results presentation fy 2016 - técnicas reunidas · results presentation ... auxiliary units...
TRANSCRIPT

Results Presentation
FY 2016
Juan LladóCEO
0

Awards & Backlog
FY 2016 Financial Results
Outlook
2
INDEX
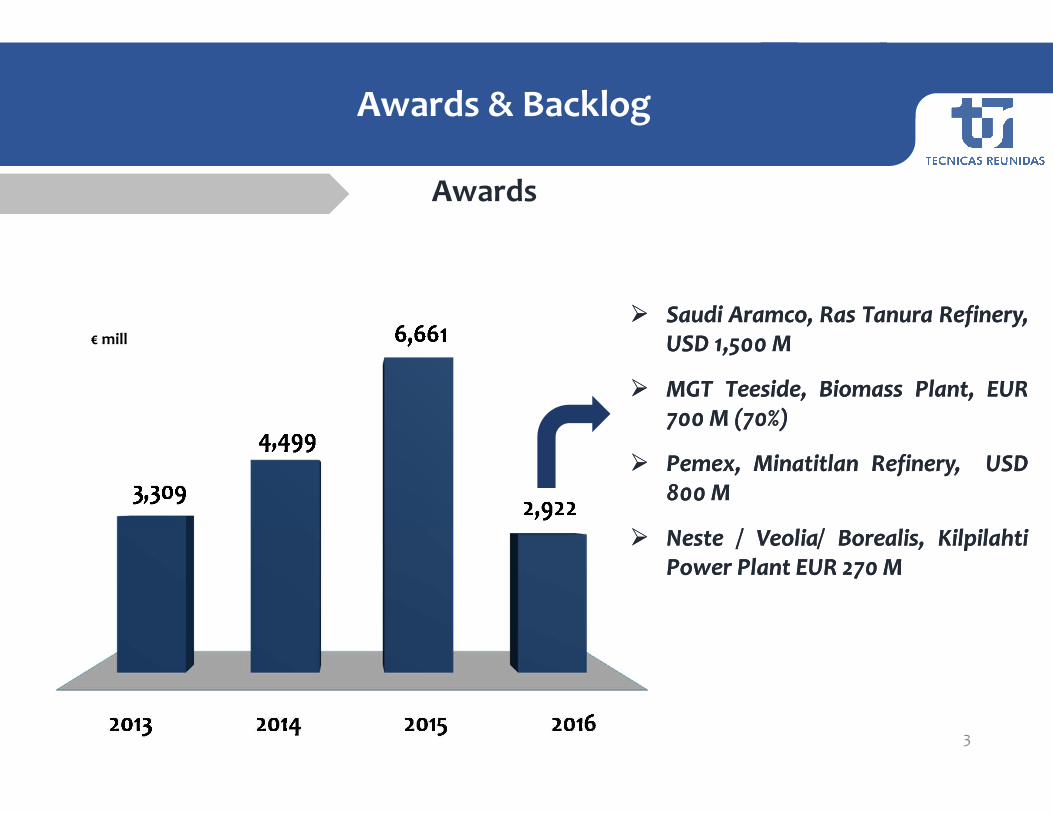
Awards
€ mill
Awards & Backlog
3
� Saudi Aramco, Ras Tanura Refinery,USD 1,500 M
� MGT Teeside, Biomass Plant, EUR700 M (70%)
� Pemex, Minatitlan Refinery, USD800 M
� Neste / Veolia/ Borealis, KilpilahtiPower Plant EUR 270 M
� Saudi Aramco, Ras Tanura Refinery,USD 1,500 M
� MGT Teeside, Biomass Plant, EUR700 M (70%)
� Pemex, Minatitlan Refinery, USD800 M
� Neste / Veolia/ Borealis, KilpilahtiPower Plant EUR 270 M
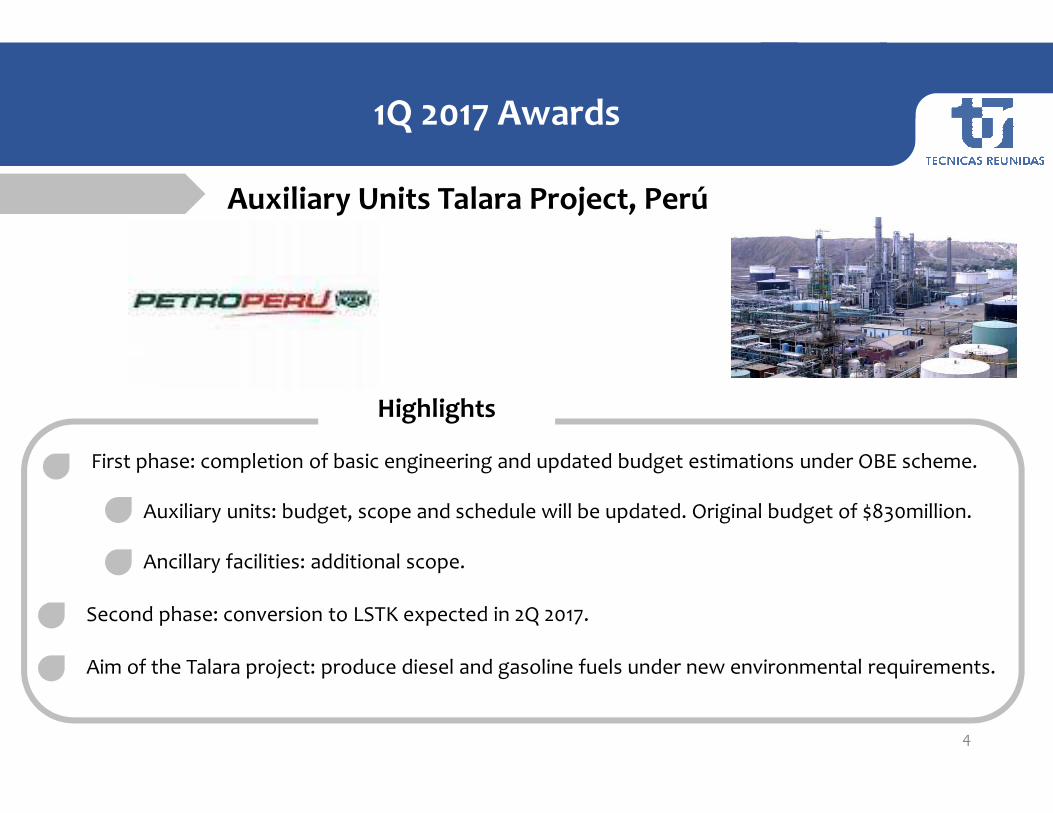
Highlights
Auxiliary Units Talara Project, Perú
4
First phase: completion of basic engineering and updated budget estimations under OBE scheme.
Auxiliary units: budget, scope and schedule will be updated. Original budget of $830million.
Ancillary facilities: additional scope.
Second phase: conversion to LSTK expected in 2Q 2017.
Aim of the Talara project: produce diesel and gasoline fuels under new environmental requirements.
1Q 2017 Awards

Backlog
2013 2014 2015 2016
6,377
8,412
12,136
10,583
Oil & Gas Power & Infrastructures
€ mill
5
Awards & Backlog
CAGR 18%
*
*Auxiliary Units Talara Project will be included in 1Q 2017
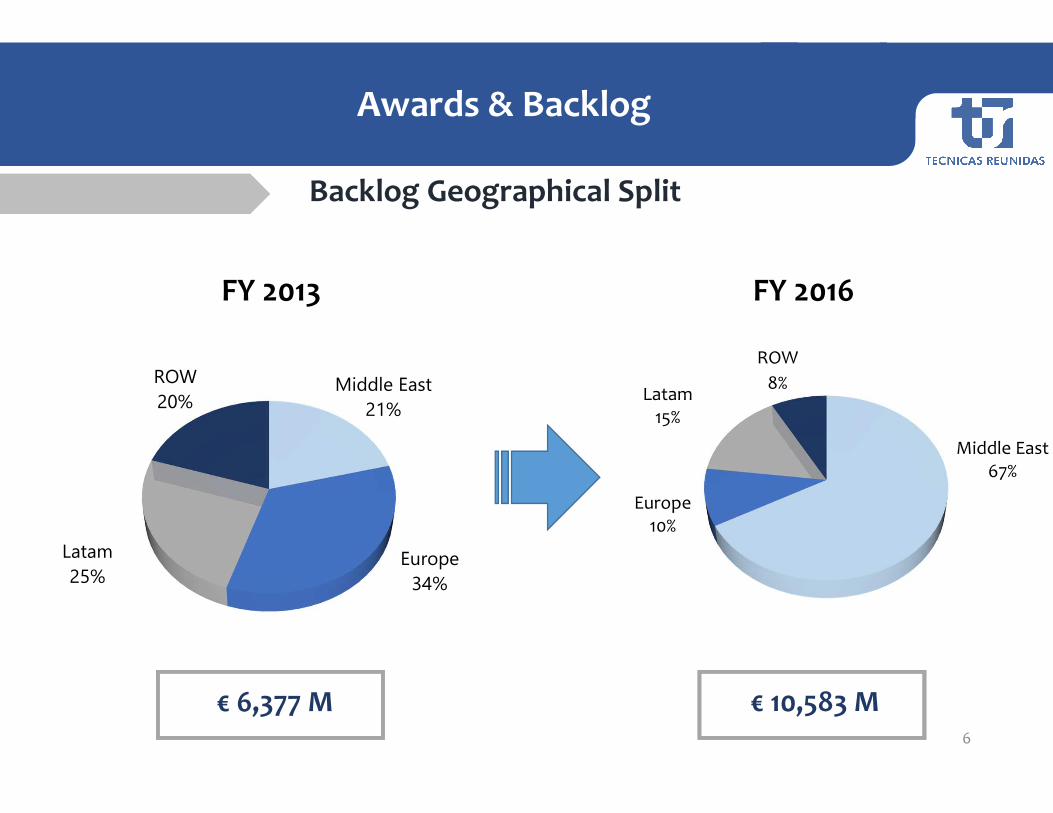
Backlog Geographical Split
FY 2016
6
Awards & Backlog
Middle East67%
Europe10%
Latam15%
ROW
8%
€ 10,583 M
FY 2013
€ 6,377 M
Middle East
21%
Europe
34%
Latam
25%
ROW
20%

7
High Value Added Services…
Canada Greece
UAEAlgeria
FranceFrance
Australia
Conceptual
Feasibility
FEED
OBE
.. with Strong Technological
Content …
Liquefaction Natural Gas
High Efficiency Combined Cycle Power Plant
Euro V Gasoline Production
Fuel Oil Hydrocracking
Gas Regasification
Mouth Well Gas Flaring ReductionEPC
… from the Initial Stages
of the Projects …
.. all Over the World

Awards & Backlog
FY 2016 Financial Results
Outlook
8
INDEX

Profit and Loss Account
€ Million
Revenues
EBITDA
EBIT
Margin
Net Financial Results
Profit Before Taxes
Taxes
Net Profit from Continuing
Operations
Net Profit after Discontinued
Operations
2016 2015 Var.
4,792.6
211.0
191.9
4.0%
4.0
193.4
-53.2
140.2
129.2
14.4%
100.4%
123.1%
134.9%
132.9%
114.6%
9
FY 2016 Financial Results
4,187.9
105.3
86.0
2.1%
1.5
82.3
-22.2
60.2
60.2

570
436
348
533 541521
489 488
200
300
400
500
600
1Q 2015 2Q 2015 3Q 2015 4Q 2015 1Q 2016 2Q 2016 3Q 2016 4Q 2016
Net Cash Position and Dividends
FY 2016 Net cash position: € 488 million
2015 Total Dividends: € 75 million
Net Cash Position€ Million
10
FY 2016 Financial Results
Awards & Backlog
FY 2016 Financial Results
Outlook
11
INDEX

Positive outlook for 2017
Consolidation of growth stage
Successful execution, with
Efficiency and risk control
Cash discipline
Stable margins for 2017
Opportunities
Focus on industries with solid investment drivers
Sustained investment levels in the Middle East
Growing opportunities in the bidding pipeline in other regions (South East Asia, NorthAmerica and Latin America)
12
Outlook
This document has been prepared by Tecnicas Reunidas S.A. (the Company) solely for use at presentations heldin connection with the announcement of the Company's results for the year 2016.
This document contains forward-looking statements of the Company and/or its management. These forward-looking statements such as statements relating to the Company's or management's intent belief or currentexpectations of the future growth in the Company's business and capital expenditure in the oil and gasindustry in general are subject to risks and variables that are beyond the Company's control and that couldmaterially and adversely affect the outcome and financial effects of the facts expressed implied or projectedherein.
The Company is under no obligation to update or keep current the information contained in this presentationincluding any looking forward-statements or to correct any inaccuracies that may later become apparent.
No representation or warranty express or implied is made as to and no reliance should be placed on thefairness accuracy completeness or correctness of the information or opinions contained herein. None of theCompany or any of its affiliates advisors or representatives shall have any liability whatsoever for any lossarising from any use of this document or its contents or otherwise arising in connection with this document.
This document is only provided for information purposes and does not constitute nor may it be interpreted asan offer to sell or exchange or acquire or solicitation for offers to purchase any share in the Company. Anydecision to buy or invest in shares in relation to a specific issue must be made on the basis of the informationcontained in the relevant prospectus filed by the Company in relation to such specific issue.
13
DISCLAIMER

14