results presentation 31 december 2018 andi case …...at 31 december balance sheet andi case and...
TRANSCRIPT

Results Presentation
31 December 2018
Andi Case and Jeff Woyda
11 March 2019

Andi Case and Jeff Woyda | 11 March 2019Results Presentation | 31 December 20182
Agenda
1Financial results
2Markets
3Outlook

Andi Case and Jeff Woyda | 11 March 2019Results Presentation | 31 December 20183
Financial results
Jeff WoydaChief Financial Officer and Chief Operating Officer

to 31 DecemberResults summary
Andi Case and Jeff Woyda | 11 March 2019Results Presentation | 31 December 20184
2018
£m
2017
£m
Revenue 337.6 324.0
Underlying profit before taxation
(Before acquisition related costs)
45.3 50.2
Underlying earnings per share
(Before acquisition related costs)
105.2p 116.8p

to 31 DecemberResults summary
Andi Case and Jeff Woyda | 11 March 2019Results Presentation | 31 December 20185
2018
£m
2017
£m
Revenue 337.6 324.0
Underlying profit before taxation
(Before acquisition related costs)
45.3 50.2
Acquisition related costs (2.4) (4.8)
Profit before taxation
(After acquisition related costs)
42.9 45.4
Underlying earnings per share
(Before acquisition related costs)
105.2p 116.8p

Revenue, profit and marginSegmental performance
Andi Case and Jeff Woyda | 11 March 2019Results Presentation | 31 December 20186
Revenue
2018
£m
Revenue
2017
£m
Profit
2018
£m
Profit
2017
£m
Margin
2018
Margin
2017
Broking 251.7 238.9 44.0 43.9 17.5% 18.4%
Financial 46.1 52.0 8.0 10.1 17.4% 19.4%
Support 23.9 18.5 2.3 2.1 9.6% 11.4%
Research 15.9 14.6 5.0 4.8 31.4% 32.9%

to 31 December
*Assuming no further acquisitions, this should amount to a £1.7m in 2019
Acquisition related costs*
Andi Case and Jeff Woyda | 11 March 2019Results Presentation | 31 December 20187
2018
£m
2017
£m
Cash and share-based payment charges 0.7 0.9
Loan note interest – 0.3
Amortisation – Platou 1.7 3.6
Total 2.4 4.8

at 31 DecemberBalance sheet
Andi Case and Jeff Woyda | 11 March 2019Results Presentation | 31 December 20188
2015
£m
2016
£m
2017
£m
2018
£m
Tangible fixed assets 33.1 33.0 33.3 29.3
Intangible fixed assets (Software only) - - 1.5 5.4
Investments 1.9 4.1 4.9 4.8
35.0 37.1 39.7 39.5
Working capital (7.1) (15.1) (0.4) 17.5
Net available funds 91.6 98.4 79.1 73.4
84.5 83.3 78.7 90.9
Pensions (4.1) 2.3 12.3 14.0
Deferred tax 8.4 7.1 4.6 2.2
Loan notes (46.1) (23.6) – –
Net assets before intangibles 77.7 106.2 135.3 146.6
Intangibles (excl Software above) 263.2 300.5 288.1 288.0
Net assets 340.9 406.7 423.4 434.6
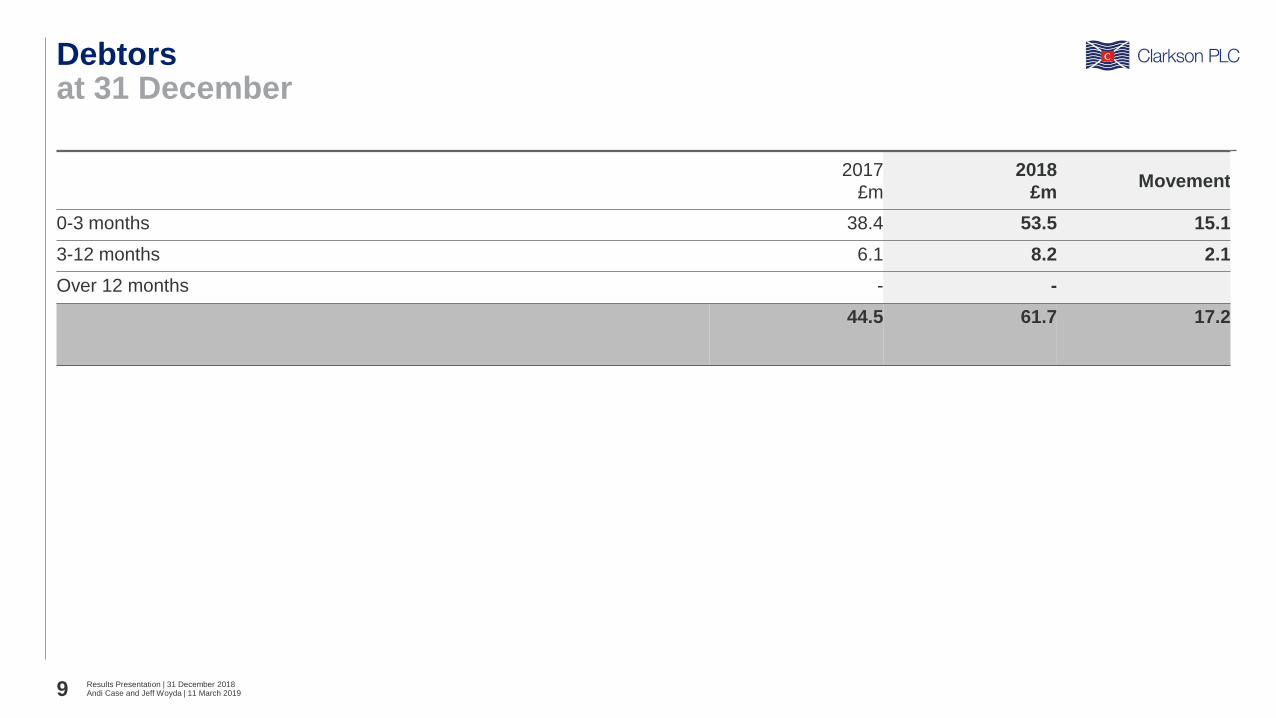
at 31 DecemberDebtors
Andi Case and Jeff Woyda | 11 March 2019Results Presentation | 31 December 20189
2017
£m
2018
£mMovement
0-3 months 38.4 53.5 15.1
3-12 months 6.1 8.2 2.1
Over 12 months - -
44.5 61.7 17.2
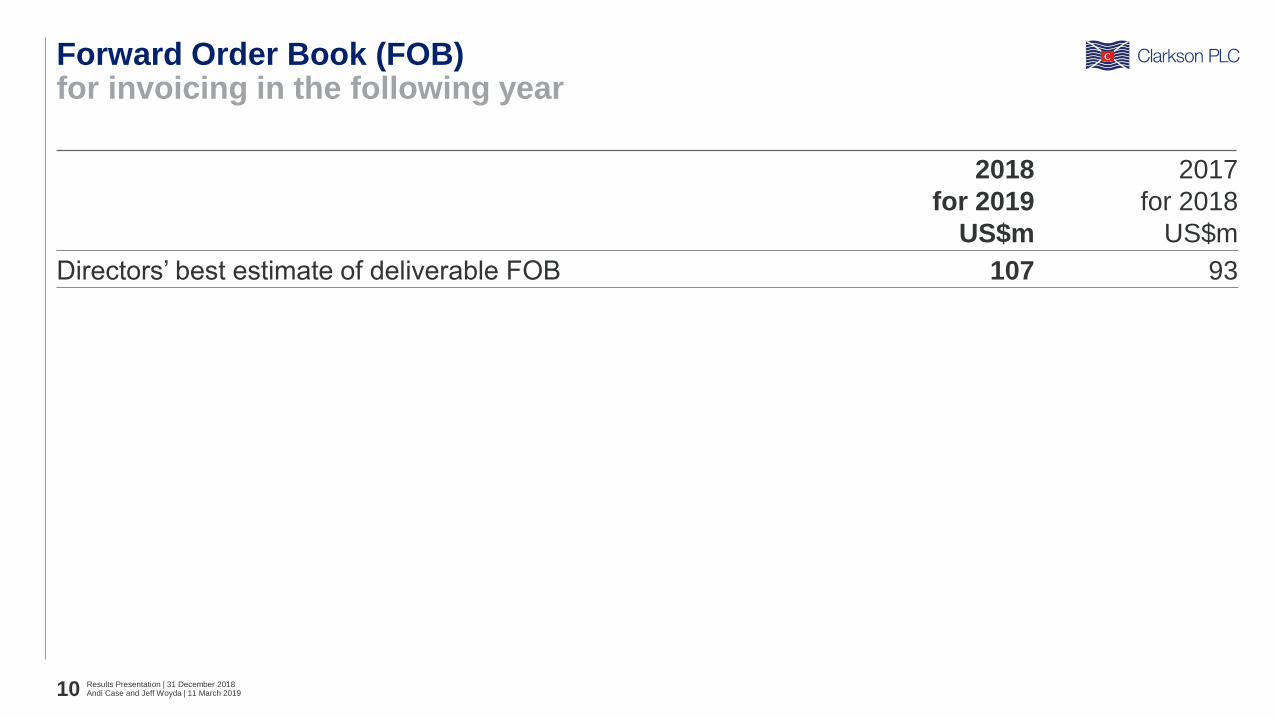
for invoicing in the following yearForward Order Book (FOB)
Andi Case and Jeff Woyda | 11 March 2019Results Presentation | 31 December 201810
2018
for 2019
US$m
2017
for 2018
US$m
Directors’ best estimate of deliverable FOB 107 93
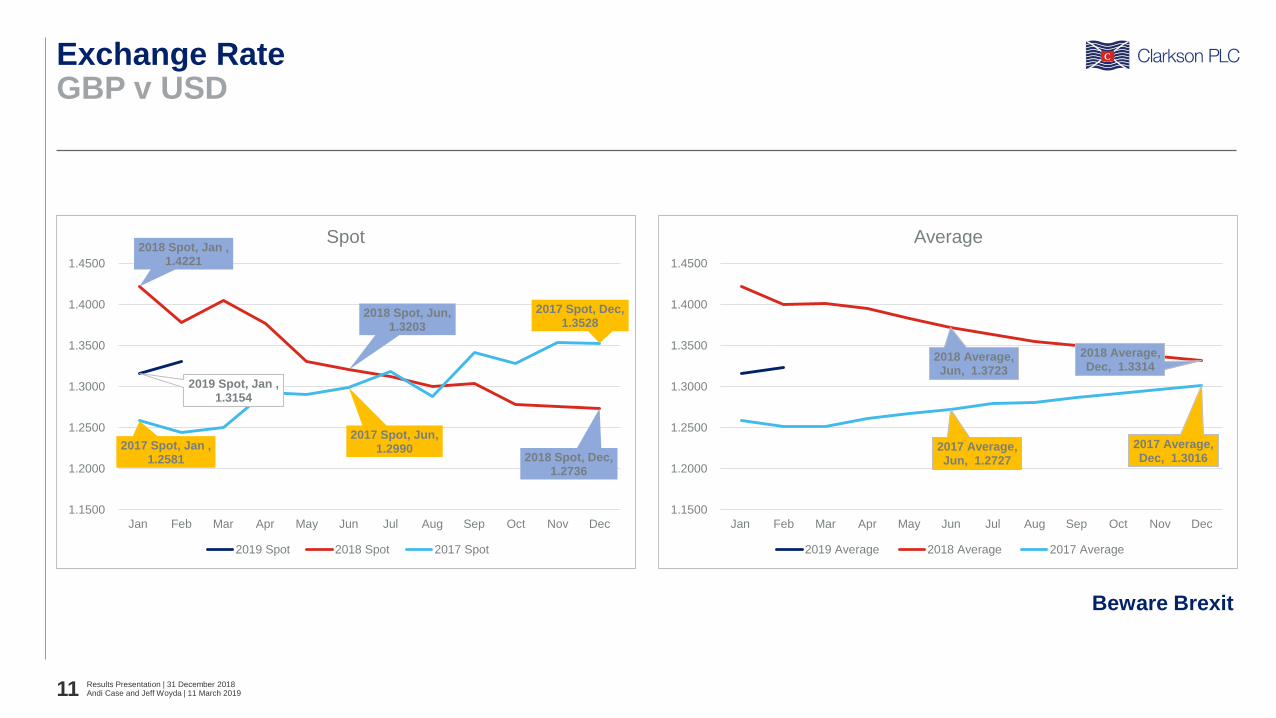
GBP v USDExchange Rate
Andi Case and Jeff Woyda | 11 March 2019Results Presentation | 31 December 201811
2019 Spot, Jan , 1.3154
2018 Spot, Jan , 1.4221
2018 Spot, Jun, 1.3203
2018 Spot, Dec, 1.2736
2017 Spot, Jan , 1.2581
2017 Spot, Jun, 1.2990
2017 Spot, Dec, 1.3528
1.1500
1.2000
1.2500
1.3000
1.3500
1.4000
1.4500
Jan Feb Mar Apr May Jun Jul Aug Sep Oct Nov Dec
Spot
2019 Spot 2018 Spot 2017 Spot
2018 Average, Jun, 1.3723
2018 Average, Dec, 1.3314
2017 Average, Jun, 1.2727
2017 Average, Dec, 1.3016
1.1500
1.2000
1.2500
1.3000
1.3500
1.4000
1.4500
Jan Feb Mar Apr May Jun Jul Aug Sep Oct Nov Dec
Average
2019 Average 2018 Average 2017 Average
Beware Brexit
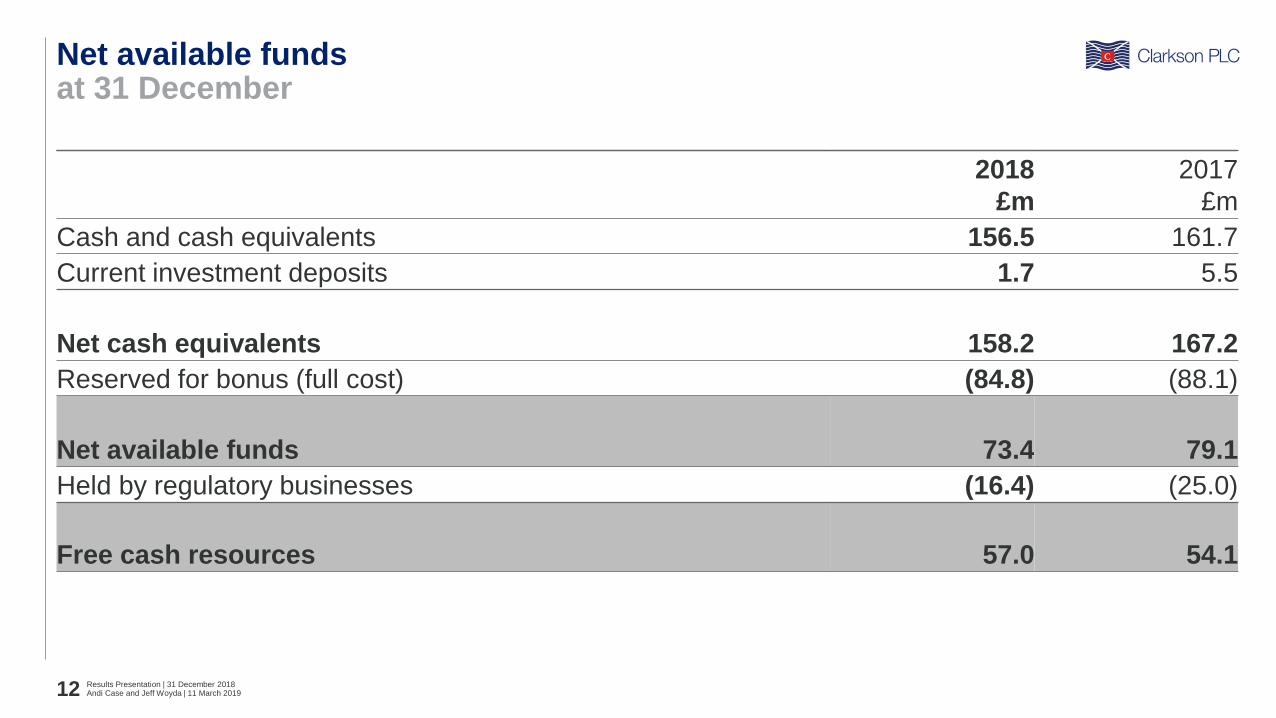
at 31 DecemberNet available funds
Andi Case and Jeff Woyda | 11 March 2019Results Presentation | 31 December 201812
2018
£m
2017
£m
Cash and cash equivalents 156.5 161.7
Current investment deposits 1.7 5.5
Net cash equivalents 158.2 167.2
Reserved for bonus (full cost) (84.8) (88.1)
Net available funds 73.4 79.1
Held by regulatory businesses (16.4) (25.0)
Free cash resources 57.0 54.1

after bonusMovement in free cash resources
Andi Case and Jeff Woyda | 11 March 2019Results Presentation | 31 December 201813
2.3 (22.5)
(14.6)
(8.3)
(6.7)
54.1
45.0
57.08.6
Free cashresources
Dec 17
Operating profit Depreciation Other Dividends Working capital Taxation Short termInvestments in
regulatedentities
CapitalisedSoftware
development
Capex Movement incash held by
regulatedentities
Free cashresources
Dec 18
5.2
(2.2)(3.9)

16 years of progressive dividendDividend history
Andi Case and Jeff Woyda | 11 March 2019Results Presentation | 31 December 201814
6 79 10
1214
16 16 17 18 18 1921 22 22 23 24
911
16
22
24
2626 27
3032 33
37
3940
43
5051
1518
25
32
36
4042 43
4750 51
56
6062
65
7375
0
10
20
30
40
50
60
70
80
2002 2003 2004 2005 2006 2007 2008 2009 2010 2011 2012 2013 2014 2015 2016 2017 2018
Interim Final

Andi Case and Jeff Woyda | 11 March 2019Results Presentation | 31 December 201815
Markets
Andi CaseChief Executive Officer

The Board
Andi Case and Jeff Woyda | 11 March 2019Results Presentation | 31 December 201816
Chair
Bill ThomasChair (Independent Non-Executive)
Executive Directors
Andi CaseChief Executive Officer
Jeff WoydaChief Financial Officer and Chief Operating Officer
Peter M. AnkerPresident of Broking and Investment Banking
Non-Executive Directors
Peter BackhouseSenior Independent Non-Executive Director
Marie-Louise ClaytonIndependent Non-Executive Director
James Hughes-Hallett, CMGIndependent Non-Executive Director
Tim MillerIndependent Non-Executive Director
Birger NergaardIndependent Non-Executive Director
Company Secretary
Rachel SpencerCompany Secretary
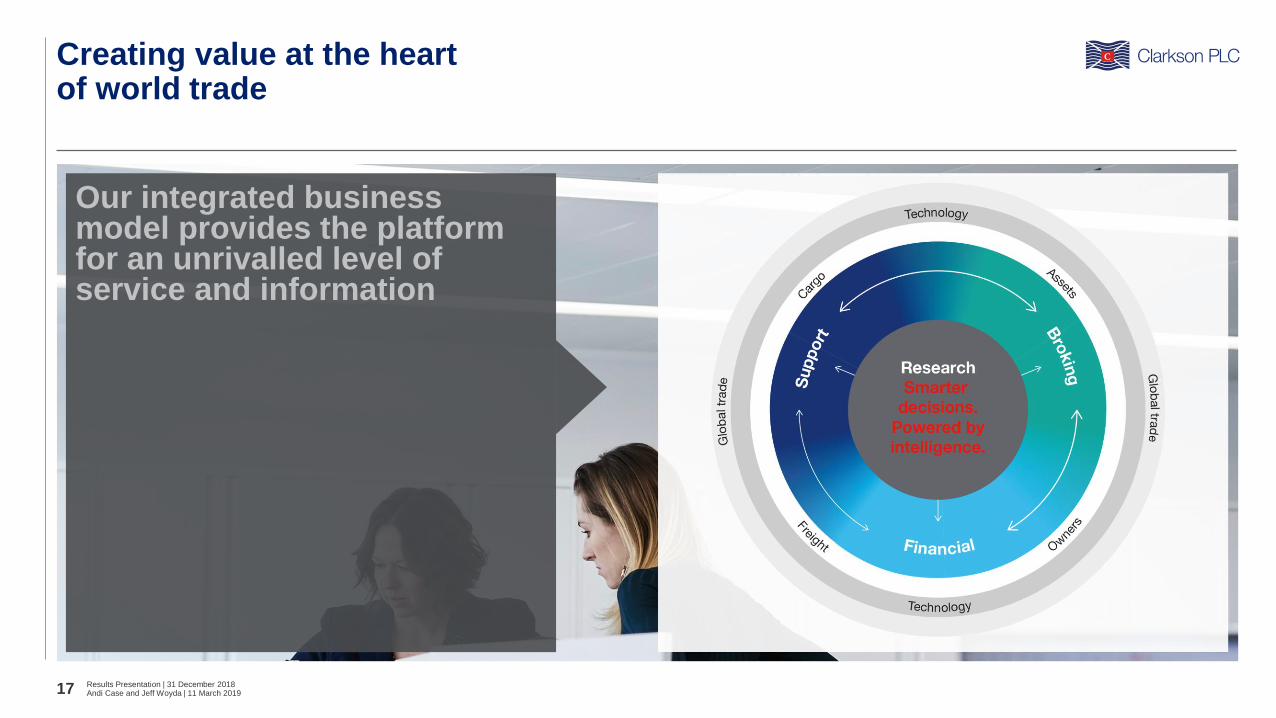
Creating value at the heart of world trade
Andi Case and Jeff Woyda | 11 March 2019Results Presentation | 31 December 201817
Our integrated business model provides the platform for an unrivalled level of service and information

Andi Case and Jeff Woyda | 11 March 2019Results Presentation | 31 December 201818
This is Smarter Shipping
TechnologyRebranded for the future

Technology
Andi Case and Jeff Woyda | 11 March 2019Results Presentation | 31 December 201819
A collection of interoperable modules to enhance the end-to-end chartering process
INTELLIGENCE EXECUTION DOCUMENTATION MONITORING

Source: Clarksons/IMF
World Seaborne Trade vs. GDP
Andi Case and Jeff Woyda | 11 March 2019Results Presentation | 31 December 201820
0
20
40
60
80
100
120
140
160
0
2
4
6
8
10
12
14
16
19
85
19
87
19
89
19
91
19
93
19
95
19
97
19
99
20
01
20
03
20
05
20
07
20
09
20
11
20
13
20
15
20
17
20
19
20
21
20
23
20
25
20
27
20
29
GD
P C
urre
nt P
rices (T
N $
)
Wo
rld
Seab
orn
e T
rad
e (
BN
to
nn
es)
World Seaborne Trade Trade trend volume GDP Current Prices GDP trend volume Linear (World Seaborne Trade) Linear (GDP Current Prices)

Economic growth remains supportive of seaborne tradeGlobal Macroeconomic Indicators
Andi Case and Jeff Woyda | 11 March 2019Results Presentation | 31 December 201821
44
46
48
50
52
54
56
58
60
62
Jan-1
2
Ma
y-1
2
Sep-1
2
Jan-1
3
Ma
y-1
3
Sep-1
3
Jan-1
4
Ma
y-1
4
Sep-1
4
Jan-1
5
Ma
y-1
5
Sep-1
5
Jan-1
6
Ma
y-1
6
Sep-1
6
Jan-1
7
Ma
y-1
7
Sep-1
7
Jan-1
8
Ma
y-1
8
Sep-1
8
Jan-1
9
Co
ntr
acti
on
| E
xp
an
sio
n
US Japan Eurozone China
Global Manufacturing PMI’s
Source: IMF, HSBC, Markit, Caixin, Refinitiv
-6
-4
-2
0
2
4
6
8
10
12
14
16
20
00
20
01
20
02
20
03
20
04
20
05
20
06
20
07
20
08
20
09
20
10
20
11
20
12
20
13
20
14
20
15
20
16
20
17
20
18
20
19 e
% c
han
ge (
year
on
year)
World GDP US GDP Eurozone China GDP India GDP
GDP Growth

Manufacturing activity in emerging economies is expandingEmerging Asian Economies Potential
Andi Case and Jeff Woyda | 11 March 2019Results Presentation | 31 December 201822
Source: HSBC, Markit, Caixin, Refinitiv
Selected Emerging Economies Manufacturing PMI’s Energy Use Per Capita Vs GDP Per Capita Steel Use Per Capita
44
46
48
50
52
54
56
58
Jan-1
4
Ma
y-1
4
Sep-1
4
Jan-1
5
Ma
y-1
5
Sep-1
5
Jan-1
6
Ma
y-1
6
Sep-1
6
Jan-1
7
Ma
y-1
7
Sep-1
7
Jan-1
8
Ma
y-1
8
Sep-1
8
Jan-1
9
Co
ntr
acti
on
| E
xp
an
sio
n
India Indonesia Vietnam
0
100
200
300
400
500
600
700
800
900
1,000
1,100
1,200
South
Kore
a
Japa
n
Ch
ina
Ma
laysia
US
A
Tha
iland
Vie
tnam
India
Indon
esia
Sri L
anka
Myan
ma
r
Pakis
tan
Bang
lad
esh
Kg
fin
ish
ed
ste
el
pro
du
cts
per
year
per
cap
ita
China
India
United States
Vietnam
Philippines
Indonesia
EU
0
1,000
2,000
3,000
4,000
5,000
6,000
7,000
- 10 20 30 40 50 60 70
Oil e
qu
ivale
nt
per
cap
ita (
kg
)
GDP per capita (thousand USD)

Creating inefficiencies in seaborne trade US-China Trade Dispute
Andi Case and Jeff Woyda | 11 March 2019Results Presentation | 31 December 201823
• Tariffs compromising world
economic growth
• Uncertainty leading to reduced
investment and slower
demand growth
• Strong dollar impacting
demand for commodities
• Risk of escalation and
retaliatory tariffs
• Accelerated production /
hoarding ahead of tariff
implementation
• Dislocation of trades creating
inefficiencies and tightening
supply / demand balances
• U.S. energy exports continue to
increase but a resolution
generates additional upside
• Increase in China’s import of
energy products increases
overall tonne-mile demand

Source: Clarksons Research. Data as of 1st January 2019. Retrospective changes to number of orders may occur due to late reporting and other factors.
Global Newbuilding Orders at Historic Low…
Andi Case and Jeff Woyda | 11 March 2019Results Presentation | 31 December 201824
480 545411
550
795
546667
1,378
1,196 1,145
2,256
2,909
1,872
582
1,840
1,043
706
2,054
1,342
1,152
242
787708
0
500
1,000
1,500
2,000
2,500
3,000
3,500
1996 1997 1998 1999 2000 2001 2002 2003 2004 2005 2006 2007 2008 2009 2010 2011 2012 2013 2014 2015 2016 2017 2018
No. Ships
Orders representative of vessels
over 20,000 dwt

Source: Clarksons Research. Data as of 1st January 2019. Retrospective changes to number of orders may occur due to late reporting and other factors.
…Reflected In Number Of Yards With An Orderbook Of At Least One Vessel >20,000 dwt
Andi Case and Jeff Woyda | 11 March 2019Results Presentation | 31 December 201825
47 49 50 5361
70 72 71 7685
101
151
208
235 232240
224
181
158 152 151138
120107
65 61 63 58 4645 49 47 47
48
54
64
71
7163 56
52
40
3831 33
33
29
20
0
50
100
150
200
250
300
350
1996 1997 1998 1999 2000 2001 2002 2003 2004 2005 2006 2007 2008 2009 2010 2011 2012 2013 2014 2015 2016 2017 2018 2019
No. Yards
Rest of World
China - Japan - Korea
2009: 306 yards
1996-2019: Yards with at least 1 ship
on order at year start.
January 2019:
127 yards

Source: Clarksons
Orderbook as % of Fleet
Andi Case and Jeff Woyda | 11 March 2019Results Presentation | 31 December 201826
0%
2%
4%
6%
8%
10%
12%
14%
16%
18%
20%
0%
10%
20%
30%
40%
50%
60%
70%
80%
90%
100%
2005 2006 2007 2008 2009 2010 2011 2012 2013 2014 2015 2016 2017 2018 2019
Dry Bulk (Dwt) Containerships (TEU) Deep Sea Tankers (Dwt) Specialised Products (Dwt)
LNG Carriers (Cu. M.) LPG Carriers (Cu. M.) Global Fleet – All Vessel Types (% based on no. of Vessels – Right Axis)

Demand Growth
(BN Tonne-Miles*, % Chg 2018–2020)
Data Source: Clarksons. *LNG and Oil Tanker Demand Growth account for fleet productivity and floating storage developments as well as tonne-miles, and are measured in cbm/dwt demand respectively. Container Demand Growth basis TEU-
miles, adjusted to account for fleet productivity changes; container utilization adjusted for estimated changes in capacity idle or out of service.
Sector Fundamentals Outlook Comparison
Andi Case and Jeff Woyda | 11 March 2019Results Presentation | 31 December 201827
8%
7%
14%
9%
16%
11%
0% 5% 10% 15% 20%
Containers
Dry Bulk
Crude & Products
Chemicals
LNG
LPG & Ammonia
Fleet Growth
(% Chg 2018–2020)
7%
6%
5%
4%
17%
8%
0% 5% 10% 15% 20%
Containers
Dry Bulk
Crude & Products
Chemicals
LNG
LPG & Ammonia
7%
6%
8%
6%
19%
11%
0% 5% 10% 15% 20%
Containers
Dry Bulk
Crude & Products
Chemicals
LNG
LPG & Ammonia
Fleet Growth
(% Chg 2016–2018)

Data Source: Clarksons/TEX/Asiasis/Refinitiv
Upward Pressure on Newbuilding Prices
Andi Case and Jeff Woyda | 11 March 2019Results Presentation | 31 December 201828
0
50
100
150
200
250
300
350
0
20
40
60
80
100
120
140
160
180
Jan-0
0
Jan-0
1
Jan-0
2
Jan-0
3
Jan-0
4
Jan-0
5
Jan-0
6
Jan-0
7
Jan-0
8
Jan-0
9
Jan-1
0
Jan-1
1
Jan-1
2
Jan-1
3
Jan-1
4
Jan-1
5
Jan-1
6
Jan-1
7
Jan-1
8
Jan-1
9
Ind
ex
MM
$
VLCC NB Price (LH-axis) 100 Billion Won in US$ (LH-Axis) Korean Steel Price Index (RH-axis)
• Newbuilding prices have increased
from 2017’s low point
• Cost pressures supporting rise in
prices
• Shipyard consolidation continuing
• Environmental regulations and new
technology likely to add to costs

Impact of the IMO 2020 Sulphur Cap on Bunker Fuels
Andi Case and Jeff Woyda | 11 March 2019Results Presentation | 31 December 201829
Fleet Supply
• Reduction in active fleet size due to scrubber retrofitting
• Re-positioning of the fleet in order to prepare for compliance
• Potential early retirement of older vessels due to higher bunker fuel costs
Vessel Demand
• Potential speed restraint due to higher bunker costs, leading to increased
vessel requirements
• Anticipated increase in demand for tankers due to higher refinery runs,
changes to oil trade patterns and floating storage
Market Impact
Expected tightening of supply
/ demand balances across
most market sectors

Source: Clarksons. Based on individually identified vessels only. *% of all vessels for Cruise / Passenger and Ro-Ro.
Installation of Scrubbers
Andi Case and Jeff Woyda | 11 March 2019Results Presentation | 31 December 201830
0
100
200
300
400
500
600
700
800
900
1000
Bulk Carrier Cruise/Passenger Containership Gas Carrier Ro-Ro Tanker Others
Num
ber
of
vessels
Existing vessels with scrubbers fitted Existing vessels due to be retrofitted Vessels due to be delivered with scrubbers fitted
• Heavy investment in scrubbers
predominantly in larger vessels
• $2.5 million – $5.0 million price range for
equipment and installation on larger
vessels (tankers and dry bulk) and $5.0
million - $7.0 million for large
containerships.
• Off-hire time for retrofitting vessels in key
market sectors disrupting fleet utilisation.
4% 7% 1% 1%9%
% of fleet per sector >20,000 dwt that is retrofitting scrubbers*
0.2% 1%

The regulatory timeline continues to accelerate
Source: Clarksons Research, January 2019
Environmental Regulation
Andi Case and Jeff Woyda | 11 March 2019Results Presentation | 31 December 201831
2019 2020 2021 2022 2023 2024 2025 - - - - - - 2030 - - - - - - 2050
ECAs SOx NOx GHG / EEDI Green Recycling Ballast Water Current position
EU MRV
certification in
effect
Lower EEDI ref.
line (Phase 3)
Lower EEDI
ref. line
(Phase 2)
North Sea & Baltic
Sea NOx ECAs in
effect
50% GHG
Reduction Target
IMO DCS reporting
period begins
EU SRR
enters into
force
40% CO2 Intensity
Reduction Target
IMO 2020
0.5% Global
Sulphur Limit
IMO BWM
Convention requires
retrofitting of vessels

Immediate loss of export volumes
Source: Clarksons/GTIS
Vale Iron Ore Disaster: Lost volumes and replacement capacity
Andi Case and Jeff Woyda | 11 March 2019Results Presentation | 31 December 201832
World Iron Ore Supply 2019(f) vs 2018
873 882 905
920
384 396 396 411
275 253 263 263
200
250
300
350
400
450
500
550
600
650
700
750
800
850
900
950
2017 2018(f) 2019(f) 2020(f)
Millio
n T
on
nes
Australia Brazil Other
27.6
41.0
0.0
23.0
23.0
20.0
4.7
4.2
1.6
1.4
0.7
0.3
-3.6
-8.9
1.2
1.0
-14 -9 -4 1 6 11 16 21 26 31 36 41 46
Total
Total
Brazil
Brazil
Australia
Australia
Canada
Canada
South Africa
South Africa
Chile/Peru
Chile/Peru
Iran
Iran
Sweden/Norway/Finland
Sweden/Norway/Finland
Y-O-Y Million Tonnes
Post-Vale incidentPre-Vale incident

0.0
0.2
0.4
0.6
0.8
1.0
1.2
1.4
1.6
1.8
2.0
2.2
2.4
2.6
2.8
3.0
Jan-1
5
Jul-1
5
Jan-1
6
Jul-1
6
Jan-1
7
Jul-1
7
Jan-1
8
Jul-1
8
Millio
n b
pd
China Japan South KoreaTaiwan India EUSouth Africa
0.0
0.2
0.4
0.6
0.8
1.0
1.2
1.4
1.6
1.8
2.0
2.2
Jan-1
5
Jul-1
5
Jan-1
6
Jul-1
6
Jan-1
7
Jul-1
7
Jan-1
8
Jul-1
8
Millio
n b
pd
North America China Europe India
Venezuelan Crude Exports to Key Areas Iranian Crude Exports to Asia and EU
• Venezuelan exports expected to fall,
particularly to the U.S., adding to OPEC
cuts. However disruption may lead to some
longer-haul VLCC voyages.
• Iranian exports believed to have increased
in early 2019 due to specific waivers.
• Further reductions in Iranian exports from
Q2 2019 may lead to increased spot market
shipments from other countries.
Source: GTIS/Clarksons. Trade data based on reported imports into receiving countries. Not all receiving countries provide import data e.g. no data available for imports of Iranian crude oil into Turkey.
Geopolitical Developments Affecting Oil Trade
Andi Case and Jeff Woyda | 11 March 2019Results Presentation | 31 December 201833

Andi Case and Jeff Woyda | 11 March 2019Results Presentation | 31 December 201834
Financial Division

Global full service investment bank for our core industriesClarksons Platou Securities
Andi Case and Jeff Woyda | 11 March 2019Results Presentation | 31 December 201835
Global full service investment bank for our three core industries – Shipping, Oil Services, and Metals & Mining
Investment banking arm of the Clarksons Group
Fully licensed in Norway and EEA alongside a strong
track record of capital markets activity in US/Canada
Global coverage from five dedicated offices in Europe
and North America
Clarksons Platou Securities covers “cargo and its
journey”
− Shipping
− Oil Services
− Metals & Mining
43% market sharein shipping ECM globally
2013-2018
41% market sharein offshore drilling ECM globally
2010-2018
Joint book-running manager in
USD 1.9bnsecondary offering of GLNG (NASDAQ)
shares for the Fredriksen Group (2014)
USD 20.7bn equity capital raised since 2010
Sole advisor to Transocean in USD 3.4bn
acquisition of Songa Offshore,
one of the largest
rig M&As globally
Sole financial advisor to both parties in
USD 328m
acquisitionof Songa Bulk by Star Bulk
Participated in
3x coal IPOsAnd
2x term loans
USD 17.3bn debt capital raised since 2010
Joint Bookrunner in
USD 350m senior
secured bond issue for Nemaska Lithium in May 2018
Participated in
AUD 774mIPO of Coronado Resources, the largest
coal IPO in Australia

Seamless execution leading to repeat business
Clarksons Platou Securities
Andi Case and Jeff Woyda | 11 March 2019
Results Presentation | 31 December 201836
2,705
2,205
1,674
1,440
1,100
604
487
478
105
Go
lar
LN
GB
orr
Drilli
ng
Scorp
ioB
ulk
ers
Scorp
ioT
ankers
Sh
elf
Dri
llin
gN
em
aska
Lith
ium
DH
TH
old
ings
Navio
sG
rou
pS
tand
ard
Dri
llin
g
Joint Lead Manager
Jun 2014
USD 683m
Equity Offering
Joint Lead Manager
Sept 2014
USD 1,872m
Equity Offering
Joint Lead Manager
Nov 2016
USD 150m
Equity Offering
Joint Lead Manager
Dec 2016
USD 155m Equity
Offering
Joint Lead Manager
Mar 2017
USD 800m Equity
Offering
Joint Lead Manager
Oct 2017
USD 650m Equity
Offering
Joint Lead Manager
Mar 2018
USD 250m Equity
Offering
Joint Lead Manager
May 2018
USD 350m
Convertible Bond
Sole Manager
Jun 2013
USD 250mm
Equity Offering
Sole Manager
Sep 2013
USD 300m
Equity Offering
Sole Manager
Oct 2013
USD 300m
Equity Offering
Joint Lead Manager
Dec 2013
USD 350m
IPO
Placement Agent
Nov 2014
USD 150m
Equity Offering
Joint Lead Manager
Jun 2015
USD 200m
Equity Offering
Sole Bookrunner
Mar 2016
USD 63m
Equity Offering
Sole Bookrunner
Jun 2016
USD 61m
Equity Offering
Sole Manager
Jan 2013
USD 230m
Equity Offering
Sole Manager
Mar 2013
USD 235m
Equity Offering
Sole Manager
May 2013
USD 300m
Equity Offering
Joint Lead Manager
Aug 2013
USD 219m
Equity Offering
Joint Lead Manager
Apr 2015
USD 140m
Equity Offering
Sole Bookrunner
Nov 2017
USD 90m
Equity Offering
Senior Manager
Oct 2018
USD 227m
Equity Offering
Co-Manager
Feb 2018
USD 600m
Bond Offering
Co-Manager
Jun 2018
USD 300m
Bond Offering
Joint Bookrunner
Jun 2018
USD 225m
IPO
Sole Manager
Nov 2013
USD 110m
Equity Offering
Joint Lead Manager
Jan 2014
USD 227m
Equity Offering
Joint Lead Manager
Sept 2014
USD 150m
Equity Offering
Sole Manager
Feb 2013
USD 101m
Equity Offering
Sole Manager
May 2013
USD 120m
Equity Offering
Sole Manager
Sept 2013
USD 100m
Equity Offering
Joint Lead Manager
Feb 2014
USD 58m
Equity Offering
Sole Bookrunner
Aug 2017
USD 50m
Equity Offering
Joint Bookrunner
Nov 2017
USD 50m
Equity Offering
Sole Manager
Dec 2016
NOK 275m
Equity Offering
Sole Manager
Jan 2017
NOK 100m
Equity Offering
Sole Manager
Jan 2017
NOK 198m
Equity Offering
Sole Manager
Nov 2017
NOK 200m
Equity Offering
Sole Manager
Mar 2018
NOK 100m
Equity Offering
Figures in
USDm
Sole Selling Agent
Jun 2017
USD 39m
Equity Offering
Sole Selling Agent
May 2018
USD 215m
Equity Offering
Joint Lead Manager
Jun 2018
USD 350m
Bond Offering

29 x ECM, DCM, CB, M&A and restructuring transactions completed in 2018Clarksons Platou Securities
Andi Case and Jeff Woyda | 11 March 2019Results Presentation | 31 December 201837
Joint Lead Manager
USD 11m Equity
Private Placement
Joint Lead Manager
NOK 500m Senior
Unsecured Bond Issue
Sole Selling Agent
CAD 280m Equity
Offering
Sole Advisor
USD 21m Sale- and
Leaseback
Financial Advisor
USD 10m Equity
Private Placement and
USD 65m Stream
Sole Advisor
USD 65m Private
Secured Loan Facility
Joint Lead Manager
NOK 520m Equity
Private Placement
Sole Manager
USD 32m Equity
Private Placement
Joint Bookrunner
USD 550m
Term Loan B
Sole Manager
Listing on Oslo Stock
Exchange
Joint Lead Manager
USD 350m Senior
Convertible Bond
Joint Lead Manager
USD 250m Equity
Private Placement
Joint Lead Manager
AUD 774m IPO
Listing on ASX
Joint Bookrunner
USD 225m IPO
Listing on OSE
Sole Advisor
USD 328m (EV)
acquisition of Songa
Bulk
Sole Manager
NOK 100m Equity
Offering
Senior Manager
USD 330m
Public Offering of
Common Shares
Financial Advisor
Spin-off from Grindrod
Limited and listing on
NASDAQ
Joint Lead Manager
USD 350m Senior
Secured Callable Bond
Financial Advisor
51% acquisition of
Island Offshore Subsea
Sole Manager
USD 45m Equity
Private Placement
Co-Manager
USD 300m Tack-on
Senior Notes Issue
Underwriter
CAD 8m Equity Private
Placement
Co-Manager
USD 600m Senior
Notes Issue
Sole Advisor
Southern Cross
Group’s disposal of UP
Offshore
Sole Selling Agent
CAD 9m
Equity Offering
Sole Financial Advisor
USD 5m Private
Placement and Change
of Control
Joint Lead Manager
NOK 40m
Rights Issue
Joint Bookrunner
USD 350m senior
secured 1st lien notes
UP Offshore
Avenir LNG
Songa Bulk
• Clarksons Platou Securities completed 29x transactions
during the course of 2018
• Working for 25x unique clients, generating both new and
repeat business across our core sectors of Shipping, Oil
Services and Metals & Mining
• Full service offering with ECM, DCM, CB, M&A and
restructuring transactions completed during the year

Why 2018 was a challenging year - MacroClarksons Platou Securities
Andi Case and Jeff Woyda | 11 March 2019Results Presentation | 31 December 201838
S&P, FTSE & OSE 2018 development Commentary
• Turbulent year for the global stock market driven by
― All-time-high valuations prompting fears of correction
― Weaker Chinese economic growth
― Fear of higher interest rates
― Trade war tensions
― Uncertain outcome of Brexit
• Implementation of stricter regulatory policies such as MiFID II and GDPR
― Resulted in pressure on CPS commissions/research payments
• Brent crude oil price ended down 24% in 2018YE compared to 2017YE, at USD 50.57/bbl compared to USD 66.73/bbl, effecting our core markets
• However, markets have shown signs of recovery 2019YTD
0
5
10
15
20
25
30
35
40
80
85
90
95
100
105
110
115
120
VIX
vo
lati
lity
ind
ex
Equ
ity
ind
ice
s (r
eb
ase
d)
Volatility (VIX) S&P 500 OSEBX FTSE 100
2018YE

Why 2018 was a challenging year - MicroClarksons Platou Securities
Andi Case and Jeff Woyda | 11 March 2019Results Presentation | 31 December 201839
Companies trading significantly below NAV
• Challenging equity market with peers trading significantly below NAV
• Limited equity market activity, other than in distressed situations
0.4
0.5
0.6
0.7
0.8
0.9
1.0
1.1
1.2
Weighted Average Tankers Weighted Average DRY

Completed 36 projects in the shipping and real estate space during 2018
Total transaction value of USD 1,7 billion
Raised USD 250 million in equity for new projects
Corporate management on 52 vessels and 42 properties (total of 360 000 sqm)
Established Clarksons Platou Real Estate Investment Management with its first
NOK 500 million (USD 61 million) fund
Continued strong transaction flowClarksons Platou Project Finance
Andi Case and Jeff Woyda | 11 March 2019Results Presentation | 31 December 201840

Andi Case and Jeff Woyda | 11 March 2019Results Presentation | 31 December 201841
Outlook

Financial Outlook
Andi Case and Jeff Woyda | 11 March 2019Results Presentation | 31 December 201842
Tailwinds vs Headwinds
Forward
order book
$ 107m
+$14m
Finance
requirement
strong
amongst
clients
IMO 2020
• Scrubber
fitting
• Regulatory
uncertainty
• Voyage
dislocation
Demand
growth
2018
11.9bn tonnes
2008
8.6bn tonnes
Supply side
challenged
• Lack of
finance
• Rates
• Shipyards
Progressive
dividend
policy in
16th year
Cash
generative
and debt
free
US-China
trade war
Vale NAV to
Market Cap
SEC closureSanctionsExchange
rate
volatility
Dec 1.2736
Feb 1.3301
Venezuela
Headwinds…?
Tailwinds

Thank You
ClarksonsCommodity QuaySt. Katharine DocksLondonUnited KingdomE1W 1BFwww.clarksons.com

The material and the information (including, without limitation, any future rates and/or forward looking predictions) contained herein (together,
the "Information") are provided by Clarkson PLC (Clarksons) for general guide.
The Information is provided on ‘as is’ and ‘as available’ basis. Clarksons and all its Group companies make no representations or warranties of
any kind, express or implied about the completeness, accuracy, reliability, suitability or availability with respect to the Information. Any reliance
placed on such Information is therefore strictly at the recipient's own risk and no responsibility is accepted for any loss or damage howsoever
arising. Please note that future rates and/or forward looking predictions are for illustration purposes only and given without guarantee; the
ultimate outcome may be different.
This Information is not for reproduction or distribution without Clarksons’ prior written consent. Especially, the Information is not to be used in
any document for the purposes of raising finance whether by way of debt or equity. All intellectual property rights are fully reserved by
Clarksons, its Group companies and/or its licensors.
This disclaimer shall be governed by and construed in accordance with English law.
Commodity Quay, St. Katharine Docks, London, UK, E1W 1BF
Clarkson PLCDisclaimer
Andi Case and Jeff Woyda | 11 March 2019Results Presentation | 31 December 201844