results of microsoft-funded testing q1 2015 - scalearc · results of microsoft-funded testing ......
TRANSCRIPT

© 2014 ScaleArc. All Rights Reserved. 1© 2015 ScaleArc. All Rights Reserved. 1
Scaling Database Performance in AzureResults of Microsoft-funded Testing
Q1 2015

Test Goals and Background Info
© 2014 ScaleArc. All Rights Reserved. 3© 2015 ScaleArc. All Rights Reserved. 3
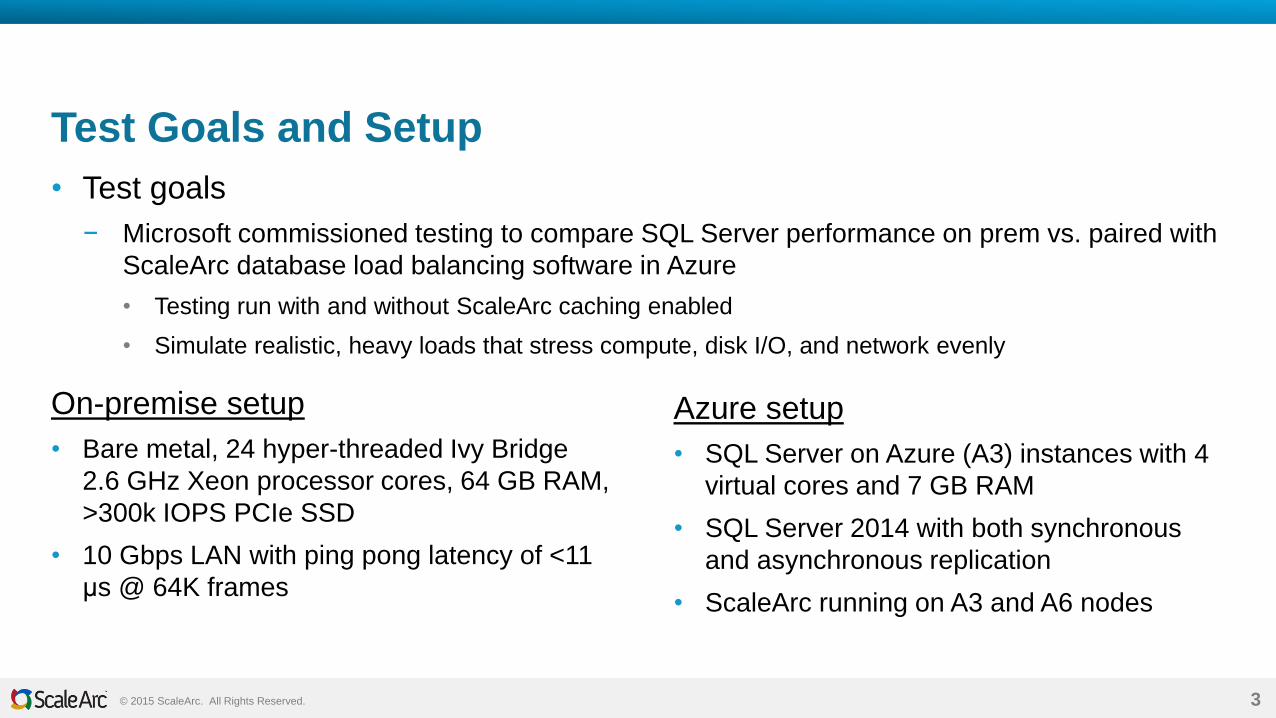
Test Goals and Setup
• Test goals
− Microsoft commissioned testing to compare SQL Server performance on prem vs. paired with
ScaleArc database load balancing software in Azure
• Testing run with and without ScaleArc caching enabled
• Simulate realistic, heavy loads that stress compute, disk I/O, and network evenly
On-premise setup
• Bare metal, 24 hyper-threaded Ivy Bridge
2.6 GHz Xeon processor cores, 64 GB RAM,
>300k IOPS PCIe SSD
• 10 Gbps LAN with ping pong latency of <11
μs @ 64K frames
Azure setup
• SQL Server on Azure (A3) instances with 4
virtual cores and 7 GB RAM
• SQL Server 2014 with both synchronous
and asynchronous replication
• ScaleArc running on A3 and A6 nodes

© 2014 ScaleArc. All Rights Reserved. 4© 2015 ScaleArc. All Rights Reserved. 4
What is ScaleArc?
• Database load balancing software
− Inserts transparently between apps, databases
− Enables an Agile Data Tier – abstraction layer
• Available on Azure Marketplace
• Enables zero downtime environment and
provides instant database scalability
• Supports SQL Server, MySQL, Oracle
− SQL Server 2005, 2008/R2, 2012, 2014
− AlwaysOn Integration

© 2014 ScaleArc. All Rights Reserved. 5© 2015 ScaleArc. All Rights Reserved. 5
Without ScaleArc: Limitations of SQL Server on Azure
• Virtual machine size
− Large VMs with a lot of compute resources are unavailable / expensive
• I/O limitations
− Storage is shared / SAN-based – IOPS and storage latency are a challenge vs. SSD storage
• Hypervisor-related losses
− Hypervisor layers add overhead and reduce effective resources – also, bad neighbor effect
• Network latency
− Cloud machines have no guarantee of proximity
• Added resource utilization due to replication
− AlwaysOn replication needed for capacity, which may cause further performance degradation

© 2014 ScaleArc. All Rights Reserved. 6© 2015 ScaleArc. All Rights Reserved. 6
Benefits of Deploying ScaleArc in Azure with AlwaysOn
• Enables simple app migration with no performance compromise
− Move enterprise workloads to Azure with no app changes and no performance loss
• Aggregate smaller cloud database instances to behave like one large server
• Provides automatic high availability
− Auto failover with no app restarts – within one locale or across regions
− Eliminates the need for maintenance windows to patch SQL databases
• Solves future scaling issues
− Scale up and scale out without any app modifications
• Delivers high-performance hybrid deployments
− App in Azure, with database on prem

© 2014 ScaleArc. All Rights Reserved. 7© 2015 ScaleArc. All Rights Reserved. 7
How ScaleArc Augments SQL Server AlwaysOn
• Aggregate capacity across VMs to get on premise-like performance
− Combine as many as nine database VMs
• Linear scalability
− Add machines as needed – ramp up and down for traffic surges, with no downtime
• Higher availability in Azure vs. on prem, and at lower cost
− Auto failover + queueing supports cross-region HA, at much lower cost than two data centers
• Zero-downtime maintenance
− Perform maintenance per server, cluster or Azure zone with no application downtime
• Deep SQL analytics
− SQL query patterns and historical analytics enabling troubleshooting in minutes vs. hours

Test Methodology and Results
© 2014 ScaleArc. All Rights Reserved. 9© 2015 ScaleArc. All Rights Reserved. 9
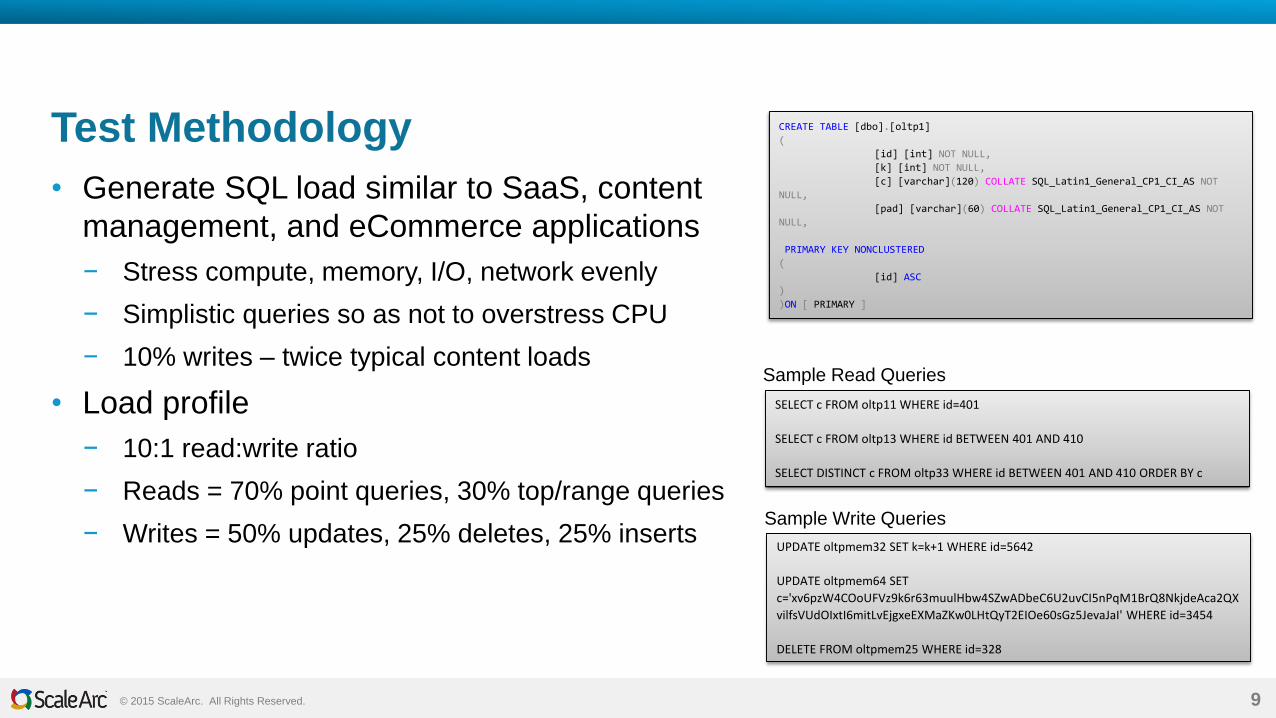
Test Methodology
• Generate SQL load similar to SaaS, content
management, and eCommerce applications
− Stress compute, memory, I/O, network evenly
− Simplistic queries so as not to overstress CPU
− 10% writes – twice typical content loads
• Load profile
− 10:1 read:write ratio
− Reads = 70% point queries, 30% top/range queries
− Writes = 50% updates, 25% deletes, 25% inserts
CREATE TABLE [dbo].[oltp1]
(
[id] [int] NOT NULL,
[k] [int] NOT NULL,
[c] [varchar](120) COLLATE SQL_Latin1_General_CP1_CI_AS NOT
NULL,
[pad] [varchar](60) COLLATE SQL_Latin1_General_CP1_CI_AS NOT
NULL,
PRIMARY KEY NONCLUSTERED
(
[id] ASC
)
)ON [ PRIMARY ]
SELECT c FROM oltp11 WHERE id=401
SELECT c FROM oltp13 WHERE id BETWEEN 401 AND 410
SELECT DISTINCT c FROM oltp33 WHERE id BETWEEN 401 AND 410 ORDER BY c
Sample Read Queries
UPDATE oltpmem32 SET k=k+1 WHERE id=5642
UPDATE oltpmem64 SET
c='xv6pzW4COoUFVz9k6r63muulHbw4SZwADbeC6U2uvCI5nPqM1BrQ8NkjdeAca2QX
vilfsVUdOIxtI6mitLvEjgxeEXMaZKw0LHtQyT2EIOe60sGz5JevaJaI' WHERE id=3454
DELETE FROM oltpmem25 WHERE id=328
Sample Write Queries

© 2014 ScaleArc. All Rights Reserved. 10© 2015 ScaleArc. All Rights Reserved. 10
Benchmarks: On Premise vs. Azure Cloud Performance
• On premise (12 physical cores):
− 17K QPS, 1416 queries / physical core
• 3 x SQL on A3 instances + 2 x
ScaleArc (A3) (20 virtual cores)
− 15K QPS, 750 queries / virtual core
• 4 x SQL on A3 instances + 2 x
ScaleArc (A3) (24 virtual cores)
− 18.5K QPS, 770 queries / virtual core
• 6 x SQL on A3 instances + 2 x
ScaleArc (A3) (32 virtual cores)
− 28K QPS, 866 queries / virtual core
5,408
10,184
15,032
18,499
23,441
27,731
17,034
- 5,000 10,000 15,000 20,000 25,000 30,000
1 x Azure (A3)
2 x Azure (A3)
3 x Azure (A3)
4 x Azure (A3)
5 x Azure (A3)
6 x Azure (A3)
On-Premise
Queries / Second on at 4096 Concurrent Connections
Note: ScaleArc + Azure enables linear scalability gains from adding readable secondaries with no app mods or downtime

© 2014 ScaleArc. All Rights Reserved. 11© 2015 ScaleArc. All Rights Reserved. 11
ScaleArc Cache Performance
• 2 x SQL on A3 + 1 x ScaleArc (A6) with
read cache enabled (16 virtual cores)
− 31.6K QPS, 1976 queries / virtual core
9,531
17,034
31,619
- 5,000 10,000 15,000 20,000 25,000 30,000 35,000
2 x Azure (A3)
On-Premise
2 x SQL (A3) + 1 x ScaleArc (A6)
Queries / Second on at 4096 Concurrent Connections
• On-premise server with 24 hyper-
threaded cores (12 physical cores)
− 17K QPS, 1416 queries / physical core
• 2 x SQL on A3 instances + 2 x
ScaleArc (A3) (16 virtual cores)
− 9.5K QPS, 595 queries / virtual core

© 2014 ScaleArc. All Rights Reserved. 12© 2015 ScaleArc. All Rights Reserved. 12
Automated Failover Testing
• ScaleArc detects failure of
current AlwaysOn Primary
• ScaleArc queues inbound
client traffic
• Queue shields app from errors
while failover completes
• Traffic pauses briefly as
ScaleArc queues traffic
• No errors are seen by app
while failover completes in
SQL AlwaysOn (other than the
failed queries to the server
that just died)
• Before failover, ScaleArc
performed automatic read/write
split, sending secondary reads
and primary reads and writes
• No config or app changes
needed, no read-intent strings
• After failover, newly promoted
server serves all traffic

© 2014 ScaleArc. All Rights Reserved. 13© 2015 ScaleArc. All Rights Reserved. 13
Additional Resources on Augmenting SQL Server