results of accelerated tests on flexible pavements in...
TRANSCRIPT

Ninth International Conference on Asphalt Pavements –Copenhagen/2002
Page 1
Results of accelerated tests on flexible pavements in Brazil using the UFRGS-DAER simulator
Fernando Pugliero Gonçalves & Jorge Augusto Pereira Ceratti
Universidade Federal do Rio Grande do Sul (UFRGS), Department of Civil Engineering, Brazil.
Régis Martins Rodrigues
Instituto Tecnológico de Aeronáutica (ITA), Geotechnical Department, Brazil.
ABSTRACT: Full-scale accelerated tests with traffic simulators have been used to improve methodologies for pavement design. To evaluate the performance of conventional and polymer modified asphalt mixtures a study is being conducted on a full-scale test facility at the Federal University of the Rio Grande do Sul. A linear traffic simulator has been used to carry out accelerated tests on six test sections of flexible pavements in asphalt concrete. The most important variables for asphalt mixtures performance evaluation in field are: evolution of surface cracking, rutting in wheel tracks, deflections, horizontal tensile strains in the bottom of the asphalt layer, measured with electrical resistance strain gauges, and vertical stress measured with total pressure cells in different locations of the pavement structure. This paper presents an evaluation of the several stages that composes the experimental part proposed. Special emphasis is given to results involving residual horizontal stress developed on the granular base layer during the compaction process.
1. INTRODUCTION In Brazil flexible pavements in asphalt concrete gradually deteriorate with time due to two mechanisms directly associated to the repeated passage of traffic loads: fatigue cracking in asphalt layers and the rutting in wheel tracks due to accumulation of plastic deformations in every structural layer.
Climate parameters, as air temperature and rain fall, as well as pavement drainage conditions, influence the rate of structural damage and affect the durability and mechanic properties of pavement materials . Stresses are generated when the structure tends to limit volumetric movements of thermal nature or of humidity variation.

Ninth International Conference on Asphalt Pavements –Copenhagen/2002
Page 2
Generally, the structural design of flexible pavement has been done by applying empirical methods which define the necessary total thickness in order to protect the subgrade against excessive plastic deformations. At the same time, these methods set, based on the estimated traffic volume, minimal thickness of the other layers, and specifications for materials. Such methods present are esy to apply and reflect the performances of real pavements.
However, it has been proved that the extrapolation of these methods to conditions others than the ones that originated them leads to under-design or over-design. Many studies, such as those carried out by Ullidtz (1), Witczack (2) and Rodrigues (3), have been developed in order to obtain performance prediction models. Only by applying such models it is possible to design pavements using new or alternative materials.
In this context, the current state of research development is presented. Its main propose is to investigate the performance of flexible pavement in asphalt concrete. In this research the behavior of conventional and polymer modified asphalt mixtures (PMBs) is being studied in laboratory. Also, full-scale accelerated pavement testing has been performed using a linear traffic simulator. This paper discusses the instrumentation and performance stages of six experimental sections built in a Pavement Test Facility established in a combined effort of the Federal University of Rio Grande do Sul (UFRGS) and Rio Grande do Sul State Road Department (DAER/RS).
Test sections have had their performance monitored in terms of evolution of main degradation mechanisms. Details regarding the UFRGS-DAER traffic simulator was presented by Ceratti et al. (4).
Periodically, pavement tests sections and the environment have been monitored through the following measurements:
• Performance (cracking and rutting data); • Environmental (rainfall, air and pavement temperature); • Structural response (strains, stresses, surface deflections and basins).
Once the asphalt concrete properties are highly dependent on the temperature (layer stiffness), measured deformations should be corrected to a reference temperature. In this sense, studies are being made to establish a local correcting factor that makes it possible to take into account the effects of temperature on the strain of the asphalt layer.
The temperature readings are done daily through a digital thermometer at 50 mm and 900 mm of deepness in the inner part of the asphalt layers. Also, investigations are being made to understand the effect of the level of load applied by the traffic simulator in the measured horizontal strains.
2. EXPERIMENTAL DESIGN Pavement life, defined as the number of loading cycles of a given magnitude to cause failure, is the dependent variable. Independent variables are:

Ninth International Conference on Asphalt Pavements –Copenhagen/2002
Page 3
• Layer thickness of asphalt coating (H); factor fixed in three levels: • Axle load (C); a factor fixed in three levels: 82,100 and 130 kN; • Type of asphalt mixture (M); a factor fixed in two levels (conventional and polymer modified
asphalt concrete). In order to take into account the non-linearity of the relations between dependent and
independent variables, levels were combined as the experimental matrix shows, obtained with the help of the software Statistics, presented on Table 1. In this project there are three controlled factors: two in three levels (applied loading and the asphalt concrete thickness) and a third at two levels (the type of mixture). In order to obtain a crossed project it would be necessary to test at least 18 sections, without including repetitions. Due to intrinsic restrictions to the research in development, 12 sectors will be tested, two in each experimental track.
Table 1. Experimental Design
Section Rut M Asphalt concrete layer thickness (mm)
Axle loads applied (kN)
1 1 AC 40 130 1 2 AC 40 82 2 1 PMB 40 130 2 2 PMB 40 82 3 1 PMB 66 130 3 2 PMB 60 120 4 1 AC 60 130 4 2 AC 60 120 5 1 AC 80 130 5 2 AC 80 100 6 1 PMB 80 130 6 2 PMB 80 100
2.1 Test Sections At first a study in laboratory was carried out aiming the characterization of materials to be used in the composition of asphalt mixtures. Recommended tests were carried out through Marshall Method adopting aggregate gradations commonly used by Brazilian Roads Departments.
In the sequence, for the different compositions, resilient modulus and tensile strength tests were performed. The adopted optimum content of asphalt was of 5 %, based on an integrated analysis of

Ninth International Conference on Asphalt Pavements –Copenhagen/2002
Page 4
the obtained results and taking into account the situation to which asphalt mixtures will be submitted in situ during the application of loads by the linear traffic simulator.
During experimental sections construction, cored specimens were tested to determine the fatigue laws, checking the behavior regarding the occurrence of permanent deformation, resilient modulus and traction resistance.
The construction of the test sections was finished on September 2nd 2000. In the pavements of experimental tracks respect, the following aspects are pointed out:
• Six experimental tracks were built. Three of them have asphalt layer constituted by
conventional asphalt mixture and the other three by polymer modified asphalt mixture; • Layer thickness of asphalt concrete are 40, 60 and 80 mm; • Subgrade was kept in the same state that it was during a previos study on thin pavements
with weathered basalt carried out by Nuñez (5) • Base and subase granular layers are made of densely grade crushed stone with gradation
compatible to Grade A of DAER/RS; • Base thickness in all base layers is 300 mm (densely graded crushed stone). The subgrade material was a red lateritic clay with a clay content (-2µm size) of 43%. Plasticity
tests indicated a plastic limit of 23 %, liquid limit of 44 %, and plasticity index of 21 %. The soil was classified as CL according to the Unified Soil classification system and as A-7-6 (7), according to AASHTO classification system. Laboratory moisture-unit weight testing gave a standard Proctor maximum dry unit weight of 16.7 kN/m3 at an optimum water content of 20.6 %.
3. INSTRUMENTATION During the construction of test sections, configured instruments were installed with the purpose of investigating pavement main responses of pavements to repeated load of the traffic simulator. Such responses include stresses and strains in the inner part of the layers of pavements. The main group of used sensors is made of total pressure cells and electrical resistance strain gauges. The places for the instrument installation instruments include critical points along pavement deepness.
Reports presented by OCDE (6), Oliver et al. (7), Chen et al (8) and Groenendijk et al. (9) present arguments results obtained through pavement instrumentation in different parts of the structure.
A sensor selection to measure the deformation in pavement structures should be based on several factors, such as durability, accuracy and repeatability of measurement, magnitude of deformations, mechanic resistance, capacity of outstanding the building stage, dimensions, fatigue life, places of interest and stability.
According to Tabatabaee et al. (10) the most suitable sensors to performance of deformation measurements structures are the electrical resistance strain gauges (cemented layers). Sebaaly et al. (11) present the applicability of sensors of Hall effect to performance of deformation measurement
Ninth International Conference on Asphalt Pavements –Copenhagen/2002
Page 5
in structures of flexible pavements. According to the responsible for the research, such sensor presented significant advantages when compared to electrical resistance strain gauges.
An important aspect to be observed on the choosing of the instrument to be used is that the installation of a sensor in a layer of pavement distorts the expected deformation distribution, demanding that the same agrees as much as possible with the component material. Therefore, desirable features for a deformation sensor include minimal stiffness to permit sufficient durability and flexibility to deform along with the material. In the sequence, installation techniques commonly used to measure deformations in asphalt pavement layer are presented. A more detailed performance and information evaluation related to costs and availability can be obtained in Van Deusen et al. (12) and Baker et al. (13).
Most of strain gauges commercially available cannot be directly incorporated to cemented and asphalt materials that compose a pavement structure. There are three main methods to prepare sensors of deformation considering its installation in a pavement structure: (1) H-gauges, (2) gauges prepared in laboratory and (3) gauges incorporated to material withdrawn from the pavement.
3.1 Identification of Places of Interest Considering the establishment of places of interest, that is, the definition of critical points where the sensors to measure stresses and deformations should be installed, it is initially necessary to identify the kind of pavement structure that will be instrumented.
In the case of flexible pavements in the asphalt concrete, the distribution of stresses and deformations produced in the structure by the loads of traffic occurs in a way that the asphaltic and base layers ease the compression vertical stresses in the substructure through the absorption of shearing stresses. In this process there are stresses and strains of tensile in lower fiber of asphalt layer which will cause cracking by fatigue by the repeated passage of loads of traffic. Therefore, in this case the ideal place to the performance of tensile strain measurement is at the bottom of the asphalt layer.
On the other hand if the kind of structure to be instrumented is of a semi rigid pavement, the cracking of the cemented base followed by quick crack reflection through the thickness of asphalt concrete is the preponderant degradation mechanism. This process of reflection occurs either by the repeated of the traffic loads or by the thermal movements in the cemented layer.
The cracking caused by fatigue due to the repetition of the tensile strains under the base, produced by loads of the vehicle wheels is always present. If hardness of the cemented mixture is high or if the conditions of cure are not adequate, the formation of retraction transversal cracks at the base is expected soon after the building.
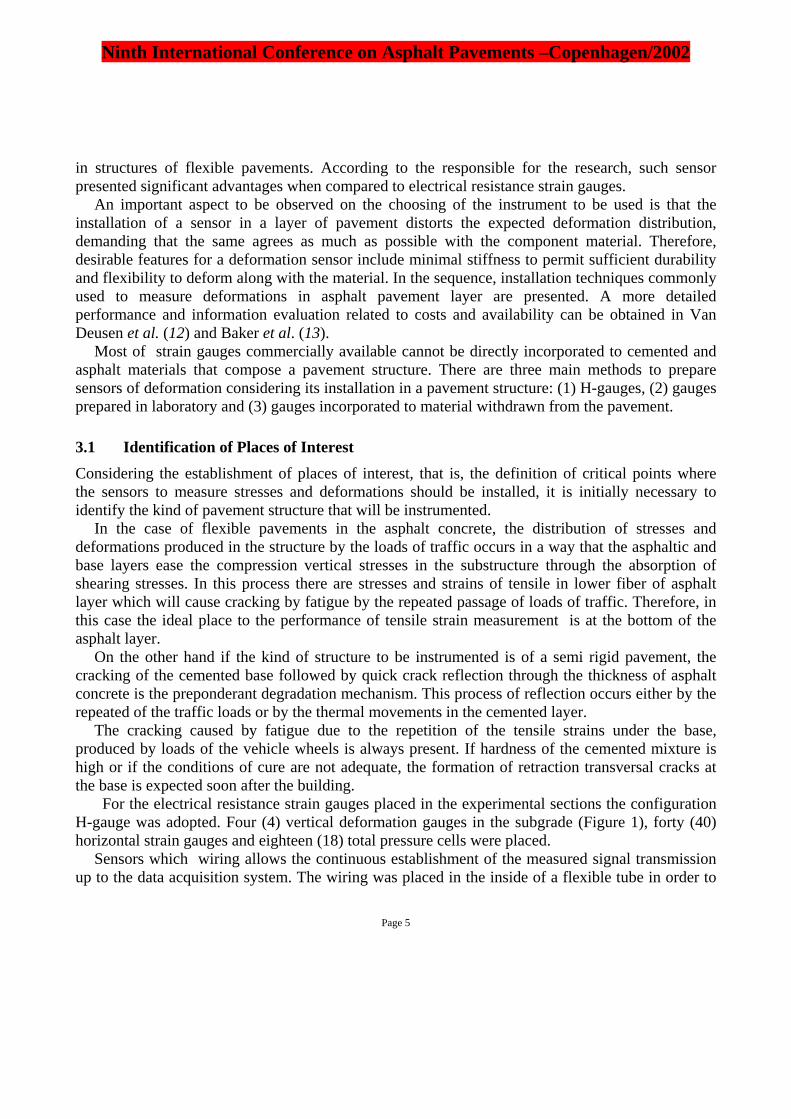
For the electrical resistance strain gauges placed in the experimental sections the configuration H-gauge was adopted. Four (4) vertical deformation gauges in the subgrade (Figure 1), forty (40) horizontal strain gauges and eighteen (18) total pressure cells were placed.
Sensors which wiring allows the continuous establishment of the measured signal transmission up to the data acquisition system. The wiring was placed in the inside of a flexible tube in order to
Ninth International Conference on Asphalt Pavements –Copenhagen/2002
Page 6
protect it, mainly, during the stages of pavement construction. Regarding the mechanical resistance of the sensors, these offer a minimal rigidity to assure a dependable performance.
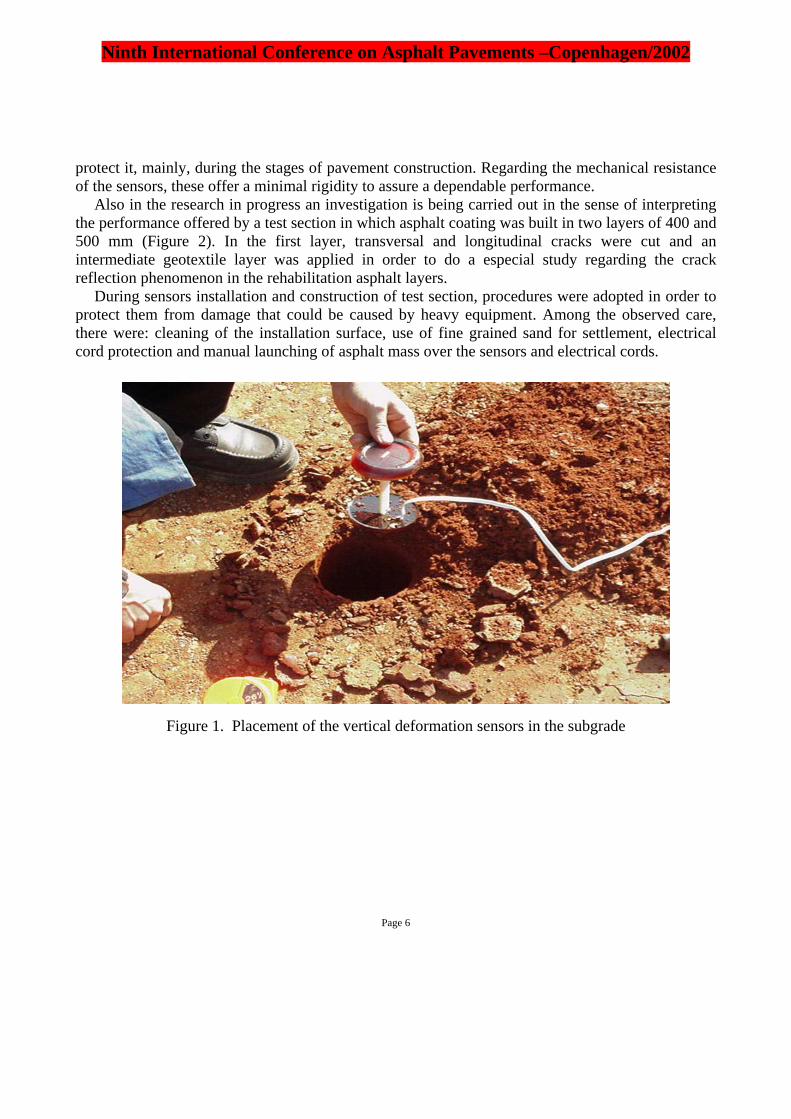
Also in the research in progress an investigation is being carried out in the sense of interpreting the performance offered by a test section in which asphalt coating was built in two layers of 400 and 500 mm (Figure 2). In the first layer, transversal and longitudinal cracks were cut and an intermediate geotextile layer was applied in order to do a especial study regarding the crack reflection phenomenon in the rehabilitation asphalt layers.
During sensors installation and construction of test section, procedures were adopted in order to protect them from damage that could be caused by heavy equipment. Among the observed care, there were: cleaning of the installation surface, use of fine grained sand for settlement, electrical cord protection and manual launching of asphalt mass over the sensors and electrical cords.
Figure 1. Placement of the vertical deformation sensors in the subgrade
Ninth International Conference on Asphalt Pavements –Copenhagen/2002
Page 7
A B C D E F
STRAIN GAUGES
GEOTEXTILE 01 GEOTEXTILE 02
(a) Test section
(b) Strain gauges
(c) Placement of the horizontal strain sensors in the asphalt concrete
Ninth International Conference on Asphalt Pavements –Copenhagen/2002
Page 8
Figure 2. Localization of strain gauges placed in a test section (anti-reflection of cracks system)
4. STRESS MEASUREMENTS DURING THE COMPACTION When a computer program is applied through the elastic layer theory to a flexible pavement and the horizontal residual stresses left by the compaction on the granular layers are not taken into account it is common to see horizontal tensile stress in the lower fiber of those layers.
As the granular materials are resistant to extremely low tensile (only due to the suction and to the meshing of aggregations), this is clearly a rupture condition, which violates the Mohr-Coulomb criteria. This is in contradiction, however, with the performance observed in the field, where excessive accumulation of plastic deformation due to the contribution of the base granular layer is not recorded.
The explanation to this apparent paradox lies on the compression horizontal residual layers which are stored in the granular layer since the first cycles of load to which the layer is submitted to. Thus, even if the increase of stresses caused by the application of cyclical loads is of tensile, the state of the resulting strains is always of compression, not violating, therefore, the Mohr-Coulomb criteria.
Taking into account the horizontal residual stresses left by the compaction in the granular layers is fundamental when we apply software through the elastic layer theory or through the definite elements method in analysis where sensitivity to the state of tension of the resilient modulus is considered. Otherwise, we will come to wrong conclusion that with the rising of a granular base in thickness its effective elasticity modulus will sharply decrease.
When the obtained correlation is taken into account from the deflection measurement, by Dormon & Metcaf (14) between the effective modulus of a base or sub-base layer and the effective modulus of a subjacent subgrade, which varies according to the thickness of a base layer:
( ) 3
45,022 2,0 EhE ××= (1)
in which
E2: elasticity modulus of the base granular layer[MPa]; h2: base layer thickness (mm) E3: subgrade elasticity modulus [MPa] it is observed a contrary tendency: the effective modulus of the granular layer increases along
with its thickness. Regarding the simplification associated to the correlation above, it portraits experimental results that show that the compaction residual strain cannot be disregarded when using non-linear resilient patterns in the structural analysis of pavements.
In the research at hand, for the investigation of the horizontal and vertical stress evolution caused during the compaction of calibrated crushed stones, six cells of total pressure were installed in different points located along of the deepness of the base and sub-base layers of a experimental
Ninth International Conference on Asphalt Pavements –Copenhagen/2002
Page 9
section of the pavement (50 mm, 150 mm and 290 mm). The total pressure cells used are from the Kyowa model.
The techniques used for the installation include the use of metallic fixation elements to make possible the horizontal and vertical readings and the use of a small amount of fine sand for the settlement and leveling of the cells.
The base and sub-base granular layers were compacted through the use of rolls of the vibrating kind and tires. Measurements were performed at intervals corresponding to each compaction equipment passage, being also recorded the effects under the dynamic loading and the responses read immediately after the removal of the stress imposed by the compacting equipment. 5. TOTAL PRESSURE CELLS CALIBRATION The calibration of used instruments in the field was performed in a lab on the same materials and kind of configuration used for the readings done during the compaction of the pavement layers.
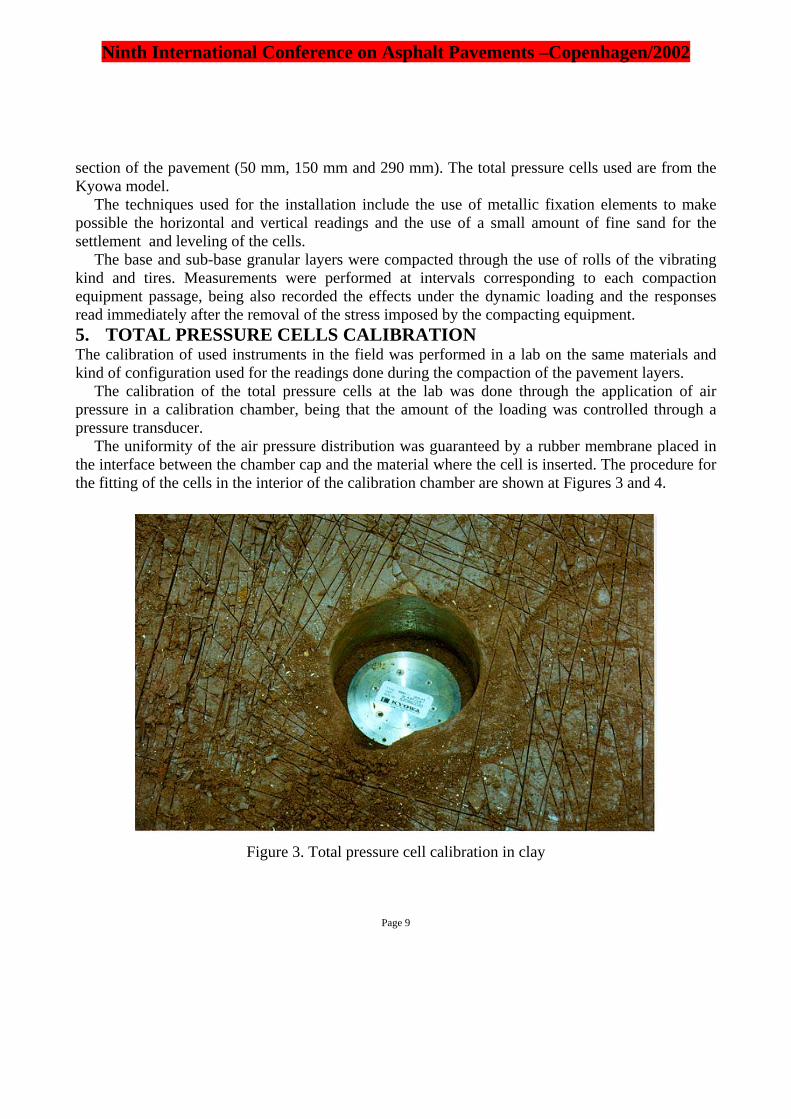
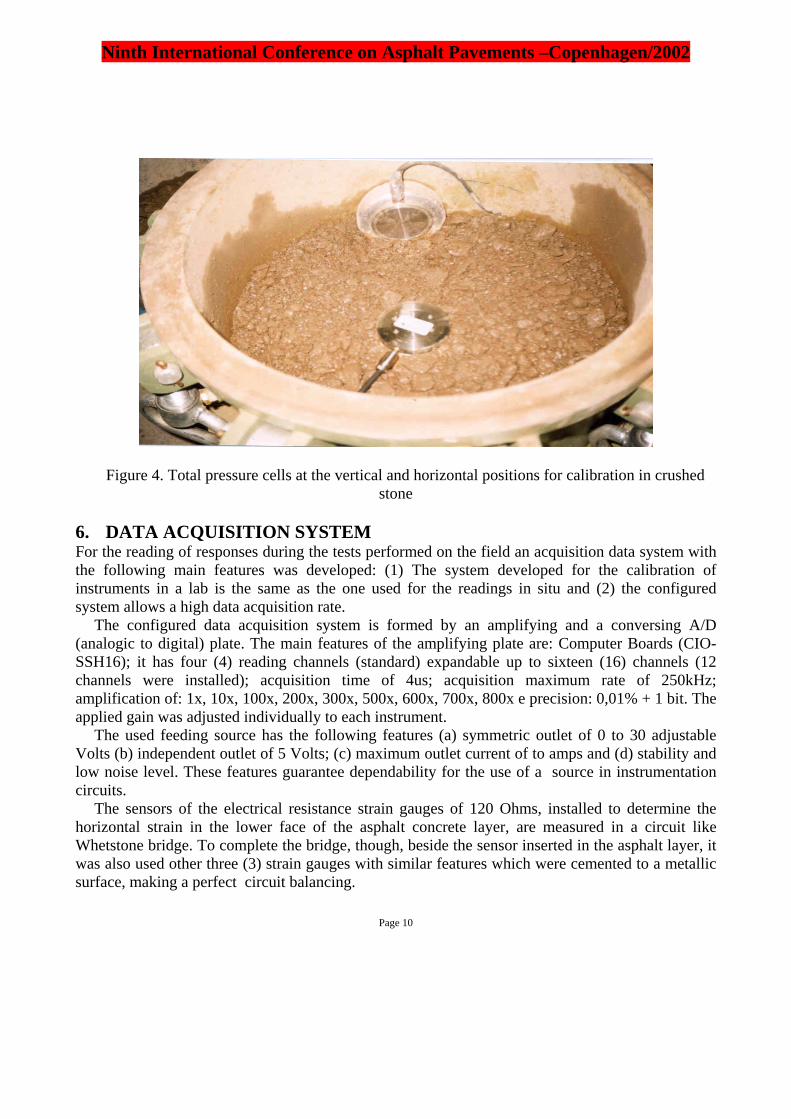
The calibration of the total pressure cells at the lab was done through the application of air pressure in a calibration chamber, being that the amount of the loading was controlled through a pressure transducer.
The uniformity of the air pressure distribution was guaranteed by a rubber membrane placed in the interface between the chamber cap and the material where the cell is inserted. The procedure for the fitting of the cells in the interior of the calibration chamber are shown at Figures 3 and 4.
Figure 3. Total pressure cell calibration in clay
Ninth International Conference on Asphalt Pavements –Copenhagen/2002
Page 10
Figure 4. Total pressure cells at the vertical and horizontal positions for calibration in crushed stone
6. DATA ACQUISITION SYSTEM For the reading of responses during the tests performed on the field an acquisition data system with the following main features was developed: (1) The system developed for the calibration of instruments in a lab is the same as the one used for the readings in situ and (2) the configured system allows a high data acquisition rate.
The configured data acquisition system is formed by an amplifying and a conversing A/D (analogic to digital) plate. The main features of the amplifying plate are: Computer Boards (CIO-SSH16); it has four (4) reading channels (standard) expandable up to sixteen (16) channels (12 channels were installed); acquisition time of 4us; acquisition maximum rate of 250kHz; amplification of: 1x, 10x, 100x, 200x, 300x, 500x, 600x, 700x, 800x e precision: 0,01% + 1 bit. The applied gain was adjusted individually to each instrument.
The used feeding source has the following features (a) symmetric outlet of 0 to 30 adjustable Volts (b) independent outlet of 5 Volts; (c) maximum outlet current of to amps and (d) stability and low noise level. These features guarantee dependability for the use of a source in instrumentation circuits.
The sensors of the electrical resistance strain gauges of 120 Ohms, installed to determine the horizontal strain in the lower face of the asphalt concrete layer, are measured in a circuit like Whetstone bridge. To complete the bridge, though, beside the sensor inserted in the asphalt layer, it was also used other three (3) strain gauges with similar features which were cemented to a metallic surface, making a perfect circuit balancing.
Ninth International Conference on Asphalt Pavements –Copenhagen/2002
Page 11
In the data acquisition activities many software are being used, among which some stand out: Microsoft Windows 98, Microsoft Excel and Microsoft Word. The control programs were developed in a commercial software called HP-VEE, developed by Hewlett Packard. That software is available specifically for data acquisition and process control and its main features are: (1) visual programming (2) allows the use of a pre-programmed sub-routine and (3) eases interfacing with other applicatives. Up to the moment, in this research, two programs were developed in HP-VEE. and one of them is for data acquisition under static loading and the other for acquisition under dynamic loading.
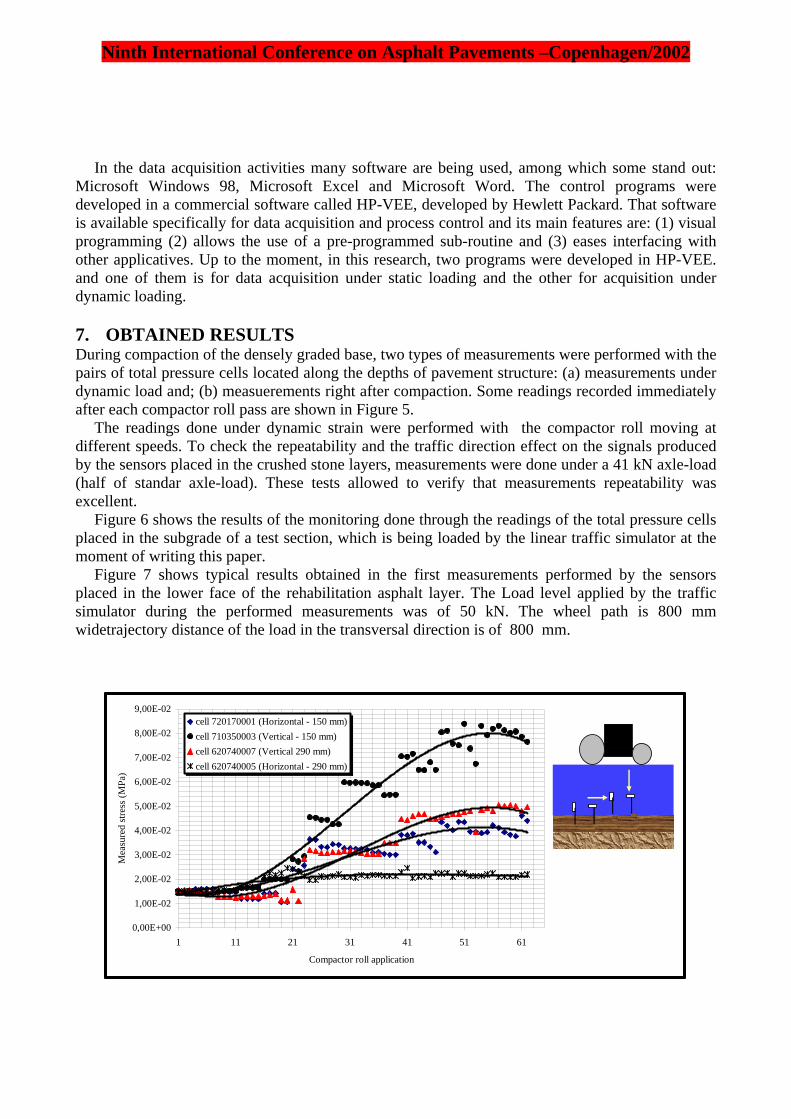
7. OBTAINED RESULTS During compaction of the densely graded base, two types of measurements were performed with the pairs of total pressure cells located along the depths of pavement structure: (a) measurements under dynamic load and; (b) measuerements right after compaction. Some readings recorded immediately after each compactor roll pass are shown in Figure 5.
The readings done under dynamic strain were performed with the compactor roll moving at different speeds. To check the repeatability and the traffic direction effect on the signals produced by the sensors placed in the crushed stone layers, measurements were done under a 41 kN axle-load (half of standar axle-load). These tests allowed to verify that measurements repeatability was excellent.
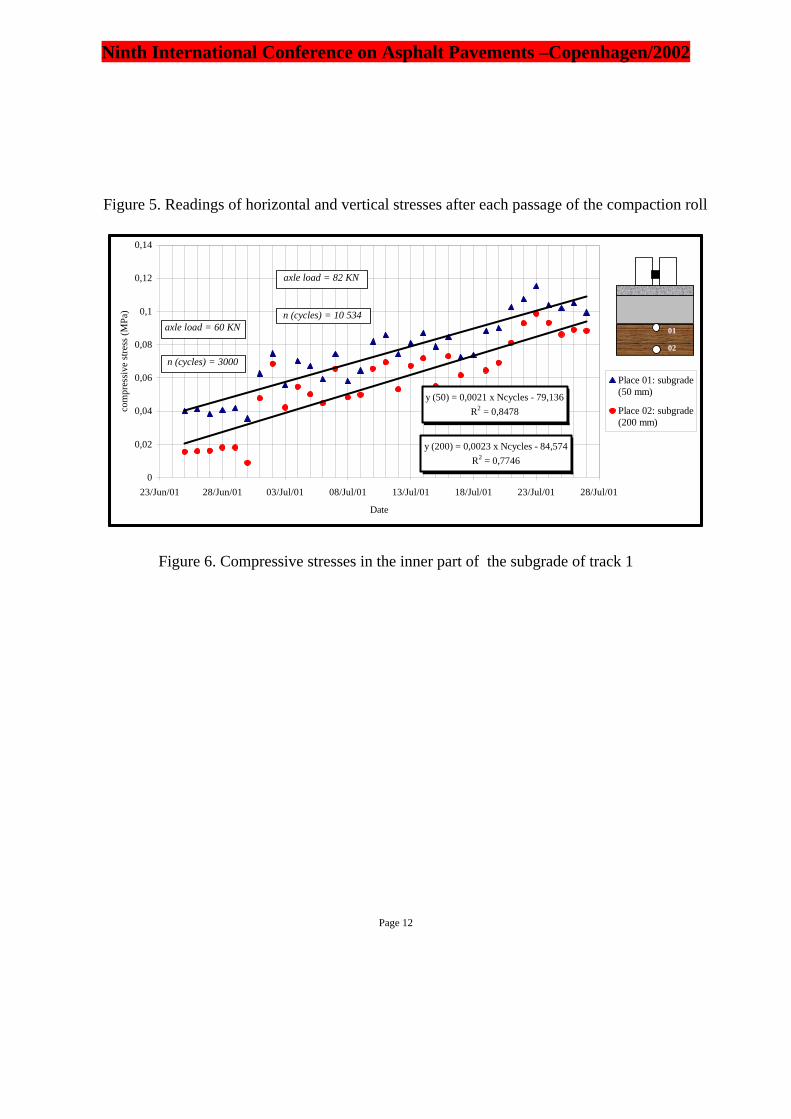
Figure 6 shows the results of the monitoring done through the readings of the total pressure cells placed in the subgrade of a test section, which is being loaded by the linear traffic simulator at the moment of writing this paper.
Figure 7 shows typical results obtained in the first measurements performed by the sensors placed in the lower face of the rehabilitation asphalt layer. The Load level applied by the traffic simulator during the performed measurements was of 50 kN. The wheel path is 800 mm widetrajectory distance of the load in the transversal direction is of 800 mm.
0,00E+00
1,00E-02
2,00E-02
3,00E-02
4,00E-02
5,00E-02
6,00E-02
7,00E-02
8,00E-02
9,00E-02
1 11 21 31 41 51 61
Compactor roll application
Mea
sure
d st
ress
(MPa
)
cell 720170001 (Horizontal - 150 mm)cell 710350003 (Vertical - 150 mm)cell 620740007 (Vertical 290 mm)cell 620740005 (Horizontal - 290 mm)
Ninth International Conference on Asphalt Pavements –Copenhagen/2002
Page 12
Figure 5. Readings of horizontal and vertical stresses after each passage of the compaction roll
y (200) = 0,0023 x Ncycles - 84,574R2 = 0,7746
y (50) = 0,0021 x Ncycles - 79,136R2 = 0,8478
0
0,02
0,04
0,06
0,08
0,1
0,12
0,14
23/Jun/01 28/Jun/01 03/Jul/01 08/Jul/01 13/Jul/01 18/Jul/01 23/Jul/01 28/Jul/01
Date
com
pres
sive
stre
ss (M
Pa)
Place 01: subgrade(50 mm)
Place 02: subgrade(200 mm)
n (cycles) = 3000
axle load = 60 KN
axle load = 82 KN
n (cycles) = 10 53401
02
Figure 6. Compressive stresses in the inner part of the subgrade of track 1

Ninth International Conference on Asphalt Pavements –Copenhagen/2002
Page 13
Figure 7. Typical shape of horizontal strain measured under dynamic load
8. CONCLUSIONS This paper presented the first results of stress and strains measurements in flexible pavements, measured during full-scale accelerated tests with a linear traffic simulator, at the Pavement Tests Facility - UFRGS/DAER-RS. In the present stage of the work, the following main aspects regarding the development of the research can be reported:
• Development of a data acquisition system for the instrumentation of the full-scale
experimental sections; • Total pressure cell calibration in different environments (air, sand, clay and crushed stone) in
the laboratory; • Construction and instrumentation of six experimental tracks 4 meters wide & 12 meters long; • At the experimental section built for the investigation the use of geotextiles as an anti-
reflection of cracks six strain gauges of electrical resistance were installed. Five (5) of them survived building;
• The configured data acquisition system allows the reading of the deformation sensors placed in the pavement in an operational and dependable way.
A thorough interpretation of the collected results in the field in the measurements of horizontal
and vertical stresses generated during the compaction of the calibrated crushed stones might contribute for the establishment of conclusions regarding the development of residual stresses in
0,00029
0,00031
0,00033
0,00035
0,00037
0,00039
0,00041
0,00043
0,00045
0 5 10 15 20 25 30 35 40 45 50 55 60 65 70 75 80 85 90 95
Time (s)
Tens
ile st
rain
at t
he b
otto
m o
f asp
halt
conc
rete
(m
icro
stra
in)
800 mm
Strain gauge

Ninth International Conference on Asphalt Pavements –Copenhagen/2002
Page 14
granular layers during the compaction process. Investigations in this regard are being made and should be presented in future publications.
The experiment in progress will allow to follow the evolution of the horizontal strains in the lower face of the rehabilitation asphalt layer with the increase of the pavement structure in terms of its main degradation mechanisms (cracking and occurrence of permanent deformation).
Such monitoring, should, yet, make possible a comparative investigation on the transversal and longitudinal horizontal strains in the sections of conventional rehabilitation and in those with different kinds of geotextiles as an intermediate layer.
The end of the performed accelerated tests in the experimental tracks is expected to take place in the year of 2002.
9. ACKNOWLEDGMENTS This research is part of a study in progress with the purpose of investigating the performance of asphalt mixtures used in Brazil. The financial support comes from the Support Program for the Excellency Centers (PRONEX) from the Science and Technology Ministry (MCT) of the Brazilian Government.
The authors express their sincere appreciation to the staff from the Pavement Test Facility. Specially our thanks to Ipiranga Asfaltos S.A. and Concessionaria da Rodovia Osorio Porto Alegre S.A. and for the support and compromising at the carrying out of the experimental tracks.
10. REFERENCES 1. Ullidtz, P.; Zhang, W. and Baltzer, 1999, S. "Validation of Pavement Response and Performance
Models", International Conference Accelerated Pavement Testing,, Reno, Nevada. 2. Witczack, M. W., Von Quintus, H. L. and Shartz, C. W., 1998, Superpave Suport and
Performance Models Management: Evaluation of the SHRP Performance Models System. http://www.ence.umd.edu/superpave. Accessed Oct. 5, 1998.
3. Rodrigues, R.M., 2000, Performance Prediction Models for Highway and Airport Pavements in Brazil. Final Report FAPESP, São Paulo.
4. Ceratti, J. A., Nnuñez, W. P., Gehling, W. Y., Oliveira, J. A., 2000, A Full-Scale Study of Rutting of Thin Pavements. Transportation Research Board, 79 th Annual Meeting, Washington, D. C.
5. Núñez, W. P., 1997, Experimental Analysis of Slender Pavements Built with Weathered Basalts. Ph.D. Thesis, UFRGS/CPGEC, Porto Alegre, 294p. (In Portuguese)
6. OECD “Full-scale Pavement Tests”, 1985, Road Transport Research, Organisation for Economic Co-operation and Development, Paris.
7. Chen, D. H.; Fults, K; Murphy, M., 1997, The primary results for the first TxMLS test pad. In:Transportation Research Board Annual Meeting, 76, Washington, D.C.
8. Oliver,J. W. H.; Jameson, G. W.; Sharp, K. G.; Vertessy, N. J.; Johnson-Clarke, J. R.; Alderson, A. J., 1997, An evaluation of the rut-resistant properties of asphalt mixes under field and laboratory conditions. In:Transportation Research Board Annual Meeting, 76, Washington, D.C.

Ninth International Conference on Asphalt Pavements –Copenhagen/2002
Page 15
9. Groenendijk, J.; Miradi, A.; Molenaar, A. A. A.; Vogelzang, C. H.; Dohmen, L. J. M.,1997, Rutting development in LINTRACK test pavements: evaluation of the Shell subgrade criterion. In:Transportation Research Board Annual Meeting, 76, 1997, Washington, D.C.
10. Tabatabaee, N., Al-Qadi, I.L., Sebaaly, P.E., 1992, Field Evaluation of Pavement Instrumentation Methods, Journal of Testing and Evaluation, Vol. 20, no 2, pp. 144-151.
11. Sebaaly, P.E., Tabatabaee, N., Kulakowsky, B., 1995, Evaluation of the Hall Effect Sensor for Pavement Instrumentation, American Society for Testing and Materials.
12. Van Deusen, D.A., Newcomb, D.E., Labuz, J. F., 1992, A Review of Instrumentation Technology for the Minnesota Road Research Project, Minnesota Department of Transportation - Mn/ROAD.
13. Baker, H. B., Buth, M. R., Van Deusen, D.A., 1994, Minnesota Road Research Project: Load Response Instrumentation/ Installation and Testing Procedures, Minnesota Department of Transportation - Mn/ROAD.
14. Shell (1981). The Shell Pavement Design Manual, MS-1.