results for the first six months - wizz air bulgaria · 56.9 67.0 78.5 83.0 91.9 97.8 wizz ryanair...
TRANSCRIPT

WIZZ AIR HOLDINGS PLCRESULTS FOR THE FIRST SIX MONTHSH1 F20
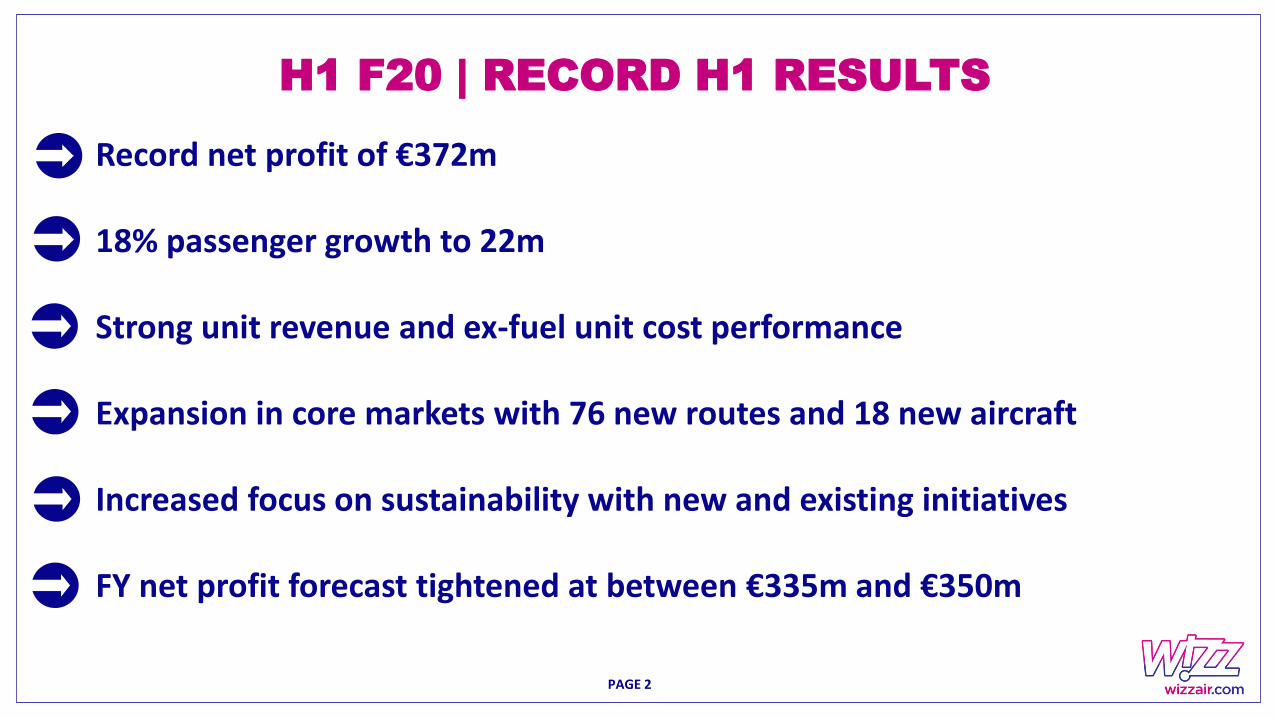
H1 F20 | RECORD H1 RESULTS
Record net profit of €372m
18% passenger growth to 22m
Strong unit revenue and ex-fuel unit cost performance
Expansion in core markets with 76 new routes and 18 new aircraft
Increased focus on sustainability with new and existing initiatives
FY net profit forecast tightened at between €335m and €350m
PAGE 2
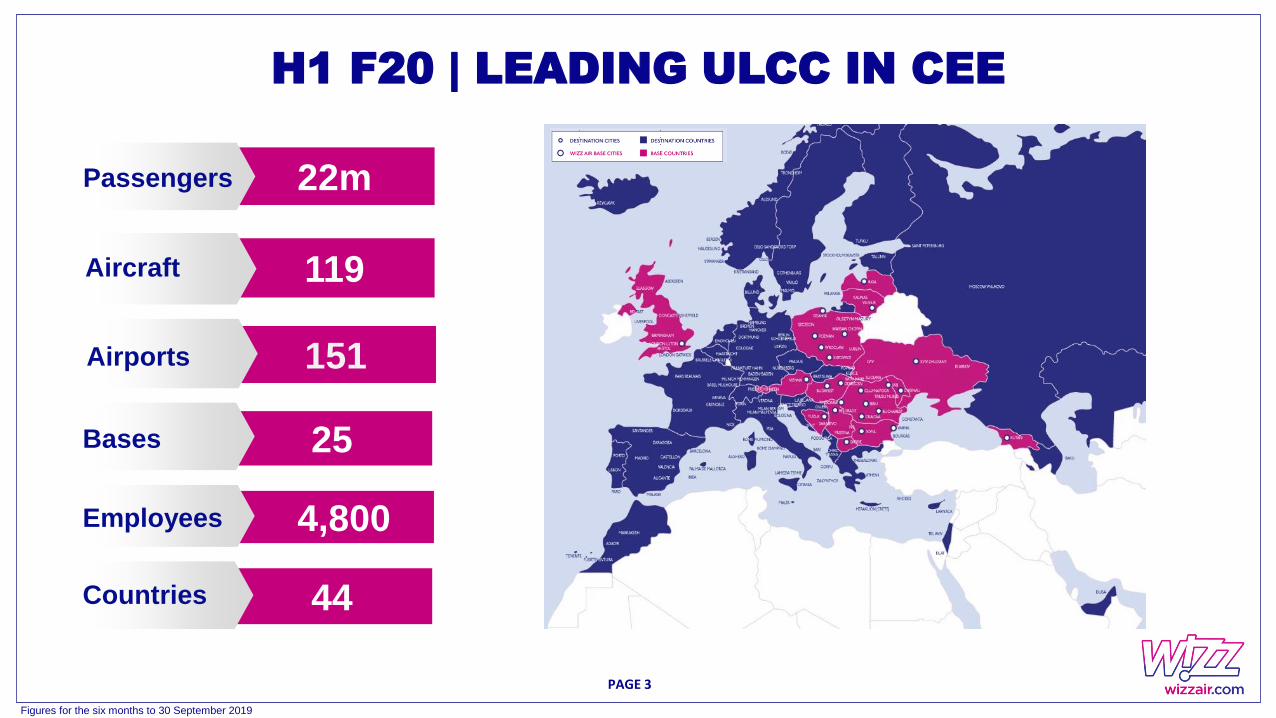
H1 F20 | LEADING ULCC IN CEE
22mPassengers
151Airports
25 Bases
119Aircraft
4,800Employees
44Countries
Figures for the six months to 30 September 2019
PAGE 3
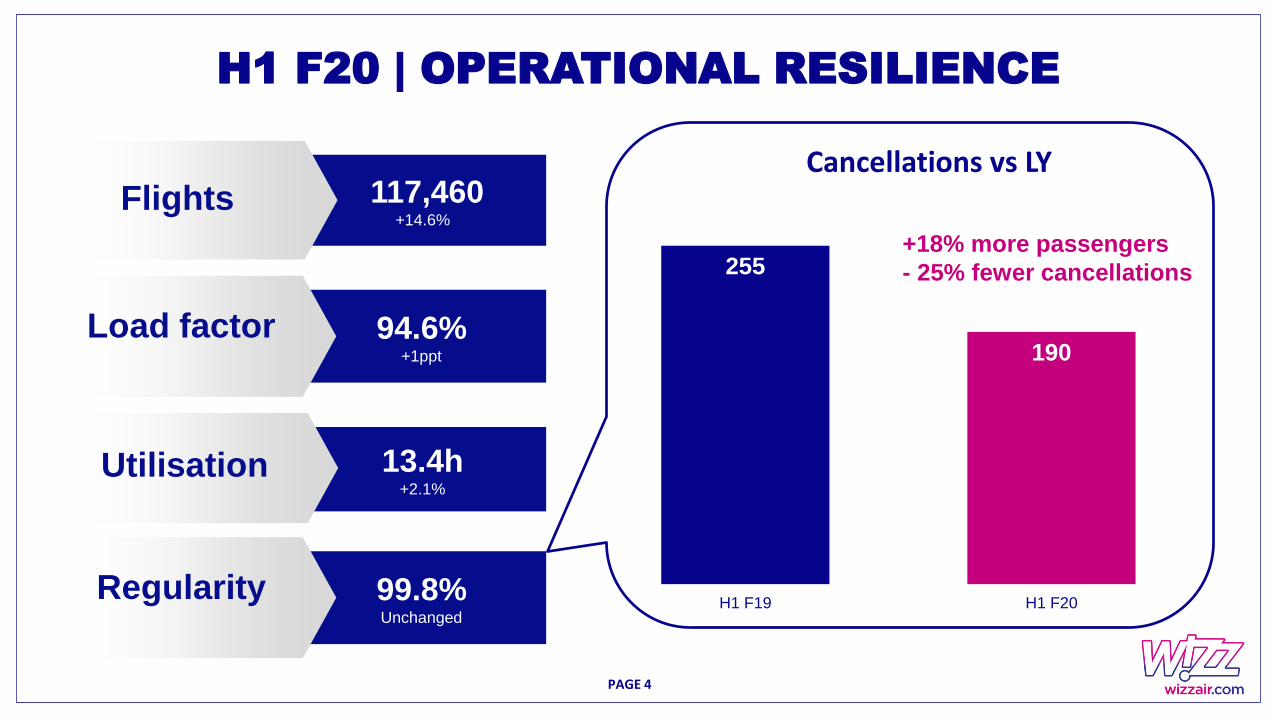
H1 F20 | OPERATIONAL RESILIENCE
13.4h+2.1%
Utilisation
117,460 +14.6%
Flights
99.8%Unchanged
Regularity
94.6%+1ppt
Load factor
255
190
H1 F19 H1 F20
Cancellations vs LY
+18% more passengers
- 25% fewer cancellations
PAGE 4
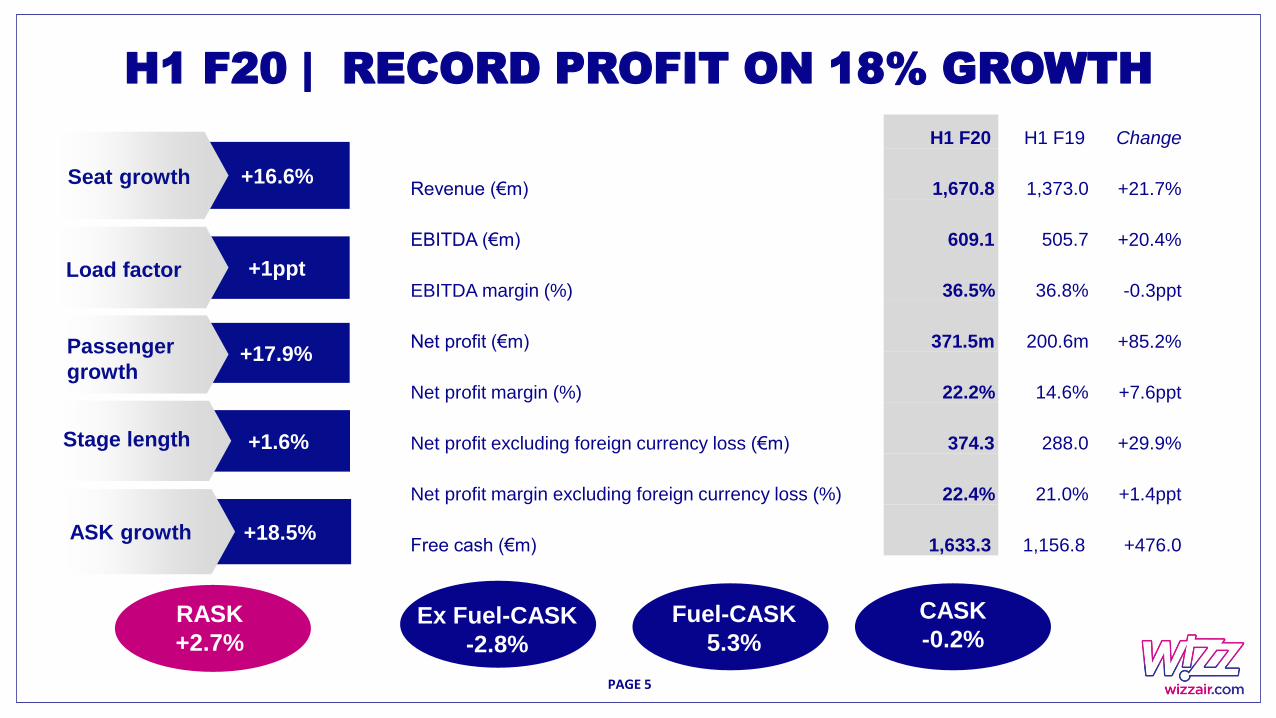
H1 F20 | RECORD PROFIT ON 18% GROWTH
H1 F20 H1 F19 Change
Revenue (€m) 1,670.8 1,373.0 +21.7%
EBITDA (€m) 609.1 505.7 +20.4%
EBITDA margin (%) 36.5% 36.8% -0.3ppt
Net profit (€m) 371.5m 200.6m +85.2%
Net profit margin (%) 22.2% 14.6% +7.6ppt
Net profit excluding foreign currency loss (€m) 374.3 288.0 +29.9%
Net profit margin excluding foreign currency loss (%) 22.4% 21.0% +1.4ppt
Free cash (€m) 1,633.3 1,156.8 +476.0
+16.6%Seat growth
+1pptLoad factor
+1.6%Stage length
+18.5%ASK growth
+17.9%Passenger
growth
RASK
+2.7%
CASK
-0.2%Fuel-CASK
5.3%Ex Fuel-CASK
-2.8%
PAGE 5

859 957
514
714
H1 F19 H1 F20
Ticket Ancillary
H1 F20 | STRONG REVENUE GENERATION
Revenue (€m)
+22%RASK +2.7 %
Ancillary per pax +17.8 %
Ticket per pax -5.5 %
Revenue per pax +3.3 %
- Easter effect
- Strong bag recovery
- Strong value-add ancillaries
- Strong GDP growth in CEE
- Higher load factor
Revenue Drivers
1,373
1,671
PAGE 6
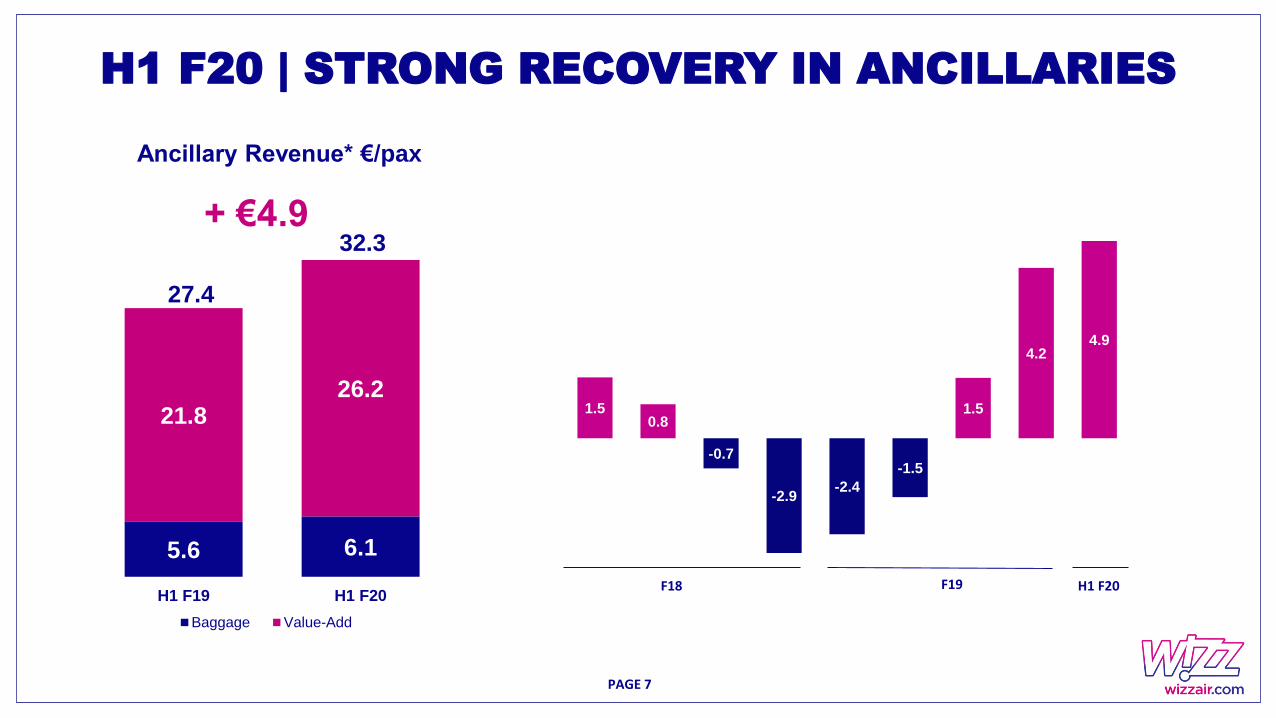
1.50.8
-0.7
-2.9-2.4
-1.5
1.5
4.24.9
H1 F20 | STRONG RECOVERY IN ANCILLARIES
Ancillary Revenue* €/pax
5.6 6.1
21.826.2
H1 F19 H1 F20
Baggage Value-Add
32.3
27.4
+ €4.9
F18 F19 H1 F20
PAGE 7
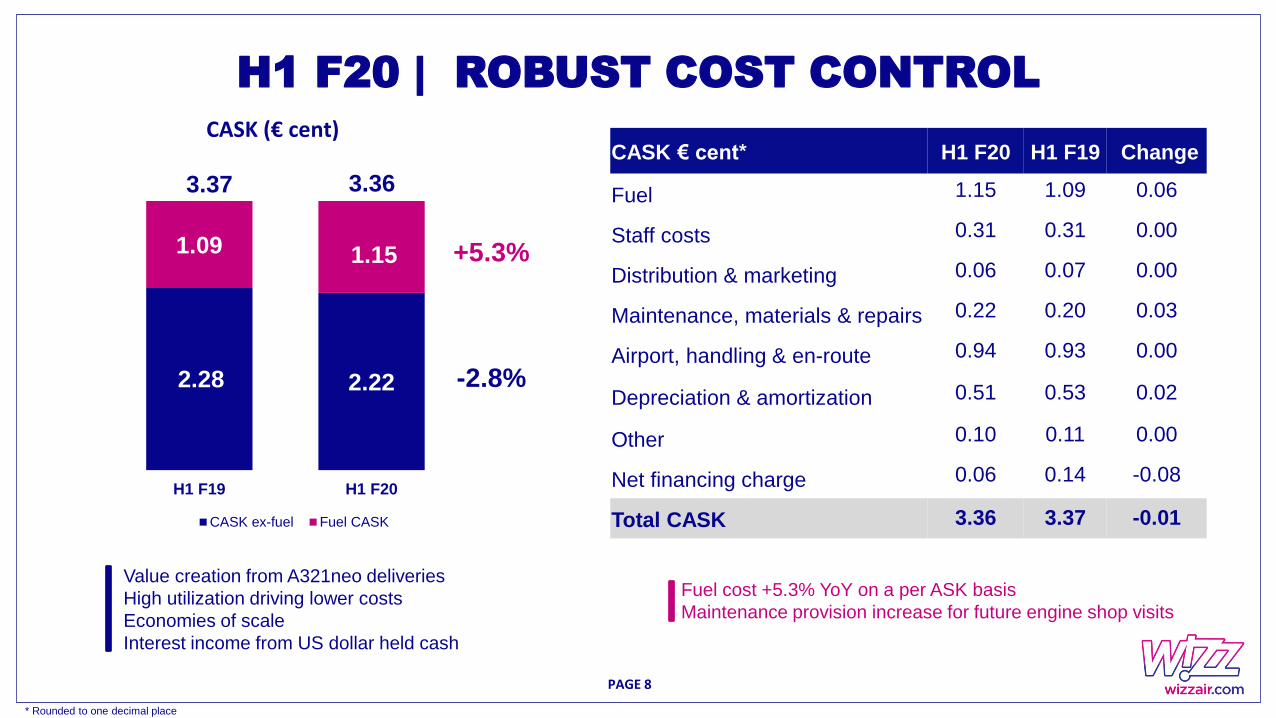
H1 F20 | ROBUST COST CONTROL
CASK € cent* H1 F20 H1 F19 Change
Fuel 1.15 1.09 0.06
Staff costs 0.31 0.31 0.00
Distribution & marketing 0.06 0.07 0.00
Maintenance, materials & repairs 0.22 0.20 0.03
Airport, handling & en-route 0.94 0.93 0.00
Depreciation & amortization 0.51 0.53 0.02
Other 0.10 0.11 0.00
Net financing charge 0.06 0.14 -0.08
Total CASK 3.36 3.37 -0.01
CASK (€ cent)
2.28 2.22
1.09 1.15
H1 F19 H1 F20
CASK ex-fuel Fuel CASK
+5.3%
-2.8%
3.37 3.36
Value creation from A321neo deliveries
High utilization driving lower costs
Economies of scale
Interest income from US dollar held cash
PAGE 8
Fuel cost +5.3% YoY on a per ASK basis
Maintenance provision increase for future engine shop visits
* Rounded to one decimal place
PAGE 9
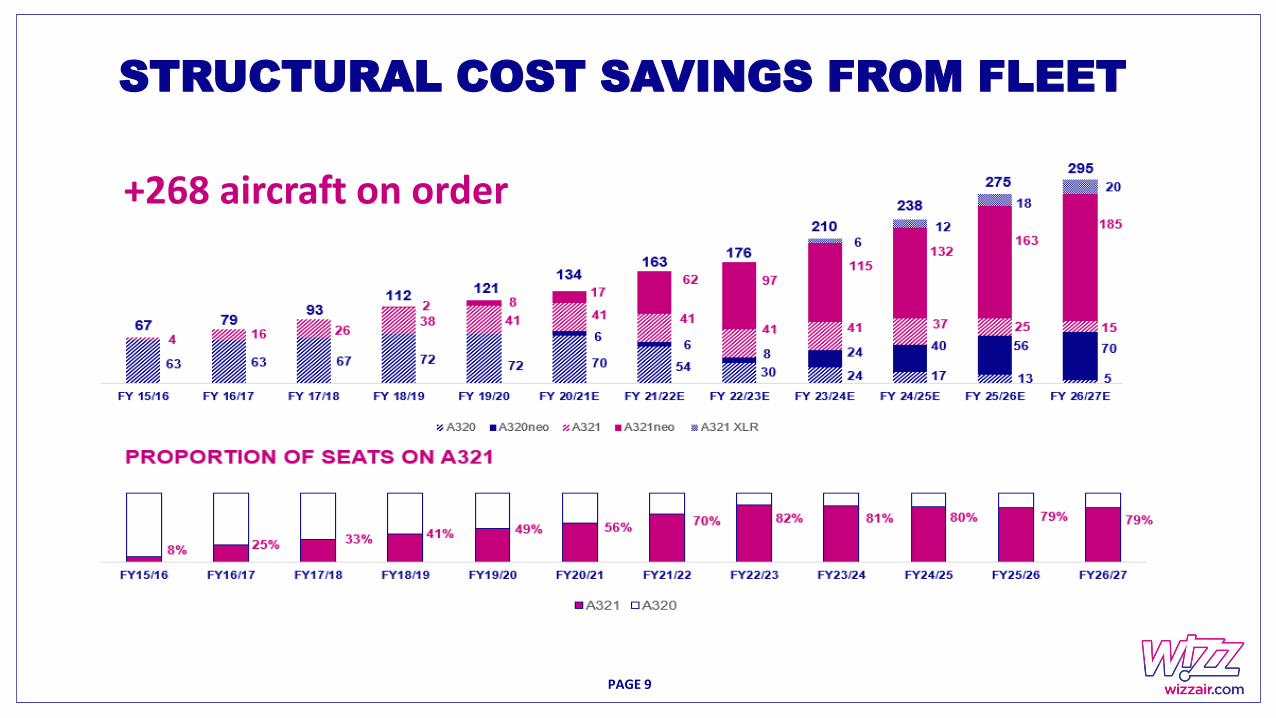
STRUCTURAL COST SAVINGS FROM FLEET
+268 aircraft on order
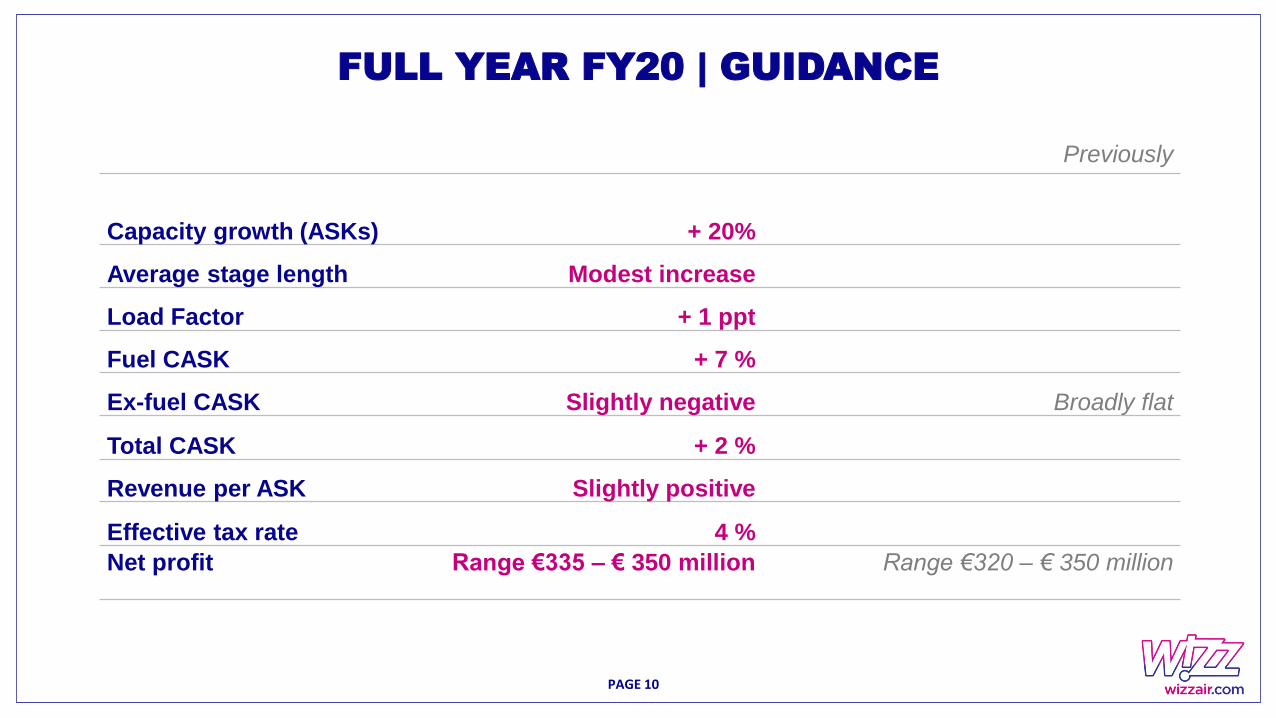
FULL YEAR FY20 | GUIDANCE
Guidance Previously
Capacity growth (ASKs) + 20%
Average stage length Modest increase
Load Factor + 1 ppt
Fuel CASK + 7 %
Ex-fuel CASK Slightly negative Broadly flat
Total CASK + 2 %
Revenue per ASK Slightly positive
Effective tax rate 4 %
Net profit Range €335 – € 350 million Range €320 – € 350 million
PAGE 10
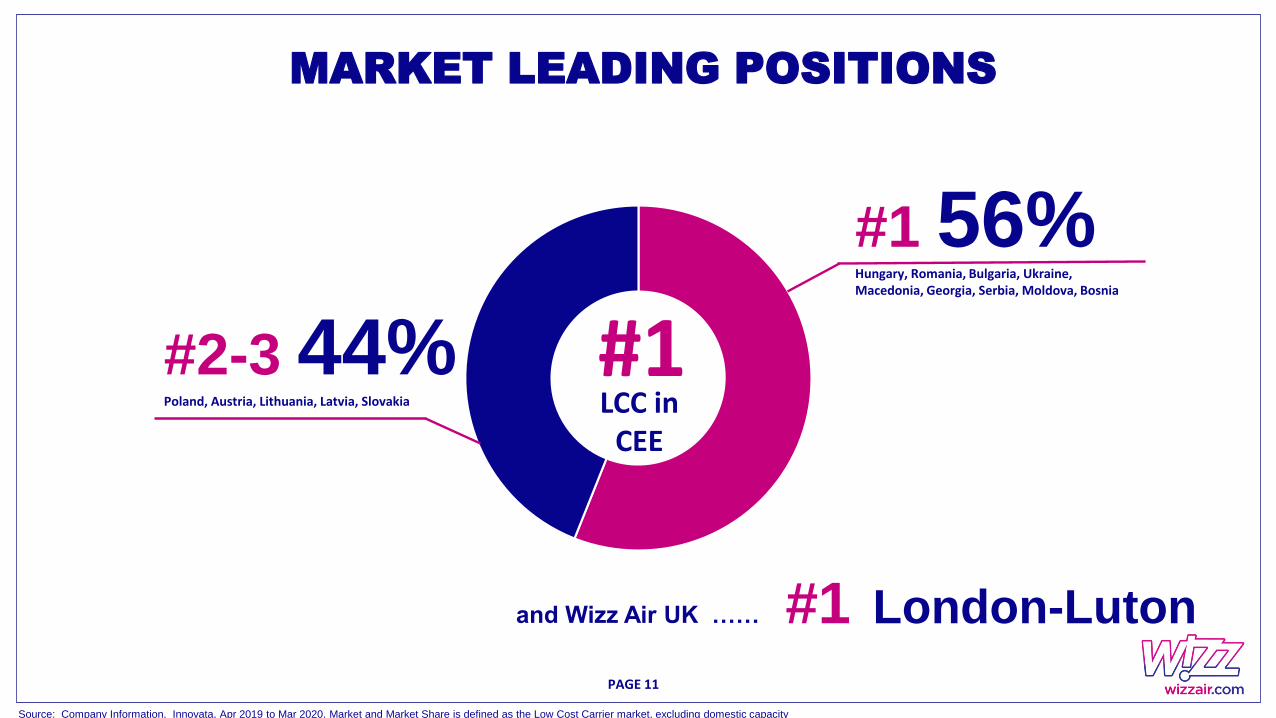
#2-3 44%Poland, Austria, Lithuania, Latvia, Slovakia
#1 56%Hungary, Romania, Bulgaria, Ukraine, Macedonia, Georgia, Serbia, Moldova, Bosnia
Source: Company Information. Innovata, Apr 2019 to Mar 2020. Market and Market Share is defined as the Low Cost Carrier market, excluding domestic capacity
MARKET LEADING POSITIONS
#1
and Wizz Air UK …… #1 London-Luton
LCC in CEE
PAGE 11
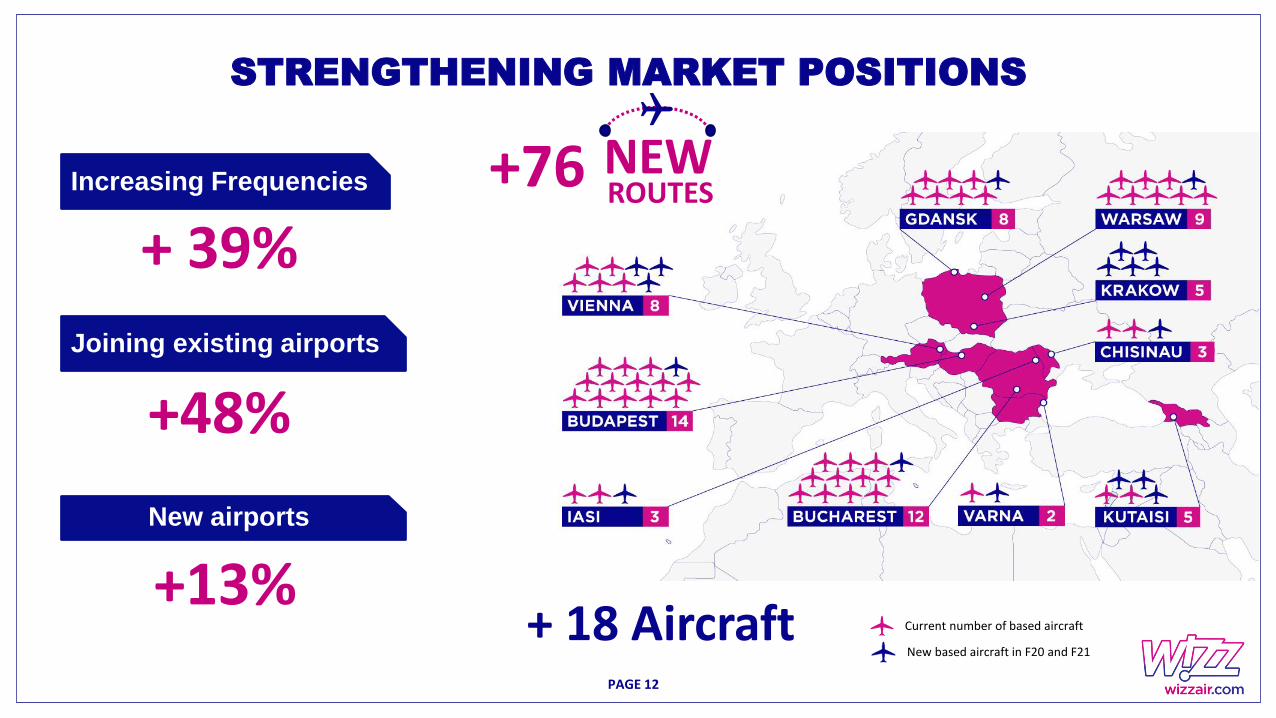
STRENGTHENING MARKET POSITIONS
Increasing Frequencies
+ 39%
+48%
Joining existing airports
+13%New airports
PAGE 12
+ 18 Aircraft Current number of based aircraft
New based aircraft in F20 and F21
+76 NEWROUTES
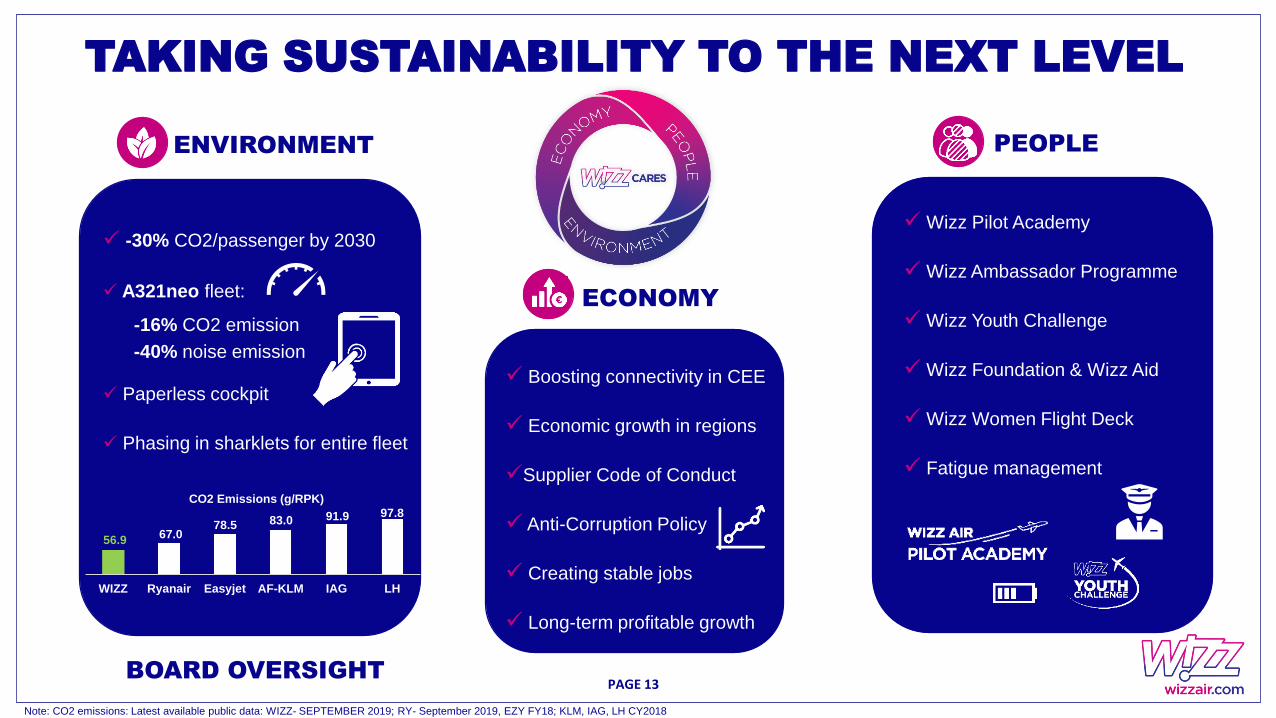
PEOPLEENVIRONMENT
ECONOMY
✓ Wizz Pilot Academy
✓ Wizz Ambassador Programme
✓ Wizz Youth Challenge
✓ Wizz Foundation & Wizz Aid
✓ Wizz Women Flight Deck
✓ Fatigue management
✓ -30% CO2/passenger by 2030
✓ A321neo fleet:
-16% CO2 emission
-40% noise emission
✓ Paperless cockpit
✓ Phasing in sharklets for entire fleet
✓ Boosting connectivity in CEE
✓ Economic growth in regions
✓Supplier Code of Conduct
✓ Anti-Corruption Policy
✓ Creating stable jobs
✓ Long-term profitable growth
TAKING SUSTAINABILITY TO THE NEXT LEVEL
56.967.0
78.5 83.0 91.9 97.8
WIZZ Ryanair Easyjet AF-KLM IAG LH
CO2 Emissions (g/RPK)
Note: CO2 emissions: Latest available public data: WIZZ- SEPTEMBER 2019; RY- September 2019, EZY FY18; KLM, IAG, LH CY2018
PAGE 13BOARD OVERSIGHT
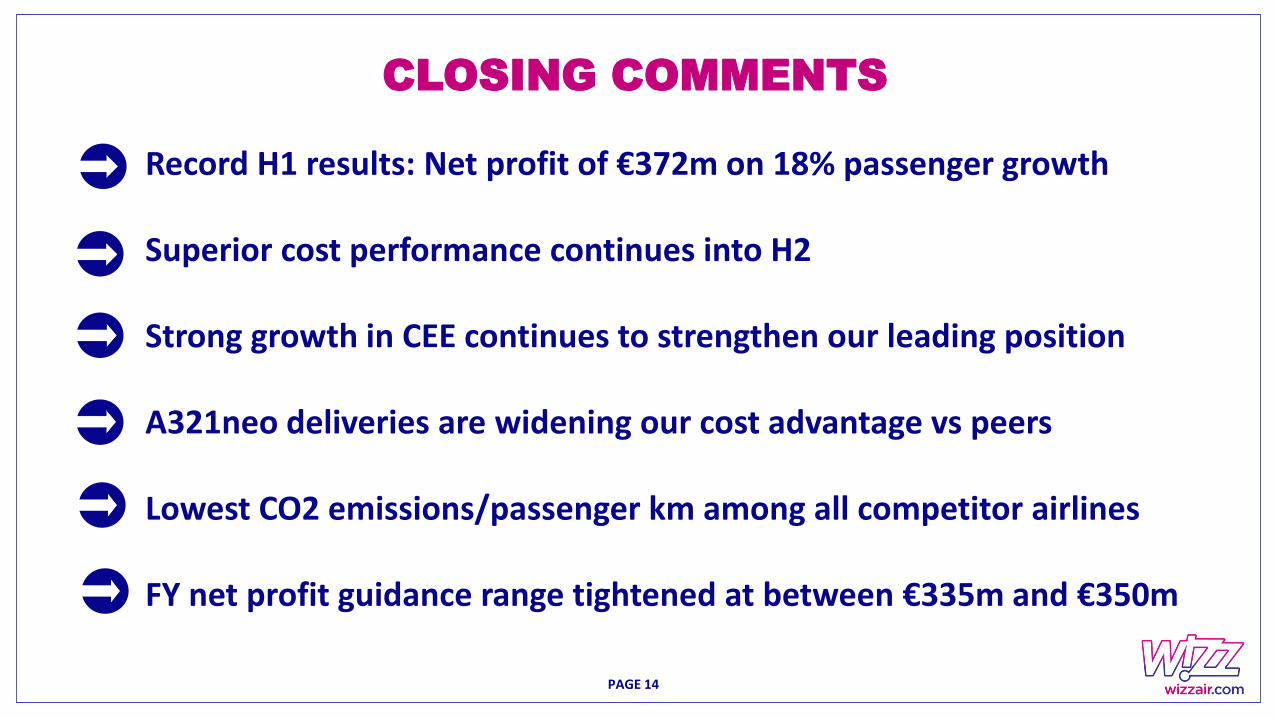
CLOSING COMMENTS
Record H1 results: Net profit of €372m on 18% passenger growth
Superior cost performance continues into H2
Strong growth in CEE continues to strengthen our leading position
A321neo deliveries are widening our cost advantage vs peers
Lowest CO2 emissions/passenger km among all competitor airlines
FY net profit guidance range tightened at between €335m and €350m
PAGE 14

This presentation has been prepared by Wizz Air Holdings Plc (the “Company”). By receiving this presentation and/or attending the meeting where this presentation is made, or by reading the presentation slides, youagree to be bound by the following limitations.
This presentation is intended to be delivered in the United Kingdom only. This presentation is directed only at (i) persons having professional experience in matters relating to investments who fall within the definition of"investment professionals" in Article 19(5) of the Financial Services and Markets Act 2000 (Financial Promotion) Order 2005 (as amended from time to time) (the “Order”); (ii) high net worth bodies corporate,unincorporated associations, partnerships and trustees of high value trusts as described in Article 49(2)(a)-(d) of the Order; or (iii) persons to whom it would otherwise be to distribute it. Persons within the UnitedKingdom who receive this communication (other than those falling within (i), (ii) and/or (iii) above) should not rely on or act upon the contents of this presentation. This presentation is not intended to be distributed orpassed on to any other class of persons.
This presentation does not constitute or form part of any offer to sell or issue, or invitation to purchase or subscribe for, or any solicitation of any offer to purchase or subscribe for, any securities of the Company or any ofits subsidiaries (together the “Group”) in any other entity, nor shall this document or any part of it, or the fact of its presentation, form the basis of, or be relied on in connection with, any contract or investment decision,nor does it constitute a recommendation regarding the securities of the Group. Past performance, including the price at which the Company’s securities have been bought or sold in the past and the past yield on theGroup’s securities, cannot be relied on as a guide to future performance. Nothing herein should be construed as financial, legal, tax, accounting, actuarial or other specialist advice and persons needing advice shouldconsult an independent financial adviser or independent legal counsel.
Neither this presentation nor any information contained in this presentation should be transmitted into, distributed in or otherwise made available in whole or in part by the recipients of the presentation to any otherperson inthe United States, Canada, Australia, Japan or any other jurisdiction which prohibits or restricts the same except in compliance with applicable securities laws. Recipients of this presentation are required to informthemselves of and comply with all restrictions or prohibitions in such jurisdictions and neither the Group nor any of its affiliates, members, directors, officers, advisors, agents, employees, or any other person accepts anyliability to any person acting on its behalf (its “Affiliates”) in relation to the distribution or possession of the presentation or any information contained in the presentation in or from any such jurisdiction.
The information contained in this presentation has not been independently verified. This presentation does not purport to be all-inclusive or to contain all the information that a prospective investor in securities of theGroup may desire or require in deciding whether or not to offer to purchase such securities.
No representation, warranty, or other assurance express or implied, is made or given by or on behalf of the Group or any of its Affiliates as to the accuracy, completeness or fairness of the information or opinionscontained in this presentation or any other material discussed verbally.
None of the Group or any of its Affiliates accepts any liability whatsoever for any loss howsoever arising from any use of this presentation or its contents or otherwise arising in connection therewith.
The information in this presentation includes forward-looking statements, made in good faith, which are based on the Group's or, as appropriate, the Group’s directors' current expectations and projections about futureevents. These forward-looking statements may be identified by the use of forward-looking terminology including, but not limited to, the terms "believes", "estimates", "plans", "projects", "anticipates", "expects", "intends","may", "will" or "should" or, in each case, their negative or other variations or comparable terminology, or by discussion of the Group’s strategy, plans, operations, financial performance and condition, objectives, goals,future events or intentions. These forward-looking statements, as well as those included in any other material discussed at any analyst presentation, are subject to risks, uncertainties and assumptions about the Groupand investments many of which are outside of the Group control, including, among other things, the development of its business, the trends in its operating industry, changing economic, financial, or other marketconditions and future capital expenditures. In light of these risks, uncertainties and assumptions, the events or circumstances referred to in the forward-looking statements may differ materially from those indicated inthese statements. Forward-looking statements may, and often do, materially differ from actual results. Thus, these forward-looking statements should be treated with caution and the recipients of the presentation shouldnot rely on any forward-looking statements.
None of the future projections, expectations, estimates or prospects or any other statements contained in this presentation should be taken as forecasts or promises nor should they be taken as implying any indication,assurance or guarantee that the assumptions on which such future projections, expectations, estimates or prospects have been prepared are correct or exhaustive or, in the case of the assumptions, fully stated in thepresentation. Forward-looking statements speak only as of the date of this presentation. Subject to obligations under the listing rules and disclosure guidance and transparency rules made by the Financial ConductAuthority under Part VI of the Financial Services and Markets Act 2000 (as amended from time to time), neither the Group nor any of its Affiliates, undertakes to publicly update or revise any such forward-lookingstatement, or any other statements contained in this presentation, whether as a result of new information, future events or otherwise.
As a result of these risks, uncertainties and assumptions, you should not place undue reliance on these forward-looking statements as a prediction of actual results or otherwise. The information and opinions contained inthis presentation and any other material discussed verbally are provided as at the date of this presentation and are subject to verification, completion and change without notice.
In giving this presentation neither the Group nor any of its Affiliates, undertakes any obligation to provide the recipient with access to any additional information or to update this presentation or any additional informationor to correct any inaccuracies in any such information which may become apparent.
WIZZ | DISCLAIMER
PAGE 15

Sensitivities (before hedges) for the remaining F20 period:• A one cent movement in the euro/US dollar exchange rate impacts the 2020 financial year operating expenses by €2.5 million.• A one penny movement in the euro/British pound exchange rate impacts the 2020 financial year operating expenses by €0.9 million.• A $10 (per metric ton) movement in the price of jet fuel impacts the 2020 financial year fuel costs by $4.8 million.
Source: As of 9 November 2016
Capped rate $1.19 $1.17 £0.91 $689 $655Floor rate $1.15 $1.13 £0.85 $629 $597
HEDGECOVERAGE
Source: Company Information
63%
35%
FY20 FY21
5 months 12 months
EUR/USD
APPENDIX: HEDGE PROGRAM
50%
F20
5 months
EUR/GBP
80%
52%
FY20 FY21
5 months 12 months
Jet Fuel