results for the 4th quarter of 2017 ccro3 ... -...
TRANSCRIPT

1
Results for the 4th quarter of 2017
São Paulo, February 22, 2018 – CCR S.A. (CCR), Brazil’s largest road concession
operator in terms of revenues, announces its results for the fourth quarter and full
year of 2017.
Presentation of Results
The Financial Statements were prepared and are being presented in accordance
with the accounting practices adopted in Brazil for the parent company and with
International Financial Reporting Standards (“IFRS”) issued by the International
Accounting Standards Board (“IASB”) for the consolidated statements. They are also
based on Brazilian Corporate Law, the rules defined by the Brazilian Securities and
Exchange Commission (“CVM”) and the pronouncements, instructions and
interpretations issued by the Accounting Pronouncements Committee (“CPC”),
applied consistently with the accounting practices described in Note 2 to the
Financial Statements.
Unless otherwise indicated, the financial and operating information is presented on a
consolidated basis, in thousands of reais, and the comparisons refer to the fourth
quarter (4Q16) and full year of 2016.
The proforma information includes the proportional data of the jointly-owned
subsidiaries. Said information has not been audited by the independent auditors.
4Q17 Highlights
Consolidated traffic grew by 4.4%.
Same-basis* adjusted EBITDA increased by 17.9%, with an adjusted margin of
61.3% (+2.9 p.p.). Adjusted EBITDA grew by 25.5%, with a margin of 61.3% (+2.9
p.p.).
Same-basis* net income totaled R$425.0 million, 162.7% up. Net income totaled
R$329.1 million, 94.2% up.
The Company’s Board of Executive Officers proposed the distribution of
additional dividends in the amount of approximately R$0.20 per share, to be approved
at the 2018 Annual Shareholders’ Meeting.
* The definitions of “same-basis” are described below the following table.
For Immediate Disclosure
B3: CCRO3
Bloomberg: CCRO3 BZ
www.ccr.com.br/ri Arthur Piotto Filho – CFO and Investor Relations Officer
[email protected] Phone: 55 (11) 3048-5932
Investor Relations Department
Marcus Macedo
[email protected] Phone: 55 (11) 3048-5941
Flávia Godoy
[email protected] Phone: 55 (11) 3048-5955 Daniel Kuratomi
[email protected] Phone: 55 (11) 3048-6353 Marcela Dias
[email protected] Phone: 55 (11) 3048-2108
CCR – CCR S.A., Publicly-held Company, headquartered at Av. Chedid Jafet, 222 Bloco B, 5º Andar Corporate Taxpayer’s ID (CNPJ): 02.846.056/0001-9 Company Registry (NIRE): 35.300.158.334

2
1 Net revenue excludes construction revenue. 2 Same-basis figures exclude:
I. in the quarter-on-quarter comparisons: (i) the non-recurring effect of SPVias adherence to PERT in 4Q17, of R$97.8 million on the financial result and R$139.7 million on net income; (ii) ViaQuatro, which became a subsidiary in 2Q17; (iii) ViaRio, in which CCR’s stake has increased from 33.33% to 66.66% since 2Q17, in profit and proforma comparisons, in addition to the items previously mentioned.
II. in the year-on-year comparisons: (i) the effects mentioned above; (ii) the non-recurring effect of the sale of STP in 3Q16, of R$1,307.7 million on EBITDA and R$863.1 million on net income; (iii) the non-recurring effect of the acquisition of stakes in ViaQuatro and ViaRio in 2Q17, of R$548.1 million on EBITDA and R$361.8 million on net income; and (iv) STP and VLT, in same-basis profit and proforma comparisons, in addition to the items previously mentioned.
3 Calculated by adding net revenue, construction revenue, cost of services and administrative expenses. 4 The adjusted EBIT and EBITDA margins were calculated by dividing EBIT and EBITDA by net revenue, excluding construction revenue, as required by IFRS. 5 Calculated excluding non-cash expenses: depreciation and amortization, provision for maintenance and the recognition of prepaid concession expenses. 6 LTM 4Q17 adjusted EBITDA includes non-recurring effects of the acquisition of stakes in ViaQuatro and ViaRio (R$548.1 million). Excluding these effects on EBITDA, the Net Debt/EBITDA ratio came to 2.6x (2.5x in proforma figures) in December 2017.
Subsequent Event
On January 19, through a consortium, CCR offered the highest concession fee for rendering public passenger transport
services in Lines 5 (Lilac) and 17 (Gold) of the São Paulo subway system and was considered the best bidder.
Financial Indicators (R$ MM) 4Q16 4Q17 Chg % 4Q16 4Q17 Chg %
Net Revenues1 1,690.7 2,021.1 19.5% 1,895.3 2,178.8 15.0%
Adjusted Net Revenues on the same basis2 1,690.7 1,900.7 12.4% 1,823.2 2,040.6 11.9%
Adjusted EBIT3 601.5 883.3 46.9% 690.6 950.6 37.6%
Adjusted EBIT Mg.4 35.6% 43.7% 8.1 p.p. 36.4% 43.6% 7.2 p.p.
EBIT on the same basis2 601.5 820.4 36.4% 659.5 882.5 33.8%
EBIT Mg. on the same basis2 35.6% 43.2% 7.6 p.p. 36.2% 43.2% 7.1 p.p.
Adjusted EBITDA5 988.0 1,239.6 25.5% 1,112.2 1,342.4 20.7%
Adjusted EBITDA Mg.4 58.4% 61.3% 2.9 p.p. 58.7% 61.6% 2.9 p.p.
Adjusted EBITDA on the same basis2 988.0 1,164.8 17.9% 1,073.3 1,257.3 17.1%
Adjusted EBITDA Mg. on the same basis2 58.4% 61.3% 2.9 p.p. 58.9% 61.6% 2.7 p.p.
Net Income 169.5 329.1 94.2% 169.5 329.1 94.2%
Net Income on the same basis2 161.8 425.0 162.7% 161.8 425.0 162.7%
Net Debt / Adjusted EBITDA LTM (x)6 2.5 2.3 - 2.4 2.3 -
Adjusted EBITDA / Performed investments (x) 0.5 0.8 - 0.6 0.7 -
Adjusted EBITDA / Interest and Monetary Variation (x) 2.7 5.2 - 2.9 5.1 -
IFRS Proforma
Financial Indicators (R$ MM) 2016 2017 Chg % 2016 2017 Chg %
Net Revenues1 6,704.4 7,537.7 12.4% 7,680.3 8,192.9 6.7%
Adjusted Net Revenues on the same basis2 6,704.4 7,174.7 7.0% 7,227.3 7,678.2 6.2%
Adjusted EBIT3 4,059.3 3,762.1 -7.3% 4,481.6 4,058.7 -9.4%
Adjusted EBIT Mg.4 60.5% 49.9% -10.6 p.p. 58.4% 49.5% -8.9 p.p.
EBIT on the same basis2 2,751.6 3,014.5 9.6% 2,986.8 3,249.5 8.8%
EBIT Mg. on the same basis2 41.0% 42.0% 1.0 p.p. 41.3% 42.3% 1.0 p.p.
Adjusted EBITDA5 5,371.4 5,169.0 -3.8% 5,953.4 5,603.6 -5.9%
Adjusted EBITDA Mg.4 80.1% 68.6% -11.5 p.p. 77.5% 68.4% -9.1 p.p.
Adjusted EBITDA on the same basis2 4,063.7 4,389.4 8.0% 4,421.8 4,741.3 7.2%
Adjusted EBITDA Mg. on the same basis2 60.6% 61.2% 0.6 p.p. 61.2% 61.7% 0.5 p.p.
Net Income 1,713.9 1,797.5 4.9% 1,713.9 1,797.5 4.9%
Net Income on the same basis2 722.6 1,460.6 102.1% 722.6 1,460.6 102.1%
Net Debt / Adjusted EBITDA LTM (x)6 2.5 2.3 - 2.4 2.3 -
Adjusted EBITDA / Performed investments (x) 1.4 1.8 - 1.4 1.7 -
Adjusted EBITDA / Interest and Monetary Variation (x) 3.3 4.7 - 3.5 4.7 -
IFRS Proforma

3
IFRS Gross Revenue (excluding construction revenue)
¹ Includes ancillary revenues. Part of Metrô Bahia’s 4Q16 and 4Q17 revenues does not come from tariffs and refers to the booking of financial assets. This non-
tariff revenue totaled R$18.8 million and R$84.8 million in the respective periods.
² ViaQuatro has been consolidated as of 2Q17.
Electronic payment toll revenues declined by 0.7 p.p. in 4Q17, to 67.3% of the total.
Toll Gross Revenue (R$ 000) 4Q16 4Q17 Chg % 2016 2017 Chg %
AutoBAn 521,989 557,058 6.7% 1,997,467 2,139,824 7.1%
NovaDutra 327,184 352,393 7.7% 1,210,658 1,297,371 7.2%
RodoNorte 162,472 181,726 11.9% 678,638 750,911 10.6%
ViaLagos 29,539 32,134 8.8% 109,339 120,374 10.1%
ViaOeste 253,762 267,587 5.4% 978,796 1,046,603 6.9%
RodoAnel Oeste 63,438 69,671 9.8% 246,181 264,516 7.4%
SPVias 151,571 167,050 10.2% 599,633 641,447 7.0%
MSVia 68,100 72,133 5.9% 291,888 269,313 -7.7%
Total 1,578,055 1,699,752 7.7% 6,112,600 6,530,359 6.8%
% of Total Revenues 85.5% 77.1% -8.4 p.p. 83.7% 79.4% -4.3 p.p.
Ancillary Gross Revenue1 4Q16 4Q17 Chg % 2016 2017 Chg %
Total Ancillary Gross Revenue 36,109 26,300 -27.2% 129,440 100,865 -22.1%
% of Total Revenues 2.0% 1.2% -0.8 p.p. 1.8% 1.2% -0.6 p.p.
Other Gross Revenues 4Q16 4Q17 Chg % 2016 2017 Chg %
Barcas1 31,779 31,329 -1.4% 155,411 130,637 -15.9%
Curaçao 33,401 33,306 -0.3% 151,287 119,217 -21.2%
Metro Bahia1 29,614 131,965 345.6% 240,959 378,410 57.0%
Samm 23,182 22,789 -1.7% 86,041 93,757 9.0%
BH Airport 53,864 72,683 34.9% 213,508 272,068 27.4%
TAS 59,100 61,439 4.0% 212,079 225,689 6.4%
ViaQuatro 1 2 - 124,091 n.m. - 370,395 100.0%
Total 230,940 477,602 106.8% 1,059,285 1,590,173 50.1%
% of Total Revenues 12.5% 21.7% 9.2 p.p. 14.5% 19.3% 4.8 p.p.
Total Operational Gross Revenue 1,845,104 2,203,654 19.4% 7,301,325 8,221,397 12.6%

4
The gross revenue of the jointly-owned subsidiaries recorded under the equity method is shown below, as additional
information.
1 - Proportional interest including ancillary revenue and excluding construction revenue. 2 - On August 31, 2016, the sale of the stake in STP was concluded. 3 - Part of VLT’s revenue does not come from tariffs and refers to the booking of returns on financial assets. This non-tariff revenue totaled R$5.9 million and R$6.5 million in 4Q16 and 4Q17, respectively. 4 - Toll collection in ViaRio began on August 28, 2016. With the acquisition of an additional stake in ViaRio in May 2017, the 4Q17 figure considers a stake of 66.66%, versus a stake of 33.33% in 4Q16. 5 - It does not include eliminations.
IFRS Construction Revenue
Gross Operating Revenue of Jointly
Controlled Companies1 4Q16 4Q17 Chg % 2016 2017 Chg %
Renovias 44,318 46,066 3.9% 169,542 179,876 6.1%
STP2 - - n.m. 185,699 - n.m.
Quito (Quiport) 62,327 63,130 1.3% 273,026 256,204 -6.2%
San José (Aeris) 18,660 27,179 45.7% 81,123 88,279 8.8%
VLT3 7,266 8,616 18.6% 27,787 31,224 12.4%
ViaRio4 6,777 19,503 187.8% 8,599 60,055 598.4%
Total5 139,348 164,494 18.0% 745,776 615,638 -17.5%
Construction Gross Revenue 4Q16 4Q17 Chg % 2016 2017 Chg %
Total 980,383 1,372,173 40.0% 3,291,624 3,023,289 -8.2%

5
Traffic
1 - Vehicle Equivalents is a measure calculated by adding heavy vehicles (commercial vehicles such as trucks and buses), multiplied by the number of axles charged, to light vehicles. One light vehicle is equivalent to one axle of a heavy vehicle. 2 - In CCR’s consolidated figures, the traffic volume of ViaOeste, which only collects one-way tolls, is doubled in order to adjust it to the concessionaires that adopt bidirectional collections. This procedure is based on the fact that the one-way tariffs already include the return trip costs. 3 - The average tariff is calculated by dividing toll revenue by the total number of vehicle equivalents of each concessionaire and the consolidated figure. 4 - The number of vehicle equivalents refers to the 40% stake in Renovias and 33.33% stake in ViaRio until April 2017 and 66.66% as of May 2017.
Concessionaires Performance 4Q16 4Q17 Chg % 2016 2017 Chg %
Traffic - Equivalent Vehicles1
AutoBAn 65,508,637 68,750,545 4.9% 262,623,153 266,709,734 1.6%
NovaDutra 33,119,393 34,297,270 3.6% 128,491,170 129,400,670 0.7%
RodoNorte 20,024,790 21,594,253 7.8% 85,072,361 90,277,596 6.1%
ViaLagos 1,965,457 2,051,797 4.4% 7,669,158 8,015,810 4.5%
ViaOeste 29,994,225 30,742,910 2.5% 120,455,743 121,734,117 1.1%
RodoAnel Oeste 33,549,719 34,918,651 4.1% 133,928,448 136,012,551 1.6%
SPVias 15,422,158 16,480,506 6.9% 63,473,597 64,288,532 1.3%
MSVia 10,511,999 11,021,883 4.9% 47,164,660 42,913,440 -9.0%
Consolidated2 240,090,603 250,600,725 4.4% 969,334,033 981,086,567 1.2%
Average Toll Paid (in R$ / Equivalent Vehicle)3
AutoBAn 7.97 8.10 1.6% 7.61 8.02 5.4%
NovaDutra 9.88 10.27 3.9% 9.42 10.03 6.5%
RodoNorte 8.11 8.42 3.8% 7.98 8.32 4.3%
ViaLagos2 15.03 15.66 4.2% 14.26 15.02 5.3%
ViaOeste 8.46 8.70 2.8% 8.13 8.60 5.8%
RodoAnel Oeste 1.89 2.00 5.8% 1.84 1.94 5.4%
SPVias 9.83 10.14 3.2% 9.45 9.98 5.6%
MSVia 6.48 6.54 0.9% 6.19 6.28 1.5%
Consolidated2 6.57 6.78 3.2% 6.31 6.66 5.5%
Additional information - Renovias and ViaRio4 4Q16 4Q17 Chg % 2016 2017 Chg %
Traffic - Equivalent Vehicles1
Renovias 5,666,422 5,798,443 2.3% 22,401,707 22,567,420 0.7%
ViaRio 1,139,664 2,767,458 n.m. 1,448,282 8,544,268 n.m.
Average Toll Paid (in R$ / Equivalent Vehicle)3
Renovias 7.40 7.54 1.9% 7.12 7.48 5.1%
ViaRio 5.95 7.04 18.3% 5.94 7.03 18.4%
6
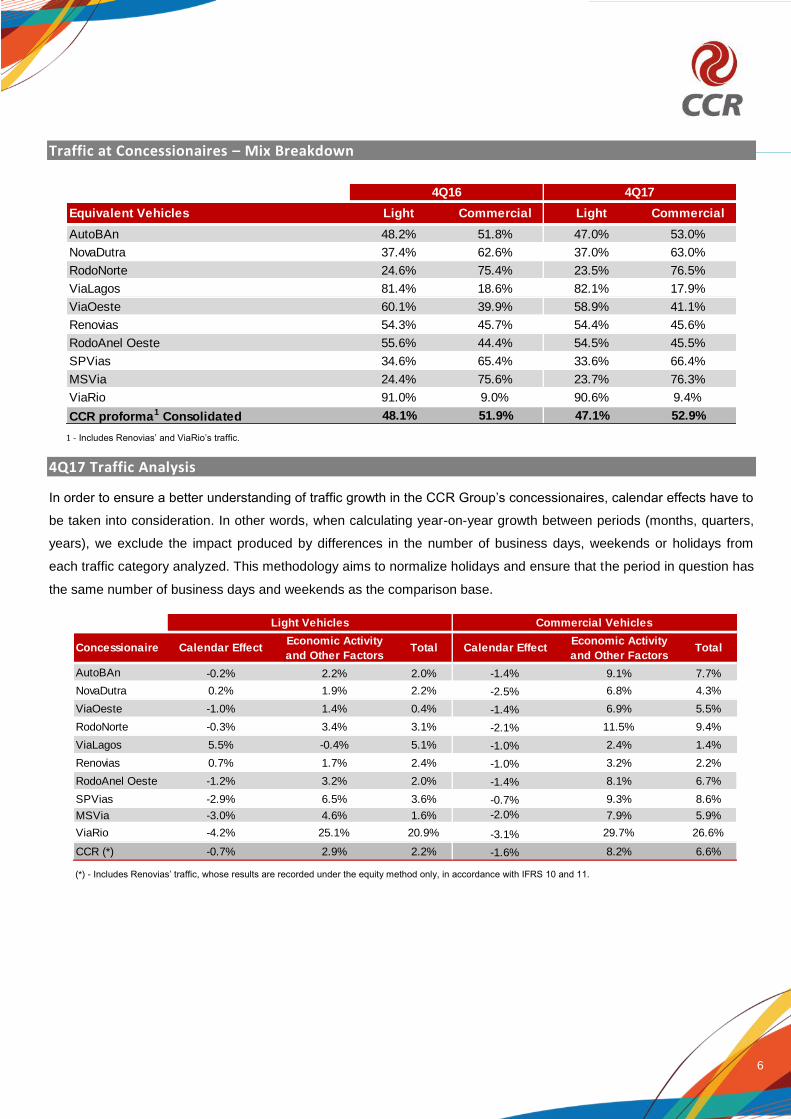
Traffic at Concessionaires – Mix Breakdown
1 - Includes Renovias’ and ViaRio’s traffic.
4Q17 Traffic Analysis
In order to ensure a better understanding of traffic growth in the CCR Group’s concessionaires, calendar effects have to
be taken into consideration. In other words, when calculating year-on-year growth between periods (months, quarters,
years), we exclude the impact produced by differences in the number of business days, weekends or holidays from
each traffic category analyzed. This methodology aims to normalize holidays and ensure that the period in question has
the same number of business days and weekends as the comparison base.
(*) - Includes Renovias’ traffic, whose results are recorded under the equity method only, in accordance with IFRS 10 and 11.
Equivalent Vehicles Light Commercial Light Commercial
AutoBAn 48.2% 51.8% 47.0% 53.0%
NovaDutra 37.4% 62.6% 37.0% 63.0%
RodoNorte 24.6% 75.4% 23.5% 76.5%
ViaLagos 81.4% 18.6% 82.1% 17.9%
ViaOeste 60.1% 39.9% 58.9% 41.1%
Renovias 54.3% 45.7% 54.4% 45.6%
RodoAnel Oeste 55.6% 44.4% 54.5% 45.5%
SPVias 34.6% 65.4% 33.6% 66.4%
MSVia 24.4% 75.6% 23.7% 76.3%
ViaRio 91.0% 9.0% 90.6% 9.4%
CCR proforma1 Consolidated 48.1% 51.9% 47.1% 52.9%
4Q16 4Q17
Concessionaire Calendar EffectEconomic Activity
and Other FactorsTotal Calendar Effect
Economic Activity
and Other FactorsTotal
AutoBAn -0.2% 2.2% 2.0% -1.4% 9.1% 7.7%
NovaDutra 0.2% 1.9% 2.2% -2.5% 6.8% 4.3%
ViaOeste -1.0% 1.4% 0.4% -1.4% 6.9% 5.5%
RodoNorte -0.3% 3.4% 3.1% -2.1% 11.5% 9.4%
ViaLagos 5.5% -0.4% 5.1% -1.0% 2.4% 1.4%
Renovias 0.7% 1.7% 2.4% -1.0% 3.2% 2.2%
RodoAnel Oeste -1.2% 3.2% 2.0% -1.4% 8.1% 6.7%
SPVias -2.9% 6.5% 3.6% -0.7% 9.3% 8.6%
MSVia -3.0% 4.6% 1.6% -2.0% 7.9% 5.9%
ViaRio -4.2% 25.1% 20.9% -3.1% 29.7% 26.6%
CCR (*) -0.7% 2.9% 2.2% -1.6% 8.2% 6.6%
Commercial VehiclesLight Vehicles

7
Urban Mobility
ViaQuatro
Metrô Bahia
The commercial operation of Line 1 began on January 2, 2016 with seven stations. On February 11, 2016, the entire
Line 1 became operational with the opening of the Pirajá station.
On December 5, 2016, the Company began operating the first stretch of Line 2, which includes the Acesso Norte 2,
Detran and Rodoviária stations. On May 23, 2017, we opened another four stations in Line 2: Pernambués, Imbuí, CAB
and Pituaçu.
On September 11, 2017, four new stations began operating: Flamboyant, Tamburugy, Bairro da Paz and Mussurunga,
totaling nineteen operational stations, of which eight in Line 1 and eleven in Line 2, totaling 26.5 kilometers. The
Aeroporto station is currently under construction and represents the last stage before the project is fully operational.
Integrated Passengers 45,178,272 44,548,200 45,230,779 45,741,349 45,074,442 -0.2%
Exclusive Passengers 4,535,510 4,468,565 4,788,773 4,842,829 4,701,661 3.7%
Total 49,713,782 49,016,765 50,019,552 50,584,178 49,776,103 0.1%
Weekday 674,428 658,234 702,124 697,816 713,727 5.8%
Saturday 360,696 369,644 356,602 345,422 376,543 4.4%
Sunday 217,068 195,004 143,581 105,480 147,661 -32.0%
Daily Highest 740,668 748,842 762,669 760,108 771,664 4.2%
Average daily demand
Transported passengers 4Q16
4Q16
2Q17
2Q17
Chg %
(4Q17 X 4Q16)
Chg %
(4Q17 X 4Q16)
3Q17
3Q17
1Q17
1Q17
4Q17
4Q17
Total 4,251,097 5,443,781 7,041,816 10,744,924 18,250,456 329.3%
Weekday 54,158 71,087 92,009 138,430 229,809 324.3%
Saturday 38,919 47,869 56,083 87,200 161,774 315.7%
Sunday 14,304 19,132 25,551 40,475 86,417 504.1%
Average daily demand
Transported passengers 4Q16 2Q17 3Q171Q17
2Q17
Chg %
(4Q17 X 4Q16)
4Q16 1Q17Chg %
(4Q17 X 4Q16)3Q17
4Q17
4Q17

8
Barcas
Operating Data:
The changes were mainly due to the following factors:
The economic crisis in the state of Rio de Janeiro and the consequent increase in the unemployment rate;
Intervention in access roads to downtown Rio de Janeiro, which made it difficult to integrate waterway transport and roads in the Praça XV region; and
The opening of the Charitas x Cafubá Tunnel, which reduced travel time from Niterói to the station and slightly increased demand in the Rio-Charitas Line.
VLT Carioca
On August 2, 2016, VLT Carioca began operating, with 34 stations and stops currently in operation, out of a total of 42.
Route Miles/Trip Fare 4Q16 4Q17 Chg %
Rio - Niterói 2.7 R$ 5.90 4,267,133 3,852,745 -9.7%
Rio - Charitas 4.4 R$ 16.50 358,009 364,579 1.8%
Rio - Paquetá 10.7 R$ 5.90 316,281 336,229 6.3%
Rio - Cocotá 7.4 R$ 5.90 168,518 126,520 -24.9%
Angra - Ilha Grande - Mangaratiba 26.0 R$ 16.60 46,318 45,625 -1.5%
Total 5,156,259 4,725,698 -8.4%
Lines Number of Passengers
Total 2,009,038 2,390,469 2,505,551 3,039,690 3,541,323 76.3%
Weekday 25,172 33,967 35,024 40,471 50,297 99.8%
Saturday 15,059 16,591 16,649 17,974 19,682 30.7%
Sunday 12,423 12,864 11,828 12,361 11,945 -3.8%
4Q17
4Q17
3Q17
3Q17
2Q17
2Q17
1Q17
1Q17
Chg %
(4Q17 X 4Q16)
Chg %
(4Q17 X 4Q16)
Transported passengers
Average daily demand
4Q16
4Q16

9
70%
30%
Curaçao International Airport
Airport Revenue Commercial Revenue
Airports
International Airports 4Q17 average tariffs
1 - The tariff for the use of international infrastructure is the same as the tariff for cargo and others at Quito International Airport. 2 - Tariffs for San José International Airport do not exclude the 35.2% government stake. Revenues shown in the revenue chart of jointly-owned subsidiaries are net of this stake. This airport does not include revenue from domestic passenger boarding fees. 3 - Air Traffic Movement. 4 - The method to calculate the average tariff was changed in order to allow comparison with 4Q17.
Revenue Mix
4Q16 4Q17 4Q16 4Q17 4Q16 4Q17
Boarding/PAX 47.2 48.2 13.0 13.4 - -
Use of infraestructure/ton 20.1 21.6 3.7 3.8 19.3 18.8
Boarding bridges/ATM3 286.1 271.9 471.3 440.5 - -
Quito International Airport¹
Average rates in US$International Domestic Carga
4Q164 4Q17 4Q16 4Q17 4Q16 4Q17
Boarding/PAX 23.9 23.8 34.1 39.4 13.6 12.8
Use of infraestructure/ton 5.4 5.9 6.1 6.4 6.1 6.4
Boarding bridges/ATM3 37.1 35.3 539.3 434.7 478.2 471.8
Curaçao International AirportSan José International Airport²
International International DomesticAverage rates in US$
74%
26%
Quito International Airport
71%
29%
San José International Airport
70%
30%
Curaçao International Airport
Airport Revenue Commercial Revenue

10
Operational data (100% of the concessionaires)
1 - International and domestic ATMs generate revenue at Quito Airport. In the case of San José and Curaçao airports, none of the ATMs generates revenue. 2 - Air Traffic Movement. 3 - Maximum Takeoff Weight.
The changes in the operational data presented above were mainly influenced by the following factors:
1. Quito International Airport (50.0%)
Increase in international traffic, mainly due to the creation of new routes by TAME to New York and Lima.
Reduction in ATMs and MTOWs, impacted by the reduction in Aerorepublica, LATAM and Viva Colombia
flights.
2. San José International Airport (48.75%)
Increase in the number of passengers, due to the creation of new routes by several companies, mainly
Copa, Avianca and Air Canada.
3. Curaçao International Airport (79.80%)
The decline in the number of passengers and other indicators was a result of the reductions in routes and
flights by Insel.
Total Passengers
(Boarding '000)4Q16 4Q17 Chg % 4Q16 4Q17 Var % 4Q16 4Q17 Chg %
International 244 255 4.5% 524 569 8.6% 140 132 -5.7%
Domestic 358 328 -8.4% - - - 44 41 -6.8%
Total 602 583 -3.2% 524 569 8.6% 184 173 -6.0%
Total ATM 1
(Takeoffs) 2 4Q16 4Q17 Chg % 4Q16 4Q17 Chg % 4Q16 4Q17 Chg %
International 2,289 2,176 -4.9% 5,390 5,320 -1.3% 2,696 2,174 -19.4%
Domestic 3,771 3,524 -6.5% 2,968 2,567 -13.5% 2,391 2,586 8.2%
Cargo 644 719 11.6% 656 683 4.1% - - -
Military and Other 408 439 7.6% 697 1,592 n.m. - - -
Total 7,112 6,858 -3.6% 9,711 10,162 4.6% 5,087 4,760 -6.4%
Total MTOW
('000 per ton)3 4Q16 4Q17 Chg % 4Q16 4Q17 Chg % 4Q16 4Q17 Chg %
International 219 230 5.0% 393 410 4.3% 153 161 5.2%
Domestic 240 211 -12.1% 14 11 -21.4% 74 51 -31.1%
Cargo and Other 176 203 15.3% 87 85 -2.3% - - -
Total 635 643 1.3% 494 506 2.4% 227 212 -6.6%
Quito International Airport San José International Airport Curaçao International Airport

11
BH Airport Operating data (100% of the concessionaire)
¹ - Air Traffic Movement (does not generate revenue at BH Airport). ² - Maximum Takeoff Weight.
4Q17 Average Tariffs 4Q17 Revenue Mix*
* As of January 2017, ATAERO (35.9%) has been added to domestic and international boarded passenger tariffs. This increase does not affect the concessionaire’s results, given that this amount is deducted from taxes (PIS/COFINS/ISS) and the variable concession fee. Accordingly, the average tariff and revenue mix amounts were impacted by this entry.
The increase in the number of domestic passengers was a result of the gradual recovery of the Brazilian economy,
while the upturn in the number of international passengers was mainly due to the creation of a new daily route to
Buenos Aires and the launch of flights to Orlando.
Total Passengers
(Boarding '000)4Q16 4Q17 Chg %
Total ATM
(Landing in
units)1
4Q16 4Q17 Chg %
International 33 65 97.0% International 237 392 65.4%
Domestic 1,133 1,245 9.9% Domestic 11,733 11,926 1.6%
Total 1,166 1,310 12.3% Total 11,970 12,318 2.9%
Total MTOW
('000 per ton)2 4Q16 4Q17 Chg %Cargo
('000 per ton)4Q16 4Q17 Chg %
International 36 51 41.7% Importation 2 3 50.0%
Domestic 653 686 5.1% Exportation 1 1 0.0%
Total 689 737 7.0% Total 3 4 33.3%
Average rates in R$ International Domestic International Domestic
Boarding/PAX 36.3 17.9 51.6 24.6
ATM /MTOW 40.9 7.4 54.0 10.4
Average rates in R$ / ton
Cargo
4Q16 4Q17*
1,900.3 1,929.4
Import/ Export Import / Export
4Q16 4Q17*
70%
30%
BH Airport 4Q16
Airport Revenue Commercial Revenue

12
IFRS Total Costs
Total costs moved up by 21.3% in 4Q17 over 4Q16, to R$2,510.0 million. In the same comparison, same-basis cash
costs grew by 4.6%.
Total costs = cost of services + administrative expenses + other operating expenses and revenues.
Same-basis cash costs exclude: (i) non-cash costs: depreciation and amortization, prepaid expenses, construction costs and provision for maintenance; and (ii)
ViaQuatro, which has been consolidated into the results as of April 2017.
The main reasons for the year-on-year variations in 4Q17 are detailed below:
Depreciation and Amortization: Increase of 23.8% (R$60.9 million). ViaQuatro accounted for R$12.0 million in 4Q17.
On the same comparison basis, the 19.1% variation was mainly influenced by the conclusion of construction works in
RodoNorte, ViaOeste, Metrô Bahia, NovaDutra and MSVia.
Third-party Services: Increase of 10.6% (R$23.2 million). ViaQuatro accounted for an expense of R$9.0 million in
4Q17. On the same comparison basis, the 6.4% increase was mainly due to: (i) costs with consulting services at BH
Airport; (ii) higher services related to management of construction works and direct construction at SPVias; and (iii)
services related to the analysis of new business opportunities at CPC.
Direct costs (non-recurring or emergency expenses to repair concession infrastructure) amounted to R$13.5 million in
4Q17, versus R$8.9 million in 4Q16.
Concession Fees and Prepaid Expenses: Increase of 3.5% (R$3.2 million). The increase in Curaçao’s concession
fees was due to the adjustment to the provisioned concession amount in December 2016, given the reduced number of
passengers in 2016.
Personnel Costs: Increase of 18.2% (R$45.0 million). ViaQuatro accounted for R$23.8 million in 4Q17. On the same
comparison basis, the 8.6% increase was due to: (i) the collective bargaining agreement in April 2017; (ii) the payment
of variable compensation at CCR; and (iii) the hiring of new employees by TAS as a result of increased demand.
Construction Costs: Increase of 40.0% (R$391.8 million). ViaQuatro accounted for R$9.3 million in 4Q17. On the
same comparison basis, the 39.0% upturn was mainly influenced by Metrô Bahia’s and RodoNorte’s construction
schedule. On the other hand, construction costs fell at BH Airport, due to construction works in Terminal 2 in 4Q16, and
MSVia.
Provision for Maintenance: The amounts were provisioned in accordance with the frequency of maintenance works,
cost estimates and the corresponding calculation of present value. In 4Q17, the decline of 83.0%, or R$91.1 million,
Costs (R$ MM) 4Q16 4Q17 Chg % 2016 2017 Chg %
Total Costs (2,069.6) (2,510.0) 21.3% (5,936.7) (6,798.8) 14.5%
Depreciation and Amortization (256.3) (317.2) 23.8% (959.4) (1,155.3) 20.4%
Third-Party Services (219.5) (242.7) 10.6% (898.7) (903.0) 0.5%
Concession Fee Costs and Anticipated Expenses (90.8) (94.0) 3.5% (368.1) (370.5) 0.7%
Personnel Costs (247.3) (292.3) 18.2% (941.9) (1,120.5) 19.0%
Construction Costs (980.4) (1,372.2) 40.0% (3,291.6) (3,023.3) -8.2%
Maintenance Provision (109.8) (18.7) -83.0% (270.7) (169.7) -37.3%
Other Costs (165.5) (172.9) 4.5% 793.7 (56.5) n.m.

13
was mainly due to variations at SPVias, ViaOeste and RodoNorte, as a result of lower provision costs compared to the
previous estimate and considering the expected future schedule.
Other Costs: The “Other Costs” line (materials, insurance, rent, marketing, trips, electronic means of payment, fuel and
other general expenses) grew by 4.5% (R$7.4 million). ViaQuatro accounted for R$12.7 million in 4Q17. On the same
comparison basis, the 3.2% decline was mainly due to: (i) a higher number of projects with tax incentives at the CCR
holding company in 4Q16; and (ii) the write-off of provisions for civil lawsuits at NovaDutra. These effects were partially
offset by an increase in Metrô Bahia’s other costs, mainly due to increased energy consumption as a result of the
opening of new stations.
IFRS EBITDA
(a) Calculation in accordance with CVM Instruction 527/2012, which consists of net income adjusted for the net financial result, income and social contribution tax expenses and depreciation and amortization costs and expenses.
(b) Refers to the recognition of prepayments related to the concession, which is adjusted, given that it constitutes a non-cash item in the financial statements.
(c) The provision for maintenance is adjusted, given that it refers to estimated future expenditures from periodic maintenance in CCR’s investees and constitutes a non-cash item in the financial statements. (d) The adjusted EBITDA margin was calculated by excluding construction revenue, in accordance with IFRS requirements, with a counter-entry impacting total costs. (e) Same-basis annual comparisons exclude: (i) the non-recurring effects of the sale of STP, of R$1,307.7 million in 3Q16, and the acquisition of stakes in ViaQuatro and ViaRio, of R$548.1 million in 2Q17; and (ii) ViaQuatro, which has been consolidated as of 2Q17.
Net Income 169.5 329.1 94.2% 1,713.9 1,797.5 4.9%
(+) Income Tax and Social Contribution 72.0 233.6 224.4% 829.5 928.4 11.9%
(+) Net Financial Results 410.6 364.6 -11.2% 1,835.5 1,185.7 -35.4%
(+) Depreciation and Amortization 256.3 317.2 23.8% 959.4 1,155.3 20.4%
EBITDA (a) 908.4 1,244.5 37.0% 5,338.3 5,066.9 -5.1%
EBITDA Mg. (a) 34.0% 36.7% 2.7 p.p. 53.4% 48.0% -5.4 p.p.
(+) Anticipated expenses (b) 20.5 20.5 n.m. 81.9 81.9 n.m.
(+) Maintenance provision (c) 109.8 18.7 -83.0% 270.7 169.7 -37.3%
(-) Equity Income (36.5) (35.8) -1.9% (243.1) (135.0) -44.5%
(+) Minority Interest (14.2) (8.2) -42.3% (76.4) (14.5) -81.0%
Adjusted EBITDA 988.0 1,239.6 25.5% 5,371.4 5,169.0 -3.8%
Adjusted EBITDA Mg. (d) 58.4% 61.3% 2.9 p.p. 80.1% 68.6% -11.5 p.p.
Adjusted EBITDA on the same basis (e) 988.0 1,164.8 17.9% 4,063.7 4,389.4 8.0%
Adjusted EBITDA Mg. on the same basis (e) 58.4% 61.3% 2.9 p.p. 60.6% 61.2% 0.6 p.p.
2017 Chg %EBITDA Reconciliation (R$ MM) 4Q16 4Q17 Chg % 2016

14
IFRS Net Financial Result
Others: Commissions, fees, taxes, fines and interest on taxes
ViaOeste and AutoBAn have foreign-currency-denominated loans hedged by a currency swap agreement, through
which they are long in the 3-month Libor plus spread and the exchange variation and short in a percentage of the CDI
interbank deposit rate. CCR has a foreign-currency-denominated loan hedged by a currency swap agreement, through
which it is long at a fixed rate plus the exchange variation and short in a percentage of the CDI interbank deposit rate.
Metrô Bahia has Non-Deliverable Forwards (NDFs) to hedge against the impact of the exchange variation applied to the
supply of rolling stock. AutoBAn has swap agreements in which it is long in the IPC-A + 4.88% p.a. and IPC-A + 5.428%
p.a. and short in a percentage of the CDI rate. AutoBAn has two swap agreements in which it is long at 6.768% and
6.765% of the CDI rate and short at fixed rates. ViaOeste has swap agreements in which it is long in the IPC-A + 5.67%
p.a. and short in a percentage of the CDI rate. NovaDutra has swap agreements in which it is long in the IPC-A +
6.4035% p.a. and short in a percentage of the CDI rate. SPVias has swap agreements in which it is long in the IPC-A +
6.38% p.a. and short in a percentage of the CDI rate.
The main reasons for the variations reported in 4Q17 are detailed below:
The results with the hedge operations line reflect the gains with swaps realized in CCR, AutoBAn, NovaDutra and
ViaOeste.
The monetary variation on loans, financing and debentures grew by 102.9%, mainly due to: (i) the increase in the IPC-
A, from 0.7% in 4Q16 to 1.1% in 4Q17; and (ii) AutoBAn’s 8th debenture issue in July 2017, in the amount of R$716.5
million.
The impact of the foreign exchange variation on gross debt, derivatives and suppliers was a 191.5% increase in
expenses, mainly due to: (i) ViaQuatro’s negative contribution of R$22.6 million; (ii) the issue of R$375.2 million in CCR
(Law 4131), concluded in April 2017; and (iii) the impact of the foreign exchange variation on ViaOeste’s and AutoBAn’s
debt (Law 4131).
Net Financial Result (R$ MM) 4Q16 4Q17 Chg % 2016 2017 Chg %
Net Financial Result (410.6) (364.5) -11.2% (1,835.5) (1,185.8) -35.4%
- Income from Hedge Operation (50.6) 33.3 n.m. (376.9) (54.3) -85.6%
- Monetary Variation on Loans, Financing and Debentures (20.8) (42.2) 102.9% (204.4) (131.9) -35.5%
- Exchange Rate Variation on Loans, Financing, Debentures, Derivatives and Suppliers (16.4) (47.8) 191.5% 259.7 13.5 -94.8%
- Monetary Variation on Liabilities related to the Granting Power (11.5) (19.4) 68.7% (144.7) (62.1) -57.1%
- Present Value Adjustment of Maintenance Provision and Liabilities related to the
Granting Power(27.3) (28.1) 2.9% (104.7) (112.4) 7.4%
- Interest on Loans, Financing and Debentures (339.4) (194.9) -42.6% (1,397.0) (950.4) -32.0%
- Investment Income and Other Income 71.4 76.5 7.1% 333.5 428.8 28.6%
- Fair Value of Loans and Debentures (5.7) 8.1 n.m. (101.8) (80.0) -21.4%
- Others (10.4) (150.0) 1,342.3% (99.2) (237.0) 138.9%
Average CDI 13.8% 7.5% 14.1% 10.1%
IGP-M 0.7% 1.6% 7.2% -0.5%
IPCA 0.7% 1.1% 6.3% 3.0%
Average TJLP 7.5% 7.0% 7.5% 7.1%
Average Exchange (R$ - US$) 3.3 3.2 3.5 3.2
2017 2017Key indicators 4Q16 4Q17

15
The “Monetary variation on obligations with the Granting Authority” line includes the monetary variation (IPC-A) on the
BH Airport concession, totaling R$19.4 million in 4Q17, versus R$11.5 million in 4Q16. As previously mentioned, the
IPC-A increased, partially offset by the decline in the balance, due to the payment of R$74.1 million through a judicial
deposit on May 12.
Adjustments to present value of the provision for maintenance and obligations with the Granting Authority moved up by
2.9%, chiefly due to the updating of the amount in the balance sheet.
In 4Q17, the “Interest on loans, financing and debentures” line dropped by 42.6%, mainly due to the impact of the lower
average CDI from 13.8% in 4Q16 to 7.5% in 4Q17.
The “Interest on financial investments and other revenues” line increased by 7.1% in 4Q17, mainly due to the 71%
increase in cash flow and financial investments between the periods.
The “Fair value of hedge operations” line reflects gains and losses from mark-to-market of debt, mainly at AutoBAn and
NovaDutra.
The “Other financial revenues and expenses” line recorded an increase of R$139.6 million in expenses in 4Q17, mainly
due to SPVias adherence to the Special Tax Regularization Program (“PERT”), pursuant to Executive Decree
783/2017, which resulted in the recognition of expenses totaling R$97.8 million under the financial result (cash effect of
R$23.6 million), with an impact of -R$139.7 million on the net result for the year. See note 26 to the Financial
Statements for additional information.
Net Income
Consolidated net income totaled R$329.1 million in 4Q17, 94.2% up. Same-basis¹ net income amounted to R$425.0
million, 162.7% up.
¹ Same-basis figures exclude: (i) ViaRio, in which CCR’s stake has increased from 33.33% to 66.66% since 2Q17; (ii) the non-recurring effect of SPVias adherence to
PERT, as previously mentioned in the Financial Result section; and (iii) ViaQuatro, in which CCR’s stake has increased from 60% to 75% since 2Q17.

16
Indebtedness
Consolidated net debt (IFRS) stood at R$11.8 billion in December 2017, while the Net Debt/EBITDA ratio (last 12
months) came to 2.3x, as shown below:
* LTM adjusted EBITDA includes non-recurring effects of the acquisition of stakes in ViaQuatro and ViaRio, in the amount of R$548.1
million, since 2Q17. Between 3Q16 and 2Q17, this indicator was positively impacted by the non-recurring effect of the sale of STP, of
R$1,307.6 million.
Excluding non-recurring effects of the acquisition of stakes in ViaQuatro and ViaRio (R$548.2 million), the Net
Debt/EBITDA ratio came to 2.6x (2.5x in proforma figures) in December 2017.
In 4Q17, funding and rollover of the subsidiaries and jointly-owned subsidiaries were as follows:
9,562 9,82610,413 10,734
12,42312,971
13,94513,261
14,443
10,75911,961 11,801
12,703
10,93611,786
2.3 2.4 2.5 2.53.0 3.0 3.1
2.2 2.41.8 1.8
2.2 2.3 2.2 2.3
-5.5
-4.5
-3.5
-2.5
-1.5
-0.5
0.5
1.5
2.5
3.5
5,000
7,000
9,000
11,000
13,000
15,000
17,000
19,000
4Q14 1Q15 2Q15 3Q15 4Q15 1Q16 2Q16 3Q16 4Q16 1Q17 2Q17 3Q17 4Q17 3Q17 4Q17
Net Debt (R$ MM) Net Debt/EBITDA (x)
Concessionaire Date Amount (R$ MM) Debt Average Cost Maturity
AutoBAn Oct-17 690.0 Promissory Note 106.75% of CDI Oct-20
RodoNorte Oct-17 220.0 Debentures 106.50% of CDI Nov-20
RodoNorte Oct-17 170.0 Debentures IPCA + 4.4963% p.a. Nov-21
BH Airport Oct-17 23.4 BNDES TJLP + 2.40% p.a. Jan-18
VLT (100%) Oct-17 23.0 BNDES TJLP + 3.44% p.a. Nov-35
RodoAnel Oeste Nov-17 800.0 Debentures 120.00% of CDI Apr-24
Metrô Bahia Nov-17 13.0 BNDES TJLP + 3.18% p.a. Oct-42
CCR Dec-17 470.0 Debentures CDI + 0.60% p.a. Nov-20
CCR Dec-17 663.2 Debentures CDI + 0.95% p.a. Nov-22
CCR Dec-17 389.9 Debentures CDI + 1.50% p.a. Nov-24
CCR Dec-17 176.7 Debentures IPCA + 6.00% p.a. Nov-24
ViaOeste Dec-17 330.0 Debentures 106.25% of CDI Nov-20
Metrô Bahia Dec-17 22.5 BNDES TJLP + 3.18% p.a. Oct-42
Metrô Bahia Dec-17 409.6 BNDES TJLP + 4.00% p.a. Oct-42
Total 4,401.3
Concessionaire Date Amount (US$ MM) Debt Average Cost Maturity
CCR Espanha Oct-17 70.0 Credit Facility LIBOR 6M + 3.75% Oct-22
Total 70.0
Proforma data
IFRS10 and 11

17
Evolution of Indebtedness
1 - Gross debt excludes transaction costs incurred during the structuring of the respective financial instruments and measured at fair value, when applicable. 2 - On December 31, 2017, the adjustment of swaps receivable was mainly due to the period exchange variation, as well as the variation in the CDI rate.
Debt Breakdown¹
1 - Amounts do not exclude transaction costs and are not measured at fair value.
As additional information, on December 31, 2017, the proforma net exposure in dollars was US$37.3 million, which
refers to the debt and supply of ViaQuatro (75%) and Metrô Bahia. In the same period, proforma gross debt came to
R$18.0 billion.
Debt Amortization Schedule¹
¹ Amounts do not exclude transaction costs and are not measured at
fair value.
(R$ MM) Sep/17 Dec/17
Gross Debt1 14,737.6 16,905.2
% Real-Denominated 88% 91%
% Foreign Currency-Denominated 12% 9%
Short Term 3,331.9 3,514.8
% Real-Denominated 73% 83%
% Foreign Currency-Denominated 27% 17%
Long Term 11,405.7 13,390.4
% Real-Denominated 92% 93%
% Foreign Currency-Denominated 8% 7%
Cash, Equivalents and Financial Investments 3,638.1 4,835.0
Receivable/Payable Swap Settlements2 163.6 284.1
Net Debt 10,935.9 11,786.1
Debt Breakdown
(R$ MM) - Not Hedged
BNDES TJLP TJLP + (2.0% - 4,00% p.a.) 4,104.8 24.2%
Local Bond, Credit Deposit and others CDI (106.25% - 129.3%) of CDI, CDI + (0.60% - 3.95% p.a.) 7,410.1 43.7%
Local Bond IPCA IPCA + (4.4963% - 7.34% p.a.) 3,973.6 23.4%
Dolar USD LIBOR 3M + (2.05% - 2.60% p.a.) / LIBOR 6M + (2.2% p.a. – 3.75% p.a.) /4.00% - 4.20% p.a. 1,475.0 8.7%
Other Pre fixed 16.49% p.a. 3.4 0.0%
Total 16,966.9 100.0%
Index Average Cost p.a. %Dec/17
Debt Breakdown
(R$ MM) - Hedged
BNDES TJLP TJLP + (2.0% - 4.00% p.a.) 4,104.8 24.2%
Local Bond, Credit Deposit and others CDI (88.75% - 129.3%) of CDI, CDI + (0.60% - 3.95% p.a.) 9,651.5 56.9%
Local Bond IPCA IPCA + (4.4963% - 7.34% p.a.) 2,023.7 11.9%
Dolar USD LIBOR 3M + (2.05% - 2.60% p.a.) / LIBOR 6M + (2.2% p.a. – 3.75% p.a.)/ 4.20% p.a. 588.1 3.5%
Other Pre fixed 6.7665% - 16.49% p.a. 598.8 3.5%
Total 16,966.9 100.0%
%Dec/17Index Average Cost p.a.
Years R$ MM % Total
2018 3,463.3 20%
2019 3,133.4 19%
2020 3,129.0 18%
2021 1,498.8 9%
From 2022 5,742.5 34%
Total 16,966.9 100%
Debt Amortization Schedule
18
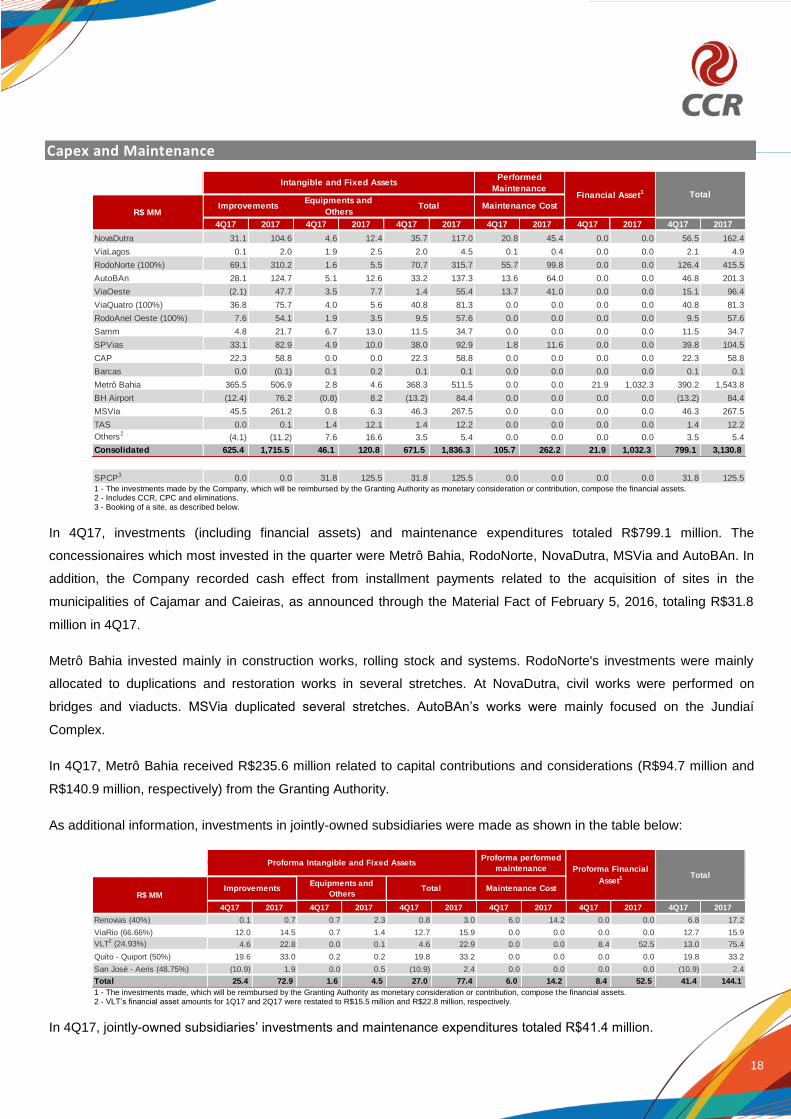
Capex and Maintenance
1 - The investments made by the Company, which will be reimbursed by the Granting Authority as monetary consideration or contribution, compose the financial assets. 2 - Includes CCR, CPC and eliminations. 3 - Booking of a site, as described below.
In 4Q17, investments (including financial assets) and maintenance expenditures totaled R$799.1 million. The
concessionaires which most invested in the quarter were Metrô Bahia, RodoNorte, NovaDutra, MSVia and AutoBAn. In
addition, the Company recorded cash effect from installment payments related to the acquisition of sites in the
municipalities of Cajamar and Caieiras, as announced through the Material Fact of February 5, 2016, totaling R$31.8
million in 4Q17.
Metrô Bahia invested mainly in construction works, rolling stock and systems. RodoNorte's investments were mainly
allocated to duplications and restoration works in several stretches. At NovaDutra, civil works were performed on
bridges and viaducts. MSVia duplicated several stretches. AutoBAn’s works were mainly focused on the Jundiaí
Complex.
In 4Q17, Metrô Bahia received R$235.6 million related to capital contributions and considerations (R$94.7 million and
R$140.9 million, respectively) from the Granting Authority.
As additional information, investments in jointly-owned subsidiaries were made as shown in the table below:
1 - The investments made, which will be reimbursed by the Granting Authority as monetary consideration or contribution, compose the financial assets. 2 - VLT’s financial asset amounts for 1Q17 and 2Q17 were restated to R$15.5 million and R$22.8 million, respectively.
In 4Q17, jointly-owned subsidiaries’ investments and maintenance expenditures totaled R$41.4 million.
4Q17
4Q17 2017 4Q17 2017 4Q17 2017 4Q17 2017 4Q17 2017 4Q17 2017
NovaDutra 31.1 104.6 4.6 12.4 35.7 117.0 20.8 45.4 0.0 0.0 56.5 162.4
ViaLagos 0.1 2.0 1.9 2.5 2.0 4.5 0.1 0.4 0.0 0.0 2.1 4.9
RodoNorte (100%) 69.1 310.2 1.6 5.5 70.7 315.7 55.7 99.8 0.0 0.0 126.4 415.5
AutoBAn 28.1 124.7 5.1 12.6 33.2 137.3 13.6 64.0 0.0 0.0 46.8 201.3
ViaOeste (2.1) 47.7 3.5 7.7 1.4 55.4 13.7 41.0 0.0 0.0 15.1 96.4
ViaQuatro (100%) 36.8 75.7 4.0 5.6 40.8 81.3 0.0 0.0 0.0 0.0 40.8 81.3
RodoAnel Oeste (100%) 7.6 54.1 1.9 3.5 9.5 57.6 0.0 0.0 0.0 0.0 9.5 57.6
Samm 4.8 21.7 6.7 13.0 11.5 34.7 0.0 0.0 0.0 0.0 11.5 34.7
SPVias 33.1 82.9 4.9 10.0 38.0 92.9 1.8 11.6 0.0 0.0 39.8 104.5
CAP 22.3 58.8 0.0 0.0 22.3 58.8 0.0 0.0 0.0 0.0 22.3 58.8
Barcas 0.0 (0.1) 0.1 0.2 0.1 0.1 0.0 0.0 0.0 0.0 0.1 0.1
Metrô Bahia 365.5 506.9 2.8 4.6 368.3 511.5 0.0 0.0 21.9 1,032.3 390.2 1,543.8
BH Airport (12.4) 76.2 (0.8) 8.2 (13.2) 84.4 0.0 0.0 0.0 0.0 (13.2) 84.4
MSVia 45.5 261.2 0.8 6.3 46.3 267.5 0.0 0.0 0.0 0.0 46.3 267.5
TAS 0.0 0.1 1.4 12.1 1.4 12.2 0.0 0.0 0.0 0.0 1.4 12.2
Others2(4.1) (11.2) 7.6 16.6 3.5 5.4 0.0 0.0 0.0 0.0 3.5 5.4
Consolidated 625.4 1,715.5 46.1 120.8 671.5 1,836.3 105.7 262.2 21.9 1,032.3 799.1 3,130.8
SPCP3 0.0 0.0 31.8 125.5 31.8 125.5 0.0 0.0 0.0 0.0 31.8 125.5
R$ MMImprovements
Equipments and
OthersTotal Maintenance Cost
Intangible and Fixed Assets Performed
Maintenance Financial Asset1 Total
4Q17
4Q17 2017 4Q17 2017 4Q17 2017 4Q17 2017 4Q17 2017 4Q17 2017
Renovias (40%) 0.1 0.7 0.7 2.3 0.8 3.0 6.0 14.2 0.0 0.0 6.8 17.2
ViaRio (66.66%) 12.0 14.5 0.7 1.4 12.7 15.9 0.0 0.0 0.0 0.0 12.7 15.9
VLT2 (24.93%) 4.6 22.8 0.0 0.1 4.6 22.9 0.0 0.0 8.4 52.5 13.0 75.4
Quito - Quiport (50%) 19.6 33.0 0.2 0.2 19.8 33.2 0.0 0.0 0.0 0.0 19.8 33.2
San José - Aeris (48.75%) (10.9) 1.9 0.0 0.5 (10.9) 2.4 0.0 0.0 0.0 0.0 (10.9) 2.4
Total 25.4 72.9 1.6 4.5 27.0 77.4 6.0 14.2 8.4 52.5 41.4 144.1
Proforma Intangible and Fixed Assets Proforma performed
maintenance Proforma Financial
Asset1
R$ MMImprovements
Equipments and
OthersTotal Maintenance Cost
Total

19
In the fourth quarter, the Company received a net amount of R$50.8 million related to investments and considerations
(R$38.5 million and R$12.3 million, respectively) from VLT.
The following table details estimated investment and maintenance totals for 2018. The figures include eventual service
contingent investments and cases being discussed for reestablishing the financial balance.
* Includes CCR, CPC, SPCP, Barcas and eliminations.
Estimated Maintenance
Metrô Bahia 595.6 248.9 346.7 0.0
RodoNorte (100%) 473.3 0.0 473.3 121.5
ViaQuatro (100%) 264.8 0.0 264.8 0.0
NovaDutra 171.7 0.0 171.7 85.5
MSVia 145.5 0.0 145.5 0.0
BH Airport (100%) 124.1 0.0 124.1 0.0
AutoBAn 111.6 0.0 111.6 8.9
Quito - Quiport (50%) 83.4 0.0 83.4 0.0
ViaOeste 52.1 0.0 52.1 34.1
SPVias 52.1 0.0 52.1 112.2
RodoAnel Oeste (100%) 48.7 0.0 48.7 0.0
VLT (24.93%) 48.5 41.5 7.0 0.0
SAMM 44.6 0.0 44.6 0.0
San José - Aeris (48.75%) 40.9 0.0 40.9 0.0
Curaçao - CAP (100%) 36.4 0.0 36.4 0.0
CCR Actua 22.5 0.0 22.5 0.0
ViaLagos 11.0 0.0 11.0 4.4
Renovias (40%) 7.3 0.0 7.3 5.4
ViaRio (66.66%) 6.9 0.0 6.9 0.0
TAS (100%) 4.4 0.0 4.4 0.0
Others* 65.8 0.0 65.8 (4.5)
Total 2,411.1 290.4 2,120.7 367.6
Maintenance Costs
Estimated investments
2018 (E) - R$ MM TotalContributions of
Granting PowersNet Total

20
In addition, the remaining investment balances (Note 24 to the Financial Statements) and the balances of jointly-owned
subsidiaries, including eventual service contingent investments and cases being discussed for reestablishing the financial
balance, are presented below.
(*) Refers to 100% of the jointly-owned concessionaire’s commitments. (1) Metrô Bahia’s balance of 2017 financial statements (R$ thousands): Refers to the investments envisaged in the concession agreement, which total R$5,245,184, excluding contributions, monetary consideration and investments already made, totaling R$2,283,089, R$1,634,190 and R$1,327,905, respectively. The amount of R$1,327,905 corresponds to 25.15% (approximate own investments in the business plan) of total investments of R$5,280,168. The amounts of total investments and monetary consideration are restated by the IPCA consumer price index. The reported contribution amount is equivalent to the amount in the concession agreement (base: April 2013 - without restatement), and the amount of the investments already made is stated at the cost effectively incurred. (2) These investments were fully made in the year; there was no remaining balance. These figures represent 100% of the concessionaire and refer to the best estimate of mandatory investments to be made by the Concessionaire, excluding investment triggers. The amounts are restated by the IPCA consumer price index up to the last updated tariff.
AutoBAn 72.7 358.7
Metrô Bahia1
0.0 384.1
NovaDutra 305.5 355.2
Renovias (*) 12.6 39.9
RodoAnel Oeste 488.6 488.6
RodoNorte 859.0 1,126.8
SPVias 244.5 330.0
ViaLagos 47.6 47.6
ViaOeste 326.0 865.7
ViaQuatro 327.2 327.2
MSVia 4,410.7 4,410.7
VLT (*) 48.2 48.2
ViaRio (*)2
- -
BH Airport 945.0 945.0
Total 8,087.5 9,727.7
R$ MM Balance of 2017 financial statement
Balance including possible
investments under discussion for
rebalancing and contingent
investments

21
About the CCR Group, CPC and CCR:
About the CCR Group: Founded in 1999, the CCR Group is one of Latin America’s largest infrastructure
concession groups. Divided into four core businesses, CCR Highways SP, CCR Highways BR, CCR Mobility and
CCR Airports, the Company has concessions in the main modes of transport in the country. The CCR Group was
one of the first companies to operate in the highway concession segment in Brazil and is currently one of the
world’s five largest companies in the segment, operating ten highway concessionaires across the country: CCR
NovaDutra, CCR ViaLagos, CCR RodoNorte, CCR AutoBAn, CCR ViaOeste, CCR RodoAnel, CCR SPVias,
Renovias, ViaRio and CCR MSVia, with 3,265 kilometers of concession in São Paulo, Rio de Janeiro, Mato Grosso
do Sul and Paraná. Its portfolio includes highways that have been considered the best and safest highways in the
country by specialized rankings for several years in a row, having managed to significantly reduce fatal accident
ratios. After being granted concessions to Line 5 (Lilac) of the São Paulo subway system and monorail Line 17
(Gold) in the beginning of 2018, the Group consolidated its operations in the passenger transport segment,
managing important companies that are responsible for improving traffic flow, safety and comfort in large urban
routes. These companies include: ViaQuatro, VLTCarioca, CCR Barcas and CCR Metrô Bahia, with operations in
the state capitals of São Paulo, Rio de Janeiro and Bahia, respectively. The CCR Group has international
operations in the airport concession sector through its interests in the Quito (Ecuador), San José (Costa Rica) and
Curaçao airports. In Brazil, it owns the BH Airport concessionaire, responsible for managing Belo Horizonte
International Airport, in Minas Gerais. In 2015, it acquired TAS (Total Airport Services), a U.S. company that
renders airport services. In addition to its commitment to the development of infrastructure projects in the country,
CCR is also dedicated to the sustainable development of its surrounding communities and 13,000 employees. As a
result, the Company became a signatory to the UN’s Global Compact in 2011 and, consequently, assumed the
commitments therein. The Company was also included in B3’s Corporate Sustainability Index (ISE) for the seventh
consecutive year and promotes social, cultural, environmental and sports projects in its surrounding communities
through the CCR Institute, bringing social development to thousands of people. With over 20 years of existence, it
is recognized in the domestic and international markets for its successful history and the constant adoption of the
highest standard of corporate governance as the basis for its operation and which are listed in the Company’s
Integrity and Compliance Program.
About CPC: Companhia de Participações em Concessões (CPC) is a CCR Group company, whose purpose is to
evaluate new business opportunities in the primary market, through bids, and the secondary market, through the
direct management of new businesses. CPC has retained a 40% interest in Renovias, a highway concessionaire in
São Paulo state, since 2008. In October 2010, it acquired 100% of CCR SPVias, a São Paulo state highway
concessionaire and, in 2012, 80% of CCR Barcas, the world’s fourth largest waterway transport operator. CPC also
holds 50% of Quiport, which operates Quito International Airport in Ecuador, 48.75% of Aeris Holding Costa Rica
S.A., which operates San José Airport (Juan Santamaría) in Costa Rica, and 79.8% of Curaçao Airport Partners
NV, the Curaçao airport concessionaire.
About CCR: CCR is the holding company of the CCR Group and was one of the first companies to join the Novo
Mercado listing segment of B3 (former BM&FBovespa), which contains only those publicly-held companies with the
highest levels of corporate governance. Its capital stock consists entirely of common shares with voting rights and it

22
has a free float of 55.23%. CCR is included in the IBOVESPA Index, as well as in the ISE (Corporate Sustainability
Index), ICO2 (Carbon Efficient Index), IGC (Special Corporate Governance Stock Index), IBrX-50 (Brazil Index 50),
IBrX-100 (Brazil Index 100) and the MSCI Latin America index. With over 20 years of existence, it is recognized in
the domestic and international markets for its successful history and the constant adoption of the highest standard
of corporate governance as the basis for its operation and which are listed in the Company’s Integrity and
Compliance Program.
Conference calls/Webcast
Access to the conference calls/webcasts:
Conference call in Portuguese:
Friday, February 23, 2018 11:00 a.m. São Paulo / 09:00 a.m. New York Participants calling from Brazil: (11) 3193-1001 or (11) 2820-4001 Access code: CCR Replay: (11) 3193-1012 or (11) 2820-4012 Code: 2211008#
Conference call in English:
Friday, February 23, 2018 12:00 p.m. São Paulo / 10:00 a.m. New York Participants calling from Brazil: (55 11) 3193-1001 or (55 11) 2820-4001 Participants calling from the United States: 1-800-492-3904 or (+1) 646 828-8246 Access code: CCR Replay: (11) 3193-1012 or (11) 2820-4012 Code: 6282781#
The instructions to participate in these events are available on CCR’s website: www.ccr.com.br/ir.

23
CONSOLIDATED INCOME STATEMENT
Brazilian Corporate Law (R$ '000)4Q16 4Q17 Chg % 2016 2017 Chg %
Gross Revenues 1,845,104 2,203,654 19,4% 7,301,325 8,221,397 12.6%
- Toll Revenues 1,578,055 1,699,752 7,7% 6,112,600 6,530,359 6.8%
- Other Revenues 267,049 503,902 88,7% 1,188,725 1,691,038 42.3%
Gross Revenues Deductions (154,415) (182,601) 18,3% (596,882) (683,689) 14.5%
Net Revenues 1,690,689 2,021,053 19,5% 6,704,443 7,537,708 12.4%
(+) Construction Revenues 980,383 1,372,173 40,0% 3,291,624 3,023,289 -8.2%
Cost of Services (1,885,232) (2,328,069) 23,5% (6,566,718) (6,621,416) 0.8%
- Depreciation and Amortization (239,019) (320,886) 34,3% (893,526) (1,104,805) 23.6%
- Third-party Services (182,724) (201,172) 10,1% (698,632) (749,919) 7.3%
- Concession Costs (70,314) (73,506) 4,5% (286,206) (288,646) 0.9%
- Personnel Costs (192,505) (212,724) 10,5% (691,066) (795,371) 15.1%
- Construction Costs (980,383) (1,372,173) 40,0% (3,291,624) (3,023,289) -8.2%
- Maintenance Provision (109,820) (18,660) -83,0% (270,715) (169,725) -37.3%
- Other (89,994) (108,476) 20,5% (353,024) (407,771) 15.5%
- Appropriation of Anticipated Expenses from the Concession (20,473) (20,472) 0,0% (81,925) (81,890) 0.0%
Gross Profit 785,840 1,065,157 35,5% 3,429,350 3,939,581 14.9%
Gross Margin 46.5% 52.7% 6,2 p.p. 51.2% 52.3% 1.1 p.p.
Administrative Expenses (184,384) (181,866) -1,4% 629,946 (177,526) n.m.
- Depreciation and Amortization (17,278) 3,683 n.m. (65,890) (50,514) -23.3%
- Third-party Services (36,788) (41,551) 12,9% (200,082) (153,095) -23.5%
- Personnel (54,781) (79,591) 45,3% (250,810) (325,158) 29.6%
- Other (75,537) (64,407) -14,7% 1,146,728 351,241 -69.4%
Adjusted EBIT 601,456 883,291 46,9% 4,059,296 3,762,055 -7.3%
Adjusted EBIT Margin (a) 35.6% 43.7% 8,1 p.p. 60.5% 49.9% -10.6 p.p.
+ Equity Income Result 36,524 35,755 -2,1% 243,148 134,973 -44.5%
- Minority Interest 14,153 8,244 -41,8% 76,404 14,548 -81.0%
EBIT (b) 652,133 927,291 42,2% 4,378,848 3,911,577 -10.7%
EBIT Margin 24.4% 27.3% 2,9 p.p. 43.8% 37.0% -6.8 p.p.
+ Depreciation and Amortization 256,297 317,203 23,8% 959,416 1,155,319 20.4%
EBITDA (b) 908,430 1,244,493 37,0% 5,338,264 5,066,895 -5.1%
EBITDA Margin 34.0% 36.7% 2,7 p.p. 53.4% 48.0% -5.4 p.p.
+ Maintenance Provision (c) 109,820 18,660 -83,0% 270,715 169,725 -37.3%
+ Appropriation of Anticipated Expenses (d) 20,473 20,472 0,0% 81,925 81,890 0.0%
- Equity Income Result (36,524) (35,755) -2,1% (243,148) (134,973) -44.5%
- Minority Interest (14,153) (8,244) -41,8% (76,404) (14,548) -81.0%
Adjusted EBITDA 988,046 1,239,626 25,5% 5,371,352 5,168,989 -3.8%
Adjusted EBITDA Margin (e) 58.4% 61.3% 2,9 p.p. 80.1% 68.6% -11.5 p.p.
Net Financial Result (410,628) (364,620) -11,2% (1,835,533) (1,185,725) -35.4%
Financial Expenses: (726,480) (637,364) -12,3% (3,217,345) (2,409,345) -25.1%
- Interest on Loans, Financing and Debentures and Loans Cost Capitalization (339,421) (194,889) -42,6% (1,397,011) (950,401) -32.0%
- Monetary variation on loans, financing and debentures (23,908) (42,237) 76,7% (207,470) (146,833) -29.2%
- Monetary variation on Liabilities related to the Granting Power (11,485) (19,446) 69,3% (144,712) (62,079) -57.1%
- Exchange Rate Variation (123,492) (67,067) -45,7% (261,816) (192,496) -26.5%
- Losses from Hedge Operations (172,884) (119,674) -30,8% (783,335) (500,191) -36.1%
- Present Value Adjustment of Maintenance Provision (27,282) (28,095) 3,0% (104,729) (112,361) 7.3%
- Fair Value of Hedge Operations (17,215) (8,321) -51,7% (217,846) (189,647) -12.9%
- Other Financial Expenses (10,381) (150,018) 1.345,1% (99,220) (237,020) 138.9%
- Exchange Rate Variation on foreing suppliers (412) (7,617) 1.748,8% (1,206) (18,317) 1.418.8%
Financial Income: 315,852 272,744 -13,6% 1,381,812 1,223,620 -11.4%
- Gains from Hedge Operations 122,308 152,980 25,1% 406,414 445,917 9.7%
- Exchange Rate Variation 107,289 26,042 -75,7% 521,515 213,267 -59.1%
- Monetary Variation 3,108 - -100,0% 3,108 14,975 381.8%
- Fair Value of Hedge Operations 11,512 16,382 42,3% 116,043 109,666 -5.5%
- Interest and Other Financial Income 71,384 76,473 7,1% 333,532 428,759 28.6%
- Exchange Rate Variation on foreing suppliers 251 867 245,4% 1,200 11,036 819.7%
Equity Income Result 36,524 35,755 -2,1% 243,148 134,973 -44.5%
Profit (Loss) Before Income and Social Contribution Taxes 227,352 554,427 143,9% 2,466,911 2,711,304 9.9%
Income and Social Contribution Taxes - Current (123,901) (218,529) 76,4% (988,150) (845,284) -14.5%
Income and Social Contribution Taxes - Deferred 51,866 (15,088) n.m. 158,686 (83,102) n.m.
Profit before Minority Interest 155,317 320,810 106,6% 1,637,447 1,782,918 8.9%
Minority Interest 14,153 8,244 -41,8% 76,404 14,548 -81.0%
Net Profit for the Period 169,470 329,054 94,2% 1,713,851 1,797,466 4.9%
Basic profit Per Share (In Reais - R$) 0.10 0.16 69,7% 0.97 0.89 -8.3%
Number of shares at the end of fiscal year (in units) 1,765,587,200 2,020,000,000 14,4% 1,765,587,200 2,020,000,000 14.4%
(a) Adjusted EBIT Margin was calculated by dividing EBIT by Net Revenues, excluding construction revenue, as this is an IFRS requirement, whose corresponding amount affects total
cost.
(b) Calculated in accordance with CVM instruction number 527/12.
(c) The Maintenance Provision refers to an estimate of future expenditures for regular maintenance in CCR subsidiaries and is adjusted as it relates to a non-cash-relevant item of the
financial statements.
the financial statements. (d) Refers to the result appropriation of prepayments related to the concession and is adjusted relates to a non-cash relevant item of the financial statements.
(e) Adjusted EBITDA Margin was calculated by dividing Adjusted EBITDA by Net Revenues, excluding construction revenue, as this is an IFRS requirement, whose corresponding
amount affects total cost.
amount affects total cost.
24
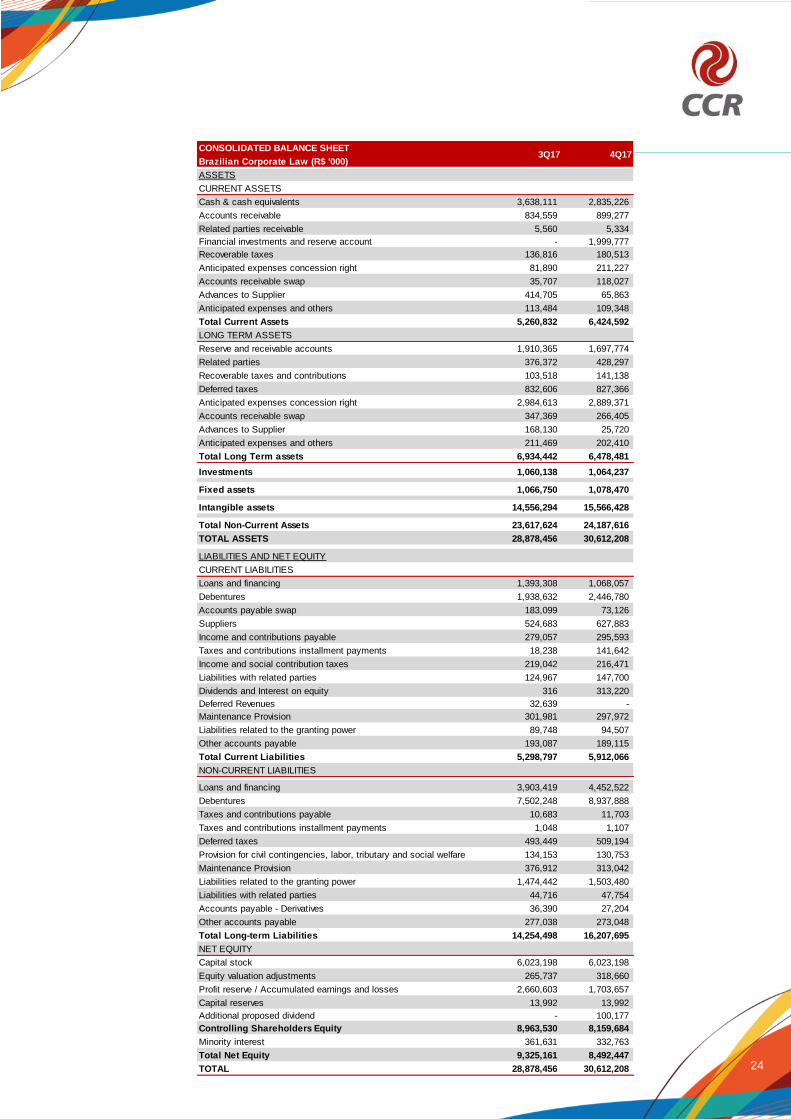
CONSOLIDATED BALANCE SHEET
Brazilian Corporate Law (R$ '000)
ASSETS
CURRENT ASSETS
Cash & cash equivalents 3,638,111 2,835,226
Accounts receivable 834,559 899,277
Related parties receivable 5,560 5,334
Financial investments and reserve account - 1,999,777
Recoverable taxes 136,816 180,513
Anticipated expenses concession right 81,890 211,227
Accounts receivable swap 35,707 118,027
Advances to Supplier 414,705 65,863
Anticipated expenses and others 113,484 109,348
Total Current Assets 5,260,832 6,424,592
LONG TERM ASSETS
Reserve and receivable accounts 1,910,365 1,697,774
Related parties 376,372 428,297
Recoverable taxes and contributions 103,518 141,138
Deferred taxes 832,606 827,366
Anticipated expenses concession right 2,984,613 2,889,371
Accounts receivable swap 347,369 266,405
Advances to Supplier 168,130 25,720
Anticipated expenses and others 211,469 202,410
Total Long Term assets 6,934,442 6,478,481 - -
Investments 1,060,138 1,064,237
Fixed assets 1,066,750 1,078,470
Intangible assets 14,556,294 15,566,428
Total Non-Current Assets 23,617,624 24,187,616
TOTAL ASSETS 28,878,456 30,612,208
LIABILITIES AND NET EQUITY
CURRENT LIABILITIES
Loans and financing 1,393,308 1,068,057
Debentures 1,938,632 2,446,780
Accounts payable swap 183,099 73,126
Suppliers 524,683 627,883
Income and contributions payable 279,057 295,593
Taxes and contributions installment payments 18,238 141,642
Income and social contribution taxes 219,042 216,471
Liabilities with related parties 124,967 147,700
Dividends and Interest on equity 316 313,220
Deferred Revenues 32,639 -
Maintenance Provision 301,981 297,972
Liabilities related to the granting power 89,748 94,507
Other accounts payable 193,087 189,115
Total Current Liabilities 5,298,797 5,912,066
NON-CURRENT LIABILITIES
Loans and financing 3,903,419 4,452,522
Debentures 7,502,248 8,937,888
Taxes and contributions payable 10,683 11,703
Taxes and contributions installment payments 1,048 1,107
Deferred taxes 493,449 509,194
Provision for civil contingencies, labor, tributary and social welfare 134,153 130,753
Maintenance Provision 376,912 313,042
Liabilities related to the granting power 1,474,442 1,503,480
Liabilities with related parties 44,716 47,754
Accounts payable - Derivatives 36,390 27,204
Other accounts payable 277,038 273,048
Total Long-term Liabilities 14,254,498 16,207,695
NET EQUITY
Capital stock 6,023,198 6,023,198
Equity valuation adjustments 265,737 318,660
Profit reserve / Accumulated earnings and losses 2,660,603 1,703,657
Capital reserves 13,992 13,992
Additional proposed dividend - 100,177
Controlling Shareholders Equity 8,963,530 8,159,684
Minority interest 361,631 332,763
Total Net Equity 9,325,161 8,492,447
TOTAL 28,878,456 30,612,208
4Q173Q17

25
Consolidated Cash Flow Statement
Brazilian Corporate Law (R$ '000) - Indirect Method
Operational activities cash flow
Net cash originating from (used on) operational activities 1,136,445 1,295,454 4,186,220 3,339,705 - - - -
Net profit (loss) in the period 155,317 320,810 1,637,447 1,782,918 - - - -
Settlements by:
Deferred income and social contribution taxes (51,866) 15,088 (158,686) 83,102
Appropriation of anticipated expenses 20,473 20,472 81,925 81,890
Depreciation and Amortization 236,121 288,864 881,620 1,053,868
Fixed, intangible and deferred assets write off 9,628 1,566 16,479 25,848
Goodwill amortization 20,176 28,339 77,796 101,451
Exchange rate variation on loans, financing and derivatives 16,203 47,775 (259,699) (13,490)
Monetary variation of the liabilities related to the granting power 11,485 19,446 144,712 62,079
Interest on debentures, promissory notes, loans, financing
and leasing 446,158 359,630 1,882,621 1,532,641
Financing costs capitalization (85,937) (122,504) (281,248) (450,382)
Result from derivative operations 56,279 (41,367) 478,724 134,255
Recognition of maintenance provision 109,820 18,660 270,715 169,725
Present value adjustment of maintenance provision
and Liabilities related to the granting power 16,141 17,165 59,987 68,567
Recognition and reversal of provision for civil, labor,
tax and social security risks 17,845 5,660 59,693 48,548
Provision of doubtfull accounts 2,737 (1,342) 124 2,029
Interest and mutual loan monetary variation with related parties (5,560) (9,177) (10,557) (35,149)
Interest on taxes in installments 24 58 105 117
Present value adjustment of financial assets (18,751) (84,793) (211,849) (270,291)
Present value adjustment of liabilities related to the granting power 11,141 10,930 44,742 43,794
Equity Income (36,524) (35,755) (243,148) (134,973)
Goodwill on the remeasurement of the stake in ViaQuatro - - - (511,703)
Advantageous purchase of ViaRio - - - (36,449) 0 0 0 0 - - - -
Assets and liabilities variations 205,535 435,929 (285,283) (398,690)
Assets (increase) decrease
Accounts receivable (133,370) (3,485) (1,416,328) (1,089,732)
Accounts receivable - Related parties (1,260) 5,059 350,471 32,207
Recoverable taxes (3,863) (81,317) 89,825 (121,560)
Dividends and interest on capital received 88,924 60,753 142,054 146,141
Antecipated expenses - fixed concession fee (53,107) (54,567) (194,625) (215,347)
Dividends and interest on capital receivable - - 53,241 -
Antecipated expenses and others 21,310 13,195 257,364 (106,388)
Receipt of financial asset 349,725 237,493 971,861 889,254
Advances to supplier (7,111) 254,562 (315,094) (948) - - - -
Liabilities increase (decrease) - - - -
Suppliers (10,935) 96,450 54,889 121,611
Suppliers - Related parties (11,225) (20,660) (42,155) (21,059)
Social and labor obligations (2,499) (2,117) 7,491 8,679
Taxes and contributions payable and in installments, and
accrual for income and social contribution taxes 133,815 323,439 654,455 933,784
Payments of income tax and social contribution (101,185) (182,478) (724,474) (772,668)
Realization of the maintenance provision (80,564) (103,704) (197,608) (254,745)
Liabilities related to the granting power 2,933 3,421 (91) (2,175)
Payment of provision for civil, labor, tax and social
security risks (10,463) (9,060) (29,813) (35,796)
Deferred Revenues - (32,639) - -
Other accounts payable 24,410 (68,416) 53,254 90,052 - - - -
Investment activities cash flow
Fixed assets acquisition (104,111) (78,028) (327,004) (246,296)
Advances for the intangible assets (873,517) (628,650) (2,350,673) (1,729,514)
Selloff of hedge operations (8,844) (14,017) (47,294) (78,436)
Loans with related parties
Receivables - 2,201 - 15,447
Fundraising (10,569) (35,618) (82,084) (86,256)
Capital increase in subsidiaries and other investments movements (226) (44) 22,153 (19)
Acquisition of 33.33% of participation in ViaRio - - - (20,767)
Payment for the purchase of 15% of ViaQuatro, net from cash acquired - - - (18,071)
Advance of funds for future capital increase - related parties - (168) - (168)
Financial investments - (1,979,607) - (1,979,607)
Other intangible assets 31 (250,954) 905 7,607 - - - -
Net cash used on investment activities (997,236) (2,984,885) (2,783,997) (4,136,080) - - - -
Financing activities cash flow
Redemptions / Investments on reserve account 127 (2,286) 233 (20,170)
Settlement of hedge operations (101,012) (60,670) (181,209) (324,778)
Loans with related parties - - - -
Fundraising 11,075 37 5,489 876
Payments (5) 95,301 (816) (1,728)
Loans, financing, debentures, promissory notes and leasing
Fundraising 1,780,587 4,970,482 8,754,095 6,968,808
Principal Payment (581,789) (2,874,356) (7,023,906) (7,113,881)
Interest Payment (424,789) (336,105) (1,354,779) (1,524,336)
Dividends - - - -
Paid to controlling shareholders (749,952) (872,919) (1,250,319) (1,272,873)
Payable / (paid) to non-controlling shareholders (24,293) (58,448) (29,933) (61,376)
Capital integralization - - - 3,997,856
Advance of funds for future capital increase - related parties - - - 42,800
Minority Interest 53,466 37,824 224,147 92,999 - - - -
Net cash used on financing activities (36,585) 898,860 (856,998) 784,197 - - - -
Effect of exchange rate changes on cash and cash equivalents 10,089 5,570 (20,425) 26,184 - - - -
Increase / Decrease of cash and cash equivalents 112,713 (785,001) 524,800 14,006 - - - -
Cash balances demonstration and cash equivalents
In the beginning of the period 2,708,507 3,620,227 2,296,420 2,821,220
At the end of the period 2,821,220 2,835,226 2,821,220 2,835,226
2016 2017 4Q16 4Q17

26
EXHIBIT – PROFORMA TABLES
(Including in all accounts the proportional results of: Renovias (40%), STP (34.24%), ViaRio (66.66%), VLT (24.93%),
Quito Int. Airport (50%) and San José Int. Airport (48.75%)).
CONSOLIDATED INCOME STATEMENT
Brazilian Corporate Law (R$ '000)4Q16 4Q17 Chg % 2016 2017 Chg %
Gross Revenues 2,057,825 2,366,844 15,0% 8,330,875 8,900,515 6.8%
- Toll Revenues 1,626,747 1,762,987 8,4% 6,280,596 6,759,108 7.6%
- Other Revenues 431,078 603,857 40,1% 2,050,279 2,141,407 4.4%
Gross Revenues Deductions (162,573) (188,068) 15,7% (650,607) (707,636) 8.8%
Net Revenues 1,895,252 2,178,776 15,0% 7,680,268 8,192,879 6.7%
(+) Construction Revenues 1,102,142 1,464,078 32,8% 4,135,100 3,259,989 -21.2%
Cost of Services (2,104,311) (2,480,330) 17,9% (7,815,083) (7,104,626) -9.1%
- Depreciation and Amortization (274,536) (354,456) 29,1% (1,034,066) (1,237,313) 19.7%
- Third-party Services (201,612) (207,918) 3,1% (773,257) (774,012) 0.1%
- Concession Costs (73,627) (77,103) 4,7% (299,943) (302,929) 1.0%
- Personnel Costs (220,992) (221,711) 0,3% (804,216) (840,093) 4.5%
- Construction Costs (1,099,627) (1,463,847) 33,1% (4,126,682) (3,257,338) -21.1%
- Maintenance Provision (108,641) (20,060) -81,5% (275,114) (173,767) -36.8%
- Other (104,803) (114,763) 9,5% (419,880) (437,284) 4.1%
- Appropriation of Anticipated Expenses from the Concession (20,473) (20,472) 0,0% (81,925) (81,890) 0.0%
Gross Profit 893,083 1,162,524 30,2% 4,000,286 4,348,242 8.7%
Gross Margin 47.1% 53.4% 6,3 p.p. 52.1% 53.1% 1.0 p.p.
Administrative Expenses (202,478) (211,913) 4,7% 481,269 (289,524) n.m.
- Depreciation and Amortization (17,912) 3,221 n.m. (80,726) (51,882) -35.7%
- Third-party Services (41,144) (48,316) 17,4% (236,398) (177,731) -24.8%
- Personnel (61,207) (92,643) 51,4% (296,606) (381,073) 28.5%
- Other (82,215) (74,175) -9,8% 1,094,999 321,162 -70.7%
Adjusted EBIT 690,605 950,611 37,6% 4,481,555 4,058,718 -9.4%
Adjusted EBIT Margin (a) 36.4% 43.6% 7,2 p.p. 58.4% 49.5% -8.9 p.p.
- Minority Interest 14,153 8,244 -41,8% 76,404 14,548 -81.0%
EBIT (b) 704,759 958,856 36,1% 4,557,960 4,073,267 -10.6%
EBIT Margin 23.5% 26.3% 2,8 p.p. 38.6% 35.6% -3.0 p.p.
+ Depreciation and Amortization 292,448 351,235 20,1% 1,114,792 1,289,195 15.6%
EBITDA (b) 997,206 1,310,090 31,4% 5,672,751 5,362,461 -5.5%
EBITDA Margin 33.3% 36.0% 2,7 p.p. 48.0% 46.8% -1.2 p.p.
+ Maintenance Provision (c) 108,641 20,060 -81,5% 275,114 173,767 -36.8%
+ Appropriation of Anticipated Expenses (d) 20,473 20,472 0,0% 81,925 81,890 0.0%
- Minority Interest (14,153) (8,244) -41,8% (76,404) (14,548) -81.0%
Adjusted EBITDA 1,112,167 1,342,378 20,7% 5,953,386 5,603,570 -5.9%
Adjusted EBITDA Margin (e) 58.7% 61.6% 2,9 p.p. 77.5% 68.4% -9.1 p.p.
Net Financial Result (450,637) (385,876) -14,4% (1,917,104) (1,313,557) -31.5%
Financial Expenses: (813,379) (685,676) -15,7% (3,500,808) (2,586,765) -26.1%
- Interest on Loans, Financing and Debentures and Loans Cost Capitalization (363,150) (222,838) -38,6% (1,487,541) (1,050,166) -29.4%
- Monetary variation on loans, financing and debentures (24,537) (42,725) 74,1% (209,858) (148,881) -29.1%
- Monetary variation on Liabilities related to the Granting Power (11,485) (19,446) 69,3% (144,712) (62,079) -57.1%
- Exchange Rate Variation (145,601) (67,066) -53,9% (328,708) (199,740) -39.2%
- Losses from Hedge Operations (189,912) (119,673) -37,0% (865,294) (514,491) -40.5%
- Present Value Adjustment of Maintenance Provision (27,655) (28,160) 1,8% (106,625) (113,179) 6.1%
-Fair Value of Hedge Operations (17,215) (8,321) -51,7% (217,846) (189,647) -12.9%
- Other Financial Expenses (29,938) (169,782) 467,1% (130,303) (287,551) 120.7%
- Exchange Rate Variation on foreing suppliers (3,886) (7,665) 97,2% (9,921) (21,031) 112.0%
Financial Income: 362,742 299,800 -17,4% 1,583,704 1,273,208 -19.6%
- Gains from Hedge Operations 135,614 152,980 12,8% 443,686 449,086 1.2%
- Exchange Rate Variation 128,326 26,044 -79,7% 649,952 228,573 -64.8%
-Monetary Variation 3,108 - -100,0% 3,108 14,975 381.8%
-Fair Value of Hedge Operations 11,512 16,382 42,3% 116,043 109,666 -5.5%
- Interest and Other Financial Income 78,751 103,525 31,5% 356,983 454,754 27.4%
- Exchange Rate Variation on foreing suppliers 5,431 869 -84,0% 13,932 16,154 15.9%
Profit (Loss) Before Income and Social Contribution Taxes 239,968 564,736 135,3% 2,564,451 2,745,162 7.0%
Income and Social Contribution Taxes - Current (137,313) (225,187) 64,0% (1,086,821) (882,233) -18.8%
Income and Social Contribution Taxes - Deferred 52,661 (18,739) n.m. 159,816 (80,011) n.m.
Profit before Minority Interest 155,317 320,810 106,6% 1,637,447 1,782,918 8.9%
Minority Interest 14,153 8,244 -41,8% 76,404 14,548 -81.0%
Net Profit for the Period 169,470 329,054 94,2% 1,713,851 1,797,466 4.9%
Basic profit Per Share (In Reais - R$) 0.10 0.16 69,7% 0.97 0.89 -8.3%
Number of shares at the end of fiscal year (in units) 1,765,587,200 2,020,000,000 14,4% 1,765,587,200 2,020,000,000 14.4%
(a) Adjusted EBIT Margin was calculated by dividing EBIT by Net Revenues, excluding construction revenue, as this is an IFRS requirement, whose corresponding amount
affects total cost.
(b) Calculated in accordance with CVM instruction number 527/12.
(c) The Maintenance Provision refers to an estimate of future expenditures for regular maintenance in CCR subsidiaries and is adjusted as it relates to a non-cash-relevant
item of the financial statements.
(d) Refers to the result appropriation of prepayments related to the concession and is adjusted relates to a non-cash relevant item of the financial statements.
(e) Adjusted EBITDA Margin was calculated by dividing Adjusted EBITDA by Net Revenues, excluding construction revenue, as this is an IFRS requirement, whose
corresponding amount affects total cost.

27
CONSOLIDATED BALANCE SHEET - PROFORMA
Brazilian Corporate Law (R$ '000)
ASSETS
CURRENT ASSETS
Cash & cash equivalents 3,886,955 3,001,462
Accounts receivable 924,259 990,541
Related parties receivable 19,214 8,549
Financial investments and reserve account 22,958 2,005,854
Recoverable taxes 140,403 183,292
Anticipated expenses concession right 81,983 210,304
Accounts receivable swap 35,707 118,050
Advances to Supplier 425,864 74,385
Anticipated expenses and others 152,462 142,572
Total Current Assets 5,689,805 6,735,009
LONG TERM ASSETS
Reserve and receivable accounts 2,129,155 1,920,009
Related parties 191,901 218,454
Recoverable taxes 103,518 141,180
Income and deferred taxes 898,694 887,018
Anticipated expenses concession right 3,017,557 2,924,585
Accounts receivable swap 347,370 266,405
Advances to Supplier 168,130 55,038
Anticipated expenses and others 200,613 191,529
Advance for capital increase - related parties 309 385
Total Long Term assets 7,057,247 6,604,603 - -
Fixed assets 1,108,858 1,120,415
Intangible assets 16,893,713 17,998,681 -
Total Non-Current Assets 25,059,818 25,723,699
TOTAL ASSETS 30,749,623 32,458,708 -
LIABILITIES AND NET EQUITY
CURRENT LIABILITIES
Loans and financing 1,607,004 1,287,944
Debentures 2,248,490 2,773,664
Accounts payable swap 183,490 73,227
Suppliers 543,950 667,251
Taxes and contributions payable 294,386 314,916
Taxes and contributions installment payments 18,626 142,034
Income and social contribution taxes 245,348 246,346
Accounts payable - related parties 208,238 151,697
Mutual loan - related parties 12,075 31,411
Dividends and interest on equity 316 313,220
Maintenance provision 310,284 301,415
Deferred Revenues 32,640 -
Liabilities related to the granting power 97,241 103,102
Other accounts payable 200,126 196,258
Total Current Liabilities 6,002,214 6,602,485
NON-CURRENT LIABILITIES
Loans and financing 4,453,460 4,964,547
Debentures 7,542,037 8,967,730
Accounts payable swap 36,391 27,204
Taxes and contributions payable 14,361 19,919
Taxes and contributions installment payments 2,442 2,416
Income and Deferred taxes 528,702 538,505
Accounts payable - related parties 44,962 48,108
Provision for civil contingencies, labor, tributary and social welfare 135,675 132,485
Maintenance provision 377,125 313,630
Liabilities related to the granting power 1,474,442 1,517,994
Mutual loan - relates parties 180,250 187,147
Other accounts payable 632,401 644,091
Total Long-term Liabilities 15,422,248 17,363,776
NET EQUITY
Capital stock 6,023,198 6,023,198
Equity valuation adjustments 265,737 318,660
Profit reserve / Accumulated earnings and losses 2,660,603 1,803,834
Capital reserves 13,992 13,992
Controlling Shareholders Equity 8,963,530 8,159,684
Minority interest 361,631 332,763
Total Net Equity 9,325,161 8,492,447
TOTAL 30,749,623 32,458,708
4Q173Q17

28
Consolidated Cash Flow Statement - PROFORMA
Brazilian Corporate Law (R$ '000) - Indirect Method
Operational activities cash flow
Net cash originating from (used on) operational activities 1,067,554 1,241,484 4,566,754 3,540,698 - - - -
Net profit (loss) in the period 155,317 320,810 1,637,447 1,782,918 - - - -
Settlements by: - - - -
Deferred income and social contribution taxes (52,661) 18,739 (159,816) 80,011
Appropriation of anticipated expenses 20,473 20,472 81,925 81,890
Depreciation and Amortization 266,838 316,954 1,014,964 1,164,846
Fixed, intangible and deferred assets write off (47,796) 1,585 124,167 (4,293)
Investment write-off - - 78,123 -
Deferred taxes - 90 - 792
Amortization of concessionarie rights-goowill 25,610 34,281 99,828 124,349
Exchange rate variation on loans, financing and derivatives 17,275 47,818 (321,244) (23,956)
Monetary variation of the liabilities related to the granting power 11,485 19,446 144,712 62,079
Interest on debentures, promissory notes, loans, financing - - - -
and leasing 480,461 389,827 2,030,792 1,656,909
Financing costs capitalization (95,882) (124,264) (336,501) (472,837)
Result from derivative operations 60,001 (41,368) 523,411 145,386
Recognition of maintenance provision 109,388 20,060 275,861 173,767
Present value adjustment of maintenance provision 16,514 17,230 61,883 69,385
Present value adjustment of financial assets (23,435) (89,801) (230,210) (291,444)
Present value adjustment of liabilities related to the granting power 11,141 10,930 44,742 43,794
Recognition and reversion of provision for civil, labor, - - - -
tax and social security risks 17,042 (72) 60,139 48,651
Provision of doubtfull accounts 2,955 (846) (73,320) 2,399
Interest and mutual loan monetary variation with related parties 1,497 (27,196) 13,326 (16,483)
Interest on taxes in installments 62 75 271 218
Goodwill on the remeasurement of the stake in ViaQuatro - - - (511,703)
Advantageous purchase of ViaRio - - - (36,449) - - - -
Assets and liabilities variations 91,269 306,714 (503,746) (539,531)
Assets (increase) decrease - - - -
Accounts receivable 36,515 (17,402) (1,493,767) (1,151,746)
Accounts receivable - Related parties (32,102) 46,204 238,034 105,799
Recoverable taxes 8,171 (80,551) 104,106 (118,934)
Antecipated expenses - fixed concession fee (54,541) (55,821) (198,955) (220,232)
Dividends and interest on capital receivable - - 2,584 -
Antecipated expenses and others 94,911 18,974 391,394 (77,092)
Receipt of Financial Asset 200,099 250,913 1,053,363 930,378
Advances to Supplier, 26,066 227,881 (347,252) (8,162) - - - -
Liabilities increase (decrease) - - - -
Suppliers 14,239 116,505 120,024 145,115
Suppliers - Related parties 17,598 (122,204) 79,390 (148,548)
Social and labor obligations (42) 1,452 2,790 13,554
Taxes and contributions payable and in installments, and - - - -
accrual for income and social contribution taxes 138,209 332,543 823,589 970,952
Payments of income tax and social contribution (106,310) (187,757) (882,722) (806,039)
Realization of the maintenance provision (84,369) (109,654) (211,293) (268,946)
Liabilities related to the granting power 2,933 17,935 (311) 12,339
Payment of provision for civil, labor, tax and - - - -
social security risks (9,633) (3,118) (29,894) (36,791)
Deferred Revenues - (32,640) - (30,744)
Other accounts payable (160,475) (96,546) (154,826) 149,566 - - - -
Investment activities cash flow - - - -
Fixed assets acquisition (106,150) (79,691) (348,679) (251,156)
Advances for the intangible assets (852,729) (674,254) (2,777,876) (1,861,271)
Capital increase in subsidiaries and other investments movements (226) - (13,787) -
Acquisition of 33.33% of participation in ViaRio - - - (10,292)
Payment for the purchase of 15% of ViaQuatro, net from cash acquired - - - (111,126)
Settlement of hedge operations (11,049) (2,896) (117,631) (80,308)
Loans with related parties - - - -
Fundraising (7,333) (18,161) (56,383) (51,488)
Receivables - 1,155 - 8,382
Advance of funds for future capital increase - related parties - (66) - (66)
Financial investments - (1,979,607) - (1,979,607)
Other intangible assets 3,406 (226,851) 13,082 20,082 - - - -
Net cash used on investment activities (974,081) (2,980,371) (3,301,274) (4,316,850) - - - -
Financing activities cash flow - - - -
Redemptions / Investments on reserve account (1,192) (3,289) (1,048) (24,928)
Settlement of hedge operations (98,502) (71,878) (40,535) (347,394)
Loans with related parties - - - -
Fundraising 19,792 18,115 36,810 47,004
Receivables (29,229) 93,380 (29,229) (17,946)
Loans, financing, debentures, promissory notes and leasing - - - -
Fundraising 1,820,087 4,974,442 8,943,260 7,214,065
Principal Payment (589,876) (2,936,139) (7,243,247) (7,385,455)
Interest Payment (489,796) (354,299) (1,469,165) (1,575,309)
Dividends - - - -
Paid to controlling shareholders (749,953) (872,919) (1,252,923) (1,272,873)
Payable / (paid) to non-controlling shareholders (24,293) (58,448) (29,933) (61,376)
Minority Interest 53,466 37,824 224,147 92,999
Advance of funds for future capital increase - related parties - 83 - 42,883
Capital integralization - - - 3,997,856 - - - -
Net cash used on financing activities (89,496) 826,872 (861,863) 709,526 - - - -
Effect of exchange rate changes on cash and cash equivalents - 26,522 (43,590) (16,206) - - - -
Increase / Decrease of cash and cash equivalents 3,977 (885,493) 360,027 (82,832) - - - -
Cash Balances Demonstration - - - -
In the beginning of the period 3,080,317 3,886,955 2,724,267 3,084,294
At the end of the period 3,084,294 3,001,462 3,084,294 3,001,462
2016 2017 4Q16 4Q17