results 2015 - abertis · • 2015 marks the first year of abertis’ 2015-2017 strategic plan...
TRANSCRIPT

2015 Results. 10 February 2016
Results
2015 10 February 2016

2015 Results. 10 February 2016 2
Contents
1. Executive Summary .......................................................... 3
2. Non Recurrent Effects ........................................................ 5
3. Activity ............................................................................ 6
4. Income Statement ............................................................ 7
5. Toll Roads ...................................................................... 10
6. Toll Roads Spain ............................................................. 11
7. Toll Roads France ........................................................... 13
8. Toll Roads Brazil ............................................................. 14
9. Toll Roads Chile .............................................................. 16
10. Hispasat ........................................................................ 18
11. Cash Flow ...................................................................... 19
12. Capex ........................................................................... 19
13. Balance Sheet ................................................................ 20
Annexes
14. Annex I: P&L, Balance Sheet & Cash Flow .......................... 22
15. Annex II: Summary of Relevant Facts ............................... 24
16. Annex III: Contact Details ............................................... 25
17. Annex IV: Disclaimer....................................................... 26

2015 Results. 10 February 2016 3
Executive Summary
• 2015 marks the first year of Abertis’ 2015-2017 strategic plan supported by the focus on toll roads,
growth, efficient operations and shareholder remuneration.
• The execution of the focalization strategy continued throughout 2015 as evidenced by the disposal of
the last airport assets and the successful stock market listing of Cellnex, above expectations. This last
transaction generated net book gains of €2,666Mn, thus strengthening Abertis’ balance sheet and
flexibility to invest.
• Throughout the year Abertis actively pursued growth opportunities in toll roads with notable
successes in Chile (Autopista del Sol, Libertadores, and Autopista Central in January 2016), and in
France where the Group agreed to invest in its existing portfolio in exchange for concession
extensions.
• In addition to the above, Abertis invested around €550Mn to enhance its existing toll roads portfolio,
setting the path for future revenue generation (via tariffs, traffic, or extensions). As a result the
company’s asset base is growing and improving.
• The good traffic performance of the year also underpins the quality of Abertis’ asset base. This
positive evolution, coupled with tariff increases, has contributed to a 5% L-f-L increase in
revenues to €4,378Mn.
• On the efficiencies front, a number of concessions are already capturing operating margin
improvements as a testament to the success of the Efficiency Program. EBITDA for the Group
reached €2,692Mn, a 5% L-f-L increase after excluding extraordinaries.
• Net profit for the year amounted to €1,880Mn as a result of numerous non-recurrent effects
explained later on. Excluding these, Net Profit increases by 7%.
• At €3,162Mn, Discretionary Free Cash Flow (before dividends and expansion capex) for the
Group far exceeds the previous year’s level, boosted by the proceeds from the IPO of Cellnex and
other asset disposals. As a result of the above, and after factoring in expansion capex and other
effects, net debt declines by 9% to €12,554Mn.
2015 Chg
ADT Spain 19,231 +6.1%
ADT France 24,021 +1.8%
ADT Brazil 18,187 -2.3%
ADT Chile 19,257 +8.5%
€ Mn 2015 L-f-L
Revenues 4,378 +5%
EBITDA 2,692 +5%
EBIT -65 +12%
Net profit 1,880 +7%
Net debt (*) 12,554
Discretionary free cash flow 3,162 +8%
Free cash flow 1,652 +64%
(*) % change vs closing prior year

2015 Results. 10 February 2016 4
• The decrease in net debt was also accompanied by a reduction in the average cost of debt supported
by Abertis’ successful liability management programs throughout the year. The company continues to
explore ways to optimize its capital structure.
Note: As of the publication of these results, the Abertis Board of Directors has not yet formulated the accounts for 2015.
Download full tables and data

2015 Results. 10 February 2016 5
Non Recurrent Effects
2015 results have been impacted by a number of non-recurrent effects. In order to facilitate the
analysis, the following must be considered:
• A €260Mn net provision on Arteris which took into account the macroeconomic environment in
Brazil and the ongoing Public Tender Offer for the totality of Arteris shares at R$10.15 per share.
• Changes in the perimeter scope: the stock market listing of a 66% stake in Cellnex took
place during the month of May (thus Abertis lost majority control of the asset). As a consequence, the
results of Cellnex (and the net book gains) have been classified as “Discontinued Operations” until the
IPO date, and as equity accounted thereafter. The consolidation of Túnels contributed one month of
EBITDA (€3.5Mn) and increased Net Debt by €178Mn.
• The AP-7 Agreement: Following a prudent accounting approach, the Company fully provisioned the
traffic guarantee of the AP-7. Abertis continues to maintain the sound legal arguments regarding the
validity of the Agreement and is pursuing its defense in Spain’s Supreme Court.
• A €73Mn impairment on Autema following the unilateral approval of a Decree by the regional
government of Catalonia which modifies the concession terms and generates a significant decline in
revenues. Abertis is a minority shareholder in the concession.
• In 2015 the Company received an executive court order in favor of some financial debtors from
Alazor who demand payment of amounts under dispute which have already been deposited and
provisioned by Abertis. However, and in parallel to the appeal process pursued by Abertis, the
Company decided to provision €117Mn to cover the potential risk that the remaining financial
debtors will file lawsuits requesting payment.
• In France, the company reached an agreement to execute the Plan de Relance. The agreement
consists of investments amounting to €590Mn in exchange for an average 2.5 years extension of its
concessions. Considering these new maturities, as of July, the amortizations for Sanef and SAPN were
recalculated.
• The 2014 Profit & Loss and Cash Flow Statements have been restated following the 2015 accounting
criteria in order to facilitate comparisons.
Note: The financials included by Abertis from Participes in Brazil, Arteris, and its group in this closing do
not necessarily match those to be reported by Arteris, as the scope is not exactly the same, the IFRS
rules in Brazil show small differences with Abertis’ IFRS criteria and, most importantly, Abertis includes
below EBITDA a number of financial impacts as well as impacts from the amortization of revalued assets
associated with the transaction (PPA).
Download full tables and data

2015 Results. 10 February 2016 6
Activity
• Abertis closed 2015 with a positive toll road activity evolution in terms of average daily traffic
(ADT). Throughout the year, the company maintained a strong overall traffic performance −
especially in Spain and Chile − more than enough to offset the volume deceleration in Brazil due to
the current macroeconomic scenario.
• The Spanish network registered the best performance since 2001, confirming the good momentum
of the country’s economy. Worth highlighting the 8.5% growth in heavy vehicle traffic (pegged to
the GDP recovery), but also the evolution in light vehicle traffic (+5.7%) on the back of a recovery in
domestic consumption. From a quarterly perspective traffic continued to improve on a sequential
basis despite a more challenging basis of comparison.
• In France the annual ADT grew 1.8% on the back of fuel prices and an overall stable economic
environment. Nonetheless, Q4 figures were adversely impacted by the Paris terrorist attacks which
restricted traffic on some of the motorways, the Paris Climate Change Conference, and strikes. Light
and heavy vehicles posted similar figures, growing 1.8% and 1.7% respectively. Full year numbers
were also impacted by an unfavorable basis of comparison from 2014 that posted a strong volume
due to better weather conditions and the reopening at the end of August 2014 of the Mathilde Bridge
as an alternative route for SAPN users.
• For Brazil, GDP weakness weighed on the total traffic volumes which shed 2.3% in the year. Taking
into consideration the Brazilian roads traffic mix, light vehicles volumes grew 1% showing resilience
against the challenging macroeconomic environment, while heavy vehicles suffered ‒ down 8.4% ‒
also affected by truckers’ strikes during February and November. Despite the crisis, the Brazilian toll
road industry is more resilient than other markets due to the country’s huge infrastructure gaps.
• Chile continues to be a good surprise in terms of traffic with an overall traffic outperformance relative
to the country’s economy indicators. ADT increased by 8.5% with light vehicles delivering close to
two digits growth (+9.6%). This can be partially explained by the good weather conditions during
2015 and special events such as the Copa America’s football tournament. Heavy vehicles improved by
3.3% in the period.
Download full tables and data
2015 Chg Chg LV Chg HV
Toll roads: ADT
Total Spain 19,231 +6.1% +5.7% +8.5%
Total France 24,021 +1.8% +1.8% +1.7%
Total Brazil 18,187 -2.3% +1.0% -8.4%
Total Chile 19,257 +8.5% +9.6% +3.3%
2015 Results. 10 February 2016 7
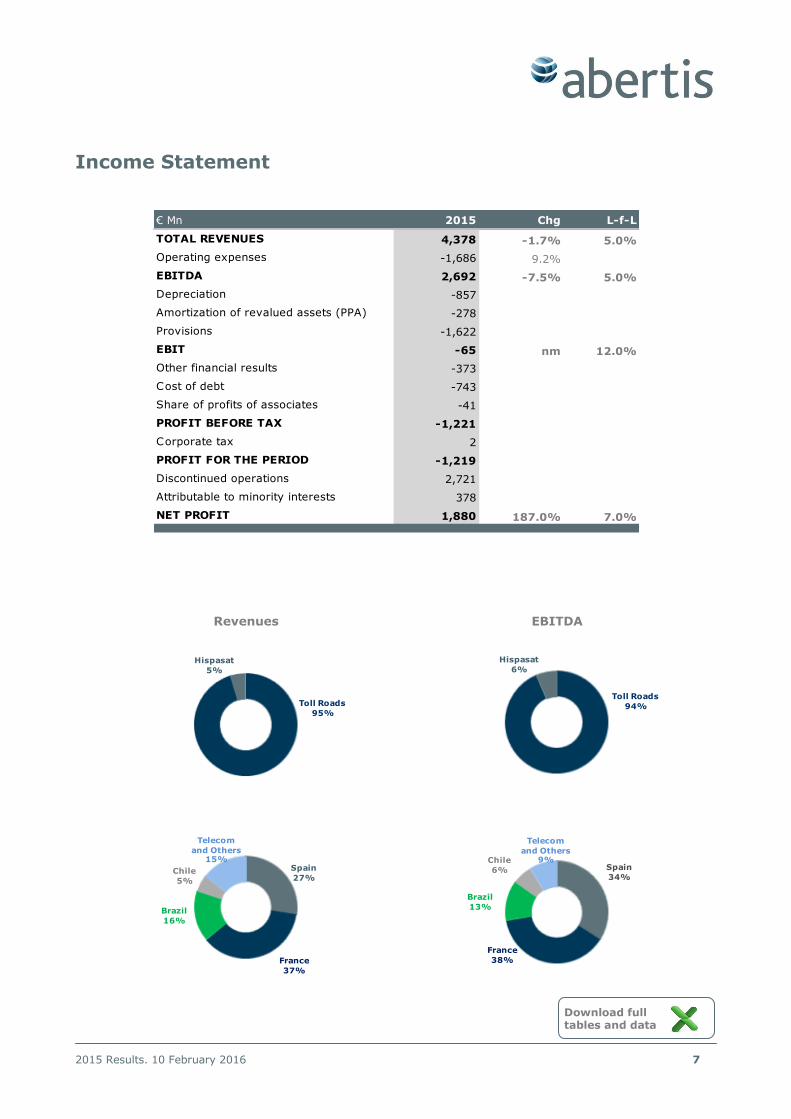
Income Statement
Revenues EBITDA
Toll Roads
95%
Hispasat
5%
Toll Roads
94%
Hispasat
6%
Spain
34%
France
38%
Brazil
13%
Chile
6%
Telecom
and Others9%
Spain
27%
France
37%
Brazil
16%
Chile
5%
Telecom
and Others15%
Download full tables and data
€ Mn 2015 Chg L-f-L
TOTAL REVENUES 4,378 -1.7% 5.0%
Operating expenses -1,686 9.2%
EBITDA 2,692 -7.5% 5.0%
Depreciation -857
Amortization of revalued assets (PPA) -278
Provisions -1,622
EBIT -65 nm 12.0%
Other financial results -373
Cost of debt -743
Share of profits of associates -41
PROFIT BEFORE TAX -1,221
Corporate tax 2
PROFIT FOR THE PERIOD -1,219
Discontinued operations 2,721
Attributable to minority interests 378
NET PROFIT 1,880 187.0% 7.0%

2015 Results. 10 February 2016 8
• 2015 Revenues amounted to €4,378Mn, up 5% on a like-for-like basis mainly due to a strong
traffic performance and tariff increases. It should be noted that 2014’s figures included the recognition
of the Acesa’s AP-7 traffic guarantee (€198Mn) and that 2015’s no longer consider such an impact.
Moreover, the negative FX evolution (€101Mn), namely the Brazilian real and other non-recurrent
items were responsible for a 1.7% decrease in headline revenues.
• Operating expenses increased 9.2% on the back of upfront costs linked to the implementation of
the efficiency program (including redundancies), other non-recurrent impacts (e.g. extraordinary
expenses related to M&A), and higher land fees related to the Redevance Domaniale in France.
Furthermore, provision reversals at Sanef and Autopista del Sol during 2014, and a perimeter change
with the consolidation of Túnels in Spain at the end of 2015, also disrupt the comparison between the
periods. All in all, comparable opex increased by 2.2%.
• EBITDA amounted to €2,692Mn (up 5% on a comparable basis). This comparable basis excludes the
AP-7 traffic guarantee, FX impacts and the aforementioned one-offs. Excluding said effects,
EBITDA amounts to €2,807Mn.
• EBIT was impacted by the extraordinary provisions carried out during 2015. These include the AP-7
traffic guarantee provision from 2006 until the end of 2014 (€859Mn) and the Arteris write-down
(€763Mn). On a comparable basis, EBIT registered a 12% improvement.
• Net financial result amounted to €1,116Mn. The difference vs. 2014 is related to one-offs booked on
“other financial results” totaling €373Mn. These include €123Mn in provisions on the 6.5% annual
financial compensation from the AP-7 traffic guarantee agreement, €92Mn from the liability
management expenses at HIT and SANEF, and other provisions to cover eventual risks including
€117Mn related to a possible demand for payment from the rest of the financial debtors of Alazor
(Radiales). The expenses related to the debt were €743Mn with an average financial cost of 5.1%
— a reduction relative to 2014 as a result of the optimization of the group’s capital structure.
• Associates, including Cellnex Telecom since its IPO and Autopista Central until the full control and
consolidation of the asset in 2016, recorded a negative contribution of €41Mn due to the €73Mn
provision at Autema to fully cover the risk linked to a contractual dispute with the regional granting
authority.
• Corporate tax for the year registered a positive amount of €2Mn, as the payable tax related to the
operations of the group’s companies was offset by the tax reversal related to the AP-7 traffic
guarantee and the impairments carried out by the company during the year. The current tax rates in
the main countries where Abertis operates are as follow: Spain (28% decreasing to 25% in 2016);
France (38% decreasing to 34% in 2016); Brazil (34%) and Chile (22.5% increasing to 24% in 2016).
• Results from Discontinued Operations reflect the net book gains from the disposal of a 66% stake
in Cellnex Telecom, as well as the revaluation of the remaining 34% stake, and to a lesser degree the
disposal of the last airports in the portfolio (at present there are no more airports within Abertis’ asset
base).
• Minorities are mainly linked to the results’ contribution to external partners of HIT, Arteris, and
Hispasat. In this sense, the impairment in Brazil explains the positive sign in terms of the minorities
results which offsets the profits achieved mainly in France and Hispasat.
Download full tables and data

2015 Results. 10 February 2016 9
• The value crystallization through the Cellnex IPO generated net book gains of €2,666Mn that made
possible the highest net profit in the history of Abertis, €1,880Mn in 2015. Excluding this
extraordinary event, the impacts from the AP-7 traffic guarantee and the aforementioned provisions,
Net Profit grew 7% L-f-L.
Download full tables and data

2015 Results. 10 February 2016 10
Toll Roads
• At the end of 2015 toll roads contributed 95% of the group’s revenues and 94% of its EBITDA, up
from 87% and 89% in 2014 revenues and EBITDA respectively. The results also highlight the Group’s
internationalization strategy which mitigates risks and maintain a sustainable global growth platform.
This key advantage prevented major impacts from the cyclical current Brazilian economic scenario as
the good momentum of Spain, France and Chile sustained a L-f-L toll road growth of 4.3% on
revenues and 4.8% in EBITDA, totaling €4,159Mn and €2,597Mn respectively.
• The headline decrease in total revenues and EBITDA is related to the effects of the AP-7 provisions
affecting Spain (€198Mn) and the devaluation of the Brazilian real. The FX impact on toll roads at the
revenue level amounted €91Mn, and €45Mn at the EBITDA level.
• EBIT was impacted by the increase in depreciation and amortization due to the impairment of some
of the Arteris assets as well as the AP-7 agreement provision booked on the account receivable
generated by the traffic guarantee from 2006 until 2014. These effects are partly offset by lower
depreciation in France as a result of a longer concession term due to the agreement reached with the
French Government on the Plan de Relance.
€ Mn 2015 Chg 2015 Chg 2015 Chg
Total Revenues 1,200 -10.1% 1,601 2.8% 706 -16.5%
Operating expenses -287 -568 -362
EBITDA 913 -16.7% 1,033 1.5% 344 -20.5%
Depreciation -1,127 -278 -142
EBIT -214 755 202
Amortization of revalued assets -50 -87 -846
EBIT (2) -265 nm 668 7.5% -644 nm
€ Mn 2015 Chg 2015 Chg 2015 Chg
Total Revenues 234 14.1% 417 30.4% 4,159 -2.4%
Operating expenses -65 -280 -1,562
EBITDA 169 8.7% 138 19.9% 2,597 -7.8%
Depreciation -36 -43 -1,626
EBIT 133 95 971
Amortization of revalued assets -27 -1 -1,012
EBIT (2) 107 11.5% 94 22.2% -41 nm
Spain France Brazil
ROW Toll RoadsChile
Download full tables and data

2015 Results. 10 February 2016 11
Toll Roads Spain
• The Spanish toll roads network delivered the strongest traffic growth since 2001 (+6.1%). Light
vehicles had 5.7% improvement while heavy vehicles rose 8.5%, confirming a sustainable
economic recovery after a relative long period of weakness.
• L-f-L revenues grew 6% while the efficiency measures taken by the company in the recent years
led to an 8.1% L-f-L growth in EBITDA.
2 0 15 Chg 2 0 15 Chg 2 0 15 Chg 2 0 15 Chg
ADT 25,511 5.5% 48,300 4.6% 15,249 7.6% 22,490 6.4%
% HV 21% 0.3 4% 0.0 13% 0.7 7% -0.1
% ETC revenues 83% 0.9 84% 0.3 67% 1.3 87% 0.8
T o tal R evenues 464 -27.0% 112 2.6% 273 7.8% 88 -5.1%
Operating expenses -124 -28 -60 -18
EB IT D A 341 -38.6% 84 -0.7% 213 5.0% 70 -6.2%
% margin 73.3% -13.9 74.8% -2.5 77.9% -2.1 79.3% -0.9
Depreciation -935 -24 -67 -13
EB IT -594 -224.8% 59 -0.7% 146 7.7% 56 -7.4%
% margin -127.9% -202.8 53.1% -1.8 53.5% 0.0 64.0% -1.6
Amortization of revalued assets 0 0 0 0
EB IT (2) -594 -224.8% 59 -0.7% 146 7.7% 56 -7.4%
% margin -127.9% -202.8 53.1% -1.8 53.5% 0.0 64.0% -1.6
2 0 15 Chg 2 0 15 Chg 2 0 15 Chg 2 0 15 Chg
ADT 11,760 5.8% 22,280 6.4% 6,702 9.6% 19,231 6.1%
% HV 10% 0.1 12% 0.5 7% 0.0 14% 0.6
% ETC revenues 83% 1.3 69% 5.9 69% 5.3 81% 1.0
T o tal R evenues 138 5.0% 109 7.0% 1,200 -10.1%
Operating expenses -38 -27 -287
EB IT D A 101 4.9% 82 6.4% 913 -16.7%
% margin 72.8% -0.1 75.2% -0.4 76.1% -6.0
Depreciation -34 -27 -1,127
EB IT 66 6.8% 55 7.5% -214 nm
% margin 48.1% 0.8 50.0% 0.2 -17.9%
Amortization of revalued assets -50 0 -50
EB IT (2) 16 36.2% 55 7.5% -265 nm
% margin 11.5% 2.6 50.0% 0.2 -22.1%
Total Spain
acesa aumar aucat
avasa iberpistas castellana
invicat
Download full tables and data

2015 Results. 10 February 2016 12
• Upsides captured due to the efficiency plan include a reduction in personnel costs and other
comparable expenses. The total increase in the operating expenses is related to one-offs, indemnities,
and other provisions.
• Non-cash effects from the provisions of the AP-7 traffic guarantee impacted revenues, EBITDA,
and EBIT (including extraordinary impairments booked under depreciation). These are exclusively
related to Acesa as evidenced by the decrease of its main figures.
• Aumar: During the month of July, and in light of the administrative silence over the request,
submitted in 2011, for a financial reequilibrium of the concession due to the impact from the
construction of free parallel roads, the company has filed an administrative dispute appeal
(Recurso Contencioso-Administrativo) in the Supreme Court.
• At the end of November after receiving the approval of the Generalitat de Catalunya Abertis acquired
an additional 15.01% of the share capital of Túnels de Barcelona i del Cadí for €35Mn. With this
transaction, Abertis became the majority and controlling shareholder of the company, holding 50.01%
stake of the asset and consolidating its figures. For 2015 the consolidation of Túnels contributed with
one month of EBITDA (€3.5Mn).
Download full tables and data

2015 Results. 10 February 2016 13
Toll Roads France
• France contributed 37% of Group revenues and 38% of EBITDA. Traffic growth in the period amounted to 1.8%, evenly split between light (+1.8%) and heavy vehicles (+1.7%). As previously
mentioned, this traffic performance was negatively impacted by the Paris terror attacks during the 4Q15, the Paris Climate Change Conference, and strikes.
• Revenues grew 2.8% even after taking into account the government-imposed tariff freeze for 2015.
It should be noted the freeze, together with previous years’ increases in the Redevance Domaniale, will be compensated with tariff step-ups over the coming years (2016-2023).
• SANEF and SAPN registered a slight decrease in EBITDA due to redundancies and upfront costs
related to the efficiency plan and one-off effects in 2014 (€10Mn provision reversal for pensions and €22Mn write-down for the cancelation of the Ecotaxe) as well a one-off adjustment at the Redevance
Domaniale fee during 2015 (€11Mn). All in all these impacts were offset due to the top line growth (France EBITDA grew 1.5% or 3.8% in a L-f-L basis).
• The Plan de Relance that remunerated additional investments for term extensions reduced the
yearly depreciation when recalculated using the new concession maturity (additional 2.5 years on average).
• In September, Holding d’Infrastructures de Transport (HIT), a French company controlled by
Abertis, issued bonds for a total amount of €200Mn, maturing in March 2025, and paying an annual coupon of 2.25%, below the company’s cost of debt and extending the debt maturity. Proceeds from
the issue were used to repay €250Mn of the 2018 bond paying a 5.75% coupon. In November SANEF successfully closed a public issue of bonds for a total amount of €600Mn, maturing in March 2026, and paying an annual coupon of 1,875%.
• It is worth mentioning that at the end of 2015 the French government announced a corporate tax
reduction from 38% to 34% starting in 2016.
2 0 15 Chg 2 0 15 Chg 2 0 15 Chg 2 0 15 Chg
ADT 23,664 1.7% 29,012 2.0% 24,021 1.8%
% HV 16% 0.0
% ETC revenues 90% 3.0
T o tal R evenues 1,169 2.0% 385 2.3% 48 35.3% 1,601 2.8%
Operating expenses -406 -125 -37 -568
EB IT D A 762 -0.7% 260 -0.7% 10 -183.0% 1,033 1.5%
% margin 65.2% -1.8 67.6% -2.1 21.9% 57.6 64.5% -0.8
Depreciation -188 -86 -3 -278
EB IT 574 1.8% 174 4.0% 7 -146.4% 755 5.6%
% margin 49.1% -0.1 45.1% 0.7 15.5% 60.8 47.2%
Amortization of revalued assets -74 (13) 0 -87
EB IT (2) 500 6.3% 161 -3.8% 7 -146.4% 668 7.5%
% margin 42.8% 1.7 41.7% -2.7 15.5% 60.8 41.7%
Sanef SAPN Others Total France
Download full tables and data

2015 Results. 10 February 2016 14
Toll Roads Brazil
2 0 15 Chg 2 0 15 Chg 2 0 15 Chg 2 0 15 Chg 2 0 15 Chg 2 0 15 Chg
ADT 16,166 -3.3% 25,240 -1.9% 21,611 -4.2% 34,291 -0.3% 6,802 -5.5% 21,307 -2.2%
% HV 23% -1.5 34% -2.6 54% -2.8 29% -2.1 37% -2.7
% ETC revenues 41% 1.9 42% 1.0 52% 1.1 35% 0.4 32% 0.5
T o tal R evenues 47 -11.4% 72 -16.2% 76 -11.5% 60 -16.5% 30 -19.8% 285 -14.7%
Operating expenses -29 -48 -42 -41 -21 -180
EB IT D A 18 -15.1% 24 -19.9% 34 -12.3% 20 -31.7% 8 -32.8% 105 -20.7%
% margin 38.9% -1.7 33.8% -1.6 45.1% -0.4 32.8% -7.3 28.7% -5.5 36.9%
Depreciation -10 -20 -19 -15 -10 -74
EB IT 9 -34.8% 4 -62.3% 15 -25.8% 5 -68.8% -1 -137.1% 32 -51.2%
% margin 18.2% -6.6 5.8% -7.1 20.2% -3.9 8.3% -13.9 -4.9% -15.4 11.1%
Amortization of revalued assets -53 -22 -32 -1 -3 -112
EB IT (2) -45 -525.0% -17 -284.9% -17 -209.0% 4 -73.4% -5 -241.2% -80 -246.3%
% margin -95.3% -115.1 -24.2% -35.2 -22.5% -40.8 6.9% -14.7 -16.3% -25.5 -28.1%
2 0 15 Chg 2 0 15 Chg 2 0 15 Chg 2 0 15 Chg 2 0 15 Chg 2 0 15 Chg
ADT 11,949 -2.4% 14,734 -1.9% 10,257 -2.2% 14,778 -2.6% 12,499 -2.4% 18,187 -2.3%
% HV 27% -1.3 29% -1.7 28% -1.1 23% -1.0 33% -2.2
% ETC revenues 59% 0.5 61% 0.5 58% 0.3 55% 0.5 47% 0.6
T o tal R evenues 94 -15.2% 101 -15.6% 107 -13.9% 88 -14.9% 389 -14.9% 706 -16.5%
Operating expenses -36 -40 -39 -31 -145 -362
EB IT D A 58 -15.8% 61 -20.9% 68 -14.6% 57 -23.8% 244 -18.8% 344 -20.5%
% margin 61.7% -0.4 60.8% -4.0 63.6% -0.6 65.0% -7.5 62.7% 48.8% -2.5
Depreciation -19 -15 -8 -23 -66 -142
EB IT 38 -25.3% 46 -25.9% 60 -16.0% 34 -33.0% 179 -24.3% 202 nm
% margin 41.0% -5.5 45.5% -6.3 56.4% -1.4 38.6% -10.4 45.9% 28.7%
Amortization of revalued assets -52 -69 -181 -35 -336 -846
EB IT (2) -14 -143.7% -23 -159.8% -120 -407.2% -1 -103.5% -158 -209.1% -644 nm
% margin -14.6% -42.9 -22.5% -54.3 -112.2% -143.7 -1.5% -36.6 -40.6% -91.2%
Planalto Sul Arteris Federais
Arteris Estaduais Total Brazil
Fluminense Fernao Dias Regis Bittencourt Litoral Sul
Autovias Centrovias Intervias Via Norte
• Traffic volumes in Brazil decreased 2.3% in 2015 especially due to an 8.4% drop in heavy vehicles
impacted by the current economic scenario and truckers’ strikes at different times of the year. The
resilient light vehicles registered a growth of 1% over 2014 partially offsetting the impact from the
heavy vehicles.
• Tariff increases in all concessions − in some cases above inflation due to compensations on
investments – offset most of the traffic decrease, leading to stable revenues on a comparable basis
(i.e. adjusted by FX impacts and non recurrent 2014 revenues).
• The granting authority approved an economic and financial rebalancing of the federal
concession contracts through tariff increases. This measure compensates for the Truck Drivers'
Law which prohibited billing the suspended axles for heavy vehicles in the federal concessions
effective since April 2015. Furthermore, the compensation for additional investments will lead to a two
digits federal roads’ tariff increase from 2016 onwards.
Total Brazil includes Holding and other activities from Group companies like those for road maintenance
Download full tables and data

2015 Results. 10 February 2016 15
• Regarding operating expenses, Q4 15 non-cash provisions for maintenance (related to future
disbursements for paving and renewal of the highways) were adjusted upwards, therefore increasing
the total opex. Every quarter the company reviews these provisions according to the expectations of
the timing for execution and the total amount of these disbursements.
• The average 18.3% devaluation of the Brazilian real on a yearly basis was responsible for a
€131Mn impact on the group’s revenues and €67Mn on its EBITDA. Considering the above, as well as
an extraordinary revenue during 2014 (€6Mn telecom right of way charging), headline revenue
declined 16.5%, and EBITDA by 20.5%. On a Like-for-Like basis, revenues remained broadly flat, and
EBITDA declined by 4.5%.
• Results at the EBIT line can be explained by several elements: the performance at the EBITDA level;
an increase in the assets’ depreciation, in line with the current investment plan; and; Arteris’
€763Mn gross provisions to account for the macroeconomic situation in Brazil as well as the
intention to launch a public tender offer for the acquisition of all common shares issued by Arteris at
an offering price per share of R$10.15.
• During October the federal granting authority (ANTT) approved a revision on the return rates for
new investments in the current concessions and also for the ambitious federal infrastructure plan
(PIL). The methodology is based on the remuneration of the project’s marginal cash flow and the new
WACC to be used will be around 9.8% real unlevered post-tax.
Download full tables and data

2015 Results. 10 February 2016 16
Toll Roads Chile
• Abertis’ assets in Chile posted sound figures across the board in 2015. The positive traffic
performance (+8.5%) coupled with an average 5.9% tariff increase, and the Chilean Peso
appreciation (+4.2%), boosted results leading to a 14.1% revenues expansion. This strong
performance can be seen along all the Chilean operations.
• In terms of EBITDA, the 8.7% improvement was only impacted by a non recurrent provision
reversal at Autopista del Sol (€10Mn) back in 2014 related to a dispute for additional works and costs
in the new access to the San Antonio Port. Excluding this one-off as well as FX, the consolidated
EBITDA grew 9.5%.
Total Chile includes Holding and other activities from Group companies
2 0 15 Chg 2 0 15 Chg 2 0 15 Chg
ADT 32,333 8.2% 6,271 5.1% 17,621 6.5%
% HV 13% -0.7 39% -2.3 10% -0.5
% ETC revenues 11% 1.9 0% 0.0 13% 1.8
T o tal R evenues 97 15.4% 35 9.0% 33 17.2%
Operating expenses -22 -14 -6
EB IT D A 75 16.4% 21 11.1% 27 19.9%
% margin 77.6% 0.6 59.3% 1.1 81.6% 1.9
Depreciation -15 -4 -3
EB IT 60 19.8% 17 12.6% 24 22.3%
% margin 62.1% 2.3 48.4% 1.5 71.8% 3.0
Amortization of revalued assets -11 0 -7
EB IT (2) 49 24.1% 17 12.6% 17 30.8%
% margin 50.3% 3.5 48.4% 1.5 52.0% 5.4
2 0 15 Chg 2 0 15 Chg 2 0 15 Chg
ADT 36,637 10.7% 8,478 8.3% 19,257 8.5%
% HV 10% -0.2 15% 0.0 15% 2.8
% ETC revenues 14% 1.4 0% 0.0 11% 1.5
T o tal R evenues 47 11.8% 21 24.9% 234 14.1%
Operating expenses -9 -6 -65
EB IT D A 37 -4.5% 14 37.8% 169 8.7%
% margin 79.8% -13.6 69.2% 6.5 72.3% -3.6
Depreciation -6 -6 -36
EB IT 32 -6.1% 8 77.7% 133 10.0%
% margin 67.8% -12.9 40.0% 11.9 56.9%
Amortization of revalued assets -7 -2 -27
EB IT (2) 25 -8.7% 7 115.3% 107 11.5%
% margin 53.1% -11.9 32.1% 13.5 45.6%
A. del Sol Los Andes Total Chile
Rutas Elqui Libertadores
Download full tables and data

2015 Results. 10 February 2016 17
• In July 2015 Abertis acquired 50% less one share of Infraestructura Dos Mil for approximately €133
Mn. With this operation, Abertis reached 100% of both Autopista Libertadores and Autopista del
Sol.
• In January 2016 Abertis acquired a 50% stake in Autopista Central for €948Mn (equity),
reaching 100% of the asset which will be fully consolidated into the group’s accounts in 2016. Prior to
the acquisition, Autopista Central was accounted for under the equity method, thus not contributing to
the operational figures. During 2015, on the back of a 4.6% increase in the ADT (+5.1% LV,
+1.8% HV) a 6% tariff revision, and the introduction of congestion charging on several segments,
revenues expanded by 17.3% at a fixed FX rate totaling €219Mn. EBITDA posted a growth of
30% with a total of €149Mn while the EBIT reached €118Mn with a 39% improvement.
Download full tables and data

2015 Results. 10 February 2016 18
Hispasat
• Revenues rose 14.5% to €215Mn, mainly due to higher sales in the orbital position 61 W, revenues
from commercial agreements in new orbital positions, and the FX evolution. 60% of the revenues came from Latin America.
• It is worth highlighting the €89Mn payment of the Amazonas 4A insurance policy. This amount was
allocated to the early repayment of the project financing. On the other hand, the successful launch of
the Intelsat 34 satellite on August 20 provides continuity and growth to the services offered from the orbital position 55.5 W and replacing Amazonas I.
• Operating expenses decreased basically due to non-recurrent expenses incurred the previous year and to efficiencies.
• The above-mentioned events were responsible for the 21.7% increase of EBITDA to €179Mn.
2015 Chg
Revenues 215 14.5%
Operating expenses 36
EBITDA 179 21.7%
Margin 83.2% 4.9
Depreciation -87
EBIT 92
% margin 42.9%
Amortization of revalued assets -28
EBIT (2) 64 182.9%
% margin 29.7% 17.7
Download full tables and data

2015 Results. 10 February 2016 19
Cash Flow
Capex
• During 2015, operating capex amounted to €95Mn vs. €125Mn the previous year. The main
investments relate to France (€36Mn for the renovation and modernization of the existing network).
• Expansion capex reached €811Mn during the period:
o Toll Roads: €552Mn, mainly as a result of the Brazilian Capex program (€386Mn).
o Telecom: €250Mn in Hispasat (mainly for the construction of new satellites, including Amazonas
5 and Hispasat 1F)
• The acquisition of 50% (minus one share) of Autopistas del Sol and Libertadores during July 2015 and
the additional 15.05% of Tunels de Barcelona i Cadí are not included in the Capex of this section, but
in the M&A investments.
€ Mn Operating Expansion
Spain 23 28
France 36 125
Brazil 24 386
Chile 5 7
Others 3 7
Toll Roads 92 552
Telecom 3 250
Holding 0 9
Total 95 811
Download full tables and data
2,692
3,162
1,652
-1,116
2 -569
2,248 -95-811
-579
-120
Ebitda Financial
Result
Income tax Non cash
effects
Disposal of
assets
Operating
capex
Discrecionary
free cash flow
Expansion
capex
Dividends Minorities Net CF

2015 Results. 10 February 2016 20
Balance Sheet
• The most significant changes in the balance
sheet as of 31 December 2015 vs. December
2014 result from the sale of Cellnex and its
present classification as associates, the
impairments carried out during the period, and
from the FX effect vs. euro.
• The Net Debt stood at €12,554Mn at the end of
2015, a €1,235Mn decrease vs. 2014, mainly as
a result of the cash flow generated during the
period (€1,652Mn, driven by the inflow of
€2,071Mn from the disposal of Cellnex and
€177Mn from the disposal of MBJ, as well as the
company’s activity), the deconsolidation of
Cellnex’s own debt (€329Mn) and the FX effect,
mainly the devaluation of the Brazilian real, that
offset the purchase of treasury shares acquired
during the year (€1,062 Mn). The average cost of
debt has declined to 5.1% and the Net
Debt/EBITDA reached 4.7x.
• As of 31 December 2015, available credit lines
amounted to €3,535Mn and Cash at
consolidated level stood at €2,222Mn. These
figures do not include the investment for the
acquisition of Autopista Central.
22,114
5,349
3,625
17,253
3,137
1 2
Current liabilities
Non-Current Assets
Current Assets
Shareholders' equity
Non-current liabilities
13,789
12.554
-1,652
-329 168
1,062 -89 -382
-14
Net Debt 2014 Net CF Cellnex Net Debt
Desconsolidation
M&A Investments Buy-Back program Amazonas 4
Insurance
Fx Others Net debt 2015
€ Mn 2014 2015
Net debt 13,789 12,554
Cash and equivalents 2,242 2,222
Cash at Holding 844 1,373
Average cost of debt 5.2% 5.1%
Average maturity (yr) 6.0 6.1
Non-recourse debt 67% 66%
Long-term debt 91% 90%
Fixed rate debt 84% 88%
Bank debt 35% 31%
Capital markets 65% 69%
Debt in Spain 39% 41%
Undrawn credit lines 4,015 3,535
Download full tables and data

2015 Results. 10 February 2016 21
Spain Net Debt: €4,580 Mn Net Debt/EBITDA: 4.5x Average cost: 3.8% Average maturity: 5.7
France Net Debt: €5,376 Mn Net Debt/EBITDA: 5.2x Average cost: 4.3% Average maturity: 6.1
Brazil Net Debt: €1,305 Mn Net Debt/EBITDA: 3.8x Average cost: 12.4% Average maturity: 3.6
Chile Net Debt: €498 Mn Net Debt/EBITDA: 2.9x Average cost: 4.4% Average maturity: 5.6
RoW Net Debt: €808 Mn Net Debt/EBITDA: 5.7x Average cost: 6.1% Average maturity: 12.5
Maturities profile (€Mn)
1,404 1,474
964
1,5121,320
1,966
1,020 1,195
4,139
2016 2017 2018 2019 2020 2021 2022 2023 2024+
Corporate debt Subsidiaries debt
2016 2017 2018 2019 2020 2021 2022 2023 2024+
Spain 674 875 96 929 858 83 299 667 1,643
France 205 245 620 320 258 1,722 265 363 1,705
Brazil 409 247 136 134 77 85 94 103 139
Chile 90 88 104 119 115 66 44 50 195
Others 26 19 8 10 12 10 318 12 457
1,404 1,474 964 1,512 1,320 1,966 1,020 1,195 4,139
Download full tables and data

2015 Results. 10 February 2016 22
Annexes
Annex I: P&L, Balance Sheet and Cash Flow
P&L (€ Mn) 2014 2015 Chg
Revenues 4.453 4.378 -1,7%
Toll Roads 4.262 4.159 -2,4%
Hispasat 188 215 14,5%
Holding 3 5 42,3%
Operating expenses -1.544 -1.686
EBITDA 2.909 2.692 -7,5%
% margin 65,3% 61,5%
Toll Roads 2.816 2.597 -7,8%
% margin 66,1% 62,4%
Hispasat 147 179 21,7%
% margin 78,3% 83,2%
Holding -54 -84 54,3%
% margin n/a n/a
Depreciation -859 -1.715
Toll Roads -760 -1.626
Hispasat -94 -87
Holding -5 -3
EBIT 2.050 976 -52,4%
% margin 46,0% 22,3%
Toll Roads 2.056 971 -52,8%
% margin 48,2% 23,4%
Hispasat 53 92 72,9%
% margin 28,4% 42,9%
Holding -59 -87 46,9%
% margin n/a n/a
Amortization of revalued assets -304 -1.041
Toll Roads -273 -1.012
Hispasat -31 -28
Holding 0 -1
EBIT (2) 1.746 -65 -103,7%
% margin 39,2% -1,5%
Toll Roads 1.783 -41 -102,3%
% margin 41,8% -1,0%
Hispasat 23 64 182,9%
% margin 12,0% 29,7%
Holding -59 -88 48,4%
% margin n/a n/a
Other financial results 44 -373
Cost of debt -770 -743
Share of profits (losses) of associates 21 -41
PROFIT BEFORE TAX 1.042 -1.221 -217,2%
Income tax expense -356 2
PROFIT FOR THE PERIOD 686 -1.219
Discontinued operations 119 2.721
Attributable to minority interests -150 378
NET ATT. PROFIT 655 1.880 187,0%

2015 Results. 10 February 2016 23
CF (€ Mn) 2014 2015 Chg
EBITDA 2,909 2,692 -7.5%
Financial result -726 -1,116
Income tax expense -356 2
Cash flow 1,827 1,578 -13.6%
Adjust. & non cash effects -384 -569
Asset Disposals 274 2,248
Gross operating cash flow 1,717 3,257 89.6%
Operating capex -125 -95
Discretionary free cash flow 1,592 3,162 98.6%
Dividends -577 -579
Payments to minorities -155 -120
Free cash flow II 860 2,463
Expansion capex - organic -812 -811
Free cash flow 47 1,652
Balance (€ Mn) 2014 2015 Chg
Assets
Property, plant and equipment 1,976 1,375 -601
Intangible assets 17,585 16,208 -1,377
Investments & other fin. assets 4,216 4,531 315
Non-current assets 23,777 22,114 -1,663
Trade and other receivables 1,076 1,039 -37
Others 328 364 36
Cash 2,242 2,222 -20
Current assets 3,647 3,625 -22
Assets held for sale 316 0 -316
Total assets 27,740 25,739 -2,001
Equity & Liabilities
Share capital 2,695 2,830 135
Reserves and Minority interest 3,298 2,520 -778
Shareholder's equity 5,993 5,349 -644
Loans and borrowings 14,665 13,261 -1,404
Other liabilities 3,888 3,991 103
Non-current liabilities 18,552 17,253 -1,299
Loans and borrowings 1,367 1,515 148
Trade and other payables 1,712 1,623 -89
Current liabilities 3,079 3,137 58
Liabilities held for sale 116 0 -116
Total equity and liabilities 27,740 25,739 -2,001

2015 Results. 10 February 2016 24
Annex II: Summary of Relevant Facts
October 2015
The CNMV communicated the final results for the Voluntary Tender Offer for the partial acquisition of its
shares formulated by Abertis Infraestruturas on the 6.5% of its share capital. The offer was concluded
with the acceptance of 453,668,895 shares, representing 48.10% of the share capital.
November 2015
Abertis communicated that SANEF, a French company controlled by Abertis through a 52.55% stake in
Holding d’Infrastructures de Transport (“HIT”), had successfully closed a public issue of bonds (more than
6x oversubscribed) for a total amount of 600 million Euro, maturing in March 2026, and paying an annual
coupon of 1.875%, below the company’s cost of debt. This was the first public issue of bonds carried out
directly by Sanef and its net proceeds were used for the repayment of its existing debt at an average cost
of 4.7%.
Due to a process of "accelerated bookbuilding" among qualified investors, 59,792,969 shares of Trebol
International B (CVC)., representing a 6.339% stake of Abertis, were placed in the market at €13.68 per
share.
Events subsequent to the closing
January 2016
Abertis communicated that through its wholly-owned subsidiary Inversora de Infraestructuras, it had
acquired a 50% stake in Autopista Central from Alberta Investment Management Corporation (AIMCo) for
€948Mn. As a result, Abertis now controls 100% of the asset.

2015 Results. 10 February 2016 25
Annex III: Contact Details Investor Relations
Steven Fernández [email protected] Thiago Ribas [email protected]
Sergio Castilla [email protected]
Laura Berjano [email protected]
Paseo de la Castellana, 39 28046 Madrid (España) Tel: +34 91 595 10 00
+34 91 595 10 20 [email protected] [email protected]
Abertis website: www.abertis.com

2015 Results. 10 February 2016 26
Annex IV: Disclaimer The information and forward-looking statements contained in this presentation have not been verified by an independent entity and the accuracy, completeness or correctness thereof should not be relied on. In this regard, the persons to whom this presentation is delivered are invited to refer to the documentation
published or registered by Abertis with the Spanish stocks markets regulation (Comision Nacional del Mercado de Valores). All forecasts and other statements included in this presentation that are not statements of historical fact, including, without limitation, those regarding the financial position, business strategy, management plans and objectives for future operations of Abertis (which term includes its subsidiaries and investees), are forward-looking statements. These forward-looking statements involve known and unknown risks, uncertainties and other factors, which may cause actual results, performance or achievements of Abertis, or industry results, to be materially different from those expressed or implied
by these forward-looking statements. These forward-looking statements are based on numerous
assumptions regarding Abertis' present and future business strategies and the environment in which Abertis expect to operate in the future which may not be fulfilled. All forward looking statements and other statements herein speak only as of the date of this presentation. None of Abertis or any of its affiliates, advisors or representatives, nor any of their respective directors, officers, employees or agents, shall bear any liability (in negligence or otherwise) for any loss arising from any use of this presentation or its contents, or otherwise in connection herewith.
This distribution is addressed to analysts and to institutional or specialized investors only. The distribution of this presentation in certain other jurisdictions may be restricted by law. Consequently, persons to which this presentation or a copy of it is distributed must inform themselves about and observe such restrictions. By receiving this presentation you agree to observe those restrictions.
Nothing herein constitutes an offer to purchase and nothing herein may be used as the basis to enter into any contract or agreement.