restructuring bulong debt_3
DESCRIPTION
Debt restructuring of BulongTRANSCRIPT

“Restructuring Bulong’s Project Debt”
Subject : INFIN-II
Guidance of Prof. Pramod
Submitted by Abhishek Shah, Kumar Abhishek
4/1/2013

Q1. Why did Bulong default in Jan 2000? Was it a result of a flawed strategy, poor
execution, or bad luck? Were any of the factors that caused them to default foreseeable?
Preston acquired Bulong from Resolute in July 1998 for A$319 million. Preston revenues in
1998 were A$ 231,000, consolidated assets of A$ 29 million. Preston funded the A$319 million
by borrowing A$260.5 million from Barclays in the form of Bridge loan, issuing A$39.9 million
equity to Resolute, assuming A$11.1 million in liabilities, and paying A$7.5 million of cash on a
deferred basis. At the time, the contracts had a negative net value on a mark-to-market basis of
A$33 million, a liability that Preston assumed from Resolute.
The projections made by Bulong assumed average nickel price of US$3.25, which was too
optimistic seeing the present conditions and London Metal Exchange’s spot and forward prices
of Nickel. Pricing of Nickel as per CRU assumptions were $2.03 and $2.07 for initial couple of
years which is about 62% less than what assumed by Preston. Also there was an exchange rate
risk.
Also Preston became a highly leveraged firm after the buyout. In 1998 Preston D/V value was
37.1% which soared to 83.3% in 1999. In 2000, Preston’s value of assets plunged by more than
200% from (in A$ 000) A$367,839 to A$ 115,100 creating a negative equity position for
Preston. Preston cash reserves were a mere A$2,233,000 in 1998. Bulong management had
assumed that commissioning would be completed in December 1998, but it started in March
1999 to be again stopped in August because certain valves were limiting throughput. The semi-
annual interest payments of A$ 18.3 million on the project bond that Preston had issued in
December 1998, were to commence on June15, 1999. The note issue had left BOP with cash
reserves of A$66 million, in June 1999. With this cash reserve Bulong could make both required
interest payment in 1999, but it failed to replenish the DSRA in Jan 2000, as between July 1999
till May 2000, Bulong faced operation problem and was not able to produce. The actual revenues
in 2000 were 155% less than what was forecasted. The revenues generated were not sufficient to
make payments to employees and suppliers.
The forecasts that Preston used were that of Resolute. Resolute’s forecast was of processing
600,000 tons of ore annually to produce 8000 tons of nickel and 670 tons of cobalt. Preston
(Exhibit-10) in its forecast kept the ore processes to be 600,000 tons but increased Nickel-output
sold to 9000 tons and Cobalt-output sold to 750 tons. The Bulong deposit averaged only 1 per
cent nickel, compared with grades of 3 per cent being mined at Kambalda at the time. Also
financial assumptions for (US$/lb) assumed by Preston were $3.30 for Nickel & $15-$25/lb for
Cobalt, whereas as per CRU Nickel prices were at $2.03/lb and $8.74-22.56/lb for Cobalt. Thus
we can say operating as well as financial forecasts done by Preston were very optimistic.
Thus we can say that operating side of Bulong bleached into the financial side and since the
financial side was also not robust enough Bulong defaulted in Jan 2000.
Bulong’s default in Jan 2000 was due to the failure of interest payment and the DSRA account
replenishing.
Let’s try to understand this default from the Operations as well as financial side.

Financial Side analysis:
- Bridge loan of A$260.5mn was taken during acquisition of Bulong by Preston
- Preston raised a bond of A$185mn to clear off the bridge loan debt
- In Yr. 2000, the borrowings from bond issue and other were used to clear of the
Bridge loan debt
- The interest on the bond to be paid for the 1st year was A$42.78mn
Let’s look at the below tables which highlights the Sources and Uses of fund:
Diff 99-98 % Diff 00-99 %
Sources
Sources
Acc Payable $ 14,341 3% Acc Payable $ 40,293 5%
ST Borrowings $ 43,643 9% ST Borrowings $ 321,653 38%
Provisons $ 2,867 1% Other $ 123,992 15%
Other $ - 0% Share Capital $ 1,562 0%
Acc Payable $ 3,143 1% Cash $ 20,618 2%
LT Borrowings $ 279,964 57% Receivables $ 4,124 0%
Provisons $ 69,514 14% Inventories $ 1,799 0%
Share Capital $ 73,750 15% Other $ 3,722 0%
Receivables $ - 0%
Investments $ 268 0%
Total $ 487,222 PPE $ 252,739 30%
Exploration $ 33,729 4%
Uses
Other $ 44,451 5%
Cash $ 19,209 4% Total $ 848,950
Receivables $ 5,201 1% Uses
Inventories $ 10,741 2% Provisons $ 2,278 0%
Other $ 6,608 1% Acc Payable $ 1,045 0%
Receivables $ - 0% LT Borrowings $ 279,964 33%
Investments $ 159 0% Provisons $ 66,883 8%
PPE $ 367,582 75% Reserves $ 1,562 0%
Exploration $ 7,095 1% Accumulated Losses $ 497,219 59%
Other $ 46,805 10%
Reserves $ 525 0%
Accumulated Losses $ 23,295 5%
Total $ 487,220 $ 848,951
From the above table we can easily identify that the ST borrowings (i.e. Bond issued + other
borrowings) A$321.653mn were used to pay back the LT borrowing (i.e. Bridge loan) of
A$279.964mn (A$260.5 + interest accrued). So the majority of source of fund in Yr.2000 was
used to pay the borrowings.

Now consider the interest to be paid for the bond issued (US$185 mn); in below table –
A$ A$ A$ A$ A$ A$
Yr Sr. No Bond Issue 1st half 2nd half Interest at 1st half Interest at 2nd half Total interest
2000 1 291.85 277.26 262.67 17.33 16.42 33.75
2001 2 262.67 248.08 233.48 15.50 14.59 30.10
2002 3 233.48 218.89 204.30 13.68 12.77 26.45
2003 4 204.30 189.70 175.11 11.86 10.94 22.80
2004 5 175.11 160.52 145.93 10.03 9.12 19.15
2005 6 145.93 131.33 116.74 8.21 7.30 15.50
2006 7 116.74 102.15 87.56 6.38 5.47 11.86
2007 8 87.56 72.96 58.37 4.56 3.65 8.21
2008 9 58.37 43.78 29.19 2.74 1.82 4.56
2009 10 29.19 14.59 0.00 0.91 0.00 0.91
The 1st year interest payment is of A$ 33.75mn
Considering the operations side now we try to find whether the revenue generated was enough to
facilitate the interest amount;
From the Exhibit 5 of the case, the Operating Revenue in year 2000 is A$ 62.259mn; which on
deduction of expenses becomes A$ - 33.51mn! (Ref: Exhibit 5). This clearly shows that the Op.
rev of A$ 62.59mn cannot clear the interest payment of A$ 33.75mn
To meet the interest payment of A$ 33.75mn, an operating revenue of at least A$ 129.52mn is
required – which as per the revenue projection (Exhibit 9) should be A$ 159.022mn.
Also, if we try to adjust the interest rates to meet the revenue generated; still as the Op. Exp. are
so huge that the interest payment would not be made.
Now let’s consider the Business side analysis
Business Side analysis:
The main objective of Preston to acquire Bulong was to utilize Bulong’s operation cash flow in developing
Marlborough mine and also, to utilize the expertise at Bulong for Marlborough.
But, without having detailed examination on profitability/break even of mine – they directly considered it as a rare
opportunity!
Let’s examine the Break even analysis, based on the Exhibit 5, 10 & 11; we can conclude that the BEP production
volume in 2000 were very high than the existing production! (Please refer below table)
Op Exp 51427.7 A$ (000)
Co rev 7416.8 A$ (000)
Ni rev 44010.9 A$ (000)
BEP Ni prod 9602.2 ton
Act Ni prod 4006.4 ton From the above table; the BEP Ni production required is 9602.2ton against current production of 4006.4ton! Almost
140% reduction!

Now suppose we consider that the above situation was for that particular year 2000 only. So we try to find when it
will achieve BEP considering average production and average prices. Please find the below table showing average
production required per month and its relative expenses and revenue generated.
2000 2001 2002 Avg/mnth
Ni ton/mnth 364 529 544 479
Rev(A$)/mnth 1669 2279 2455 2135
Co ton/mnth 19 34 33 29
Rev(A$)/mnth 674 1061 849 862
Op exp(A$)/mnth 4675 6832 6735 6081 The above table is summarized as below:
Total Avg Ton Total Avg Rev Total Avg OpExp
Existing 508 2996 6081
Additional 523 3085 0
Required 1031 6081 6081
The above table tells us the whole story on the required production to meet BEP. Bulong will have to mine on a n
average of 1031ton of Ni+Co per month, i.e. around 12000ton per year!! Which when compared with their
projections too, it doesn’t match throughout the period.
Now suppose say, they will rise their commodity prices and recover the break even; but the markets won’t allow this
too! As the prices of Ni and Co is falling y-o-y.
Based on above analysis we can say that the strategy to go for Bulong itself was a flawed! And
they were bound to default with the flawed strategy backed by weak operations and a bleeding
financial side.
Q2. How did Preston try to resolve the default? Why has it been difficult to restructure the
debt?
- Preston tried to resolve the default by taking working capital loan of A$30mn from
Barclays
- Also, looked towards restructuring by issuing equity of A$75mn and considered a JV
proposal with Australian firm Anaconda Nickel Ltd.
If we try to restructure by issuing more equity; say A$ 75mn, then the new structure would look
as below:
Yr. 2000 Restructure
d= $ 375,296 $ 300,296
plus A$75mn e= $ 102,137 $ 177,137
v= $ 477,433 $ 477,433
d/v= 78.61% 62.9%
e/v= 21.4% 37.1%
Debt break up
Bond $291,853 $ 233,529
Borrowings $83,443 $ 66,767
Total $375,296 $ 300,296
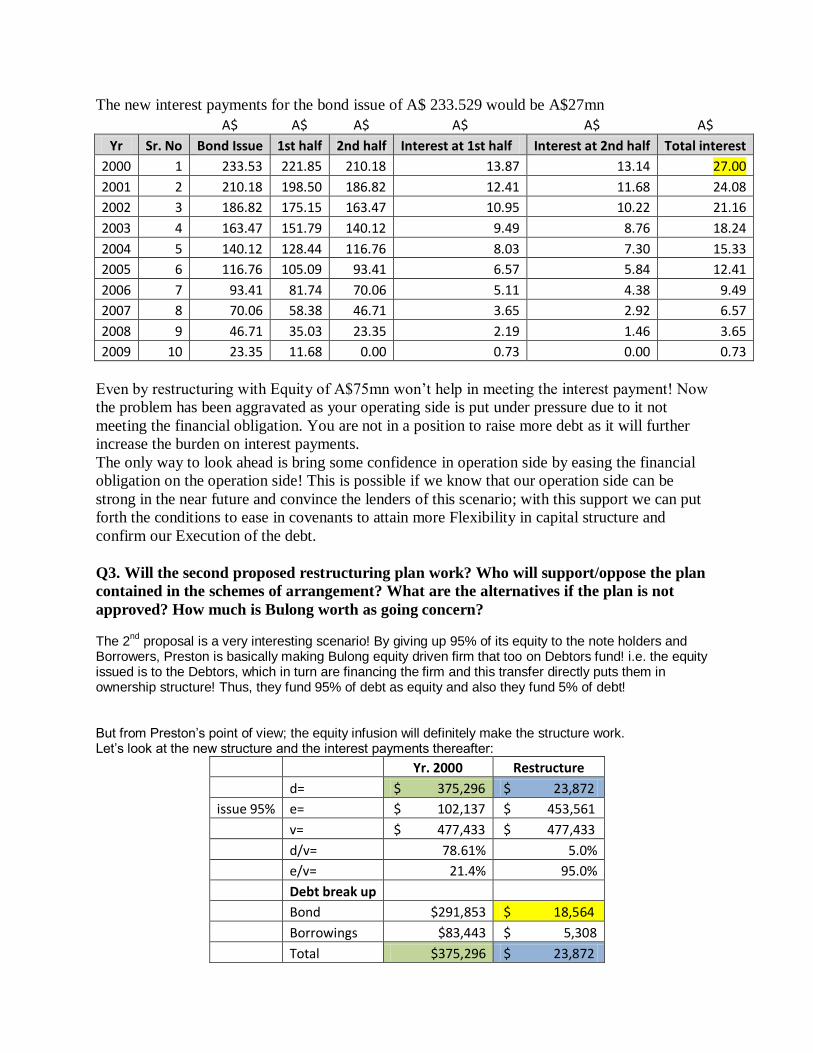
The new interest payments for the bond issue of A$ 233.529 would be A$27mn
A$ A$ A$ A$ A$ A$
Yr Sr. No Bond Issue 1st half 2nd half Interest at 1st half Interest at 2nd half Total interest
2000 1 233.53 221.85 210.18 13.87 13.14 27.00
2001 2 210.18 198.50 186.82 12.41 11.68 24.08
2002 3 186.82 175.15 163.47 10.95 10.22 21.16
2003 4 163.47 151.79 140.12 9.49 8.76 18.24
2004 5 140.12 128.44 116.76 8.03 7.30 15.33
2005 6 116.76 105.09 93.41 6.57 5.84 12.41
2006 7 93.41 81.74 70.06 5.11 4.38 9.49
2007 8 70.06 58.38 46.71 3.65 2.92 6.57
2008 9 46.71 35.03 23.35 2.19 1.46 3.65
2009 10 23.35 11.68 0.00 0.73 0.00 0.73
Even by restructuring with Equity of A$75mn won’t help in meeting the interest payment! Now
the problem has been aggravated as your operating side is put under pressure due to it not
meeting the financial obligation. You are not in a position to raise more debt as it will further
increase the burden on interest payments.
The only way to look ahead is bring some confidence in operation side by easing the financial
obligation on the operation side! This is possible if we know that our operation side can be
strong in the near future and convince the lenders of this scenario; with this support we can put
forth the conditions to ease in covenants to attain more Flexibility in capital structure and
confirm our Execution of the debt.
Q3. Will the second proposed restructuring plan work? Who will support/oppose the plan
contained in the schemes of arrangement? What are the alternatives if the plan is not
approved? How much is Bulong worth as going concern? The 2
nd proposal is a very interesting scenario! By giving up 95% of its equity to the note holders and
Borrowers, Preston is basically making Bulong equity driven firm that too on Debtors fund! i.e. the equity issued is to the Debtors, which in turn are financing the firm and this transfer directly puts them in ownership structure! Thus, they fund 95% of debt as equity and also they fund 5% of debt! But from Preston’s point of view; the equity infusion will definitely make the structure work. Let’s look at the new structure and the interest payments thereafter:
Yr. 2000 Restructure
d= $ 375,296 $ 23,872
issue 95% e= $ 102,137 $ 453,561
v= $ 477,433 $ 477,433
d/v= 78.61% 5.0%
e/v= 21.4% 95.0%
Debt break up
Bond $291,853 $ 18,564
Borrowings $83,443 $ 5,308
Total $375,296 $ 23,872

A$ A$ A$ A$ A$ A$
Yr Sr. No Bond Issue 1st half 2nd half Interest at 1st half Interest at 2nd half Total interest
2000 1 18.56 17.64 16.71 1.10 1.04 2.15
2001 2 16.71 15.78 14.85 0.99 0.93 1.91
2002 3 14.85 13.92 12.99 0.87 0.81 1.68
2003 4 12.99 12.07 11.14 0.75 0.70 1.45
2004 5 11.14 10.21 9.28 0.64 0.58 1.22
2005 6 9.28 8.35 7.43 0.52 0.46 0.99
2006 7 7.43 6.50 5.57 0.41 0.35 0.75
2007 8 5.57 4.64 3.71 0.29 0.23 0.52
2008 9 3.71 2.78 1.86 0.17 0.12 0.29
2009 10 1.86 0.93 0.00 0.06 0.00 0.06 The new bond issue would be of only A$18.56mn incurring an interest payment of A$2.15mn which is very much feasible to cover from operations! This structure will basically make the debtors to be the equity holders! There are chances of them (i.e. note holders and Barclays’) to resist against this; as they would be facing the whole risk of Bulong while Preston would be enjoying its Marlborough mines! But looking at the scenario, this option looks the best. As once the assets start generating revenue, the note holders and Barclays are in full position to sell off the assets and recover their funds. If the restructuring fails then it will ultimately lead to the liquidation of the Company, which again has its costs. Thus looking at the scenario the restructuring is best for both Preston as well as Barclays.
--x--