restaurant brands new zealand limited is a corporate franchisee that operates the … ·...
TRANSCRIPT


11
Restaurant Brands New Zealand Limited is a corporate franchisee that operates the New Zealand outlets of KFC, Pizza Hut and Starbucks Coffee.
These brands – three of the world’s most famous – are distinguished for their product, look, style and ambience, service and for the total experience they deliver to their customers in New Zealand and around the world.
Steady as she goes 13
CEO’s report 09
Chairman’s report 05
Year in review 02
Financial Highlights 0
3
KFC Operations 16
Board of directors 22 Consolidated income statement 2
Shareholder Information 63Statutory Information 65 Statement of corporate Governance 68
corporate Directory 71 Financial Calendar 72
Financial Statements 26
Pizza Hut Operations 18Starbucks coffee Operations 20

2
Group Net Profit After Tax (excluding non-trading items) was a record $25.1 million (25.6 cents per share), 26% up on prior year, as a result of improved profit performance across all three areas of the business.
Net Profit after Tax (including non-trading items) was $24.3 million (24.9 cents per share) compared to $19.5 million in 2009/2010.
Total store sales of $324.4 million were up $6.5 million (2.1%) on the previous year’s sales, with same store sales up 2.4%.
KFC store transformations and new store openings continued to drive group sales and profit growth and Pizza Hut store sales programme is now underway.
Strong operating cash flows resulted in further reductions in group debt to a record low of $12.2 million.
A final fully imputed dividend of 10.0 cents per share has been declared, making a full-year dividend of 17.0 cents, up 4.5 cents or 36% on prior year.
>
>
>
>
>
>
Year in review
TOTAL SALES($NZ MILLIONS)
“06 “07 “08 “09 “10 “11
316. 318.7 309.8 309. 317.8 32 .
“06 “07 “08 “09 “10 “11
5.0 37.0 .2 3.75 .9
61.9TOTAL STORE EBITDA($NZ MILLIONS)
“06 “07 “08 “09 “10 “11
109.3 117.7 112.0101.1 103.0
111.
TOTAL ASSETS($NZ MILLIONS)

3
Financial highlights
All figures in $NZM unless stated 2006 2007 2008 2009 2010 (1) 2011 (1)
Financial performanceSalesKFC 171.8 182.7 199.1 211.5 223.2 235.8Pizza Hut 89.1 79.7 71.4 64.6 64.2 59.3Starbucks Coffee 27.9 31.3 33.0 33.0 30.5 29.3Pizza Hut Victoria 27.6 25.0 6.3 0.3 - -Total 316.4 318.7 309.8 309.4 317.8 324.4Store EBITDAKFC 29.6 31.2 35.9 38.0 46.3 52.1Pizza Hut 11.8 5.1 4.4 2.8 5.4 5.6Starbucks Coffee 3.9 3.6 3.9 2.9 3.2 4.1Pizza Hut Victoria (0.3) (2.9) - - - -Total 45.0 37.0 44.2 43.7 54.9 61.9
EBIT 11.3 (1.1) 16.1 15.6 29.2 35.0NPAT (reported) 5.2 (3.6) 8.4 8.3 19.5 24.3NPAT (excluding non-trading) 12.3 6.5 10.4 11.7 19.9 25.1
Financial position/cash flowShare capital 25.6 25.6 25.6 25.6 25.8 26.6Total equity 43.9 32.6 35.2 37.1 48.7 58.9Total assets 109.3 117.7 112.0 101.1 103.0 111.4Operating cash flows 28.2 20.8 31.3 23.3 38.7 40.6
SharesShares on issue (year end) 97,081,875 97,128,956 97,128,956 97,128,956 97,280,005 97,762,866Number of shareholders (year end) 7,067 6,733 6,214 6,095 5,668 5,527Earnings per share (full year reported) 5.4c (3.7)c 8.6c 8.5c 20.1c 24.9cOrdinary dividend per share 10.0c 5.5c 6.5c 7.0c 12.5c 17.0c
OtherNumber of stores (year end)KFC 88 87 87 84 85 89Pizza Hut 107 103 97 93 91 82Starbucks Coffee 44 47 44 42 41 37Pizza Hut Victoria 50 23 1 - - -Total 289 260 229 219 217 208
Partners (employees) paid (year end) 6,787 5,949 4,957 4,526 4,735 4,374
Historical summary
Note: (1) Sales and store EBITDA for each of the concepts may not aggregate to the total due to rounding.
STRONG CASH FLOW PERFORMANCE

TED VAN ARKEL
S A T I S F 0 M E T E R
4

Chairman’s report
The profit improvement represents further enhancement to the significant “step up” in the company’s performance achieved last year, with a Net Profit after Tax (excluding non-trading items) of $25.1 million (25.6 cents per share). The 2010/11 result has shown the result achieved last year (2009/10) is sustainable.
We have seen, over the past two years, the results of a significant turnaround in the company’s operations. Increasingly Restaurant Brands is becoming a “well-oiled” machine with all parts of the company’s operations working effectively together to produce the bottom line results our shareholders want. This co-operation is the theme of this year’s annual report.
Group Operating Results
Net Profit after Tax (excluding non-trading items) for the year ended 28 February 2011 was $25.1 million (25.6 cents per share), up 26% from last year’s $19.9 million (20.5 cents per share).
Most of the improvement arose from another good year for the KFC brand, but the Pizza Hut and Starbucks Coffee businesses continued to contribute to overall profitability.
Net Profit after Tax (including non-trading items) was $24.3 million (24.9 cps) compared to $19.5 million (20.1 cps) in 2009/10.
Overall, the results continued to reflect the benefits of the major and ongoing KFC refurbishment programme of the last few years. Profit continued to climb in the first half of the year, but the rate of growth slowed in the second six months. Trading proved more challenging as the year progressed reflecting an increasingly difficult market, slowing sales growth and the challenge of comparisons with the very strong first half results from the prior year.
First half results (excluding non-trading items) were up $4.7 million on prior year with the second half only showing a $0.4 million improvement.
Total store earnings before interest, tax, depreciation and amortisation (EBiTDA) climbed $7.0 million (13%) to $61.9 million. This rise followed the $11.2 million growth in the prior year. KFC contributed $5.8 million of the improvement, Pizza Hut $0.2 million and Starbucks Coffee $0.9 million.
Total store sales of $324.4 million were up $6.5 million (2.1%) on the previous year’s sales. Same store sales for the group were up 2.4% (up 6.8% in 2009/10). KFC and Starbucks Coffee saw same store sales growth of 4.4% and 0.8% respectively, but Pizza Hut saw same store sales drop 3.8%.
Year end store numbers at 208 were nine down on February 2010. Five Pizza Hut stores were sold to franchisees as part of the progressive sell-down strategy. Three red roof (dine-in Pizza Hut stores) and one delco (delivery store) were closed. There were also four Starbucks Coffee stores closed. KFC opened four new stores over the year.
2010/11 was a very good year for Restaurant Brands. With a record profit performance and positive momentum across all three areas of its business, directors are well satisfied with the result.
NET PROFIT AFTER TAX (EXCLUDING NON-TRADING)up
25.8%
5

6
Cash Flow and Balance Sheet
The higher levels of store profitability lifted operating cash flows to $40.6 million, up $1.9 million on prior year.
Investing cash outflows were $20.4 million, up $7.2 million on the prior year. This reflected the increased rate of capital expenditure in the KFC business. A total of nine store transformations and four new KFC stores produced a gross cash outflow of $24.3 million, up $10.7 million on the previous year. Offsetting this was the positive inflow from store disposals of $4.3 million.
Financing cash outflows were down $5.2 million on prior year as higher dividends paid were more than offset by reduced loan repayments. The improved free cash flow position allowed us to further reduce total bank borrowings by $5.5 million over the year. This follows a $16.6 million reduction in 2009/10. Bank debt now stands at $12.2 million, well within reduced facility limits of $35 million. Following the two-year renewal of the facility with Westpac in 2010, bank debt has been reclassified as term debt in the accounts.
Total assets at $111.4 million were up $8.4 million on last year. The higher levels of KFC capital expenditure in the past 12 months accounted for a $9.2 million increase in fixed asset values. This was partially offset by a $1.6 million reduction in intangibles following a write down of Pizza Hut goodwill with store disposals.
Year end shareholders’ funds of $58.9 million reflect the higher levels of profitability over the year and some increase in issued capital ($0.8 million) on exercise of options.
The balance sheet is now very conservative with a gearing ratio of 17% (2010: 27%).
Christchurch Earthquake and Annual Shareholder’s Meeting
The major earthquake in Christchurch on 22 February 2011 had a significant impact on the company’s operations in that city. Although no staff were harmed, a number suffered considerable disruption to their personal lives. All nineteen of the company’s stores in the city were closed for some time.
The company response included: staff financial support over the store closure periods; a $100,000 donation (including $50,000 from Yum! Restaurants International) to the city’s relief fund and providing 18,000 pieces of chicken from the KFC Hornby store free to relief workers.
The company has insurance policies in place for both material damage and business interruption. Earthquake consequential losses are expected to be minimal.
The company has a policy of rotating the venue for its Annual Shareholders’ Meetings to locations outside of Auckland every second year. The 2011 annual meeting had been scheduled to be held in Christchurch. Directors have resolved to continue with that plan in support of the people of that city following the tragic earthquake in February.
Pizza Hut Franchise Sales
Following the appointment of a full time manager to drive the Pizza Hut store sales programme, five stores have been sold to individual franchisees in the latter half of the year. A similar number are expected to settle in the first half of the new financial year. The focus is on selling stores in regional areas where an independent franchisee can make a successful business on a smaller sales base with a more personal approach to running the store.
Dividend
The continuing improved performance of the company (with profit up 26% on prior year) and further substantial reductions in debt levels has provided the opportunity for an increased return to shareholders. On 7 April 2011 directors declared a final fully imputed dividend of 10.0 cents per share. This brought the total dividend for the year to 17.0 cents from 12.5 cents last year, an increase of 36%.
The dividend will be paid on 24 June 2011 to all shareholders on the register as at 10 June 2011. A supplementary dividend of 1.765 cents per share will also be paid to overseas shareholders on that date.
The dividend policy is to increase dividends commensurate with improvements in profitability but always with a view to considering the business’s requirement for reinvestment capital.
Board
Restaurant Brands has a small board which continues to work closely together and with management in overseeing the operations of the company.
Restaurant Brands’ directors have only received one increase in directors’ fees since the company was floated in 1997. An independent survey has confirmed that the current fee levels are below market for the size of the company. Accordingly directors will be seeking a modest increase in the directors’ fees pool from $220,000 to $250,000 a year. Further details are contained in the notice of meeting.
The directors take best practice governance seriously and are conscious of the need to continually refresh the board. To that end directors are seeking to make a further appointment to the board in the coming year.

7
People
The theme of this annual report is about all parts of the business working together effectively for a common goal. The kind of results we have seen this year can only come about by this focused co-operation across all areas of the business. The board acknowledges the continued skill and hard work of our staff at all levels.
New Brand
The board’s longer term strategy includes the introduction of a fourth brand at an appropriate time. Any such introduction will require significant analysis and a suitable economic environment, as well as the continued achievement of the strategic imperatives of the other three brands.
Some consideration has been given to some of these fourth brand options of which Taco Bell in the Yum! Restaurants’ stable is one; however no commitments have been entered into at this early stage.
Outlook
The 2010/11 financial year saw Restaurant Brands produce its best ever trading profit. The underlying performance of the company and its brands has lifted considerably over the past couple of years and directors believe that these levels of profitability are sustainable.
The latter half of the 2011 year, however, saw deterioration in trading conditions with a much softer retail environment. These trends were exacerbated by the change in GST rates and increasing petrol prices. The retail marketplace in the 2012 year will remain tough, with strong competition for an increasingly scarce consumer dollar. However, some improvement is expected as the year progresses, particularly with the Rugby World Cup taking place at the start of the third quarter of the financial year.
The company is well positioned to manage its way through the economic downturn. A strong management team and robust and increasingly efficient business processes are in place to maintain profitability through this tougher time, although any further increase in profitability will be very challenging.
The KFC brand still has considerable momentum driven by the ongoing benefits of its transformation project. The planned slowing in this expenditure in the 2011/12 year will give KFC the opportunity to stabilise its operations after the significant growth of the past couple of years. Four to five stores are currently targeted for transformation and one new store is planned.
Pizza Hut is also expected to face softer sales in the first half of the year, but then begin to return to same store growth. Continued focus on operating controls and the sale of smaller stores should see some small expansion in margin. Store sales to independent franchisees will continue with eight to ten stores expected to be sold over the coming year.
The Starbucks Coffee business is expected to maintain its steady sales growth trend. Margins may be squeezed somewhat with input cost increases, but these will be at least partially offset by improved operating controls.
Directors consider the 2011 profit performance to be very satisfactory. Restaurant Brands has demonstrated resilience in the recent tough economic environment, however the current trends mean taking a more cautious approach in looking at the year ahead.
Ted van Arkel Chairman

8
KFC NEW RECORD TOTAL SALES
$235.8MRUSSEL CREEDY

9
KFC
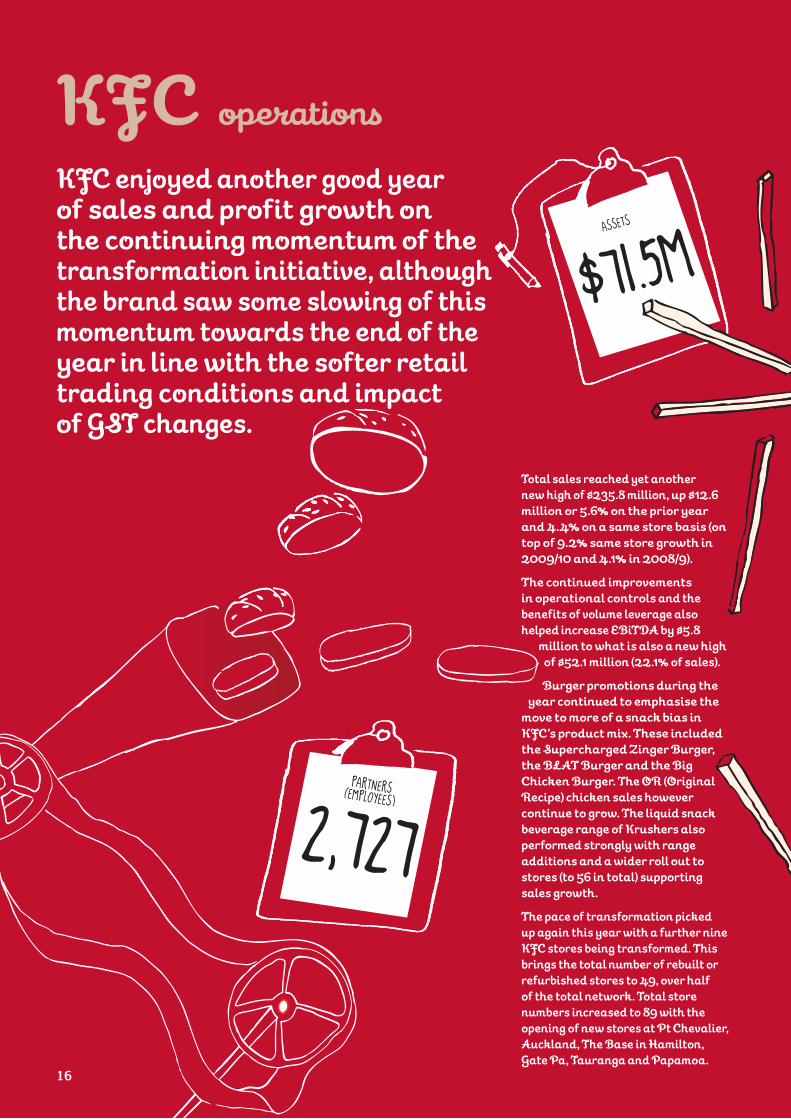
KFC enjoyed another good year of sales and profit growth on the continuing momentum of the transformation initiative. However, the brand saw some slowing of this momentum towards the end of the year in line with the softer retail trading conditions and impact of GST changes.
Total sales reached another new high of $235.8 million, up $12.6 million or 5.6% on the prior year and 4.4% on a same store basis (on top of 9.2% same store growth in 2009/10 and 4.1% in 2008/9).
Continued improvements in operational controls and the benefits of volume leverage helped increase EBiTDA by $5.8 million to $52.1 million (22.1% of sales). We also increased our investment in store support with increased resource devoted to internal audit, store operational reviews and support and management.
A number of new burger promotions during the year continued to underline the move to more of a snack bias in KFC’s product mix. These included the Supercharged Zinger Burger, the BLAT Burger and the Big Chicken Burger. The frozen Krushers beverage range continued to perform strongly with range additions and a wider roll out to stores (to 56 in total) supporting sales growth.
As flagged last year, we accelerated the pace of store transformation. We rebuilt a further nine KFC stores, bringing total rebuilt or refurbished stores to 49, representing more than half of the total network. Store numbers increased by four to 89 with the opening of new stores at Pt Chevalier, Auckland, The Base in Hamilton, Gate Pa, Tauranga and Papamoa.
Pizza Hut
Our plan for Pizza Hut for the year was to continue to build on the positive same store sales momentum seen in the back half of last year, while improving profit margins through further tightening of in-store controls and loss prevention activities. We did not manage to maintain the sales momentum, but profitability improved.
After a strong start, the Pizza Hut business lost some impetus in the last six months but it still managed to continue the trend begun in 2009/10 of improving profitability. EBiTDA was $5.6 million (9.5% of sales), up $0.2 million on the previous year’s $5.4 million (8.4% of sales).
Store disposals and closures, leading to lower depreciation charges, as well as lower general and administration expenses (G&A) meant a much more significant improvement in Pizza Hut EBiT of $1.2 million.
Lower sales revenue was largely a function of having nine less stores. As planned, five stores were sold to independent franchisees and four (including three red roof restaurants) were closed over the year. Year end store numbers were 82. The brand saw a drop back to negative same store sales of 3.8% for the full year with tougher trading conditions in the second half.
The release of the Big New Yorker pizza was a major sales driver. The successful Pizza Mia range was expanded and there were a number of new pizza flavour variants introduced. More 4 All was brought back as a limited time offer which also performed well for the business. Pizza Hut continues to rely heavily on coupon activity and discounting to bring in customers in a competitive environment.
Chief Executive’s reportIn 2009/10 we “lifted the bar” to a new level in terms of improved profit performance. In 2010/11 we retained and further built on those gains.Again the KFC story drove the profitability of the company, but I am pleased to report that the two other brands, Pizza Hut and Starbucks Coffee, also continued to “step up” their profit performance.

Starbucks Coffee
As we anticipated last year, the renewed focus on customer service and product innovation delivered a return to positive same store sales growth through the new year. We continued work on margin enhancement through more local sourcing, effective price increases and better labour and food cost controls.
Despite a drop in total revenues following store closures, Starbucks Coffee produced a solid earnings result reflecting cost reductions across all areas of expenditure. Continued improvements in operating controls and a favourable exchange rate contributed to improved margins. EBiTDA was a solid $4.1 million (14.0% of sales) up from the prior year’s $3.2 million (10.6% of sales).
Total sales of $29.3 million were down 3.8% on prior year, but on a same store basis were up 0.8%. We planned some store rationalisation of loss making stores and four of these stores were closed over the year at the end of their leases: Parnell, Onehunga and Ponsonby in Auckland and also Mid Lambton Quay in Wellington. Total store numbers stood at 37 at year end.
Corporate and Other Costs
G&A expenses (above store overheads) at $12.7 million were $0.2 million less than prior year and less than 4.0% of sales (2010: 4.1% of sales).
Group non-trading charges of $1.8 million included a pro rata write off of goodwill following Pizza Hut store disposals ($1.0 million), Pizza Hut and Starbucks Coffee store closure costs (mainly fixed asset write offs) of $0.8 million and KFC transformation write offs of $0.4 million.
Offsetting these charges were a number of credits, including a gain on disposal of a KFC sale and leaseback store and a gain on insurance recoveries.
A write down of fixed assets on the four closed stores in the central Christchurch business district following the recent earthquake resulted in a charge of $0.6 million, which has been fully offset by the estimated insurance recovery.
Depreciation charges at $12.6 million were $0.6 million up on the prior year reflecting increased capital expenditure in KFC, offset by lower charges in the other two brands with store closures and disposals.
Interest and funding costs at $1.2 million were down $0.3 million on prior year as the company benefited from lower debt levels. Bank interest rates (inclusive of margins and fees) for the year averaged 4.8% compared with 4.3% in 2009/10.
People
Restaurant Brands relies heavily on the continued support of competent and willing people out in its stores to deliver the sort of customer experiences that keep customers coming back.
We have many excellent operators amongst our 4,374 staff and much of the credit for this year’s strong result rests with them.
The company takes its obligations to its people seriously. We continue to invest in training and development of our staff and the health and safety of our employees is paramount in our business model. Consequently our accident rates continue to fall, with lost time injuries down 2.1% on the previous year.
Conclusion
The ongoing performance of Restaurant Brands rests first and foremost on its KFC business, which has enjoyed some excellent results in recent times. The challenges of rolling over the substantial levels of sales growth seen last year in the current economic environment will be substantial, but the company has the systems, processes and competencies to continue to deliver the kinds of results shareholders have come to expect.
Russel Creedy CEO
10

11
OPERATING
CASH FLOWS
$ 0.6M

12

What could be complicated about serving up some chicken wings, or a pizza, or even a cup of coffee? On the face of it, it sounds simple enough. The ever so slight complication is when you have to do it nearly 450,000 times in one week; and when the last coffee, the last pizza and that last chicken wing for the week is as fresh and delicious as the first.
Steady as she goes
13

That’s why we have to hand it to our 208 stores. They’re the engine rooms of our business. And during recent years, while Restaurant Brands has been restructuring its operations and making lots of changes, these engines have been busy working away keeping things firmly on track over the length of the country from Kaitaia to Invercargill.They know that every one of KFC’s 300,000 orders a week, Pizza Hut’s 56,000 and Starbucks’s 82,000, represents a moment of truth with the customer. That final reckoning, after all the different working parts of an expansive, complex, and synchronised operation come together, should create the perfect in-store experience. One that brings the customer back for more.
The continuous and constant commitment from everyone working in this well-oiled Restaurant Brands machine is mission critical. From the crew member on the
front counter to the support staff at head office, each participant in the system depends on the efficiency and effectiveness of another.
That’s because it’s all interconnected, and if one part falls out of sync with the others the downstream effect can impact the whole organisation. For example poor purchasing decisions will compromise quality of ingredients with consequent impact on providing the best product in the restaurants.
Restaurant Brands is an operator of franchise systems, which means the mechanics of food and beverage delivery are largely prescribed by the franchisors. Accordingly we apply these practices and procedures to the letter.
But the secret to getting the best performance and value out of the franchise is in the way we adapt and fine tune it to suit the local market. By constantly monitoring our market environment and making refinements and improvements to our operations, we can keep everything humming along in perfect time, perfectly tuned and in perfect balance.
This, we might add, is a state of affairs geared not only to optimising the experience for the customer but also to delivering a profitable outcome for the shareholder.
14

The key ingredient to our efficiency and effectiveness is teamwork. And the connectedness that good smooth, seamless teamwork relies upon to ensure the whole operation ticks along consistently delivering excellent quality food and dining experiences for the customer.
We employ 4,400 people and every one of them understands this. Take KFC.
Every front line crew member is part of a restaurant team responsible for preparing the chicken, cooking, cleaning, operating the equipment, serving the customer, packing the order, keeping supplies topped up.
Pitching in amongst them are the managers and the shift supervisors shuffling responsibilities, marshaling crew, and rolling up their sleeves too when the tempo picks up. All strive for precision in their respective operations; just the right number of crew at any one time – not too many, not too few. Efficiency through teamwork is the mantra.
At the next level, Area and Regional Managers maintain their constant watch, guiding the restaurant managers, monitoring resource and stock levels, and seeing that processes are followed.
The Operations support teams are always on-hand too, reviewing and fine-tuning systems to make them work even better. The Business Improvement Managers see to it that the internal operations, controls and customer delivery are at peak performance across all the variable inputs in our stores.
Internal audit officers check for any “leakages” in the system, training managers ensure that all staff in the stores are fully competent in their roles, safety managers keep hazards to a minimum to avoid injury and disruption, QA managers keep a close eye on food quality.
Meanwhile at Pizza Hut, delivering a pizza hot, delicious and fast to the customer’s door in less than 30 minutes relies on the dedicated call centre to handle all those customer orders. It’s one of the most recognised and most used 0800 numbers in the land, so there’s no slack there.
Back at head office – the support centre – we’ve an infrastructure focused on supporting the total team effort to create the perfect customer experience.
Marketing keeps customers salivating for our food and beverages so they come back again and again. Purchasing ensures the best quality ingredients are available in the right quantities and at the right price. HR meets all our training needs giving us the skills to keep us on top of our game.
And of course cash comes in and goes out. It’s like the fuel that keeps the big engine turning over. So Payroll and Finance work together to keep it topped up and flowing – to our staff and suppliers and, let’s not forget, the shareholders. And when the levels drop, they’re one of the first to call for action.
Meanwhile, Information Services monitors the internal and external influences on our business, processing and compiling the data to monitor and control the operation. That way everyone’s ready to respond swiftly to
anything that might require urgent attention.
That’s just about it. All to serve a cup of coffee and a muffin, some chicken wings, or a pizza. Simple really, when you know how.
And at the end of each day, we go home, rest and get up and do it all again the next day, and the day after that.
We have another week coming up, with a few hundred thousand people popping in. It’ll be just fine.
15
16
Total sales reached yet another new high of $235.8 million, up $12.6 million or 5.6% on the prior year and 4.4% on a same store basis (on top of 9.2% same store growth in 2009/10 and 4.1% in 2008/9).
The continued improvements in operational controls and the benefits of volume leverage also helped increase EBiTDA by $5.8
million to what is also a new high of $52.1 million (22.1% of sales).
Burger promotions during the year continued to emphasise the
move to more of a snack bias in KFC’s product mix. These included the Supercharged Zinger Burger, the BLAT Burger and the Big Chicken Burger. The OR (Original Recipe) chicken sales however continue to grow. The liquid snack beverage range of Krushers also performed strongly with range additions and a wider roll out to stores (to 56 in total) supporting sales growth.
The pace of transformation picked up again this year with a further nine KFC stores being transformed. This brings the total number of rebuilt or refurbished stores to 49, over half of the total network. Total store numbers increased to 89 with the opening of new stores at Pt Chevalier, Auckland, The Base in Hamilton, Gate Pa, Tauranga and Papamoa.
KFCKFC enjoyed another good year of sales and profit growth on the continuing momentum of the transformation initiative, although the brand saw some slowing of this momentum towards the end of the year in line with the softer retail trading conditions and impact of GST changes.
operations
ASSETS
$71.5M
2,727
16
PARTNERS (EMPLOYEES)
17
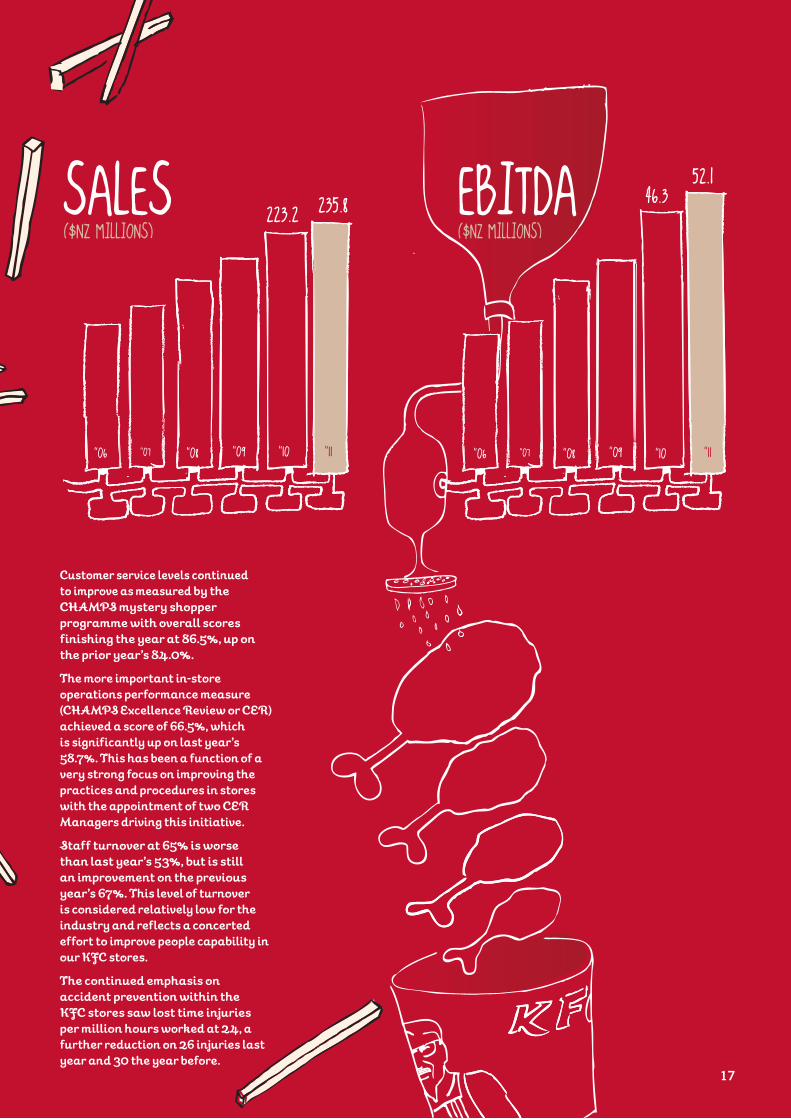
Customer service levels continued to improve as measured by the CHAMPS mystery shopper programme with overall scores finishing the year at 86.5%, up on the prior year’s 84.0%.
The more important in-store operations performance measure (CHAMPS Excellence Review or CER) achieved a score of 66.5%, which is significantly up on last year’s 58.7%. This has been a function of a very strong focus on improving the practices and procedures in stores with the appointment of two CER Managers driving this initiative.
Staff turnover at 65% is worse than last year’s 53%, but is still an improvement on the previous year’s 67%. This level of turnover is considered relatively low for the industry and reflects a concerted effort to improve people capability in our KFC stores.
The continued emphasis on accident prevention within the KFC stores saw lost time injuries per million hours worked at 24, a further reduction on 26 injuries last year and 30 the year before.
17
SALES($NZ MILLIONS)
235.8
“06 “07 “08 “09 “10 “11
EBITDA($NZ MILLIONS)
52.1
“06 “07 “08 “09 “10 “11
223.26.3

18
Pizza Hut operations
After a strong start to the year, the Pizza Hut business lost some impetus in the last six months, but still managed to continue the trend of improving profitability begun in 2009/10. EBiTDA was $5.6 million (9.5% of sales), up $0.2 million on the previous year’s $5.4 million (8.4% of sales).
59.3
“06 “07 “08 “09 “10 “11
5.6
“06 “07 “08 “09 “10 “11
18
SALES($NZ MILLIONS)
EBITDA($NZ MILLIONS)
6 .25.

19
Store disposals and closures meant lower depreciation charges, as well as lower general and administration expenses (G&A) producing a much more significant improvement in Pizza Hut EBiT of $1.2 million and the return of this brand to a “bottom line” profit.
Lower sales revenue of $59.3 million was largely a function of having nine less stores. Five stores were sold to independent franchisees and four (including three red roof restaurants) were closed over the year. Year end store numbers were 82. The brand saw a drop back to negative same store sales of 3.8% for the full year with tougher trading conditions in the second half.
New product releases over the year included the very successful Big New Yorker pizza, the successful Pizza Mia range was expanded and there were a number of new pizza flavour variants introduced. More 4 All was brought back as a limited time offer which also performed well for the business. Pizza Hut continues to rely heavily on coupon activity and discounting to continue to bring in customers in a competitive environment and addressing this dependency is part of the Pizza Hut strategy for the coming year.
Customer service levels as measured by the CHAMPS mystery shopper programme were 84.7%, a slight drop on last year’s 85.8%. These levels are considered more than comparable with the brand’s Australian counterparts.
The measure of internal store operational compliance (CER score) for the year, which is a key part of the strategy of improving store operations was 63%, significantly up on last year’s 53%.
Staff turnover at 74% was up on last year’s 55%, but reflects a high level of store closures and disposals.
Disappointingly, lost time injuries increased slightly over prior year with 11 claims per million hours compared with seven in the previous year, however total claims were marginally down on prior year.
The sale of regional stores to independent franchisees at an increased pace will again see store numbers and total sales decrease over the coming year, but margin improvement will continue. Restaurant Brands is now concentrating its pizza business around larger urban centres, whilst still overseeing a national presence for the Pizza Hut brand as the biggest operator in the country.
1,167
ASSETS
$27.3M
19
PARTNERS(EMPLOYEES)

20
Starbucks CoffeeDespite a drop in total revenues with some store closures, Starbucks Coffee produced a solid earnings result reflecting cost reductions across all areas of expenditure. Continued improvements in operating controls, a favourable exchange rate and some rationalisation of poorer performing stores all contributed to improved margins. EBiTDA was a solid $4.1 million (14.0% of sales) up from the prior year’s $3.2 million (10.6% of sales).
Total sales of $29.3 million were down 3.8% on prior year, but on a same store basis were up 0.8%. Four stores were closed over the year at the end of their leases: Parnell, Onehunga and Ponsonby in Auckland and also Mid Lambton Quay in Wellington. Total store numbers stood at 37 at year end.
Partner turnover at 75% was worse than last year’s 64%, but incorporates four store closures.
Accident levels were marginally up on prior year at seven per million hours worked, but total accident numbers for the year dropped from 21 to 17 this year.
For the new year Starbucks Coffee will continue the momentum of same store sales growth enjoyed in the second half of 2010/11, whilst building increased profitability around store margins. Some opportunities may be explored for further store growth.
operations
387
ASSETS
$6.7M
20
PARTNERS(EMPLOYEES)

21
29.3
“06 “07 “08 “09 “10 “11 “06 “07 “08 “09 “10 “11
21
EBITDA($NZ MILLIONS)
SALES($NZ MILLIONS) .1
30.5
3.2

22
Eduard (Ted) Koert van Arkel FNZIM Chairman
Mr van Arkel has been a professional director since retiring from the position of Managing Director of Progressive Enterprises Limited in November 2004. He joined the board in September that year and was elected chairman in July 2006. Mr van Arkel currently serves as Chairman of Charlie’s Group Limited, Unitec New Zealand Limited, Colorite Group Limited and Health Benefits Limited. He is also a director of NZX listed companies AWF Group Limited (previously known as Allied Work Force Group Limited) and Postie Plus Group Limited. Mr van Arkel is also a Director of Nestle NZ Limited, as well as a Director of the following private companies: Danske Mobler Limited and Lockwood Group Limited. Mr van Arkel is a director of the Auckland Regional Chamber of Commerce & Industry Limited and is a director of his family-owned companies Lang Properties Limited and Van Arkel & Co Limited. Mr van Arkel sits on the board’s audit committee and remuneration committee.
Danny Diab FAICD, Dip CD, Dip CM, FICM Director
Mr Diab was appointed to the board in October 2002 and is based in Australia where he owns and operates a number of Pizza Hut restaurants in Sydney in addition to other business interests. He has more than 23 years’ experience in the pizza industry and is regarded as one of the leading Pizza Hut franchisees in Australia. He is currently president of the Australasian Pizza Association Inc. and a director of the Pizza Hut Advertising Co-Operative Australia. Mr Diab sits on the board’s remuneration and audit committees.
23
David A Pilkington BSc, BE(Chem), Dip Dairy Sci & Tech Director
The former Managing Director of New Zealand Milk Limited, Mr Pilkington is also Chairman of Prevar Limited, Ruapehu Alpine Lifts Limited and Hellers Limited. He is also a director of Douglas Pharmaceuticals Limited, Ballance Agri-Nutrients Limited, Port of Tauranga Limited, Rangatira Limited and Zespri Group Limited. Mr Pilkington is also a shareholder and director of NZ Biotechnologies Limited and his own consulting company, Excelsa Associates Limited. He is an independent appointee to the Wellington City Council Audit and Risk Management Sub-Committee and a trustee for the New Zealand Community Trust. Mr Pilkington was appointed to the board in July 2004 and chairs the board’s audit committee. He also sits on the board’s remuneration committee.
Sue H Suckling B.Tech (Hons), M.Tech (Hons), OBE Director
Ms Suckling is a professional director with over 20 years governance experience with public and private companies. She was appointed to the board in June 2006. She is currently Chairperson of the New Zealand Qualifications Authority, Barker Fruit Processors Limited, HSR Governance Limited, ECL Group Limited, Carter Price Rennie Limited and Annah Stretton Clothing Limited (and associated companies). She is a director of TYTM Development Limited, Oxford Health Group Limited, Oxford Clinic Hospital Limited and Acemark Holdings Limited, and a member of the Takeovers Panel. She is on the Restaurant Brands audit and remuneration committees.

24
$NZ000’s
28 February 2011
Audited vs Prior %
28 February 2010
Audited
Continuing operations:SalesKFC 235,805 5.6 223,228Pizza Hut 59,266 (7.6) 64,158
Starbucks Coffee 29,313 (3.8) 30,463Total sales 324,384 2.1 317,849Other revenue 516 4.2 495Total operating revenue 324,900 2.1 318,344Cost of goods sold (256,746) (0.6) (255,136)Gross margin 68,154 7.8 63,208Distribution expenses (3,461) 8.5 (3,781)Marketing expenses (15,204) 9.0 (16,716)General and administration expenses (12,743) 1.6 (12,945)EBIT before non-trading 36,746 23.4 29,766Non-trading (2,047) (266.8) (558)EBIT 34,699 18.8 29,208Interest income 11 (65.6) 32Interest expense (1,182) 19.8 (1,474)Net profit before tax 33,528 20.8 27,766Taxation expense (9,511) (15.6) (8,230)Net profit after tax (NPAT) from continuing operations 24,017 22.9 19,536
Discontinued operation:Profit from discontinued operation net of tax * 295 100.0 -Total profit after tax (NPAT) 24,312 24.4 19,536Total NPAT excluding non-trading 25,072 25.8 19,926
% sales % sales
EBITDA before G&AKFC 52,125 22.1 12.7 46,268 20.7Pizza Hut 5,637 9.5 4.3 5,403 8.4Starbucks Coffee 4,104 14.0 27.3 3,224 10.6Total 61,866 19.1 12.7 54,895 17.3
RatiosNet tangible assets per security (net tangible assets divided by number of shares) in cents 37.6c 25.6c
Consolidated income statement
* Pizza Hut Victoria is a discontinued operation.Cost of goods sold are direct costs of operating stores: food, paper, freight, labour and store overheads.Distribution expenses are costs of distributing product from store.Marketing expenses are call centre, advertising and local store marketing expenses.General and administration expenses (G&A) are non-store related overheads.
24

25
The Directors are pleased to present the Financial Statements of Restaurant Brands New Zealand Limited for the year ended 28 February 2011 contained on pages 26 to 61.
For and on behalf of the Board of Directors:
E K van ArkelChairman
7 April 2011
D A PilkingtonDirector
7 April 2011
26 Statements of Comprehensive Income
27 Statements of Changes in Equity
29 Statements of Financial Position
30 Statements of Cash Flows
31 Notes to and forming part of the Financial Statements
62 Auditors’ Report
63 Shareholder Information
65 Statutory Information
68 Statement of Corporate Governance
25
26
Group Company
$NZ000's Note 2011 2010 2011 2010
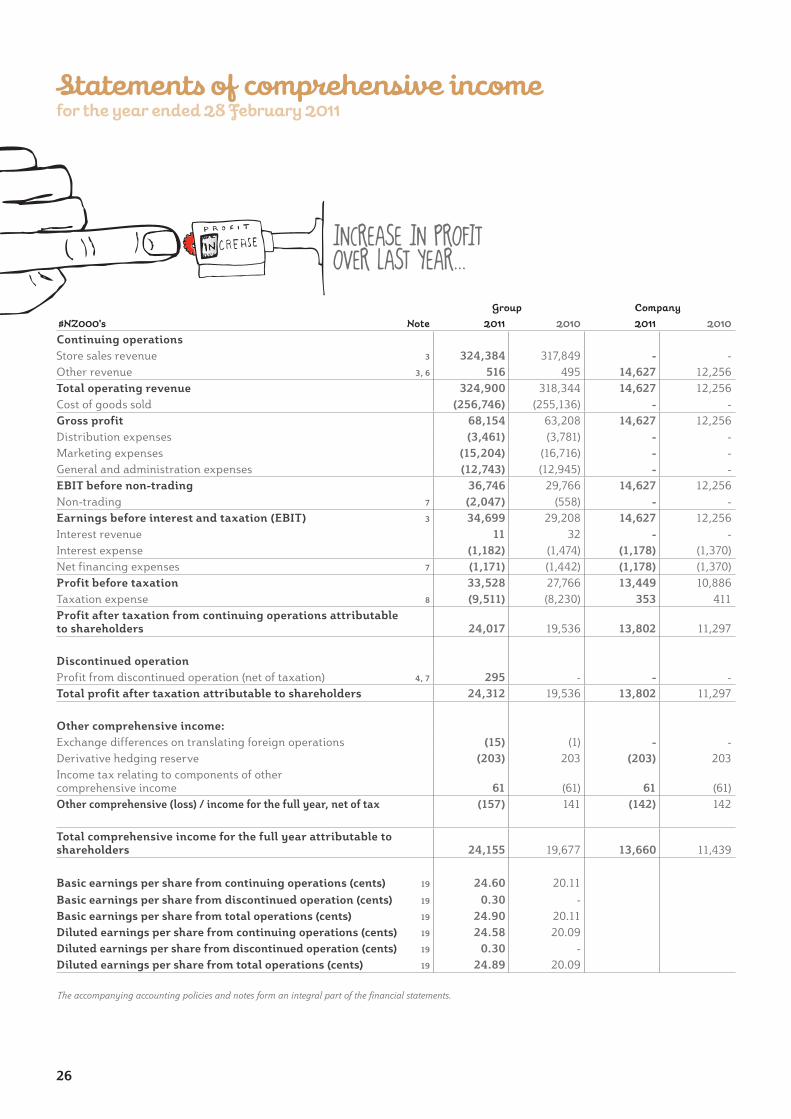
Continuing operationsStore sales revenue 3 324,384 317,849 - -Other revenue 3, 6 516 495 14,627 12,256Total operating revenue 324,900 318,344 14,627 12,256Cost of goods sold (256,746) (255,136) - -Gross profit 68,154 63,208 14,627 12,256Distribution expenses (3,461) (3,781) - -Marketing expenses (15,204) (16,716) - -General and administration expenses (12,743) (12,945) - -EBIT before non-trading 36,746 29,766 14,627 12,256Non-trading 7 (2,047) (558) - -Earnings before interest and taxation (EBIT) 3 34,699 29,208 14,627 12,256Interest revenue 11 32 - -Interest expense (1,182) (1,474) (1,178) (1,370)Net financing expenses 7 (1,171) (1,442) (1,178) (1,370)Profit before taxation 33,528 27,766 13,449 10,886Taxation expense 8 (9,511) (8,230) 353 411Profit after taxation from continuing operations attributable to shareholders 24,017 19,536 13,802 11,297
Discontinued operationProfit from discontinued operation (net of taxation) 4, 7 295 - - -Total profit after taxation attributable to shareholders 24,312 19,536 13,802 11,297
Other comprehensive income:Exchange differences on translating foreign operations (15) (1) - -Derivative hedging reserve (203) 203 (203) 203Income tax relating to components of other comprehensive income 61 (61) 61 (61)Other comprehensive (loss) / income for the full year, net of tax (157) 141 (142) 142
Total comprehensive income for the full year attributable to shareholders 24,155 19,677 13,660 11,439
Basic earnings per share from continuing operations (cents) 19 24.60 20.11Basic earnings per share from discontinued operation (cents) 19 0.30 -Basic earnings per share from total operations (cents) 19 24.90 20.11Diluted earnings per share from continuing operations (cents) 19 24.58 20.09Diluted earnings per share from discontinued operation (cents) 19 0.30 -Diluted earnings per share from total operations (cents) 19 24.89 20.09
Statements of comprehensive incomefor the year ended 28 February 2011
The accompanying accounting policies and notes form an integral part of the financial statements.
INCREASE IN PROFIT OVER LAST YEAR...

27
Statements of changes in equityfor the year ended 28 February 2011
The accompanying accounting policies and notes form an integral part of the financial statements.
Group $NZ000's Note Share capitalShare option
reserve
Foreign currency
translation reserve
Derivative hedging reserve
Retained earnings Total
Balance as at 28 February 2009 25,622 79 69 - 11,292 37,062
Comprehensive incomeTotal profit after taxation attributable to shareholders - - - - 19,536 19,536
Other comprehensive incomeMovement in foreign currency translation reserve - - (1) - - (1)Movement in derivative hedging reserve - - - 142 - 142 Total other comprehensive income - - (1) 142 - 141
Total comprehensive income - - (1) 142 19,536 19,677
Transactions with ownersShares issued on exercise of options 18 199 (11) - - - 188 Net dividends distributed 17 - - - - (8,257) (8,257)Total transactions with owners 199 (11) - - (8,257) (8,069)
Balance as at 28 February 2010 16, 18 25,821 68 68 142 22,571 48,670
Comprehensive incomeTotal profit after taxation attributable to shareholders - - - - 24,312 24,312
Other comprehensive incomeMovement in foreign currency translation reserve - - (15) - - (15)Movement in derivative hedging reserve - - - (142) - (142)Total other comprehensive income - - (15) (142) - (157)
Total comprehensive income - - (15) (142) 24,312 24,155
Transactions with ownersShares issued on exercise of options 18 755 (35) - - - 720 Net dividends distributed 17 - - - - (14,650) (14,650)Total transactions with owners 755 (35) - - (14,650) (13,930)
Balance as at 28 February 2011 16, 18 26,576 33 53 - 32,233 58,895
TOTAL EQUITY INCREASED AND A HIGHER DIVIDEND PAYMENT TO SHAREHOLDERS

28
Company $NZ000's Note Share capitalShare option
reserve
Foreign currency
translation reserve
Derivative hedging reserve
Retained deficit Total
Balance as at 28 February 2009 25,622 79 - - (27,455) (1,754)
Comprehensive income
Profit after taxation attributable to shareholders - - - - 11,297 11,297
Other comprehensive incomeMovement in derivative hedging reserve - - - 142 - 142 Total other comprehensive income - - - 142 - 142
Total comprehensive income - - - 142 11,297 11,439
Transactions with ownersShares issued on exercise of options 18 199 (11) - - - 188 Net dividends distributed 17 - - - - (8,257) (8,257)Total transactions with owners 199 (11) - - (8,257) (8,069)
Balance as at 28 February 2010 16, 18 25,821 68 - 142 (24,415) 1,616
Comprehensive income
Profit after taxation attributable to shareholders - - - - 13,802 13,802
Other comprehensive incomeMovement in derivative hedging reserve - - - (142) - (142)Total other comprehensive income - - - (142) - (142)
Total comprehensive income - - - (142) 13,802 13,660
Transactions with ownersShares issued on exercise of options 18 755 (35) - - - 720 Net dividends distributed 17 - - - - (14,650) (14,650)Total transactions with owners 755 (35) - - (14,650) (13,930)
Balance as at 28 February 2011 16, 18 26,576 33 - - (25,263) 1,346
Statements of changes in equity (continued)for the year ended 28 February 2011
The accompanying accounting policies and notes form an integral part of the financial statements.

29
The accompanying accounting policies and notes form an integral part of the financial statements.
Statements of financial positionas at 28 February 2011
Note
Group Company
$NZ000's 2011 2010 2011 2010
Non-current assetsProperty, plant and equipment 9 82,565 73,365 - -Investments in subsidiaries 11 - - 150,396 150,396Intangible assets 10 22,173 23,773 - -Deferred tax asset 12 1,553 1,074 - -Total non-current assets 106,291 98,212 150,396 150,396Current assetsInventories 13 1,789 1,822 - -Other receivables 14, 26 2,477 1,907 - -Cash and cash equivalents 26 795 826 39 92Derivative financial instruments 15, 26 - 203 - 203Total current assets 5,061 4,758 39 295Total assets 111,352 102,970 150,435 150,691Equity attributable to shareholdersShare capital 18 26,576 25,821 26,576 25,821Reserves 86 278 33 210Retained earnings / (deficit) 32,233 22,571 (25,263) (24,415)Total equity attributable to shareholders 58,895 48,670 1,346 1,616 Non-current liabilitiesProvisions and deferred income 22 5,957 5,543 - -Loans and finance leases 20, 26 12,398 79 12,210 -Total non-current liabilities 18,355 5,622 12,210 -Current liabilitiesIncome tax payable 2,753 3,689 - -Loans and finance leases 20, 26 109 17,862 - 17,670Creditors and accruals 21, 26 29,449 25,445 75 119Provisions and deferred income 22 1,620 1,371 - -Amounts payable to subsidiary companies 26, 28 - - 136,647 131,286Derivative financial instruments 15, 26 157 - 157 -Liabilities associated with assets classified as held for sale 5, 26 14 311 - -Total current liabilities 34,102 48,678 136,879 149,075Total liabilities 52,457 54,300 149,089 149,075
Total equity and liabilities 111,352 102,970 150,435 150,691
DEBT LEVELS SIGNIFICANTLY REDUCED OVER THE YEAR
The accompanying accounting policies and notes form an integral part of the financial statements.
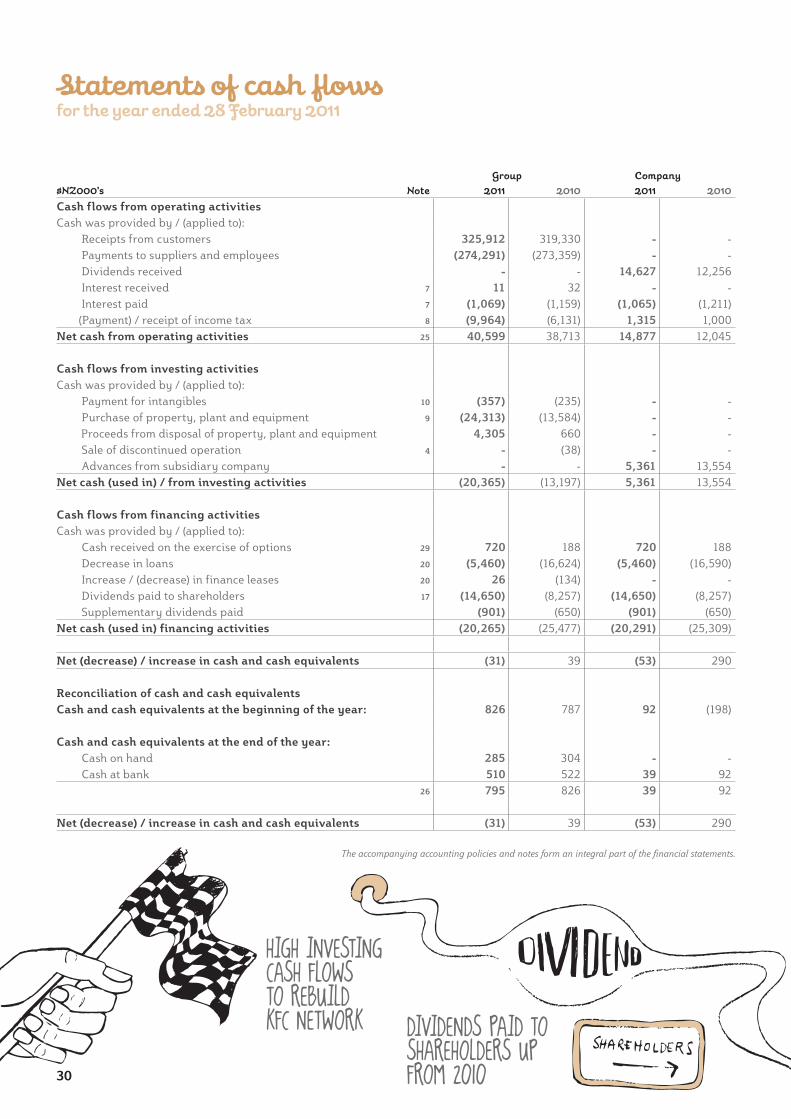
Statements of cash flowsfor the year ended 28 February 2011
NoteGroup Company
$NZ000's 2011 2010 2011 2010
Cash flows from operating activitiesCash was provided by / (applied to): Receipts from customers 325,912 319,330 - - Payments to suppliers and employees (274,291) (273,359) - - Dividends received - - 14,627 12,256 Interest received 7 11 32 - - Interest paid 7 (1,069) (1,159) (1,065) (1,211) (Payment) / receipt of income tax 8 (9,964) (6,131) 1,315 1,000Net cash from operating activities 25 40,599 38,713 14,877 12,045
Cash flows from investing activitiesCash was provided by / (applied to): Payment for intangibles 10 (357) (235) - - Purchase of property, plant and equipment 9 (24,313) (13,584) - - Proceeds from disposal of property, plant and equipment 4,305 660 - - Sale of discontinued operation 4 - (38) - - Advances from subsidiary company - - 5,361 13,554Net cash (used in) / from investing activities (20,365) (13,197) 5,361 13,554
Cash flows from financing activitiesCash was provided by / (applied to): Cash received on the exercise of options 29 720 188 720 188 Decrease in loans 20 (5,460) (16,624) (5,460) (16,590) Increase / (decrease) in finance leases 20 26 (134) - - Dividends paid to shareholders 17 (14,650) (8,257) (14,650) (8,257) Supplementary dividends paid (901) (650) (901) (650)Net cash (used in) financing activities (20,265) (25,477) (20,291) (25,309)
Net (decrease) / increase in cash and cash equivalents (31) 39 (53) 290
Reconciliation of cash and cash equivalentsCash and cash equivalents at the beginning of the year: 826 787 92 (198)
Cash and cash equivalents at the end of the year: Cash on hand 285 304 - - Cash at bank 510 522 39 92
26 795 826 39 92
Net (decrease) / increase in cash and cash equivalents (31) 39 (53) 290
DIVIDENDS PAID TO SHAREHOLDERS UP FROM 2010
HIGH INVESTING CASH FLOWS TO REBUILD KFC NETWORK
30

31
1. General informationRestaurant Brands New Zealand Limited (“Company” or “Parent”), together with its subsidiaries (the “Group”), operate quick service and takeaway restaurant concepts.
The Company is a limited liability company incorporated and domiciled in New Zealand. The address of its registered office is Level 3, Westpac Building, Central Park, 666 Great South Road, Penrose, Auckland.
The financial statements were authorised for issue on 7 April 2011 by the Board of Directors who do not have the power to amend after issue.
2. Summary of significant accounting policiesThe principal accounting policies adopted in the preparation of the consolidated financial statements are set out below. These policies have been consistently applied to all the years presented, unless otherwise stated.
Basis of preparationThe consolidated financial statements have been prepared in accordance with New Zealand Generally Accepted Accounting Practice (“NZ GAAP”). They comply with New Zealand equivalents to International Reporting Standards (“NZ IFRS”), and other applicable Financial Reporting Standards, as appropriate for profit-oriented entities. The financial statements comply with International Financial Reporting Standards (“IFRS”).
The consolidated financial statements are presented in New Zealand dollars, rounded where necessary to the nearest thousand dollars. The Group divides its financial year into 13 four-week periods. The 2011 full year results are for 52 weeks (2010: 52 weeks).
Entities reportingThe financial statements for the Group are the consolidated financial statements comprising the economic entity Restaurant Brands New Zealand Limited and its subsidiaries. The financial statements of the Parent are for the Company as a separate legal entity.
The Parent and the Group are designated as profit-oriented entities for financial reporting purposes.
Statutory baseThe Company is listed on the New Zealand Stock Exchange (“NZX”). It is registered under the Companies Act 1993 and is an issuer in terms of the Financial Reporting Act 1993. The financial statements have been prepared in accordance with the requirements of the Financial Reporting Act 1993 and the Companies Act 1993.
Historical cost conventionThe consolidated financial statements have been prepared on the historical cost convention, except for financial derivatives which are stated at their fair value and are discussed further below.
Critical accounting estimatesThe preparation of financial statements requires management to make judgments, estimates and assumptions that affect the application of accounting policies and the reported amounts of assets, liabilities, income and expenses. Actual results may differ from these estimates.
The estimates and assumptions that have a significant risk of causing material adjustment to the carrying value of assets and liabilities within the next financial year are addressed below.
(i) Goodwill impairmentAs disclosed in Note 10, the Group undertook impairment testing of its operating divisions. Note 10 sets out the key assumptions used to determine the recoverable amount along with a sensitivity analysis.
(ii) Income taxThere are many transactions and calculations for which the ultimate tax determination is uncertain during the ordinary course of business. The Group recognises liabilities for anticipated tax audit issues based on estimates of whether additional taxes will be due. Where the final tax outcome of these matters is different from the amounts that were initially recorded, such differences will impact the income tax and deferred tax provisions in the period in which such determination is made.
Estimates and underlying assumptions are reviewed on an ongoing basis. Revisions to accounting estimates are recognised in the period in which the estimate is revised and in any future periods affected.
Notes to and forming part of the financial statements for the year ended 28 February 2011

32
(a) Basis of consolidation Subsidiaries are entities controlled by the Group. Control exists when the Group has the power to govern the financial and operating policies of an entity so as to obtain benefits from its activities. In assessing control, potential voting rights that presently are exercisable are taken into account. The financial statements of subsidiaries are included in the consolidated financial statements from the date that control commences until the date that control ceases.
The purchase method of accounting is used to account for the acquisition of subsidiaries by the Group. The cost of an acquisition is measured as the fair value of the assets given, equity instruments issued and liabilities incurred or assumed at the date of exchange, plus costs directly attributable to the acquisition. Identifiable assets acquired and liabilities and contingent liabilities assumed in a business combination are measured initially at their fair values at the acquisition date, irrespective of the extent of any minority interest. The excess of the cost of acquisition over the fair value of the Group’s share of the identifiable net assets acquired is recorded as goodwill. If the cost of acquisition is less than the fair value of the net assets of the subsidiary acquired, the difference is recognised directly in the statement of comprehensive income.
Intra-group balances and profits resulting from intra-group transactions are eliminated in preparing the consolidated financial statements.
(b) Foreign currency translationForeign currency transactions are translated into the functional currency using the exchange rates prevailing at the dates of the transactions or valuation where items are remeasured. Foreign exchange gains and losses resulting from the settlement of such transactions and from the translation at year end exchange rates of monetary assets and liabilities denominated in foreign currencies are recognised in the statement of comprehensive income. Amounts qualifying as cash flow hedges and qualifying net investment hedges are also recognised in the statement of comprehensive income.
The assets and liabilities of foreign operations, including goodwill and fair value adjustments arising on acquisition, are translated to New Zealand dollars at exchange rates at the reporting date. The income and expenses of foreign operations are translated to New Zealand dollars at exchange rates at the dates of the transactions.
Exchange differences arising from the translation of the net investment in foreign operations are recognised in the foreign currency translation reserve and are released to the statement of comprehensive income upon disposal.
(c) Financial instrumentsA financial instrument is recognised when the Group becomes a party to the contractual provisions of the instrument. Financial assets are derecognised when the Group’s contractual rights to the cash flows from the financial assets expire or when the Group transfers the financial asset to another party without retaining control or substantially all risks and rewards of the asset. Regular way purchases and sales of financial assets are accounted for at trade date, i.e. the date that the Group commits itself to purchase or sell the asset. Financial liabilities are derecognised when the Group’s obligations specified in the contract expire or are discharged or cancelled.
Non-derivative financial instrumentsNon-derivative financial instruments comprise trade and other receivables, which are initially recognised at fair value plus transaction costs and subsequently measured at amortised cost, cash and cash equivalents, loans and borrowings (initially recognised at fair value plus transaction costs and subsequently measured at amortised cost), and trade and other payables which are initially recognised at fair value and subsequently measured at amortised cost.
Non-derivative financial instruments are recognised initially at fair value plus any directly attributable transaction costs.
Derivative financial instrumentsThe Group has various derivative financial instruments to manage the exposures that arise due to movements in foreign currency exchange rates and interest rates arising from operational, financing and investment activities. The Group does not hold derivative financial instruments for trading purposes. However, derivatives that do not qualify for hedge accounting are accounted for at fair value through the profit or loss. Embedded derivatives are separated from the host contract and accounted for separately if the economic characteristics and risks of the host contract and the embedded derivative are not closely related. A separate instrument with the same terms as the embedded derivative would meet the definition of a derivative, and the combined instrument is not measured at fair value through profit or loss.
Notes to and forming part of the financial statements for the year ended 28 February 2011

33
Derivatives are recognised initially at fair value and attributable transaction costs are recognised in profit or loss when incurred. Subsequent to initial recognition, derivatives are measured at fair value and changes therein are accounted for as described below.
The fair value of forward exchange contracts is estimated by discounting the difference between the contractual forward price and the current forward price for the residual maturity of the contract using a risk-free interest rate (based on government bonds). The fair value of interest rate swaps is based on broker quotes. Those quotes are tested for reasonableness by discounting estimated future cash flows based on the terms and maturity of each contract and using market interest rates for a similar instrument at the measurement date.
Fair value hierarchyThe Group uses the following hierarchy for determining and disclosing the fair value of financial instruments by valuation technique:
Level 1: quoted (unadjusted) prices in active markets for identical assets or liabilities
Level 2: other techniques for which all inputs which have a significant effect on the recorded fair value are observable, either directly or indirectly
Level 3: techniques which use inputs which have a significant effect on the recorded fair value that are not based on observable market data.
Cash flow hedgesChanges in the fair value of the derivative hedging instrument designated as a cash flow hedge are recognised directly in equity to the extent that the hedge is effective. To the extent that the hedge is ineffective, changes in fair value are recognised in profit or loss.
If the hedging instrument no longer meets the criteria for hedge accounting, expires or is sold, terminated or exercised, then hedge accounting is discontinued prospectively. The cumulative gain or loss previously recognised in equity remains there until the forecast transaction occurs. When a forecast transaction is no longer expected to occur, the cumulative gain or loss that was reported in equity is immediately transferred to profit or loss. When the hedged item is a non-financial asset, the amount recognised in equity is transferred to the carrying amount of the asset when it is recognised. In other cases the amount recognised in equity is transferred to profit or loss in the same period that the hedged item affects profit or loss.
(d) Revenue recognitionGoods sold and services renderedRevenue from the sale of goods is measured at the fair value of the consideration received or receivable, net of returns and allowances, discounts and volume rebates. Revenue is recognised when the significant risks and rewards of ownership have been transferred to the buyer, recovery of the consideration is probable, the associated costs of possible return of goods can be estimated reliably and there is no continuing management involvement with the goods. Other revenue represents sales of services and is recognised in the accounting period in which the services are rendered, by reference to completion of the specific transaction assessed on the basis of the actual service provided as a proportion of the total services to be provided.
Dividend incomeDividend income is recognised when the right to receive payment is established.
Interest revenueInterest revenue is recognised on a time proportion basis using the effective interest method.
GrantsA grant is recognised in the statement of financial position initially as deferred income when there is reasonable assurance that it will be received and that the Group will comply with the conditions associated with the grant, and subsequently recognised in the statement of comprehensive income when the requirements under the grant have been met. Grants that compensate the Group for the cost of an asset are recognised in the statement of comprehensive income on a systematic basis over the useful life of the asset.
Notes to and forming part of the financial statements for the year ended 28 February 2011

34
(e) Net financing costsNet financing costs comprise: interest payable on borrowings calculated using the effective interest rate method; interest received on funds invested calculated using the effective interest rate method; foreign exchange gains and losses; gains and losses on certain financial instruments that are recognised (i.e. unhedged derivatives) in the statement of comprehensive income; unwinding of the discount on provisions and impairment losses on financial assets.
(f) Lease paymentsFinance leasesMinimum lease payments under finance leases are apportioned between the finance charge and the reduction of the outstanding liability. The finance expense is allocated to each period during the lease term so as to produce a constant periodic rate of interest on the remaining balance of the liability. Contingent lease payments are accounted for by revising the minimum lease payments over the remaining term of the lease when the lease adjustment is confirmed.
Operating leasesPayments made under operating leases are recognised in the statement of comprehensive income on a straight line basis over the term of the lease. Lease incentives received are recognised as an integral part of the total lease expense over the term of the lease.
(g) Income tax expenseIncome tax expense comprises current and deferred tax. Income tax expense is recognised in the statement of comprehensive income. Current tax is the expected tax payable on the taxable income for the year, using tax rates enacted or substantively enacted at the reporting date, and any adjustment to tax payable in respect of previous years. Deferred tax is recognised using the balance sheet method, providing for temporary differences between the carrying amounts of assets and liabilities for financial reporting purposes and the amounts used for taxation purposes. Deferred tax is not recognised for the following temporary differences: the initial recognition of goodwill; the initial recognition of assets or liabilities in a transaction that is not a business combination and that affects neither accounting nor taxable profit, and differences relating to investments in subsidiaries and jointly controlled entities to the extent that they probably will not reverse in the foreseeable future.
Deferred tax is measured at the tax rates that are expected to be applied to the temporary differences when they reverse, based on the laws that have been enacted or substantively enacted by the reporting date. A deferred tax asset is recognised to the extent that it is probable that future taxable profits will be available against which temporary difference can be utilised. Deferred tax assets are reviewed at each reporting date and are reduced to the extent that it is no longer probable that the related tax benefit will be realised. Additional income taxes that arise from the distribution of dividends are recognised at the same time as the liability to pay the related dividend is recognised.
Deferred tax assets and liabilities are set off only if there is a legal right of set off and they relate to income taxes levied by the same taxation authorities.
(h) Advertising and promotion costsExpenditure on advertising and promotional activities is recognised as an expense when the Group has the right to access the goods or has received the service.
(i) Royalties paidRoyalties are recognised as an expense as revenue is earned.
Notes to and forming part of the financial statements for the year ended 28 February 2011

35
(j) Financial assetsThe Group classifies its financial assets in the following categories: at fair value through profit or loss or loans and receivables. The classification depends on the purpose for which the financial assets were acquired. Management determines the classification of its financial assets at initial recognition.
Financial assets at fair value through profit or lossFinancial assets at fair value through profit or loss are financial assets held for trading. A financial asset is classified in this category if acquired principally for the purpose of selling in the short term. Derivatives are also categorised as held for trading unless they are designated as hedges. Assets in this category are classified as current assets.
Loans and receivablesLoans and receivables are non-derivative financial assets with fixed or determinable payments that are not quoted in an active market. They are included in current assets, except for maturities greater than 12 months after the balance sheet date. These are classified as non-current assets. The Group’s loans and receivables comprise ‘other receivables’ and ‘cash and cash equivalents’ in the statement of financial position.
Financial assets that are stated at cost or amortised cost are reviewed individually at balance date to determine whether there is objective evidence of impairment. If any such evidence exists, the asset’s recoverable amount is calculated using the present value of future cash flows discounted at the original effective interest rate. An impairment loss is recognised in the statement of comprehensive income for the difference between the carrying amount and the recoverable amount. An impairment loss is reversed if the subsequent increase in the recoverable amount can be related objectively to an event occurring after the impairment was recognised. The impairment loss is reversed only to the extent that the financial asset’s carrying value does not exceed the carrying value that would have been determined if no impairment loss had been recognised.
(k) Cash and cash equivalentsCash and cash equivalents comprise cash balances and call deposits. Bank overdrafts that are repayable on demand and form an integral part of the Group’s cash management are included as a component of cash and cash equivalents for the purpose of the statement of cash flows.
(l) Trade payablesTrade payables are recognised initially at fair value and subsequently measured at amortised cost using the effective interest method.
(m) BorrowingsBorrowings are recognised initially at fair value, net of transaction costs incurred. Borrowings are subsequently stated at amortised cost; any difference between the proceeds (net of transaction costs) and the redemption value is recognised in the statement of comprehensive income over the period of the borrowings using the effective interest method.
(n) Intangible assetsGoodwillGoodwill arises on the acquisition of subsidiaries and business combinations. Goodwill is measured at cost less accumulated impairment losses. Goodwill is allocated to cash-generating units and is tested annually for impairment. Where the Group disposes of an operation within a cash-generating unit, the goodwill associated with the operation disposed of is part of the gain or loss on disposal. Goodwill disposed of in this manner is measured based on the relative values of the operation disposed of and the portion of the cash-generating unit retained.
Notes to and forming part of the financial statements for the year ended 28 February 2011

36
Concept development costs and feesConcept development costs and fees include certain costs, other than the direct cost of obtaining the franchise, associated with the establishment of quick service and takeaway restaurant concepts. These include, for example, professional fees and consulting costs associated with the establishment of a new brand or business acquisition.
These costs are capitalised where the concept is proven to be commercially feasible and the related future economic benefits are expected to exceed those costs with reasonable certainty. These are subsequently measured at cost less accumulated amortisation and accumulated impairment losses. Amortisation is recognised on a straight-line basis over the period which future economic benefits are reasonably expected to be derived.
Acquired software costsSoftware costs have a finite useful life. Software costs are capitalised and amortised on a straight-line basis over the estimated economic life of three years.
(o) Property, plant and equipmentOwned assetsProperty, plant and equipment are measured at cost less accumulated depreciation and impairment losses. Where appropriate, the cost of property, plant and equipment includes site preparation costs, installation costs and the cost of obtaining resource consents. Borrowing costs associated with property, plant and equipment are expensed as incurred.
When parts of an item of property, plant and equipment have different useful lives, they are accounted for as separate items (major components) of property, plant and equipment.
The cost of replacing part of an item of property, plant and equipment is recognised in the carrying amount of the item if it is probable that the future economic benefits embodied within the part will flow to the Group and its cost can be measured reliably. The costs of the day-to-day servicing of property, plant and equipment are recognised in the statement of comprehensive income as incurred.
Leased assetsLeases in terms of which the Group assumes substantially all the risks and rewards of ownership are classified as finance leases. Assets acquired by way of finance leases are stated initially at an amount equal to the lower of its fair value and present value of the future minimum lease payments. Subsequent to initial recognition the asset is accounted for in accordance with the accounting policy applicable to that asset.
Other leases are operating leases and are not recognised on the Group’s statement of financial position. The Group also leases certain plant and equipment and land and buildings by way of operating lease. The cost of improvements to leasehold assets is capitalised as buildings or leasehold improvements and then depreciated as outlined below.
Capital work in progressAll costs relating to an asset are first recorded in capital work in progress. Once all associated costs for an asset are established with relative certainty, the asset is then transferred from work in progress and capitalised into property, plant and equipment.
Store start-up costsCosts incurred in connection with assessing the feasibility of new sites are expensed as incurred with the exception of franchise costs and certain development costs and fees as discussed above.
DepreciationLand is not depreciated. Depreciation is recognised in the statement of comprehensive income and is calculated on a straight-line basis to allocate the cost of an asset, less any residual value, over its estimated useful life. Leased assets are depreciated over the shorter of the lease term and their useful lives. The estimated useful lives of fixed assets are as follows:
Leasehold improvements . . . . . . . . . . . . . . . . . . . . . . . . . . . . . . . . . . . . . . . . . . . . . . . . . . . . . . . . . . . . . . . . . . . . . . . . . . . . . . . . 5 - 20 yearsPlant and equipment . . . . . . . . . . . . . . . . . . . . . . . . . . . . . . . . . . . . . . . . . . . . . . . . . . . . . . . . . . . . . . . . . . . . . . . . . . . . . . . . . 3 - 12.5 yearsMotor vehicles . . . . . . . . . . . . . . . . . . . . . . . . . . . . . . . . . . . . . . . . . . . . . . . . . . . . . . . . . . . . . . . . . . . . . . . . . . . . . . . . . . . . . . . . . . . .4 yearsFurniture and fittings . . . . . . . . . . . . . . . . . . . . . . . . . . . . . . . . . . . . . . . . . . . . . . . . . . . . . . . . . . . . . . . . . . . . . . . . . . . . . . . . . . 3 - 10 yearsComputer equipment . . . . . . . . . . . . . . . . . . . . . . . . . . . . . . . . . . . . . . . . . . . . . . . . . . . . . . . . . . . . . . . . . . . . . . . . . . . . . . . . . . . . 3 - 5 years
Depreciation methods, useful lives and residual values are reassessed at the reporting date.
Notes to and forming part of the financial statements for the year ended 28 February 2011

37
(p) InventoriesInventories are measured at the lower of cost and net realisable value. Net realisable value is the estimated selling price less the estimated costs of marketing, selling and distribution. The cost of inventories is based on the first-in first-out principle and includes expenditure incurred in acquiring the inventories and bringing them to their existing condition and location.
(q) DividendsDividends are accrued in the period in which they are authorised.
(r) Impairment on non-financial assetsThe carrying amounts of the Group’s assets except for inventories and deferred tax assets are reviewed at each balance date to determine whether there is any indication of impairment. If any such indication exists then the asset’s or Cash Generating Unit’s (CGU’s) recoverable amount is estimated. For goodwill and intangible assets that have indefinite lives or that are not yet available for use, the recoverable amount is estimated at each reporting date. An impairment loss is recognised whenever the carrying amount of an asset or CGU exceeds its recoverable amount. A CGU is the smallest identifiable asset group that generates cash flows that are largely independent from other assets and groups.
The recoverable amount of an asset or CGU is the greater of its value in use and its fair value less costs to sell. In assessing value in use, the estimated future cash flows are discounted to their present value using a discount rate that reflects current market assessments of the time value of money and the risks specific to the asset. Impairment losses directly reduce the carrying amount of assets and are recognised in the statement of comprehensive income. Impairment losses recognised in respect of CGUs are allocated first to reduce the carrying amount of any goodwill allocated to the units and then to reduce the carrying amount of the other assets in the unit (group of units) on a pro rata basis.
Except for impairment losses on goodwill, impairment losses recognised in prior periods are assessed at each reporting date for any indications that the loss has decreased or no longer exists. An impairment loss is reversed if there has been a change in the estimates used to determine the recoverable amount. An impairment loss is reversed only to the extent that the asset’s carrying amount does not exceed the carrying amount that would have been determined, net of depreciation or amortisation, if no impairment loss had been recognised. An impairment loss in respect of goodwill is not reversed.
(s) Share capitalIncremental costs directly attributable to the issue of ordinary shares and share options are recognised as a deduction from equity.
(t) Earnings per shareThe Group presents basic and diluted earnings per share (EPS) data for its ordinary shares. Basic EPS is calculated by dividing the profit or loss attributable to ordinary shareholders of the Company by the weighted average number of ordinary shares outstanding during the period. Diluted EPS is determined by adjusting the profit or loss attributable to ordinary shareholders and the weighted average number of ordinary shares outstanding for the effects of all dilutive potential ordinary shares, which comprise share options granted to employees.
(u) Employee benefitsOther long-term employee benefitsThe Group’s net obligation in respect of long-term employee benefits is the amount of future benefit that employees have earned in return for their service in the current and prior periods. The benefit is discounted to determine its present value.
Share-based payment transactionsThe grant date fair value of options granted to employees is recognised as an employee expense, with a corresponding increase in equity, over the period in which the employees become unconditionally entitled to the options. The amount recognised as an expense is adjusted to reflect the actual number of share options that vest. The fair value of the options granted is measured using an options pricing model, taking into account the terms and conditions upon which the options were granted. The amount recognised as an expense is adjusted to reflect the actual number of share options that vest except where forfeiture is only due to share prices not achieving the threshold for vesting.
Notes to and forming part of the financial statements for the year ended 28 February 2011

38
Short-term benefitsShort-term employee benefit obligations are measured on an undiscounted basis and are expensed as the related service is provided. A provision is recognised for the amount expected to be paid under short-term cash bonus if the Group has a present legal or constructive obligation to pay this amount as a result of past service provided by the employee and the obligation can be estimated reliably.
(v) Segment reportingOperating segments are reported in a manner consistent with the internal reporting provided to the chief operating decision maker. The chief operating decision maker, responsible for allocating resources and assessing performance of the operating segments, has been identified as the Senior Leadership Team. The Senior Leadership Team reviews the Group’s internal reporting in order to assess performance and allocate resources.
(w) Goods and services taxThe statement of comprehensive income and statements of cash flows have been prepared exclusive of Goods and Services Taxation (GST). All items in the statement of financial position are stated net of GST, with the exception of receivables and payables, which include GST invoiced.
(x) Non-current assets held for saleNon-current assets (or disposal groups comprising assets and liabilities) that are expected to be recovered primarily through sale rather than through continuing use are classified as held for sale. Immediately before classification as held for sale, the assets (or components of a disposal group) are remeasured in accordance with the Group’s accounting policies. Thereafter generally the assets (or disposal group) are measured at the lower of their carrying amount and fair value less costs to sell. Impairment losses on initial classification as held for sale and subsequent gains or losses on re-measurement are recognised in the statement of comprehensive income. Gains are not recognised in excess of any cumulative impairment loss.
(y) Discontinued operationsA discontinued operation is a component of the Group’s business that represents a separate major line of business or geographical area of operations that has been disposed of, or is held for sale, or is a subsidiary acquired exclusively with a view to resale. Classification as a discontinued operation occurs upon disposal or when the operation meets the criteria to be classified as held for sale, if earlier. When an operation is classified as a discontinued operation, the comparative statement of comprehensive income is restated as if the operation has been discontinued from the start of the comparative period.
(Z) ProvisionsA provision is recognised if, as a result of a past event, the Group has a present legal or constructive obligation that can be estimated reliably, and it is probable that an outflow of economic benefits will be required to settle the obligation. Provisions are determined by discounting the expected future cash flows at a pre-tax rate that reflects current market assessments of the time value of money and the risks specific to the liability.
RestructuringA provision for restructuring is recognised when the Group has approved a detailed and formal restructuring plan, and the restructuring either has commenced or has been announced publicly. Future operating costs are not provided for.
Onerous contractsA provision for onerous contracts is recognised when the expected benefits to be derived by the Group from a contract are lower than the unavoidable cost of meeting its obligations under the contract. The provision is measured at the present value of the lower of the expected cost of terminating the contract and the expected net cost of continuing with the contract. Before a provision is established, the Group recognises any impairment loss on the assets associated with that contract.
Notes to and forming part of the financial statements for the year ended 28 February 2011

39
(aa) Non-trading itemsThe Group seeks to present a measure of comparable underlying performance on a consistent basis. In order to do so, the Group separately discloses items considered to be unrelated to the day-to-day operational performance of the Group. Such items are classified as non-trading items and are separately disclosed in the statement of comprehensive income and notes to the financial statements.
(ab) New standards and interpretations Relevant standards, amendments and interpretations to existing standards that are not yet effective and have not been early adopted by the Group:
• NZ IAS 24 – Related party disclosures simplifies the definition of a related party, clarifying its intended meaning and eliminating inconsistencies from the definition. NZ IAS 24 is effective for accounting periods beginning 1 July 2011. The revision is not expected to have a material impact on the Group.
• NZ IFRS 9 – Financial instruments specifies how an entity should classify and measure financial assets, including some hybrid contracts. NZ IFRS 9 is intended to replace NZ IAS 39. NZ IFRS 9 is effective for accounting periods beginning 1 January 2013. The standard is not expected to have a material impact on the Group.
There are various other standards, amendments and interpretations which are currently not applicable to the Group.
3. Segmental reportingThe Group has three operating segments: KFC, Pizza Hut and Starbucks Coffee. All three segments operate quick service and takeaway restaurant concepts. No operating segments have been aggregated.
The segments were determined primarily because the Group manages each business separately. The reportable segments are each managed separately as they operate in three distinct markets, sell distinct products, have distinct production processes and have distinct operating and gross margin characteristics. The Group operates in New Zealand.
The Group has also included Pizza Hut Victoria as an additional operating segment. Refer to Note 4.
The title “All other segments” represents general and administration support centre costs (“G&A”). G&A support centre costs are not an operating segment as the costs incurred are incidental to the Group’s activities.
The Group evaluates performance and allocates resources to its operating segments on the basis of segment assets, segment revenues, concept earnings before interest and tax and depreciation and amortisation (“concept EBITDA”), and earnings before interest and tax basis (“concept EBIT”).
The accounting policies of the Group’s segments are the same as those described in the notes to the Group’s financial statements. Segment assets include items directly attributable to the segment (i.e. fixed assets, intangible assets and inventories). Unallocated items comprise other receivables, cash and cash equivalents, deferred tax and derivative financial instruments as they are all managed on a central basis. These are part of the reconciliation to total assets in the statement of financial position. Segment capital expenditure is the total cost incurred during the period to acquire property, plant and equipment and intangible assets other than goodwill.
The Group has not disclosed segment liabilities as the chief operating decision maker (the Senior Leadership Team) evaluates performance and allocates resources purely on the basis of aggregated Group liabilities.
Notes to and forming part of the financial statements for the year ended 28 February 2011

40
KFC Pizza Hut Starbucks Coffee Pizza Hut Victoria* All Other Segments** Consolidated Continuing Discontinued Continuing Discontinued$NZ000's 2011 2010 2011 2010 2011 2010 2011 2010 2011 2010 2011 2010 2011 2011 2010 2010
Business segmentsStore sales revenue 235,805 223,228 59,266 64,158 29,313 30,463 - - - - 324,384 317,849 324,384 - 317,849 -Other revenue - - - - - - - - 516 495 516 495 516 - 495 -Total operating revenue *** 235,805 223,228 59,266 64,158 29,313 30,463 - - 516 495 324,900 318,344 324,900 - 318,344 -
Concept EBITDA before general and administration expenses 52,125 46,268 5,637 5,403 4,104 3,224 - - - - 61,866 54,895 61,866 - 54,895 -
Depreciation (7,513) (6,233) (3,091) (3,597) (1,486) (1,647) - - (532) (526) (12,622) (12,003) (12,622) - (12,003) -Gain / (loss) on sale of property, plant and equipment (included in depreciation) 31 (136) 25 (11) 13 (28) - - - - 69 (175) 69 - (175) -Amortisation (included in cost of sales) (559) (554) (175) (321) (139) (152) - - (26) (67) (899) (1,094) (899) - (1,094) -G&A - area managers, general managers and support centre (2,142) (2,233) (1,148) (1,429) (738) (932) - - (7,640) (7,263) (11,668) (11,857) (11,668) - (11,857) -Segment result before non-trading 41,942 37,112 1,248 45 1,754 465 - - (8,198) (7,856) 36,746 29,766 36,746 - 29,766 -
Impairment on property, plant and equipment (474) (168) (94) (228) (330) - - - - - (898) (396) (898) - (396) -Other non-trading 555 236 (1,499) (159) (205) (239) 295 - - - (854) (162) (1,149) 295 (162) -Segment result (Concept EBIT) 42,023 37,180 (345) (342) 1,219 226 295 - (8,198) (7,856) 34,994 29,208 34,699 295 29,208 -
Operating profit (EBIT) 34,994 29,208 34,699 295 29,208 -Net financing costs (1,171) (1,442) (1,171) - (1,442) -Net profit before taxation 33,823 27,766 33,528 295 27,766 -Income tax expense (9,511) (8,230) (9,511) - (8,230) -Net profit after taxation 24,312 19,536 24,017 295 19,536 -Net profit after taxation excluding non-trading 25,072 19,926 25,072 - 19,926 -
Segment assets 71,467 56,223 27,346 32,624 6,727 9,137 - - 987 976 106,527 98,960Unallocated assets 4,825 4,010Total assets 111,352 102,970
Capital expenditure including intangibles 27,032 12,852 284 1,599 73 422 - - 479 474 27,868 15,347
* All segments are continuing operations except Pizza Hut Victoria.** All other segments are general and administration support centre expenses (G&A).*** All operating revenue is from external customers.
New Zealand Unallocated Consolidated$NZ000's 2011 2010 2011 2010 2011 2010
Geographical segmentsTotal operating revenue 324,900 318,344 - - 324,900 318,344Segment assets 106,527 98,960 4,825 4,010 111,352 102,970Capital expenditure including intangibles 27,868 15,347 - - 27,868 15,347
3. Segmental reporting (continued)
Notes to and forming part of the financial statements for the year ended 28 February 2011
IMPROVED PROFIT PERFORMANCE IN PIZZA HUT
AND STARBUCKS COFFEE

41
KFC Pizza Hut Starbucks Coffee Pizza Hut Victoria* All Other Segments** Consolidated Continuing Discontinued Continuing Discontinued$NZ000's 2011 2010 2011 2010 2011 2010 2011 2010 2011 2010 2011 2010 2011 2011 2010 2010
Business segmentsStore sales revenue 235,805 223,228 59,266 64,158 29,313 30,463 - - - - 324,384 317,849 324,384 - 317,849 -Other revenue - - - - - - - - 516 495 516 495 516 - 495 -Total operating revenue *** 235,805 223,228 59,266 64,158 29,313 30,463 - - 516 495 324,900 318,344 324,900 - 318,344 -
Concept EBITDA before general and administration expenses 52,125 46,268 5,637 5,403 4,104 3,224 - - - - 61,866 54,895 61,866 - 54,895 -
Depreciation (7,513) (6,233) (3,091) (3,597) (1,486) (1,647) - - (532) (526) (12,622) (12,003) (12,622) - (12,003) -Gain / (loss) on sale of property, plant and equipment (included in depreciation) 31 (136) 25 (11) 13 (28) - - - - 69 (175) 69 - (175) -Amortisation (included in cost of sales) (559) (554) (175) (321) (139) (152) - - (26) (67) (899) (1,094) (899) - (1,094) -G&A - area managers, general managers and support centre (2,142) (2,233) (1,148) (1,429) (738) (932) - - (7,640) (7,263) (11,668) (11,857) (11,668) - (11,857) -Segment result before non-trading 41,942 37,112 1,248 45 1,754 465 - - (8,198) (7,856) 36,746 29,766 36,746 - 29,766 -
Impairment on property, plant and equipment (474) (168) (94) (228) (330) - - - - - (898) (396) (898) - (396) -Other non-trading 555 236 (1,499) (159) (205) (239) 295 - - - (854) (162) (1,149) 295 (162) -Segment result (Concept EBIT) 42,023 37,180 (345) (342) 1,219 226 295 - (8,198) (7,856) 34,994 29,208 34,699 295 29,208 -
Operating profit (EBIT) 34,994 29,208 34,699 295 29,208 -Net financing costs (1,171) (1,442) (1,171) - (1,442) -Net profit before taxation 33,823 27,766 33,528 295 27,766 -Income tax expense (9,511) (8,230) (9,511) - (8,230) -Net profit after taxation 24,312 19,536 24,017 295 19,536 -Net profit after taxation excluding non-trading 25,072 19,926 25,072 - 19,926 -
Segment assets 71,467 56,223 27,346 32,624 6,727 9,137 - - 987 976 106,527 98,960Unallocated assets 4,825 4,010Total assets 111,352 102,970
Capital expenditure including intangibles 27,032 12,852 284 1,599 73 422 - - 479 474 27,868 15,347
New Zealand Unallocated Consolidated$NZ000's 2011 2010 2011 2010 2011 2010
Geographical segmentsTotal operating revenue 324,900 318,344 - - 324,900 318,344Segment assets 106,527 98,960 4,825 4,010 111,352 102,970Capital expenditure including intangibles 27,868 15,347 - - 27,868 15,347
STRONG KFC SALES AND PROFIT
PERFORMANCE
PROF
IT

42
4. Discontinued operationsWith the exit from Pizza Hut Victoria, the business was classified as a disposal group held for sale and as a discontinued operation. Because the franchise agreements with Yum! Restaurants International in this market created obligations that were onerous in nature, all remaining future financial obligations relating to the exit of all remaining stores had been estimated and accounted for as a provision for onerous contracts under NZ IAS 37.
All stores have subsequently been closed and management is of the view that the balance of the exit provision of $0.3 million (2010: $0.3 million) is no longer required. Accordingly $0.3 million has been classified under non-trading in the statement of comprehensive income as a gain (2010: nil).
5. Non-current assets held for saleAll remaining trade and other payables associated with the Pizza Hut Victoria business exit have been classified as held for sale as shown below:
Group
$NZ000's 2011 2010
Liabilities associated with assets classified as held for saleTrade and other payables 14 20Provisions - 291
14 311
Group Company
$NZ000's 2011 2010 2011 2010
Sale of services 516 495 - -Dividends - - 14,627 12,256
516 495 14,627 12,256
6. Other revenue
Notes to and forming part of the financial statements for the year ended 28 February 2011

43
7. Analysis of expensesThe surplus before taxation is calculated after charging the following items:
Group Company
$NZ000's Note 2011 2010 2011 2010
Auditors' remuneration: To PwC for statutory audit services 65 61 - - To PwC for other assurance services * 26 24 - -Government training grants (included in general and administration expenses) (195) (157) - -Amortisation of intangibles (included in cost of sales) 10 899 1,094 - -Royalties paid 19,316 18,919 - -Depreciation expense 9 12,622 12,003 - -Operating rental expenses 17,509 18,072 - -
Net (gain) / loss on disposal of property, plant and equipment (included in depreciation expense) (69) 175 - -
Net loss on disposal of property, plant and equipment (included in non-trading costs) 554 258 - -Directors' fees 28 220 217 - -Interest expense (net) 986 1,412 1,178 1,370Interest expense - interest rate swap fair value changes 157 - - -Finance lease interest 28 30 - -* Includes review of interim financial statements, certain compliance certificates for third parties and audit of the Company share registry.
Non-trading itemsPizza Hut Victoria:Release of store closure provision (295) - - -
(295) - - -New Zealand:Loss on sale of stores Net sale proceeds (1,054) - - - Property, plant and equipment disposed of 1,144 - - - Goodwill disposed of 10 1,000 - - -
1,090 - - -Other store closure costs 734 535 - -Other store closure costs - franchise fees written off 10 58 57 - -Other store closure costs - insurance proceeds (515) (626) - -Other store relocation and refurbishment costs 368 329 - -Other store relocation and refurbishment - insurance proceeds (586) - - -Impairment on property, plant and equipment 9 898 396 - -Other revenue - (133) - -
2,047 558 - -
Total non-trading items 1,752 558 - -
Group
$NZ000's 2011 2010
Personnel expensesWages and salaries 81,513 79,851(Decrease) / increase in liability for long service leave (6) 56
81,507 79,907
The Parent has no personnel expense (2010: nil).
Notes to and forming part of the financial statements for the year ended 28 February 2011

44
Group Group Company
$NZ000's Note 2011 2010 2011 2010
Total profit before income tax for the period 3 33,823 27,766 13,449 10,886Total income tax (expense) / credit 3 (9,511) (8,230) 353 411Net profit after income tax 24,312 19,536 13,802 11,297
Income tax using the Company’s domestic tax rate (30.0%) (10,147) (30.0%) (8,330) (4,035) (3,266)Non-deductible expenses and non-assessable income 1.8% 612 0.4% 100 4,388 3,677Change in tax rate to 28% (0.3%) (99) 0.0% - - -Prior period adjustment 0.4% 123 0.0% - - -
(28.1%) (9,511) (29.6%) (8,230) 353 411
Income tax (expense) / credit comprises:Current tax (expense) / credit (9,929) (9,724) 353 411Deferred tax credit 12 418 1,494 - - Net tax (expense) / credit (9,511) (8,230) 353 411
Statement of comprehensive income taxation expenseIncome tax (expense) / credit from continuing operations (9,511) (8,230) 353 411Total income tax (expense) / credit 3 (9,511) (8,230) 353 411
8. Income tax expense in the statement of comprehensive incomeReconciliation of effective tax rate
The deferred tax balance has been restated to reflect the reduction in corporate tax rate from 30% to 28% effective from the start of the new financial year.
Group
$NZ000's 2011 2010
Imputation credits at beginning of year 2,953 (288)New Zealand tax payments, net of refunds 9,954 6,122Imputation credits attached to dividends paid (5,377) (2,890)Other tax paid 10 9Imputation credits at end of year 7,540 2,953
Imputation credits
Notes to and forming part of the financial statements for the year ended 28 February 2011

45
9. Property, plant and equipment
Group $NZ000's LandLeasehold
improvements
Plant, equipment
and fittings
Motor vehicles
Leased plant and
equipment
Capital work in
progress Total
CostBalance as at 28 February 2009 - 80,125 50,614 1,002 1,088 572 133,401Additions for year ended February 2010 1,335 - 577 432 60 12,708 15,112Transfer from work in progress for year ended February 2010 - 5,871 2,884 - - (8,755) -Disposals for year ended February 2010 - (2,127) (1,741) (297) (61) - (4,226)Balance as at 28 February 2010 1,335 83,869 52,334 1,137 1,087 4,525 144,287Additions for year ended February 2011 - 4,099 4,644 207 - 18,561 27,511Transfer from work in progress for year ended February 2011 - 14,789 3,768 - - (18,557) -Disposals for year ended February 2011 (1,335) (5,948) (5,051) (141) (188) - (12,663)Balance as at 28 February 2011 - 96,809 55,695 1,203 899 4,529 159,135
Accumulated depreciationBalance as at 28 February 2009 - (26,351) (33,381) (768) (855) - (61,355)Charge for year ended February 2010 - (6,927) (4,706) (188) (182) - (12,003)Disposals for year ended February 2010 - 1,263 1,530 286 54 - 3,133Balance as at 28 February 2010 - (32,015) (36,557) (670) (983) - (70,225)Charge for year ended February 2011 - (7,724) (4,537) (219) (142) - (12,622)Disposals for year ended February 2011 - 2,724 4,435 141 288 - 7,588Balance as at 28 February 2011 - (37,015) (36,659) (748) (837) - (75,259)
Impairment provisionBalance as at 28 February 2009 - (227) (25) - - - (252)Charge for year ended February 2010 - (356) (40) - - - (396)Utilised/disposed for year ended February 2010 - (44) (5) - - - (49)Balance as at 28 February 2010 - (627) (70) - - - (697)Charge for year ended February 2011 - (808) (90) - - - (898)Utilised/disposed for year ended February 2011 - 256 28 - - - 284 Balance as at 28 February 2011 - (1,179) (132) - - - (1,311)
The impairment charge recognised during the year relates to accelerated depreciation on leasehold improvements and plant, equipment and fittings on stores expected to be transformed or closed. Impairment charges incurred and utilised/disposed are recognised in non-trading in the statement of comprehensive income (refer Note 7).
The Parent has no property, plant and equipment (2010: nil).
Carrying amountsBalance as at 28 February 2009 - 53,547 17,208 234 233 572 71,794Balance as at 28 February 2010 1,335 51,227 15,707 467 104 4,525 73,365Balance as at 28 February 2011 - 58,615 18,904 455 62 4,529 82,565
Notes to and forming part of the financial statements for the year ended 28 February 2011
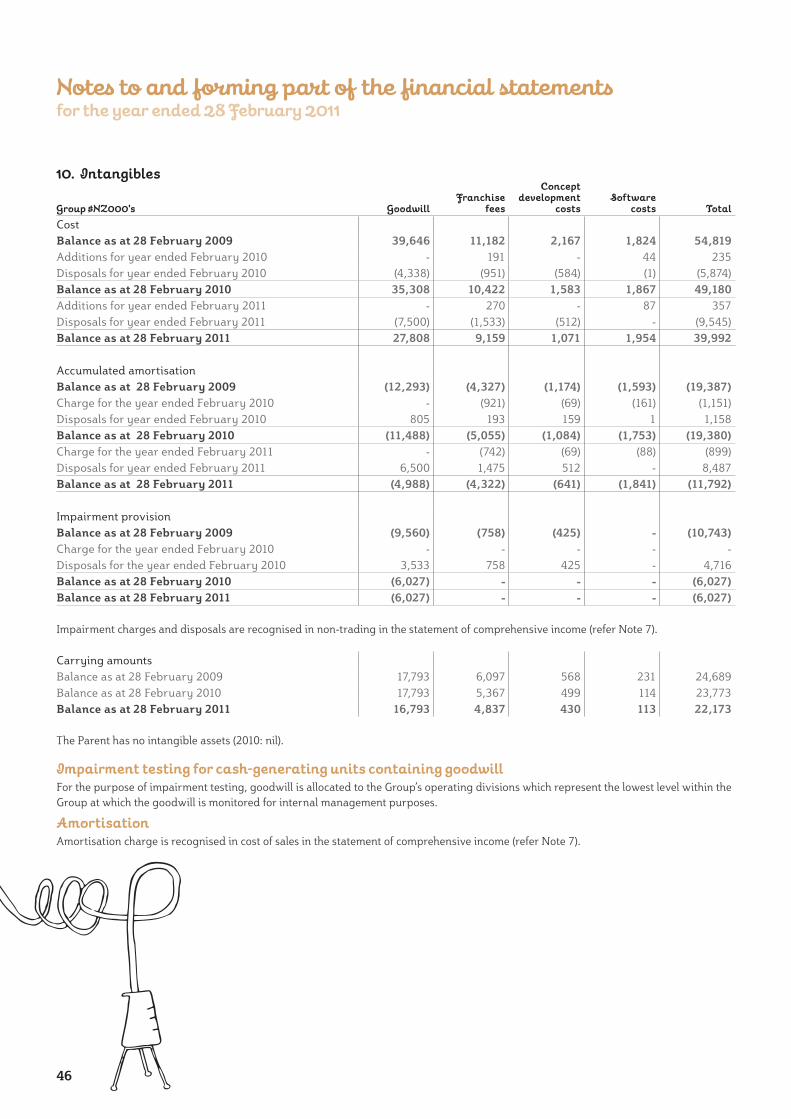
46
10. Intangibles
Impairment testing for cash-generating units containing goodwillFor the purpose of impairment testing, goodwill is allocated to the Group’s operating divisions which represent the lowest level within the Group at which the goodwill is monitored for internal management purposes.
AmortisationAmortisation charge is recognised in cost of sales in the statement of comprehensive income (refer Note 7).
Group $NZ000's GoodwillFranchise
fees
Concept development
costsSoftware
costs Total
CostBalance as at 28 February 2009 39,646 11,182 2,167 1,824 54,819Additions for year ended February 2010 - 191 - 44 235Disposals for year ended February 2010 (4,338) (951) (584) (1) (5,874)Balance as at 28 February 2010 35,308 10,422 1,583 1,867 49,180Additions for year ended February 2011 - 270 - 87 357Disposals for year ended February 2011 (7,500) (1,533) (512) - (9,545)Balance as at 28 February 2011 27,808 9,159 1,071 1,954 39,992
Accumulated amortisationBalance as at 28 February 2009 (12,293) (4,327) (1,174) (1,593) (19,387)Charge for the year ended February 2010 - (921) (69) (161) (1,151)Disposals for year ended February 2010 805 193 159 1 1,158Balance as at 28 February 2010 (11,488) (5,055) (1,084) (1,753) (19,380)Charge for the year ended February 2011 - (742) (69) (88) (899)Disposals for year ended February 2011 6,500 1,475 512 - 8,487 Balance as at 28 February 2011 (4,988) (4,322) (641) (1,841) (11,792)
Impairment provisionBalance as at 28 February 2009 (9,560) (758) (425) - (10,743)Charge for the year ended February 2010 - - - - -Disposals for the year ended February 2010 3,533 758 425 - 4,716Balance as at 28 February 2010 (6,027) - - - (6,027)Balance as at 28 February 2011 (6,027) - - - (6,027)
Carrying amountsBalance as at 28 February 2009 17,793 6,097 568 231 24,689Balance as at 28 February 2010 17,793 5,367 499 114 23,773Balance as at 28 February 2011 16,793 4,837 430 113 22,173
Impairment charges and disposals are recognised in non-trading in the statement of comprehensive income (refer Note 7).
The Parent has no intangible assets (2010: nil).
Notes to and forming part of the financial statements for the year ended 28 February 2011
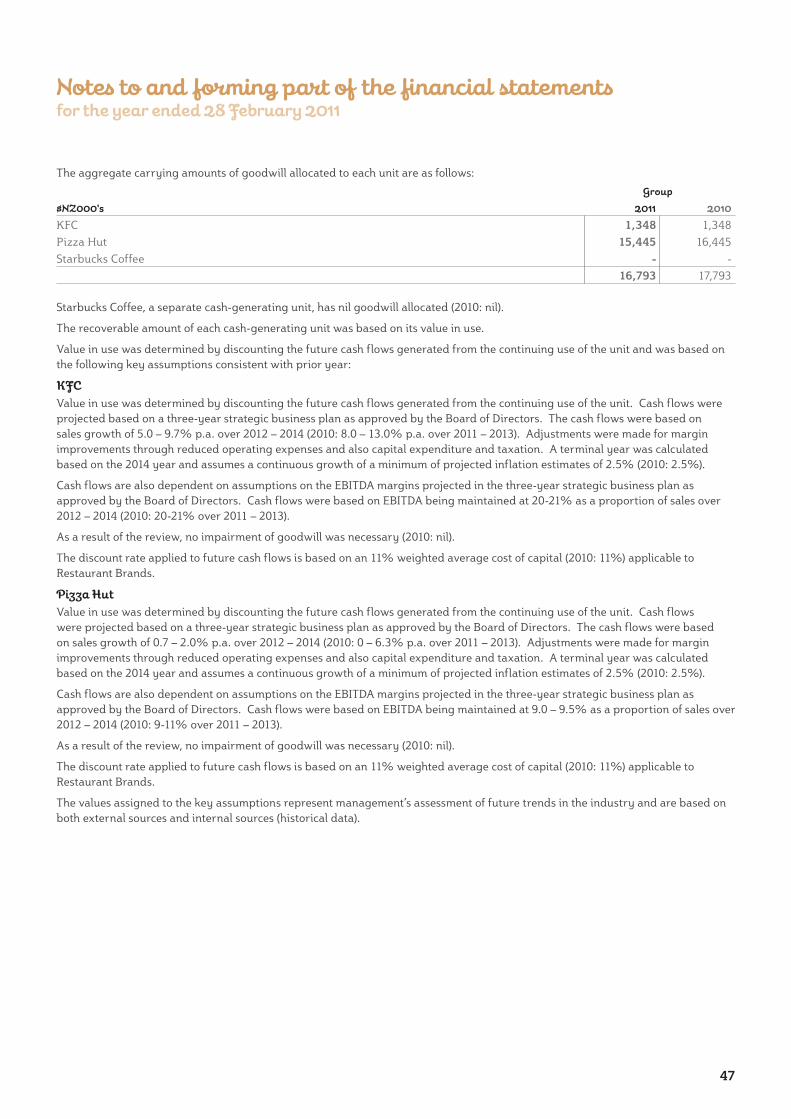
47
The aggregate carrying amounts of goodwill allocated to each unit are as follows:
Group
$NZ000's 2011 2010
KFC 1,348 1,348Pizza Hut 15,445 16,445Starbucks Coffee - -
16,793 17,793
Starbucks Coffee, a separate cash-generating unit, has nil goodwill allocated (2010: nil).
The recoverable amount of each cash-generating unit was based on its value in use.
Value in use was determined by discounting the future cash flows generated from the continuing use of the unit and was based on the following key assumptions consistent with prior year:
KFCValue in use was determined by discounting the future cash flows generated from the continuing use of the unit. Cash flows were projected based on a three-year strategic business plan as approved by the Board of Directors. The cash flows were based on sales growth of 5.0 – 9.7% p.a. over 2012 – 2014 (2010: 8.0 – 13.0% p.a. over 2011 – 2013). Adjustments were made for margin improvements through reduced operating expenses and also capital expenditure and taxation. A terminal year was calculated based on the 2014 year and assumes a continuous growth of a minimum of projected inflation estimates of 2.5% (2010: 2.5%).
Cash flows are also dependent on assumptions on the EBITDA margins projected in the three-year strategic business plan as approved by the Board of Directors. Cash flows were based on EBITDA being maintained at 20-21% as a proportion of sales over 2012 – 2014 (2010: 20-21% over 2011 – 2013).
As a result of the review, no impairment of goodwill was necessary (2010: nil).
The discount rate applied to future cash flows is based on an 11% weighted average cost of capital (2010: 11%) applicable to Restaurant Brands.
Pizza Hut Value in use was determined by discounting the future cash flows generated from the continuing use of the unit. Cash flows were projected based on a three-year strategic business plan as approved by the Board of Directors. The cash flows were based on sales growth of 0.7 – 2.0% p.a. over 2012 – 2014 (2010: 0 – 6.3% p.a. over 2011 – 2013). Adjustments were made for margin improvements through reduced operating expenses and also capital expenditure and taxation. A terminal year was calculated based on the 2014 year and assumes a continuous growth of a minimum of projected inflation estimates of 2.5% (2010: 2.5%).
Cash flows are also dependent on assumptions on the EBITDA margins projected in the three-year strategic business plan as approved by the Board of Directors. Cash flows were based on EBITDA being maintained at 9.0 – 9.5% as a proportion of sales over 2012 – 2014 (2010: 9-11% over 2011 – 2013).
As a result of the review, no impairment of goodwill was necessary (2010: nil).
The discount rate applied to future cash flows is based on an 11% weighted average cost of capital (2010: 11%) applicable to Restaurant Brands.
The values assigned to the key assumptions represent management’s assessment of future trends in the industry and are based on both external sources and internal sources (historical data).
Notes to and forming part of the financial statements for the year ended 28 February 2011

48
Impact of possible changes in key assumptionsSet out below are reasonably possible changes in key assumptions as applied to goodwill balances for KFC and Pizza Hut.
12. Deferred tax assets and liabilitiesRecognised deferred tax assets and liabilities are attributable to the following:
Key assumptions Variation % (Absolute terms)Pizza Hut threshold for impairment charge
KFC threshold for impairment charge
Terminal year sales growth (2.5) recoverable amount equals carrying value
no impairment necessary
Discount rate 2.1 recoverable amount equals carrying value
no impairment necessary
EBITDA ratio as a % of sales per annum
(1.1) recoverable amount equals carrying value
no impairment necessary
Sales growth zero growth no impairment necessary no impairment necessary
11. Investment in subsidiariesThe following subsidiary companies are all wholly owned and incorporated in New Zealand (except as outlined below), have a 28 February balance date and have been owned for the full financial year:
Restaurant operating companies Investment holding companiesRestaurant Brands Limited RB Holdings Limited Restaurant Brands Australia Pty Limited RBP Holdings Limited (incorporated in Victoria, Australia) RBDNZ Holdings Limited
RBN Holdings LimitedProperty holding companyRestaurant Brands Properties Limited Non-trading subsidiary company
Restaurant Brands Pizza LimitedEmployee share option plan trust companyRestaurant Brands Nominees Limited
Assets Liabilities Net
Group $NZ000's 2011 2010 2011 2010 2011 2010
Property, plant and equipment 400 209 (307) (381) 93 (172)Inventory 6 39 - - 6 39Debtors - 18 - - - 18Provisions 2,461 2,652 - - 2,461 2,652Intangibles - - (1,005) (1,400) (1,005) (1,400)Other - - (2) (63) (2) (63)
2,867 2,918 (1,314) (1,844) 1,553 1,074
At balance date deferred tax assets of $0.7 million and deferred tax liabilities of $1.0 million are expected to be settled within 12 months (2010: deferred tax assets of $0.4 million and deferred tax liabilities of $0.3 million). The Parent has no deferred tax assets or liabilities (2010: nil).
Notes to and forming part of the financial statements for the year ended 28 February 2011

49
Movement in temporary differences during the year:
Group $NZ000's
Balance 28 February
2009
Recognised in statement of
comprehensive income
Recognised in equity
Balance 28 February
2010
Recognised in statement of
comprehensive income
Recognised in equity
Balance 28 February
2011
Property, plant and equipment (755) 583 - (172) 265 - 93
Inventory 13 26 - 39 (33) - 6
Debtors 4 14 - 18 (18) - -
Provisions 1,746 906 - 2,652 (191) - 2,461
Intangibles (1,365) (35) - (1,400) 395 - (1,005)
Other (2) - (61) (63) - 61 (2)
(359) 1,494 (61) 1,074 418 61 1,553
13. Inventories
14. Other receivables
15. Derivative financial instruments
All inventories are valued at cost. The cost of inventories is recognised as an expense and included in cost of goods sold in the statement of comprehensive income.
Group Company
$NZ000's 2011 2010 2011 2010
Raw materials and consumables 1,789 1,822 - -
Group Company
$NZ000's 2011 2010 2011 2010
Prepayments 348 1,574 - -Other debtors 2,129 333 - -
2,477 1,907 - -
There were no foreign currency debtors included in other debtors (2010: nil).
The Group’s exposure to credit risk is minimal as the Group’s primary source of revenue is from sales made on a cash basis.
The carrying value of other receivables approximates fair value.
The above table shows the Group’s financial derivative holdings at year end.
The fair value of the interest rate swap falls into level 2 fair value measurement. Refer to Note 2(c) for information on the measurement of fair values. There were no transfers between fair value measurements during the year (2010: nil).
Fair values at balance date have been assessed using a range of market interest rates between 2.94% to 3.80% (2010: 3.37% to 4.91%).
Group & Company Group & Company
2011 2011 2010 2010
$NZ000's Assets Liabilities Assets Liabilities
CurrentFair value of interest rate swap - 157 203 -
Notes to and forming part of the financial statements for the year ended 28 February 2011

50
16. Capital and reservesShare option reserveThe share option reserve comprises the net change in options exercised during the year and the cumulative net change of share-based payments incurred.
Foreign currency translation reserveThe foreign currency translation reserve comprises all exchange rate differences arising from translating the financial statements of the foreign currency operation.
Derivative hedging reserveThe derivative hedging reserve represents the fair value of outstanding derivatives.
18. EquityThe issued capital of the Company is 97,762,866 (2010: 97,280,005) ordinary fully paid up shares. The par value is nil (2010: nil). All issued shares carry equal rights in respect of voting and the receipt of dividends, and upon winding up rank equally with regard to the Company’s residual assets.
17. Dividend distributionsGroup Company
$NZ000's 2011 2010 2011 2010
Interim dividend of 7.0 cents per share paid (2010: 4.5 cents per share) 6,841 4,372 6,841 4,372Final dividend of 8.0 cents per share paid for the year ended 28 February 2010 (2010: Final dividend of 4.0 cents per share paid for the year ended 28 February 2009) 7,809 3,885 7,809 3,885
14,650 8,257 14,650 8,257
Shares
Group &Company
2011 number
Group &Company
2011 $NZ000's
Group &Company
2010 number
Group &Company
2010 $NZ000's
Balance at beginning of year 97,280,005 25,821 97,128,956 25,622Shares issued on exercise of options 482,861 755 151,049 199Balance at end of year 97,762,866 26,576 97,280,005 25,821
Notes to and forming part of the financial statements for the year ended 28 February 2011
EARNINGS PER SHARE INCREASED OVER LAST YEAR

51
19. Earnings per shareThe calculation of basic earnings per share for the year ended 28 February 2011 was based on the weighted average number of ordinary shares on issue of 97,624,753 (2010: 97,162,901). The calculation of diluted earnings per share for the year ended 28 February 2011 was based on the weighted average number of ordinary shares on issue adjusted to assume conversion of all dilutive potential ordinary shares, of 97,693,649 (2010: 97,252,393). The difference between weighted average number of shares used to calculate basic and diluted earnings per share represents share options.
Group2011 2010
Basic earnings per share from continuing operationsProfit after taxation from continuing operations attributable to shareholders ($NZ000's) 24,017 19,536Basic earnings per share (cents) 24.60 20.11
Basic earnings per share from discontinued operationProfit after taxation from discontinued operation attributable to shareholders ($NZ000's) 295 -Basic earnings per share (cents) 0.30 -
Basic earnings per share from total operationsProfit after taxation from total operations attributable to shareholders ($NZ000's) 24,312 19,536Basic earnings per share (cents) 24.90 20.11
Diluted earnings per share from continuing operationsProfit after taxation from continuing operations attributable to shareholders ($NZ000's) 24,017 19,536Diluted earnings per share (cents) 24.58 20.09
Diluted earnings per share from discontinued operationProfit after taxation from discontinued operation attributable to shareholders ($NZ000's) 295 -Diluted earnings per share (cents) 0.30 -
Diluted earnings per share from total operationsProfit after taxation from total operations attributable to shareholders ($NZ000's) 24,312 19,536Diluted earnings per share (cents) 24.89 20.09
20. Loans and finance leasesThis note provides information about the contractual terms of the Group’s interest-bearing loans and borrowings. All existing bank loans, loans and finance leases are denominated in New Zealand dollars (2010: all denominated in New Zealand dollars). For more information about the Group’s exposure to interest rate and foreign currency risk see Note 23.
Group Company
$NZ000's Note 2011 2010 2011 2010
Non-current liabilitiesFinance leases 24d 188 79 - -Secured bank loans 23c 12,210 - 12,210 -
12,398 79 12,210 -Current liabilitiesFinance leases 24d 109 192 - -Secured bank loans 23c - 17,670 - 17,670
109 17,862 - 17,670
Notes to and forming part of the financial statements for the year ended 28 February 2011

52
Secured bank loans expire in October 2012.
In March 2009 the Group entered into an interest rate swap to fix the interest rate on $10.0 million of bank loans for five years. The swap matures on 10 March 2014. At balance date the interest rate applicable was 5.15% (2010: 5.0%) inclusive of bank margin.
The balance of the secured bank loan of $2.2 million is unhedged for interest rate rises (2010: $7.7 million). The bank loan is structured as a revolving wholesale advance facility with portions of the facility renewing on a regular basis. At balance date $2.2 million was floating at an interest rate of 4.5% (2010: $7.0 million fixed for 90 days at an interest rate of 3.4% and the balance floating at an interest rate of 3.8%).
As security over the loan and bank overdraft, the bank holds a negative pledge deed between Restaurant Brands New Zealand Limited and all its subsidiary companies. The negative pledge deed includes all obligations and cross guarantees between the guaranteeing subsidiaries.
The carrying value equates to fair value.
21. Creditors and accrualsGroup Company
$NZ000's 2011 2010 2011 2010
Trade creditors 14,664 9,325 - -Other creditors and accruals 7,750 9,358 75 119Employee entitlements 5,814 5,982 - -Indirect and other taxes 1,221 780 - -
29,449 25,445 75 119
Included in trade creditors are foreign currency creditors of $NZ81,000 ( $AU36,000, $US27,000), (2010: $NZ67,000 ($AU52,000)), which are not hedged.
The carrying value of creditors and accruals approximates fair value.
The provision for surplus lease space reflects lease commitments that the Group has on properties leased that are surplus to its current operating requirements. The Group is currently seeking tenants to sub-lease the excess space that it has. The provision has been used in the period to off-set payments made to lessors.
The provision for store closure costs reflects the estimated costs of make good and disposal of fixed assets for stores committed for closure.
Deferred income relates to non-routine revenue from suppliers and landlords and is recognised in the statement of comprehensive income on a systematic basis over the life of the associated contract.
The provision for employee entitlements is long service leave. The provision is affected by a number of estimates, including the expected length of service of employees and the timing of benefits being taken.
22. Provisions and deferred income
Group $NZ000'sSurplus lease
spaceStore closure
costsEmployee
entitlementsDeferred
income Total
Balance at 1 March 2010 - 27 526 6,361 6,914Created during the year 161 148 224 2,042 2,575Used during the year (55) (89) (105) (1,491) (1,740)Released during the year - (47) (125) - (172)Balance at 28 February 2011 106 39 520 6,912 7,577
2011Non-current 13 21 315 5,608 5,957Current 93 18 205 1,304 1,620Total 106 39 520 6,912 7,577
Notes to and forming part of the financial statements for the year ended 28 February 2011

53
23. Financial instrumentsExposure to credit, interest rate and foreign currency risks arises in the normal course of the Group’s business. Derivative financial instruments may be used to hedge exposure to fluctuations in foreign currency exchange rates and interest rates.
(a) Foreign currency riskThe Group is exposed to foreign currency risk on purchases that are denominated in a currency other than the New Zealand dollar. The currencies giving rise to this risk are primarily U.S. dollars and Australian dollars.
The direct exposure to foreign currency risk is small and is primarily confined to raw material purchases, some items of capital equipment and some franchise fee payments. Where any one item is significant, the Group will specifically hedge its exposure.
The Group has an indirect exposure to foreign currency risk on some of its locally sourced ingredients, where those ingredients in turn have a high imported component. Where this is significant, the Group contracts to a known purchase price with its domestic supplier based on a forward cover position taken by that supplier on its imported components.
The Group has a residual foreign currency risk on its assets and liabilities that are denominated in Australian dollars as part of its remaining Australian investment.
(b) Interest rate riskThe Group’s main interest rate risk arises from bank loans. The Group analyses its interest rate exposure on a dynamic basis. Based on a number of scenarios, the Group calculates the impact on profit and loss of a defined interest rate shift. Based on these scenarios, the maximum loss potential is assessed by management as to whether it is within acceptable limits.
Where necessary, the Group hedges its exposure to changes in interest rates primarily through the use of interest rate swaps. There are no minimum prescribed guidelines as to the level of hedging.
Note 2(c) discusses in detail the Group’s accounting treatment for derivative financial instruments.
As discussed in Note 20, the Group has an interest rate swap in place to fix the interest rate on $10.0 million of bank loans to March 2014 (2010: $10.0 million to March 2014). During the year the Group ceased cash flow hedge accounting for the interest rate swap. Actual debt levels are expected to be lower than forecasted when hedge accounting was initiated to the extent that management believes that the forecast transaction is no longer expected to occur. The cumulative gain that was reported in equity was immediately transferred to the statement of comprehensive income. The Group will continue to monitor interest rate movements to ensure it maintains an appropriate mix of fixed and floating rate exposure within the Group’s policy.
Notes to and forming part of the financial statements for the year ended 28 February 2011

54
(c) Liquidity riskIn respect of the Group’s cash balances, non-derivative financial liabilities and derivative financial liabilities, the following table analyses the amounts into relevant maturity groupings based on the remaining period at balance date to the contractual maturity date, along with their effective interest rates at balance date. The amounts disclosed in the table are the contractual undiscounted cash flows, except for derivatives which are included at their fair value.
$NZ000'sEffective
interest rate Total12 months
or less12 months
or more
Group 2011Cash - 285 285 -Bank balance 0.50% 510 510 -Bank term loan - principal 4.79% (12,210) - (12,210)Bank term loan - expected interest 5.03% (1,023) (614) (409)Finance leases 11.00% (297) (109) (188)Finance leases - expected interest 11.00% (45) (27) (18)Derivative financial instruments - (157) (157) -Creditors and accruals (excluding indirect and other taxes) - (28,228) (28,228) -
(41,165) (28,340) (12,825)Group 2010Cash - 304 304 -Bank balance 2.78% 522 522 -Derivative financial instruments - 203 203 -Bank loan - principal 4.27% (17,670) (17,670) -Bank loan - expected interest 4.48% (528) (528) -Finance leases 11.00% (271) (192) (79)Finance leases - expected interest 11.00% (26) (15) (11)Creditors and accruals (excluding indirect and other taxes) - (24,665) (24,665) -
(42,131) (42,041) (90)Company 2011Bank balance 0.50% 39 39 -Derivative financial instruments - (157) (157) -Bank term loan - principal 4.79% (12,210) - (12,210)Bank term loan - expected interest 5.03% (1,023) (614) (409)Creditors and accruals - (75) (75) -
(13,426) (807) (12,619)Company 2010Bank balance 2.78% 92 92 -Derivative financial instruments - 203 203 -Bank loan - principal 4.27% (17,670) (17,670) -Bank loan - expected interest 4.48% (528) (528) -Creditors and accruals - (119) (119) -
(18,022) (18,022) -
Notes to and forming part of the financial statements for the year ended 28 February 2011

55
Prudent liquidity risk management implies the availability of funding through adequate amount of committed credit facilities. The Group aims to maintain flexibility in funding by keeping committed credit lines available.
The Group has bank funding facilities, excluding overdraft facilities, of $35.0 million (2010: $45.0 million) available at variable rates. The amount undrawn at balance date was $22.8 million (2010: $27.3 million).
The Group has fixed the interest rate on $10.0 million of bank loans with the balance at a floating interest rate. The bank loan is structured as a revolving wholesale advance facility with portions of the facility renewing on a regular basis. This leads to the loans being sensitive to interest rate movement in 12 months or less.
The Company position for both 2011 and 2010 reflects the Group position in the case of the bank loans and the overdraft.
(d) Credit riskCredit risk arises from cash deposits with banks and financial institutions, and outstanding receivables.
No collateral is required in respect of financial assets. Management has a credit policy in place and the exposure to credit risk is monitored on an ongoing basis. The nature of the business results in most sales being conducted on a cash basis that significantly reduces the risk that the Group is exposed to. Reputable financial institutions are used for investing and cash handling purposes.
There were no financial assets neither past due nor impaired at balance date (2010: nil).
At balance date there were no significant concentrations of credit risk and the maximum exposure to credit risk is represented by the carrying value of each financial asset in the statement of financial position.
(e) Fair valuesThe carrying values of bank loans and finance leases are the fair value of these liabilities. A Group set-off arrangement is in place between certain bank accounts operated by the Group.
Sensitivity analysis In managing interest rate and currency risks, the Group aims to reduce the impact of short-term fluctuations on the Group’s earnings. Over the longer term, however, permanent changes in foreign exchange and interest rates on a weighted average balance will have an impact on profit.
At 28 February 2011, it is estimated that a general increase of one percentage point in interest rates would decrease the Group and Parent’s profit before income tax and equity by approximately $0.1 million (2010: $0.1 million). A one percentage point decrease in interest rates would increase the Group and Parent’s profit before income tax and equity by approximately $0.1 million (2010: $0.1 million).
A general increase of one percentage point in the value of the New Zealand dollar against other foreign currencies would have minimal impact on the cost of the Group’s directly imported ingredients denominated in foreign currencies (Parent: nil).
Capital risk managementThe Group’s capital comprises share capital, reserves, retained earnings and debt.
The Group’s objectives when managing capital are to safeguard the Group’s ability to continue to operate as a going concern, to maintain an optimal capital structure commensurate with risk and return and to reduce the cost of capital.
In order to maintain or adjust the capital structure, the Group may adjust the amount of dividends paid to shareholders, return capital to shareholders, issue new shares or sell assets to reduce debt or draw down more debt.
The Group is subject to a number of externally imposed bank covenants as part of the terms of its secured bank loan facility.
The most significant covenants relating directly to capital management is the ratio of total debt to earnings before interest, tax and amortisation (EBITA) and restrictions relating to acquiring its own shares.
The specific covenants relating to financial ratios the Group is required to meet are:
• debtcoverageratio(i.e.netborrowingstoEBITA),and
• fixedchargescoverageratio(i.e.EBITLtototalfixedcharges),withEBITLbeingEBITbeforeleasecosts.Fixedchargescompriseinterest and lease costs.
The covenants are monitored and reported to the bank on a quarterly basis. These are reviewed by the Board on a monthly basis.
There have been no breaches of the covenants during the period.
Notes to and forming part of the financial statements for the year ended 28 February 2011

56
24. Commitments(a) Capital commitmentsThe Group has capital commitments which are not provided for in these financial statements, as follows:
Group
$NZ000's 2011 2010
Store development 7,588 11,004
The Parent has no capital commitments (2010: nil).
(b) Operating lease commitments Non-cancellable operating lease rentals are payable as follows:
Group
$NZ000's 2011 2010
Not later than one year 16,549 16,187Later than one year but not later than two years 14,885 13,082Later than two years but not later than five years 29,652 27,507Later than five years 25,408 14,658
86,494 71,434
Prior year comparative information has been restated to correct an overstatement of total operating lease commitments of $14.9 million. This has no impact on the statement of comprehensive income or the statement of financial position and has only affected this note disclosure.
The parent has no operating lease commitments (2010: nil).
(c) Renewal rights of operating leases The Group has entered into a number of operating lease agreements for retail premises. The lease periods vary and many have an option to renew. Lease payments are increased in accordance with the lease agreements to reflect market rentals. The table below summarises the Group’s lease portfolio.
Right of renewal No right of renewal
2011 2010 2011 2010
Number of leases expiring:Not later than one year 28 40 11 14Later than one year but not later than two years 15 29 7 7Later than two years but not later than five years 82 82 20 15Later than five years 53 38 8 9
Notes to and forming part of the financial statements for the year ended 28 February 2011

57
(d) Finance lease commitments The carrying amount of finance leases in relation to computer and related equipment for the Group as at 28 February 2011 is $0.1 million (2010: $0.1 million).
The non-cancellable finance lease rentals are payable as follows:
Group
$NZ000's 2011 2010
Minimum lease payments of:Not later than one year 136 208Later than one year but not later than two years 131 39Later than two years but not later than five years 76 50
343 297Future lease finance charges (46) (26)Net finance lease liability 297 271
Current 109 192Non-current 188 79
297 271
The fair value of finance leases equals their carrying amount as the impact of discounting is not significant.
Notes to and forming part of the financial statements for the year ended 28 February 2011

58
Group Company
$NZ000's 2011 2010 2011 2010
Total profit after taxation attributable to shareholders 24,312 19,536 13,802 11,297Add items classified as investing / financing activities:Loss on disposal of property, plant and equipment 485 433 - -Other non-operating costs of exiting Pizza Hut Victoria - 38 - -
485 471 - -Add / (less) non-cash items:Depreciation 12,622 12,003 - -Disposal of goodwill 1,000 - - -Increase / (decrease) in provisions 118 (119) - -Amortisation of intangible assets 899 1,094 - -Write-off of franchise fees 58 57 - -Impairment on property, plant and equipment 898 396 - -Net increase in deferred tax asset (479) (1,433) - -Change in fair value of derivative financial instruments 157 - 157 -Tax effect of derivative financial instruments 61 (61) 61 (61)
15,334 11,937 218 (61)Add / (less) movement in working capital:Decrease in inventories 33 276 - -Increase in other debtors and prepayments (570) (218) - -Increase / (decrease) in trade creditors and other payables 1,040 3,123 (44) 159(Decrease) / increase in income tax payable (936) 2,938 - -Decrease in income tax 901 650 901 650
468 6,769 857 809
Net cash from operating activities 40,599 38,713 14,877 12,045
25. Net cash flow from operating activitiesThe following are definitions of the terms used in the statements of cash flows:
Cash and cash equivalentsCash and cash equivalents are comprised of cash at bank, cash on hand and overdraft balances.
Investing activities Investing activities are those activities relating to the acquisition, holding and disposal of property, plant and equipment, intangibles and investments. Investments can include securities not falling within the definition of cash.
Financing activitiesFinancing activities are those activities which result in changes in the size and composition of the capital structure of the Company.
Operating activitiesOperating activities include all transactions and other events that are not investing or financing activities.
The following is a reconciliation between the surplus after taxation for the year shown in the statement of comprehensive income and the net cash flow from operating activities.
Notes to and forming part of the financial statements for the year ended 28 February 2011

59
26. Financial assets and financial liabilities by categoryGroup Company
$NZ000's 2011 2010 2011 2010
Loans and receivablesOther debtors 2,129 333 - -Cash and cash equivalents 795 826 39 92
2,924 1,159 39 92
Derivatives used for hedgingDerivative financial instruments - assets - 203 - 203
Derivatives held at fair value through profit or lossDerivative financial instruments - liabilities 157 - 157 -
157 203 157 203
Financial liabilities at amortised costLoans and finance leases - non-current 12,398 79 12,210 -Loans and finance leases - current 109 17,862 - 17,670Creditors and accruals (excluding indirect and other taxes) 28,228 24,665 75 119Amounts payable to subsidiary companies - - 136,647 131,286Liabilities associated with assets classified as held for sale 14 311 - -
40,749 42,917 148,932 149,075
27. Contingent liabilitiesThere are no contingent liabilities that the directors consider will have a significant impact on the financial position of the Company and Group (2010: nil).
Parent and ultimate controlling partyThe immediate parent and controlling party of the Group is Restaurant Brands New Zealand Limited.
Identity of related parties with whom material transactions have occurredNote 11 identifies all entities within the Group. All of these entities are related parties of the Company.
In addition, the directors and key management personnel of the Group are also related parties.
28. Related party disclosures (a) SubsidiariesMaterial transactions within the Group are loans and advances to and from Group companies and dividend payments. All inter-company group loans in the Parent are non-interest bearing, repayable on demand and disclosed as a current liability.
During the year, the Parent was advanced $5.4 million by its subsidiary company (2010: $13.6 million). At balance date the amount owed to subsidiary companies was $136.6 million (2010: $131.3 million). During the year, the Parent received $14.6 million in dividends from its subsidiary company (2010: $12.3 million).
(b) Other transactions with entities with key management or entities related to themDuring the year, the Group made stock purchases of $0.2 million from Charlie’s Group Limited (2010: $0.1 million), a company of which Restaurant Brands director Ted van Arkel is chairman. There was nil owing as at 28 February 2011 (2010: nil).
(c) Key management and director compensationKey management personnel comprises members of the Senior Leadership Team. Key management personnel compensation comprised short-term benefits for the year ended 28 February 2011 of $2.4 million (2010: $1.5 million) and other long-term benefits of $14,000 (2010: $11,000). Directors’ fees were $0.2 million (2010: $0.2 million).
Notes to and forming part of the financial statements for the year ended 28 February 2011

60
(d) Share options issued to key management personnelAt balance date, 31,674 options issued under the employee share option plan (refer to Note 29) to key management personnel remain outstanding (2010: 76,045). During the year, 44,371 options were exercised (2010: 15,678). The table below summarises the movement in outstanding options during the year.
Date of issue Exercise priceOutstanding options at
28 February 2010 Exercised in yearOutstanding options at
28 February 2011
12-Sep-01 $1.50 13,492 (13,492) -13-Sep-02 $1.85 22,464 (11,437) 11,02723-Sep-03 $1.39 40,089 (19,442) 20,647
Total 76,045 (44,371) 31,674
29. Employee share growth share option planThe Company had established an employee share option plan (“the Plan”) for certain employees, under which it issued options at no cost for shares in the Company to the employees. The holder of an option is entitled to subscribe for one fully paid share for each option held (adjusted for bonus share issues), at an exercise price that is determined by reference to the market price at the time of issue of the options.
On the anniversary date of issue in each subsequent year, 20% of the options issued become exercisable. Options only remain exercisable (subject to certain conditions and legislative provisions) whilst holders remain employed by the Company. The options terminate 10 years from the date they are issued and are equity settled. Principal officers and employees of the Company that participated in the Plan received an annual issue of options in respect of the number of shares equal to approximately 10% of their eligible earnings divided by the exercise price per share.
Options issued and outstanding under the Plan:
Date of issue Exercise price Issued
Outstanding options at
28 February 2010 Exercised in year Forfeited in year
Outstanding options at
28 February 2011
5-Jun-97 $2.20 546,213 - - - -31-Aug-98 $0.94 1,318,062 - - - -15-Sep-99 $1.32 1,078,467 - - - -11-Sep-00 $1.05 1,494,368 90,273 (53,744) (36,529) -12-Sep-01 $1.50 1,010,122 180,530 (134,495) (3,754) 42,28113-Sep-02 $1.85 905,128 194,316 (112,906) (11,608) 69,80223-Sep-03 $1.39 1,228,423 285,931 (181,716) (17,196) 87,019
Total 7,580,783 751,050 (482,861) (69,087) 199,102
Weighted average exercise price $1.36 $1.49 $1.49 $1.29 $1.57
In April 2003 the Plan was terminated and the final allocation of options was the September 2003 allocation. All existing rights with respect to options which have already been granted will be maintained.
The percentage of total shares on issue was 0.2% (2010: 0.8%).
The weighted average remaining life of outstanding options at balance date was 1.8 years (2010: 2.5 years).
In March 2000 there was a 1:12 taxable bonus share issue. Therefore options issued prior to and exercised after this date will have a corresponding adjustment to the number of shares issued.
Refer to Note 20 for details regarding the guarantees between Group companies.
Notes to and forming part of the financial statements for the year ended 28 February 2011

61
30. Subsequent eventSubsequent to balance date, the directors have declared a fully imputed final dividend of 10.0 cents per share for the year ended 28 February 2011 (2010: 8.0 cents).
Notes to and forming part of the financial statements for the year ended 28 February 2011
31. Canterbury earthquakeOn 22 February 2011 the Canterbury region suffered a major earthquake. The Company operates 19 stores in the affected area and all stores were closed for a period of time. Fourteen stores re-opened subsequent to balance date while five stores remain closed. Of the five stores still closed, four are situated in the central business district area to which authorities have not allowed access.
Management has determined, based on current information available, that property, plant and equipment amounting to $0.6 million associated with the four closed stores in the central business district have been impaired at balance date. This has been included as a non-trading item in the statement of comprehensive income. Insurance policies are in place for both material damage and business interruption cover for losses incurred.

62
Independent auditors’ report to the shareholders of Restaurant Brands New Zealand Limited
Report on the Financial StatementsWe have audited the financial statements of Restaurant Brands New Zealand Limited on pages 26 to 61, which comprise the statements of financial position as at 28 February 2011, the statements of comprehensive income and statements of changes in equity and statements of cash flow for the year then ended, and the notes to the financial statements that include a summary of significant accounting policies and other explanatory information for both the Company and the Group. The Group comprises the Company and the entities it controlled at 28 February 2011 or from time to time during the financial year.
Directors’ Responsibility for the Financial StatementsThe Directors are responsible for the preparation of these financial statements in accordance with generally accepted accounting practice in New Zealand and that give a true and fair view of the matters to which they relate and for such internal controls as the Directors determine are necessary to enable the preparation of financial statements that are free from material misstatement, whether due to fraud or error.
Auditors’ ResponsibilityOur responsibility is to express an opinion on these financial statements based on our audit. We conducted our audit in accordance with International Standards on Auditing (New Zealand) and International Standards on Auditing. These standards require that we comply with relevant ethical requirements and plan and perform the audit to obtain reasonable assurance about whether the financial statements are free from material misstatement.
An audit involves performing procedures to obtain audit evidence about the amounts and disclosures in the financial statements. The procedures selected depend on the auditors’ judgment, including the assessment of the risks of material misstatement of the financial statements, whether due to fraud or error. In making those risk assessments, the auditor considers the internal controls relevant to the Company and Group’s preparation of financial statements that give a true and fair view of the matters to which they relate, in order to design audit procedures that are appropriate in the circumstances, but not for the purpose of expressing an opinion on the effectiveness of the Company and Group’s internal control. An audit also includes evaluating the appropriateness of accounting policies used and the reasonableness of accounting estimates, as well as evaluating the overall presentation of the financial statements.
We believe that the audit evidence we have obtained is sufficient and appropriate to provide a basis for our audit opinion.
We have no relationship with, or interests in, Restaurant Brands New Zealand Limited or any of its subsidiaries other than in our capacities as auditors and providers of other assurance services in relation to the interim financial statements, certain compliance certificates for third parties and audit of the Company’s share registry. These matters have not impaired our independence as auditors of the Company and Group.
OpinionIn our opinion, the financial statements on pages 26 to 61:
(i) comply with generally accepted accounting practice in New Zealand;
(ii) comply with International Financial Reporting Standards; and
(iii) give a true and fair view of the financial position of the Company and the Group as at 28 February 2011, and their financial performance and cash flows for the year then ended.
Report on Other Legal and Regulatory RequirementsWe also report in accordance with Sections 16(1)(d) and 16(1)(e) of the Financial Reporting Act 1993. In relation to our audit of the financial statements for the year ended 28 February 2011:
(i) we have obtained all the information and explanations that we have required; and
(ii) in our opinion, proper accounting records have been kept by the Company as far as appears from an examination of those records.
Restriction on Distribution or UseThis report is made solely to the Company’s shareholders, as a body, in accordance with Section 205(1) of the Companies Act 1993. Our audit work has been undertaken so that we might state to the Company’s shareholders those matters which we are required to state to them in an auditors’ report and for no other purpose. To the fullest extent permitted by law, we do not accept or assume responsibility to anyone other than the Company and the Company’s shareholders, as a body, for our audit work, for this report or for the opinions we have formed.
Chartered Accountants Auckland7 April 2011

63
Shareholder information as at 12 April 2011
1. Stock exchange listingThe Company’s ordinary shares are listed on the New Zealand Stock Exchange (NZX).
2. Distribution of security holders and security holdings
Size of holding Number of security holders Number of securities
1 to 999 1,098 19.98% 586,075 0.60%
1,000 to 4,999 2,901 52.79% 5,474,791 5.60%
5,000 to 9,999 691 12.57% 4,479,006 4.58%
10,000 to 49,999 702 12.77% 12,315,293 12.60%
50,000 to 99,999 52 0.95% 3,315,788 3.39%
100,000 to 499,999 43 0.78% 7,529,450 7.70%
500,000+ 9 0.16% 64,062,463 65.53%
5,496 100.00% 97,762,866 100.00%
Geographic distributionNew Zealand 5,299 96.42% 91,339,986 93.43%
Australia 111 2.02% 5,511,744 5.64%
Rest of world 86 1.56% 911,136 0.93%
5,496 100.00% 97,762,866 100.00%
3. 20 largest registered holders of quoted equity securitiesNumber of
ordinary shares
Percentage of ordinary
shares
New Zealand Central Securities Depository Limited 51,053,390 52.22%
Diab Investments NZ Limited 5,000,000 5.11%
FNZ Custodians Limited 2,316,171 2.37%
Waterview Custodian Limited 1,717,220 1.76%
Investment Custodial Services Limited (account R) 1,178,759 1.21%
Investment Custodial Services Limited (account C) 811,030 0.83%
Thomas Joseph Menzies 732,000 0.74%
JA Hong Koo & Pyung Keum Koo 641,000 0.66%
New Zealand Depository Nominee Limited (account 1) cash account 612,893 0.63%
Moon Chul Choi & Keum Sook Choi 440,000 0.45%
Matthew Charles Goodson 436,666 0.44%
NZPT Custodians (Grosvenor) Limited 314,543 0.32%
Alan John Green 300,000 0.31%
Roger John Williams 288,000 0.29%
Russel Ernest George Creedy 252,229 0.26%
Linda Louise Creedy 250,000 0.26%
Michael Zheng 240,000 0.24%
Sally Tetro (G D Tetro No 3 account) 230,000 0.24%
Yeong Hoe Koo & Yong Ran Koo 224,000 0.23%
Orange Nominees Limited 212,000 0.22%
67,249,901 68.79%

64
New Zealand Central Securities Depository Limited (NZCSD) is a depository system which allows electronic trading of securities to its members. As at 12 April 2011, the NZCSD holdings in Restaurant Brands were:
Number of ordinary
shares
Percentage of ordinary
shares
Citibank Nominees (New Zealand) Limited 19,875,854 20.33%Accident Compensation Corporation 6,988,205 7.15%Tea Custodians Limited 4,511,720 4.62%Westpac NZ Shares 2002 Wholesale Trust 3,244,181 3.32%HSBC Nominees (New Zealand) Limited A/C State Street 2,682,638 2.74%New Zealand Superannuation Fund Nominees Limited 2,625,178 2.69%BT NZ Unit Trust Nominees Limited 2,221,176 2.27%Custody and Investment Nominees Limited 2,032,432 2.08%National Nominees New Zealand Limited 1,634,690 1.67%NZ Guardian Trust Investment Nominees Limited 1,372,113 1.40%Premier Nominees Ltd - Onepath Wholesale Australasian Share Fund 1,361,485 1.39%JPMorgan Chase Bank NA 901,991 0.92%HSBC Nominees (New Zealand) Limited 603,445 0.62%New Zealand Equity Nominee Pool 356,400 0.36%Mint Nominees Limited 141,944 0.15%Premier Nominees Ltd - Onepath Wholesale NZ Share Fund 130,364 0.13%Public Trust O/A Permanent Nominees Limited Tower NZ Equity Trust 111,063 0.11%Onepath (NZ) Nominees Limited 101,043 0.10%Cogent Nominees (NZ) Limited 47,333 0.05%Guardian Trust Investment Nominees (RWT) Limited 46,335 0.05%Asteron Life Limited 35,400 0.04%Proteus Suncorp Wealth Management 28,400 0.03%
51,053,390 52.22%
4. Substantial security holdersThe following persons have given substantial security holder notices as shown by the register kept by the Company in accordance with section 35C of the Securities Markets Act 1988.
Number of shares
Percentage of voting
securities
Milford Asset Management 7,147,412 7.31%Accident Compensation Corporation 7,138,205 7.30%D Diab 5,000,000 5.14%Westpac Banking Corporation and BT Funds Management (NZ) Limited 4,899,652 5.01%
5. Shares on issueAs at 12 April 2011, the total number of ordinary shares on issue was 97,762,866.
6. Directors’ security holdings
7. Stock exchange waiverNo waivers were sought or relied on from NZX during the year.
Equity securities held
2011 2010
E K van Arkel 50,000 50,000D Diab 5,000,000 5,000,000
Shareholder information as at 12 April 2011
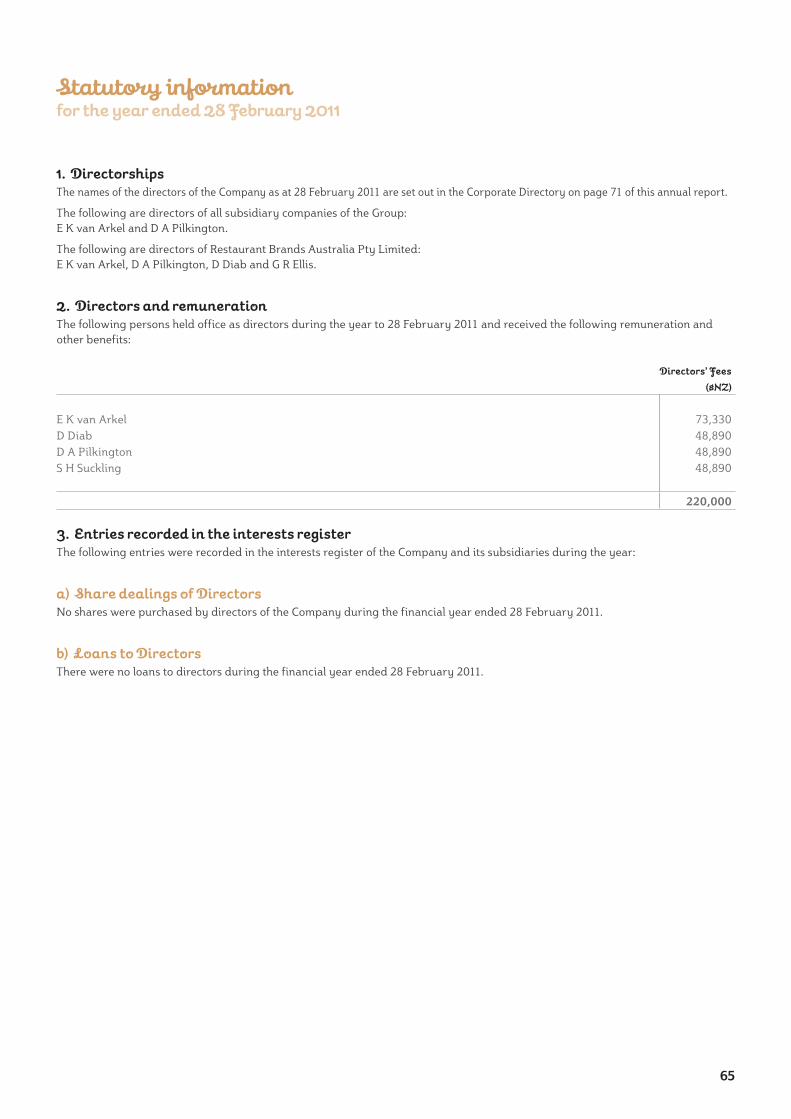
65
Statutory information for the year ended 28 February 2011
1. DirectorshipsThe names of the directors of the Company as at 28 February 2011 are set out in the Corporate Directory on page 71 of this annual report.
The following are directors of all subsidiary companies of the Group: E K van Arkel and D A Pilkington.
The following are directors of Restaurant Brands Australia Pty Limited: E K van Arkel, D A Pilkington, D Diab and G R Ellis.
2. Directors and remunerationThe following persons held office as directors during the year to 28 February 2011 and received the following remuneration and other benefits:
Directors’ Fees
($NZ)
E K van Arkel 73,330 D Diab 48,890 D A Pilkington 48,890 S H Suckling 48,890
220,000
3. Entries recorded in the interests registerThe following entries were recorded in the interests register of the Company and its subsidiaries during the year:
a) Share dealings of DirectorsNo shares were purchased by directors of the Company during the financial year ended 28 February 2011.
b) Loans to DirectorsThere were no loans to directors during the financial year ended 28 February 2011.

66
c) General disclosure of interestIn accordance with Section 140 (2) of the Companies Act 1993, directors of the Company have made general disclosures of interest in writing to the board of positions held in other named companies or parties as follows:
Name Position Party
E K van Arkel Chairman Charlie's Group Limited (and subsidiaries)Chairman Unitec New Zealand Limited (and subsidiaries)Chairman Colorite Group LimitedChairman Health Benefits LimitedDirector Lang Properties LimitedDirector Van Arkel & Co LimitedDirector AWF Group Limted (previously named Allied Work Force Group Limited)Director Danske Mobler LimitedDirector Auckland Regional Chamber of Commerce & Industry LimitedDirector Lockwood Group LimitedDirector Postie Plus Group LimitedDirector Nestle New Zealand Limited
S H Suckling Chairperson New Zealand Qualifications AuthorityChairperson Barker Fruit Processors Limited (and subsidiaries)Chairperson HSR Governance LimitedChairperson Annah Stretton Clothing Limited and associated companiesChairperson Carter Price Rennie Limited Chairperson ECL Group LimitedDirector TYTM Development LimitedDirector Acemark Holdings LimitedDirector Oxford Health Group Limited and Oxford Clinic Hospital LimitedMember Takeovers Panel
D A Pilkington Chairman Ruapehu Alpine Lifts LimitedChairman Prevar LimitedChairman and Director Hellers LimitedDirector Ballance Agri-Nutrients Limited (and subsidiaries)Director Zespri Group Limited (and subsidiaries)Director Douglas Pharmaceuticals LimitedDirector and Shareholder NZ Biotechnologies LimitedDirector Port of Tauranga LimitedDirector Rangatira LimitedDirector Excelsa Associates LimitedMember Wellington City Council Audit and Risk Management Sub-CommitteeTrustee New Zealand Community Trust
D Diab Director Diab Investments NZ LimitedDirector Diab Pty LimitedDirector Diab Investments Pty LimitedDirector Mainplay Investments Pty LimitedDirector Diab Investments II Pty LimitedDirector Pizza Hut Adco Pty LimitedDirector Mirrapol Holdings Pty LimitedDirector Pizza Advertising Co-Operative AustraliaPresident Australasian Pizza Association Inc
d) Directors’ indemnity and insuranceThe Company has insured all its directors and the directors of its subsidiaries against liabilities to other parties (except the Company or a related party of the Company) that may arise from their position as directors. The insurance does not cover liabilities arising from criminal actions.
The Company has executed a deed of indemnity indemnifying all directors to the extent permitted by section 162 of the Companies Act 1993.
Statutory information for the year ended 28 February 2011

67
4. Employees’ remunerationDuring the year the following number of employees or former employees received remuneration of at least $100,000:
Number of employees
2011 2010
$100,000 - $109,999 9 8$110,000 - $119,999 4 7$120,000 - $129,999 5 3$130,000 - $139,999 2 2$140,000 - $149,999 3 3$150,000 - $159,999 1 -$160,000 - $169,999 2 -$170,000 - $179,999 1 1$180,000 - $189,999 2 -$200,000 - $209,999 1 -$280,000 - $289,999 1 -$290,000 - $299,999 - 1$440,000 - $449,999 1 -$580,000 - $589,999 - 1$960,000 - $969,999 1 -
33 26
5. Subsidiary company directorsNo employee of Restaurant Brands New Zealand Limited appointed as a director of Restaurant Brands New Zealand Limited or its subsidiaries receives, or retains any remuneration or other benefits, as a director. The remuneration and other benefits of such employees, received as employees, are included in the relevant bandings for remuneration disclosed under Note 4 above.
Statutory information for the year ended 28 February 2011

68
Statement of corporate governance for the year ended 28 February 2011
OverviewThe board of Restaurant Brands New Zealand Limited is committed to the guiding values of the Company: integrity, respect, continuous improvement and service. Whilst not formally constituted into a code of ethics, it expects that management and staff ultimately subscribe to these values and use them as a guide to making decisions. These values are reflected in a series of formal policies covering such matters as:
• Conflictsofinterest• Useofcompanyproperty• Useofcompanyinformation• Compliancewithapplicablelaws
ResponsibilityThe board is responsible for the proper direction and control of the Company’s activities, including setting strategic direction, approval of significant expenditures, policy determination, stewardship of the Company’s assets, identification of significant business risks, legal compliance and monitoring management performance.
DelegationThe board has delegated responsibility for the day-to-day leadership and management of the Company to the Chief Executive Officer (CEO) who is required to do so in accordance with board direction. The CEO’s performance is reviewed each year by the board. The review includes a formal performance appraisal against measured objectives together with a qualitative review, including a 360 feedback process.
The board has approved a schedule of delegated authorities affecting all aspects of the Company’s operation. This is reviewed from time to time as to appropriateness and levels of delegation.
Composition and focusAs at 28 February 2011, the board comprised four non-executive directors (including the Chairman). In addition to committee responsibilities (below), individual board members work directly with management in major initiatives such as acquisitions and asset rationalisations.
Ted van Arkel, David Pilkington and Sue Suckling are considered by the board to be independent under the NZSX Listing Rules. Danny Diab is considered not to be independent as he represents a significant shareholding. The board does not have a policy on a minimum number of independent directors.
CommitteesFrom amongst its own members, the board has appointed the following permanent committees:
• Audit Committee. The members of the Audit Committee are David Pilkington (chairman), Ted van Arkel, Sue Suckling and Danny Diab. Danny was appointed to the Audit Committee on 29 April 2010. The Audit Committee is constituted to monitor the veracity of the financial data produced by the Company and ensure controls are in place to minimise the opportunities for fraud or for material error in the accounts.
The Audit Committee meets at least three times a year, with external auditors of the Company and executives performing internal audit management from within the Company. The external auditors also meet with the committee with no Company executive present.
The committee has adopted an audit charter setting out the parameters of its relationship with internal and external audit functions. The charter requires five yearly reviews of the external audit relationship and audit partner rotation.
• Appointments and Remuneration Committee. The members of the Appointments and Remuneration Committee are Ted van Arkel, Danny Diab, Sue Suckling and David Pilkington. David was appointed to the committee on 29 April 2010. This committee is constituted to approve appointments and terms of remuneration for senior executives of the Company; principally the CEO and those reporting directly to the CEO. It also reviews any company-wide incentive and share option schemes as required and recommends remuneration packages for directors to the shareholders. The Appointments and Remuneration Committee has adopted a written charter.
The board does not have a formal nominations committee, as all non-executive directors are involved in the appointment of new directors.
Other sub-committees may be constituted and meet for specific ad hoc purposes as required.

69
Statement of corporate governance for the year ended 28 February 2011
NameBoard Meetings
HeldBoard Meetings
AttendedAudit Committee
Meetings Held
Audit Committee Meetings Attended
Remuneration Committee
Meetings Held
Remuneration Committee
Meetings Attended
E K van Arkel 12 11 4 4 1 1D Diab 12 12 4 4* 1 1D A Pilkington 12 12 4 4 1 1S H Suckling 12 10 4 4 1 1
Board appraisal and trainingThe board has adopted a performance appraisal programme by which it biennially monitors and assesses individual and board performance.
The Company does not impose any specific training requirements on its directors. The board believes all directors have considerable training and expertise. New directors complete an induction programme with company senior management.
Insider tradingAll directors and senior management of the Company are familiar with and have formally acknowledged acceptance of the Company’s “Insider Trading Code” that relates to dealings in securities by directors and employees.
SizeThe constitution prescribes a minimum of three directors and as at balance date there were four members of the board.
Re-electionUnder the terms of the constitution, one third of the directors (two) are required to retire from office at the annual meeting of the Company but may seek re-election at that meeting.
MeetingsThe board normally meets eight to twelve times a year and, in addition to reviewing normal operations of the Company, approves a strategic plan and annual budget each year.
Board meetings are usually scheduled annually in advance, although additional meetings may be called at shorter notice.
Directors receive formal proposals, management reports and accounts in advance of all meetings.
Executives are regularly invited to attend board meetings and participate in board discussion. Directors also meet with senior executives on items of particular interest.
Board and committee meeting attendance for the year ended 28 February 2011 was as follows:
* including meetings three and four as a committee member
Board remunerationDirectors’ fees for the year ended 28 February 2011 were $73,330 for the Chairman and $48,890 for each non-executive director. Refer to the Statutory Information section of the annual report for more detail.
No directors currently take a portion of their remuneration under a performance-based equity compensation plan, although a number of directors do hold shares in the Company.
The terms of any directors’ retirement payments are as prescribed in the constitution and require prior approval of shareholders in general meeting. No retirement payments have been made to any director.
Directors’ indemnity and insuranceThe Company has insured all its directors and the directors of its subsidiaries against liabilities to other parties (except the Company or a related party of the Company) that may arise from their position as directors. The insurance does not cover liabilities arising from criminal actions.
The Company has executed a Deed of Indemnity, indemnifying all directors to the extent permitted by section 162 of the Companies Act 1993.

70
Statement of corporate governance for the year ended 28 February 2011
Risk managementIn managing the Company’s business risks, the board approves and monitors policy and process in such areas as:
• Internalaudit–Regularchecksareconductedbyoperationsandfinancialstaffonallaspectsofstoreoperations.
• Treasurymanagement–ExposuretointerestrateandforeignexchangerisksismanagedinaccordancewiththeCompany’streasury policy.
• Financialperformance–Fullsetsofmanagementaccountsarepresentedtotheboardateverymeeting.Performanceismeasured against an annual budget with periodic forecast updates.
• Capitalexpenditure–Allcapitalexpenditureissubjecttorelevantapprovallevelswithsignificantitemsapprovedbytheboard.The board also monitors expenditure against approved projects and approves the capital plan.
• Insurance–TheCompanyhasinsurancepoliciesinplacecoveringmostareasofrisktoitsassetsandbusiness.Theseinclude material damage and business interruption cover at all of its sites. Policies are reviewed and renewed annually with reputable insurers.
ShareholdingThere is no prescribed minimum shareholding for directors, although some do hold shares in the Company (refer to the Statutory Information section of the annual report for more detail).
Directors may purchase shares upon providing proper notice of their intention to do so and in compliance with the operation of the Company’s “Insider Trading Code” (see above).
Interests registerThe board maintains an interests register. In considering matters affecting the Company, directors are required to disclose any actual or potential conflicts. Where a conflict or potential conflict has been disclosed, the director takes no further part in receipt of information or participation in discussions on that matter.
Shareholder communicationThe board places importance on effective shareholder communication. Half year and annual reports are published each year and posted on the Company’s website, together with quarterly sales releases. From time to time the board may communicate with shareholders outside this regular reporting regime.
Consistent with best practice and a policy of continuous disclosure, external communications that may contain market sensitive data are released through NZX in the first instance. Further communication is encouraged with press releases through mainstream media. The board formally reviews its proceedings at the conclusion of each meeting to determine whether there may be a requirement for a disclosure announcement.
Shareholder attendance at annual meetings is encouraged and the board allows extensive shareholder debate on all matters affecting the Company.
Auditor independenceThe board manages the relationship with its auditors through the Audit Committee. The Company’s external auditors are currently permitted to provide non-audit services to the Company with the approval of the Audit Committee.
Auditors’ remuneration is disclosed in Note 7 to the financial statements.
NZX corporate governance best practice codeIn almost all respects, the Company’s corporate governance practices conform with the NZX Corporate Governance Best Practice Code (the “Code”). The only areas in which the Company’s practices vary from the Code are: it has not adopted a formal code of ethics, does not remunerate directors under a performance based equity compensation plan, does not impose specific training requirements on its directors and does not have a nominations committee.

71
Directors:E K (Ted) van Arkel (Chairman)Sue Helen SucklingDanny DiabDavid Alan Pilkington
Registered Office:Level 3, Westpac Building, Central Park666 Great South RoadPenroseAucklandNew Zealand
Share Registrar:Computershare Investor Services LimitedPrivate Bag 92119Auckland 1142New Zealand
Telephone: (09) 488-8700
Auditors:PricewaterhouseCoopers
Solicitors:Bell GullyHarmos Horton LuskMeredith Connell
Bankers:Westpac Banking Corporation
Contact Details:Postal Address:P O Box 22-749OtahuhuAuckland 1640New Zealand
Telephone: (09) 525-8700Fax: (09) 525-8711E-mail: [email protected]
Corporate directory

72
Annual Meeting:23 June 2011
Close of Register for Final Dividend:10 June 2011
Final Dividend Paid:24 June 2011
Interim Profit Announcement:October 2011
Interim Dividend Paid:November 2011
Financial Year End:29 February 2012
Annual Profit Announcement:April 2012
Financial calendar

