response to reviews of acpd 2014 - atmos-chem-phys … …response to reviews of forest canopy...
TRANSCRIPT
Response to reviews of Forest canopy interactions with nucleation mode particles, by Pryor et al.
Reviewer 1: (1) It would be nice to give a general context how nuclei mode particles distribute vertically,
also in other forests (Introduction). Is it common that small particles are deposited on the foliage inside the canopy and show this kind of vertical trends in forests?
Response: We are aware of very few studies that have attempted vertical profile PSD measurements through forest canopies or indeed PSD above and below canopies. Nevertheless, in response to this question we have added text to the introduction that reports above and below canopy nuclei mode conc. ratios at Hyytiala (a coniferous forest) and to prior work we conducted at MMSF. This is discussed in the introduction in the paragraph that begins; ‘Thus to the first order..’ The text in the modified manuscript reads;
Few direct measurements of vertical ultrafine particle gradients through forest canopies exist, but a limited number of studies have report above and below canopy PSD that provide evidence of substantial canopy-‐capture of ultrafine particles. For example, the mean ratio of nuclei mode (i.e. Dp < 100 nm) concentrations below to above canopy in the coniferous forest at Hyytiälä was reported to be in the range 0.85-‐0.90 (Huang et al., 2014). The mean ratio of below (6-‐m) to above canopy (46-‐m) number concentration ratios for Dp = 6-‐30 nm at MMSF computed using data when nucleation events occurred during December 2006 – December 2008 is ∼ 0.7 (Pryor et al., 2010).
(2) What is the plant physiological mechanism for capturing nanoparticles through the foliage?
Or, are these particles just deposited on the large surfaces presented by trees (simple dry/wet deposition loss)?
Response: There is evidence that leaf micro texture (and leaf orientation) play important roles in particle capture, and indeed that nanoparticles may enter leaves via stomata. This is discussed in the introduction in the paragraph beginning ‘Nucleation mode particles exhibit..’. The text inserted reads;
Nucleation mode particles exhibit high deposition velocities to forest canopies due to their high Brownian diffusion velocities, the large surface area of forests and enhancement of particle capture efficiencies due to leaf micro-‐texture (Petroff et al., 2009). There is also evidence that nano-‐particles may penetrate leaves via the stomata (Burkhardt et al., 2012;Corredor et al., 2009). Actual deposition velocities (surface capture) to forests are complex functions of factors such as leaf orientation, and the key leaf characteristics (width, length and thickness) are variable by species.
(3) The frequency of new particle formation at this site is very high, compared to other mixed forests (e.g. in Michigan; Kanawade et al., ACP 2011). Is this because these nuclei mode particles are transported from polluted regions with high sulfur plumes, as opposed to locally formed in the forest? So, they show lower concentrations near the top canopy than near the ground?
Response: It is not clear based on the relative paucity of long-term measurements what the ‘typical’ NPF frequency is for non-urban regions within eastern North America. The frequency of occurrence of NPF at MMSF based on our long-term measurements is rather similar to Egbert (in Canada) but yes much higher than was reported for the 2009 experiment during
summer in Michigan. We now explicitly address this point in the first paragraph in the beginning of section 3 Results and discussion. The text thus now reads;
PSD data from MMSF collected during 2006-‐2008 indicated NPF on ∼ 46% of classifiable days and that 18% of classifiable days exhibited A class events (Pryor et al., 2010). Data for March 2012 – March 2014 indicate evidence of NPF on 55% of classifiable days, and 27% of classifiable days exhibited A-‐type events (Figure 4). The frequency of NPF at MMSF is similar to that reported for Egbert in Ontario (downwind of Toronto) (Crippa and Pryor, 2013), but is higher than was reported in data collected at a forest in Michigan during 1 July – 3 August 2009 which indicated clear evidence for intense NPF on only two days (Kanawade et al., 2011). NPF at MMSF is likely enhanced by the relatively large local emissions of ammonia and frequent impact of air masses with high sulfuric acid concentrations (Pryor et al., 2011).
(4) The measurements from 3 different heights are interesting. How are the inlet transmission efficiencies different in these sampling locations (with different inlet lengths) (Figure 2)?
Response: Apologies for not being sufficiently clear. The tubing at the three heights is identical in length and all other characteristics (the excess lengths from the lower heights were coiled into large coils – one coil for the 20 m and two for 12 m) and at least in the empirical transmission efficiencies from the three levels were identical. Perhaps further confirmation for equal transmission efficiencies can be gained from the leaf-off period events where nucleation mode conc. were very much more similar to each other. We address this matter in the paragraph in section 2 that begins; ‘The PSD measurements presented..’ The text now reads;
The PSD measurements presented herein were taken at 28 m (near the top of the canopy), 20 m and 12 m (near the bottom of the over-‐storey) (Figure 1c and 1d) using a TSI Fast Mobility Particle Sizer (FMPS 3091) (Figure 1). Using a valve switching system air is drawn sequentially at 17 lpm down 8.9 mm inner diameter copper tubing from each sampling level. To ensure the PSD from the different sampling levels are comparable the dimensions of the three copper sampling tubes are identical. The 12 m level is sampled during 0-‐10 minutes past the hour, the 20 m level is sampled from 10-‐20 minutes past the hour, while the 28 m level is sampled during 20-‐30 minutes past the hour. This sampling pattern is then repeated such that each level is sampled for two 10-‐minute periods within each hour. To avoid unstable flow during the valve switching, we use only the central eight minutes in each 10-‐minute period to derive an estimate of the PSD at each level (in 32 logarithmically spaced channels in the diameter space; 6-‐520 nm). The comparability of PSD measurements from the three sampling lines was evaluated at the beginning and end of the field deployment by moving the tubes to a common sampling height and sampling for three days. Multiple linear regression of the particle concentrations from each of the sampling lines integrated over the nucleation mode indicated variance explanation (R2) > 0.94, slopes of 1±0.12 and intercepts of < 6% of the mean concentration. Similar analyses for the individual size channels with Dp < 350 nm, indicated regression slopes of 1±0.2, intercept < 7% of the mean concentration in that size bin and R2 > 0.8. The residence time in each of the sampling tubes is 7.5 seconds. Empirical tubing penetration efficiencies were obtained by comparing PSD measurements conducted with flow through one of the
sampling lines and without a sampling line (Figure 2). The resulting empirical wall loss corrections are applied to all PSD measurements presented herein.
(5) With regard to the MEGAN-predicted BOVC emissions, especially monoterpenes: Because missions and ambient concentrations of monoterpenes show different diurnal trends, one should not necessarily expect a positive correlation of monoterpene emission with growth rates, as seen in 2013 normal year, as opposed to 2012 drought year. How did you assume monoterpenes are more important for the growth than isoprene, in this forest? The arguments of monoterpene-driven growth presented in this work seem not very convincing.
Response: We did not a priori decide that monoterpenes dominate particle growth (or indeed are more important than isoprene) BUT as we show in Table 1 there is a statistical relationship between GR and monoterpene emissions in 2013 but not with isoprene. So it is not an assumption but a statistical association. It was not one that greatly surprised us given the low volatility of some first stage oxidation products of monoterpenes. I agree that monoterpenes are emitted throughout the day but the emissions scale with T and thus in the absence of other effects (e.g. drought) it seems reasonable there should be a relationship between time integrated terpene emissions and GR IF terpenes are responsible for the particle growth. It maybe we mis-lead the reader by our comment – ‘the specific monoterpene emitted and oxidant concentrations’ we have corrected that to terpene. Other comments: Page 18184. Line 10. Isoprene can suppresses new particle formation in forests, but the mechanisms are not known at present. At least, it is clear that in real forests, thes mechanisms do not involve the oxidants reduction by isoprene (Kanawade et al., ACP Table 1). This is the difference between what is happening in the plant chamber and what is in real forest environments. Response: Totally fair point – we have elaborated on this in the introduction in the paragraph that begins ‘Previous research over temperate forests..’ The text now reads;
However, the cause-‐effect relationships are complex, and the role of BVOC emissions remains uncertain. While monoterpene emissions and concentrations exhibit a positive correlation with NPF and growth (Paasonen et al., 2013), there is evidence of infrequent NPF over forests with high isoprene to monoterpene emission ratios (Kanawade et al., 2011) and inferences from experimental chambers indicate that – at least in some forest environments – isoprene may suppress NPF possibly via a reduction in oxidant availability (Kiendler-‐Scharr et al., 2009).
Page 18185. Line 25. Is the linear relationship of 100 nm particles and temperatures (Paasonen 2013) directly relevant to growth of new particles? Response: Maybe not! Just to clarify the relationship is not linear… Anyway looking at PSD from MMSF and other sites (and of course numerical model output) does imply a substantial fraction of nucleation mode particles DO growth to CCN-relevant sizes. We have included some text along these lines towards the end of the paragraph in section 1 that begins ‘Previous research over temperate forests..’ The text now reads;
While analyses of this postulate have not fully quantified the role of new particle formation (NPF) or growth of nucleated particles by condensation of oxidation products in generation of potential CCN, previous analyses using numerical simulations suggest 45% of global low-‐level cloud CCN at 0.2% supersaturation derive from nucleated particles (Merikanto et al., 2009), and regional-‐scale simulations indicate boundary-‐layer nucleation significantly contributes to CCN-‐

sized particles over eastern North America (Luo and Yu, 2011). Further, while nucleation in the free-‐troposphere likely makes a larger contribution to CCN production, observationally based estimates of survival and growth rates of nucleation particles in the planetary boundary-‐layer imply a non-‐negligible fraction reach 100 nm diameter within 24 hours and thus may contribute to the CCN concentration (Pierce et al., 2014;Westervelt et al., 2013).
Page 18188. Line 25. “associated with” should be “due to”? Response: Quite. Done. Page 18189. Line 20. Dp=6.04 nm. Isn’t this too precise for the instrument used here? Response: We have reworded to say ‘that have a sizing channel mean diameter = 6.04-29.4 nm’ Page 18193. Line 4. Change “significant” to “some”. Response: Well it is statistically significant at the 90% confidence level so it is appropriate to say significant. Page 18193. Line 18. “tress” should be “tree”? Response: Quite. Done. Reviewer 2: 1. The main data analyzed in this manuscript was the PSD measured at three levels between
March 2012 and March 2014. In a couple of places in the manuscript, the authors mentioned that the PSD measurements were presented (i.e., line 13, page 18185; line 24, page 18186, etc.). However, I didn’t find one single figure showing directly the PSD data. While the authors presented some results derived from PSD measurements, I consider it to be necessary to present direct PSD data. I highly recommend that the authors give the seasonally mean PSD measured at three levels during “A” events in 2012 and 2013, respectively. These curves will help the readers better understand the main findings of this manuscript.
Response: It is very difficult to standardize events (such they differ in intensity, start time etc etc) But totally take the point that presenting examples is fruitful. I have thus made a synthesis figure that shows three event days that differ in terms of leaf-on v leaf-off, and event starting nGMD etc to give the reader a sense of the data (and measurements at the different heights). This new Figure is Figure 5. New Figure 5:
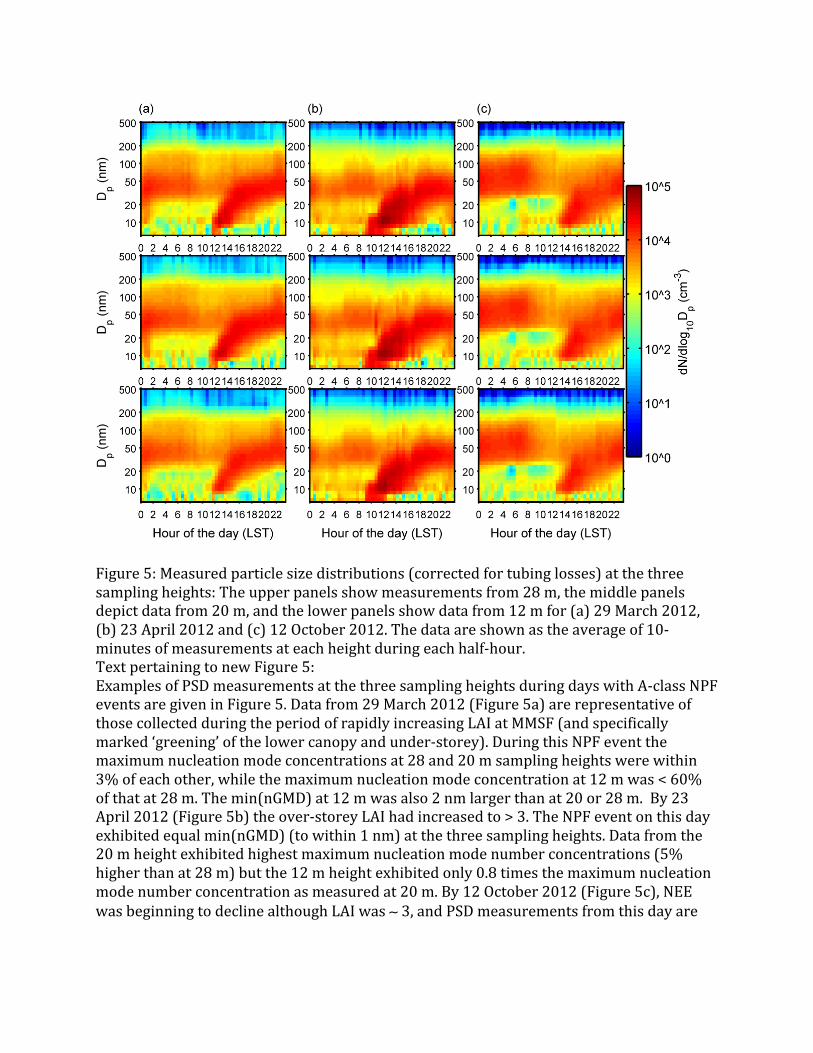
Figure 5: Measured particle size distributions (corrected for tubing losses) at the three sampling heights: The upper panels show measurements from 28 m, the middle panels depict data from 20 m, and the lower panels show data from 12 m for (a) 29 March 2012, (b) 23 April 2012 and (c) 12 October 2012. The data are shown as the average of 10-‐minutes of measurements at each height during each half-‐hour. Text pertaining to new Figure 5: Examples of PSD measurements at the three sampling heights during days with A-‐class NPF events are given in Figure 5. Data from 29 March 2012 (Figure 5a) are representative of those collected during the period of rapidly increasing LAI at MMSF (and specifically marked ‘greening’ of the lower canopy and under-‐storey). During this NPF event the maximum nucleation mode concentrations at 28 and 20 m sampling heights were within 3% of each other, while the maximum nucleation mode concentration at 12 m was < 60% of that at 28 m. The min(nGMD) at 12 m was also 2 nm larger than at 20 or 28 m. By 23 April 2012 (Figure 5b) the over-‐storey LAI had increased to > 3. The NPF event on this day exhibited equal min(nGMD) (to within 1 nm) at the three sampling heights. Data from the 20 m height exhibited highest maximum nucleation mode number concentrations (5% higher than at 28 m) but the 12 m height exhibited only 0.8 times the maximum nucleation mode number concentration as measured at 20 m. By 12 October 2012 (Figure 5c), NEE was beginning to decline although LAI was ∼ 3, and PSD measurements from this day are
representative of many (but not all) events that occurred during the leaf-‐off period, with virtually no gradient in maximum concentration or min(nGMD). 2. One key objective and conclusion of this work is about the capture of nucleation mode particles by the foliage. In page 18185, the authors discussed the size-dependent collection efficiency (E). It will be helpful if the authors can present curves showing the dependence of E on particle sizes, under mean LAI values of different seasons. Response: Deconvoluting this signal is actually rather challenging due to;
(a) The statistical uncertainty on the individual FMPS channels (b) The large event –to- event variability – e.g. the coupling of meteorology to in canopy
chemistry (and indeed in canopy timescale). (c) The role of sweeps in determining the degree of coupling of the PSD to the canopy.
We frankly hoped to find appropriate scaling to allow us to deconvolute growth from canopy scavenging but have not yet been able so to do (at least with any voracity at the size-channel scale). We will continue to attempt this analysis in the coming months but were unable to do so for this manuscript. 3. Figure 5a. Any seasonal variations of the difference of nucleation mode particles measured at three sampling levels? Since LAI was small during November-March, I expect the difference to be small during this period compared to the months with high LAI. Response: Yes quite – we now show example of this in Figure 5. 4. Figure 2, the wall loss is significant for nucleation mode particles (20-90%). What is the uncertainty (or error bar) of the particle transmission efficiency? Could this impact the conclusion about the capture of nucleation mode particles by the foliage (16%)? Response: The corrections are large and of course it is an important source of uncertainty. We now acknowledge this explicitly in the paragraph in section 3 that begins with ‘Nucleation mode number concentrations…’