response of vegetation to drought time-scales across ... · pdf fileresponse of vegetation to...
TRANSCRIPT

Response of vegetation to drought time-scales acrossglobal land biomesSergio M. Vicente-Serranoa,1, Célia Gouveiab,c, Jesús Julio Camarerod, Santiago Begueríae, Ricardo Trigob,f,Juan I. López-Morenoa, César Azorín-Molinaa, Edmond Pashoa, Jorge Lorenzo-Lacruza, Jesús Revueltoa,Enrique Morán-Tejedaa, and Arturo Sanchez-Lorenzog
aInstituto Pirenaico de Ecología, Consejo Superior de Investigaciones Científicas, 50059 Zaragoza, Spain; bCentro deGeofisica Universidad de Lisboa, InstitutoDomLuiz,Faculdade de Ciências, Universidade de Lisboa, 1749-016 Lisbon, Portugal; cEscola Superior de Tecnologia, Instituto Politécnico de Setúbal, 2910-761 Setúbal, Portugal;dFundación Agencia Aragonesa para la Investigación y Desarrollo–Instituto Pirenaico de Ecología, Consejo Superior de Investigaciones Científicas, 50059 Zaragoza,Spain; eEstación Experimental de Aula Dei, Consejo Superior de Investigaciones Científicas, 50059 Zaragoza, Spain; fDepartamento de Engenharias, UniversidadeLusófona, 1749-024 Lisboa, Portugal; and gInstitute for Atmospheric and Climate Science, Eidgenössische Technische Hochschule Zurich, 8006 Zurich, Switzerland
Edited by Robert E. Dickinson, The University of Texas at Austin, Austin, TX, and approved November 27, 2012 (received for review April 27, 2012)
We evaluated the response of the Earth land biomes to drought bycorrelating a drought indexwith three global indicators of vegetationactivity and growth: vegetation indices from satellite imagery, tree-ring growth series, and Aboveground Net Primary Production (ANPP)records. Arid and humid biomes are both affected by drought, andwesuggest that thepersistenceof thewaterdeficit (i.e., thedrought time-scale) could be playing a key role in determining the sensitivity of landbiomes to drought. We found that arid biomes respond to drought atshort time-scales; that is, there is a rapid vegetation reaction as soonaswater deficits below normal conditions occur. This may be due to thefact that plant species of arid regions havemechanisms allowing themto rapidly adapt to changingwater availability. Humid biomes also re-spond todrought at short time-scales, but in this case thephysiologicalmechanisms likely differ from thoseoperating in arid biomes, as plantsusually have a poor adaptability to water shortage. On the contrary,semiarid and subhumid biomes respond to drought at long time-scales, probably because plants are able to withstand water deficits,but they lack the rapid response of arid biomes to drought. Theseresults are consistent among three vegetation parameters analyzedand across different land biomes, showing that the response ofvegetation to drought depends on characteristic drought time-scalesfor each biome. Understanding the dominant time-scales at whichdrought most influences vegetation might help assessing the re-sistance and resilience of vegetation and improving our knowledge ofvegetation vulnerability to climate change.
drought impacts | NDVI | drought adaptation |Standardized Precipitation Evapotranspiration Index | drought index
Drought is a natural phenomenon that occurs when wateravailability is significantly below normal levels over a long pe-
riod and the supply cannot meet the existing demand. Drought isone of the main drivers of the reduction in Aboveground Net Pri-mary Production (ANPP) (1), although land ecosystems differ intheir sensitivity to drought (2). However, a general theory of theeffects of drought on land vegetation is lacking and the subject ofscientific debate (2–4).Understanding the response of land vegetation to drought is a
crucial challenge, as growth and CO2 uptake by plants are con-strained to a large extent by drought (5). Its study is hindered bydifficulties for drought quantification (6) and by the synergisticeffects of temperature rise and drought on vegetation (7, 8).Differences in the physiological response of plant species todrought determine different levels of resistance and resilience towater deficits (9, 10) and ultimately influence the type of impactof a drought, differentiating those that slow growth (11) or re-duce greenness (12), those that lead to loss of biomass (5), andthose that result in plant mortality (8, 13).The quantification of drought is a difficult task, as we usually
identify a drought by its effects on different systems (agriculture,water resources, ecosystem), but there is not a unique physical var-iable we can measure to quantify drought intensity. Droughts aredifficult to pinpoint in time and space, and it is very difficult to
quantify their duration, magnitude, and spatial extent with a singlevariable or metric. Furthermore, the intrinsic multiscalar nature ofdrought introduces another element of uncertainty. In recent yearsthe concept of drought time-scale has been widely used in droughtstudies (6, 14). The term refers to the time lag that typically existsbetween the starting of a water shortage and the identification of itsconsequences, for example by a decrease of theANPPor an increaseof tree mortality. Thus, the time-scales at which different plantspecies respond to drought may differ noticeably (11, 12, 15).The response to water deficit among vegetation types is a crucial
issue underlying geographic patterns of vegetation and a centralconcept to understanding the structure and dynamic of terrestrialecosystems (2, 16). Nevertheless, the way by which the temporalvariability of drought determines vegetation activity across theworld biomes remains largely unknown because vegetation typeshave different characteristic response times (11, 15) and vulnera-bility (9, 10) to drought. Moreover, most studies considered theresponse of vegetation to climate by means of the simple anomalyof precipitation with respect to the average conditions. Such ap-proach neglects the role of temperature and the drought time-scaleat which the response of vegetation is highest. Both elements areessential to identify the response to climate variability and to un-derstand the sensitivity of vegetation to drought.In this study we focus on the analysis of drought impacts on
vegetation by means of three vegetation parameters: (i) vegetationactivity and greenness, (ii) tree radial growth, and (iii) ANPP. Westress the importance of considering the drought time-scale tounderstand drought impacts on a variety of vegetation types andbiomes. For this purpose, we used the Standardized PrecipitationEvapotranspiration Index (SPEI) (17), which is a site-specificdrought indicator of deviations from the average water balance(precipitation minus potential evapotranspiration) (SI Appendix).Different SPEIs are obtained for different time-scales representingthe cumulative water balance over the previous n months. TheSPEI includes the role of temperature on drought severity bymeans of its influence on the atmospheric evaporative demand,hence improving the performance of previous drought indicesbased on precipitation data alone when determining the droughtimpacts on different hydrological and ecological systems (6, 18).
Results and DiscussionConsidering an annual summary of the analysis of the Global In-ventory Modeling and Mapping Studies–Normalized DifferenceVegetation Index (GIMMS-NDVI) dataset, the vegetation activity
Author contributions: S.M.V.-S., C.G., S.B., R.T., and J.I.L.-M. designed research; S.M.V.-S., J.J.C.,and S.B. performed research; S.M.V.-S., C.G., J.J.C., S.B., C.A.-M., E.P., J.L.-L., J.R., E.M.-T., andA.S.-L. analyzed data; and S.M.V.-S., J.J.C., S.B., R.T., and J.I.L.-M. wrote the paper.
The authors declare no conflict of interest.
This article is a PNAS Direct Submission.1To whom correspondence should be addressed. E-mail: [email protected].
This article contains supporting information online at www.pnas.org/lookup/suppl/doi:10.1073/pnas.1207068110/-/DCSupplemental.
52–57 | PNAS | January 2, 2013 | vol. 110 | no. 1 www.pnas.org/cgi/doi/10.1073/pnas.1207068110
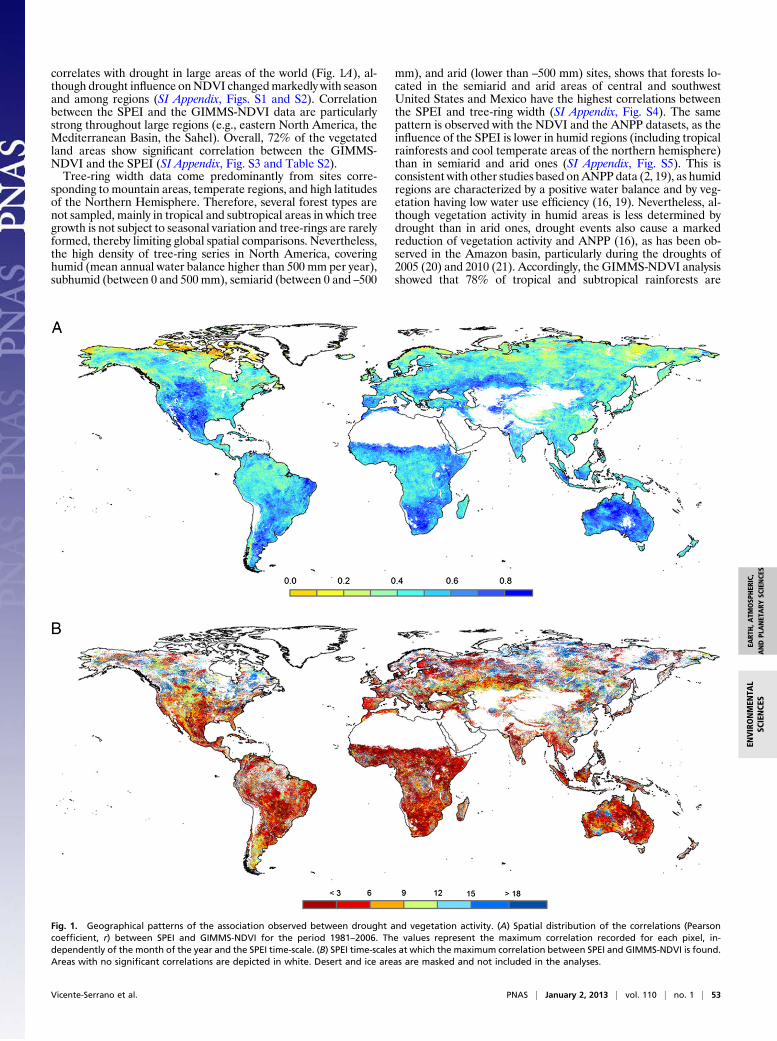
correlates with drought in large areas of the world (Fig. 1A), al-though drought influence onNDVI changedmarkedly with seasonand among regions (SI Appendix, Figs. S1 and S2). Correlationbetween the SPEI and the GIMMS-NDVI data are particularlystrong throughout large regions (e.g., eastern North America, theMediterranean Basin, the Sahel). Overall, 72% of the vegetatedland areas show significant correlation between the GIMMS-NDVI and the SPEI (SI Appendix, Fig. S3 and Table S2).Tree-ring width data come predominantly from sites corre-
sponding to mountain areas, temperate regions, and high latitudesof the Northern Hemisphere. Therefore, several forest types arenot sampled, mainly in tropical and subtropical areas in which treegrowth is not subject to seasonal variation and tree-rings are rarelyformed, thereby limiting global spatial comparisons. Nevertheless,the high density of tree-ring series in North America, coveringhumid (mean annual water balance higher than 500 mm per year),subhumid (between 0 and 500 mm), semiarid (between 0 and –500
mm), and arid (lower than –500 mm) sites, shows that forests lo-cated in the semiarid and arid areas of central and southwestUnited States and Mexico have the highest correlations betweenthe SPEI and tree-ring width (SI Appendix, Fig. S4). The samepattern is observed with the NDVI and the ANPP datasets, as theinfluence of the SPEI is lower in humid regions (including tropicalrainforests and cool temperate areas of the northern hemisphere)than in semiarid and arid ones (SI Appendix, Fig. S5). This isconsistent with other studies based onANPP data (2, 19), as humidregions are characterized by a positive water balance and by veg-etation having low water use efficiency (16, 19). Nevertheless, al-though vegetation activity in humid areas is less determined bydrought than in arid ones, drought events also cause a markedreduction of vegetation activity and ANPP (16), as has been ob-served in the Amazon basin, particularly during the droughts of2005 (20) and 2010 (21). Accordingly, the GIMMS-NDVI analysisshowed that 78% of tropical and subtropical rainforests are
Fig. 1. Geographical patterns of the association observed between drought and vegetation activity. (A) Spatial distribution of the correlations (Pearsoncoefficient, r) between SPEI and GIMMS-NDVI for the period 1981–2006. The values represent the maximum correlation recorded for each pixel, in-dependently of the month of the year and the SPEI time-scale. (B) SPEI time-scales at which the maximum correlation between SPEI and GIMMS-NDVI is found.Areas with no significant correlations are depicted in white. Desert and ice areas are masked and not included in the analyses.
Vicente-Serrano et al. PNAS | January 2, 2013 | vol. 110 | no. 1 | 53
EART
H,A
TMOSP
HER
IC,
ANDPL
ANET
ARY
SCIENCE
SEN
VIRONMEN
TAL
SCIENCE
S

characterized by significant correlation with the SPEI. This per-centage was found to be even higher for the Moderate ResolutionImaging Spectroradiometer (MODIS) images obtained for theperiod 2001–2009 [90.7% for the Enhanced Vegetation Index(EVI), and 90.9% for the NDVI]. The percentage of surface areashowing significant correlations was also high for boreal forests,cool temperate moist forests and rainforests (65.6% for theGIMMS-NDVI, and 85.5% and 84.4% for the MODIS-EVI andMODIS-NDVI datasets, respectively).One of the main climate drivers of the geographical distribution
of vegetation types is the water balance—that is, the differencebetween the annual precipitation and the atmospheric water de-mand (22). The water balance determines forest gradients andvariations of forest biomass (23), but also the resistance of vegeta-tion to drought explains the spatial distribution of vegetation in bothhumid (24) and dry environments (25). It is a reasonable hypothesisto think that not only the average water balance but also the char-acteristics related to the temporal variability (i.e., the frequency,severity, and duration of drought episodes) may play an important
role in explaining the spatial distribution of vegetation types. Fol-lowing the classification of world biomes byHoldridge (SI Appendix,Fig. S6), we found a relationship between themeanwater balance ineach biome and the average influence of droughts on the in-terannual variability of NDVI (Fig. 2A), tree growth (Fig. 2B), andANPP (Fig. 2C). The drought influence was quantified by means ofcorrelations between the SPEI series and the series of the threevegetation parameters. Thus, wet and moist forests of each regionare always located in areas with a positive water balance, where thecontrol of vegetation activity by drought is low, as indicated by lowcorrelation with the SPEI. In cold regions, where temperature butnot precipitation is the major constraint on plant development,there is little influence of drought on vegetation activity, resulting inlow correlations too. In temperate, subtropical, and tropical regions,there are clear gradients of drought influence on vegetation activityas a function of the annual water balance, as revealed by large dif-ferences in the correlation with the SPEI. These areas contain drybiomes (including dry forests, scrublands, steppes) with very lowANPP (1, 2), which show the highest correlations with the SPEI.
Fig. 2. (A) Relationships between the average SPEI/GIMMS-NDVI maximum Pearson correlation coefficients and the average annual water balance (in mm)across the world biomes. (B) Relationships between the average SPEI/tree-ring width correlations and the average annual water balance across the worldbiomes. (C) Relationships between the average SPEI/ANPP correlations and the average annual water balance across the world biomes. The biomes aregrouped according to six eco-regions: subpolar, boreal, cool temperate, warm temperate, subtropical, and tropical. Colors represent the different biomes ofeach one of the six eco-regions in the A, B, and C plots. The symbols represent the different eco-regions in plots A, B, and C. Error bars represent ±1/2 SDs. Thelinear fits and their coefficients of determination are also shown in all graphs.
54 | www.pnas.org/cgi/doi/10.1073/pnas.1207068110 Vicente-Serrano et al.

The time-scales at which droughts affect vegetation provideuseful information to understand how biomes respond to drought.From analysis of the SPEI time-scales at which the maximum cor-relations are recorded, we found that vegetation activity respondspredominantly to short drought time-scales (e.g., 2–4 mo; SI Ap-pendix, Fig. S7), although spatial variability is high (Fig. 1B). Nev-ertheless, it is possible to identify general patterns, as theNDVI, forexample, tends to respond to shorter drought time-scales in aridareas than in humid ones. This pattern is particularly evident inregions that include the most arid biomes. In warm temperate,subtropical, and tropical regions, the most arid biomes tend to re-spond at shorter time-scales than the humidones (Fig. 3). This couldbe related to different mechanisms, which allow plants to reducethe damage caused by water deficits in arid areas (9). Generally,arid ecosystems respond in a highly plastic way to water availability(26), as plant species are adapted to water shortage (27) thanks tophysiological, anatomical, and functional strategies that reducewater loss, respiration costs, photosynthetic activity, and growth rate
(9). When areas with positive water balance are analyzed in-dependently, it is found that correlations between SPEI andNDVI(Fig. 4A, blue), ANPP (Fig. 4B, blue), and tree growth (Fig. 4C)tend to occur at shorter time-scales as the average water balanceincreases. This suggests that the influence of drought time-scales isrelevant to explain the temporal variability of vegetation parame-ters also in humid biomes.In contrast with arid and humid regions, vegetation in semiarid
and subhumid regions tends to respond to drought at longer time-scales. Vegetation of these regions is adapted to tolerate regularlyperiods of water deficit and has physiological mechanisms to copewith these conditions (9). Therefore, it is a reasonable hypothesisto consider that these plant communities must be exposed tosustained water deficits—that is, those registered by long time-scales of the SPEI—to be negatively affected by drought. Thus, inareas with water balance approaching zero, the highest correla-tions between SPEI and NDVI, tree-ring width, and ANPP occurat time-scales between 8–10 mo, but in the areas with the mostpositive water balance, the highest correlations between SPEI andvegetation parameters are found at shorter time-scales than insubhumid regions. There are relatively few tree-ring recordsavailable for wet tropical rainforests. However, the available datafor humid boreal and cool temperate forests show a dominant re-sponse to drought at shorter time-scales than is generally recordedfor semiarid and subhumid forests (Fig. 3). Boreal and cool tem-perate moist forests are thus highly sensitive to drought (28), anindicator that tree species dominating these forests do not toleratewater deficits (29). This may explain why droughts predominantlyaffect tree growth in these areas at short time-scales, as even a shortperiod of water deficit could have negative consequences in vege-tation activity and plant growth. Although tree-ring data are notavailable for the most humid areas of the world such as the tropicalrainforests, the results derived from the NDVI suggest a similarpattern: a predominant effect of short-term droughts on vegetationactivity (Fig. 3 and SI Appendix, Fig. S8). Previous studies iden-tified a lagged response between drought, declining plant growth(30), and forestmortality (31) in similar humid forests.Using variousdrought time-scales, we have shown that this lag might be usuallyshort, as demonstrated by the response of vegetation activity, forestgrowth, and the ANPP to very short drought time-scales.Knowledge of the dominant time-scales at which drought influ-
ences vegetation could be critical for the early detection of vege-tation damage, but it may also be useful for identifying responsepatterns that determine the resistance of diverse vegetation typesand biomes to drought. Drought vulnerability, however, is relatednot only to the resistance of vegetation to water stress but also tohow fast it recovers after the episode has ended—that is, by itsresilience. Drought resilience depends on a variety of factors in-cluding the severity and duration of the water deficit, but also thevegetation type (32), the type and magnitude of the damage (33),the plant growth rates and competition between species (34), andeven variations in environmental conditions recorded at smallspatial scales (35). Although our analysis did not focus on therecovery times of vegetation after drought disturbance, the con-cept of drought time-scales also seems to constitute a promisingtool for analyzing vegetation resilience to drought.It is noteworthy that the highest influence of drought on vege-
tation identified in arid areas does not imply necessarily that plantcommunities from those areas aremore vulnerable to drought thanthose dominant in humid biomes (3, 10). Thus, the short droughttime-scales that mostly affect both arid and humid biomes areprobably indicative of different types of impacts and differentbiophysical mechanisms. In arid and semiarid regions, droughtimpacts usually result in decreased vegetation activity (15) andplant growth (11), but rarely cause plant mortality or long-termdamage, as plant communities commonly exhibit a strong re-sistance to water stress (36), as they contain species that are welladapted to water shortage through different mechanisms (9). Thisis in agreement with studies analyzing long-term trends of vege-tation greenness in arid ecosystems that demonstrated the capacityof such ecosystems to recover the initial greenness values after
Fig. 3. (A) Relationships between the average SPEI time-scales at which themaximumSPEI/GIMMS-NDVI correlation is found and the average annualwaterbalance across eco-regions considering separately negative and positive waterbalances. (B) Relationship between the average SPEI time-scale at which max-imum SPEI/tree-ring correlation is found and the average annual water balanceacross eco-regions. (C) Relationship between the average SPEI time-scale atwhich maximum SPEI/ANPP correlation is found and the average annual waterbalance across eco-regions for negative and positive water balances. Error barsrepresent±1/2 SDs. The linearfits and the coefficients of determination are alsoshown in all graphs. See corresponding colors in the legend of Fig. 2.
Vicente-Serrano et al. PNAS | January 2, 2013 | vol. 110 | no. 1 | 55
EART
H,A
TMOSP
HER
IC,
ANDPL
ANET
ARY
SCIENCE
SEN
VIRONMEN
TAL
SCIENCE
S

severe and long-lasting droughts as soon as water is available (37).Nevertheless, although vegetation in arid regions is usually highlyresistant to drought (3), when strong damages (e.g., tree mortality)occur during very extreme droughts, the recovery rates after theevent has passedmay be slow, as arid woody species have generallyslow growth rates (38). Thus, unusual severe droughts, whichcorrespond to long SPEI time-scales, can cause plantmortality (34)and even trigger desertification processes (35) in arid environ-ments. Moreover, recurrent droughts can produce a progressiveloss of resilience that affects negatively the ability of recovering theinitial state (39), often leading to vegetation change.In general, drought vulnerability is much larger in humid biomes
than in arid ones (3, 24), although we found a lower response todrought in the former. This might be explained by the more com-plex relationship between drought and vegetation activity and plantgrowth in humid areas because they are characterized by watersurplus. Consequently a negative SPEI there does not necessarilyimply a water deficit because thewater balancemay still be positive,albeit lower than usual. Moreover, in humid sites other factorsincluding phenological aspects such as the period of active leafflushing and vapor pressure deficit may influence the effect ofdrought on plants (40). In humid regions, drought impacts aremost probably linked to damages to plant tissues that result in lossof foliar biomass (29, 31), given the general poor tolerance ofplants to water stress (3, 10), but the fast growth rates character-istic of plants of humid regions could allow vegetation to recoverits prior state in a short period as soon as the drought has ended.However, in humid areas, long-lasting or recurrent droughts mayalso be too intense to allow for a fast vegetation recovery, and thiscould help explain some recent plant mortality episodes in humidforests around the world after severe drought events (7, 20, 29).Our results concerning the time-scales of drought are similar
irrespective of the data sources used: NDVI fromNational Oceanicand Atmospheric Administration-Advanced Very High ResolutionRadiometer and MODIS images, EVI fromMODIS images, a vastdataset of tree-ring growth series, and ANPP series across theworld. Therefore, our results should be considered robust and un-likely to be explained by alternative causes, such as (i) possible re-sidual noise in the GIMMS dataset, (ii) the saturation of the NDVIat high values of leaf area index, (iii) the low temporal coverage ofthe MODIS dataset, (iv) the low spatial representativeness of theavailable ANPP series, and (v) the lack of adequate coverage of dry
and very humid regions by the tree-ring growth dataset. Despite theuncertainties present in each dataset, all of them point toward thesame conclusions, and taking into account their complementarynature, this further enhances the robustness of our findings.Overall, our results provide extensive evaluation of the impact of
droughts on global vegetation activity and plant growth. They areparticularly relevant within the changing climate framework becausethe degree to which ecosystems respond to limited water indicateshow responsive they may be to future changes in precipitation andtemperature. Therefore, the assessment of drought impacts onvegetation parameters may improve the accuracy of projections ofvegetation shifts under global change scenarios. Global warming willalmost certainly continue in the future (41), which would implymoreland areas vulnerable to drought stress, including humid areas suchas temperate, mountain, boreal, and wet tropical forests. Vegetationin these areas is already subject to increased drought stress leading tolocal and regional die-off events because of warming-induceddrought stress (7, 29, 31).Althoughwith increased aridity a reductionin vegetation activity might be partially compensated for by risingatmospheric CO2 concentrations, this mechanism will not enhanceproduction under drought conditions because plant physiologicalprocesses are highly constrained by water deficits, independently ofthe atmosphericCO2 concentration (42). Increasing drought severityin humid areas may have unpredictable consequences for the bio-sphere and the global carbon cycle, because the main terrestrialcarbon pool is stored in the humid world biomes (43).In conclusion, we show that vegetation responds to drought
at different characteristic time-scales across regions and biomes.Vegetation of both arid and humid biomes respondmostly at shortdrought time-scales (i.e., a fast reaction of several vegetationparameters is found as soon as relative water deficit occurs), butthe mechanisms that drive this response are most likely very dif-ferent. These mechanisms affect the resistance and resilience ofvegetation to drought stress, conditioning their vulnerability todrought. Understanding the relationship between these mecha-nisms and the characteristics of droughts (for example, as de-termined by the drought time-scale) is crucial for improving ourknowledge of vegetation vulnerability to climate fluctuations andclimate change. As expected from current climate change scenar-ios, the water balance will become more negative in most areas ofthe world as a consequence of warming processes, which willprobably reinforce drought severity worldwide (44).
MethodsTo quantify drought severity we used monthly data of the SPEI at a spatialresolution of 0.5° and time-scales ranging from 1 to 24 mo obtained fromthe SPEIbase (45) (http://sac.csic.es/spei/download.html, SI Appendix). We usedthree different datasets of vegetation parameters, which provide informationon ANPP, leaf photosynthetic activity, and tree radial growth across the world.First, we collected long-term ANPP series from the scientific literature using thepublished tabular data or by digitizing figures. A total set of 40 series thatcontain a minimum of 10 y were collected (SI Appendix, Table S1). The seriescover different biomes and vegetation types. The second dataset was based onannual tree-ring width data, obtained from the International Tree-Ring DataBank (www.ncdc.noaa.gov/paleo/treering.html). From the entire dataset, weselected the tree-ring width series with at least 25 y of data within the period1945–2009. A total number of 1,846 site chronologies were selected and ana-lyzed (SI Appendix). Finally, we included time series of vegetation indicesobtained from long-term satellite imagery. We used the NOAA GIMMS-NDVI(46) from July 1981 to December 2006, at a resolution of 0.1°, available from theGlobal Land Cover Facility (www.glcf.umd.edu/data/gimms). Vegetation indicesfrom the MODIS were also used to replicate the GIMMS-NDVI for the period2001–2009. Monthly composites of the EVI (47) and the NDVI at a spatial reso-lution of 5.6 km from theMOD13A2 dataset were obtained fromNASA (https://lpdaac.usgs.gov). To characterize the spatial distribution of the world biomes,we used the Holdridge classification (48) from the United Nations EnvironmentProgram–Divisionof EarlyWarning andAssessment/Global Resource InformationDatabase–Geneva (www.grid.unep.ch) at a spatial resolution of 0.5°. The GlobalLand Cover Map (http://ionia1.esrin.esa.int/) was used with the purpose ofmasking the urban areas and irrigated lands.
The 0.5° SPEI data series were interpolated to 8 km for 1981–2006 tomatch the spatial resolution of the GIMMS-NDVI and to 5.6 km for the
Fig. 4. Average values of the time-scales (in months) at which the GIMMS-NDVI/SPEI (A), the tree-ring width/SPEI (B), and the ANPP/SPEI (C) maximumcorrelations are recorded, summarized for different ranges of the annualwater balance. The linear fits and the corresponding coefficients of de-termination for negative and positive water balances are also shown.
56 | www.pnas.org/cgi/doi/10.1073/pnas.1207068110 Vicente-Serrano et al.

2001–2009 to match the MODIS vegetation indices. The biweekly GIMMS-NDVI series were monthly composited according to the maximum monthlyvalue to avoid different sources of noise. Taking into account the Gaussianshape of the monthly NDVI distributions (49), the 1981–2006 GIMMS-NDVIand the 2001–2009 MODIS EVI and NDVI series were standardized, accordingto the average and the SDs of the monthly series obtained for each NDVIpixel. In addition, annual ANPP and tree-ring growth series were also stan-dardized before applying the analysis.
The impact of the SPEI interannual variability on vegetation activity, treegrowth, andANPPwas assessed bymeans of parametric correlations using thePearson coefficient for the entire period of available data, and consideringa significance threshold of α < 0.05. Twelve series of the GIMMS-NDVI (oneper month) were obtained per pixel, and each one was correlated (Pearsoncoefficient) to the monthly 1- to 24-mo SPEI series of the pixel for the period1981–2006. For each grid cell, we obtained 288 correlation values (24 foreach month of the year). To eliminate the influence of phenology on theresults, the monthly correlations were summarized seasonally and annually.For this purpose, the highest correlation found in each season was retainedand also the SPEI time-scale at which the maximum seasonal correlation wasobtained. After that, seasonal results were summarized annually followingthe same approach. The same methodology was applied to the MODISdatasets, ANPP, and tree-ring series (SI Appendix).
Maximum annual and seasonal correlations between the GIMMS andMODIS vegetation indices and the SPEI as well as maximum annual corre-lations between tree-ring width and ANPP records and the SPEI were sum-marized according to the Holdridge classification by means of the calculationof the average correlation and average maximum SPEI time-scale for thedifferent biomes. For this purpose, the average aridity conditions in eachbiome were quantified using precipitation and potential evapotranspirationdata taken from the CRU TS3.0 dataset (SI Appendix).
ACKNOWLEDGMENTS. We thank to the two anonymous reviewers for theirhelpful comments, which have noticeably improved the final manuscript. Wealso thank the GIMMS and theMODIS science teamof the National Aeronauticsand Space Administration for providing the remote sensing data. We wouldalso like to thank the Climate Research Unit of the University of East Anglia(United Kingdom) for providing the global land temperature and precipitationdataset used to obtain the SPEIbase and the contributors of the InternationalTree-Ring Data Bank for providing the tree-ring records used in this study. Thiswork was supported by projects financed by the Spanish Commission of Scienceand Technology (CGL2011-27574-CO2-02, CGL2011-27536, andCGL2011-26654)and theAragónGovernment. C.G. andR.T.were supportedby Project PTDC/AAC-CLI/103361/2008 funded by the Portuguese Foundation for Science and Tech-nology. J.J.C. thanks the support of ARAID, and A.S-L. was supported by a post-doctoral fellowship from the Generalitat de Catalunya (2009 BP-A 00035).
1. Webb WL, Lauenroth WK, Szarek SR, Kinerson RS (1983) Primary production andabiotic controls in forests, grasslands, and desert ecosystems in the United States.Ecology 64(1):134–151.
2. Knapp AK, Smith MD (2001) Variation among biomes in temporal dynamics ofaboveground primary production. Science 291(5503):481–484.
3. Maherali H, Pockman WT, Jackson RB (2004) Adaptative variation in the vulnerabilityof woody plants to xylem cavitation. Ecology 85(8):2184–2199.
4. Samanta A, et al. (2010) Amazon forests did not green-up during the 2005 drought.Geophys Res Lett 37(5):L05401, 10.1029/2009GL042154.
5. Ciais Ph, et al. (2005) Europe-wide reduction in primary productivity caused by theheat and drought in 2003. Nature 437(7058):529–533.
6. Vicente-Serrano SM, Beguería S, López-Moreno JI (2011) Comment on “Characteristicsand trends in various forms of the Palmer Drought Severity Index (PDSI) during 1900-2008” by A. Dai. Journal of Geophysical Research-Atmosphere 116(19):D19112,10.1029/2011JD016410.
7. Breshears DD, et al. (2005) Regional vegetation die-off in response to global-change-type drought. Proc Natl Acad Sci USA 102(42):15144–15148.
8. Allen CD, et al. (2010) A global overview of drought and heat-induced tree mortalityreveals emerging climate change risks for forests. For Ecol Manage 259(4):660–684.
9. Chaves MM, Maroco JP, Pereira JS (2003) Understanding plant responses to drought—From genes to the whole plant. Funct Plant Biol 30(3):239–264.
10. McDowell N, et al. (2008) Mechanisms of plant survival and mortality during drought:Why do some plants survive while others succumb to drought? New Phytol 178(4):719–739.
11. Pasho E, Camarero JJ, de Luis M, Vicente-Serrano SM (2011) Impacts of drought atdifferent time scales on forest growth across a wide climatic gradient in north-easternSpain. Agric For Meteorol 151(12):1800–1811.
12. Ji L, Peters AJ (2003) Assessing vegetation response to drought in the northern GreatPlains using vegetation and drought indices. Remote Sens Environ 87(1):85–98.
13. Adams HD, et al. (2009) Temperature sensitivity of drought-induced tree mortalityportends increased regional die-off under global-change-type drought. Proc NatlAcad Sci USA 106(17):7063–7066.
14. McKee TBN, Doesken J, Kleist J (1993) The relationship of drought frequency andduration to time scales. Eighth Conference on Applied Climatology (American Me-teorological Society, Anaheim, CA), pp 179–184.
15. Vicente-Serrano SM (2007) Evaluating the impact of drought using remote sensing ina Mediterranean, semi-arid region. Nat Hazards 40(1):173–208.
16. Huxman TE, et al. (2004) Convergence across biomes to a common rain-use efficiency.Nature 429(6992):651–654.
17. Vicente-Serrano SM, Beguería S, López-Moreno JI (2010) A multi-scalar drought indexsensitive to global warming: The Standardized Precipitation EvapotranspirationIndex – SPEI. J Clim 23(17):1696–1718.
18. Vicente-Serrano SM, et al. (2012) Performance of drought indices for ecological, ag-ricultural and hydrological applications. Earth Interact 16(10):1–27.
19. Schuur EAG (2003) Productivity and global climate revisited: The sensitivity of tropicalforest growth to precipitation. Ecology 84(5):1165–1170.
20. Phillips OL, et al. (2009) Drought sensitivity of the Amazon rainforest. Science 323(5919):1344–1347.
21. Xu L, et al. (2011) Widespread decline in greenness of Amazonian vegetation due tothe 2010 drought. Geophys Res Lett 38(7):L07402, 10.1029/2011GL046824.
22. Stephenson NL (1990) Climatic control of vegetation distribution: The role of thewater balance. Am Nat 135(5):649–670.
23. Stegen JC, et al. (2011) Variation in above-ground forest biomass across broad cli-matic gradients. Glob Ecol Biogeogr 20(5):744–754.
24. Engelbrecht BMJ, et al. (2007) Drought sensitivity shapes species distribution patternsin tropical forests. Nature 447(7140):80–82.
25. Pockman WT, Sperry JS (2000) Vulnerability to xylem cavitation and the distributionof Sonoran Desert vegetation. Am J Bot 87(9):1287–1299.
26. Schwinning S, Sala OE (2004) Hierarchy of responses to resource pulses in arid andsemi-arid ecosystems. Oecologia 141(2):211–220.
27. Lundholm B (1976) Adaptations in arid ecosystems. Can Desert Encroachment BeStopped? Ecological Bull. No. 24, eds Rapp A, Le Houerou NH, Lundholm B (UnitedNations Environmental Programme, Stockholm, Sweden).
28. Barber VA, Juday GP, Finney BP (2000) Reduced growth of Alaskan white spruce inthe twentieth century from temperature-induced drought stress. Nature 405(6787):668–673.
29. Anderegg WRL, et al. (2012) The roles of hydraulic and carbon stress in a widespreadclimate-induced forest die-off. Proc Natl Acad Sci USA 109(1):233–237.
30. Bréda N, Huc R, Granier A, Dreyer E (2006) Temperate forest trees and stands undersevere drought: A review of ecophysiological responses, adaptation processes andlong-term consequences. Ann For Sci 63(16):625–644.
31. Phillips OL, et al. (2010) Drought-mortality relationships for tropical forests. NewPhytol 187(3):631–646.
32. del Cacho M, Lloret F (2012) Resilience of Mediterranean shrubland to a severedrought episode: The role of seed bank and seedling emergence. Plant Biol (Stuttg)14(3):458–466.
33. Lapenis A, Shvidenko A, Shepaschenko D, Nilsson S, Aiyyer A (2005) Acclimatation ofRussian forests to recent changes in climate. Glob Change Biol 11(12):2090–2102.
34. Galiano L, Martínez-Vilalta J, Lloret F (2010) Drought-induced multifactor decline ofScots Pine in the Pyrenees and potential vegetation change by the expansion of co-occurring oak species. Ecosystems (N Y) 13(7):978–991.
35. Vicente-Serrano SM, Zouber A, Lasanta T, Pueyo Y (2012) Dryness is acceleratingdegradation of vulnerable shrublands in semiarid Mediterranean environments. EcolMonogr 82(4):407–428.
36. Craine JM, et al. (2012) Global diversity of drought tolerance and grassland climate-change resilience. Nature Climate Change, 10.1038/nclimate1634.
37. Heumann BW, Seaquist JW, Eklundh L, Jönsson P (2007) AVHRR derived phenologicalchange in the Sahel and Soudan, Africa, 1982-2005. Remote Sens Environ 108(4):385–392.
38. Bonet A (2004) Secondary succession of semiarid Mediterranean old-fields in south-eastern Spain: Insights for conservation and restoration of degraded lands. J AridEnviron 56(2):213–233.
39. Lloret F, Siscart D, Dalmases C (2004) Canopy recovery after drought dieback in holm-oak Mediterranean forests of Catalonia (NE Spain). Glob Change Biol 10(12):2092–2099.
40. Brando PM, et al. (2010) Seasonal and interannual variability of climate and vege-tation indices across the Amazon. Proc Natl Acad Sci USA 107(33):14685–14690.
41. Solomon S, et al. (2007) Climate Change 2007: The Physical Science Basis (CambridgeUniv Press, Cambridge, UK).
42. Smith SD, et al. (2000) Elevated CO2 increases productivity and invasive species successin an arid ecosystem. Nature 408(6808):79–82.
43. Nemani RR, et al. (2003) Climate-driven increases in global terrestrial net primaryproduction from 1982 to 1999. Science 300(5625):1560–1563.
44. Dai A (2012) Increasing drought under global warming in observations and models.Nature Climate Change, 10.1038/nclimate1633.
45. Beguería S, Vicente-Serrano SM, Angulo M (2010) A multi-scalar global drought dataset: The SPEIbase: A new gridded product for the analysis of drought variability andimpacts. Bull Am Meteorol Soc 91(10):1351–1354.
46. Tucker CJ, et al. (2005) An extended AVHRR 8-km NDVI data set compatible withMODIS and SPOT Vegetation NDVI Data. Int J Remote Sens 26(20):4485–5598.
47. Huete A, et al. (2002) Overview of the radiometric and biophysical performance ofthe MODIS vegetation indices. Remote Sens Environ 83(1-2):195–213.
48. Holdridge LR (1947) Determination of world plant formations from simple climaticdata. Science 105(2727):367–368.
49. Peters AJ, et al. (2002) Drought monitoring with NDVI-based Standardized Vegeta-tion Index. Photogramm Eng Remote Sensing 68(1):71–75.
Vicente-Serrano et al. PNAS | January 2, 2013 | vol. 110 | no. 1 | 57
EART
H,A
TMOSP
HER
IC,
ANDPL
ANET
ARY
SCIENCE
SEN
VIRONMEN
TAL
SCIENCE
S