resource atlas of wajir county, kenya - pubs.iied.orgpubs.iied.org/pdfs/g04025.pdf · the process...
TRANSCRIPT

Resource Atlas of Wajir County, Kenya Community-based mapping of pastoralist resources and their attributes
February 2016

Contents
Participatory GIS mapping process .................................................................................................................................................................................................................................................... 1
Background ................................................................................................................................................................................................................................................................................. 1
Mapping process......................................................................................................................................................................................................................................................................... 1
Data management ...................................................................................................................................................................................................................................................................... 2
Wajir maps and data ................................................................................................................................................................................................................................................................... 3
Mapping ...................................................................................................................................................................................................................................................................................... 3
Location .......................................................................................................................................................................................................................................................................................... 6
Infrastructure ................................................................................................................................................................................................................................................................................. 8
Land Use ....................................................................................................................................................................................................................................................................................... 16
Water and Drainage ..................................................................................................................................................................................................................................................................... 24
iii


Participatory GIS mapping process
Background The policy and institutional environment in Kenya is supportive of pastoral livestock development in the ASALs. The Constitution of Kenya (2010) has provisions for strengthening livestock production and transforming ASAL economies, while Kenya Vision 2030 recognizes the importance of livestock production in the ASALs to overall national agricultural development.1
The Constitution of Kenya 2010 introduced devolved government with an Executive and an Assembly. County governments are responsible to provide opportunities for communities and citizens to be more intimately involved in the planning and implementation of development projects that impact on their livelihoods. To support community participation, practical measures are needed to facilitate dialogue and understanding between county government actors and local people. On the one hand, county government staff need to better understand the rationale of local livelihood systems and how different communities plan their activities, particularly in the face of climate change; but, on the other hand, local people also have to understand how county government planning and budgeting systems work.
Participatory digital mapping using satellite imagery and digital earth and other open source Geographic Information Systems (GIS) is a practical tool bridging the knowledge and communication gap between pastoral communities and county government planners. It is offering an effective ‘tool’ for participatory planning and
1 Additional provisions in support of pastoral livestock development are found within Sessional Paper No. 8 of 2012 on the National Policy for the Sustainable Development of Northern Kenya and other Arid Lands, The National Land Policy, the Agricultural Sector Development Strategy (ASDS) 2010 to 2020 and Sessional Paper No. 2 of 2008 on National Livestock Policy.
decision-making in support of climate change adaptation in the drylands of Kenya.
The use of participatory mapping is not new in seeking to capture an understanding of the community and its use of natural resources. These maps are typically drawn on the ground using stones, bits of wood and other easily available material to depict key features such as schools, water points, forest areas, etc. Such processes produce perception maps rich in local knowledge and reflecting community priorities. From the perspective of government planners, however, such maps are of limited use for planning as they lack accurate scales and coordinates – characteristics essential for demarcating the location and extent of resources on which to develop byelaws for their protection and good management.
The process used in Wajir County combines digital mapping with community-drawn perception maps. This offers a number of benefits. While fully capturing the wealth of local knowledge, they contain a built in coordinate system which respond to a global reference grid, enabling their linkage to maps used in formal systems. Furthermore, the coordinate system provides a geographically precise basis from which to discuss natural resource management, making outputs of participation in mapping more universally useable. These benefits, however, need to be carefully balanced to avoid the risk that through this process pastoral resources, that are highly dynamic, are ‘frozen’ in time and space. The flexible nature of digital maps allows users to zoom in and work on specific areas, and then to zoom out to obtain a wider view of the data. This is critical when developing maps of pastoral resources and livelihood strategies that require a presentation of data and analysis at the ecosystem scale, reflecting the dimension at which the system operates.
The participatory GIS mapping process was initiated by the Adaptation Consortium (www.adaconsortium.org), a
government led initiative under the leadership of the National Drought Management Authority within the Ministry of Devolution and Planning. The Consortium works in the arid and semi-arid counties of Garissa, Isiolo, Kitui, Makueini and Wajir. The Consortium consists of Christian Aid working with ADS-Eastern in Kitui and Makueni; International Institute of Environment and Development (IIED) working with Resource Advocacy Programme (RAP) in Isiolo, Womankind Kenya in Garissa, and Arid Lands Development Focus (ALDEF) in Wajir; the Met Office (UK) and the Kenya Meteorological Services (KMS). It is funded by DFID Kenya (UK Aid) under its Strengthening Adaptation and Resilience to Climate Change in Kenya plus programme and CORDAID..
Mapping process The participatory mapping process has adopted Geographic Information System (GIS) workflows within community workshops that has allowed for creation of integrated, consistent and standardised geospatial information.
The process consists of seven steps illustrated below:
Step 1 – Feature and attributes specification with community
Step 2 – Projected digital aerial / satellite comparative assessment
Step 3 – Participants add attributes to features
Step 4 – Spatial and attribute data merged and symbolised to create Community Resource GIS layers
Step 5 – Validation by participants, local government, interest groups
Step 6 – Cycle of mapping and verification to refine maps
Step 7 – GPS log for field based verification / updated image inputs etc
Process
Perceptual and topological maps – relative positional accuracy
Topographically correct features or indicators – for objective / independent verification
Data / Outputs
Enhanced characterisation of natural resources, quality and asset information
Draft integrated map and attribute data in consistent coordinate reference systems
Validated and Accredited geospatial data
Iterative update of feature and attribute information / Integration of data from multiple communities across ASAL.
Map and digital data outputs and Atlas products / analysis / Presentation and visualisation options / Online Information Portal
1
Step 1: Community level meetings to develop perception maps on the ground and/or on paper. The 1st step is the production of a community perception map of the resources important for their livelihood system. This map can be drawn on the ground and should be done in a community setting to enable the participation of a large group of people. Several maps may be produced by smaller sub-groups (women, youth, elders) and then amalgamated. The final map is then copied onto paper.
Step 2. Digital mapping is introduced. This step takes place in a workshop setting with a smaller group of key informants chosen by the community as well as county government planners and technical staff. The presence of the latter is critical to the process of legitimising community knowledge. Following a quick explanation of satellite imagery, Google Earth imagery is projected onto a wall next to the perception maps developed under step 1. The use of Google Earth is used for orientation and toenable participants to navigate the imagery and cross-reference their paper-mapped key resources against thesatellite imagery. Features that participants feel areimportant (e.g. water points, wet and dry season grazingareas, drought reserves, wildlife routes) are thencaptured digitally using open source applications(Quantum GIS (QGIS)) and JOSM, the Open Street Mapediting platform). This produces the coordinates thatpinpoint the locations of natural resources in a mannerthat can be independently and objectively verified (seeFigure 2).
This highly interactive process of geo-referencing local knowledge to a coordinate reference system allows resource maps to be produced to any scale, and in real-time, with the community. This stage also allows the first level of ‘validation’ of the data and discussion on the suitability of the products to meet the stakeholders’ needs (community, local government and other external stakeholders).
Step 3 Qualitative and quantitative attributes describing the key resources are collected. As participants put features onto the map they also describe the specified characteristics or attributes of these features. Attribute data includes a fuller description of the physical
characteristics of the resource (e.g. soil type, water quantity and quality, pasture species) as well as issues concerning its management (e.g. under customary or modern management, land tenure status, negotiated or paid access, area of conflict). Updating this data on a regular basis will inherently add temporal and trend data to the spatial database, highlighting the need to structure the data systems well to manage time-based data and record updates.
Steps 4-6: Data verification cycles integrated into the mapping process to capture community feedback and verify the records in the geospatial data and their attribute values against the specification. The mapping includes a series of validation, cross-checking and verification cycles, run with the community and in a few instances including on the ground verification. This stage also allows the first level of ‘validation’ of the data; the suitability of the products to meet the stakeholder (community and external stakeholder) needs.
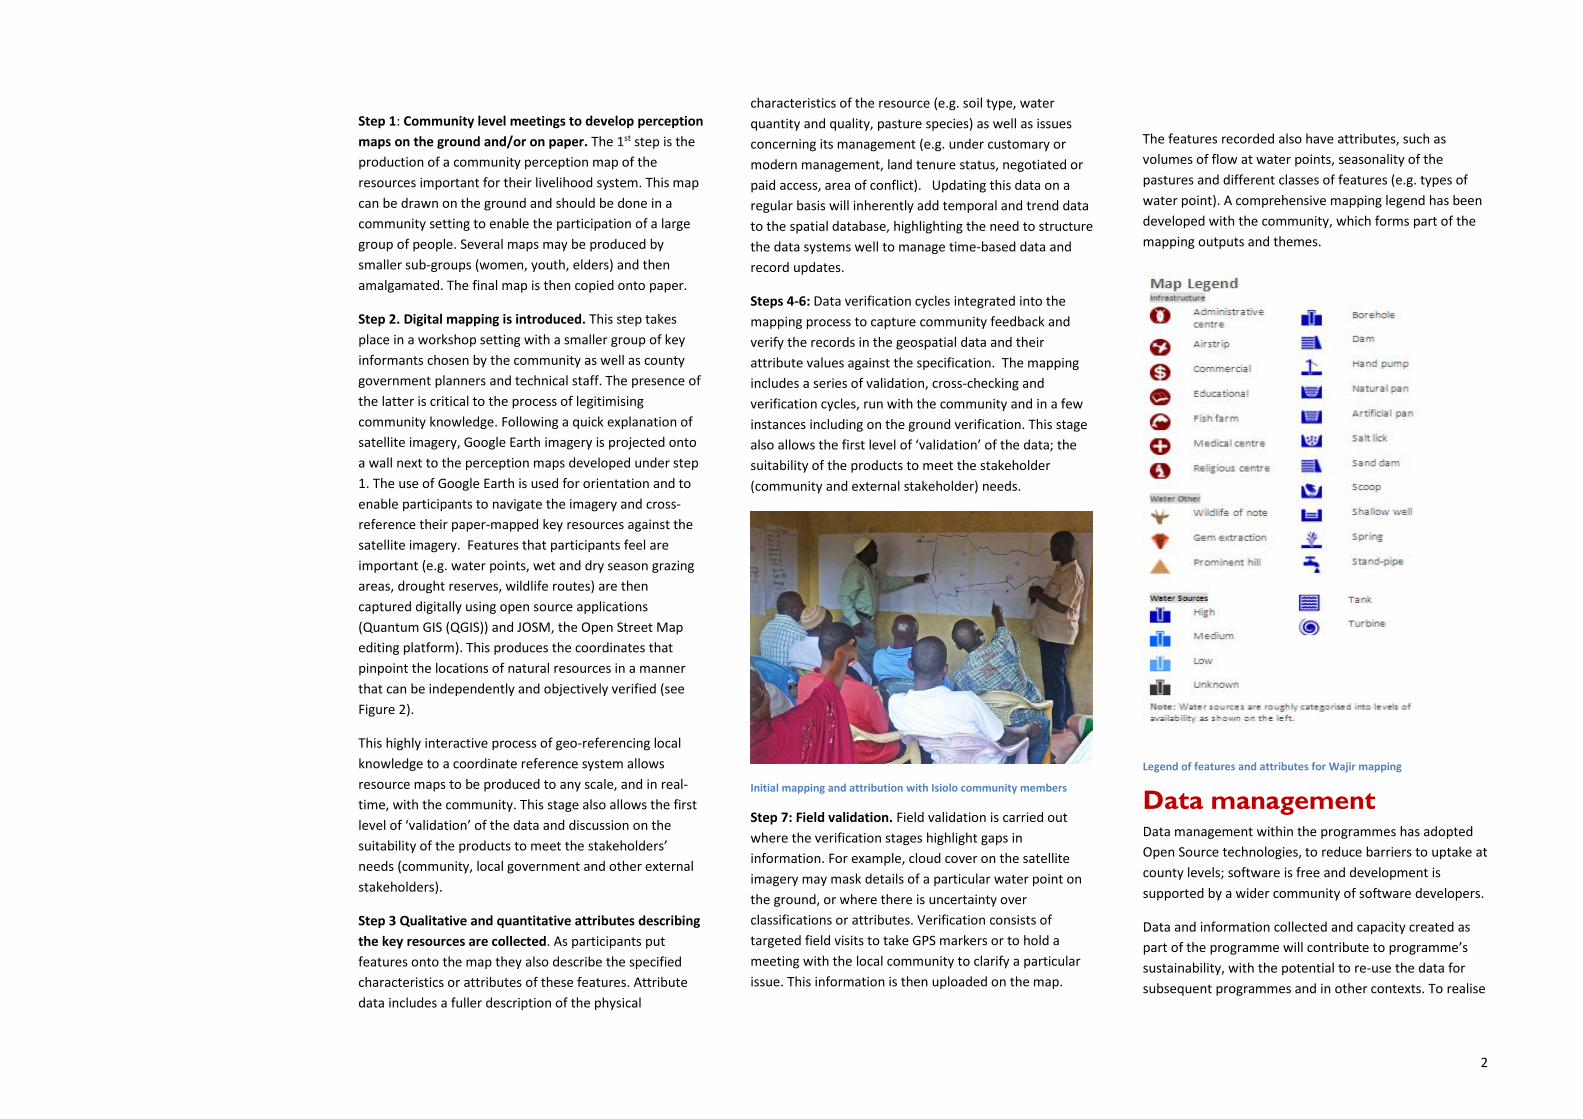
Initial mapping and attribution with Isiolo community members
Step 7: Field validation. Field validation is carried out where the verification stages highlight gaps in information. For example, cloud cover on the satellite imagery may mask details of a particular water point on the ground, or where there is uncertainty over classifications or attributes. Verification consists of targeted field visits to take GPS markers or to hold a meeting with the local community to clarify a particular issue. This information is then uploaded on the map.
The features recorded also have attributes, such as volumes of flow at water points, seasonality of the pastures and different classes of features (e.g. types of water point). A comprehensive mapping legend has been developed with the community, which forms part of the mapping outputs and themes.
Legend of features and attributes for Wajir mapping
Data management Data management within the programmes has adopted Open Source technologies, to reduce barriers to uptake at county levels; software is free and development is supported by a wider community of software developers.
Data and information collected and capacity created as part of the programme will contribute to programme’s sustainability, with the potential to re-use the data for subsequent programmes and in other contexts. To realise
2
these benefits the preparatory stage has evaluated data management issues.
The technologies selected to support this participatory GIS have been based on Open Source software components; these have been explicitly experimental and evolved through the programme. Within the preparatory stages a series of platforms and data management approaches have been tested using paper mapping, satellite imagery, crowd-sourcing as part of the validation, update and data dissemination through the web portal (Link).
ASALs cover a wide, trans-national area with multiple communities with knowledge of their own neighbourhood, with their own views of what features are significant, with varied naming conventions of features and with inherent geographic variation. These factors present a further challenge for production of a coherent dataset across a wide ASAL area. A technical challenge has been to accommodate loosely structured datasets that meet the community specification whilst still allowing for ‘back office’ coordination and standardisations. The approach adopted has been to use the Open StreetMap (OSM) model; this has unstructured data to represent features types by tags, which can be defined by the community.
As datasets are combined for the wider area the geographic database moves towards a spatial data infrastructure. There is a need for a way of identifying and aggregating similar features at different levels and displaying these with the same cartographic. For example, there were differences between the separate district workshops and even between separate groups within a single meeting for describing the same feature. In Wajir data were exported to OSM XML and JOSM, the OSM editor, which was used to attribute similar features through attribute-based rendering of the map data.
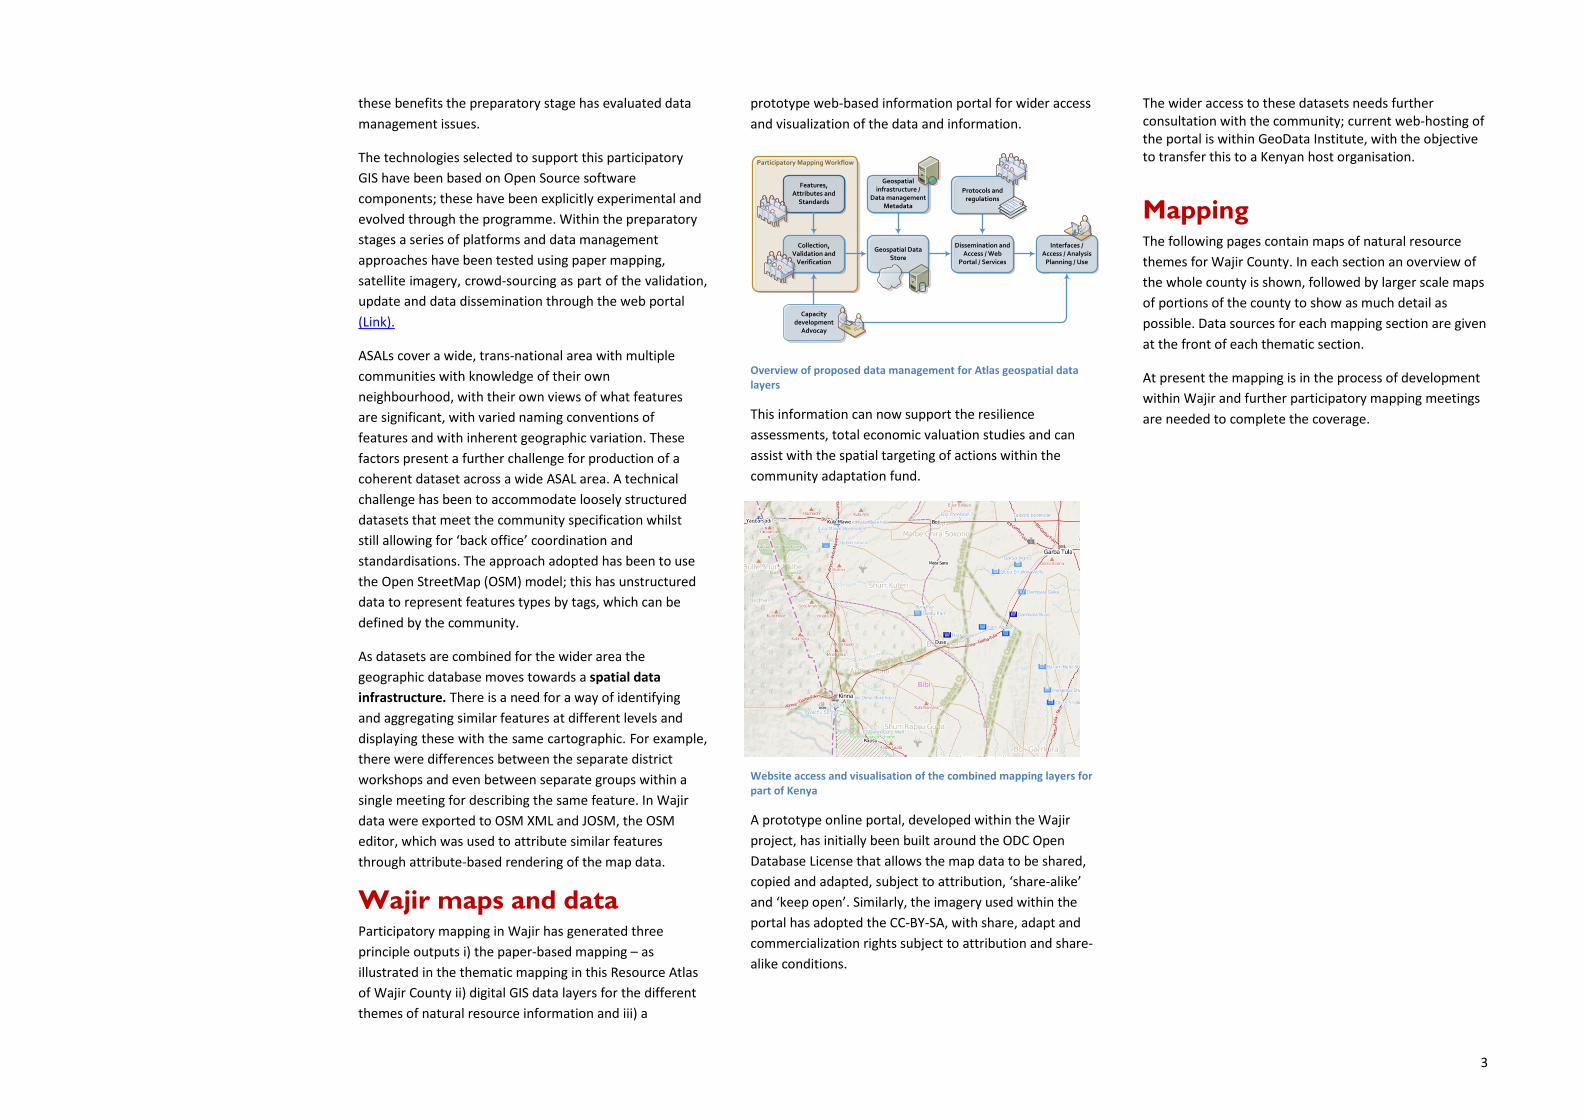
Wajir maps and data Participatory mapping in Wajir has generated three principle outputs i) the paper-based mapping – as illustrated in the thematic mapping in this Resource Atlas of Wajir County ii) digital GIS data layers for the different themes of natural resource information and iii) a
prototype web-based information portal for wider access and visualization of the data and information.
Participatory Mapping Workflow
Features, Attributes and
Standards
Collection, Validation and
Verification
Geospatial Data Store
Geospatial infrastructure /
Data management Metadata
Dissemination and Access / Web
Portal / Services
Protocols and regulations
Interfaces / Access / Analysis
Planning / Use
Capacity development
Advocay
Overview of proposed data management for Atlas geospatial data layers
This information can now support the resilience assessments, total economic valuation studies and can assist with the spatial targeting of actions within the community adaptation fund.
Website access and visualisation of the combined mapping layers for part of Kenya
A prototype online portal, developed within the Wajir project, has initially been built around the ODC Open Database License that allows the map data to be shared, copied and adapted, subject to attribution, ‘share-alike’ and ‘keep open’. Similarly, the imagery used within the portal has adopted the CC-BY-SA, with share, adapt and commercialization rights subject to attribution and share-alike conditions.
The wider access to these datasets needs further consultation with the community; current web-hosting of the portal is within GeoData Institute, with the objective to transfer this to a Kenyan host organisation.
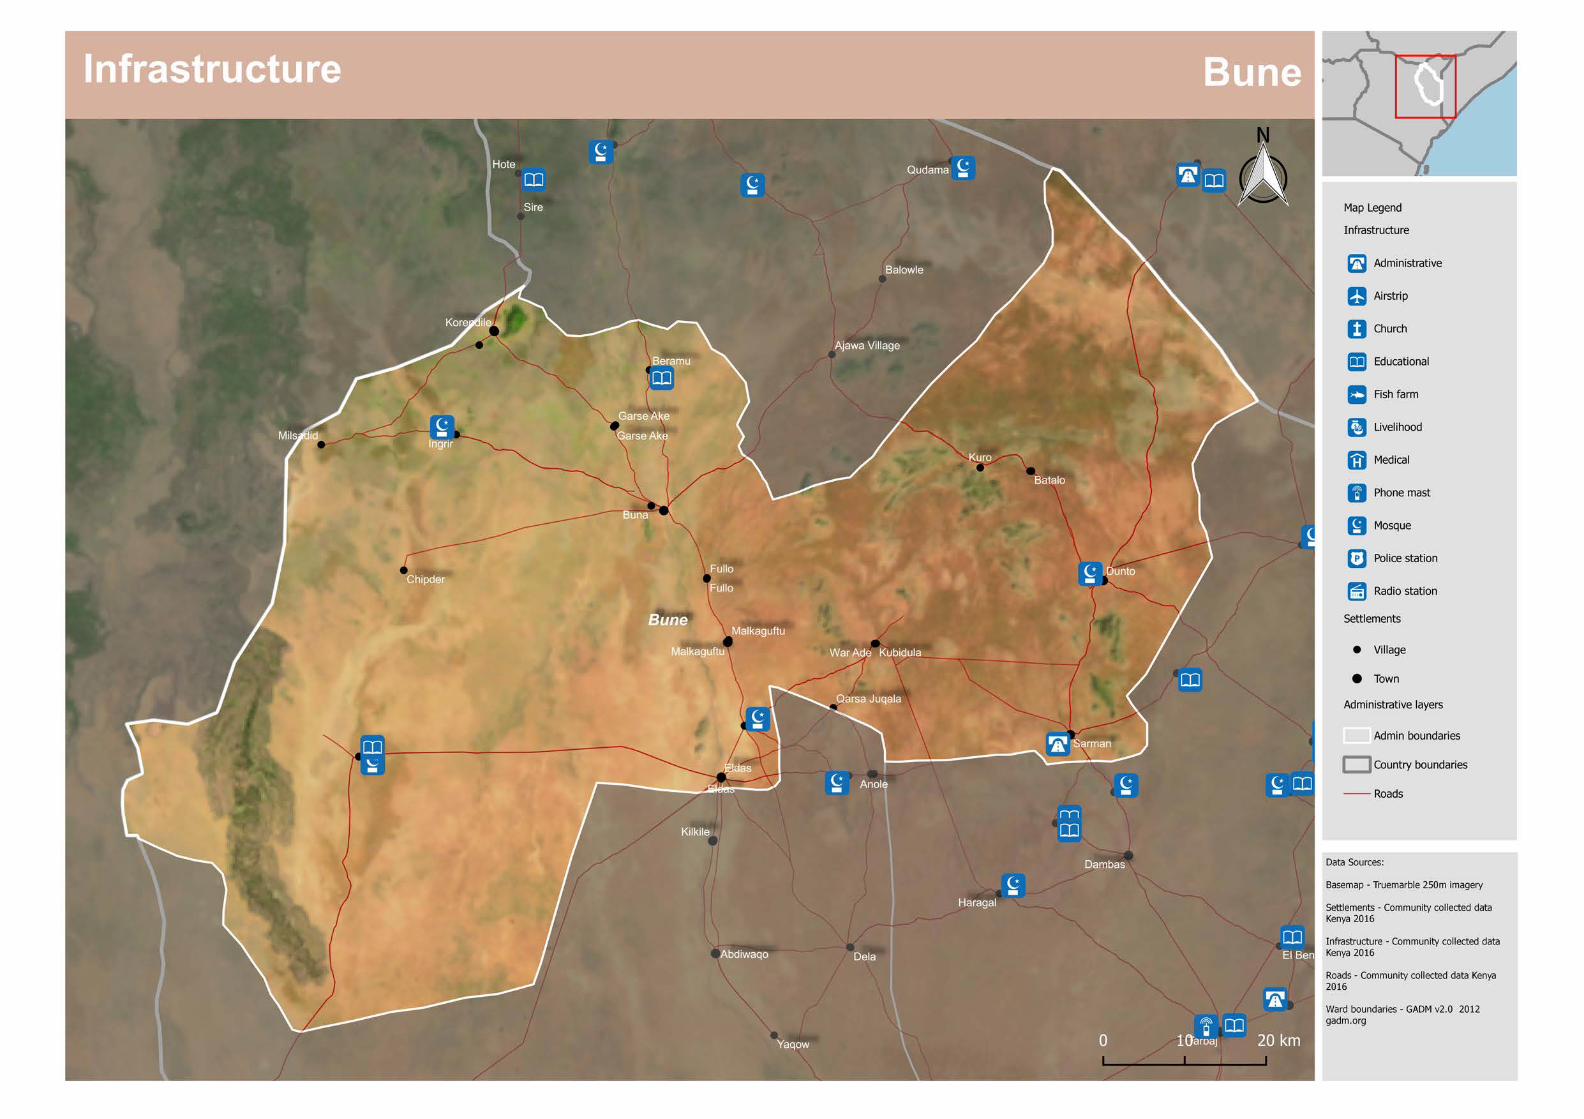
Mapping The following pages contain maps of natural resource themes for Wajir County. In each section an overview of the whole county is shown, followed by larger scale maps of portions of the county to show as much detail as possible. Data sources for each mapping section are given at the front of each thematic section.
At present the mapping is in the process of development within Wajir and further participatory mapping meetings are needed to complete the coverage.
3

5

Location
Data Sources
Basemap - Truemarble 250m imagery
Ward boundaries - GADM v2.0 2012 gadm.org


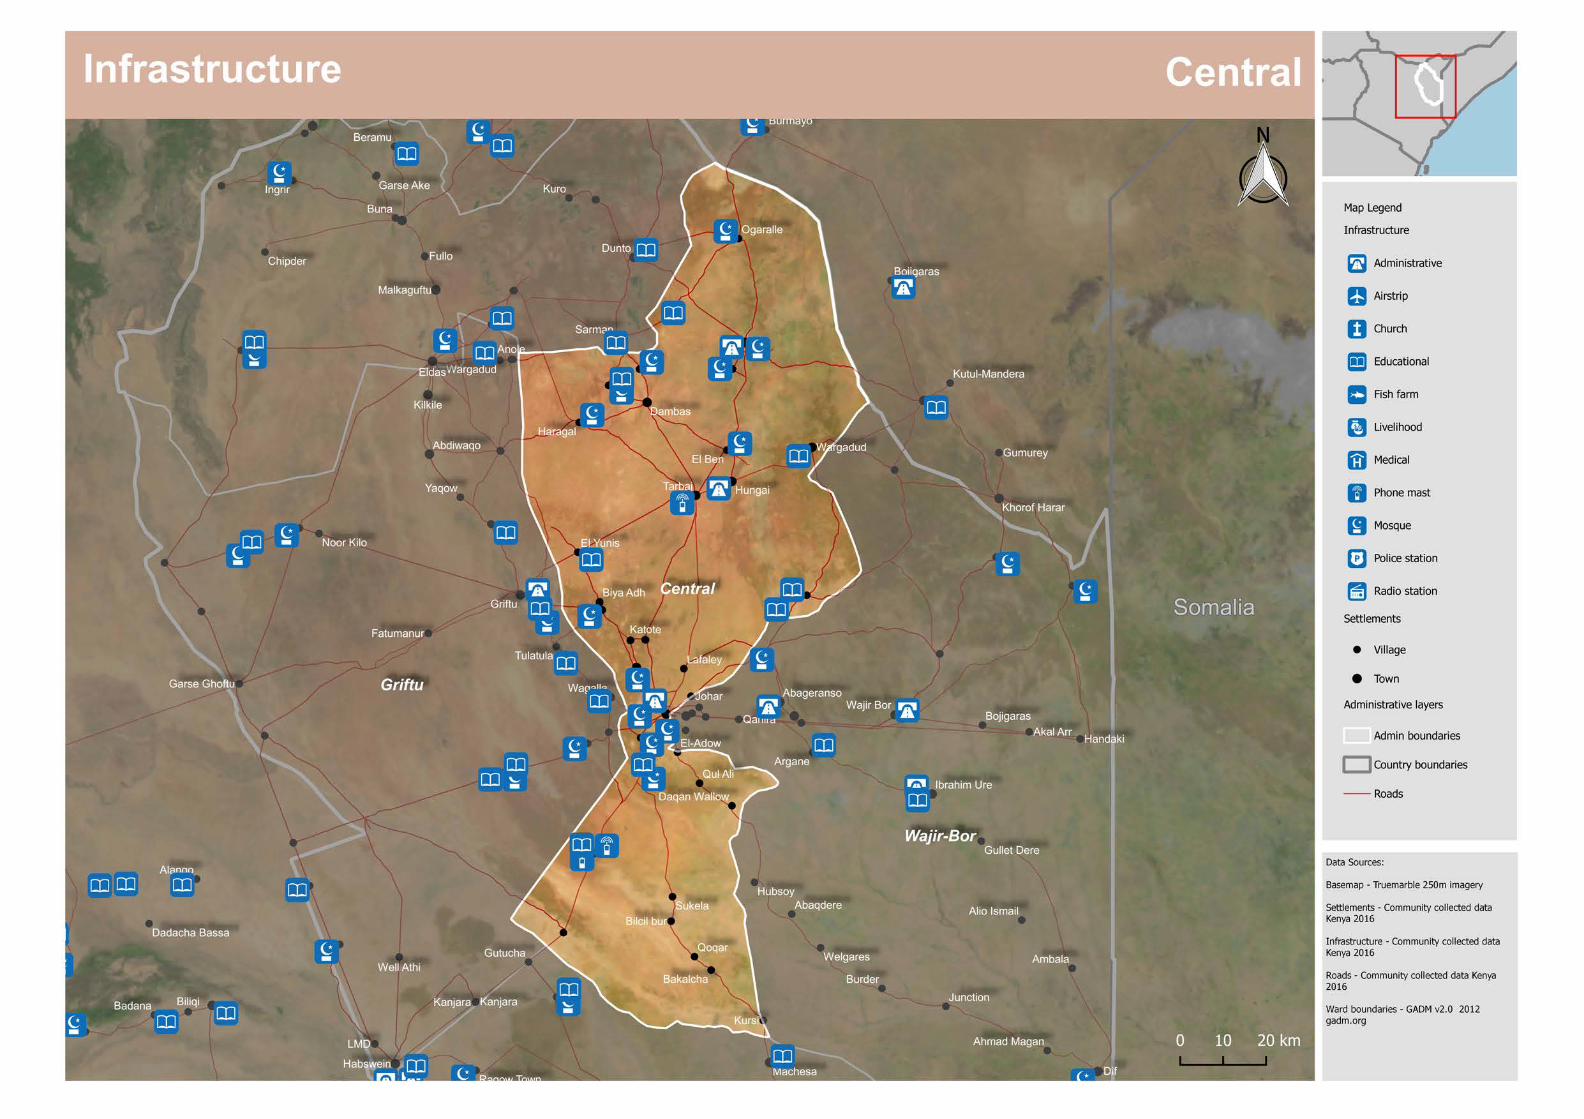
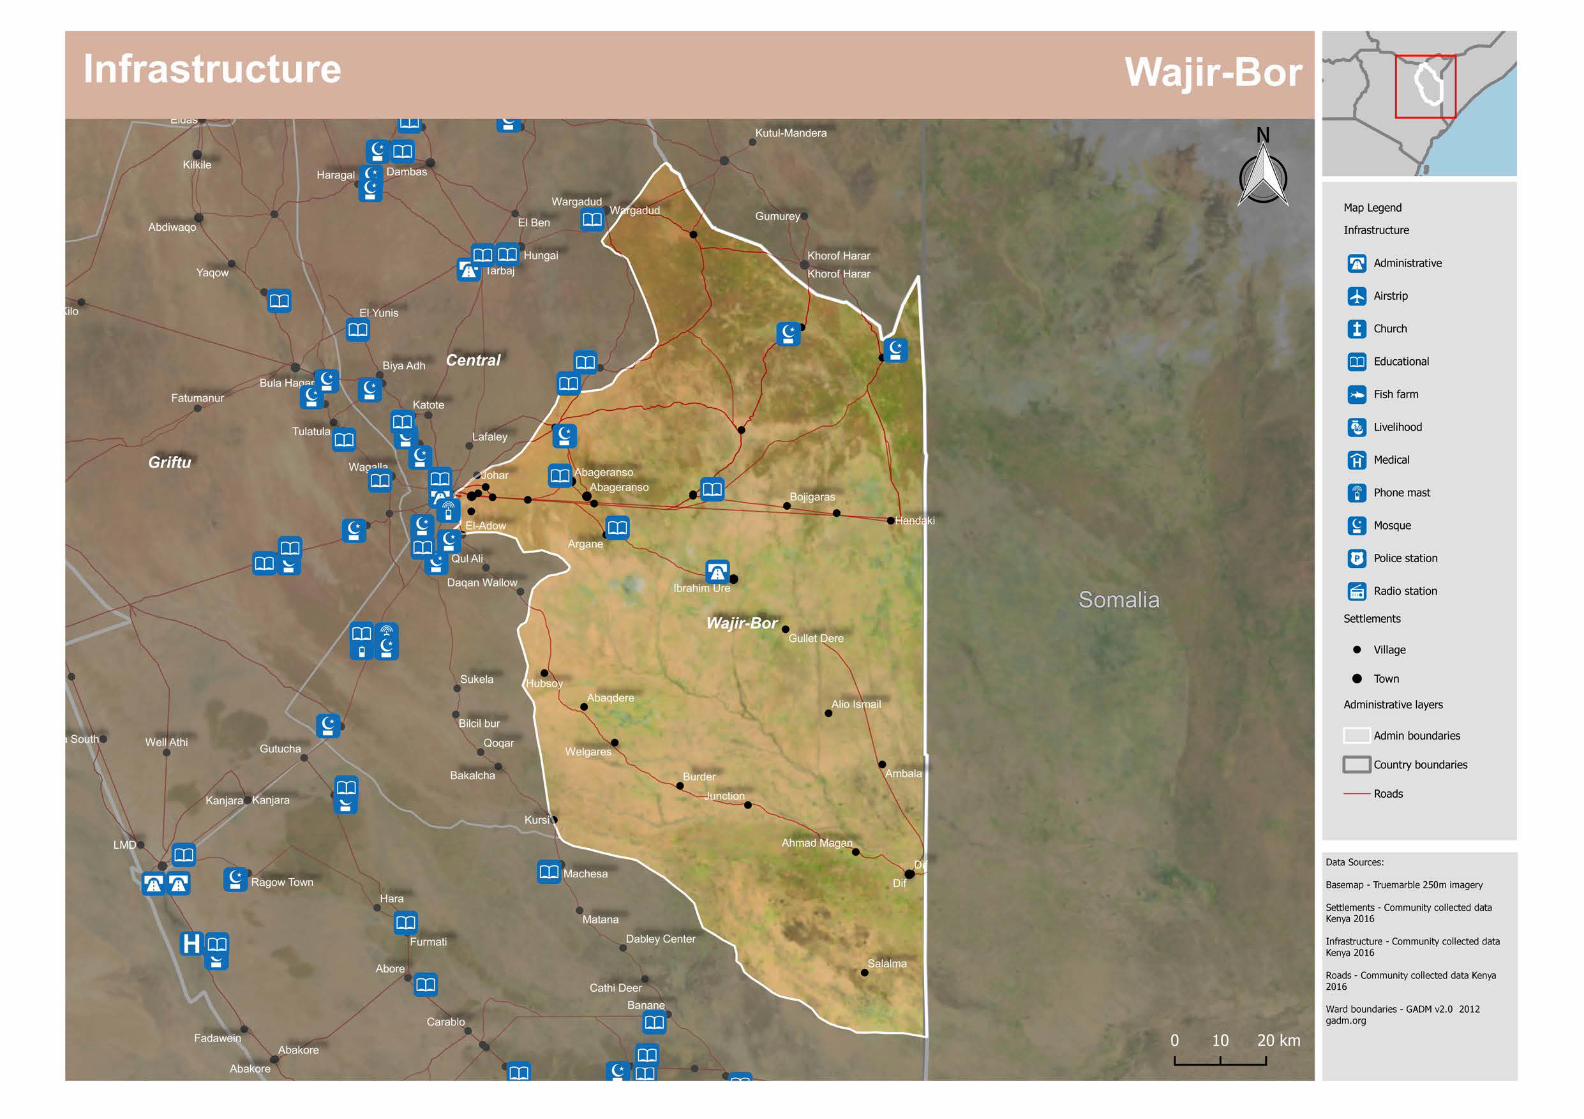
Infrastructure
Data Sources
Basemap - Truemarble 250m imagery
Settlements - Community collected data Kenya 2016
Infrastructure - Community collected data Kenya 2016
Roads - Community collected data Kenya 2016
Ward boundaries - GADM v2.0 2012 gadm.org


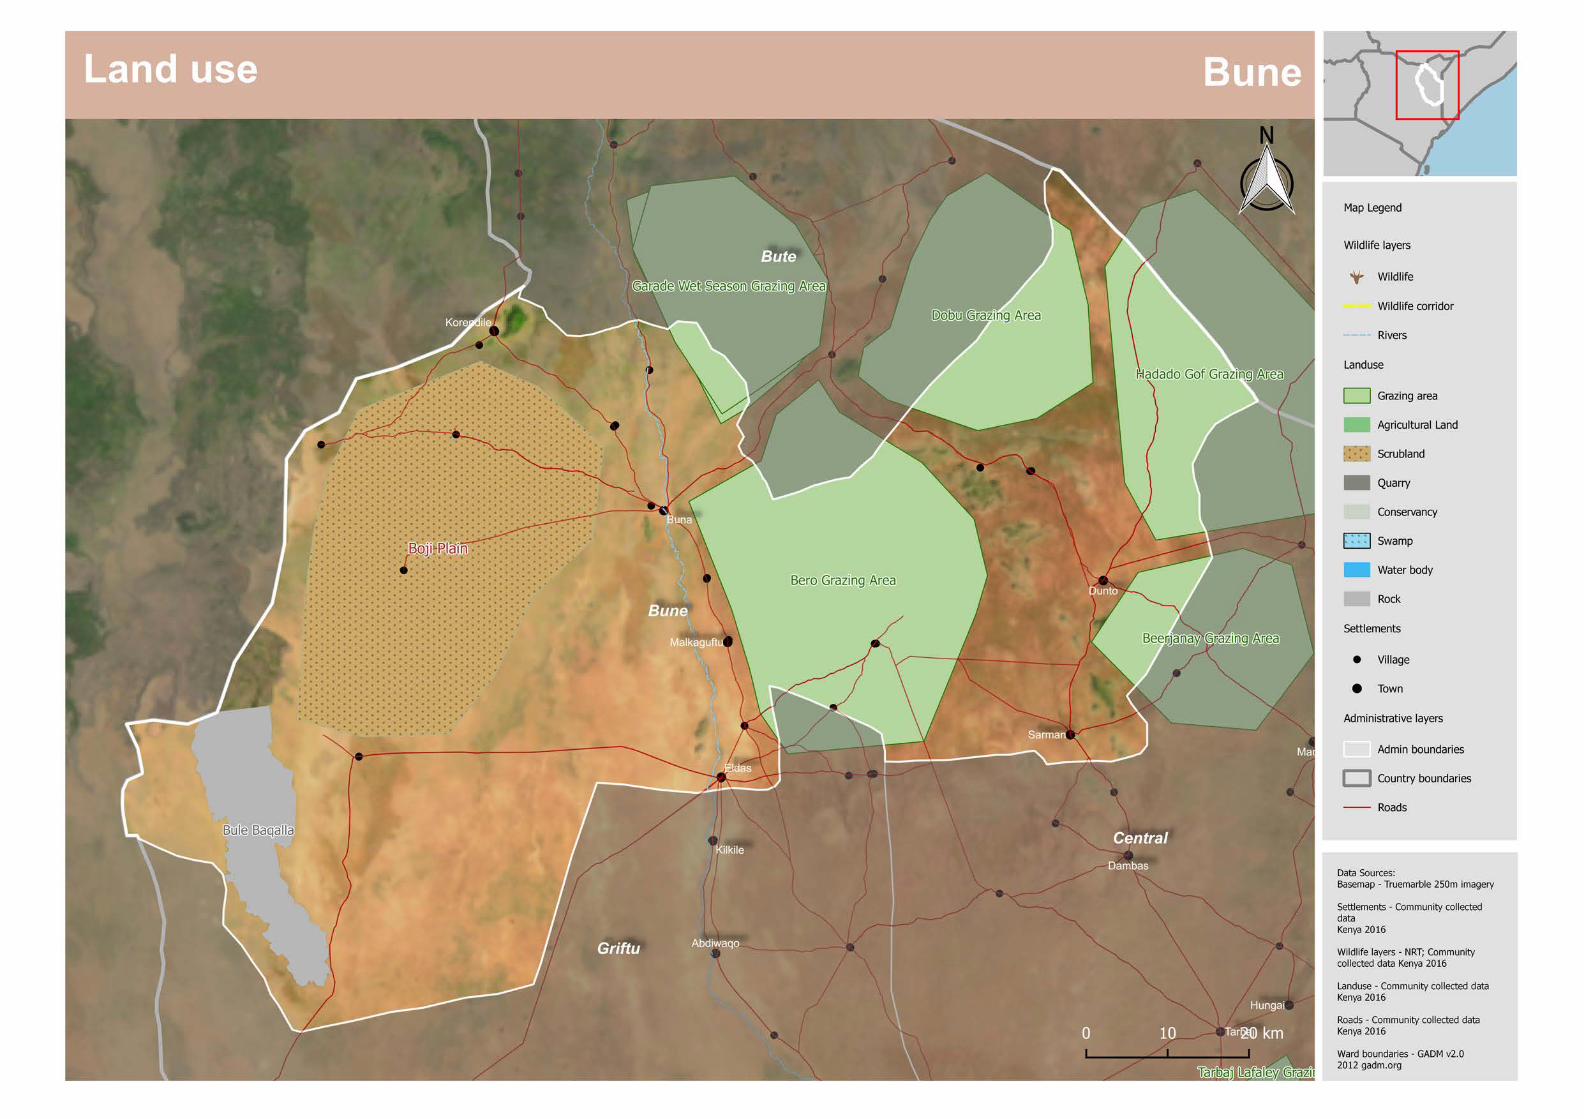
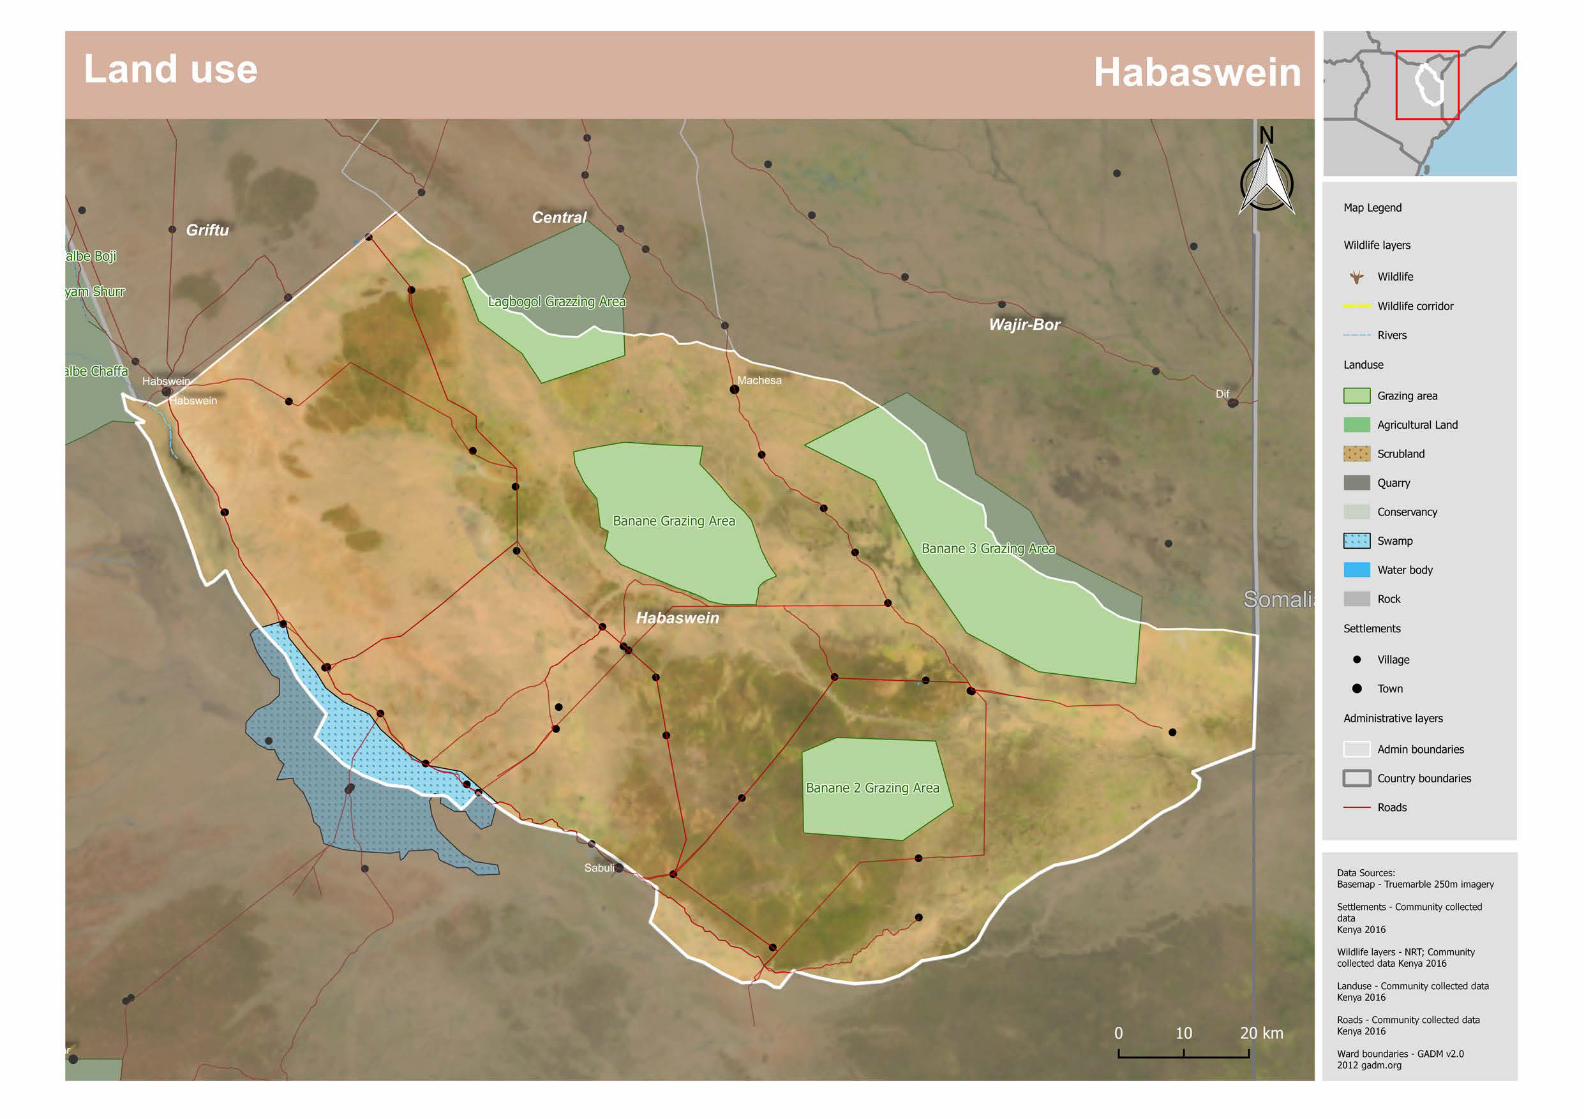
Land Use
Data Sources
Basemap - Truemarble 250m imagery
Settlements - Community collected data Kenya 2016
Wildlife layers - NRT; Community collected data Kenya 2016
Landuse - Community collected data Kenya 2016
Roads - Community collected data Kenya 2016
Ward boundaries - GADM v2.0 2012 gadm.org


Water and Drainage
Data Sources
Basemap - Truemarble 250m imagery
Settlements - Community collected data Kenya 2016
Water and Drainage - Community collected data Kenya 2016
Roads - Community collected data Kenya 2016
Ward boundaries - GADM v2.0 2012 gadm.org


The Consortium brings together Christian Aid (CA), International Institute for Environment and Development (IIED), Kenya Meteorological Services (KMS) and UK Met Office. The Consortium is hosted by the National Drought Management Authority. The consortium funded under Strengthening Adaptation and Resilience to Climate Change in Kenya plus (StARCK+) aims at preparing county government to access global climate finance fund in support of adaptation and climate resilient development and to mainstream mechanisms that allow communities to prioritise investments in public goods that build their resilience to climate change. The Adaptation Consortium is funded by UK Aid from the Department for International Development. The Atlas also incorporates the work undertaken by earlier programmes.
Photographs in this Atlas courtesy of James Pattison, Tom Rowley, and RAP