resolving the kinematic distance ambiguity toward …
TRANSCRIPT

RESOLVING THE KINEMATIC DISTANCE AMBIGUITY TOWARD GALACTIC H ii REGIONS
Michal A. Kolpak, James M. Jackson, T. M. Bania, and D. P. Clemens
Institute for Astrophysical Research, 725 Commonwealth Avenue, BostonUniversity, Boston,MA 02215
and
JohnM. Dickey
AstronomyDepartment, 116 Church Street SE, University ofMinnesota,Minneapolis, MN 55455Received 2002 August 26; accepted 2002 September 17
ABSTRACT
Kinematic distance determinations in the inner Galaxy are hampered by the near-far kinematic distanceambiguity. Here we resolve the ambiguity for 49 H ii region complexes with known recombination-line veloc-ities in the first Galactic quadrant. We measured the 21 cm H i absorption spectrum toward each source withthe Very Large Array in the C array. The maximum velocity of H i absorption was used to discriminatebetween the near and far kinematic distances. The number ratio of far to near sources, �3, can be entirelyexplained as a geometrical effect. The kinematic distances that we derive are compared with previous determi-nations for the same sources. Although our distance determinations are largely in agreement with previousmeasurements, there are 22 discrepancies that we discuss. Using our distance determinations, we create aface-on Galactic map of the H ii region complexes and compare it with a kinematically derived profile of thedistribution of CO-traced molecular hydrogen. The H ii region complexes delineate the large-scale featuresseen in the molecular gas. The 5 kpc molecular ring and the Sagittarius spiral arm are clearly evident, and afewH ii region complexes lie in the Perseus arm.
Subject headings:Galaxy: general — Galaxy: structure — H ii regions — ISM: atoms —radio lines: ISM — techniques: spectroscopic
On-line material: additional figures
1. INTRODUCTION
1.1. Background
Distance measurements are fundamentally important tostudies of the Galaxy. Distances are needed to establish theluminosity, size, and mass of Galactic sources and also todetermine the face-on structure of the Galaxy. A method todetermine distances on a Galactic scale accurately andunambiguously would be extremely valuable.
Distance determination for Galactic sources, however, isdifficult. The most accurate parallax measurements to datewere made using data from theHipparcosmission and havestandard errors of 1–2 mas (Perryman et al. 1995). Thistechnique is therefore currently limited to distances of a fewhundred parsecs. Water maser proper motion measure-ments have yielded very accurate distances to a few sources(e.g., W49, W51, and Sgr B2), but these studies require sev-eral years of observations and are limited to only a handfulof sources. Determinations of kinematic distance, on theother hand, only require the measurement of the radialvelocity of a source and the application of a Galactic circu-lar rotation curve (e.g., Clemens 1985, hereafter C85).Although kinematic distance determinations are less directthan other methods, they can provide a distance estimatefor any source of spectral-line radiation in the Galaxy.
Although determination of kinematic distances isstraightforward in the outer Galaxy, it is problematic in theinner Galaxy because of the so-called kinematic distanceambiguity (KDA). In the inner Galaxy, along a given line ofsight, each radial velocity value corresponds to two distan-ces equally spaced on either side of the tangent point. Onlysources at the tangent point have unambiguous distances.
This is a problem for all axisymmetric rotation curves andhas been a significant obstacle to the determination of reli-able kinematic distances (e.g., Clemens, Sanders, & Scoville1988, hereafter CSS88).
Fortunately, this long-standing problem can be solvedfor many Galactic H ii regions through measurement oftheir absorption spectra. If there is an interstellar cloudbetween an H ii region and the observer, the thermal brems-strahlung radio continuum emission from the backgroundH ii region is absorbed at frequencies corresponding toatomic and molecular transitions of the various gas speciesin the cloud. These absorption lines are Doppler shifted tothe radial velocity of the absorbing cloud. If an H ii region islocated at its far kinematic distance, there can be absorptionfrom clouds that have radial velocities up to and includingthe tangent-point velocity. If an H ii region is located at itsnear kinematic distance, however, there can only be absorp-tion from clouds that have radial velocities less than theradial velocity of the background H ii region. Therefore, ameasurement of the maximum velocity of absorption can beused to discriminate between near and far sources, providedthat the velocity of the H ii region is known and there areseveral absorbing clouds along the line of sight.
Figure 1 illustrates this KDA resolution technique with aschematic example. In Figures 1a and 1c, we show face-onschematic diagrams of the Galaxy, drawn from the perspec-tive of the north Galactic pole (the Galaxy rotates clock-wise). The concentric, shaded annuli represent exampleconcentrations of cold, clumpy H i, the circled asterisks rep-resent H ii region complexes, and the long, diagonal linesindicate the lines of sight. The places where the sight linesintersect H i clouds are numbered in the face-on diagrams.
The Astrophysical Journal, 582:756–769, 2003 January 10
# 2003. The American Astronomical Society. All rights reserved. Printed in U.S.A.
E
756
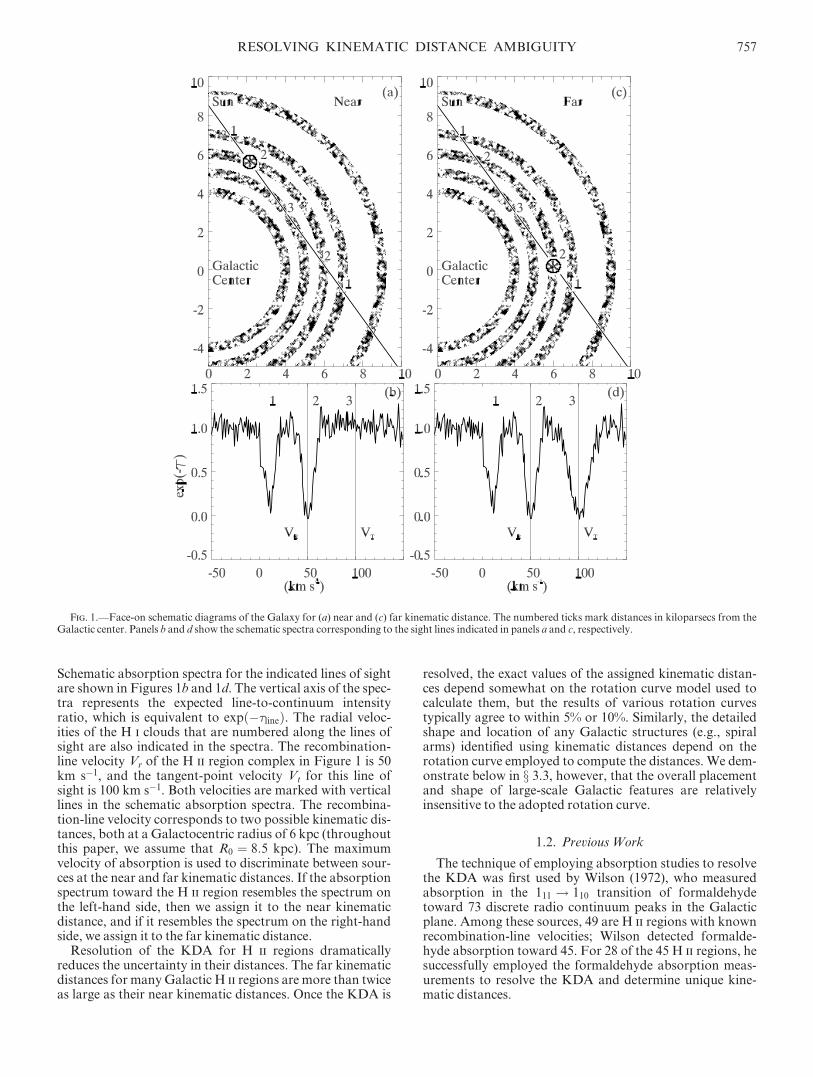
Schematic absorption spectra for the indicated lines of sightare shown in Figures 1b and 1d. The vertical axis of the spec-tra represents the expected line-to-continuum intensityratio, which is equivalent to expð��lineÞ. The radial veloc-ities of the H i clouds that are numbered along the lines ofsight are also indicated in the spectra. The recombination-line velocity Vr of the H ii region complex in Figure 1 is 50km s�1, and the tangent-point velocity Vt for this line ofsight is 100 km s�1. Both velocities are marked with verticallines in the schematic absorption spectra. The recombina-tion-line velocity corresponds to two possible kinematic dis-tances, both at a Galactocentric radius of 6 kpc (throughoutthis paper, we assume that R0 ¼ 8:5 kpc). The maximumvelocity of absorption is used to discriminate between sour-ces at the near and far kinematic distances. If the absorptionspectrum toward the H ii region resembles the spectrum onthe left-hand side, then we assign it to the near kinematicdistance, and if it resembles the spectrum on the right-handside, we assign it to the far kinematic distance.
Resolution of the KDA for H ii regions dramaticallyreduces the uncertainty in their distances. The far kinematicdistances for manyGalactic H ii regions are more than twiceas large as their near kinematic distances. Once the KDA is
resolved, the exact values of the assigned kinematic distan-ces depend somewhat on the rotation curve model used tocalculate them, but the results of various rotation curvestypically agree to within 5% or 10%. Similarly, the detailedshape and location of any Galactic structures (e.g., spiralarms) identified using kinematic distances depend on therotation curve employed to compute the distances. We dem-onstrate below in x 3.3, however, that the overall placementand shape of large-scale Galactic features are relativelyinsensitive to the adopted rotation curve.
1.2. PreviousWork
The technique of employing absorption studies to resolvethe KDA was first used by Wilson (1972), who measuredabsorption in the 111 ! 110 transition of formaldehydetoward 73 discrete radio continuum peaks in the Galacticplane. Among these sources, 49 are H ii regions with knownrecombination-line velocities; Wilson detected formalde-hyde absorption toward 45. For 28 of the 45 H ii regions, hesuccessfully employed the formaldehyde absorption meas-urements to resolve the KDA and determine unique kine-matic distances.
Fig. 1.—Face-on schematic diagrams of the Galaxy for (a) near and (c) far kinematic distance. The numbered ticks mark distances in kiloparsecs from theGalactic center. Panels b and d show the schematic spectra corresponding to the sight lines indicated in panels a and c, respectively.
RESOLVING KINEMATIC DISTANCE AMBIGUITY 757

Formaldehyde traces molecular rather than atomic gas.Because the filling factor of molecular gas in the inner Gal-axy is much smaller than that of atomic gas, the line of sightto many continuum sources may contain too few molecularabsorbers for this technique to be reliable. Specifically, ifthere is no formaldehyde near the tangent point, the absorp-tion spectrum toward a radio continuum source at the farkinematic distance will not reveal absorption at tangent-point velocities. This lack of high-velocity absorption couldlead to an incorrect assignment of the near kinematicdistance. The ubiquity of H i clouds makes them a morereliable absorber to use for this method.
Statistical studies of 21 cm H i absorption features haveestablished the frequency distribution of H i absorption fea-tures as a function of peak optical depth. For example,Payne, Salpeter, & Terzian (1983) find that the probabilityof finding an H i absorption dip with a peak optical depthgreater than 0.1 along a line of sight, reduced to bj j ¼ 90�, isbetween 0.75 and 1.5. Assuming a vertical scale height of100 pc for the absorbing H i clouds (Kulkarni & Heiles1987), this probability range implies that the mean free pathbetween cold H i clouds with a peak 21 cm optical depthgreater than 0.1 is between 65 and 130 pc. Radio continuumradiation from most H ii regions in the inner Galaxy shouldtherefore pass through many H i clouds on its way to theobserver. Kuchar & Bania (1994, hereafter KB94) resolvedthe KDA and determined kinematic distances to 70 H ii
regions in the first Galactic quadrant using the Arecibo tele-scope to measure their 21 cm H i absorption spectra. Theyalso made a face-on map of the Galactic distribution ofthese 70 H ii regions and found concentrations of H ii
regions coincident with the 5 kpc molecular ring and theSagittarius and Perseus spiral arms.
1.3. Initial Sample Selection
In this paper we present the results of a survey at 21 cmusing the Very Large Array (VLA), and we use these data toresolve the KDA for 49 compact H ii region complexes. Oursource selection criteria were chosen to select Galacticembedded star-forming regions. We matched the spatialcoverage of our survey to that of the Boston University–Five College Radio Astronomy Observatory Galactic RingSurvey (BU-FCRAO GRS; Simon et al. 2001): l ¼ 18�–52�
and b ¼ �0=5. The GRS is a new survey of J ¼ 1 ! 0emission of 13CO from molecular clouds in the 5 kpcGalactic ring.
We compiled an initial list of target fields centered onsources from the NRAO VLA Sky Survey (NVSS) point-source catalog. The NVSS is an all-sky 20 cm radio contin-uum survey made with the VLA in the D array (Condon etal. 1998). We selected all NVSS sources in our survey regionhaving 20 cm continuum fluxes greater than 0.4 Jy andangular sizes smaller than 100.
From this sample, we then selected only those continuumsources that were within 1500 of an IRAS point source. Thethermal component of Galactic radio continuum emissionis strongly correlated with far-infrared emission (e.g.,Broadbent, Haslam, & Osborne 1989). By choosing onlythose radio continuum sources coincident with far-infraredpoint sources, we eliminated most nonthermal radio sourcesand selected dusty embedded thermal sources, which aremost likely to be Galactic. A total of 28 sources met our cri-teria, and we refer to these 28 continuum sources as the tar-
get list. Each of our 28 observed fields is centered on a targetlist source.
All but one of the target list sources are within 30 of aradio recombination-line source listed in the catalog ofLockman (1989, hereafter L89). The beam FWHM of theL89 survey is 30. The presence of recombination-line emis-sion ensures that these sources are H ii regions and confirmsthat our selection criteria have isolated thermal Galacticsources.
1.4. Advantages of Interferometry
For measuring 21 cm H i absorption toward Galacticradio continuum sources, the VLA has two importantadvantages over single-dish instruments. First, extractingabsorption spectra from single-dish observations of H i
absorption in the Galactic plane usually requires subtrac-tion of the background large-scale diffuse H i emission(Dickey & Lockman 1990). KB94 accomplished this sub-traction by averaging the signal from several positionsremoved from the continuum source by the half-powerbeam width and subtracting that average from the signalmeasured directly on the continuum source.
This method relies on the assumption that the back-ground H i emission varies smoothly over the source region.If there are strong gradients in the background over thisregion, subtraction of the emission will produce significantuncertainty in the measurement of the absorption spectrum.The uncertainty introduced by this subtraction is the domi-nant source of uncertainty in single-dish H i absorptionspectra (Dickey & Lockman 1990).
This source of uncertainty is greatly reduced by using aninterferometer. Because interferometers have a minimumbaseline length, they effectively filter out spatial frequenciessmaller than a threshold value. The minimum baselinelength for the C-array configuration of the VLA is 35 m,and in the L band, this corresponds to a maximum size ofroughly 100 for snapshot observations. Because our obser-vations are relatively insensitive to H i emission on angularscale sizes larger than this, we measure the 21 cmH i absorp-tion spectra directly, without subtracting the H i emissionbackground.
Second, the VLA in the C array provides a higher angularresolution than single-dish instruments. For example, eventhough the collecting area of Arecibo is more than 5 timesthat of the VLA, the FWHM of Arecibo’s beam at 21 cm is40; almost 20 times that of the VLA in the C array. Theeffects of beam dilution on compact radio sources are there-fore greatly reduced by using the VLA.
Our observations and data reduction are described in x 2.In x 3 we describe our method of discriminating between thenear and far kinematic distances and present our mainresults: a table of distances to 49 H ii region complexes anda face-on Galactic representation of their distribution. Adiscussion of the main sources of uncertainty in our distancemeasurements is also included in this section. In x 4 wecompare our distance determinations with previous mea-surements. We also examine the correlation between large-scale molecular gas features and the distribution of H ii
region complexes. Finally, we discuss the asymmetrybetween the number of near and far H ii region complexes.In x 5 we present a summary of the main results andconclusions.
758 KOLPAK ET AL. Vol. 582

2. OBSERVATIONS AND DATA REDUCTION
2.1. VLAObservations
The data presented here were collected in 2000 Marchand April using the NRAO VLA in the C-array configura-tion in the L band. The correlator was configured to have atotal bandwidth of 1.6 MHz, 128 channels, and 12.2 kHzchannel�1, corresponding to a velocity resolution of 2.6 kms�1 channel�1. Both circular polarizations were observedsimultaneously; on-line Hanning smoothing was not imple-mented. The FWHM of the synthesized beam was 1600,which yielded a beam size of 289 arcsec2 and a gain of 2.37K mJy�1. We used standard flux and bandpass calibratorsand selected phase calibrators from the VLA calibratormanual. We observed 28 fields, each centered on a brightGalactic radio continuum source from the target list. Thetotal integration time for each field was typically 10–15minutes, and spectra typically had rms fluctuations of 15mJy beam�1. To compensate for the limited u-v coverageprovided by such short snapshots, we observed each field ina mosaic of four pointings, typically spread evenly over 8 hr.One pointing was centered on the radio continuum source,and the other three were each offset by 100 from the source(to the south, northeast, and northwest), forming anequilateral triangle with the radio continuum source at thecenter.
2.2. Data Reduction
We edited and calibrated the data using the standardAIPS software package. Mosaicked dirty image cubes werecreated from the calibrated u-v data using MIRIAD (Sault,Teuben, & Wright 1995). Continuum maps were created byaveraging line-free channels (typically a total of 50 chan-nels). The continuum maps were then deconvolved usingthe MIRIAD task MOSSDI, which implements the SDICLEAN algorithm (Steer, Dewdney, & Ito 1984). Finally,these CLEAN models were convolved with the CLEANbeams, and the deconvolution residuals were added. Thesemaps were used to measure the positions and fluxes of con-tinuum sources.
We detected 146 serendipitous continuum sources in our28 target source fields. We used images from the NVSS sur-vey to confirm the reality of all our continuum source detec-tions. These images were obtained through SkyView(McGlynn, Scollick, &White 1996). We extracted 21 cm H i
spectra for all sources in our continuum maps that werecoincident with obvious peaks in the NVSS maps. Nine ofthe 146 serendipitous peaks that we identified in the contin-uum maps do not have NVSS counterparts. These ninesources are probably noise artifacts, and we rejected themfrom further analysis.
Our attempt to CLEAN the spectral-line data was unsuc-cessful. Although the VLA in the C array filters out GalacticH i emission on scales larger than 100, it is still sensitive tolow-level Galactic H i emission features smaller than 100.The presence of these emission features confused theCLEAN algorithm and resulted in the introduction of spu-rious absorption features. We therefore extracted absorp-tion spectra directly from the dirty image cubes. Weobtained average H i spectra toward the continuum sourcesby spatially averaging the brightest contiguous pixels of thedirty image cubes, typically covering an area of 200–300 arc-sec2. The continuum flux level for each source was measuredby fitting a first-order baseline to the average spectrum.
H i absorption dips that were at least 3 times deeper thanthe standard deviation of baseline fluctuations, �, weredetected toward a total of 158 sources. These 158 sourcescomprise the absorption detection sample.
3. ANALYSIS AND RESULTS
3.1. Post Facto Sample Selection
In order to select only H ii regions for further analysis, wepruned the absorption detection sample using two postfacto selection criteria. First, we correlated our absorptiondetection sample with the radio recombination-line catalogof L89 and selected only the absorption detection sourceswithin 30 of an H ii region listed by L89, resulting in 100sources.
Although this selection should have removed most non-thermal sources, some extragalactic sources that happenedto be within 30 of an L89 H ii region could still have conta-minated the sample. In order to avoid these extragalacticsources, we excluded 21 sources for which there was signifi-cant 21 cm H i absorption present at negative velocities.Absorption features at negative velocities are caused by gasbeyond the solar circle, and most radio continuum sourcesbehind this outer Galaxy gas are likely to be extragalactic.Specifically, we excluded a source if at least two consecutivechannels with velocities redward of �10 km s�1 showed 21cm absorption with an optical depth of 0.4 or greater (ourtechnique for measuring the optical depth of 21 cm absorp-tion is described in a previous paper [Kolpak et al. 2002]).After removing the sources with negative velocity absorp-tion, 79 sources remained. These 79 sources form our H ii
region list.At 1600 resolution, some large H ii region complexes are
resolved into several small components (e.g., W49A). Infact, the 79 sources on our H ii region list belong to a totalof only 51 separate complexes. The components of eachcomplex are all within 30 of the same L89 recombination-line source, i.e., nearly within the L89 survey beam.Hereafter, we refer to each H ii region complex by theGalactic coordinates of its brightest component (e.g.,G18.149�0.283). Within each complex, the spectra for theindividual components are very similar (with the exceptionof source G25.397�0.141, to be discussed below). These 51complexes are our H ii region complex list.
Our 28 target list sources are a flux-limited sample, butthe 51 sources in our H ii region complex list are not.Roughly half of these H ii region complexes are serendipi-tous detections with fluxes less than the 0.4 Jy limit chosenfor the initially targeted sample. The H ii region complexsample is not complete for fluxes below 0.4 Jy.
3.2. Resolving the KDA
For most of the 51 sources in the H ii region complex list,the recombination-line velocity corresponds to two kine-matic distances. The goal of our analysis was to break thisambiguity and select a single kinematic distance for eachH ii region complex. We accomplished this for each sourceby measuring the maximum velocity of 21 cm H i absorp-tion and comparing it with the tangent-point velocityVt andthe recombination-line velocity Vr. We also evaluated thequality of each distance determination to indicate our levelof confidence in the resolution of the KDA for each H ii
region complex.
No. 2, 2003 RESOLVING KINEMATIC DISTANCE AMBIGUITY 759

The first step was to calculate the two possible kinematicdistances for each of the 51 H ii region complexes using theradial velocities Vr reported in the L89 recombination-linecatalog (the typical uncertainty in Vr listed by L89 is �2 kms�1). We assumed the C85 rotation curve (with R0 ¼ 8:5kpc,V0 ¼ 220 km s�1) to compute these distances.
Then we analyzed the spectrum of each H ii region com-plex to determine which spectral channels show reliable 21cm H i absorption. We first measured the standard devia-tion of the noise in the baseline of the averaged spectrum, �.Then we measured the excursion below the baseline in eachchannel. As mentioned above, we required this excursion tobe at least 3 �. To avoid interpreting noise spikes and badchannels as absorption features, we further required thatabsorption be detected in at least two contiguous channels(over a velocity width of at least 5.2 km s�1). The maximumvelocity at which we reliably detected 21 cm H i absorption,Va, was then used to resolve the KDA.
We assigned near, far, or tangent-point kinematic dis-tance designations for each source by calculating the veloc-ity differences Vt � Vr and Vt � Va. The C85 rotation curvewas used to computeVt for each line of sight. We found thatthere are two distinct groups of sources for whichVt � Vr > 0. One group has Vt � Va near 0 and is thereforeat the far kinematic distance. The other group has Vt � Va
significantly greater than 0 and is therefore at the near kine-matic distance. Any source with Vt � Vr < 0 must be verynear the tangent point.
3.2.1. Simulation of KDAResolutions
Identification of these three groups of sources is not, byitself, sufficient to assign a kinematic distance and a qualityto all the H ii region complexes. Some sources are near theboundaries between groups, and it is not obvious to whichkinematic distance they should be assigned. In addition, it isimportant to have an estimate of the certainty with whicheach source can be assigned to one of the groups.
In order to address these issues, we performed a simplesimulation. The goal of this simulation was to estimateranges of Vt � Vr and Vt � Va that correspond to high-quality KDA resolutions. We created a sample of 10,000randomly placed H ii regions with Galactocentric radiibetween 3 and 8 kpc and Galactic longitudes between 18�
and 50�. Our observed H ii region complexes were not dis-tributed uniformly in Galactocentric radius. The number ofobserved H ii region complexes between R ¼ 4 and 5 kpcand between 6 and 7 kpc was roughly twice as large as thenumber between 5 and 6 kpc and 4 times larger than thenumber inward of 4 kpc and outward of 7 kpc. We designedour simulated H ii region population to match this observedGalactocentric radial distribution.
We assigned a circular velocity to each simulated H ii
region based on the C85 rotation curve. The measured dis-tribution of H ii region velocities deviates from purely circu-lar rotation, and this deviation typically has both randomand systematic components (e.g., Brand & Blitz 1993). Therandom component is caused by cloud-cloud dispersion,and the systematic component is often explained as stream-ing motions along spiral arms. To include the effects ofcloud-cloud dispersion, we added a random component tothe circular velocity of our simulated H ii regions. This ran-dom component follows a Gaussian distribution with amean of 0 km s�1 and a dispersion of 5 km s�1, which is con-
sistent with published measurements of the cloud-cloud dis-persion (e.g., Blitz, Fich, & Stark 1980; Liszt & Burton1983; C85).
We included streaming motions by adding 10 km s�1 (inthe direction of Galactic rotation) to the circular velocitiesof 50% (randomly selected) of the simulated H ii regionsbetween Galactocentric radii of 4.5 and 5.5 kpc and between6 and 7 kpc. These Galactocentric radii correspond to thelocations of the 5 kpc molecular ring and the Sagittariusspiral arm. It is also at these Galactocentric radii that someH ii region complexes from our observed sample haverecombination-line velocities up to 20 km s�1 larger thanthe tangent-point velocity. Such large deviations from circu-lar rotation at particular Galactocentric radii are probablydue to large-scale streaming motions. We chose the sign andsize of the streaming motion in order to match the distribu-tion of observed H ii region velocity differences.
Our next task was to simulate the observed quantities Vr
and Va. We constructed Vr by calculating the radial velocitycomponent for each simulated H ii region and subtractingthe radial component of the Galactic orbital motion of theSun. Because of the ubiquity of absorbing H i clouds, wecalculated Va assuming that absorption would be detectedat all velocities, up to the largest relative radial velocityalong the line of sight to the simulated H ii region. There-fore, for sources on the near side of the locus of tangentpoints, Va is equal to Vr, and for sources on the far side ofthe locus of tangent points,Va is equal toVt.
We also included streaming motions in our calculation ofVa. For H ii regions nearer than the tangent point, the 21 cmabsorption near Va is caused by gas that is very close to theH ii region. If the H ii region is participating in a streamingmotion (i.e., if its circular velocity has been raised by 10 kms�1), then the nearby H i cloud is probably participating inthe same streaming motion and is therefore moving at avelocity comparable to the recombination-line velocity ofthe H ii region. For near-side H ii regions that had Vr aug-mented by streamingmotions, we added a 10 km s�1 stream-ing motion to Va as well. This procedure is supported by thefact that for all but two of our observed sources, we measure21 cm absorption at the recombination-line velocity of theH ii region.
For H ii regions beyond the tangent point, the highestvelocity absorption comes from H i near the tangent point.If this tangent-point gas is participating in a streamingmotion, then Va for these sources will be augmented. Wetherefore added 10 km s�1 to Va for 50% (randomlyselected) of the far-side H ii regions for which the Galacto-centric radius of the tangent point was between 4.5 and 5.5kpc or between 6 and 7 kpc.
Finally, we added a Gaussian-distributed random veloc-ity to Va for all the simulated H ii regions to simulate cloud-cloud motions in the absorbing H i gas. This random com-ponent had amean of 0 km s�1 and a dispersion of 5 km s�1.
Figure 2 shows the plot of velocity differences for thesimulated H ii region sample. We analyzed the distributionof sources by first binning the points into cells of 3� 3 (kms�1)2. We then computed the fractions of points in each cellcorresponding to sources on the near and far sides of thelocus of tangent points. The contour line in the top rightportion of the plot encloses a region in which all cells con-tain at least 90% near sources, and the contour in the bot-tom right portion of the plot encloses a region in which allcells contain at least 90% far sources.
760 KOLPAK ET AL. Vol. 582

The straight, solid lines mark approximations to theseboundaries. All sources in the top right portion of the plotcan be assigned to the near kinematic distance with a highdegree of confidence, and those in the bottom right portioncan be confidently assigned to the far kinematic distance.The triangle near the center of the plot marks a zone ofhigher uncertainty. The results of our simulation indicatethat H ii region complexes that fall inside this region have asignificant chance of being at either of the near or far kine-matic distances. The dashed, diagonal line divides thisregion into two pieces. Above the dashed line, greater than50% of the simulated H ii regions in each cell are at the nearkinematic distance, while below the dashed line, greaterthan 50% are at the far kinematic distance.
3.2.2. KDAResolutions
These solid and dashed lines are also drawn in Figure 3,which is a plot of Vt � Va against Vt � Vr for our observedH ii regions. We used the zones delineated by these lines toresolve the KDA.We assigned all observed H ii region com-plexes in the bottom right region of the plot to the far kine-matic distance, and those in the top right region to the nearkinematic distance. Based on our simulation, we have a highlevel of confidence in these KDA resolutions, and we assignthem a quality of ‘‘ A.’’ Within the triangular region nearthe center of the plot, we assign all sources above the dashedline to the near kinematic distance and those below the lineto the far kinematic distance. Because these KDA resolu-tions are more uncertain, we assign them a quality of ‘‘ B.’’
The left side of the plot contains H ii region complexes withrecombination-line velocities greater than the tangent-pointvelocity. We therefore assign these sources to the tangent-point distance with a quality of A.
Using this technique, we resolved the KDA and deter-mined unique kinematic distances for all but two (see noteon G23.900+0.068 and G31.243�0.110 below) of the 51H ii region complexes.
In order to probe the importance of our choice of rotationcurve, we calculated the kinematic distances to these 49 H ii
region complexes again, using the rotation curve of Olling &Merrifield (1998, hereafter OM98). Because their best-fitcurve (for R0 ¼ 7:1 kpc, �0 ¼ 184 km s�1) is not given inanalytic form, we estimated its form from their Figure 1(bottom left panel). We represent this as a two-part linearcurve:
�0 ¼155þ 10R ; 2:9 � R < 3:5 ;
195:3� 1:5R ; 3:5 � R < 19:4 :
�ð1Þ
Here, R represents the Galactocentric radius in kilopar-secs, and h is the circular rotation speed in km s�1. Becausethe OM98 rotation curve adopts a value ofR0 ¼ 7:1 kpc, werescaled the kinematic distances to R0 ¼ 8:5 before compar-ing them with the results from the C85 rotation curve.
3.3. Results
Figures 4a and 5 showH i absorption spectra for 12 repre-sentative sources from our H ii region complex list. Absorp-tion spectra for the remaining 37 H ii region complexes forwhich we were able to resolve the KDA are published as Fig-ures 4b–4h in the electronic version of this paper, which isavailable from theAstrophysical JournalWeb site. The max-imum velocity of reliably detected 21 cm absorption Va, the
Fig. 3.—Velocity differences plot of the 49 H ii region complexes forwhich we resolved the KDA. The solid and dashed lines are the same as inFig. 2. The sources outside of the triangular region near the center of theplot represent our quality A kinematic distance determinations, and thosesources within the triangle represent our quality B determinations.
Fig. 2.—Velocity differences for the simulated H ii region complexes.The vertical axis represents the difference between the tangent-point veloc-ity and the maximum velocity at which we measured absorption, Vt � Va.The horizontal axis represents the difference between the tangent-pointvelocity and the recombination-line velocity, Vt � Vr. The irregularlyshaped contours enclose regions where locally at least 90% of the simulatedH ii regions are at the near (top right contour) or far (bottom right contour)kinematic distance. The straight solid lines mark approximations to thesecontours. Above the dashed line, at least 50% of the simulated H ii regionsare at the near kinematic distance, while below the dashed line, at least 50%are at the far kinematic distance.
No. 2, 2003 RESOLVING KINEMATIC DISTANCE AMBIGUITY 761

tangent-point velocity Vt, and the recombination-linevelocityVr are indicated in each spectrum.
Table 1 lists important parameters for the 51 sources ofour H ii region complex sample. Column (1) contains thesource names. Two sources, G23.900+0.068 andG31.243�0.110, are listed twice because L89 reports tworecombination-line velocity components toward each ofthese sources. Columns (2) and (3) list the right ascensionand declination (J2000.0) for the peak pixel value for eachsource as determined from our continuum maps. Columns(4)–(6) contain the H ii region complex recombination-linevelocity, tangent-point velocity, and the maximum velocityof H i absorption for each source. Column (7) lists our
determination of whether the sources are at the near kine-matic distance (N), the far kinematic distance (F), the tan-gent point (T), or undetermined (?), and column (8)contains our kinematic distance for each source along withan estimate of the uncertainty in the distance. Column (9)lists the quality assignment (A or B) for our resolution ofthe KDA for each H ii region complex.
Of the 51 sources, we determined that nine are at the nearkinematic distance, 28 are at the far kinematic distance, and12 are at the tangent-point distance. The distances to theother two sources remain undetermined, as explainedbelow. One H ii region complex at the near kinematic dis-tance and eight at the far kinematic distance received a qual-
Fig. 4a
Fig. 4.—(a) Example H i absorption spectra for six of the 49 sources on the H ii region complex list. The name of each source is at the top of each panel. Thetangent-point velocity Vt is marked by a solid vertical line, and the recombination-line velocity Vr is marked by a dotted vertical line. The dashed line marksthe maximum velocity at which we measured H i absorption, Va. The vertical axis of the spectra represents the observed line-to-continuum intensity, which isequivalent to expð��lineÞ. We resolved the KDA by comparing this maximum velocity of H i absorption with the source and tangent-point velocities. Sourcesshown on the left are complexes that we assigned to the near kinematic distance. The sources at the top left and middle left have a quality of A, and the sourceat bottom left has a quality of B. We assigned the sources shown on the right to the far kinematic distance with qualities of A. See the electronic edition of theAstrophysical Journal for additional H i absorption spectra.
762 KOLPAK ET AL. Vol. 582

ity of B because they fall within the triangular region in Fig-ure 3. We also assigned a quality of B to two H ii regioncomplexes at the tangent-point distance for reasons that areexplained in x 4.1.1. The remaining 38 H ii region complexesreceived a quality of A.
The distances listed in Table 1 are based on the C85modelof circular Galactic rotation. Perturbations to circular rota-tion caused by random gas motions and spiral-arm stream-ing motions typically have an amplitude of 5–10 km s�1
(Bania & Lockman 1984). Using the C85 rotation curve tocompute distances therefore introduces an uncertainty,because the rotation curve does not account for thesemotions. The uncertainties in distance listed in column (8)are calculated by allowing a�5 km s�1 range in velocity cen-tered on the recombination-line velocity of each H ii region
complex. We then use the C85 rotation curve to computethe distances corresponding to the high and low ends of thisvelocity range. We list the resulting full range in distance asa distance uncertainty.
For most of the H ii regions, the uncertainty is typically10%–15% of the distance. Near the tangent point, the dis-tance depends very strongly on the velocity, and the uncer-tainties are larger, sometimes as high as �1 kpc. Sometangent-point H ii region complexes have recombination-line velocities greater than 5 km s�1 above the tangent-pointvelocity. Because their radial velocities are greater thanthe tangent-point velocity, these sources are probablyquite close to the tangent point. Moreover, calculation ofdistance uncertainties for these H ii region complexes basedon recombination-line velocity ranges of �5 km s�1 is not
Fig. 5.—Six more examples of H i absorption spectra of H ii region complexes. The spectra are displayed as in Fig. 4, although two recombination-linevelocities are indicated for both G23.900+0.068 andG31.243�0.110.We assign the sources shown at top left and middle left to the far kinematic distance witha quality of B. We assign the sources shown at bottom left and at top, middle, and bottom right to the tangent-point velocity. The sources at bottom left andtop right have a quality of A, and the sources at middle right and bottom right have a quality of B.
No. 2, 2003 RESOLVING KINEMATIC DISTANCE AMBIGUITY 763

possible. Hence, we have included neither distanceuncertainties nor error bars for H ii region complexes withrecombination-line velocities greater than 5 km s�1 abovethe tangent-point velocity.
The kinematic distances computed using the OM98 rota-tion curve are not significantly different from the results ofthe C85 rotation curve. The average difference is less than
5%, and the difference was greater than 10% for only five ofthe H ii region complexes. Because the results of the tworotation curves are so similar, we do not report the distancescomputed from the OM98 curve.
In contrast, the average ratio of the far kinematic distanceto the near kinematic distance for these 49 H ii region com-plexes is 2.5. Our resolution of the KDA has, therefore, sub-
TABLE 1
H ii Region Complexes
Source
Name
(1)
R.A.
(J2000.0)
(2)
Decl.
(J2000.0)
(3)
Vr
(km s�1)
(4)
Vt
(km s�1)
(5)
Va
(km s�1)
(6)
KDA
Resolution
(7)
Distance
(kpc)
(8)
Quality
Assignment
(9)
G18.149�0.283 ............... 18 25 01.2 �13 15 28.9 53.9 126 60 N 4.3� 0.2 A
G18.259�0.307 ............... 18 25 19.1 �13 10 19.1 50.9 125 50 N 4.1� 0.3 A
G18.303�0.390a.............. 18 25 42.2 �13 10 18.5 32.7 125 54 N 3.0� 0.4 A
G19.610�0.235a.............. 18 27 38.3 �11 56 35.4 41.0 119 131 F 12.6� 0.3 A
G19.678�0.132 ............... 18 27 23.7 �11 50 06.2 55.0 119 127 F 11.8� 0.2 A
G21.874+0.007a.............. 18 31 02.6 �09 49 31.2 24.4 113 119 F 13.7� 0.4 A
G23.437�0.207 ............... 18 34 44.2 �08 32 15.5 103.0 111 104 N 6.6� 0.5 B
G23.691+0.207a.............. 18 33 43.4 �08 07 17.1 103.8 111 113 F 8.9� 0.5 B
G23.871�0.120a.............. 18 35 13.9 �08 06 44.3 73.8 111 121 F 10.7� 0.2 A
G23.900+0.068............... 18 34 36.7 �08 00 00.0 32.8 111 110 ? . . . . . .
G23.900+0.068............... 18 34 36.7 �08 00 00.0 103.4 111 110 T 7.7� 1.1 B
G23.955+0.150a.............. 18 34 25.2 �07 54 48.3 78.9 110 83 N 5.1� 0.2 A
G24.129�0.070 ............... 18 35 31.9 �07 51 36.9 86.9 110 82 N 5.5� 0.3 A
G24.469+0.491a.............. 18 34 09.3 �07 18 00.4 99.8 110 107 F 9.2� 0.4 B
G25.380�0.181a.............. 18 38 14.9 �06 48 00.5 59.1 110 67 N 4.0� 0.3 A
G25.404�0.253 ............... 18 38 33.0 �06 48 42.6 67.6 110 55 N 4.5� 0.3 A
G26.544+0.413a.............. 18 38 16.4 �05 29 36.1 88.4 109 117 F 9.7� 0.3 A
G28.652+0.027............... 18 43 31.4 �03 47 45.6 102.4 106 109 F 8.2� 0.6 B
G28.806+0.175a.............. 18 43 16.7 �03 35 29.0 107.6 105 108 T 7.4� 0.7 A
G29.957�0.018a.............. 18 46 04.3 �02 39 20.2 96.7 103 105 F 8.4� 0.5 B
G30.535+0.021a.............. 18 46 59.4 �02 07 24.7 45.6 101 119 F 11.6� 0.3 A
G30.783�0.028 ............... 18 47 37.0 �01 55 30.7 91.6 101 122 F 8.7� 0.5 A
G31.243�0.110a.............. 18 48 44.9 �01 33 11.7 29.9 100 113 ? . . . . . .
G31.243�0.110a.............. 18 48 44.9 �01 33 11.7 98.0 100 113 T 7.3� 0.5 B
G31.279+0.063............... 18 48 11.9 �01 26 32.3 104.7 100 112 T 7.3 A
G31.395�0.259 ............... 18 49 33.4 �01 29 09.3 86.2 99 107 F 8.9� 0.3 A
G31.412+0.308a.............. 18 47 34.1 �01 12 43.9 102.2 99 107 T 7.2� 0.8 A
G32.799+0.190a.............. 18 50 31.1 00 01 54.0 15.0 96 110 F 13.1� 0.3 A
G33.915+0.109a.............. 18 52 50.6 00 55 28.7 101.4 93 110 T 7.0 A
G34.255+0.145............... 18 53 20.1 01 14 37.1 54.6 92 65 N 3.6� 0.3 A
G35.574+0.068a.............. 18 56 01.0 02 22 56.2 50.5 88 99 F 10.5� 0.3 A
G35.590�0.026 ............... 18 56 22.9 02 21 13.0 52.8 88 87 F 10.4� 0.3 A
G37.360�0.231 ............... 19 00 21.1 03 50 04.3 40.3 84 87 F 10.9� 0.3 A
G37.543�0.112a.............. 19 00 15.7 04 03 06.0 52.5 83 87 F 10.0� 0.4 A
G37.749�0.109 ............... 19 00 37.8 04 14 10.5 57.8 83 86 F 9.6� 0.4 A
G37.763�0.216 ............... 19 01 02.2 04 11 59.1 65.3 83 94 F 9.0� 0.4 A
G37.872�0.397a.............. 19 01 52.9 04 12 49.8 60.8 82 100 F 9.4� 0.4 A
G42.434�0.262a.............. 19 09 50.2 08 19 39.9 62.7 71 76 F 8.0� 0.6 B
G43.172+0.006a.............. 19 10 15.2 09 06 22.1 8.9 70 78 F 11.6� 0.3 A
G43.186�0.526a.............. 19 12 11.3 08 52 21.2 55.0 70 71 F 8.5� 0.4 A
G45.122+0.132a.............. 19 13 27.9 10 53 34.9 57.6 65 71 F 7.6� 0.7 B
G45.455+0.058a.............. 19 14 21.7 11 09 13.0 55.9 64 73 F 7.7� 0.6 A
G45.478+0.131a.............. 19 14 08.5 11 12 28.4 56.0 64 71 F 7.7� 0.6 B
G45.824�0.284a.............. 19 16 17.8 11 19 16.0 62.3 64 67 F 6.5� 0.7 B
G48.929�0.281 ............... 19 22 15.1 14 03 55.8 66.5 57 74 T 5.6 A
G48.984�0.304 ............... 19 22 26.5 14 06 11.4 65.5 56 71 T 5.6 A
G49.079�0.374 ............... 19 22 52.9 14 09 14.1 67.9 56 81 T 5.6 A
G49.206�0.342a.............. 19 23 00.8 14 16 51.5 67.2 56 73 T 5.5 A
G49.370�0.302a.............. 19 23 11.2 14 26 40.0 53.7 56 72 F 6.3� 0.8 A
G49.480�0.386 ............... 19 23 42.4 14 30 06.1 58.2 55 72 T 5.5� 0.8 A
G49.586�0.385 ............... 19 23 54.7 14 35 44.0 62.1 55 72 T 5.5 A
Note.—Units of right ascension are hours, minutes, and seconds, and units of declination are degrees, arcminutes, and arcseconds.a These sources form the initial target list.
764 KOLPAK ET AL. Vol. 582

stantially improved the distance estimates for these H ii
region complexes.Using the distances and longitudes in Table 1, we con-
structed a face-on map of the Galactic distribution of the 49sources from our H ii region complex list for which we re-solved the KDA. Figure 6 shows this distribution of H ii
region complexes. The filled squares mark the positions ofH ii region complexes with a quality of A, and the sourceswith a quality of B are marked by open squares. The numberof sources on the far side of the locus of tangent pointsexceeds that on the near side by a factor of�4. The distribu-tion of sources is not random. Distinct concentrations andgaps are evident that resemble segments of rings or spiralarms.
We also produced a face-on map of these 49 H ii regioncomplexes using the distances calculated from the OM98rotation curve. The two face-on diagrams are shown
together in Figure 7 for comparison. Although the exactpositions of several H ii region complexes differ slightlyaccording to which rotation curve is employed to calculatethe distances, the overall pattern of H ii region complexes isthe same.
4. DISCUSSION
4.1. Notes on Specific Sources
Complications arose while assigning kinematic distancesto some sources. Two recombination-line velocity compo-nents are listed in L89 for each of three of the sources on ourH ii region complex list. In another case, we detected tworadio continuum peaks separated by only 2<6 with very dif-ferent absorption spectra. We give the details for each ofthese difficult cases below.
4.1.1. G23.900+0.068 and G31.243�0.110
Both of these sources are blended H ii regions. Their posi-tions are each listed in the L89 recombination-line surveywith two velocity components. These two velocity com-ponents probably come from two separate H ii regioncomplexes along each of these two lines of sight that wereblended together in the same beam in the recombination-line observations. Both G23.900+0.068 and G31.243�0.110 have one recombination-line component at a lowvelocity (<50 km s�1) and another at a high velocity (90–100 km s�1), slightly less than the tangent-point velocity.Our 21 cm continuum maps for G23.900+0.068 andG31.243�0.110, however, reveal only one compact compo-nent at each position. We do not detect two separate com-ponents with distinct absorption spectra at either positionthat could correspond to the two recombination-line veloc-ity components reported for each of these sources.
We measure H i absorption toward both G23.900+0.068and G31.243�0.110 at velocities up to and including thetangent-point velocity, and therefore, at least one of the H ii
regions along each of these sight lines must be at least as dis-tant as the tangent point. Because we cannot determinewhich H ii region is responsible for the high-velocity absorp-tion, however, we cannot resolve the KDA for any of thesefour H ii region complexes.
On the other hand, because the high-velocity recombina-tion-line component is centered at a velocity nearly as largeas the tangent-point velocity for both G23.900+0.068 andG31.243�0.110, the difference between the near and far kin-ematic distances for these H ii region complexes is small (�1kpc). We therefore place the high-velocity H ii region com-plexes at the tangent-point distance and include a distanceuncertainty equal to the difference between the near and farkinematic distances. We also give these distance determina-tions a quality of B.
For the low-velocity components, the difference betweenthe near and far kinematic distances is large (�10 kpc), andit is unreasonable to place them at the tangent-point dis-tance. Because their H i absorption spectra are blended withthose of the high-velocity complexes, we are unable toresolve the KDA for these two low-velocity H ii regioncomplexes.
4.1.2. G30.535+0.021
Although L89 reports two different recombination-linevelocities, 46.1 and 95.2 km s�1, at the position of this H ii
Fig. 6.—Positions of the 49 H ii region complexes for which we resolvedthe KDA, plotted in a face-on representation of the Galaxy. The sourceswere placed according to their longitude and kinematic distance, and theerror bars represent a �5 km s�1 variation in the recombination-line veloc-ity (except for G23.900+0.068 and G31.243�0.110; see x 4.1.1). The long,straight lines indicate our longitude range, and the large semicircle is thelocus of tangent points that separates near from far sources. Sources withquality A kinematic distance determinations are marked with filled squares,and those with quality B kinematic distance determinations are markedwith open squares.
No. 2, 2003 RESOLVING KINEMATIC DISTANCE AMBIGUITY 765

region complex, Wood & Churchwell (1989, hereafterWC89) report a single velocity, 45.6 km s�1. The observa-tions of WC89 were made in the H76-� line with the VLA inthe D array with a synthesized beam size of 4>4. Theyobtained spectra by integrating over roughly one synthe-sized beam.We obtained our 21 cmH i absorption spectrumfor this source over a very similarly sized region, centeredat the same position. The second velocity component seenby L89 may originate from a source other thanG30.535+0.021. We therefore used the velocity measuredby WC89 to compute a kinematic distance forG30.535+0.021.
4.1.3. G25.397�0.141
Source G25.397�0.141 is only 2<3 from an L89recombination-line source, and its spectrum reveals no sub-stantial negative velocity absorption. Nevertheless, we havenot included this source on the H ii region complex list. TheL89 recombination-line source associated with G25.397�0.141 is also only 0<3 from another H ii regioncomplex, G25.380�0.181. In fact, G25.397�0.141 andG25.380�0.181 are so close that we initially assumed theywere a single H ii region complex. The spectrum ofG25.397�0.141, however, shows 21 cm absorption up to100 km s�1, whereas the maximum velocity of reliablydetected absorption in the spectrum of G25.380�0.181 is 67km s�1. This difference suggests that these two sources areseparate H ii region complexes. The velocity of the nearbyrecombination-line source is 59.1 km s�1, and becausesource G25.380�0.181 shows no absorption at velocitiessignificantly greater than this, we assign it to the near kine-
matic distance. Because G25.397�0.141 shows absorptionalmost up to the tangent-point velocity of 110 km s�1, it isprobably at least as distant as the tangent point. Unfortu-nately, we have no recombination-line velocity to associatewith the more distant source, G25.397�0.141, and so wecannot determine a kinematic distance for it.
4.2. Comparison with Previous Determinations
Previous studies have determined distances for many ofthe 51 H ii region complexes in Table 1. A comparison ofour KDA resolutions with those derived using differenttechniques is important for two reasons. First, agreementbetween our results and previous determinations enhancesconfidence in the various techniques and KDA resolutions.In addition, by studying the disagreements, we may learnabout problems associated with the KDA resolutiontechniques.
KB94 resolved the KDA for 70 H ii region complexes anddetermined kinematic distances based on the C85 rotationcurve. Our determinations match theirs for 25 of 27 com-mon sources.
One of the discrepancies is for G30.535+0.021. In theiranalysis, KB94 used both of the recombination-line velocitycomponents reported by L89 and treated G30.535+0.021 astwo separate H ii region complexes. Because L89 lists both alow- and high-velocity component toward G30.535+0.021and because KB94 measured absorption up to the tangent-point velocity toward this source, they were unable toresolve the KDA for either the low- or the high-velocity H ii
region complex. As explained in x 4.1.2, we regarded this asa single H ii region complex with a recombination-line
Fig. 7.—(a) Same as Fig. 6. (b) Face-on map of the same 49 H ii region complexes with distances calculated using the OM98 rotation curve. The distanceshave been rescaled so thatR0 ¼ 8:5 kpc. The position and shape of the large-scale features are essentially the same in both plots.
766 KOLPAK ET AL. Vol. 582

velocity of 45.6 km s�1. We measured H i absorptionbeyond the tangent-point velocity, and G30.535+0.021 fallswell within the 90% confidence contour for far sources inFigure 3. We therefore assigned the far kinematic distanceand a quality of A to this source.
The other discrepancy is for source G30.783�0.028. Thissource has a recombination-line velocity of 91.6 km s�1, andthe tangent-point velocity for this line of sight is 101 km s�1.In their Table 1, KB94 list 94.3 km s�1 as the nearest velocityto the recombination-line velocity at which H i absorptionwas detected for this H ii region complex, but the maximumvelocity at which they detected H i absorption is not listed.Presumably, it is less than the tangent-point velocity, andthey therefore assigned the H ii region complex to the nearkinematic distance, 5.7 kpc. If 94.3 km s�1 in fact representsthe maximum velocity at which KB94 detected H i absorp-tion, they would place this source just above the dashed,diagonal line in Figure 3, and we would assign it a quality B,near kinematic distance. We detected very strong 21 cm H i
absorption toward this source beyond the tangent-pointvelocity (see Fig. 4a [middle right]). G30.783�0.028 there-fore falls well below the uncertain triangular zone in Figure3, and we assign this source to the far kinematic distancewith a quality of A.
We also compared our H ii region complex distanceswith the list compiled by Wilson (1980, hereafter W80).Of 36 sources common to both our lists, there are23 matches and 13 discrepancies. For five of the discrepan-cies (G19.610�0.235, G19.678�0.132, G30.783�0.028,G31.395�0.259, and G35.590�0.026), we assign the H ii
region complex to the far distance and Wilson assigns it tothe near distance (see Table 2 of W80). All of these H ii
region complexes fall within the 90% confidence contour forfar sources in Figure 3, and so their distance determinationshave A qualities. We measure 21 cm absorption at velocitiesgreater than the tangent-point velocity for all butG35.590�0.026. For this source, we only detected H i
absorption up 87 km s�1, and the tangent-point velocity is88 km s�1. Because the recombination-line velocity forG35.590�0.026 is only 52.8 km s�1, however, this sourcemust be behind a high-velocity H i cloud near the tangentpoint.
To understand these five discrepancies, it is important tonote that the determinations of W80 are based primarily onH2CO absorption spectra collected by Downes et al. (1980,hereafter D80). As mentioned in x 1.2, formaldehydeabsorption experiments may yield false near determinationsbecause of the small filling factor of molecular gas in thedisk, which could lead to a lack of gas at the tangent pointalong a particular line of sight.
For three additional discrepancies (G23.955+0.150,G25.380�0.181, and G25.404�0.253), we assign the H ii
region complexes to the near distance andW80 assigns themto the far distance (although the distances for these threesources are listed in Table 2 of W80 with question marks toindicate some uncertainty). These three sources fall wellwithin the 90% confidence contour for near sources. In allthree cases, the maximum velocity of H i absorption is atleast 25 km s�1 below the tangent-point velocity. We also donot detect any H i absorption at velocities greater than 8 kms�1 above the recombination-line velocity of these H ii
region complexes. Our results do not support theassignment of the far kinematic distance to any of thesethree sources.
According to the C85 rotation curve, the tangent-pointvelocity for all three of these sources is 110 km s�1. ForG23.955+0.150, D80 detected a single formaldehydeabsorption feature, centered at 81.3 km s�1, with a half-power width of 3.2 km s�1 (D80 list an uncertainty of 2–5km s�1 for the line centers and half-power widths), and forG25.404�0.253, D80 did not detect any formaldehydeabsorption. Although W80 gives no indication of whatother information was used to resolve the KDA for thesesources, it seems unlikely that he assigned them to the farkinematic distance based solely on the D80 survey data.
For G25.380�0.181, D80 detected a formaldehydeabsorption line at 95.7 km s�1 with a half-power width of3.3 km s�1. W80 probably assigned this source to the farkinematic distance because of this high-velocity absorptionfeature. Our H i spectrum for this source shows no 21 cmabsorption above 67 km s�1. As explained above in x 4.1.3,however, we measure H i absorption up to 100 km s�1 foranother source, G25.397�0.141, which is separated fromG25.380�0.181 by only 2<6. Because the telescope beam-width for the D80 survey is also 2<6, it is likely that theabsorption spectrum that they measured towardG25.380�0.181 was substantially contaminated by absorp-tion toward G25.397�0.141. The 95.7 km s�1 formaldehydeabsorption feature that they detected is therefore probablycaused by G25.397�0.141 and not by G25.380�0.181,which is the source nearest to the recombination-lineemission.
The five remaining discrepancies (G23.437�0.207,G23.691+0.207, G24.469+0.491, G49.370�0.302, andG49.480�0.386) probably arise from our use of differentrotation curves. The KDA resolutions in W80 were madeusing the Schmidt (1965) model of Galactic rotation,whereas we used the C85 rotation curve. We assignG49.370�0.302 to the far kinematic distance andG49.480�0.386 to the tangent-point distance, both withqualities of A, and the other three sources all receive qual-ities of B. We assign G23.437�0.207 to the near kinematicdistance and G23.691+0.207 and G24.469+0.491 to the farkinematic distance. W80, on the other hand, assignsG49.480�0.386 to the far kinematic distance and the otherfour sources to the tangent-point distance. All five of theseH ii region complexes have recombination-line velocitieswithin 10 km s�1 of the tangent-point velocities indicated bythe C85 rotation curve, and so they are all near the tangent-point distance. The Schmidt (1965) model predicts a differ-ent set of tangent-point velocities, and this is likely to be thereason for the discrepancies. In any case, for none of thesefive sources is our distance determination more than 1.6 kpcdifferent from that of W80 (after his distances have beenscaled so thatR0 ¼ 8:5 kpc).
CSS88 estimate distances for 50 H ii region complexes inthe first Galactic quadrant (see their Table 4). They selectedthe near or far kinematic distance by calculating the densityof molecular gas at both locations. In order to do this, theyhad to first resolve the KDA for the gas itself. They assumedthat the latitude profile of the molecular emission at a givenlongitude and velocity could be modeled by two superposedGaussian distributions: a narrow component from the gasat the far kinematic distance and a broad component fromthe gas at the near kinematic distance. The H ii region com-plexes were assigned to the distance that corresponded to ahigher molecular gas density. We detect eight of the H ii
region complexes in their list.
No. 2, 2003 RESOLVING KINEMATIC DISTANCE AMBIGUITY 767

Our near-far determinations agree with those of CSS88for only one of the sources common to both studies. For theremaining seven sources, our methods yield different results.One of these discrepancies, G28.652+0.027, is probably dueto a difference between the criteria used to select tangent-point sources. We assigned this source to the far kinematicdistance with a quality of B, and CSS88 assigned it to thetangent-point distance. The recombination-line velocity forthis source is only a few km s�1 below the tangent-pointvelocity for this line of sight, and our distance determina-tions actually differ by only 600 pc.
For the six discrepancies that remain (G19.610�0.235, G23.437�0.207, G23.955+0.150, G26.544+0.413,G34.255+0.145, and G43.186�0.526), either we assign thesource to the near kinematic distance and CSS88 assign it tothe far kinematic distance, or vice versa. We assign a qualityof A to all but one of these distance determinations, that ofG23.437�0.207.
Because of the small overlap (�15%) between our surveysample and that of CSS88, we cannot be certain whetherthese six discrepancies characterize a general disparitybetween the two methods of resolving the KDA. The 75%disagreement rate for sources common to both surveys doessuggest, however, that the CSS88 KDA resolutions may beunreliable.
4.3. Correlation withMolecular Gas
Star formation occurs predominately within molecularclouds. Because H ii regions are produced by short-lived,early-type stars, there should be a correlation between con-centrations of molecular gas and H ii regions.
In order to search for such a correlation, we superposedthe 49 H ii region complexes for which we determined kine-matic distances on a kinematically derived profile of theface-on Galactic distribution of molecular hydrogen density(as traced by 12CO emission) made by CSS88. This is shownin Figure 8. The error bars in position have been calculatedas described above in x 3.3.
There are two versions of the C85 rotation curve, onevalid for R0 ¼ 8:5 kpc, V0 ¼ 220 km s�1, and another validfor R0 ¼ 10 kpc, V0 ¼ 250 km s�1. We determined kine-matic distances using the former version, but the densityprofile was created using the latter, and in Figure 8, it hasbeen rescaled so that R0 ¼ 8:5 kpc. The two C85 rotationcurves, however, are not scaled versions of one another, andit is not strictly correct to compare this rescaled density pro-file with the H ii region positions from Figure 6. We there-fore recalculated the kinematic distances for the 49 H ii
region complexes using the R0 ¼ 10 kpc, V0 ¼ 250 km s�1
version of the C85 rotation curve and then rescaled them sothat R0 ¼ 8:5 kpc. These rescaled distances are typically lessthan 1% different from the distances in Table 1. In Figure 8,we plot the face-on positions of H ii regions derived fromthese rescaled distances.
A striking correlation is evident between the distributionof H ii regions and the main ridges of H2 density. The molec-ular ring is particularly well defined by an arc of 25 H ii
regions at a Galactocentric radius of 5 kpc. The Sagittariusspiral arm (CSS88) is clearly outlined by an arc of 22 sourcesat a Galactic radius of roughly 6 kpc, and there is a distinctgap between this feature and the ring. The two sources neara radius of 8 kpc lie on the Perseus spiral arm (CSS88). Thespatial correlation between large-scale molecular gas den-
sity peaks and concentrations of bright H ii region com-plexes supports the idea that spiral arms are sites of currentstar formation.
It is important to emphasize, however, that the distancesto these 49 sources were derived from the same Galacticrotation model that was used to determine the molecularhydrogen density distribution. In this light, the excellentface-on correlation can be interpreted more purely as a cor-relation in (l, v)-space combined with a successful resolutionof the KDA.
4.4. Near-Far Asymmetry
In our sample of 51 H ii region complexes, there are �3times more sources at the far kinematic distance than at thenear kinematic distance. This asymmetry could be causedby several effects: geometrical dilution, Malmquist bias, andnonuniform source distribution.
Geometrical dilution is of primary importance. In theinner Galaxy, the area of the disk on the near side of thelocus of tangent points is one-third the area on the far side.Therefore, if the sources are distributed uniformly, weexpect to find roughly a 3 : 1 ratio between the number of
Fig. 8.—Positions of the 49 H ii region complexes for which we resolvedthe KDA, superposed on a gray-scale representation of a kinematicallyderivedmolecular hydrogen density profile adapted fromCSS88. The origi-nal profile has been rescaled so that R0 ¼ 8:5 kpc, and the gray-scale bar atthe right displays the density-color transfer function. Sources with qualityA kinematic distance determinations are marked with filled squares, andthose with quality B kinematic distance determinations are marked withopen squares. The two main arcs of H ii region complexes coincide withlarge-scale features in the density model.
768 KOLPAK ET AL. Vol. 582

far and near sources. In addition, because our observationswere limited to Galactic latitudes between �0=5 and +0=5,we should expect an even larger asymmetry. If the H ii
region complexes are distributed uniformly in the disk witha Gaussian vertical distribution and a scale height of 50 pc,then our latitude range samples less than 1 scale height fordistances closer than 5.7 kpc. The tangent point for our lon-gitude range is, on average, 7.4 kpc away, significantly moredistant than the point beyond which we sample a full scaleheight of the disk. Therefore, our latitude limits cause us tomiss significantly more near sources than far sources.Including the effects of both our longitude and latituderanges, we estimate a total geometrical asymmetry of3:8 : 1.
Because our source sample is flux-limited, it is subject toMalmquist bias. We could be biased to the detection ofintrinsically bright sources, which are rare and typically verydistant. The magnitude of such an effect depends on thedetailed shape of the radio luminosity function for H ii
region complexes.Finally, the asymmetry could partly reflect a genuinely
nonuniform distribution of sources. Specifically, there maybe an overabundance of H ii region complexes at the far kin-ematic distance in the longitude range of our survey.
The observed asymmetry between H ii region complexesat the near and far kinematic distances is easily accountedfor by geometrical effects alone. We therefore conclude thatthe survey geometry is primarily responsible for theobserved asymmetry. Both Malmquist bias and a genuinefar-side overabundance may exist at a low level, but theseeffects are probably outweighed by the dominant impact ofgeometrical asymmetry.
5. SUMMARY
We resolved the kinematic distance ambiguity (KDA)toward 49 bright, compact radio H ii region complexes in
the first Galactic quadrant by evaluating the maximumvelocity of 21 cm H i absorption. With the KDA removed,we were then able to derive kinematic distances to these 49H ii region complexes using their published radio recombi-nation-line velocities.
Most of our KDA resolutions are in agreement with pre-vious determinations. In 22 cases, however, our resolutionof the KDA is different from that of previous studies. Wherethere is disagreement, we believe that our determinationsare more reliable. This statement is based on three impor-tant factors that affect the quality of our KDA resolutions:the ubiquity of H i clouds, the high spatial resolution of ourdata, and the ability of the VLA to resolve out large-scaleH i emission.
We found �3 times as many sources at the far side of thelocus of tangent points as at the near side. This asymmetrycan be explained by the geometrical effects of the location ofthe tangent-point locus and the limited latitude rangesampled.
The kinematic distances we determined were used to pro-duce a face-on map of H ii region complexes in the firstGalactic quadrant. Most of the 49 H ii region complexes areconcentrated in two main rings with a distinct gap betweenthem. The distribution strongly suggests spiral structure,and the two rings of H ii region complexes roughly matchthe positions of spiral arms proposed by Vallee (2002). Fur-thermore, the spatial distribution of H ii region complexes isstrongly correlated with a kinematically derived profile ofthe density of molecular gas determined from 12CO emis-sion. The 5 kpc molecular ring and the Sagittarius spiralarm are very distinct, and a few H ii region complexes liealong the Perseus arm.
This work was supported in part by NSF grants AST 98-00334 and AST 00-98562. The FCRAO is supported byNSF grants AST 97-25951 and AST 01-00793.
REFERENCES
Bania, T.M., & Lockman, F. J. 1984, ApJS, 54, 513Blitz, L., Fich, M., & Stark, A. A. 1980, in IAU Symp. 87, InterstellarMolecules, ed. B. H. Andrew (Dordrecht: Reidel), 213
Brand, J., & Blitz, L. 1993, A&A, 275, 67Broadbent, A., Haslam, C. G. T., & Osborne, J. L. 1989, MNRAS, 237,381
Clemens, D. P. 1985, ApJ, 295, 422 (C85)Clemens, D. P., Sanders, D. B., & Scoville, N. Z. 1988, ApJ, 327, 139(CSS88)
Condon, J. J., Cotton, W. D., Greisen, E. W., Yin, Q. F., Perley, R. A.,Taylor, G. B., & Broderick, J. J. 1998, AJ, 115, 1693
Dickey, J.M., & Lockman, F. J. 1990, ARA&A, 28, 215Downes, D., Wilson, T. L., Bieging, J., & Wink, J. 1980, A&AS, 40, 379(D80)
Kolpak, M. A., Jackson, J. M., Bania, T. M., & Dickey, J. M. 2002, ApJ,578, 868
Kuchar, T. A., & Bania, T.M. 1994, ApJ, 436, 117 (KB94)Kulkarni, S. R., & Heiles, C. 1987, in Interstellar Processes, ed. D. J.Hollenbach &H. A. Thronson, Jr. (Dordrecht: Reidel), 87
Liszt, H. S., & Burton,W. B. 1983, in Kinematics, Dynamics, and Structureof theMilkyWay, ed.W. L. H. Shuter (Dordrecht: Reidel), 135
Lockman, F. J. 1989, ApJS, 71, 469 (L89)McGlynn, T., Scollick, K., & White, N. 1996, in IAU Symp. 179, NewHorizons from Multiwavelength Sky Surveys, ed. B. J. McLean et al.(Dordrecht: Kluwer), 465
Olling, R. P., &Merrifield,M. R. 1998,MNRAS, 297, 943 (OM98)Payne, H. E., Salpeter, E. E., & Terzian, Y. 1983, ApJ, 272, 540Perryman,M. A. C., et al. 1995, A&A, 304, 69Sault, R. J., Teuben, P. J., & Wright, M. C. H. 1995, in ASP Conf. Ser. 77,Astronomical Data Analysis Software and Systems IV, ed. R. Shaw,H. E. Payne, & J. J. E. Hayes (San Francisco: ASP), 433
Schmidt, M. 1965, in Galactic Structure, ed. A. Blaauw & M. Schmidt(Chicago: Univ. Chicago Press), 513
Simon, R., Jackson, J. M., Clemens, D. P., Bania, T. M., & Heyer, M. H.2001, ApJ, 551, 747
Steer, D., Dewdney, P., & Ito,M. 1984, A&A, 137, 159Vallee, J. 2002, ApJ, 566, 261Wilson, T. L. 1972, A&A, 19, 354———. 1980, in Radio Recombination Lines, ed. P. A. Shaver (Dordrecht:Reidel), 205 (W80)
Wood, D. O. S., & Churchwell, E. 1989, ApJS, 69, 831 (WC89)
No. 2, 2003 RESOLVING KINEMATIC DISTANCE AMBIGUITY 769