resolving the it productivity paradox: are we there yet?eprints.qut.edu.au/50810/1/50810.pdf · it...
TRANSCRIPT
Resolving the IT Productivity Paradox: Are we there yet?
Acklesh Prasad The University of the South Pacific, Fiji
Jon Heales Peter Green
UQ Business School, The University of Queensland
OCEANIA CACS2011, BRISBANE, 21 SEPTEMBER
Presentation Outline
• What’s the Issue?
• How did we do the Study?
• What were the Findings?
• What do they Mean?
• Where to from Here?
IT Productivity Paradox • The amount of computing power per white-collar
worker in the service industry was growing dramatically over the 1970s and 1980s, yet the measured productivity of this sector was flat (Roach, 1987)
• "we see the computer age everywhere except in the productivity statistics“ (Solow, 1987)
Why Invest in IT? • Many studies over the intervening years have tried to
link amount spent on IT to overall firm performance
• Mixed results
• Customer service and quality consistently rank above cost savings as the prime motivation for making IT investments (Brynjolfsson and Hitt, 1997)
IT Savvy Premium • A measurable bottom line premium for every IT dollar
invested is achieved by companies with a mutually reinforcing set of practices and capabilities (Weill and Aral, 2006)
• High IT-Savvy companies turn IT infrastructure investments into value much faster than low IT-Savvy companies – one year typically rather than three years or longer.
(Weill and Aral, 2006, p. 43)
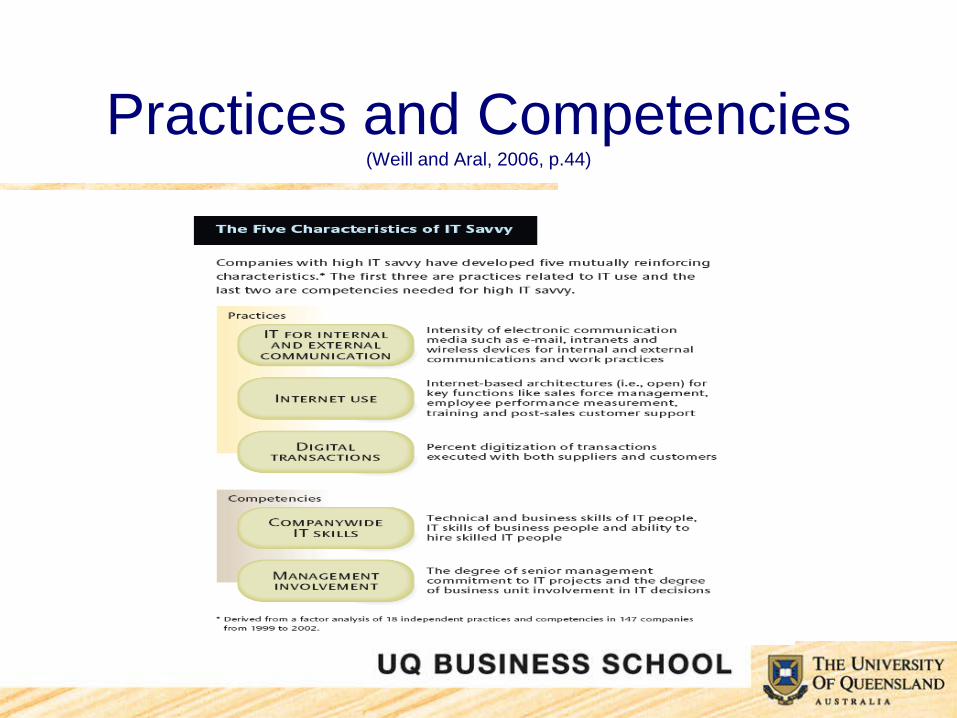
Practices and Competencies (Weill and Aral, 2006, p.44)

Motivation • Investment in IT – A strategic necessity • IT is a common resource – zero
commodity value in a competitive market
• Challenge - securing performance differentiating value from common resources
• Solution – Being different with your IT

Research Problem
• How can organisations source sustainable IT-related business value from their IT resources?
Motivation
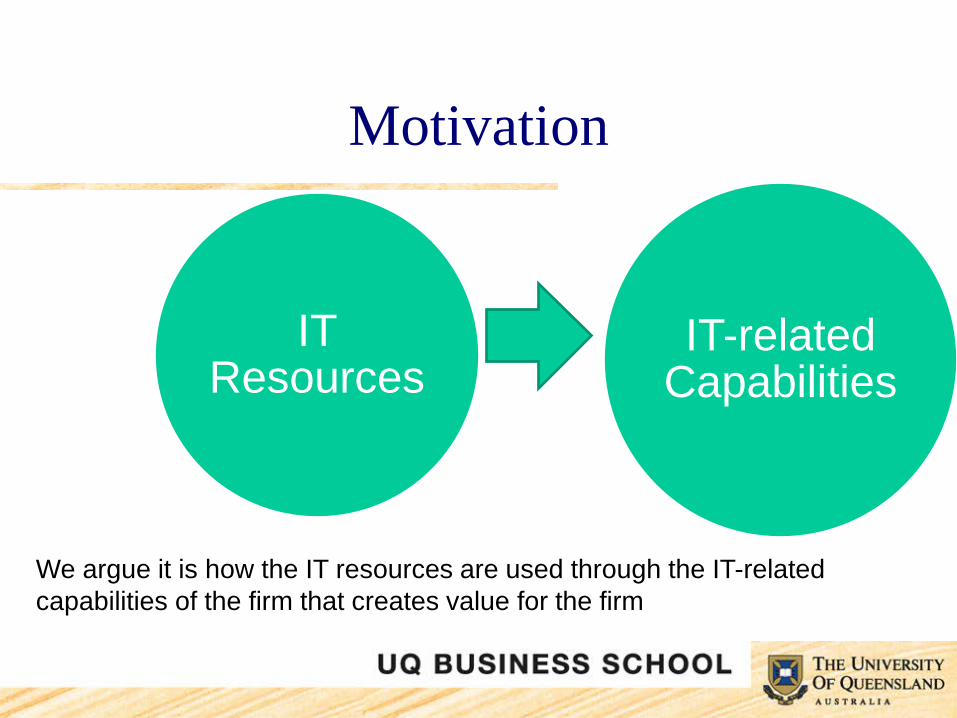
IT Resources
IT-related Capabilities
We argue it is how the IT resources are used through the IT-related capabilities of the firm that creates value for the firm
Motivation
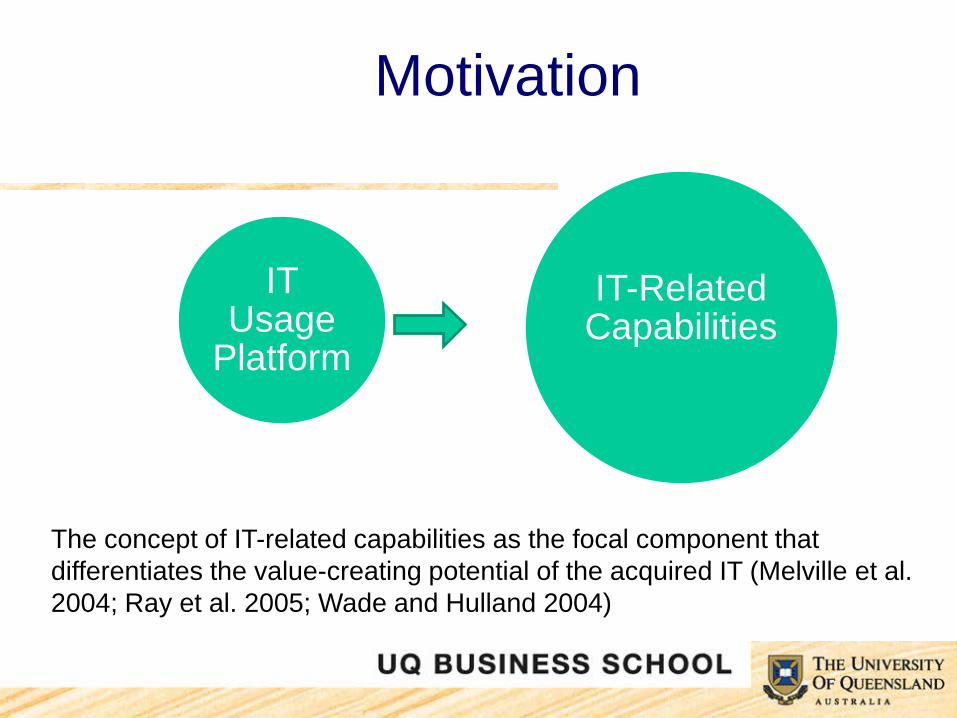
IT Usage
Platform
IT-Related Capabilities
The concept of IT-related capabilities as the focal component that differentiates the value-creating potential of the acquired IT (Melville et al. 2004; Ray et al. 2005; Wade and Hulland 2004)
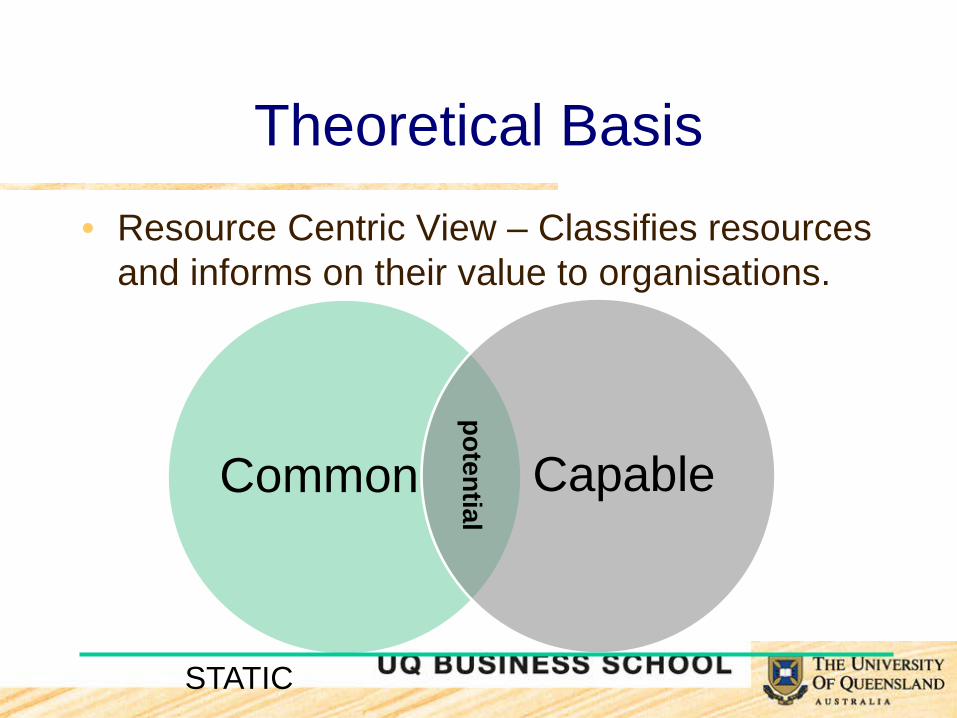
Theoretical Basis • Resource Centric View – Classifies resources
and informs on their value to organisations.
Common Capable potential
STATIC

Dynamic Capabilities • How can we differentiate performance?
• How???
Common Capable
potential Sustainable
It is the Processes! (McAfee and Brynjolfsson, 2008, p.100)
• McAfee and Brynjolfsson (2008) studied all publicly traded companies in the US from the 1960’s through to 2005.
• The link between technology and competition has become much stronger since the mid-1990’s
• Not because more products are becoming digital but because more processes are – a company’s unique business processes can now be propagated with much higher fidelity across the organisation.
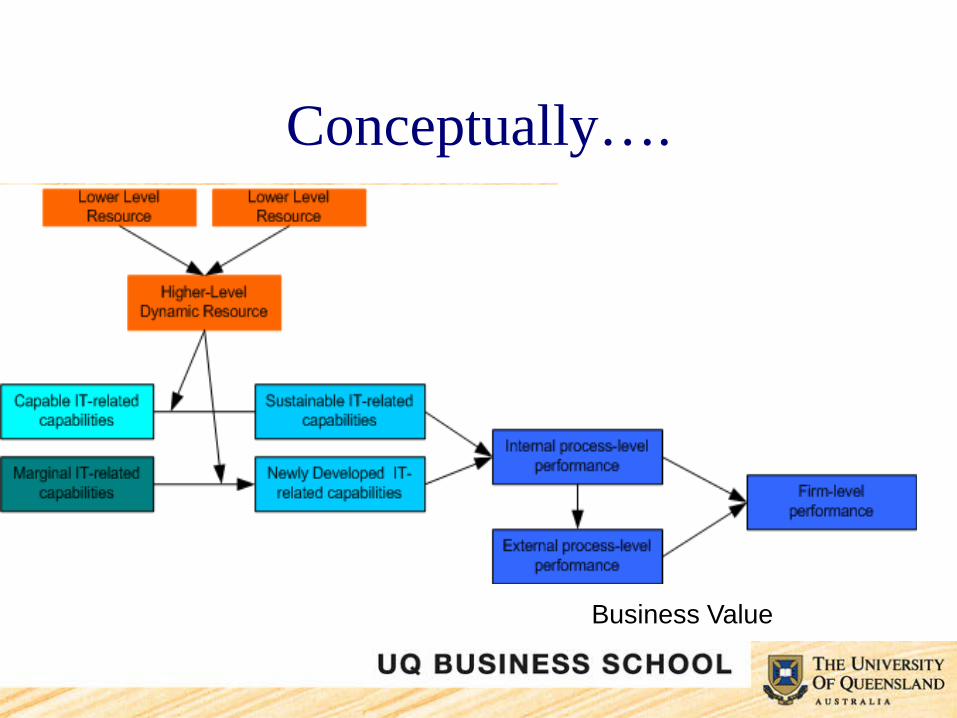
Conceptually….
Business Value
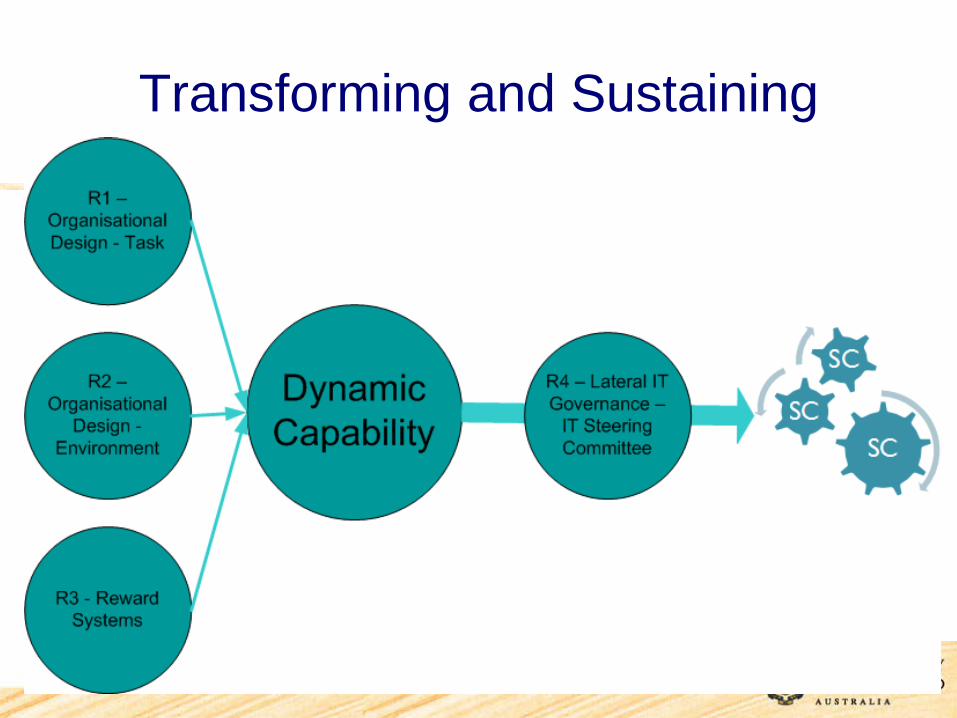
Transforming and Sustaining Capabilities
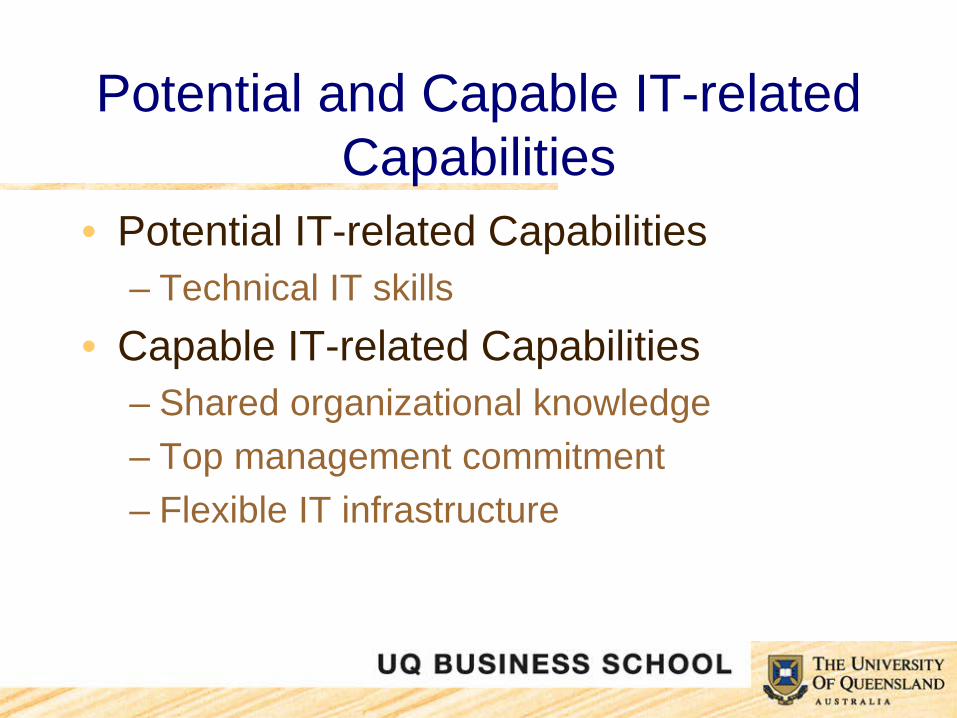
Potential and Capable IT-related Capabilities
• Potential IT-related Capabilities – Technical IT skills
• Capable IT-related Capabilities – Shared organizational knowledge – Top management commitment – Flexible IT infrastructure
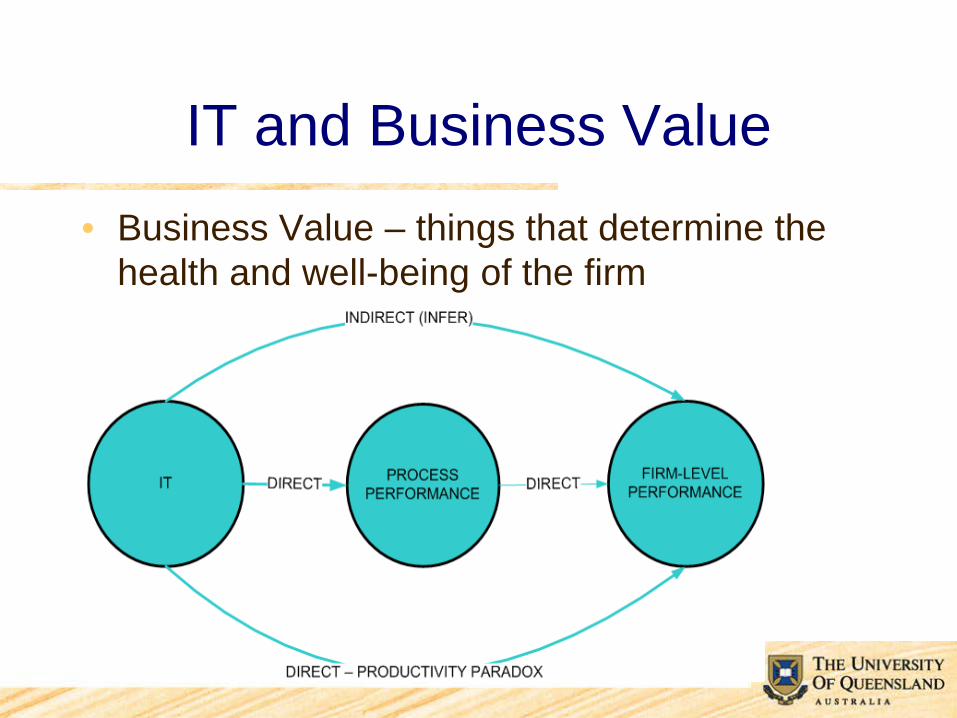
IT and Business Value • Business Value – things that determine the
health and well-being of the firm
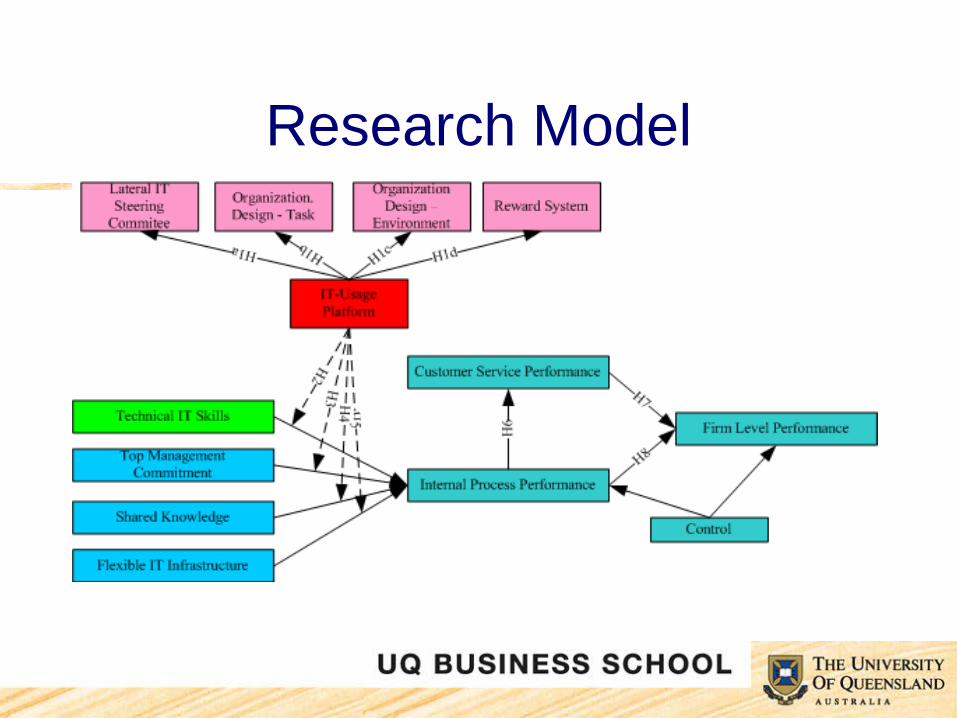
Research Model
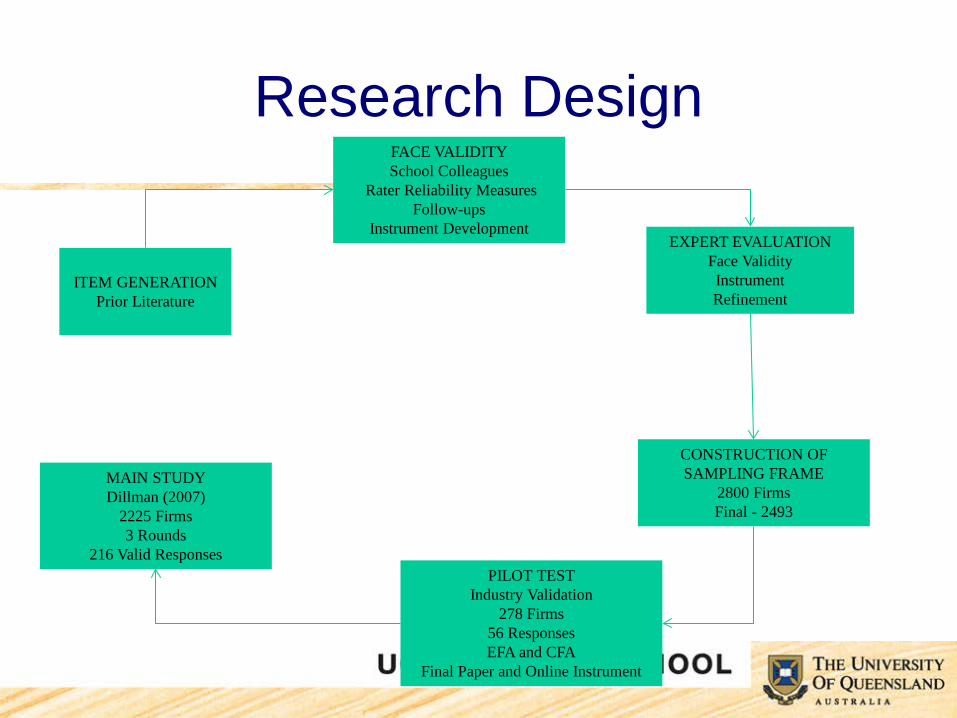
Research Design
ITEM GENERATION
Prior Literature
FACE VALIDITY School Colleagues
Rater Reliability Measures Follow-ups
Instrument Development EXPERT EVALUATION
Face Validity Instrument Refinement
PILOT TEST Industry Validation
278 Firms 56 Responses EFA and CFA
Final Paper and Online Instrument
MAIN STUDY Dillman (2007)
2225 Firms 3 Rounds
216 Valid Responses
CONSTRUCTION OF SAMPLING FRAME
2800 Firms Final - 2493
Diagnostics Checks
• Non-Response bias • • Missing Values
• Common method bias
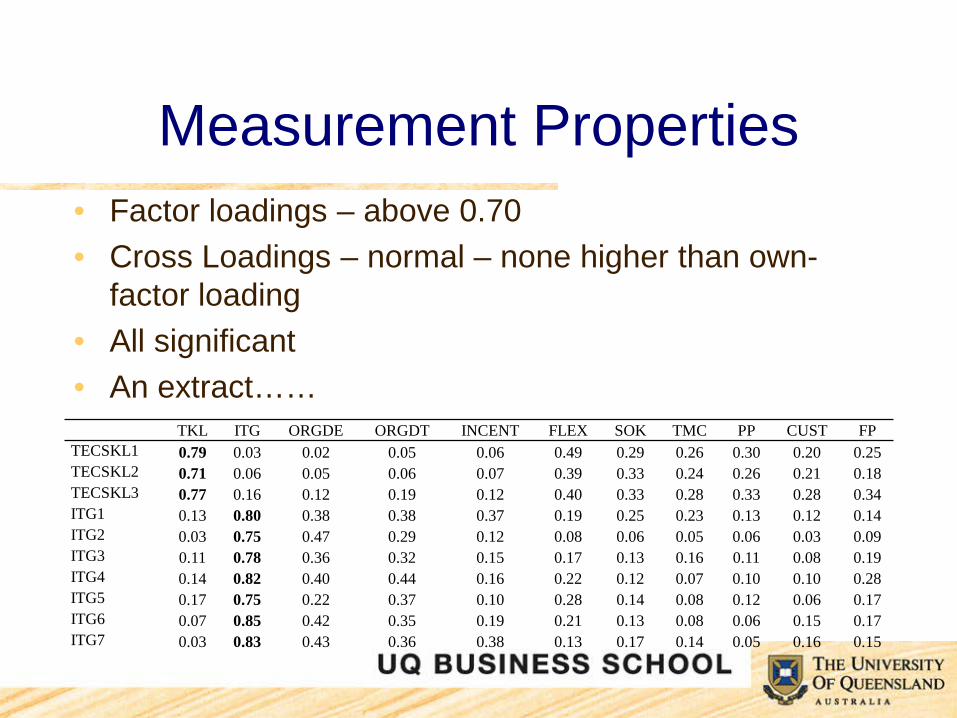
Measurement Properties • Factor loadings – above 0.70 • Cross Loadings – normal – none higher than own-
factor loading • All significant • An extract…… TKL ITG ORGDE ORGDT INCENT FLEX SOK TMC PP CUST FP TECSKL1 0.79 0.03 0.02 0.05 0.06 0.49 0.29 0.26 0.30 0.20 0.25 TECSKL2 0.71 0.06 0.05 0.06 0.07 0.39 0.33 0.24 0.26 0.21 0.18 TECSKL3 0.77 0.16 0.12 0.19 0.12 0.40 0.33 0.28 0.33 0.28 0.34 ITG1 0.13 0.80 0.38 0.38 0.37 0.19 0.25 0.23 0.13 0.12 0.14 ITG2 0.03 0.75 0.47 0.29 0.12 0.08 0.06 0.05 0.06 0.03 0.09 ITG3 0.11 0.78 0.36 0.32 0.15 0.17 0.13 0.16 0.11 0.08 0.19 ITG4 0.14 0.82 0.40 0.44 0.16 0.22 0.12 0.07 0.10 0.10 0.28 ITG5 0.17 0.75 0.22 0.37 0.10 0.28 0.14 0.08 0.12 0.06 0.17 ITG6 0.07 0.85 0.42 0.35 0.19 0.21 0.13 0.08 0.06 0.15 0.17 ITG7 0.03 0.83 0.43 0.36 0.38 0.13 0.17 0.14 0.05 0.16 0.15

Measurement Properties AVE COR CAL CUS FMP FLE INC PRP ITG ODE ODT SOK TKL TMC
CUS 0.70 0.94 0.92 0.84 FMP 0.90 0.97 0.96 0.49 0.95 FLE 0.76 0.94 0.92 0.40 0.37 0.87 INC 0.70 0.92 0.89 0.22 0.28 0.14 0.84 PRP 0.70 0.90 0.86 0.54 0.66 0.52 0.32 0.84 ITG 0.60 0.91 0.89 0.14 0.22 0.24 0.30 0.17 0.77 ODE 0.79 0.92 0.87 0.16 0.21 0.20 0.36 0.30 0.52 0.89 ORT 0.61 0.88 0.82 0.17 0.23 0.25 0.25 0.34 0.47 0.46 0.78 SOK 0.71 0.91 0.88 0.42 0.43 0.48 0.40 0.70 0.22 0.41 0.28 0.84 TKL 0.61 0.88 0.79 0.31 0.35 0.58 0.13 0.40 0.21 0.21 0.14 0.42 0.78 TMC 0.84 0.92 0.82 0.34 0.37 0.41 0.31 0.64 0.21 0.31 0.26 0.60 0.35 0.92 Note: AVE – Average Variance Extracted, COR – Composite Reliability, CAL – Cronbach’s Alpha, CUS – Customer Service Improvement, FMP – Firm-Level Performance, FLE – Flexible IT Infrastructure, INC – Incentive System, PRP – internal process-level performance, ITG – IT Governance, ODE – Decentralized Organization Design - Environment, ODT - Decentralized Organization Design - Task, SOK – Shared Organizational Knowledge, TKL - Technical IT Skills, TMC – Top Management Commitment
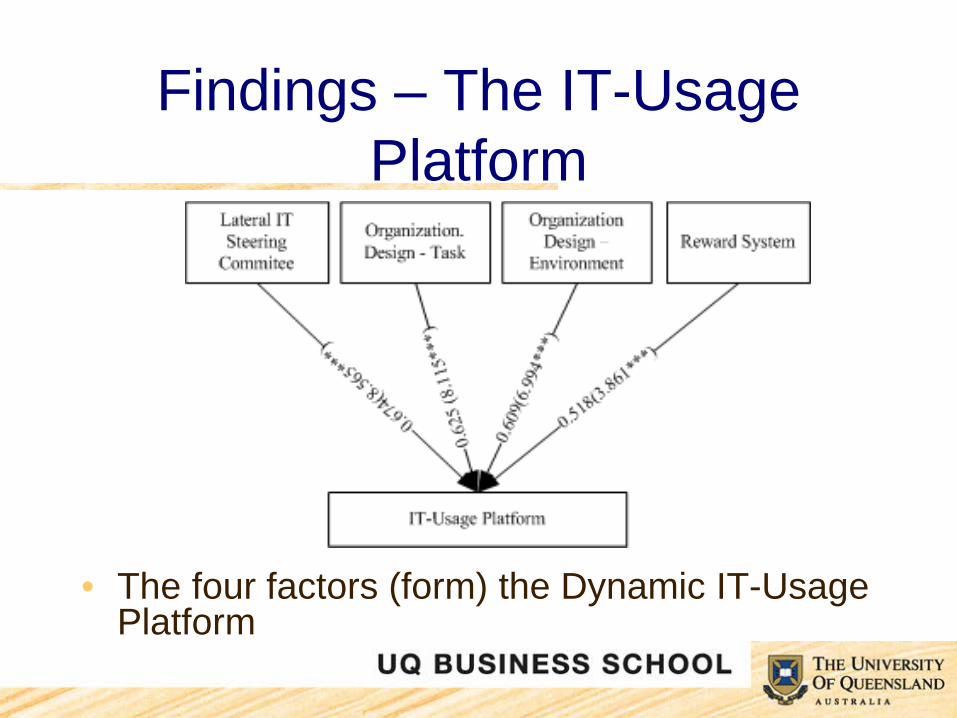
Findings – The IT-Usage Platform
• The four factors (form) the Dynamic IT-Usage Platform
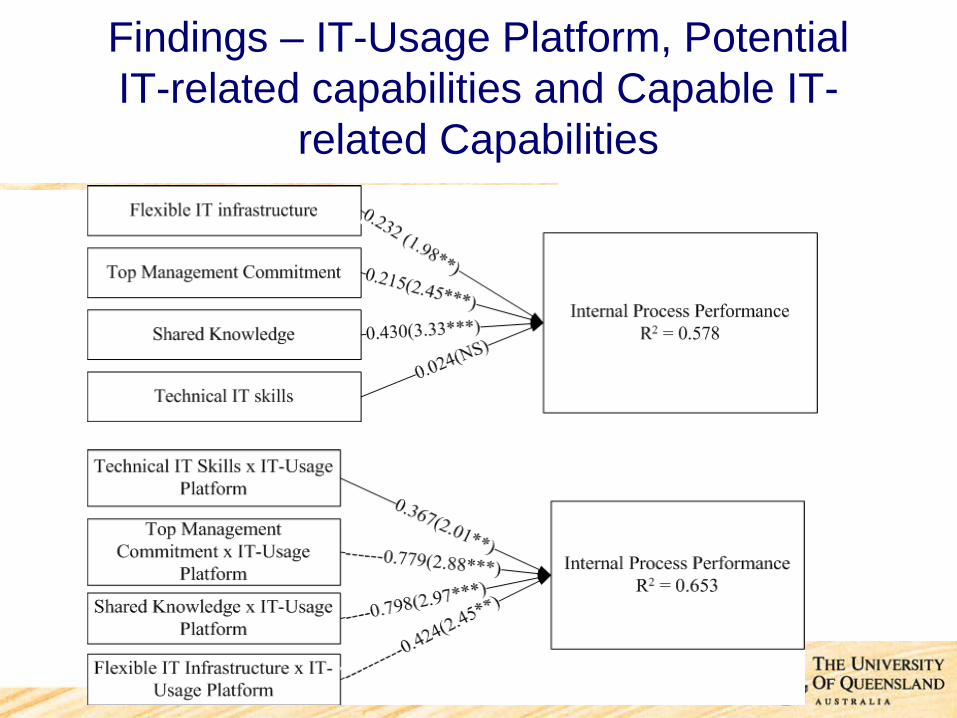
Findings – IT-Usage Platform, Potential IT-related capabilities and Capable IT-
related Capabilities
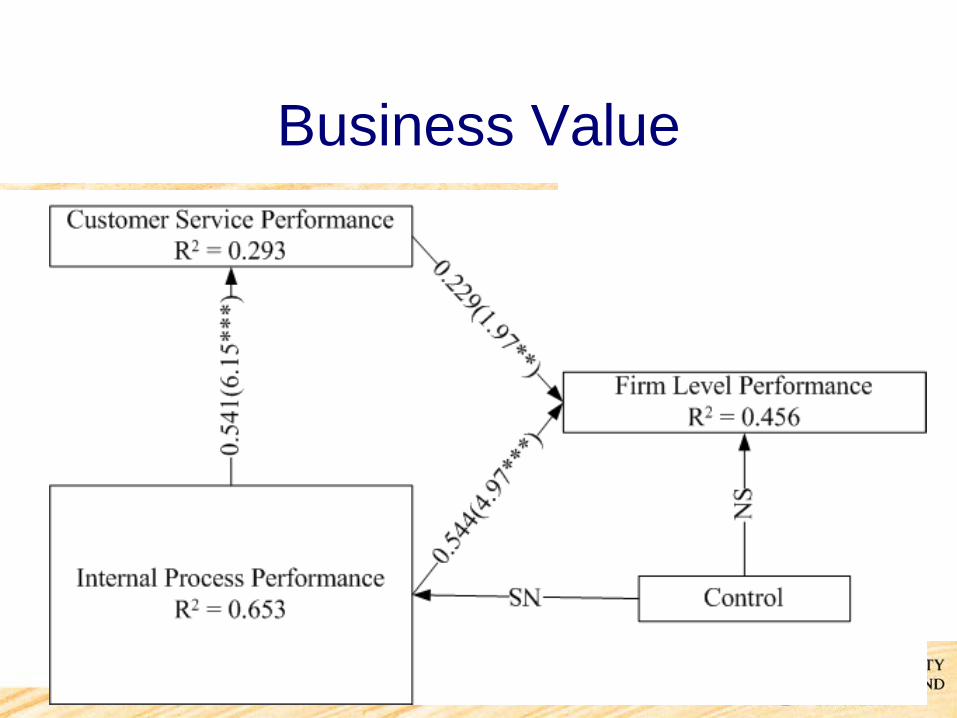
Business Value
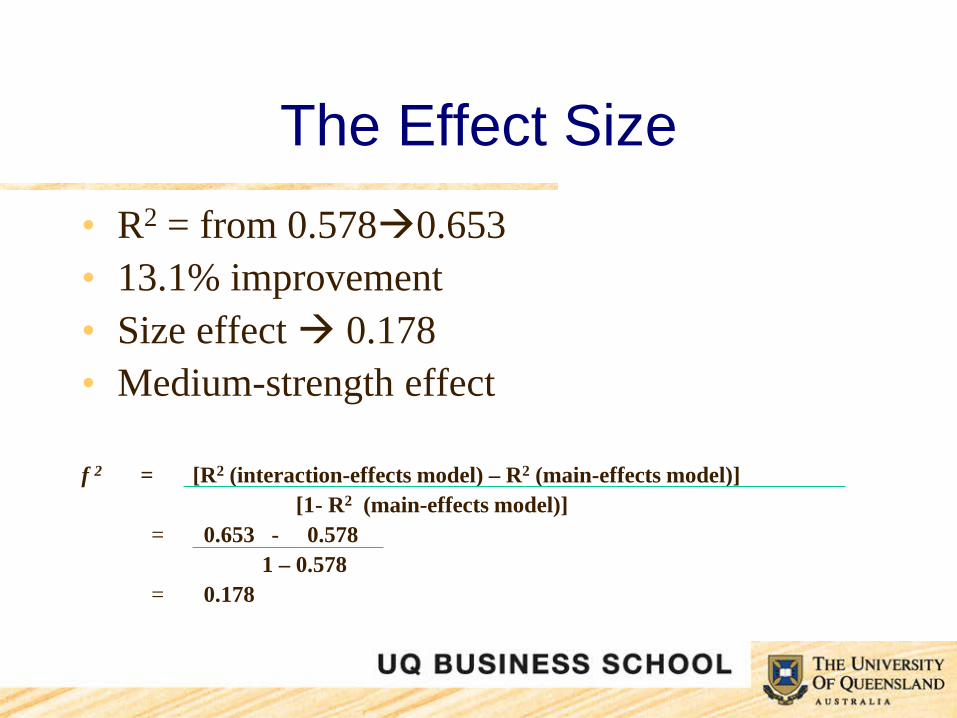
The Effect Size • R2 = from 0.5780.653 • 13.1% improvement • Size effect 0.178 • Medium-strength effect
f 2 = [R2 (interaction-effects model) – R2 (main-effects model)] [1- R2 (main-effects model)] = 0.653 - 0.578 1 – 0.578 = 0.178
Contributions – What’s New
• An approach to creating new resources to leverage the value of IT resources
• Potential IT-related capabilities Capable IT-related capabilities
• IT-related capabilities sustainable IT-related capabilities
• Overall an innovative way to remain competitive with IT
Practical Contributions Insights on the potential resources as benchmarks
against which to evaluate firms governance efforts.
Importance of the IT-related capabilities: Top management commitment, Shared organisational knowledge, and Flexible IT infrastructure.
Development of a valid and reliable measurement instrument for firms to demonstrate the contribution of IT investment to firm performance

Limitations
• Response Rate – 13.16% – But strong validity checks.
• Bias associated with research design
• Tighter control on the environment
Directions for Future Research
• Other Potential IT-related capabilities that can be converted to Capable IT-related capabilities
• Other platforms for sustaining other IT-related capabilities
• Different Structures – Collaborative Organisational Structures (COS) – IT-related capabilities for COS
• Internal-External Co-created Platform – What is value for COS
• SME’s

Conclusion • IT as a resource presents great opportunities to
achieve and sustain competitive advantage • Organisation needs to utilise more fully its IT-
Usage Platform to leverage this resource • Much of this knowledge resides in the
organisation • Organisation needs to understand the
knowledge in the synergy between their resources and IT-related capabilities.
Thank You
Any questions?
Feedback?