resistance to classical and targeted anti-cancer drugs
TRANSCRIPT

Resistance to classical and targeted anti-cancer drugs: insights from a mouse model for hereditary
breast cancer
Sven Rottenberg, Netherlands Cancer Institute, [email protected]
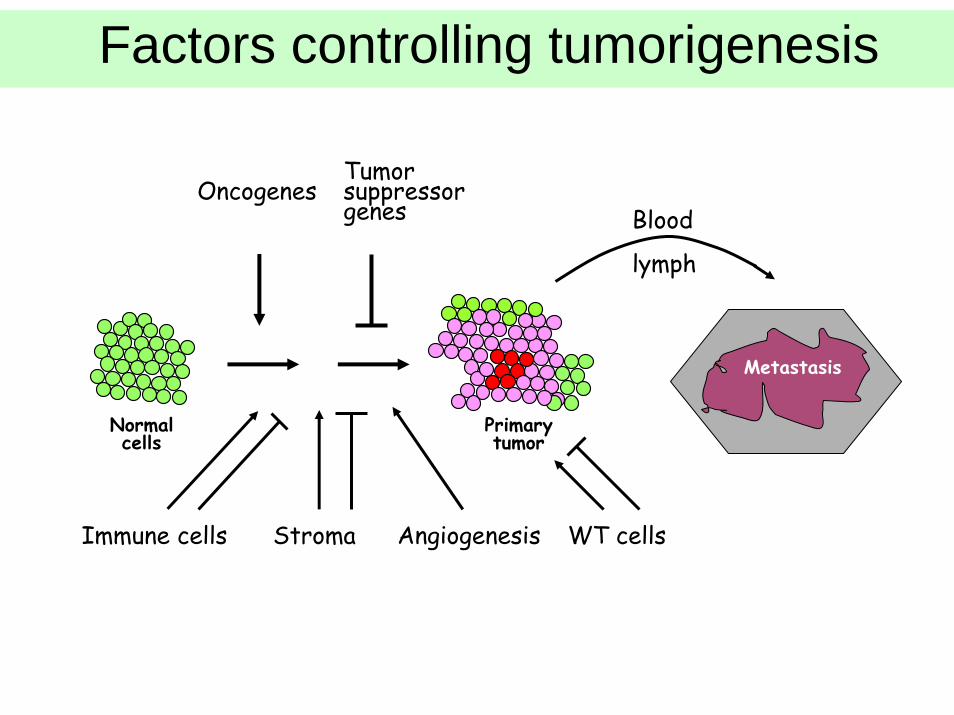
Immune cells Stroma Angiogenesis WT cells
Blood
lymph
OncogenesTumor suppressor genes
Metastasis
Primary tumor
Normal cells
Factors controlling tumorigenesis
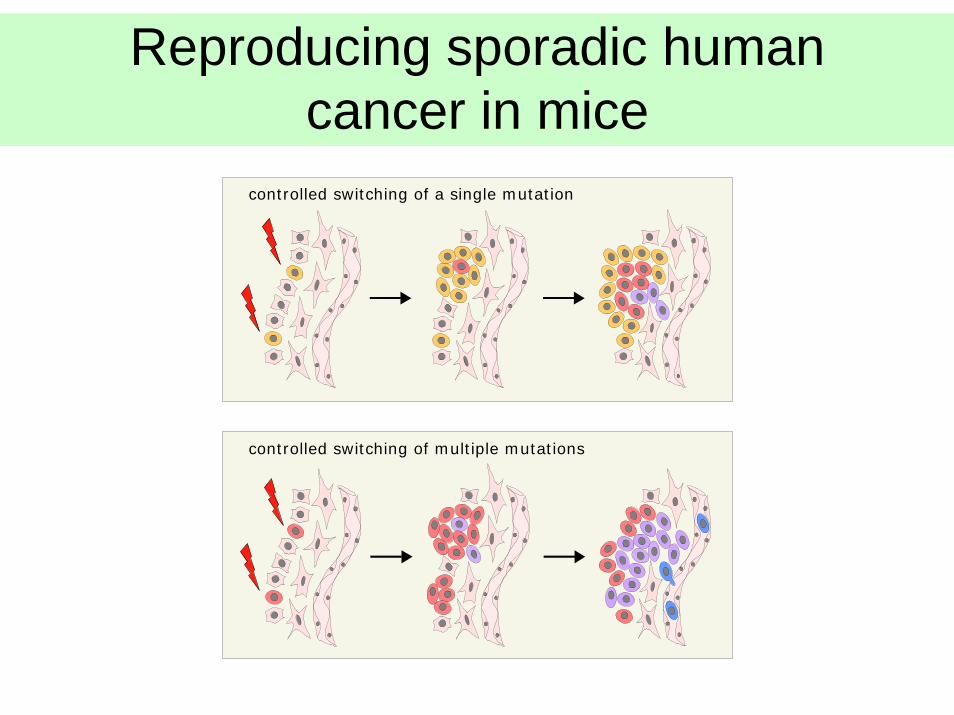
Reproducing sporadic humancancer in mice
controlled switching of multiple mutations
controlled switching of a single mutation

Recombinase-mediated gene switching
TS protein
TS protein1 2 3
1
3
1 3
2
2
+
+ Cre
loxP loxP
4 x pApromoter oncogene pAIVS
+ Cre
loxP loxP
promoter oncogene pAIVS
oncoprotein

Conditional mouse tumor models at theNetherlands Cancer Institute
Cre viruses
Adeno-CreRetro-CreRetro-CreERT2
Lenti-Cre
Cre transgenics
Actin-CreIRBP-CreK14-CreR26-CreERT2
WAP-CreP0-CrePOMC-Cre
ConditionalTSG knockouts
Atr F
Brca1 F
Brca2 F
Ecad F
Ink4a/Arf F
Nf2 F
p53 F
Pten F
Rb F
Conditionaltransgenics
LSL-KrasV12G
+
Conditionalmouse tumormodels
Skin cancer
Breast cancer
Prostate cancer
NSCLC
SCLC
Mesothelioma
Glioblastoma
Medulloblastoma
Pituitary cancer
=

Characteristics KCre, Brca1F/F, p53F/F mouse model
• mean latency of mammary tumor development of 213 days
• stochastic tumor development
• superficial tumors, accessible for measurement and sampling
• carcinoma of undifferentiated (‘basal’) cells with similar features as BRCA1-associated and basal-like breast cancer in humans
• expression of basal markers (Keratin 5, 6, 14, p63)
• genomic instability
(J. Jonkers group)

Tn
orthotopic transplantation of tumor fragments (1mm)
into wt animalstumor size
~200mm3, therapy start (MTD)
doxorubicin
docetaxel
topotecan
T*ncon
T*ndox-res
T*ndoce-res
T*ntopo-res
generation of dox/doce/topo-resistant tumors, repeated
sensitivity to cisplatin
cisplatin
T*ncismean latency
of 4 weeks
Brca1/p53-deficient tumors can be transplanted orthotopically

0
200
400
600
800
1000
1200
0 2 4 6 8 10 12
days
tum
or s
ize
in %
Growth of mammary tumors in K14-Cre, Brca1flox/flox, p53flox/flox mice
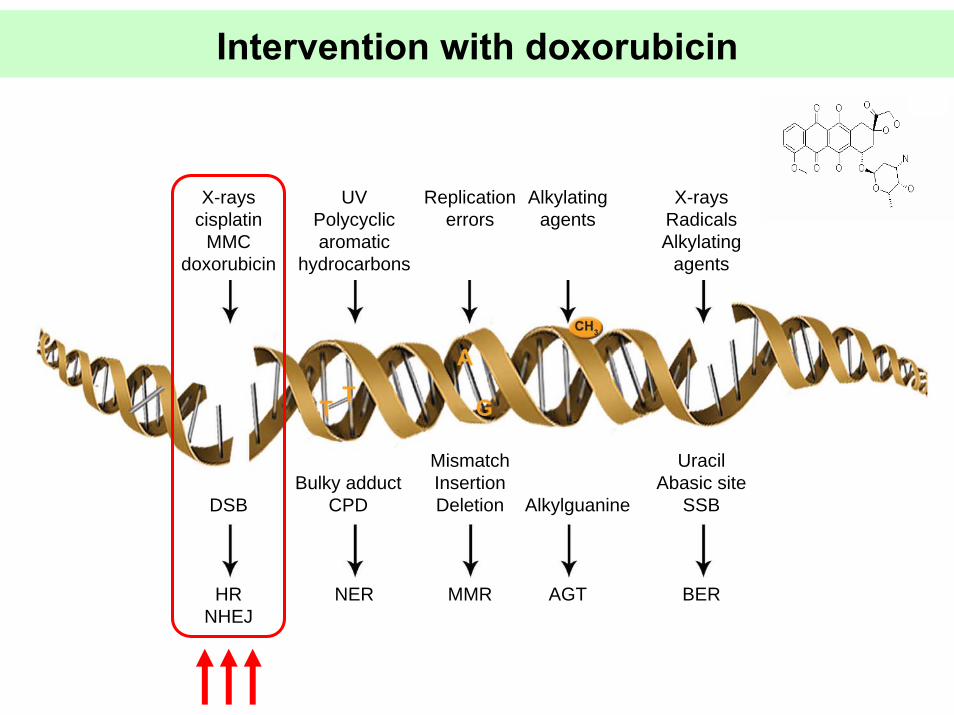
X-rayscisplatin
MMCdoxorubicin
UVPolycyclic aromatic
hydrocarbons
Replication errors
Alkylatingagents
X-raysRadicalsAlkylating
agents
HRNHEJ
NER MMR AGT BER
DSBBulky adduct
CPD
MismatchInsertionDeletion Alkylguanine
UracilAbasic site
SSB
Intervention with doxorubicin
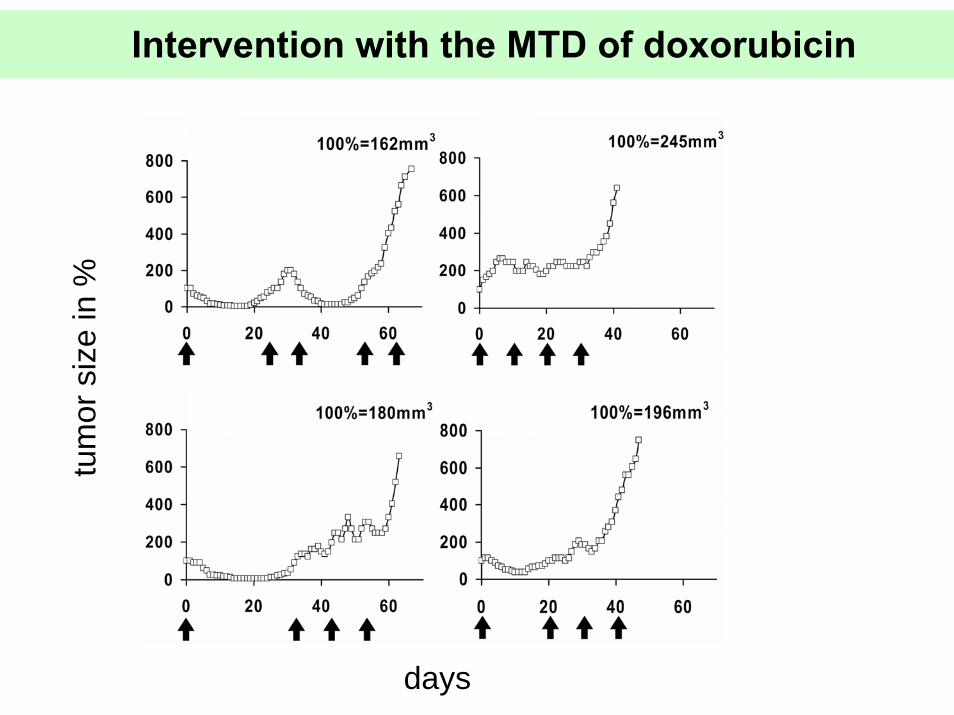
Intervention with the MTD of doxorubicin
days
tum
or s
ize
in %

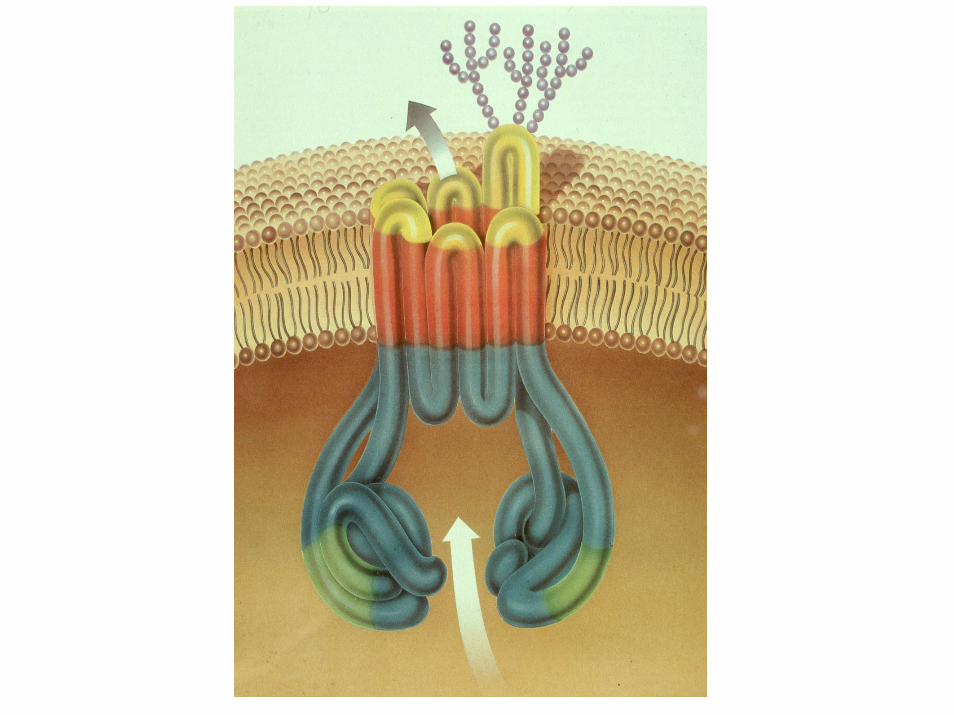
Mechanisms of drug resistance
(mainly based on in vitro studies):
C C*
X ATP ADP
metabolism
DNA damagerepair
C
C C*
drug targets
efflux
influx inhibition of apoptosis/
senescence
XC
compartmentalization
Pgp/MDR1BCRPMRP1

number of upregulated genes: 45Δ = 0.865false discovery rate: 1.95%
Significance analysis of microarrays (SAM) of 13 doxorubicin-resistant tumors in comparison to
untreated tumors
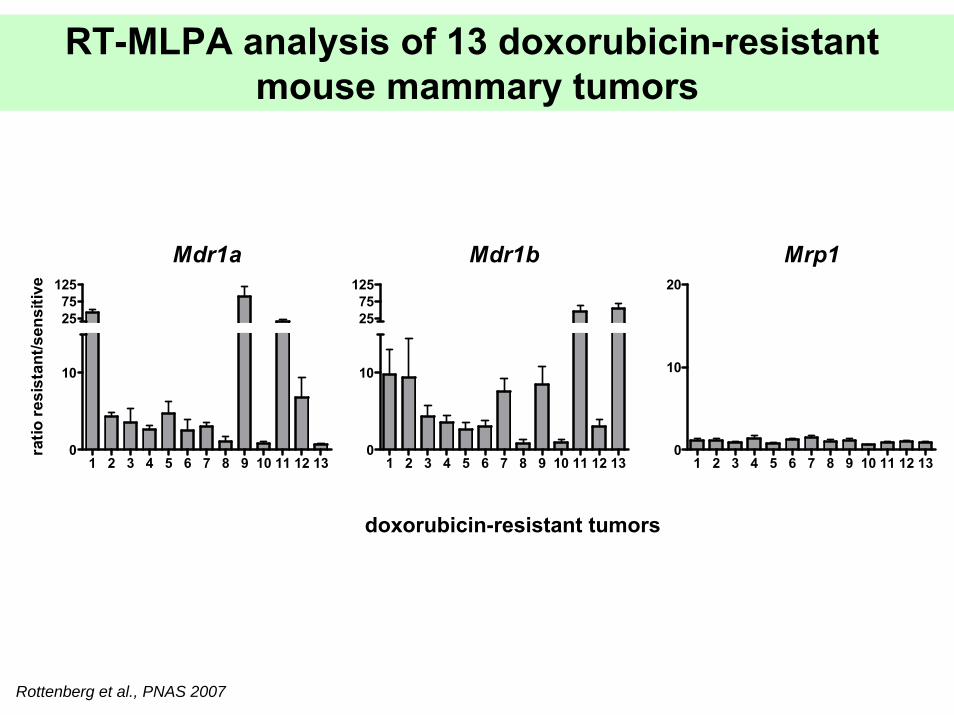
Rottenberg et al., PNAS 2007

doxorubicin-resistant tumors
RT-MLPA analysis of 13 doxorubicin-resistant mouse mammary tumors
Mdr1a
1 2 3 4 5 6 7 8 9 10 11 12 130
10
2575
125
ratio
resi
stan
t/sen
sitiv
e
Mdr1b
1 2 3 4 5 6 7 8 9 10 11 12 130
10
2575
125
Mrp1
1 2 3 4 5 6 7 8 9 10 11 12 130
10
20
Rottenberg et al., PNAS 2007

Mdr1a
duodenum
ileum
caec
umco
lonliv
erad
renal
kidney
splee
n T1
T1 dox r
es T2
T2 dox r
es T3
T3 dox r
es T4
T4 dox r
es T5
T5 dox r
es T6
T6 dox r
es T7
T7 dox r
es T8
T8 dox r
es T9
T9 dox r
esT10
T10 dox r
es 1
T11 dox r
es 2
T12 dox r
es 3
T13 dox r
es 4
0
2
4
610
20
30
40
50
ratio
Mdr
1a /
actin
β
Mdr1b
duodenum
ileum
caec
umco
lonliv
erad
renal
kidney
splee
n T1
T1 dox r
es T2
T2 dox r
es T3
T3 dox r
es T4
T4 dox r
es T5
T5 dox r
es T6
T6 dox r
es T7
T7 dox r
es T8
T8 dox r
es T9
T9 dox r
esT10
T10 dox r
es 1
T10 dox r
es 2
T10 dox r
es 3
T10 dox r
es 4
0
2
4
610
20
30
40
50
ratio
Mdr
1a /
actin
β
A moderate increase in Mdr1a/1b expression associates with in vivo resistance
doxorubicin-resistant tumor
untreated tumor
normal tissue

0100200300400500600700800900
0 10 20 30 40
days
tum
or s
ize
in %
untreated control doxorubicintariquidar doxorubicin+tariquidar
T*23 dox res 2
0100200300400500600700800900
0 10 20 30 40days
tum
or s
ize
in %
untreated control doxorubicintariquidar doxorubicin+tariquidar
T*23 dox res 3
0100200300400500600700800900
0 10 20 30 40
days
tum
or s
ize
in %
untreated control doxorubicintariquidar doxorubicin+tariquidar
T7 dox res
Drug resistance can be reversed by the 3rd
generation P-glycoprotein inhibitor tariquidar
Mdr1a: 17-foldMdr1b: 46-fold
Mdr1a: 7-foldMdr1b: 3-fold
Mdr1a: 3-foldMdr1b: 4-fold

X-rayscisplatin
MMCdoxorubicin
UVPolycyclic aromatic
hydrocarbons
Replication errors
Alkylatingagents
X-raysAlkylating
agents topotecan
HRNHEJ
NER MMR AGT BER
DSBBulky adduct
CPD
MismatchInsertionDeletion Alkylguanine
UracilAbasic site
SSB
Intervention with topotecan

days
tum
or s
ize
in %
0100200300400500600700800900
0 50 100 1500
100200300400500600700800900
0 50 100 1500
100200300400500600700800900
0 50 100 150
= untreated matched control tumors
= topotecan MTD treated tumors
= 1 treatment course of 4mg/kg topotecan IP on 5 consecutive days
Growth responses of Brca1-/-;p53-/- tumors to the MTD of topotecan

= ratio of absolute M-values resistant/sensitive (p53 reference pool)
= RT-MLPA values: ratio resistant/sensitive (internal reference Actinβ)
Comparison of MEEBO versus RT-MLPA data
ratio
resi
stan
t/sen
sitiv
e0
1
2
3
4
5
6
7
8
9
T1 T2 T3 T4 T5 T6 T7 T8 T9 T10 T11 T12 T13 T14 T15 T16 T17
tumors
SAM analysis for 17 Brca1-/-;p53-/- tumors: topotecan-resistant versus matched untreated controls
δ-value = 0.72
sign. genes = 237
false sign. genes = 20.6
Bcrp1
Increased transcript levels of the ABC drug efflux transporter Bcrp1 in topotecan-resistant tumors
Confirmation of increased Bcrp1 levels by q RT-PCR

ABCG2/BCRP1 content in topotecan-resistant tumors
topotecan-resistant
α-BCRP1 (BXP-53)
control
tumor 1 tumor 2 tumor 3

Ablation of Bcrp1 in the mouse tumor model
xKCre;Brca1F/F;p53F/F
Bcrp1-/-
KCre;Brca1F/F;p53F/F;Bcrp1-/-
orthotopictransplantation of tumor
fragment into wt animals
MTD of topotecan
KCre;Brca1F/F;p53F/Forthotopic
transplantation of tumor fragment into wt
animals
MTD of topotecan
difference ?
Bcrp1 proficient
Bcrp1 deficient

0
20
40
60
80
100
120
0 50 100 150 200 250
days
surv
ival
%Bcrp1-/-,Brca1-/-,p53-/- Brca1-/-,p53-/-untreated untreated
n=9 n=9n=11
n=11
p<0.003
Increased survival in response to topotecan in animals bearing Bcrp1-/- tumors

X-raysCisplatin
MMC
UVPolycyclic aromatic
hydrocarbons
Replication errors
Alkylatingagents
HRNHEJ
NER MMR AGT BER
DSBBulky adduct
CPD
MismatchInsertionDeletion Alkylguanine
UracilAbasic site
SSB
(PARP inhibition)(cisplatin, carboplatin)
X-raysAlkylating
agents topotecan
HR-deficient cell targeting by inhibition of poly(ADP-ribose) polymerase1 (PARP1)

Intervention with the PARP1 inhibitor AZD2281 (KuDOS) in Brca1/p53-deficient tumors
AZD2281 28d
0
2
4
6
8
10
0 20 40 60 80 100days
RTV
T1 T2 T3 T4 T5 T6 T7
AZD2281 100d
0
2
4
6
8
10
0 100 200 300 400days
RTV
T1 T2 T3 T4 T5 T6 T7
untreated control
0
2
4
6
8
10
0 5 10days
RTV
T1 T2 T3 T4 T5T6 T7 T8 T9
0
20
40
60
80
100
120
0 0.5 2 6 24hours
051015202530354045
average % Parp1 activityaverage conc AZD2281 (nM)
Rottenberg et al., PNAS 2008

0
20
40
60
80
100
120
0 50 100 150 200 250 300 350 400
days
over
all s
urvi
val %
untreated control AZD2281 100d
Intervention with AZD2281+cisplatincisplatin 6mg/kg i.v., AZD2281 50mg/kg i.p.
n=9 n=7

Intervention with AZD2281+cisplatincisplatin 6mg/kg i.v., AZD2281 50mg/kg i.p.
n=9
n=7
n=9
n=7
0
20
40
60
80
100
120
0 50 100 150 200 250 300 350 400
days
over
all s
urvi
val %
untreated control AZD2281 100d cisplatin
n=9 n=9 n=7

Intervention with AZD2281+cisplatincisplatin 6mg/kg i.v., AZD2281 50mg/kg i.p.
n=9
n=7
n=90
20
40
60
80
100
120
0 50 100 150 200 250 300 350 400days
over
all s
urvi
val %
untreated control AZD2281 100d
cisplatin cisplatin+AZD2281 100d
n=9 n=7n=9
n=7

Response of Brca/p53-deficient tumors to docetaxel
Can we predict the outcome beforehand?

Why are predictive signatures elusive, whereasprognostic signatures flourish?
Chemotherapy response can be prevented by small changesin only one of many proteins:- the drug target (HER2, Herceptin; cABL, Gleevec; Topo II,
doxorubicin)- drug disposition
- failing drug activation- increased drug inactivation- decreased cellular drug accumulation
- reduced damage response (reactivation BRCA1/2).
These alterations may not be easily picked up by geneexpression profiling (sensitivity; posttranscriptionalmodifications) or proteomics (sensitivity), given the highdegree of genetic variation in the patients and their tumors.

Why use the mouse tumors to generatepredictive tests?
1. No patient genetic heterogeneity (inbred mice);little tumor heterogeneity (they all start with the same geneticallyengineered mutations).
2. All forms of secondary resistance can be deduced bycomparing tumor samples before and after resistance arises. Provides inventory of possible mechanisms andtools to detect them (directly or indirectly).
3. Differences in the initial response to drug can be correlatedwith differences in gene expression levels, protein levels,DNA alterations (deep sequencing).
4. Insertional mutagenesis may be used to tag genes that conferacquired drug resistance

The mouse as surrogate patient
Treatment
Follow up
Diagnostics
RadiologyMolecular imaging
PathologyMolecular diagnostics
RadiotherapyChemotherapy
Targeted therapyCombination therapy
Response monitoringDetection of residual disease
Detection of tumor recurrenciesDetection of therapy resistance
Acknowledgements
Piet BorstMarina Pajic
Ariena KersbergenJanneke Jaspers
Serge Zander
Jos JonkersXiaoling Liu
Eline van der Burg Jan SchellensSjoerd Rodenhuis
Jonkers groupMedical oncology
Borst group
Animal facility
Anders O. NygrenJan Schouten
MRC-Holland
many
KuDOS/AstraZenecaNiall Martin
Mark O’ConnorAaron Cranston
Alan Lau
Diagnostic oncologyOlaf van Tellingen
Susan BatesTito Fojo
NIH
Microarray facilityRon KerkhovenMike Heimerikx
Arno Velds