resistance: some of our work - sciencenet.cnblog.sciencenet.cn/upload/blog/file/2010/9/...a 0...
TRANSCRIPT

Evaluation of Pavement SkidEvaluation of Pavement SkidResistance: Some of Our Work
Yinghao Miao, Ph. D.Assistant Professor
Transportation Research CenterBeijing University of TechnologyBeijing University of Technology
Beijing, China
Sep. 6‐8, 2010, Nanjing China

OutlineOutline
• Introductiont oduct o• Relationship of Skid Resistance to Slip Speed
– Review of the Penn State Model – Development of a New Model Using DFT Measurements
• Reference Braking Distance (RBD)• Characterization of Pavement Macrotexture• Relationship of Macrotexture to Skid Resistance• Summary
2Sep. 6‐8, 2010, Nanjing China

IntroductionIntroduction
• Pavement skid resistance is an importantPavement skid resistance is an important factor impacting traffic safety.
• However proper evaluation of pavement skid• However, proper evaluation of pavement skid resistance is a hard work.
S d d d t– Speed dependent
– Incompatible of different test methods
h h– The other reasons
3Sep. 6‐8, 2010, Nanjing China
IntroductionIntroduction
• Famous models for relating pavement skidFamous models for relating pavement skid resistance to slip speed– Penn State Model– Penn State Model
– Rado Model
F k t h i diff t t t• Famous work to harmonize different test methods
ld d ( )– World Road Association (PIARC) Experiment
– International Friction Index (IFI)
4Sep. 6‐8, 2010, Nanjing China

IntroductionIntroduction
• IFI measured using various devices still existIFI measured using various devices still exist significant difference. (Flintsch et al, 2009), (Trifirò et al 2008)(Trifirò et al,2008).
• Macrotexture is also an important item in skid resistance evaluation MTD MPD etcskid resistance evaluation. MTD, MPD etc. are usually used to charaterize it, but the relationship of macrotexture to skidrelationship of macrotexture to skid resistance is not clear.
5Sep. 6‐8, 2010, Nanjing China

IntroductionIntroduction
• Some of our workSome of our work– Developing and validating a new model using DFT measurementsDFT measurements
– Discussing a potential evaluation method of pavement skid resistancepavement skid resistance
– Charaterizing pavement surface macrotexture
– Analyzing the relationship of macrotexture toAnalyzing the relationship of macrotexture to skid resistance
6Sep. 6‐8, 2010, Nanjing China

Review of the Penn State ModelReview of the Penn State Model
• The Penn State Model (Henry 1978)The Penn State Model (Henry, 1978)
p
SSF F e
−
– Where:
F i th f i ti ffi i t t li d S
0p
SF F e=
FS is the friction coefficient at slip speed S;
F0 is FS at 0 km/h;
S i li d (k /h)S is slip speed (km/h);
Sp is speed constant.
7Sep. 6‐8, 2010, Nanjing China

Review of the Penn State ModelReview of the Penn State Model
• PIARC modified the form of the Penn StatePIARC modified the form of the Penn State Model for IFI development (Wambold et al, 1995) 10 S1995). 10
10p
SS
SF F e−
=
Where– Where:
F10 is FS at 10 km/h.
8Sep. 6‐8, 2010, Nanjing China
Review of the Penn State ModelReview of the Penn State Model
• IFI developmentIFI development– Values of F10 and Sp for each device were calculated based on the PIARC modified Penncalculated based on the PIARC modified Penn State Model for all pavement sections of PIARC experiment.
– The Golden Curve and the corresponding IFI (F60, Sp) were obtained using the PIARC modified Penn pState Model through averaging F10 and Sp derived from various devices.
9Sep. 6‐8, 2010, Nanjing China

Review of the Penn State ModelReview of the Penn State Model
• In practice all devices are calibrated usingIn practice, all devices are calibrated using the following equation for IFI calculation.
60S−
– Where:
A B are calibration constants for the selected
60pS
RSF A BF e= +A, B are calibration constants for the selected friction measuring device;
FRS is the friction coefficient measured at slipFRS is the friction coefficient measured at slip speed S using the selected friction measuring device.
10Sep. 6‐8, 2010, Nanjing China

Review of the Penn State ModelReview of the Penn State Model
• DFT is usually used as reference device forDFT is usually used as reference device for calibration of friction testers (ASTM E 1960).
• It is necessary to review the validity of the• It is necessary to review the validity of the Penn State Model for DFT measurements.
11Sep. 6‐8, 2010, Nanjing China

Review of the Penn State ModelReview of the Penn State Model
• Field TestsField TestsHighway number Grade Surface type Number of Test sites
G101 1 SMA/MS 4/7S203 2 AC 2S203 2 AC 2S205 2 AC 3S311 3 AC/SS 2/3S312 3 AC 1X202 2 AC 2X001 3 AC 2X002 3 AC 1X010 3 AC 2X013 3 AC 2
12Sep. 6‐8, 2010, Nanjing China
X020 4 AC 2

Review of the Penn State ModelReview of the Penn State Model
• Typical curves of slip speed‐frictionTypical curves of slip speed friction coefficient measured by DFT
13Sep. 6‐8, 2010, Nanjing China

Review of the Penn State ModelReview of the Penn State Model
• Fitted curves using the Penn State ModelFitted curves using the Penn State Model
14Sep. 6‐8, 2010, Nanjing China

Review of the Penn State ModelReview of the Penn State Model
• Fitted curves using the Penn State ModelFitted curves using the Penn State Model (Continued)
15Sep. 6‐8, 2010, Nanjing China

Developing a New Model Using DFT Measurements
• This work develops a new model to describeThis work develops a new model to describe the relationship of friction coefficient to slip speed using DFT measurementsspeed using DFT measurements.
SbF ae c
−= +
– Where:
a b and c are regression coefficients
SF ae c= +
a, b, and c are regression coefficients.
16Sep. 6‐8, 2010, Nanjing China
Developing a New Model Using DFT Measurements
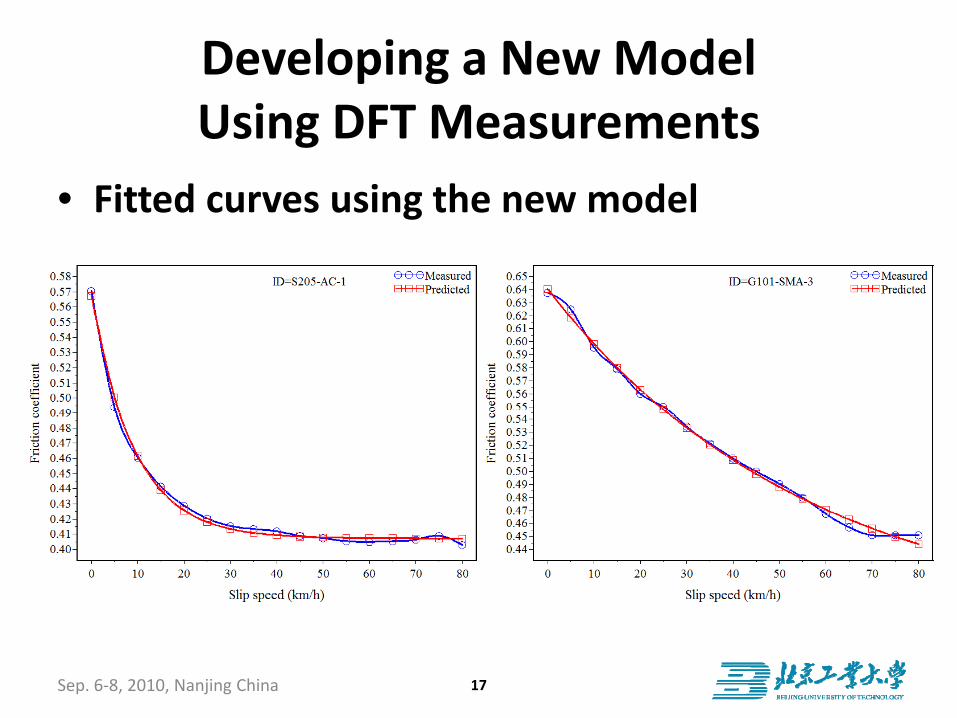
• Fitted curves using the new modelFitted curves using the new model
17Sep. 6‐8, 2010, Nanjing China

Developing a New Model Using DFT Measurements
• Fitted curves using the new modelFitted curves using the new model (Continued)
18Sep. 6‐8, 2010, Nanjing China
Developing a New Model Using DFT Measurements
• All the 33 regression analyses are significantAll the 33 regression analyses are significant with values of R‐square above 0.95.
• The maximum of R square is 0 9986 and the• The maximum of R‐square is 0.9986 and the minimum is 0.9525.
I b l d d h h d l h• It can be concluded that the new model has good adaptability in fitting various types of li d f i i ffi i l i hi fslip speed‐friction coefficient relationship of asphalt pavement measured by DFT.
19Sep. 6‐8, 2010, Nanjing China

Validating the New ModelValidating the New Model
• Data used in validation are collected fromData used in validation are collected from Tangshan, Qinhuangdao and Cangzhou, HebeiProvince ChinaProvince, China.
• 63 measurements of Asphalt Concrete (AC) pavement and PCC pavement with variouspavement and PCC pavement with various highway grades and surface texture are selected respectivelyselected respectively.
20Sep. 6‐8, 2010, Nanjing China
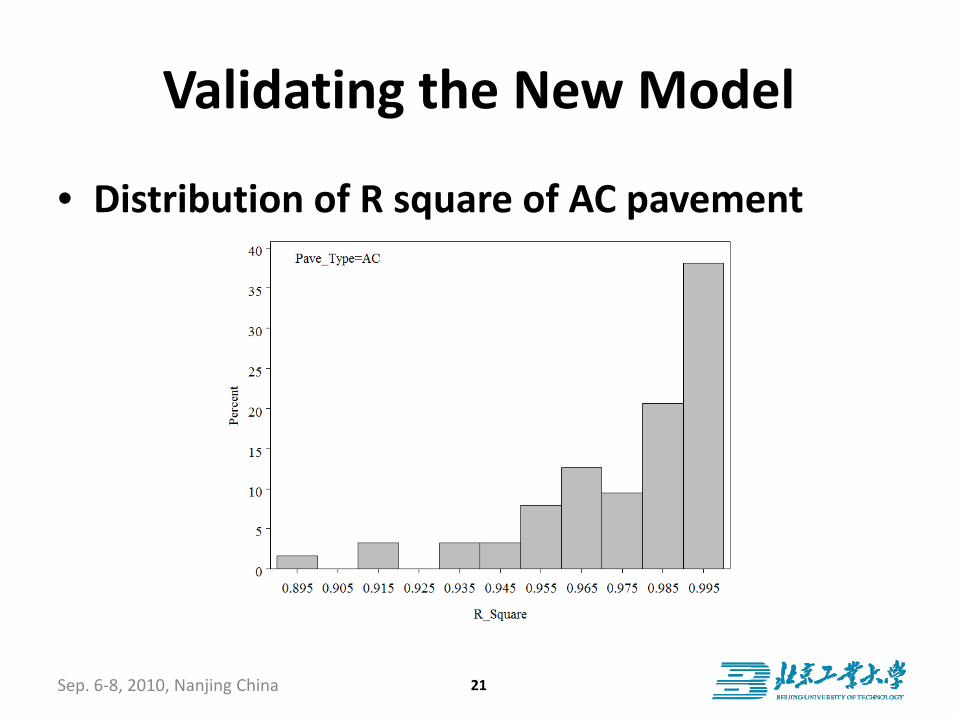
Validating the New ModelValidating the New Model
• Distribution of R square of AC pavementDistribution of R square of AC pavement
21Sep. 6‐8, 2010, Nanjing China

Validating the New ModelValidating the New Model
• Most values of R‐square are above 0 9 (onlyMost values of R square are above 0.9 (only one is 0.8962) and the mean of R‐square is 0 97580.9758.
• All regression analyses are significant.
22Sep. 6‐8, 2010, Nanjing China
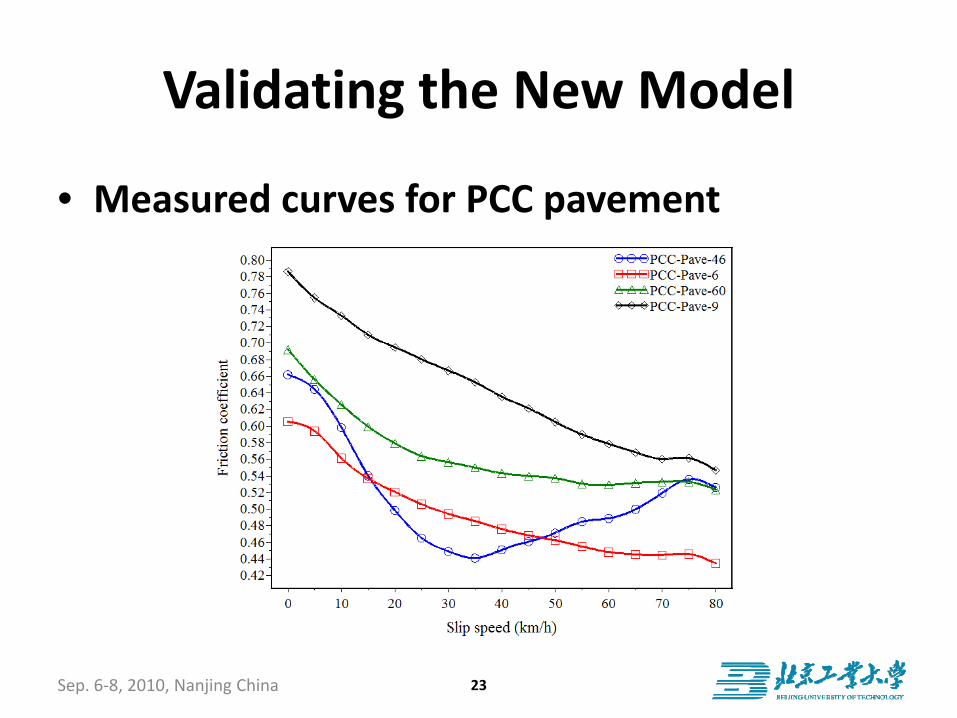
Validating the New ModelValidating the New Model
• Measured curves for PCC pavementMeasured curves for PCC pavement
23Sep. 6‐8, 2010, Nanjing China

Validating the New ModelValidating the New Model
• Distribution of R square of PCC pavementDistribution of R square of PCC pavement
24Sep. 6‐8, 2010, Nanjing China

Validating the New ModelValidating the New Model
• About 90% values of R‐square are above 0 9About 90% values of R square are above 0.9 and the mean of R‐square is 0.956
• There are 6 measurements with R squares• There are 6 measurements with R‐squares below 0.87 and the minimum one is 0.7048.
All h 6 PCC P 46• All these 6 measurements are PCC‐Pave‐46 and others whose friction coefficient is not
i d i i h li dmonotonic decreasing with slip speed.
25Sep. 6‐8, 2010, Nanjing China

Reference Braking DistanceReference Braking Distance
• Difficulties of pavement skid resistanceDifficulties of pavement skid resistance evaluation – Speed dependent– Speed dependent
– Hard to meet the requirement of traffic safety
A i di t d i d f DFT t• An indicator derived from DFT measurement are constructed.
f k ( )– Reference Braking Distance (RBD)
26Sep. 6‐8, 2010, Nanjing China

Reference Braking DistanceReference Braking Distance
• Reference Braking DistanceReference Braking Distance
niSD SΔ∑
– Where:( )1
iB i
i i
D SgF S=
= Δ∑
DB is Reference Braking Distance;
S is speed;
F(S) is friction coefficient corresponding to S;
g is gravity acceleration.
27Sep. 6‐8, 2010, Nanjing China

Characterization of Pavement Macrotexture
• Laser profile tester with 1 0671mm sampleLaser profile tester with 1.0671mm sample interval are used in field tests. Test sections
• Describing characters• Describing characters– Statistical indicators
F l i di– Fractal indicators
– Geometric indicators
– MPD
28Sep. 6‐8, 2010, Nanjing China

Characterization of Pavement Macrotexture
• Statistical indicatorsStatistical indicators
1 N
im zN
= ∑ ( )21 N
z mσ = ∑1i
iN =∑ ( )
1i
i
z mN
σ=
= −∑
1 N
1
1 N
a ii
R z mN =
= −∑ ( )331
1 N
k ii
S z mNσ =
= −∑
( )44
1
1 N
ii
K z mNσ
= −∑
29Sep. 6‐8, 2010, Nanjing China
1iNσ =
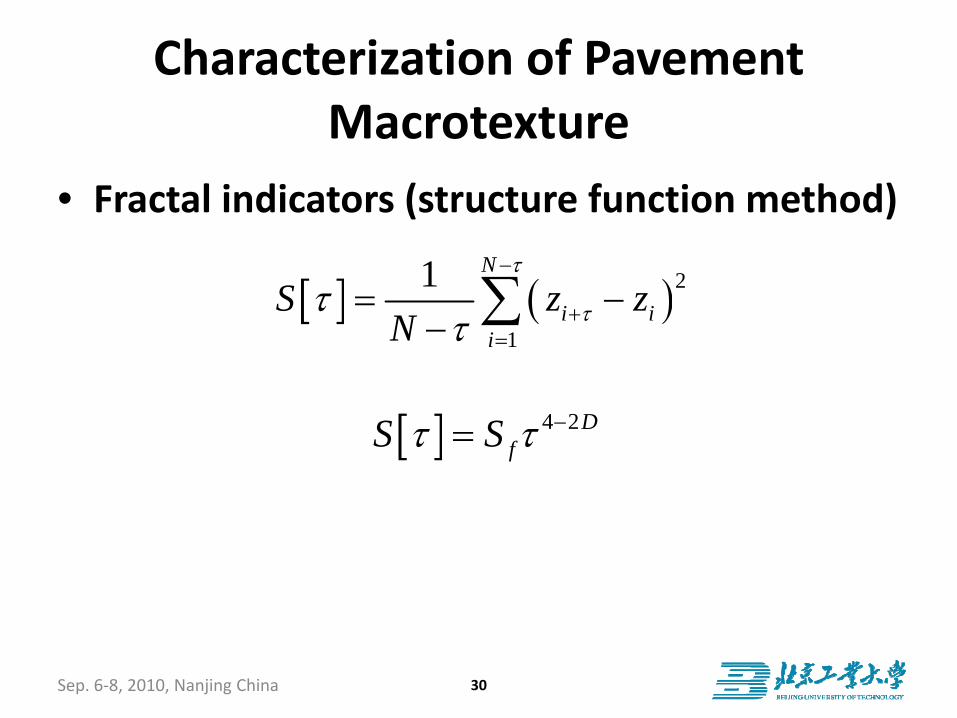
Characterization of Pavement Macrotexture
• Fractal indicators (structure function method)Fractal indicators (structure function method)
[ ] ( )21 N
i iS z zτ
τ−
= −∑[ ] ( )1
i ii
S z zN ττ
τ +=− ∑
[ ] 4 2DfS Sτ τ −=
30Sep. 6‐8, 2010, Nanjing China
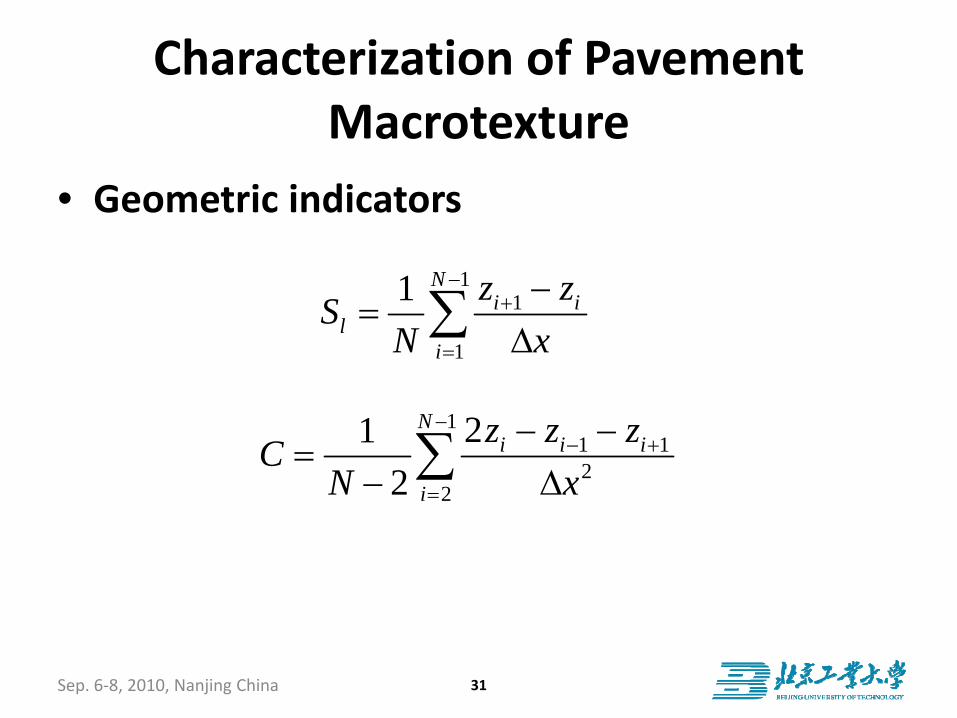
Characterization of Pavement Macrotexture
• Geometric indicatorsGeometric indicators
111 N
i iz zS−
+ −∑ 1
1
i il
iS
N x+
=
=Δ∑
11 12
2
212
Ni i i
i
z z zCN x
−− +
=
− −=
− Δ∑
31Sep. 6‐8, 2010, Nanjing China

Relationship of Macrotexturek dto Skid Resistance
F60 MPD Ra σ Sk K D Sf Sl C
F60 1.000 0.240 0.142 0.166 0.473 0.218 -0.551 0.047 0.214 -0.004
MPD 0.240 1.000 0.978 0.985 0.604 0.068 -0.726 0.903 -0.215 -0.027
R 0 142 0 978 1 000 0 997 0 452 0 032 0 652 0 947 0 226 0 005Ra 0.142 0.978 1.000 0.997 0.452 -0.032 -0.652 0.947 -0.226 -0.005
σ 0.166 0.985 0.997 1.000 0.491 0.039 -0.689 0.933 -0.232 -0.036
Sk 0.473 0.604 0.452 0.491 1.000 0.452 -0.644 0.336 -0.099 -0.178Sk 0.473 0.604 0.452 0.491 1.000 0.452 0.644 0.336 0.099 0.178
K 0.218 0.068 -0.032 0.039 0.452 1.000 -0.397 -0.133 -0.110 -0.291
D -0.551 -0.726 -0.652 -0.689 -0.644 -0.397 1.000 -0.441 0.215 0.297
Sf 0.047 0.903 0.947 0.933 0.336 -0.133 -0.441 1.000 -0.074 0.210
Sl 0.214 -0.215 -0.226 -0.232 -0.099 -0.110 0.215 -0.074 1.000 0.456
C -0.004 -0.027 -0.005 -0.036 -0.178 -0.291 0.297 0.210 0.456 1.000
32Sep. 6‐8, 2010, Nanjing China
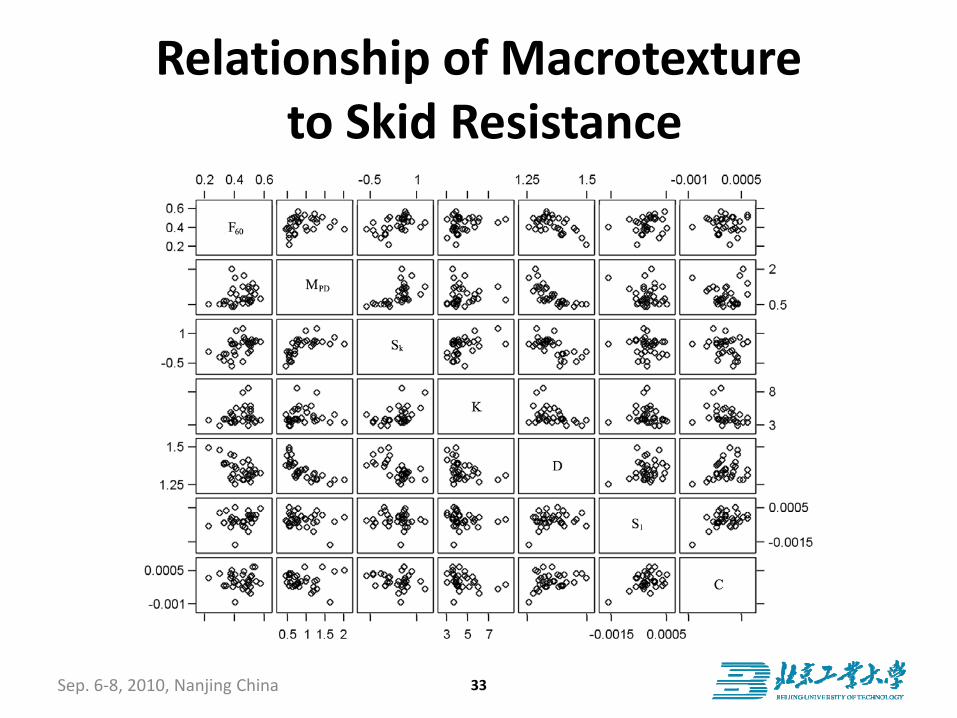
Relationship of Macrotexturek dto Skid Resistance
33Sep. 6‐8, 2010, Nanjing China
Relationship of Macrotexturek dto Skid Resistance
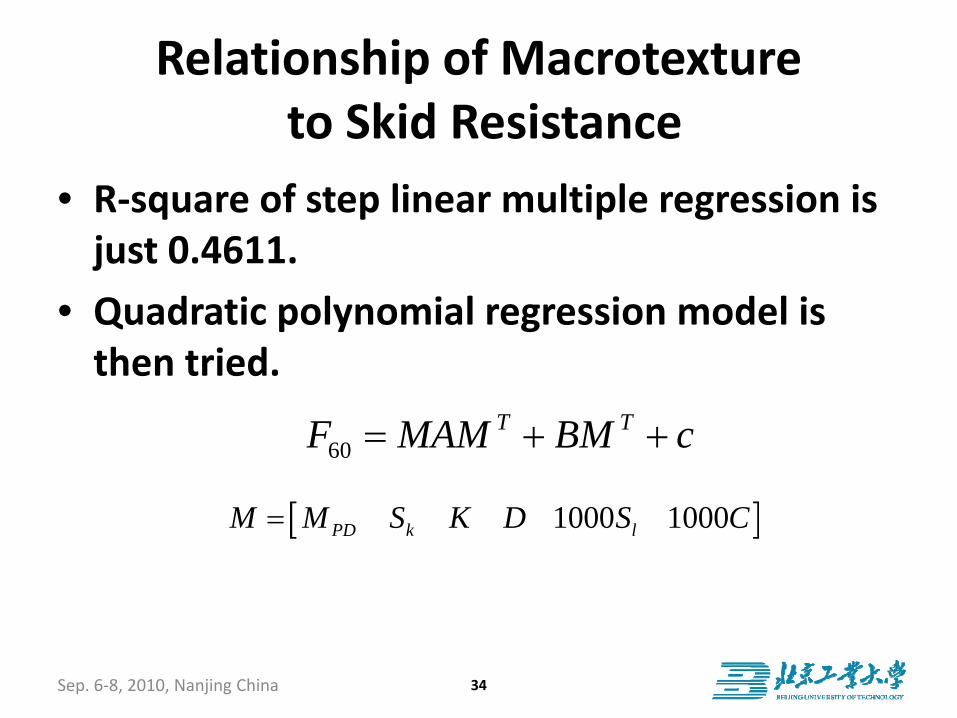
• R‐square of step linear multiple regression isR square of step linear multiple regression is just 0.4611.
• Quadratic polynomial regression model is• Quadratic polynomial regression model is then tried.
60T TF MAM BM c= + +
[ ]1000 1000M M S K D S C[ ]1000 1000PD k lM M S K D S C=
34Sep. 6‐8, 2010, Nanjing China
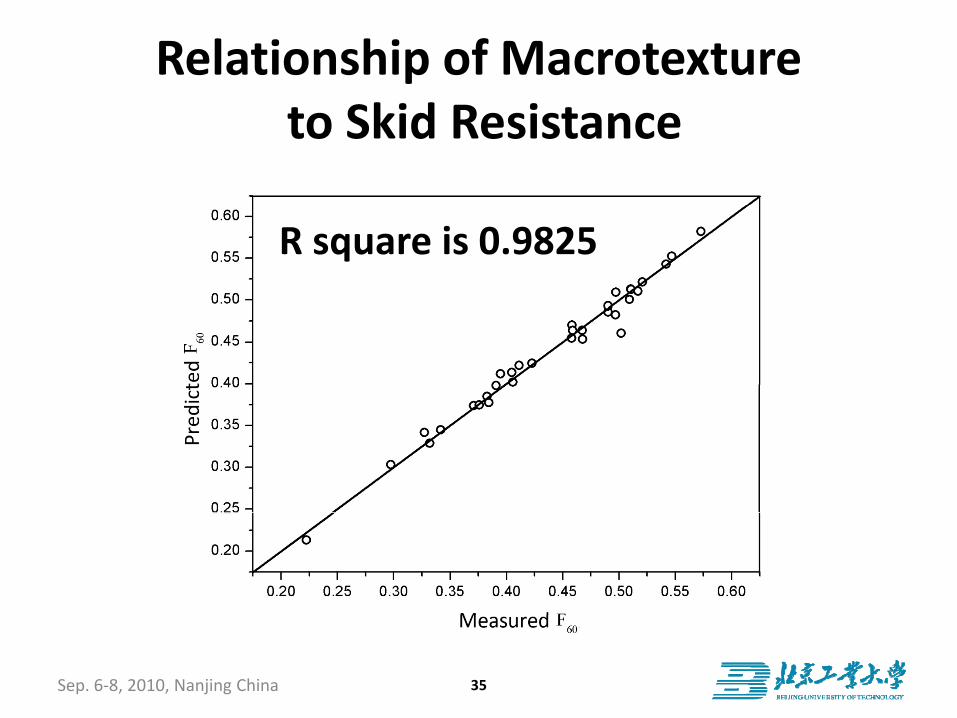
Relationship of Macrotexturek dto Skid Resistance
R square is 0.9825
35Sep. 6‐8, 2010, Nanjing China

Relationship of Macrotexturek dto Skid Resistance
Deleted indicator MPD Sk K D 1000Sl 1000C
R2 0.8570 0.6805 0.7998 0.6775 0.8089 0.8255
SSR 0.029965
0.066946
0.041945
0.067590
0.040042
0.036577
36Sep. 6‐8, 2010, Nanjing China

SummarySummary
• The Penn State Model is not suitable for DFTThe Penn State Model is not suitable for DFT measurements.
• The model developed in this work has good• The model developed in this work has good reliability for describing slip speed‐friction coefficient relationship of AC pavementcoefficient relationship of AC pavement measured by DFT.
37Sep. 6‐8, 2010, Nanjing China

SummarySummary
• The model developed in this work is alsoThe model developed in this work is also validity for most PCC pavement except for the measurements whose friction coefficientthe measurements whose friction coefficient is not monotonic decreasing with slip speed.
38Sep. 6‐8, 2010, Nanjing China

SummarySummary
• There are many works should be conductedThere are many works should be conducted before this model is applied in practice:– Evaluating its suitable for other friction test– Evaluating its suitable for other friction test methods;
– Analyzing the means of its parameters;Analyzing the means of its parameters;
– Determining if some parameters can still be calculated from pavement texture parameter.calculated from pavement texture parameter.
39Sep. 6‐8, 2010, Nanjing China

SummarySummary
• Reference Braking Distance is a potentialReference Braking Distance is a potential indicator for pavement skid resistance evaluation There are also some works shouldevaluation. There are also some works should be conducted before it is applied in practice.
• MPD or MTD is not enough to decribe• MPD or MTD is not enough to decribepavement macrotexture for skid resistance evaluationevaluation.
40Sep. 6‐8, 2010, Nanjing China

SummarySummary
• Quadratic polynomial model can characterizeQuadratic polynomial model can characterize the relationship between macrotexture and skid resistance But it is too complex toskid resistance But it is too complex to understand
• There are also many works should be done• There are also many works should be done for describing the relationship between pavement texture and skid resistancepavement texture and skid resistance.
41Sep. 6‐8, 2010, Nanjing China

Thanks for Your Attention!