resistance of thin-walled plate girders under combined bending
TRANSCRIPT

Resistance of Thin-walled Plate Girders under Combined Bending and Shear
ZDENEK KALA and JIRI KALA Department of Structural Mechanics
Brno University of Technology, Faculty of Civil Engineering Veveří Str. 95, Brno CZECH REPUBLIC
[email protected]; [email protected] http://www.vutbr.cz
Abstract: The objective of the paper is to analyze the influence of initial imperfections on the behavior of thin-walled girders welded of slender plate elements. A number of full-scale plate girders are modeled and analyzed to determine their bending and shear failure mechanism characteristics. The design of a thin-walled system is always rather complicated as also the influence of initial imperfections is to be taken into account to a greater extent. The theoretical analysis was based on a nonlinear variant of the finite element method. All input imperfections were considered to be random quantities. The statistical distributions were introduced according to both experimentally obtained results and data given in literature. Random realizations of input random quantities were simulated by the LHS (Latin Hypercube Sampling) method. By means of sensitivity analysis, it was studied to what extend the variability of initial imperfections was reflected in the variability of stresses in the crack-prone areas of the girder. Key-Words: resistance, steel, imperfections, shell elements, girder, stability, sensitivity analysis, reliability. 1 Introduction Thin-walled structures come into their own in numerous structural systems, e.g., in plains, cars, but also in bridge and technological equipment structures. In general, modern plate girders are, fabricated by welding together two flanges, a web and a series of transverse stiffeners [1]. Flanges resist the applied moment, while web plates keep the relative distance between flanges and resist shear. In most practical ranges, the induced shearing force is relatively lower than the normal flange forces. Therefore, to obtain a high strength to weight ratio, it is common to choose deep girders. This entails a deep web the weight of which is minimized by reducing its thickness.
Fig. 1 Experimentally approached girder
Various forms of instabilities, such as shear buckling of web plates, lateral beam buckling of girders, compression buckling of webs, flange-induced buckling of webs, and local buckling and crippling of webs are considered in design procedures. A slender web is the basic structural element of a thin walled structure. The major manifestation of the slender web stability loss is the buckling. In case that the structure is stressed by repeated loading, the repeated stability loss of structure slender plate elements causes the repeated state of stress change which is then followed by the initiation and propagation of fatigue cracks.
Fig.2 Girder geometry
WSEAS TRANSACTIONS on APPLIED and THEORETICAL MECHANICS Zdenek Kala, Jiri Kala
ISSN: 1991-8747 242 Issue 4, Volume 5, October 2010

First, the stable crack growth occurs at repeated loading. In classical approach, each fatigue process is finished by brittle fracture. The larger is the stress amplitude in the given point, the rapider is the crack propagation occurrence. Therefore it is necessary to analyse the factors taking part in the stress variability in the points above all, where the most frequent presence of cracks initiation and propagation has been confirmed in accordance with experimental results. Thin-walled bridge structures are very often exposed to a repeated cyclically changing loading with maximal level up to 60% of a mean load carrying capacity. An explicit determination of crack-prone areas is impossible due to a complicated shape. The authors of this contribution focused their attention on the most accurate initial shape description. The double Fourier series was chosen for this aim [2]. Its terms were defined, based on a measuring of a non-loaded shape of a girder web, with the same dimensions. In the same manner, a realistic absolute magnitude deflection was assumed. Sets of Fourier series terms were generated by LHS [3] method using the measurement results. A thereby defined shape as a part of a numerical analysis was modelled with shell finite elements applying the programme system ANSYS. A sensitivity analysis was performed utilizing geometrically and materially non-linear analysis results. On behalf of the sensitivity analysis, it is possible to distinguish the extent of influence of input variables. 2 Sensitivity Analysis As far as the he notion “sensitivity analysis” is concerned, it has different meaning to different people, see, e.g., [4-11]. With the development of conceptions of the numerical analysis of advanced systems, these procedures can contribute to a qualitative improvement of the reliability analysis of structures, as it can be seen, e.g., in [12-21]. The information on problems, methods and applications of the theoretical analysis of thin-walled structures and stability is presented, e.g. in [22-25]. Sensitivity analysis is the study of how the variation in the output of a model (load carrying capacity, stress state, etc.) can be apportioned, qualitatively or quantitatively, on different sources of variation, and of how the given model depends upon the information fed into it [4]. The sensitivity analysis can be generally divided into two groups: (i) deterministic sensitivity analysis and (ii) stochastic sensitivity analysis [9]. 2.1 Deterministic Sensitivity Analysis The deterministic sensitivity analysis is a method sometimes applied in the design of structures [9]. Such an analysis thus consists of a sequence of computations
with a gradually changing value of the input parameters Xi studied, namely in each calculation run j (j = 1, 2,…,k), and this in a certain real extent [9]. By comparison of calculation result of Y the influence of parameter Xi on the response of Y can be evaluated. Calculation result Y can means e.g. load carrying capacity, stress state. So, if applying the deterministic sensitivity analysis, we deliberately disregard valuable information about the variability of the input data. 2.2 Stochastic Sensitivity Analysis In recent years, a number of different methods of the stochastic sensitivity analysis have been evolved [4, 26]. Stochastic methods are based upon various assumptions, and it is difficult to compare the results. However, each of the methods has its informative capability of a different kind. These are briefly as follows: (i) the method based upon the observation of the correlation coefficient, (ii) variance-based methods and (iii) Fourier amplitude sensitivity texts. This paper is devoted to (i). The random input qua are considered as if they have been obtained by measurements, this enabling us to get quantified information about the influence of the scatter of individual parameters involved. The stochastic sensitivity analysis can be employed with advantage in connection with the numerical simulation method Latin Hypercube Sampling (LHS) method [3]. In the paper, the sensitivity analysis is evaluated in the form of Spearman rank-order correlation coefficient.
,)(6
13
1
2,
NN
pqr
N
jjij
i−
−−=
∑= [ ]1,1, −∈isr (1)
where ri is the order representing the value of random variable Xi in an ordered sample among N simulated values applied in the jth simulation (the order qj equals the permutation at LHS), pj is the order of an ordered sample of the resulting variable for the jth run of the simulation process (qj,i – pj is the difference between the ranks of two samples and N is sample size). The method is based on the assumption that the random quantity influencing (both positively and negatively) on the output quantity change in a significant way will have a higher correlation coefficient. Opposite to this, the coefficient with its value near to zero will signalise a low influence. 3 Input Random Quantities Statistical characteristics of dominant random quantities were derived estimating measurement results. Initial smooth-surface shape variability was extracted from sixteen web girder measurements. Differences in real
WSEAS TRANSACTIONS on APPLIED and THEORETICAL MECHANICS Zdenek Kala, Jiri Kala
ISSN: 1991-8747 243 Issue 4, Volume 5, October 2010

and ideally straight shapes were metered in a predefined rectangular point net with rows and columns distance at 0.1 m. Within the framework of the experimental investigation into the fatigue limit state of thin-walled steel girders carried out at the cooperating Institute of Theoretical and Applied Mechanics in Prague, the initial out-of-plate deflection of the webs of the test girders is carefully measured. For measuring the precise optical measuring equipment was used. The web was divided on squares and in vortexes the initial out-of-plate imperfection was measured. The measuring is shown in figure 3.
Fig. 3 Measurement of initial imperfection of a
slender web The results of the measurements carried out on the webs of 16 large-size test girders, the web of which was 1000 mm in depth (and consequently similar in character to ordinary steel plate girders), will be used as a data set for the following sensitivity analysis carried out at the Faculty of Civil Engineering in Brno. The measured initial curvatures of the webs of the test girders were expanded into double Fourier sine series (2) with initial point of coordinate system in the lower left hand corner of the web:
( )
.3sin3sin
2sin3sinsin3sin
3sin2sin2sin2sin
sin2sin3sinsin
2sinsinsinsin,
9
87
65
43
21
⎟⎠⎞
⎜⎝⎛
⎟⎠⎞
⎜⎝⎛
+⎟⎠⎞
⎜⎝⎛
⎟⎠⎞
⎜⎝⎛+⎟
⎠⎞
⎜⎝⎛
⎟⎠⎞
⎜⎝⎛
+⎟⎠⎞
⎜⎝⎛
⎟⎠⎞
⎜⎝⎛+⎟
⎠⎞
⎜⎝⎛
⎟⎠⎞
⎜⎝⎛
+⎟⎠⎞
⎜⎝⎛
⎟⎠⎞
⎜⎝⎛+⎟
⎠⎞
⎜⎝⎛
⎟⎠⎞
⎜⎝⎛
+⎟⎠⎞
⎜⎝⎛
⎟⎠⎞
⎜⎝⎛+⎟
⎠⎞
⎜⎝⎛
⎟⎠⎞
⎜⎝⎛=
ly
lxe
ly
lxe
ly
lxe
ly
lxe
ly
lxe
ly
lxe
ly
lxe
ly
lxe
ly
lxeyxF
ππ
ππππ
ππππ
ππππ
ππππ
(2)
For a correct interpretation of the sensitivity analysis results, it is necessary to suppose, monotonous dependences between input and output. It was therefore
assumed that the value of the dominant shape of the initial curvature 1x1 (with the amplitude e1) would always be positive. When the negative sign of the coefficient e1 was obtained, the signs of all coefficients e1 to e9 were changed so that the coefficient e1 was always positive. It was considered the value of coefficient e1 ( i.e., the initial curvature shape 1 x 1) is dominant. The coefficients of the other terms of the Fourier series are less significant. Although the results obtained in such a way give a certain idea of the initial curvature shape, a relatively small statistical sample is concerned. The mean value and the standard deviation of coefficients e1 to e9 are given in Tab. 1. Table 1 Statistical characteristics of the amplitudes e1 to e9 [mm]
e1 e2 e3 e4 Mean 3.574 1.544 -0.950 -0.106
St. dev. 3.335 2.315 2.461 0.937 e5 e6 e7 e8 e9
-0.005 -0.117 0.040 0.182 -0.078 0.570 0.298 0.650 0.577 0.583
Higher statistical characteristics (skewness, kurtosis, correlation coefficients) were determined with a relatively high statistical error, and therefore they are not presented here. Thus description can be simplified using only the first series member with one sine wave horizontally and vertically (shape 1x1). In the problem solved, we issued from the large amount of experimental material and geometrical characteristics of steel products made by a dominant Czech producer, see [27, 28] and Fig. 4.
Fig.4 Histogram of yield strength
WSEAS TRANSACTIONS on APPLIED and THEORETICAL MECHANICS Zdenek Kala, Jiri Kala
ISSN: 1991-8747 244 Issue 4, Volume 5, October 2010

For the not measured quantities (e.g., Young’s modulus), the study was based on the data given in the technical literature; statistical characteristics of Young’s modulus, e.g., is given in [29]. Let us remark that the consideration of standard deviation 12.6 GPa is questionable, and can be considered by a negligibly lower value. Table 2: Statistic characteristics of the input variables
Random variables Type of dist. Mean Standard
deviation Amplitude of sine initial web curvature *** 3.574 mm 3.335 mm
Web thickness * 4 mm 0.2 mm Web yield strength ** 284.5 MPa 21.5 MPa Web Young's modulus * 210 GPa 12.6 GPa Thickness of upper flange * 10 mm 0.7 mm Yield str. of upper flange ** 284.5 MPa 21.5 MPa Young's modulus of upper flange * 210 GPa 12.6 GPa
Thickness of lower flange * 10 mm 0.7 mm Yield str. of lower flange ** 284.5 MPa 21.5 MPa Young's modulus of lower flange * 210 GPa 12.6 GPa
Thickness of left stiffener * 12 mm 0.84 mm Yield str. of left stiffener ** 284.5 MPa 21.5 MPa Young's modulus of left stiffener * 210 GPa 12.6 GPa
Thickness of middle stiffener * 12 mm 0.84 mm
Yield str. of middle stiff. ** 284.5 MPa 21.5 MPa Young's modulus of middle stiffener * 210 GPa 12.6 GPa
Thickness of right stiff. * 12 mm 0.84 mm Yield str. of right stiff. ** 284.5 MPa 21.5 MPa Young's modulus of right stiffener * 210 GPa 12.6 GPa
*Gauss **Histogram ***lognormal
4 Computation model To describe the behaviour of the girder presented in Fig.2 by numerical simulation, a finite element method was used in the programme system ANSYS. Its geometry was modelled by means of a mesh as a plate structure. Shell four-nodes elements SHELL 181 with full integration and twenty Gauss points were used. A half span symmetry geometry and a load case were used due to a computation time saving, see figure 5. For steel grade S235, bilinear kinematic material with hardening was meant. Further on, it was assumed that the onset of plastification occurred when the Misses stress reaches the yield stress. Within the framework of each run of the LHS method, the load carrying capacity of an observed girder
was found out by the geometrically and materially non-linear solution FEM.
Fig. 5 The finite element non-linear shell model with initial imperfection
The full Newton-Raphson method with updating of stiffness matrix in each iteration was applied. The loading test was controlled by incrementation of a load step. It should be emphasised here that in spite of an enormous development in numerical methods (FEM), analytical solutions are still useful, particularly in the initial phase of design process since the results can be obtained in a short time so that several versions of a structure can be analysed [30, 31]. 5 Load carrying Capacity The load carrying capacity was determined as the loading rate at which the determinant of tangential stiffness matrix Kt of the structure approaches zero with accurateness of 0.1 %. The loading process starts with 20% estimated load carrying capacity and decreases automatically. The histogram of random load-carrying capacity is presented in Fig. 4. Within the framework of each run of the LHS method, the load-carrying capacity was found out by geometrically and materially nonlinear solution FEM. 800 “real tests” on girders according to Fig. 1 with random imperfections were simulated by means of 800 runs of the LHS method. On contemporary computers, the computer time necessary for solution took five days. First the variant A of the solution was investigated, in which the initial web curvature was approximately substituted by two half-waves of the sine function with a random amplitude e1.
WSEAS TRANSACTIONS on APPLIED and THEORETICAL MECHANICS Zdenek Kala, Jiri Kala
ISSN: 1991-8747 245 Issue 4, Volume 5, October 2010
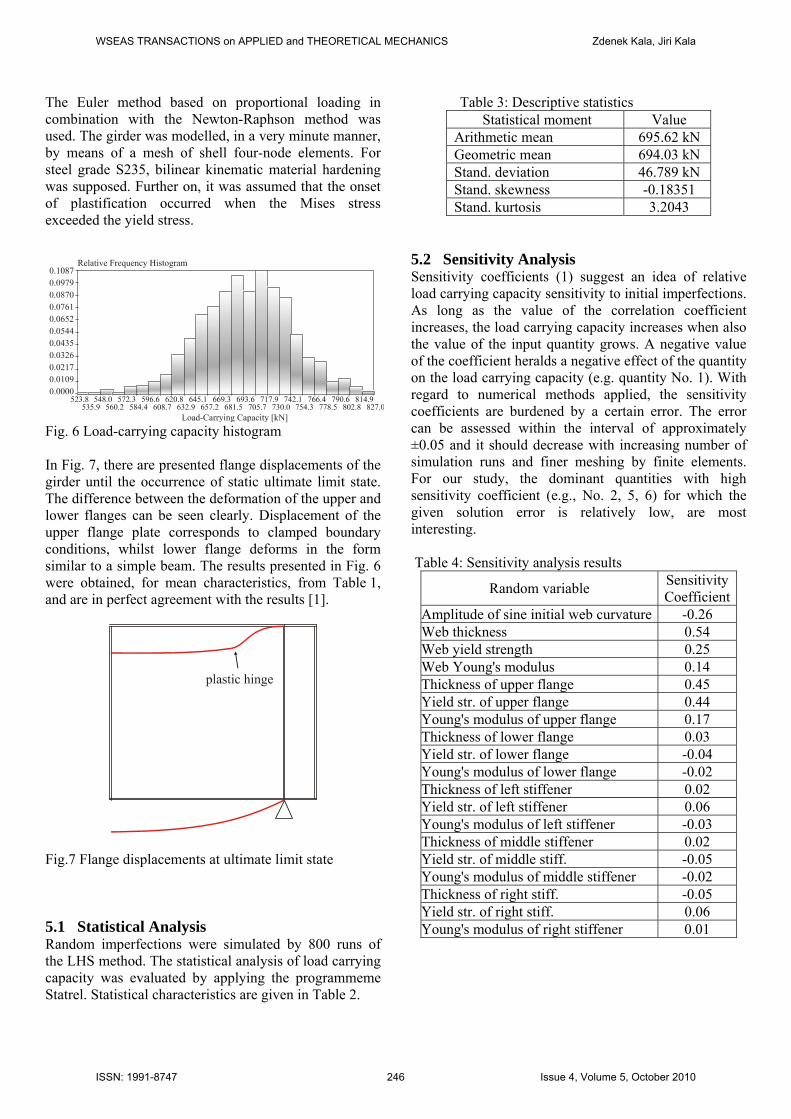
The Euler method based on proportional loading in combination with the Newton-Raphson method was used. The girder was modelled, in a very minute manner, by means of a mesh of shell four-node elements. For steel grade S235, bilinear kinematic material hardening was supposed. Further on, it was assumed that the onset of plastification occurred when the Mises stress exceeded the yield stress.
Fig. 6 Load-carrying capacity histogram In Fig. 7, there are presented flange displacements of the girder until the occurrence of static ultimate limit state. The difference between the deformation of the upper and lower flanges can be seen clearly. Displacement of the upper flange plate corresponds to clamped boundary conditions, whilst lower flange deforms in the form similar to a simple beam. The results presented in Fig. 6 were obtained, for mean characteristics, from Table 1, and are in perfect agreement with the results [1].
Fig.7 Flange displacements at ultimate limit state
5.1 Statistical Analysis Random imperfections were simulated by 800 runs of the LHS method. The statistical analysis of load carrying capacity was evaluated by applying the programmeme Statrel. Statistical characteristics are given in Table 2.
Table 3: Descriptive statistics Statistical moment Value
Arithmetic mean 695.62 kN Geometric mean 694.03 kN Stand. deviation 46.789 kN Stand. skewness -0.18351 Stand. kurtosis 3.2043
5.2 Sensitivity Analysis Sensitivity coefficients (1) suggest an idea of relative load carrying capacity sensitivity to initial imperfections. As long as the value of the correlation coefficient increases, the load carrying capacity increases when also the value of the input quantity grows. A negative value of the coefficient heralds a negative effect of the quantity on the load carrying capacity (e.g. quantity No. 1). With regard to numerical methods applied, the sensitivity coefficients are burdened by a certain error. The error can be assessed within the interval of approximately ±0.05 and it should decrease with increasing number of simulation runs and finer meshing by finite elements. For our study, the dominant quantities with high sensitivity coefficient (e.g., No. 2, 5, 6) for which the given solution error is relatively low, are most interesting. Table 4: Sensitivity analysis results
Random variable Sensitivity Coefficient
Amplitude of sine initial web curvature -0.26 Web thickness 0.54 Web yield strength 0.25 Web Young's modulus 0.14 Thickness of upper flange 0.45 Yield str. of upper flange 0.44 Young's modulus of upper flange 0.17 Thickness of lower flange 0.03 Yield str. of lower flange -0.04 Young's modulus of lower flange -0.02 Thickness of left stiffener 0.02 Yield str. of left stiffener 0.06 Young's modulus of left stiffener -0.03 Thickness of middle stiffener 0.02 Yield str. of middle stiff. -0.05 Young's modulus of middle stiffener -0.02 Thickness of right stiff. -0.05 Yield str. of right stiff. 0.06 Young's modulus of right stiffener 0.01
WSEAS TRANSACTIONS on APPLIED and THEORETICAL MECHANICS Zdenek Kala, Jiri Kala
ISSN: 1991-8747 246 Issue 4, Volume 5, October 2010

6 The stress state in crack-prone areas In first part of the results the analysis of stress state of girders with the initial curvature shape considered in three variants. For variants A and B, the initial curvature statistical characteristics were introduced according to measurements. For variant C, the same statistical characteristics were introduced for all the coefficients e1 to e9, with the aim to find out which of the initial curvature shapes influenced the output to the maximum extent.
Fig. 8 Sensitivity coefficients of the bending stress along the edges of the web – load 20 %
Fig. 9 Sensitivity coefficients of the bending stress along the edges of the web – load 60 %
Fig. 10 Sensitivity coefficients of the bending stress along the edges of the web – load 60 %
The random quantities e1 to e9 were there supposed to be statistically independent. Figs 8 and 9 show the distribution of the sensitivity coefficients for the variant B, in which the statistical characteristics of the amplitudes e1 to e9 were taken from the measurements of the initial curvature (see above Tab. 1). In this case the influences of the variability of the initial imperfections (see Tab. 4) in the variability of the bending stress generated along the edges of the web by its buckling is studied. The bending stresses were calculated with the aid of the program ANSYS based on an application of a nonlinear solution as described above. Of course, the bending stress depends on the load to which the girder and the web are subjected. In the authors’ study, two loading levels were considered; (i) equal to 20 % and (ii) equal to 60 % of the static load-bearing capacity; they represent the interval of working loads to which a typical bridge structure is usually exposed during its lifetime. With the aim to minimise the statistical errors in the assessment of the Spearman rank-orders correlation coefficients, 800 runs of the LHS method were applied. An examination of Figs 8 and 9 indicates that the variability of the bending stresses is most sensitive to the variability of the amplitudes e1, e2, and e3, the mean values and standard deviations of which being in a pronounced way higher than those of the other amplitudes, e4 - e9 (see Table 1). It should be mentioned in this connection that Figs 8 and 9 present the distributions only of those quantities where sensitivity coefficients are higher than 0.1. So, in what is said above, the sensitivity analysis is based on the values of initial imperfections which were measured on the webs of the Prague test girders. Consequently, they already reflect the fact that in the case of real steel plate girders some terms of Fourier series (2) are larger than the others. With this being so, we cannot, if proceeding in this way, reliably assess the relative role of the individual terms of series (2) on the sensitivity of the bending stresses occurring close to the boundaries of the web, i.e. in its crack-prone areas if the web is subjected to repeated loading. That is why the authors decided to carry out yet another variant of the solution, variant C, in which all the amplitudes e1 – e9 were considered to be the same. The Gaussian distribution was chosen for the random amplitudes of the initial curvature, so that the function F(x,y) of the web initial out-of-plane imperfection had the Gaussian distribution. Thereby, the requirement was fulfilled that, in the interval (0; 10mm), at least 95 % of all realizations of the function F(x, y) could occur. It was also assumed that the statistical characteristics of all the amplitudes were the same. As regards the load, it was again supposed for it to be equal to 60% of the average statistical load-carrying
WSEAS TRANSACTIONS on APPLIED and THEORETICAL MECHANICS Zdenek Kala, Jiri Kala
ISSN: 1991-8747 247 Issue 4, Volume 5, October 2010
capacity. The resulting distribution of the sensitivity coefficients along the web edges is presented in Fig. 10, but only for those quantities where the Spearman rank–order correlation coefficients are superior to 0.1. An analysis of the figure indicates that the bending stress variability is the most sensitive to the variability of the web thickness. As far as the role of the web initial curvature is concerned, it follows from a comparison with the results of the variant B of the solution that (i) values of the sensitivity coefficients for the amplitudes e1 to e3 are very low (see the left-hand part of Fig.10), and (ii) the highest values of the sensitivity coefficients were obtained for the series terms 2x3 and 3x2 (see the right-hand part of Fig. 10), i.e., for the “higher” terms of the double Fourier series (2). The influence of the initial curvature of the web on (i) the static load-carrying capacity of the girders (which determines the ultimate limit state of the girder in the case of quasi-constant loading), (ii) the bending stresses at the toes of the fillet welds connecting the web with its peripheral elements (which play an important role in fatigue limit state of the girder in the case of its being subjected to many times repeated loads) is analysed. The results of the sensitivity analysis are given in Figs 8 to 10. In the investigation, main attention was paid to the above point (ii), for which two variants B and C of the solution were presented. The results of the variant B are shown in Figs 8 and 9 where a significant effect both of the shape and size of the web initial curvature can be seen. In particular it is the values of the correlation coefficients for the quantities e1, e2, e3 (curvature shapes 1x1, 1x2, 1x3) which are relatively high. In the variant C a theoretical case was studied, where the random amplitudes e1 to e9 have the Gaussian distribution function and the same statistical characteristics. The aim of this variant of the solution was to “map” the influence of the individual terms of the double Fourier series (2), i.e., of various potential shapes of web initial curvature, on the bending stresses in the crack-prone areas of the web. The results are plotted in Fig. 10 and indicate that it is particularly “higher” configurations of the initial curvature, shapes 2x3 and 3x2, which considerably influence the stress variability.
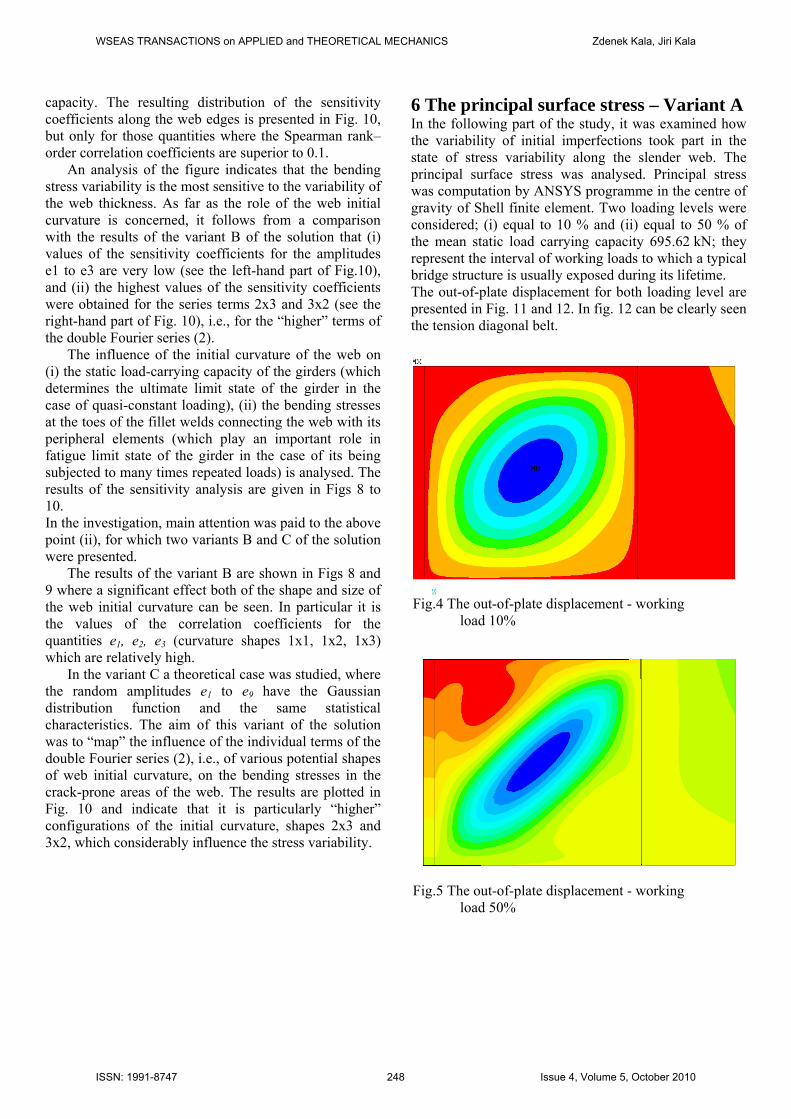
6 The principal surface stress – Variant A In the following part of the study, it was examined how the variability of initial imperfections took part in the state of stress variability along the slender web. The principal surface stress was analysed. Principal stress was computation by ANSYS programme in the centre of gravity of Shell finite element. Two loading levels were considered; (i) equal to 10 % and (ii) equal to 50 % of the mean static load carrying capacity 695.62 kN; they represent the interval of working loads to which a typical bridge structure is usually exposed during its lifetime. The out-of-plate displacement for both loading level are presented in Fig. 11 and 12. In fig. 12 can be clearly seen the tension diagonal belt.
Fig.4 The out-of-plate displacement - working
load 10%
Fig.5 The out-of-plate displacement - working
load 50%
WSEAS TRANSACTIONS on APPLIED and THEORETICAL MECHANICS Zdenek Kala, Jiri Kala
ISSN: 1991-8747 248 Issue 4, Volume 5, October 2010

7 Conclusion The resulting distribution of the sensitivity coefficients along the web edges is presented in Fig. 13 and 14, but only for those quantities where the Spearman rank–order correlation coefficients are superior to 0.2.
Fig.13 Sensitivity coefficients along the web edges – working load 10%
Fig.14 Sensitivity coefficients along the web edges – working load 50%
The aim of the analysis described in this article is to observe an influence of an initial imperfection on a load carrying capacity and stress state around web edges. The sensitivity coefficients given in Table 3 display significant load carrying sensitivity on web thickness, thickness of upper flange and yield strength of upper flange variation. A non-loaded web plate shape affection on a load carrying capacity is negative but not dominant. The initial imperfection variability effect on the principal surface stress variability was analyzed. Sensitivity analysis results visible in Fig.13 and Fig.14 show differences in behaviour diagrams of sensitivity coefficients for working level loads 10 % and 50 % of a mean static ultimate load carrying capacity. Whereas for load level 10 %, stress state is highly sensitive to a no load web shape, at 50 % of a mean static ultimate load carrying capacity, thickness and Young modulus are dominant quantities. Fig.13 and Fig.14 display only quantities with a sensitivity coefficient greater than 0.2. The results adequately complement the sensitivity studies of plate edges bending stresses [2], within which an effect of initial no load shape was analyzed. Further improvement of current ways for design will emanate from calibration methods, optimization principles and other rational approaches including the application of methods of the theory of probability, mathematical statistics and reliability theory [32-34]. Acknowledgement The article was elaborated within the framework of projects of GAČR 103/08/0275, AVČR IAA201720901 and MSM0021630519.
References: [1] M.M. Alinia, M. Shakiba, H.R. Habashi, Shear
Failure Characteristics of Steel Plate Girders, Thin-Walled Structures, Vol.47, No.12, 2009, pp. 1498–1506.
[2] Z. Kala, J. Kala, M. Škaloud, B. Teplý, The Stress State in the Crack-Prone Areas of „Breathing“ Thin Walled Girders – a Sensitivity Analysis, In Proc. of the Fourth Int. Conf. on Coupled Instabilities in Metal Structures, Rome (Italy), 2004, pp.265-276.
[3] M. D. McKey, R. J. Beckman, W. J. Conover, A Comparison of the Three Methods of Selecting Values of Input Variables in the Analysis of Output from a Computer Code, Technometrics, Vol.21, No.2, 1979, pp. 239-245.
[4] A. Saltelli, S. Tarantola, F. Campolongo, M. Ratto, Sensitivity Analysis in Practice: A Guide to Assessing Scientific Models, New York: John Wiley and Sons, 2004.
WSEAS TRANSACTIONS on APPLIED and THEORETICAL MECHANICS Zdenek Kala, Jiri Kala
ISSN: 1991-8747 249 Issue 4, Volume 5, October 2010

[5] C. Szymczak, Sensitivity Analysis of Thin-Walled Members, Problems and Applications, Thin-Walled Structures, Vol.41, No.2-3, 2003, pp.271-290.
[6] Z. Kala, Sensitivity Analysis of the Stability Problems of Thin–Walled Structures, Journal of Constructional Steel Research, Vol.61, No.3, 2005, pp. 415-422.
[7] Z. Kala, Sensitivity Assessment of Steel Members under Compression, Engineering Structures, Vol.31, No.6, 2009, pp. 1344-1348.
[8] Z. Kala, J. Kala, Variance-Based Sensitivity Analysis of Stability Problems of Steel Structures using Shell Finite Elements and Nonlinear Computation Methods, In Proc. of the 2nd WSEAS Int. Conf. on Engineering Mechanics, Structures and Engineering Geology (EMESEG ’09), Rodos Island (Greece), 2009, pp.89-94.
[9] Z. Kala, J. Kala, J. Sensitivity Analysis of Stability Problems of Steel Structures Using Shell Finite Elements and Nonlinear Computation Methods, WSEAS Transactions on Applied and Theoretical Mechanics, Vol.4, No.3, 2009, pp. 105-114.
[10] H.A. Mang, X. Jia, G. Hoefinger, Hilltop Buckling as the Alfa and Omega in Sensitivity Analysis of the Initial Postbuckling Behavior of Elastic Structures, Journal of Civil Engineering and Management, Vol.15, No.1, 2009, pp. 35-46.
[11] J. Melcher, M. Škaloud, Z. Kala, M. Karmazínová, Sensitivity and Statistical Analysis Within the Elaboration of Steel Plated Girder Resistance, Advanced Steel Construction, Vol.5, No.2, 2009, pp. 120-126.
[12] Z. Kala, Stability Problems of Steel Structures in the Presence of Stochastic and Fuzzy Uncertainty, Journal of Thin–Walled Structures, Vol.45, No. 10-11, 2007, pp. 861-865.
[13] G. Kaklauskas, V. Gribniak, D. Bacinskas, P. Vainiunas, Shrinkage Influence on Tension Stiffening in Concrete Members, Engineering Structures, Vol.31, No.6, 2008, pp. 1305-1312.
[14] Z. Kala, Fuzzy Probability Analysis of the Fatigue Resistance of Steel Structural Members under Bending, Journal of Civil Engineering and Management, Vol.14, No.1, 2008, pp. 67-72.
[15] J. Amšiejus, N. Dirgėlienė, A. Norkus, D. Žilionienė, Evaluation of Soil Shear Strength Parameters via Triaxial Testing by Height Versus Diameter Ratio of Sample, The Baltic Journal of Road and Bridge Engineering, Vol.IV, No.2, 2009, pp. 55-60.
[16] C.B. Pinca, G. O. Tirian, A. Josan, Application of Finite Element Method to an Overhead Crane Bridge, WSEAS Transactions on Applied and
Theoretical Mechanics, Vol.4, No.2, 2009, pp. 64-73.
[17] L. Puklický, Z. Kala, Application of Fuzzy Analysis to Stability Problems of Steel-Concrete Structural Members, In Proc. of the 2nd WSEAS Int. Conf. on Engineering Mechanics, Structures and Engineering Geology (EMESEG ’09), Rodos Island (Greece), 2009, pp.111–113.
[18] Z. Kala, L. Puklický, A. Omishore, M. Karmazínová, J. Melcher, Stability Problems of Steel-Concrete Members Composed of High Strength Materials, Journal of Civil Engineering and Management, Vol.16, No.3, 2010. (in print) ISSN 1392-3730 print / ISSN 1822-3605 online
[19] P. Padevět, P. Bittnar, Measuring the Creep and Material Properties of Cement Paste Specimens, WSEAS Transactions on Applied and Theoretical Mechanics, Vol.5, No.1, 2010, pp. 81-90.
[20] V. Gribniak, G. Kaklauskas, S. Idnurm, D. Bačinskas, Finite Element Mesh Size Effect on Deformation Predictions of Reinforced Concrete Bridge Girder, The Baltic Journal of Road and Bridge Engineering, Vol.V, No.1, 2010, pp.19-27.
[21] J. Valentinas, J. Atkočiūnas, SAOSYS Toolbox as MATLAB Implementation in the Elastic-Plastic Analysis and Optimal Design of Steel Frame Structures, Journal of Civil Engineering and Management, Vol.16, No.1, 2010, pp.103-121.
[22] M. Królak, Z. Kołakowski, M. Kotełko, Influence of Load-Non-Uniformity and Eccentricity on the Stability and Load Carrying Capacity of Orthotropic Tubular Columns of Regular Hexagonal Cross-section, Thin-Walled Structures, Vol.39, No.6, 2001, pp. 483-498.
[23] M. Kotełko, K. Kowal–Michalska, J. Rhodes, Stability of Structures, Thin-Walled Structures, Vol.45, No.10-11, 2007, pp. 809-809.
[24] M. Kotełko, Load carrying Capacity and Energy Absorption of Thin-Walled Profiles with Edge Stiffeners, Thin-Walled Structures, Vol.45, No.10-11, 2007, pp.872-876.
[25] SR. Arwade, M. Moradi, A. Louhghalam, Variance Decomposition and Global Sensitivity for Structural Systems, Engineering Structures, Vol. 32, No.1, 2010, pp. 1-10.
[26] J. Melcher, Z. Kala, M. Holický, M. Fajkus, L. Rozlívka, Design Characteristics of Structural Steels Based on Statistical Analysis of Metallurgical Products, Journal of Constructional Steel Research, Vol.60, No.3-5, 2004, pp. 795-808.
[27] Z. Kala, J. Melcher, L. Puklický, Material and Geometrical Characteristics of Structural Steels Based on Statistical Analysis of Metallurgical Products, Journal of Civil Engineering and
WSEAS TRANSACTIONS on APPLIED and THEORETICAL MECHANICS Zdenek Kala, Jiri Kala
ISSN: 1991-8747 250 Issue 4, Volume 5, October 2010

Management, Vol.15, No.3, 2009, pp. 299–307. [28] J.B. Cardoso, J.R. De Almeida, J.M. Dias, P.G.
Coelho, Structural Reliability Analysis Using Monte Carlo Simulation and Neural Networks, Advances in Engineering Software, Vol.39, No.6, 2008, pp. 505–513.
[29] M. Kotełko, Load-Capacity Estimation and Collapse Analysis of Thin-Walled Beams and Columns - Recent Advances, Thin-Walled Structures, Vol.42, No.2, 2004, pp.153-175.
[30] V. Ungureanu, M. Kotełko, R.J. Mania, D. Dubina, Plastic Mechanisms Database for Thin-Walled Cold-Formed Steel Members in Compression and Bending, Thin-Walled Structures, In Press. doi:10.1016/j.tws.2010.01.004
[31] M. Karmazínová, J. Melcher, Z. Kala, Design of Expansion Anchors to Concrete Based on Results of Experimental Verification, Advanced Steel Construction, Vol.5, No.4, 2009, pp. 390–405.
[32] J. Gocál, J. Vičan, R. Hlinka, J. Jošt, Laboratory Tests of a Typical Fatigue Prone Riveted Steel Railway Bridge Structural Detail, Procedia Engineering, Vol.2, No.1, 2010, pp.1761-1766.
[33] V. Jankovski, J. Atkociunas, SAOSYS Toolbox as MATLAB Implementation in the Elastic-Plastic Analysis and Optimal Design of Steel Frame Structures, Journal of Civil Engineering and Management, Vol.16, No.1, 2010, pp. 103-121.
[34] A. Omishore, Advanced Modeling Approaches for Reliability Analysis of Steel Structures, In Proc. of the 3nd WSEAS Int. Conf. on Engineering Mechanics, Structures and Engineering Geology (EMESEG ’10), Corfu Island (Greece), 2010, pp.172–176.
[35] S. Abdullah, N. A. Al-Asady, A. K. Ariffin, M. M. Rahman, Z. M. Nopiah, FEA based Fatigue Life Assessment of an Automobile Lower Suspension Arm Using Various Strain-Life Models, Proc. 4th WSEAS International Conference on APPLIED and THEORETICAL MECHANICS (MECHANICS '08), Cairo, Egypt, 2008, pp. 81 – 88.
[36] D. Gleich, P. Planinsic, M. Kseneman, M. Soccorsi, Gauss-Markov Random Field model for non-quadratic regularization of complex SAR images, Proceedings of the 7th WSEAS International Conference on SYSTEM SCIENCE and SIMULATION in ENGINEERING (ICOSSSE '08), Venice, Italy, 2008, pp. 395 -399.
[37] I. T. Carstea, D. P. Carstea, Parallel Computing in Finite Element Applications, Proc. of the 10th WSEAS Int. Conf. on MATHEMATICAL and COMPUTATIONAL METHODS in SCIENCE and ENGINEERING (MACMESE'08), Bucharest, Romania, 2008, pp. 181-186.
WSEAS TRANSACTIONS on APPLIED and THEORETICAL MECHANICS Zdenek Kala, Jiri Kala
ISSN: 1991-8747 251 Issue 4, Volume 5, October 2010