residential water use in sydney, the blue mountains and ...residential water use in sydney, the blue...
TRANSCRIPT

Residential water use in Sydney, the Blue Mountains and Illawarra
Results from the 2003 household survey
I N D E P E N D E N T P R I C I N G A N D R E G U L A T O R Y T R I B U N A L O F N E W S O U T H W A L E S


I N D E P E N D E N T P R I C I N G A N D R E G U L A T O R Y T R I B U N A L O F N E W S O U T H W A L E S
Residential water use in Sydney, the Blue Mountains and Illawarra
Results from the 2003 household survey
Research Paper RP26 ISBN 1 877049 42 5
April 2004
This is copyright. The Copyright Act 1968 permits fair dealing for study, research, news reporting, criticism and review. Selected passages, tables or diagrams may be reproduced for such purposes provided acknowledgement of the source is included.

The Tribunal would like to thank the household survey participants, without whom it could not have undertaken this analysis. It would also like
to thank Taverner Research Consulting for its contribution in collecting and collating the raw data.
This report was prepared by Brett Everett, Adrian Kemp and Kerry Napper
from IPART’s Analysis and Policy Development section.
Inquiries regarding this research report should be directed to:
Adrian Kemp ( (02) 9290 8459 Brett Everett ( (02) 9290 8423
Independent Pricing and Regulatory Tribunal of New South Wales Level 2, 44 Market Street, Sydney NSW 2000 ( (02) 9290 8400 Fax (02) 9290 2061
www.ipart.nsw.gov.au ALL CORRESPONDENCE TO: PO BOX Q290, QVB POST OFFICE NSW 1230

TABLE OF CONTENTS
1 INTRODUCTION 1 1.1 About the survey 2 1.2 Key findings and implications 2 1.3 Structure of this report 3
2 PROFILE OF RESIDENTIAL WATER USERS IN SYDNEY, BLUE MOUNTAINS AND ILLAWARRA 5 2.1 What do different water users look like? 5
2.1.1 Larger households use more water, but household composition also important 6 2.1.2 Households that live in houses use more water than those in units 9 2.1.3 Households that rent public housing use more water than private renters and
owners 11 2.1.4 Households in the Illawarra use less water than those in the Blue Mountains and
Sydney 13 2.2 What do households use water for? 14
2.2.1 Households with more water using amenities have higher average water consumption 15
2.2.2 Swimming pools have a significant impact on individual household water use 17 2.3 What is the relationship between income and water use? 18
2.3.1 High-income households generally use more water 18 2.3.2 Consumption within income groups is variable, and household size and other
characteristics have a greater impact than income alone 20 2.3.3 Concession card holders use less water than other consumers 23 2.3.4 Survey data can be used to identify vulnerable groups 26
2.4 Does paying water usage charges influence water use? 28 2.4.1 40 per cent of households do not pay water usage charges 29 2.4.2 Households that live in houses and do not receive a water usage bill consume
more water than those that do 30
3 ATTITUDES TO WATER RESTRICTIONS, REDUCING WATER CONSUMPTION AND SERVICE QUALITY 31 3.1 Customers appear willing to accept more frequent water restrictions 31 3.2 Most customers believe they could not easily reduce their own water consumption 32 3.3 What water service factors are important to customers? 33
4 IMPLICATIONS FOR DEMAND MANAGEMENT PROGRAMS 35 4.1 What factors are the key drivers of household water use? 35 4.2 What contribution do various indoor and outdoor water uses make to overall
consumption? 36 4.3 What do these findings imply for demand management programs? 37
APPENDIX 1 STATISTICAL TABLES 39
APPENDIX 2 OVERVIEW OF THE SURVEY DESIGN AND METHODOLOGY 59
APPENDIX 3 ESTIMATING THE DETERMINANTS OF WATER DEMAND 63
APPENDIX 4 GLOSSARY 65
APPENDIX 5 REFERENCE LIST 67


Introduction
1
1 INTRODUCTION
Sydney’s recent drought, and the resulting drop in the level of water in its supply storages, has put the need to better manage the balance between the city’s demand for water and its available supply in the spotlight. However, this is not a short-term issue. Over the past 20 years, Sydney’s total water consumption has regularly exceeded the level currently considered to be ’the sustainable yield’ from its water storages.1 In addition, proposals to increase the flow of water for environmental purposes in the Hawkesbury Nepean river system are expected to decrease the available supply in the future. Given these facts, together with the NSW Government’s current policy of no new dams and Sydney’s steady population growth, finding effective, sustainable ways to reduce overall water demand is critical. Sydney Water Corporation, which supplies water to all consumers in the Sydney, Blue Mountains and Illawarra regions, has embarked on a systematic water conservation campaign. Its strategies include promoting the use of water saving devices, fixing supply leaks, running education campaigns to increase awareness of the problems associated with wasting water and, most recently, imposing mandatory water restrictions. However, an additional option is being considered. This is to use price changes—such as increases in water usage charges or implementing alternative pricing structures2—to reduce overall water demand, especially by residential customers. To evaluate how effective price changes are likely to be, and how they would affect different customer groups, we need a better understanding of how much water different types of households use, and the factors that drive this usage. To this end, the Independent Pricing and Regulatory Tribunal of New South Wales (the Tribunal) has undertaken a survey of households in Sydney Water’s area of operation.3 The primary aims of the survey were to collect information on the characteristics of households and their water use that would: • help the Tribunal assess the impact of its pricing decisions on different households and
community groups—particularly low-income households—and fulfil the requirements of section 15 of the IPART Act 19924
• help increase the community’s understanding of the factors that influence water demand
• help identify where targeted demand management programs are most likely to achieve water reductions.
1 IPART, End-of-term Review of the Operating Licences for Sydney Water Corporation and the Sydney Catchment
Authority - Water Demand and Supply Balance - Issues Paper, January 2004. 2 This may involve either increases in water usage charges or the implementation of alternative pricing
structures including for example inclining-block tariffs. 3 The Tribunal conducted similar household surveys in 1993/94 and 1998/99. Where appropriate, similar
questions were asked to allow comparisons to be made between periods. 4 This section requires the Tribunal to consider the social and economic impacts of its pricing decisions on
customers.

Independent Pricing and Regulatory Tribunal
2
In addition, the Tribunal is currently undertaking a review of alternative price structures to identify how these structures might influence demand as part of a section 12 inquiry.5 It is also examining Sydney’s water demand and supply imbalance problems as part of its 2004 end of term review of the operating licence for Sydney Water.6 It expects the data collected through the 2003 household survey will contribute to its analysis for this review.
1.1 About the survey The survey was conducted between June and September 2003 and involved 2604 participants in the Sydney, Blue Mountains and Illawarra regions. The Tribunal engaged Taverner Research Company to undertake face-to-face interviews with residential households on its behalf. Taverner also asked these households to sign an authority to allow Sydney Water to give Taverner access to their consumption data.7 This allowed Taverner to provide the Tribunal with a combined data set that included consumption from the utility and the responses to the survey questions. Given the Tribunal’s desire to better understand low-income households, survey participants were split into two groups. The first was a sample of approximately 2000 households randomly selected from across the Sydney, Blue Mountains and Illawarra regions. The second sample was drawn from Australian Bureau of Statistics census districts with a high proportion of low-income households, to increase the sample size of low-income households in the survey. A detailed description of the survey design and methodology is provided in Appendix 2.
1.2 Key findings and implications The survey data indicates that although there is a high level of variability in household water consumption, a range of household characteristics and water-use purposes seem to be associated with higher average consumption. For example, these include having more people in a household, living in a house rather than a unit, having a larger sized block of land, having a higher income, living in public housing, not receiving a water usage bill, spending more time watering the garden and owning a pool. Because many of these characteristics and water-use purposes are interrelated, we developed a statistical model to isolate the contribution of each factor to overall consumption, and determine which are the most important. The statistical model suggests that household size and not receiving a water usage bill are the most important drivers of household water use. The survey data themselves indicate that household composition and dwelling type are also important.
5 IPART, Investigation into Price Structures to Reduce the Demand for Water in the Sydney Basin - Issues Paper,
December 2003. 6 IPART, End-of-term Review of the Operating Licences for Sydney Water Corporation and the Sydney Catchment
Authority - Water Demand and Supply Balance - Issues Paper, January 2004. 7 Where individually metered consumption was unavailable, for example for an unmetered unit in a
complex which is metered as a whole, the average consumption for the units within the complex was used.

Introduction
3
Our statistical modelling indicates that a household which does not directly pay their water usage charges, all other things equal, uses an average of 19 per cent more water compared to households that do8. It also indicates that if these households9 were able to reduce their water consumption to the same as equivalent households who do receive a water usage bill directly, then approximately 18 GL of water could potentially be saved. It is unlikely that simply billing these households’ water usage charges directly would achieve these savings, as there may be other causes for the additional water use including the upkeep of facilities in the residence by landlords in tenanted properties. Also, any consideration of programs to target these potential savings should consider the costs and benefits of the program, relative to alternative approaches to save water and the potential impact on vulnerable, low-income households. However, given the potential magnitude of water which might be saved, our results suggest that further work should be undertaken to examine these areas of potential savings, having regard to cost and equity considerations. We also asked households about their attitudes to mandatory water restrictions and reducing their own water consumption. Most households said they would be willing to accept water restrictions as often as once a year. However, most also believed that they would not find it easy to reduce their own consumption. We believe the survey data can be used to help understand the social and economic impact of potential changes to water prices and price changes. For example, it can be used to identify the type and number of households most vulnerable to these changes, such as those with high consumption, low income and higher household size.
1.3 Structure of this report This report explains these findings and implications in detail: • Chapter 2 provides a profile of residential water users in the Sydney, Blue Mountains
and Illawarra regions, describing the relationship between various demographic, water use and income characteristics and household water consumption
• Chapter 3 looks at residential water users attitudes to water restrictions, their beliefs about their own ability to reduce water consumption, and the importance they place on various aspects of their water service
• Chapter 4 discusses the implications of the survey findings for reducing overall water demand.
To allow further analysis of the survey data, statistical tables of all of the results from the survey relevant to water use are provided in Appendix 1.
8 The 19 per cent difference estimated by the statistical modelling isolates the influence of receiving a water
usage bill from other factors such as household size, income and differences in number of water using appliances. Without adjusting for these other factors, our survey analysis indicates that the difference in water usage between a household residing in a house that does not receive a water usage bill compared with a household that does is approximately 4 per cent.
9 Households that are considered not to receive a water usage bill include those that live in units without a separate meter, those living in premises owned by the Department of Housing, and those living in privately rented premises where the landlord does not pass on the water usage component of the bill.
Independent Pricing and Regulatory Tribunal
4

Profile of residential water users in Sydney, Blue Mountains and Illawarra
5
2 PROFILE OF RESIDENTIAL WATER USERS IN SYDNEY, BLUE MOUNTAINS AND ILLAWARRA
The survey data provides a detailed picture of residential water users in the Sydney, Blue Mountains and Illawarra regions, and identifies the characteristics that are associated with high and low household water consumption. These characteristics include household size and composition, type of dwelling, land size, number of water-using amenities, household income, and whether or not water usage charges are paid directly. This chapter provides an overview of the survey findings by exploring: • what different water users look like
• what different households use water for
• the relationship between income and water use
• the impact of direct water usage charges on water use.
Please note that this chapter discusses the relationship between household water use and a range of demographic and other characteristics in a general way. Because many of these characteristics are interrelated, a strong positive relationship between water use and a characteristic does not necessarily mean that the characteristic is driving water use. It may be that another, underlying factor is the true driver. These underlying drivers, and their implications for reducing water demand, are explored in Chapter 4.
2.1 What do different water users look like?
In 2003, average residential household water use in the Sydney, Blue Mountains and Illawarra regions was 249kL per annum. This average has remained fairly constant over the last 10 years—moving between a low of 215kL in 1996, and a high of 250kL in 1998.10
10 These averages were obtained from the information provided by Sydney Water to the Tribunal as part of
its Annual Information Returns.
Box 2.1 Snapshot of high and low water users Low users (<100kL per annum) On average, have less than 2 people in household (compared to an average household size of 3 people for all households in Sydney Water’s area of operation)
High users (>500kL per annum) On average, have more than 4 people in household (compared to an average household size of 3 people for all households in Sydney Water’s area of operation)
87% are single person households (compared to 36% of all households)
85% are couples with children (compared to 47% of all households)
53% live in flats or units (compared to 35% of all households)
93% live in separate houses (compared to 56% of all households)
32% of households in houses live on small blocks of land (less than 500 square metres) (compared to 19% of all households)
68% of households in houses live on medium blocks of land (500 to 900 square metres) (compared to 68% of all households)
89% live in Sydney (compared to 90% of all households)
8% live in public housing (compared to 5% of all households)

Independent Pricing and Regulatory Tribunal
6
Not surprisingly, however, individual household use varies enormously. The 2003 household survey suggests around 7 per cent of households are high water users—consuming more than 500kL per annum—while around 12 per cent are low water users—consuming less than 100kL per annum. When we looked at these extremes, two very different household profiles emerged. High water users tend to be larger than average households, mostly families with children, who live in separate houses, mostly on medium-sized blocks of land. Low water users are more likely to be smaller than average households, often single people, who live in units or houses on smaller blocks of land (see Box 2.1). We also compared the average annual consumption of households with different characteristics, which provided a similar but more detailed picture of Sydney water users. The key findings are as follows: • Larger households generally consume more water than smaller households. However,
the composition of the household also affects water use. Those that comprise adults only use more water than those of equal size that comprise adults and children under the age of 15 years. Of those that include children, those with younger children appear to use less water than those with older children.
• Households that live in houses consume more water than those that live in units. Of households that live in houses, those with medium- and large-sized blocks of land tend to use more than those on small blocks.
• Households that rent public housing tend to use more water than those who rent privately or own or are purchasing their own home.
• Households located in the Illawarra region use less water than those located in Sydney.
2.1.1 Larger households use more water, but household composition also important
The 2003 survey found a strong relationship between the number of people in a household and household water consumption. The average consumption for households of one to two people was 193kL, whereas for households of five or more people it was 398kL (Figure 2.1). These larger households make up 18 per cent of the total households in Sydney Water’s area of operation (Figure 2.2), but 47 per cent of those that used more than 500kL of water per annum (Figure 2.3). Large households consumed an estimated 79GL of water in 2003, which represents 13 per cent of Sydney Water’s total water demand for that year.

Profile of residential water users in Sydney, Blue Mountains and Illawarra
7
Figure 2.1 Average annual water consumption by household size
1-2 people 3-4 people 5 or more people
Household size
100
200
300
400
Ann
ual w
ater
con
sum
ptio
n (k
L)
193
279
398
Figure 2.2 Proportion of households by household size
1-2 people 43%
3-4 people 39%
5 or more people
18%

Independent Pricing and Regulatory Tribunal
8
Figure 2.3 Proportion of households using more than 500kL, by household size
Within larger households, the composition of the household also seems to influence water consumption. Our survey found that those comprising adults and children under 15 years of age tend to use less water than households of the same size comprising adults only. For example, the average annual water consumption for households of two adults and two children is 273kL, compared with 369kL for households of four adults. Similarly, the average annual consumption for households with two adults and three children is 324kL, compared with 421kL for households of five adults. In addition, within households with children, the age of the children also affects water consumption. The survey defined young families as having mostly pre-school children, middle families having mostly children aged 6 to 15, and mature families having mostly children over 15 years old. It found that the average water consumption of young families was 260kL per annum, compared with 325kL and 329kL for middle and mature families respectively. This finding is consistent with the Tribunal’s 1993 survey. Factors contributing to the lower consumption of young families may include that these families have lower average household size, and that pre-school children often share baths and/or use less water for bathing. We also looked at the per capita water consumption of households with different compositions. Our findings suggest that households comprising adults and children achieve economies of scale compared to other household types. Single-person households had the highest per capita consumption (128kL per annum), followed by couples with no children (113kL per annum), then single-parent families (90kL per annum), and finally two-parent families (84kL per annum). Two-parent families make up almost half the total households in Sydney Water’s area of operation (Figure 2.4).
1-2 people 17%
3-4 people 36%
5 or more people 47%

Profile of residential water users in Sydney, Blue Mountains and Illawarra
9
Figure 2.4 Proportion of households, by household composition
2.1.2 Households that live in houses use more water than those in units
The 2003 survey found that, on average, households that live in houses—including separate houses, combined dwellings/non-dwellings, semi-detached houses, and townhouses—use more water than those that live in units (292kL and 169kL per annum respectively, Figure 2.5). In addition, most high water users11 (93 per cent) live in separate houses (see Box 2.1). It seems likely that the main reasons for these findings are that households in units tend to be smaller (with an average of two people per household compared to three people in houses), and either do not have or are not responsible for maintaining grounds, gardens or swimming pools. These findings are consistent with those of the 1993 survey, which also found that households that live in houses use more water on average than those that live in units, and that the average household size was two people for units, and three for houses. The 1993 survey also found that 97 per cent of high water users lived in houses. When we compared the per capita water consumption of households living in houses and units, we found that water use is higher for people living in houses than for those living in units. One explanation for this may be that households in houses have more opportunities for outdoor water use, such as for gardening and swimming pools.
11 That is, those who use 500kL or more per year.
Single person 18%
Single parent family 9%
Two-parent family 49%
Couple no children 24%

Independent Pricing and Regulatory Tribunal
10
Figure 2.5 Average annual water consumption by dwelling type
Hou
se
Com
bine
d dw
ellin
g
Sem
i or t
own
hous
e
Low
ris
e un
its
Uni
ts 3
or
mor
e st
orey
s
Dwelling type
0
100
200
300
Ann
ual w
ater
con
sum
ptio
n (k
L)
304318
211192
148
Figure 2.6 Proportion of households by dwelling type
For households that live in houses, we also compared the average water consumption of those on small, medium and large blocks of land.12 This comparison suggests that land size is positively related to water consumption. On average, households that live in houses on small blocks of land used 62kL less water per annum than those on large blocks of land. This trend was also evident in the 1993 household survey.
12 Small was defined as less than 500 square metres, medium as 500 to 900 square metres, and large as more
than 900 square metres.
House79%
Combined dwelling
1%
Semi or town house 14%
Low rise units 3%
Units 3 or more storeys 3%

Profile of residential water users in Sydney, Blue Mountains and Illawarra
11
When we looked at high water users in houses, we found that the bulk of these users (68 per cent) live on medium-sized blocks of land (consistent with the proportion of medium size blocks in all of Sydney Water’s area of operation, see Box 2.1) while only 18 per cent live on large blocks. This means that while, on average, households with large blocks of land consume more water than those with medium blocks, most of the high water users (consuming over 500kL per annum) have medium-sized blocks.
Figure 2.7 Average annual water consumption for houses by land size and average household size
Small Medium Large
Land size
0
100
200
300
Ann
ual w
ater
con
sum
ptio
n (k
L) 266
310328
2.1.3 Households that rent public housing use more water than private
renters and owners
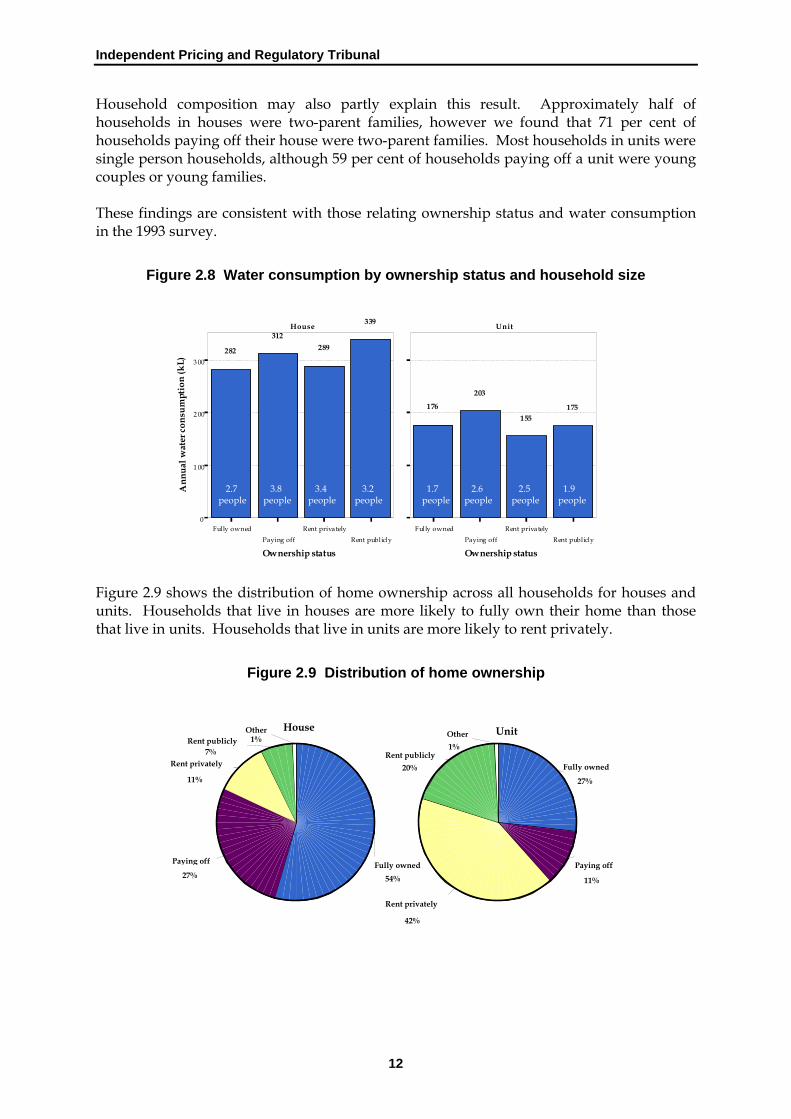
The 2003 survey found that there is a clear relationship between a household’s home ownership status and its water use. On average, households that rent public housing consume more water than households in other ownership categories. Of those that live in houses, households that rent public housing use an average of 50kL more water per annum than those that rent private housing, and an average of 27kL more per annum than households paying off their own homes (Figure 2.8). They also have a smaller average household size than both these groups, and higher consumption per capita. In addition, households that rent public housing represent 8 per cent of high water users, but only 5 per cent of the general population. Households that are paying off their own house also use more water on average than those that rent private housing or own their own home. Among households living in units, they also use more than those who rent public housing (Figure 2.8). This is likely to be at least partly explained by the higher average household sizes in this group. Of households living in houses, the average household size for those paying off their home is 3.8 people, compared with 2.7 for those that own their home and 3.4 for those that rent private housing. Of those living in units, the average household size for those paying off their home is 2.6 people, compared with 1.7 for those that own their home, 2.5 for those that rent private housing, and 1.9 for those that rent public housing.
2.9 people 3.2 people 3.1 people
Independent Pricing and Regulatory Tribunal
12
Household composition may also partly explain this result. Approximately half of households in houses were two-parent families, however we found that 71 per cent of households paying off their house were two-parent families. Most households in units were single person households, although 59 per cent of households paying off a unit were young couples or young families. These findings are consistent with those relating ownership status and water consumption in the 1993 survey.
Figure 2.8 Water consumption by ownership status and household size
Fully owned
Paying off
Rent privately
Rent publicly
Ownership status
0
1 00
2 00
3 00
Ann
ual w
ater
con
sum
ptio
n (k
L)
282
312289
339House Unit
Fully owned
Paying off
Rent privately
Rent publicly
Ownership status
176
203
155175
Figure 2.9 shows the distribution of home ownership across all households for houses and units. Households that live in houses are more likely to fully own their home than those that live in units. Households that live in units are more likely to rent privately.
Figure 2.9 Distribution of home ownership
2.7 3.8 3.4 3.2 people people people people
Fully owned
54% Paying off
27%
Rent privately
11%
Rent publicly7%
Other 1%
House Unit
Fully owned 27%
Paying off 11%
Rent privately
42%
Rent publicly20%
Other 1%
1.7 2.6 2.5 1.9 people people people people

Profile of residential water users in Sydney, Blue Mountains and Illawarra
13
2.1.4 Households in the Illawarra use less water than those in the Blue Mountains and Sydney
The 2003 survey found that average household water consumption varies across the Sydney, Blue Mountains and Illawarra regions (Figure 2.10). On average, households in the Illawarra use almost 17 per cent less water than those in Sydney, and 15 per cent less than those in the Blue Mountains. These regional differences may reflect differences in the climatic conditions of the regions, such as average rainfall and number of rainy days (Table 2.1). They might also reflect differences in underlying demographic characteristics, such as average household size.
Figure 2.10 Water consumption by region
Sydney Blue Mountains Illawarra
Region
50
100
150
200
250
Ann
ual w
ater
con
sum
ptio
n (k
L)
252 246
210
Table 2.1 Climatic conditions
Mean annual daily max temp (deg C)
Mean annual rainfall (mm)
Mean annual number of raindays
Sydney city 21.6 1219.8 138.2
Parramatta 23.1 974.5 120.7
Katoomba (Blue Mountains) 16.6 1402.3 131.4
Wollongong (Illawarra) 21.7 1354.5 137.2
Source: Commonwealth Bureau of Meteorology Climatic Averages up to 2003 for Sydney (Observatory Hill), Parramatta North (Mason’s Drive), Katoomba (Narrow Neck Rd) and Wollongong University.

Independent Pricing and Regulatory Tribunal
14
2.2 What do households use water for?
The purposes for which households use water can influence their overall water consumption. Household water use is commonly divided into discretionary and non-discretionary consumption. Non-discretionary consumption includes the use of water to meet basic health and hygiene needs—such as drinking, cooking, bathing, house cleaning, clothes washing, and toilet flushing. Discretionary water consumption includes the use of water for purposes other than meeting basic needs. Most of this consumption is due to outdoor water use—for example, watering lawns and gardens, washing cars, filling up swimming pools, and cleaning outdoor areas—but it can also include indoor use that exceeds what is necessary to meet basic needs, such as having long showers and filling large spas. Discretionary consumption is thought to fluctuate, depending upon a range of factors such as the seasons, weather conditions, household income and whether water restrictions are in place. To understand the impact of how households use water on their overall water consumption, we asked survey participants how many indoor water-using amenities they have, whether they own a swimming pool, if and how much they water their garden, and what other outdoor purposes they use water for. When we compared high water users and low water users, we found that high water users tend to have a higher average number of indoor amenities, and are more likely to own a pool, water the garden for more than an hour a week in summer, wash their car and wash footpaths and driveways than all households in Sydney Water’s area of operation. In contrast, low water users tend to have fewer indoor amenities, and are less likely to own a pool, water the garden in summer, wash their car and wash footpaths and driveways than all households (see Box 2.2).
Box 2.2 Snapshot of high and low water users
Low water users (< 100kL per annum) High water users (> 500kL per annum) Have an average of 4 indoor, water-using amenities (compared to an average of 5 among all households in Sydney Water’s area of operation )
Have an average 6 indoor water-using amenities (compared to an average of 5 among all households in Sydney Water’s area of operation)
2% have swimming pools (compared to 11% of all households)
38% have swimming pools (compared to 11% of all households)
45% of households with a garden water the garden for more than 1 hour per week in summer (compared to 62% of all households)
66% of households with a garden water the garden for more than 1 hour per week in summer (compared to 62% of all households)
23% wash their car (compared to 49% of all households)
66% wash their car (compared to 49% of all households)
5% wash footpaths/driveway (compared to 8% of all households)
17% wash footpaths/driveway (compared to 8% of all households)

Profile of residential water users in Sydney, Blue Mountains and Illawarra
15
When we looked at the data more closely, our key findings were as follows: • In relation to indoor water use, households that have more water-using amenities use
more water on average than those with fewer amenities. In addition, the number of amenities appears to increase as household income increases. Further, in households with higher incomes, it also appears to increase as household size increases.
• In relation to outdoor water use, owning a swimming pool has the largest impact on an individual household’s average water use.
2.2.1 Households with more water using amenities have higher average water consumption
A large proportion of a household’s total water consumption is related to its use of indoor water-using amenities—including toilets, showers, baths, spas, dishwashers and washing machines. Although much of the water used by these amenities is non-discretionary, it can be argued that the more amenities a household has, the greater its discretionary indoor water use is likely to be. On the other hand, the use of these amenities is also related to the number of people in the household. For example, a single person living in a house with two toilets is not likely to make as much use of these amenities as a six-person family living in a house with two toilets. The 2003 survey found that average household water consumption increases with the number of indoor amenities13 the household has (Figure 2.11). For example, households with between three and four amenities used an average 187kL per annum, whereas those with seven or more amenities used an average of 392kL per annum. When we looked at the high water users, we found that over a third of this group have seven or more indoor amenities. This is significantly more than the average number of amenities for all households in Sydney Water’s area of operation, which is five.14 However, almost half the high users (46 per cent) have between five and six indoor amenities, which is only slightly more than the average. This suggests that while the number of indoor amenities has some influence on total water demand, it is not a strong, underlying driver of this demand.
13 We calculated the number of indoor amenities based how many toilets were in the household, plus
whether there was a shower, a bath, a spa, a dishwasher, or a washing machine in the household. For example, a household with two toilets, a washing machine, and a shower would have four indoor amenities.
14 In the general population, the average number of toilets per household is almost two. Almost 100 per cent of households have showers, 95 per cent have washing machines and 34 per cent have dishwashers (see Table A1.1, Appendix 1).

Independent Pricing and Regulatory Tribunal
16
Figure 2.11 Water consumption by indoor amenities
1-2 3-4 5-6 7 or more
Indoor amenities
100
200
300
400
Ann
ual w
ater
con
sum
ptio
n (k
L)
111
187
285
392
We also looked at the relationship between the number of amenities in a household and household income and size (Figure 2.12). We found that as household income rises, the average number of indoor amenities also rises, for all household sizes. However, we also found that, for households with higher incomes, as the average number of amenities increases, so does household size. This suggests that the impact of the number of indoor amenities on water consumption is partly driven by household size.
Figure 2.12 Indoor amenities by household size and income
less than $31,200 $31,201-$52,000 $52,001-$104,000 more than $104,000
Annual household income
1-2 people 3-4 people 5 or more people
Household size
0.0
2.0
4.0
6.0
Indo
or a
men
itie
s 4.2
4.8 4.75.0
4.64.8
5.6 6.2
4.7 5.1
5.8
6.5
Profile of residential water users in Sydney, Blue Mountains and Illawarra
17
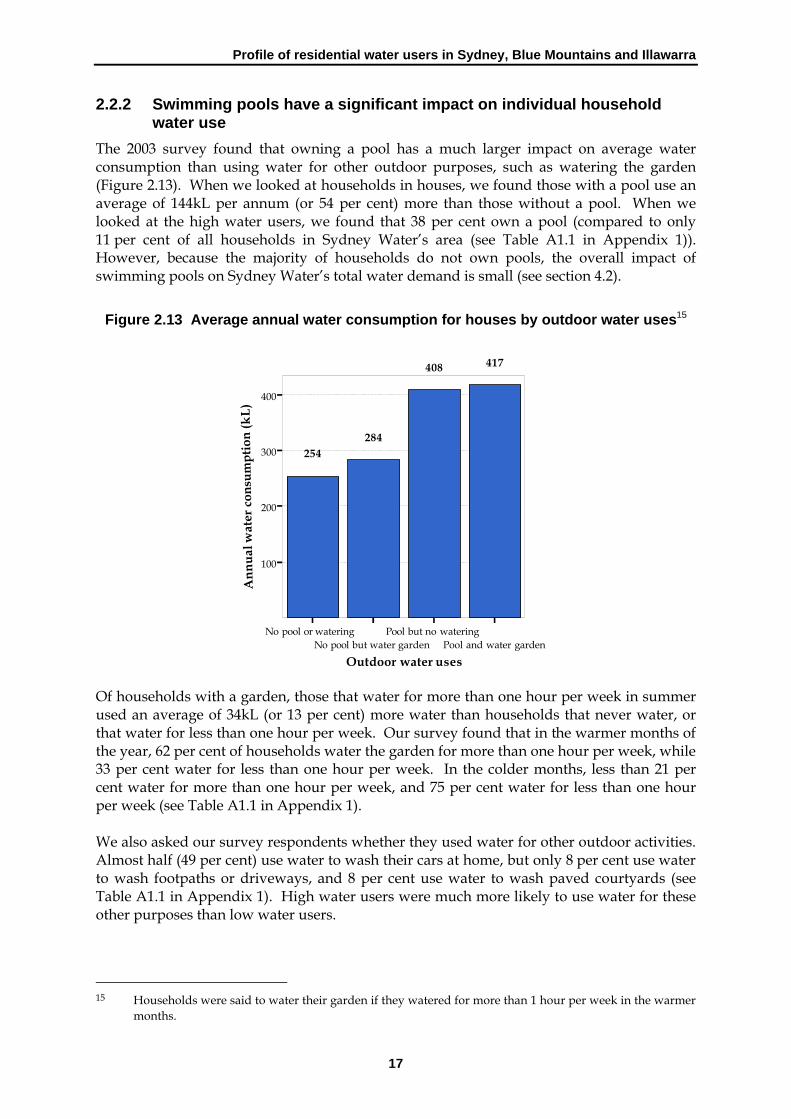
2.2.2 Swimming pools have a significant impact on individual household water use
The 2003 survey found that owning a pool has a much larger impact on average water consumption than using water for other outdoor purposes, such as watering the garden (Figure 2.13). When we looked at households in houses, we found those with a pool use an average of 144kL per annum (or 54 per cent) more than those without a pool. When we looked at the high water users, we found that 38 per cent own a pool (compared to only 11 per cent of all households in Sydney Water’s area (see Table A1.1 in Appendix 1)). However, because the majority of households do not own pools, the overall impact of swimming pools on Sydney Water’s total water demand is small (see section 4.2).
Figure 2.13 Average annual water consumption for houses by outdoor water uses15
No pool or wateringNo pool but water garden
Pool but no wateringPool and water garden
Outdoor water uses
100
200
300
400
Ann
ual w
ater
con
sum
ptio
n (k
L)
254284
408 417
Of households with a garden, those that water for more than one hour per week in summer used an average of 34kL (or 13 per cent) more water than households that never water, or that water for less than one hour per week. Our survey found that in the warmer months of the year, 62 per cent of households water the garden for more than one hour per week, while 33 per cent water for less than one hour per week. In the colder months, less than 21 per cent water for more than one hour per week, and 75 per cent water for less than one hour per week (see Table A1.1 in Appendix 1). We also asked our survey respondents whether they used water for other outdoor activities. Almost half (49 per cent) use water to wash their cars at home, but only 8 per cent use water to wash footpaths or driveways, and 8 per cent use water to wash paved courtyards (see Table A1.1 in Appendix 1). High water users were much more likely to use water for these other purposes than low water users.
15 Households were said to water their garden if they watered for more than 1 hour per week in the warmer
months.

Independent Pricing and Regulatory Tribunal
18
2.3 What is the relationship between income and water use? A household’s income can influence its annual water use, and also affects its ability to pay for water. We have looked closely at the relationship between household income and water use, and at the average water use of concession card holders—customers who are already recognised as being less able to pay for water. We have also considered how the survey data could be used to identify other customer groups who are potentially vulnerable to water price changes. These issues are particularly important, as the Tribunal is required to consider the potential economic and social impacts of its decisions on customers, particularly low-income customers. Our key findings are as follows: • In general, high-income households consume more water than low-income
households. This can be partly explained by the fact that high-income households are more likely to possess a number of other characteristics associated with higher water consumption.
• However, there is considerable variability in consumption within income groups, and a sizable proportion of high water users are low-income households. The number of people in a household and whether or not a household possesses a particular characteristic has a greater impact on consumption than its income level alone.
• Households that have concession cards tend to use less water than those that do not. Of these households, 78 per cent are aware that they can claim concessions for water charges.
• The survey findings can be used to identify customer groups that are potentially vulnerable to price changes. For instance, 4 per cent of households consume more than 300kL of water, earn less than $52,000 and have five or more people residing in the household.
Please note that, based on the income ranges stipulated in the survey, low-income households are defined as those earning less than $31,200 per annum and high-income households as those earning more than $104,000 per annum.
2.3.1 High-income households generally use more water
The 2003 survey found that water consumption tends to increase as household income increases. The average annual water consumption for high-income households is 40 per cent higher than the average consumption for low-income households (Figure 2.14).

Profile of residential water users in Sydney, Blue Mountains and Illawarra
19
Figure 2.14 Average annual water consumption by household income
less than $31,200$31,201-$52,000
$52,001-$104,000more than $104,000
Annual household income
0
100
200
300
Ann
ual w
ater
con
sum
ptio
n (k
L)
237
279
308332
In part, this finding can be explained by the fact that high-income households tend to have other characteristics that we found to be associated with higher water use. These characteristics include having larger households, living in a house rather than a unit, having more indoor water-using amenities, owning a pool, and spending more than one hour per week watering the garden in the summer months (Box 2.3).

Independent Pricing and Regulatory Tribunal
20
Box 2.3 Typical characteristics of low- and high- income households
Low Income High Income
Lower than average water consumption (237kL) Higher than average water consumption (332kL)
Live in unitsa (11% compared to 5% high-income households)
Live in housesb (95% compared to 89% for low-income households)
Renting (Private or Public) (35% compared to 13% high-income households)
Own or are paying off home (87% compared to 64% low-income households)
Less than one person working full time More than one person working full time
Average 2-3 people per household Average 3-4 people per household
Single people (42% compared to 13% for high-income households)
Couples with young, middle or mature families (72% compared to 34% for low-income households)
Have a concession card (70% compared to 3% for high-income households)
Don’t have a concession card (3% compared to 70% for low-income households)
Have lower than average number of water-using indoor amenities (less than 5 compared to over 6 for high-income households)
More likely to have indoor water consuming amenities (over 6 compared to less than 5 for low-income households)
Less likely to have a pool (5% compared to 23% for high-income households)
More likely to have a pool (23% compared to 5% for low-income households)
Less likely to water the garden during the warmer months for more than one hour per week, for households with gardens (42% don’t water compared to 30% for high-income households)
More likely to water the garden during the warmer months for more than one hour per week, for households with gardens (30% don’t water compared to 42% for low-income households)
Less likely to use water for outdoor activities such as washing the footpath/driveway/roof/car.
More likely to use water for outdoor activities such as washing the footpath/driveway/roof/car.
Notes: a Units include granny flats, low rise units and 3 storey units and high rise units (four or more storeys). b House include separate houses, dwelling/non-dwelling combined (for example shop houses) and semi-
detached/terrace/house/villa unit/town house/duplex.
2.3.2 Consumption within income groups is variable, and household size and other characteristics have a greater impact than income alone
The 2003 survey also found that the distribution of consumption within income groups is highly variable, and not all high-consumption households have a high income (Figure 2.15). For example, around 33 per cent of low-income households consume more than the average of 250kL per annum, while the same proportion of high-income households consume less than this average.

Profile of residential water users in Sydney, Blue Mountains and Illawarra
21
Figure 2.15 Annual water consumption distribution by income
0
2
4
6
8
10
12
14
16
18
0-50 k
L
51-100
kL
101-15
0 kL
151-20
0 kL
201-25
0 kL
251-30
0 kL
301-35
0 kL
351-40
0 kL
401-45
0 kL
451-50
0 kL
501-55
0 kL
551-60
0 kL
601-65
0 kL
651-70
0 kL
701-75
0 kL
751-80
0 kL
801-85
0 kL
851-90
0 kL
901 or
more
kL
Consumption Group
%
less than $31,200 $31,201-$52,000 $52,001-$104,000 more than $104,000
To further understand the relationship between income and water use, we looked more closely at the high water users (households that use more than 500kL per annum) and their household incomes. We found that these households are spread fairly evenly across all income groups (Table 2.2). While the largest proportion earn between $52,001 and $104,000 per year, almost one-fifth earn less than $31,200.
Table 2.2 Income distribution for households consuming more than 500kL per annum
Income Group Proportion of income group
(%)
Less than $31,200 17
$31,201 - $52,000 14
$52,001 - $104,000 36
More than $104,000 19
This suggests that other household characteristics are more significant than household income in influencing water use. To identify what those other characteristics are, we compared the characteristics of low-income, high-consumption households and high-income, high-consumption households with all low-income and high-income households (Table 2.3).

Independent Pricing and Regulatory Tribunal
22
Table 2.3 Water use characteristics of high and low income households consuming more than 500kL per annum
Characteristic High consumption
households (> 500kL) All households
Low Income
%
High Income
%
Low Income
%
High Income
%
1-2 28 - 66 28 3-4 26 62 24 51 5-6 32 - 8 21
No. People in Household
> 6 14 - 2 1
Fully owned 24 69 55 48 Paying off - 28 9 39
Ownership status
Renting – Private - 3 13 13 Renting – Public 55 0 22 0 Proportion of households who pay for water usage 44 97 68 90 Proportion of households with a pool 4 52 5 23 Proportion of households with a dishwasher 25 83 19 70
< 1 hr 46 19 39 26
= 1 hr 48 70 58 70 Number of hours spent watering the garden during the warmer months for houses with gardens
Do not know/Unsure - - 3 -
Note: A dash indicates that there was insufficient sample size to provide a reliable estimate. First, for both high- and low-income groups, we found that there is a much higher proportion of large households in the high-consumption group than there is across all households in Sydney Water’s area of operations. For the low-income group, 72 per cent of high-consumption households comprise three or more people, compared to only 34 per cent of all low-income households surveyed. For the high-income group, 97 per cent of high-consumption households comprise three or more people, compared to 73 per cent for high-income households in general. Second, we found that for the low-income group, the high-consumption households were much more likely to rent public housing than low-income households in general—55 per cent of high water users rent public housing compared to 22 per cent of all low-income households. The high water users were also much less likely pay water usage charges directly—only 44 per cent of low-income, high-consumption households paid water usage charges themselves,16 compared to 68 per cent of all low-income households, and 90 per cent of all high-income households.
16 These include people in units with an individual meter and renters in individually metered properties for
whom the landlord did not pass on the water usage bill.

Profile of residential water users in Sydney, Blue Mountains and Illawarra
23
For the high-income group, the picture is quite different. The high water users were more likely to fully own their homes than high-income households in general—69 per cent own their home outright, compared with 48 per cent of all high-income households. And in contrast to low-income, high-consumption households, they were more likely to pay usage charges directly. The characteristics that seem to distinguish high-consumption, high-income households from high-income households in general and from low-income, high-consumption households are related to how they use water. The high-income water users were more likely to have a higher than average number of indoor water-using amenities and to own a swimming pool than all high-income households and low-income households. For example, 52 per cent of high-income high water users own a pool, compared to 23 per cent of all high-income households and 4 to 5 per cent of low-income households. These findings suggest that while there is a positive relationship between income and water consumption, income does not appear to be a major underlying driver of consumption.
2.3.3 Concession card holders use less water than other consumers
Sydney Water provides government-funded rebates to assist pensioners and low-income households. To identify households that currently claim or are eligible to claim this rebate, we asked survey participants if they held any concession cards, and if so, what type. Twenty-nine per cent held a concession card that entitled them to a rebate. Most of these held only a Pensioner Concession Card (89 per cent). The remainder held only a Veterans’ Affairs Gold Health Card (8 per cent) or were unsure what their concession card was called (3 per cent).17 When we compared the consumption levels of these households to all households in the survey area, we found that on average, those that held a concession card consume less water. For households living in houses, those that had a concession card used approximately 13 per cent less than those that did not. For households living in units, those that had a concession card used around 16 per cent less.
17 Less than 1 per cent possessed both a Pensioner Concession Card and a Veterans’ Affairs Gold Health
Card.

Independent Pricing and Regulatory Tribunal
24
Figure 2.16 Average annual water consumption for concession card holders compared with non-concession card holders
NoYes
Concession card holder
House Unit
Dwelling Type
0
100
200
300
Ann
ual w
ater
con
sum
ptio
n (k
L)
297
258
201
169
This finding may be partly explained by differences in other household characteristics. For instance, on average, households that had a concession card comprised fewer people than other households. Of households living in houses, those that had a concession card had an average of 2.5 people compared with 3.3 for those that did not. Of households in units, those that had a concession card had an average of 1.6 people compared to 2.5 people for those that did not. Households with a concession card were also more likely to be in the low-income category (Figure 2.17). For example, 67 per cent of households that had a concession card earned less than $31,200 per year, compared with 12 per cent of those that did not.
3.3 2.5 2.5 1.6 people people people people

Profile of residential water users in Sydney, Blue Mountains and Illawarra
25
Figure 2.17 Income distribution by concession card holders
We also asked households with a concession card if they were aware that they could claim a rebate on their water bill, and whether they did so. Seventy-seven per cent said they were aware that they could (Figure 2.18). Of those households that were aware, 84 per cent said they did claim a rebate (Figure 2.19).
Figure 2.18 Awareness of concession card holders to claim concessions for water bill
NoYes
Holder of concession?
less than $31,200 $31,201-$52,000
$52,001-$104,000 more than $104,000
Annual household income
0
20
40
60
Prop
orti
on o
f ho
useh
olds
%
12
67
20
13
38
7
19
1
Yes
No
Unsure 10%
77%
13%

Independent Pricing and Regulatory Tribunal
26
Figure 2.19 Proportion of aware households who actually claim concession
2.3.4 Survey data can be used to identify vulnerable groups
One of the issues the Tribunal must take into account when making decisions about water pricing is the economic and social impacts on customers of these decisions. To do this, it needs to identify which customers are likely to be vulnerable to price increases and/or changes in the price structure. For example, the Tribunal is currently undertaking a section 12 review of Sydney Water’s price structure, to determine whether changes to the current structure could help reduce the demand for water in the Sydney Basin. As part of this review, it is considering nine alternative price structure scenarios. Six of these scenarios involve an ‘inclining-block tariff’, where customers pay a lower usage charge for each litre of water used up to a certain quantity (known as the step quantity), and a higher charge for each litre used in addition to that quantity.18 To assess the social impact of these potential changes, the Tribunal will need to consider which households are most vulnerable to price changes, and the extent of this vulnerability within Sydney Water’s area of operation. The 2003 household survey can contribute to this analysis. We collected information on a number of characteristics that are useful in identifying whether a household may be particularly affected by price structure changes—such as the household’s income, whether any member held a concession card that entitled the household to a rebate on water charges, and whether any member had health problems that necessitate greater water consumption. In addition, our findings about the household characteristics associated with high water consumption, and the underlying drivers of this consumption can also help to identify potentially vulnerable households.
18 For a detailed explanation of these price structures refer to IPART, Investigation into Price Structures to
Reduce the Demand for Water in the Sydney Basin - Issues Paper, December 2003, available from www.ipart.nsw.gov.au.
Yes
No Unsure
84%
13%
3%

Profile of residential water users in Sydney, Blue Mountains and Illawarra
27
For example, our findings suggest that households with all the following characteristics could be considered vulnerable to price changes, such as the introduction of inclining block tariffs:19 • high levels of water consumption
• low household income
• five or more members (and so are least likely to be able to reduce their level of consumption below a certain volume).
For the purposes of illustration, we have used the survey data to determine the proportion of households that meet these criteria, for a range of consumption and income levels (Table 2.4).
Table 2.4 Cumulative proportions of households with five or more members in the Sydney Basin
Annual household income
Consumption Less than $20,800
Less than $31,200
Less than $41,600
Less than $52,000
0.3% 0.6% 1.0% 1.4% > 500kL 5,273 9,864 15,278 20,621
0.5% 1.1% 1.6% 2.4% > 400kL 7,867 16,667 25,018 36,377
0.9% 2.0% 3.0% 4.2% > 300kL 14,438 30,424 45,179 63,544
Note: Figures in italics are population estimates for each category. For example, if the step quantity was set at 300kL per annum, and ‘low income’ was defined as less than $52,000 per year, the 2003 survey indicates that 4.2 per cent or approximately 63,544 households in Sydney, the Blue Mountains and the Illawarra are likely to be adversely affected. We also determined the proportion of households that meet these criteria and currently pay water usage charges directly (Table 2.5). Using the same step quantity and income definitions as above, the survey indicates that 2.9 per cent or around 44,615 households are likely to be adversely affected.
19 Alternative definitions of vulnerable groups could also be considered. These results are for illustrative
purposes only and do not represent the Tribunal’s view as to the vulnerability of certain customer groups.

Independent Pricing and Regulatory Tribunal
28
Table 2.5 Cumulative proportions of households with five or more members that pay usage charges in the Sydney Basin
Household Income
Consumption Less than $20,800
Less than $31,200
Less than $41,600
Less than $52,000
- 0.3% 0.5% 0.9% > 500kL - 4,125 8,336 13,077
- 0.6% 1.1% 1.7% > 400kL - 9,481 16,629 26,163
0.4% 1.1% 1.9% 2.9% > 300kL 6,357 17,369 29,258 44,615
Note: Figures in italics are population estimates for each category. A dash indicates that there was insufficient sample size to produce a reliable estimate.
Tables 2.4 and 2.5 illustrate the type of analysis that can be conducted to consider the social impact of changes in price structures. Other criteria can be used to define vulnerability.
2.4 Does paying water usage charges influence water use? In general, households that live in a house that they own or are paying off pay water usage charges directly to Sydney Water. However, for other household groups, this is often not the case: • Those that rent public housing dwellings do not pay water usage charges. The usage
charges measured against their premises—either through individual meters or, in the case of some units, bulk meters—are paid by the Department of Housing.
• Those that live in a privately rented house may or may not pay water usage charges, depending on the conditions of their rental agreement with the owner. If they are required to pay for their usage, they may pay Sydney Water directly or the owner of the dwelling.
• Those that live in a privately rented unit may or may not pay for their water usage, again depending on their rental agreement. In addition, if they do pay for these charges, they may not be based on their actual usage, because most units are not individually metered. Many blocks have a bulk meter for the entire block, or series of meters that measure the consumption for a number of units.
• Households that live in a unit they own or are paying off only pay for their usage charges directly if their unit is individually metered. If usage is measured via a bulk meter for the entire block, they usually pay a pro-rated amount based on the total consumption and number of units in the block, or the strata company pays the usage component from strata levies.

Profile of residential water users in Sydney, Blue Mountains and Illawarra
29
We looked at the number and typical characteristics of households that do not pay for usage charges, as the Tribunal needs to take them into account when considering alternative price structures to reduce water demand. This is important, because the fact that they do not pay water usage charges, or pay them indirectly, has the potential to dilute the price signal these usage charges are intended to send to customers. Our key findings are as follows: • around 40 per cent of households do not pay their water usage charges
• households that live in houses and do not receive a water usage bill use 4 per cent more water on average than those that do.
2.4.1 40 per cent of households do not pay water usage charges
The 2003 survey found that around 40 per cent of households do not pay for their water usage charges. This proportion includes households living in a unit where usage is measured via a bulk meter and so pay a pro-rated amount based on the total consumption and number of units in the block.
Figure 2.20 Proportion of households who pay for water usage
When we compared payment of usage charges and household income, we found that the proportion of households that do not pay these charges decreases as household income increases (Figure 2.21). This is likely to be because people on higher incomes are more likely to live in a house that they own, while those on lower incomes are more likely to rent privately or live in public housing.
Pays
60%
Does not pay 40%

Independent Pricing and Regulatory Tribunal
30
Figure 2.21 Proportion of households paying water usage charges by income group
PaysDoes not pay
Water usage charge
less than $31,200$31,201-$52,000
$52,001-$104,000more than $104,000
Annual household income
0
25
50
75
Prop
orti
on o
f ho
useh
olds
%
4852
61
39
74
26
70
30
2.4.2 Households that live in houses and do not receive a water usage bill
consume more water than those that do
On average, households that live in houses and do not receive a water usage bill consume more than those that do. Figure 2.22 shows that on average, those that do not pay their usage charges consume 4 per cent more than those that do. However, once differences in other factors which influence water use are also taken into consideration between the two groups, then this difference becomes more clear, (see Chapter 4).
Figure 2.22 Average annual water consumption for houses by payment of usage charge
Pays Does not pay
Water usage charge
0
100
200
300
Ann
ual w
ater
con
sum
ptio
n (k
L)
279290

Attitudes to water restrictions, reducing water consumption and service quality
31
3 ATTITUDES TO WATER RESTRICTIONS, REDUCING WATER CONSUMPTION AND SERVICE QUALITY
In addition to asking survey participants about their household characteristics and patterns of water use, we also asked a series of attitudinal questions to gain a better understanding of Sydney Water’s customers’ views on water restrictions, their ability to reduce their own water consumption and the water service factors they considered most important. Our findings suggest that: • Customers appear to be surprisingly willing to accept more frequent water
restrictions—most households said they would accept mandatory water restrictions once every year.
• However, most households believed that they could not easily reduce the amount of water they currently use.
• When considering the importance of different aspects of their water service, most households believed that water quality is the most important, followed by the overall cost of the service and continuity of supply.
3.1 Customers appear willing to accept more frequent water restrictions
As noted in the introduction to this report, Sydney’s total water consumption has exceeded the sustainable yield from its water supply several times in the last 20 years. With the current drought, and the steady growth in Sydney’s population, there is increasing pressure on Sydney Water and the Sydney Catchment Authority to reduce Sydney’s water demand. However, what is known as ‘the sustainable yield’ from the Catchment Authority’s storages depends partly on perceived attitudes to mandatory water restrictions. This yield is calculated using information on expected water demand and inflows to the supply catchment, using a set of criteria for reliability of supply. These criteria reflect views about how often it is acceptable to impose mandatory water restrictions. The current sustainable yield of 600GL per annum is calculated using a reliability criterion of 97 per cent, which implies that mandatory water restrictions should not be required more often than three times every 100 years. The findings of the 2003 household survey suggest that this criterion may be much higher than necessary. We asked survey participants how often they would be willing to have mandatory water restrictions to maintain dams at a reasonable level. Sixty-three per cent of respondents were willing to have these restrictions once every year (Table 3.1). Around 11 per cent were willing to have water restrictions every two or more years. Only around 9 per cent were never willing to accept water restrictions. There was not a significant difference between the findings for households living in houses and for households living in units—even though you might expect those living in houses to be less willing to have more frequent water restrictions, as they are more likely to be affected by restrictions that target garden watering.

Independent Pricing and Regulatory Tribunal
32
Table 3.1 Proportion of households willing to have water restrictions
House Semi or
town house Units All
Households
All the time % 2.0 15.5 2.6 33.0 1.5 57.5 2.0 13.6
Whenever necessary or required % 10.3 6.5 12.8 13.9 5.4 29.4 10.2 5.8
Once every year % 62.5 1.7 63.1 4.1 69.3 4.7 63.1 1.5
Once every two years or more % 11.6 6.1 6.8 19.7 11.2 19.7 10.9 5.6
Never % 9.2 7.0 6.5 20.2 10.2 20.7 8.9 6.3
Other % 4.4 10.2 8.2 17.8 2.4 44.3 4.8 8.7
Note: Figures in italics represent relative standard errors of the estimates. On face value, these findings suggest customers are surprisingly willing to accept frequent mandatory water restrictions. However, they should be considered in the context of the timing of the survey. Respondents were surveyed during a period of low rainfall, when voluntary water restrictions were in place. Thus, there was considerable public discussion of Sydney’s water supply and demand imbalance at that time. In addition, mandatory water restrictions had not been imposed since 1994, so many respondents may not have experienced the reality of these restrictions and may not have understood their full implications.
3.2 Most customers believe they could not easily reduce their own water consumption
To reduce Sydney’s overall residential water demand, households need to believe that they can reduce their own water consumption, and understand how they can do so. The 2003 survey found that more than 67 per cent of households believe that they cannot easily reduce their current water consumption (Table 3.2).
Table 3.2 Proportion of respondents that believe they can easily reduce water use
House Semi or
town house Units Total
Easily % 33.2 3.1 30.7 8.0 30.2 10.6 32.6 2.8
Not easily % 66.8 1.6 69.3 3.6 69.8 4.6 67.4 1.4
Note: Figures in italics are relative standard errors of the estimates. When we compared households living in houses with those living in units, we found little difference in their beliefs. This might suggest that there is as much scope for reducing water use in units as there is in houses, perhaps through the greater adoption of water saving appliances such as water efficient showerheads, dishwashers and washing machines. However, those living in houses are likely to have greater potential to reduce water, as they are more likely to be able to reduce their outdoor water use, for example by changing their garden-watering practices.

Attitudes to water restrictions, reducing water consumption and service quality
33
When we compared households with different levels of water consumption, we found that the proportion of households that believed they could easily reduce their water use increased as their average water consumption increased (Figure 3.1). For example, 25 per cent of households using less than 200kL per year believed they could easily reduce their consumption, compared with more than 44 per cent of those using greater than 500kL per year. This suggests that there is greater scope for water saving among higher water users.
Figure 3.1 Proportion of respondents who believed they could easily reduce water use by water consumption
YesNo
Could you easily reduce water
0-200kL201-300kL
301-400kL401-500kL
More than 500kL
Average annual water consumption
0
25
50
75
Prop
orti
on o
f po
pula
tion
%
25
75
44
56
There are several possible reasons why so many households believe they cannot easily reduce their water use. For example, it may be that they have already undertaken water efficiency measures, or that they do not know what measures to take to reduce their use, or that they know what to do but believe these measures are too difficult. Our findings do not shed any light on this issue. However, they do suggest that continued public education and other strategies designed to make it easier for households to reduce their discretionary water consumption are required.
3.3 What water service factors are important to customers? In making decisions about the pricing of water services, the Tribunal needs to consider the implications of these decisions for the quality of the service customers receive, and which aspects of that service they are most concerned about. For this reason, we asked survey respondents to rank eight characteristics of water service, from the most important to the least important.

Independent Pricing and Regulatory Tribunal
34
Most respondents ranked water quality as the most important characteristic, followed by the overall cost of the service and the continuity of supply (Figure 3.2). Most respondents believed the least important factor was flexibility in billing, followed by general customer service.
Figure 3.2 Proportion of respondents ranking service factors most and least important
When we compared the findings for households with different levels of water consumption, we found no significant variation. When we compared households living in houses with those living in units, we found some differences. The most significant was that overall cost was less important for households in units than for those in houses. This may reflect the fact that fewer households living in units pay their water bill directly.
0% 20% 40% 60% 80% 100%
Flexibility of billing
Customer service
Incentives to reduce water use
Environmental management
Water pressure
Continuity of water supply
Overall cost
Water quality
Most important In between Least important

Implications for demand management programs
35
4 IMPLICATIONS FOR DEMAND MANAGEMENT PROGRAMS
Chapter 2 discussed how a range of demographic and other characteristics appear to influence household water use. However, because many of these characteristics are interrelated, it is not clear which ones are driving water use. For example, we found that households with higher average income tend to have higher average water use, and that these households also have a higher average size. So which characteristic has the most impact on water use—household income or size? Understanding the underlying drivers of water use and the relative impact of the different household characteristics and water-use factors is important, when developing demand management programs. To help build this understanding, we developed a statistical model of the relationship between water use and a range of factors. This model enabled us to isolate the contribution of each factor to Sydney’s overall water demand, and estimate the contribution of various indoor water-using amenities and outdoor water-using practices to overall average water use. Our findings are outlined below. Details of the equations we used for these estimates are provided in Appendix 3.
4.1 What factors are the key drivers of household water use? Our analysis indicates the largest and most significant factors influencing a household’s water use are its number of occupants and whether or not it pays its own water usage bill, after controlling for all other factors that might also have an influence. On average, each additional member increases a household’s water use. However, there also appears to be an ‘economy of scale’ effect, in that the average per capita water use in a household decreases as household size increases. For example, on average, a two-person household uses approximately 67 per cent more water than a one-person household, while a three-person household uses 23 per cent more water than a two-person household Our statistical modelling indicates that not receiving a water usage bill increases a household’s water use by approximately 19 per cent. Households that are considered not to pay their water usage bill include those that live in units without separate meters, those living in premises owned by the Department of Housing, and those living in privately rented premises where the landlord does not pass on the water usage component of the bill. We also found that household income has a positive and significant impact on a household’s garden water use, but does not have a large impact on total household water demand. Our analysis indicates that as a household’s income increases from one income category to the next, it uses on average around 29 per cent more garden water (which represents an additional 6 per cent of total average household water use). However, this increased garden water use is offset by reduced water use from other areas as income increases. It is not clear what is driving this offset effect, but it might be due in part to higher income households being more likely to have adopted water saving devices such as water efficient shower heads, or have newer appliances which are in general more water efficient.

Independent Pricing and Regulatory Tribunal
36
This impact is smaller than the impact of income identified by other studies. Part of the reason for this could be we have included the impact of individual water-using amenities specifically in our model. We found that high-income households are more likely to own high-water-using amenities such as swimming pools. The higher impact of income found in other studies could have been masking the contribution of individual amenities to water demand.
4.2 What contribution do various indoor and outdoor water uses make to overall consumption?
We estimated the relative contribution that a range of indoor and outdoor water-using amenities and activities made to Sydney’s total residential water consumption for 2003. These amenities include the additional impact of single flush toilets relative to dual flush toilets, spas, dishwashers, and swimming pools. Our analysis indicates a group of activities that were not specifically included in our model made the largest contribution (Table 4.1). These activities are likely to include showering and bathing, toilet flushing by dual flush toilets, drinking, house cleaning, manual dishwashing and car washing. They accounted for around 66 per cent of the total annual residential water use, or an average of 172kL per household per year.
Table 4.1 Estimated contribution of individual water uses to Sydney’s total household water consumption, 2003
All other water use 66.2%
Garden water use 22.8%
Additional water use associated with single flush toilets 5.0% Dishwasher 3.3% Swimming pool 2.3%
Spa 0.4%
Garden watering appears to have made the next largest contribution. On average, each hour per week a household waters the garden in summer accounts for almost 7kL of water per year. However, this amount increases as land size increases. For example, we estimate that a household living in a house on a large block uses almost 64kL more per annum more than a household living in a unit, whereas a household in a house on a medium block uses 41kL more and a house on small block uses 20kL more. By considering the average number of hours households spent watering gardens in summer and the number of households living in houses on small, medium and large blocks of land, we estimated that the implied contribution of garden watering to total residential water consumption was almost 23 per cent (Table 4.1).

Implications for demand management programs
37
The additional contribution of single flush toilets made the third largest contribution, accounting for nearly 5 per cent of total residential water use. On average, households with single flush toilets use 21kL per year more for toilet flushing than households with dual flush toilets. Of the remaining amenities included in our model, dishwashers made the next largest contribution (over 3 per cent of total residential water use), then swimming pools (accounting for over 2 per cent of total residential water use), and finally spas (accounting for less than half a per cent of total water use).
4.3 What do these findings imply for demand management programs?
While there is little households can do to reduce water consumption that is related simply to the number of people in the household, there may be other opportunities for households to save water. These results indicate that reducing the average consumption of both indoor amenities and outdoor water using practices may result in large potential savings. However focussing on outdoor water use alone may ignore most of the savings potentially available. We estimate that garden water and other outdoor uses accounted for just under one-quarter of total demand for water in 2003. Our results also indicate that there may be potential to achieve water savings by identifying and addressing the underlying reasons causing households who do not receive a water usage bill to use more water compared with households that do. Statistical modelling indicates that the difference in consumption is approximately 19 per cent. It is not clear that the reason behind this apparent difference in water use is simply because the households who do not receive a water usage bill are not receiving a price signal. The difference in water use may also be because the plumbing and fitting infrastructure in rented premises, which are the owners’ responsibility, is poorly maintained or less water efficient. Based on the statistical modelling, we estimate that if an average household that currently does not receive a water usage bill could reduce its water consumption to the same level as the average for the rest of the community, then 19 per cent of its total water use contribution could be saved. Applying this estimate to the average consumption of households that do not receive a water usage bill from the survey data suggests that around 18 GL of water could be saved (Table 4.2).

Independent Pricing and Regulatory Tribunal
38
Table 4.2 Potential water savings if rental properties and units used the same quantity of water as other households20 (GL)
Units (owned and privately rented) 12 Public housing - units 1 - houses 2 Privately rented houses 3 Total 18
This result only considers the potential savings. Any programs designed to realise these savings would need to be evaluated against other alternatives, and the costs and benefits considered as part of a least cost framework. These programs may include for example installing individual meters in units, and encouraging the installation of water saving devices in tenanted properties by landlords, in addition to exploring the passing through of water usage charges to tenants. It is unclear from our work whether the costs of targeting households who do not pay water usage charges may outweigh the benefits. It is also important to consider the potential social impacts and fairness in applying water usage charges to households who currently do not pay those charges, such as adjusting existing rents if tenants were billed for actual water usage.
20 These results were estimated by applying the parameters estimated in the statistical model of the
difference in water use between customers who pay or do not pay their water usage on indoor and outdoor water consumption. The parameters for indoor use were applied only to units and both indoor and outdoor uses were applied to houses. The total potential water savings represent the sum of the potential individual water use savings across the total number of households estimated as not paying water usage charges within each of the housing categories from the survey results.

Appendix 1 Statistical tables
39
APPENDIX 1 STATISTICAL TABLES
Table A1.1 Summary Statistics for IPART Household Survey 2003 - Combined Dwellings by Consumption Note: A dash indicates that there was insufficient samples size to produce a reliable estimate. Numbers in italics are relative standard errors.
Units Dwelling Consumption Category
< 100 kL 101-300 kL 301-500 kL > 500 kL Total
Estimated population No. 187,016 914,689 321,697 99,728 1,523,130
Proportion of households % 12.3 60.1 21.1 6.5 100.0
Sample Size No. 255 1033 506 150 1944
Demographic characteristics Region Sydney % 89.2 2.3 89.0 1.1 91.3 1.6 94.6 2.2 89.9 0.8
Blue Mountains % - - 2.0 21.1 2.3 32.6 - - 2.0 16.3
Illawarra % 8.7 21.4 9.0 9.5 6.3 19.4 - - 8.2 7.8
Dwelling type
Separate house % 34.2 9.2 46.3 3.2 83.6 2.2 92.6 2.6 55.8 2.1
Dwelling/Non-dwelling combined and semi detached % 13.2 17.0 9.5 9.3 5.2 21.5 6.3 35.2 8.8 7.5
Low rise units % 23.6 11.9 19.2 6.1 - - - - 16.9 5.1
Units (3 storeys and above) % 29.0 10.4 25.0 5.2 - - - - 18.6 4.9
Land size (houses only)
Small (Less than 500 square metres) % 31.7 16.7 20.4 8.7 14.4 13.4 13.2 24.3 18.6 6.5
Medium (500 to 900 square metres) % 61.3 9.0 68.0 3.0 69.3 3.7 68.4 6.4 68.0 2.1
Large (More than 900 square metres) % - - 11.5 12.2 16.3 12.5 18.5 19.9 13.5 7.9
Household structure
Single person (young, middle and mature) % 86.9 2.7 37.2 4.4 10.3 16.5 - - 36.0 3.4
Single parent (young, middle and mature family) % 3.1 38.9 12.3 9.0 13.3 14.2 8.0 33.1 11.0 7.3
Couple with children (young, middle and mature family) % 7.1 25.3 41.6 4.0 74.5 3.3 85.4 4.0 47.0 2.7
Couple no children (young and mature) % 2.8 41.2 8.9 10.8 - - - - 6.0 10.2
Ownership status
Owned fully/fully paid off % 51.2 6.5 50.0 3.0 54.9 4.6 52.9 8.6 51.4 2.3
Buying/paying off home % 7.4 23.4 17.3 6.5 24.6 8.8 24.2 16.1 18.1 4.9
Renting - Private % 32.6 9.5 27.5 4.9 15.8 11.7 12.9 23.6 24.7 4.0
Renting - Public/Housing Commission % 7.2 23.8 5.0 13.1 4.7 22.8 8.0 30.8 5.4 9.7

Independent Pricing and Regulatory Tribunal
40
Table A1.1 Summary Statistics for IPART Household Survey 2003 - Combined Dwellings by Consumption Note: A dash indicates that there was insufficient samples size to produce a reliable estimate. Numbers in italics are relative standard errors.
Units Dwelling Consumption Category
< 100 kL 101-300 kL 301-500 kL > 500 kL Total
Other % - - - - - - - - 0.5 33.7
Average number of people in household No. 1.6 4.0 2.5 1.5 3.6 2.1 4.3 3.6 2.7 1.2
Average number of people aged 15 and over No. 1.5 3.3 2.0 1.2 2.7 2.0 3.3 3.8 2.2 1.1
Average number of people aged less than 15 years No. 0.1 27.4 0.5 5.3 0.9 7.0 1.0 11.9 0.6 4.0 Average number of people who worked more than 35 hrs in the last week No. 0.6 8.2 0.8 3.2 1.2 5.3 1.3 7.3 0.9 2.6
Average number of people who have worked part-time in the last week No. 0.2 18.8 0.3 5.8 0.5 35.0 0.5 15.4 0.3 12.4
Average number of people who spend most days of the week at home No. 0.8 7.4 1.2 2.5 1.3 4.5 1.6 7.1 1.2 2.0
Average number of times moved in last 3 years No. 0.7 11.0 0.5 5.3 0.3 11.0 0.4 19.6 0.5 4.3
Average number of bedrooms No. 2.1 2.7 2.7 1.0 3.4 1.4 3.8 2.3 2.8 0.8
Income, Concession and Payment characteristics
Annual income
Less than $31,200 % 45.7 6.3 30.4 4.2 18.3 7.8 17.3 15.0 27.7 3.2
$31,201-$52,000 % 14.7 13.8 19.0 5.7 17.1 8.1 14.2 16.9 17.6 4.3
$52,001-$104,000 % 16.3 13.0 29.1 4.3 32.1 5.4 35.5 9.2 29.0 3.1
More than $104,000 % 12.3 15.3 11.5 7.7 16.5 8.3 19.0 14.2 13.7 5.0
Refused % 11.0 16.4 9.9 8.4 15.9 8.5 14.0 17.0 12.1 5.3
Concession Cards
Has a concession card % 47.3 7.0 35.4 4.0 27.7 8.2 26.1 15.3 34.6 3.2
Has a pensioner concession card % 44.2 7.4 32.7 4.3 25.5 8.6 25.0 15.7 32.1 3.4
Has a Veterans' Affairs gold health card % 4.3 31.4 2.5 18.5 1.9 36.3 0.7 111.5 2.5 14.5
Has a concession card but not sure what it is called % 0.0 0.0 1.5 24.5 0.8 56.8 0.4 149.5 1.1 22.3
Awareness of water concessions for concession card holders
Aware % 66.5 6.9 74.3 3.0 71.1 6.1 72.8 11.0 72.4 2.4
Not aware % 5.2 41.2 7.9 17.2 14.5 23.4 - - 8.7 12.8
Not sure % 12.7 25.3 8.0 17.1 7.4 34.1 - - 8.7 12.8
Did not answer % - - 9.8 15.2 7.1 34.9 - - 10.2 11.7
Claims water concession, if aware
Does claim % 72.4 7.3 83.7 2.6 86.0 4.6 79.4 10.8 82.1 2.2
Does not claim % 20.0 23.7 9.8 17.8 10.3 33.8 - - 11.9 12.6

Appendix 1 Statistical tables
41
Table A1.1 Summary Statistics for IPART Household Survey 2003 - Combined Dwellings by Consumption Note: A dash indicates that there was insufficient samples size to produce a reliable estimate. Numbers in italics are relative standard errors.
Units Dwelling Consumption Category
< 100 kL 101-300 kL 301-500 kL > 500 kL Total
Renters who pay quarterly usage charges % 28.9 16.6 26.6 8.7 42.9 12.9 51.4 19.6 30.4 6.4
Renters who pay usage and pay directly to the water supplier % - - 27.7 16.5 - - - - 28.4 12.2
Payment difficulties
Have had difficulty paying water bills % 9.1 20.9 6.3 11.5 9.2 15.9 7.7 31.5 7.4 8.2
Water use characteristics
Average annual water consumption kL 73.8 1.9 189.6 0.9 381.2 0.8 688.5 3.1 248.5 1.6
Average annual water bill $ 330.0 3.4 456.4 1.3 766.7 0.5 1064.8 2.0 546.2 1.1
Average number of:
Single flush toilets No. 0.7 5.8 0.7 3.0 0.8 5.8 1.1 8.2 0.8 2.4
Dual flush toilets No. 0.5 9.3 0.8 3.6 1.2 5.1 1.3 9.8 0.9 2.8
Combined toilets No. 1.2 2.7 1.5 1.4 2.0 2.6 2.4 4.1 1.6 1.2
Amenities (incl pools and spas) No. 1.8 1.7 2.0 0.7 2.2 1.4 2.5 3.0 2.1 0.7
Appliances (dishwasher etc) No. 2.2 2.5 2.6 1.2 3.2 1.4 3.4 2.2 2.7 0.9
Proportion of households with:
Dishwasher % 12.1 17.9 28.8 4.7 50.9 5.0 63.5 6.9 33.7 3.3
Washing Machine % 89.8 2.2 94.0 0.8 99.7 0.3 99.6 0.6 95.0 0.5
Shower (hand held included) % 99.7 0.4 99.6 0.2 99.8 0.2 100.0 0.0 99.7 0.1
Bath % 76.5 3.7 85.8 1.2 87.8 1.9 90.7 2.9 85.4 1.0
Bath with Spa Jets % 1.2 61.1 3.9 14.9 11.2 14.2 15.6 21.2 5.8 9.3
Spa % 1.5 53.4 2.2 20.0 3.4 26.9 9.4 28.3 2.8 13.6
Swimming pool % 2.3 43.0 6.7 11.1 21.0 9.8 38.4 11.5 11.3 6.5
Proportion of households that use method for watering garden:
Hand held hose % 50.2 6.6 52.9 2.8 84.0 2.2 77.5 4.9 60.8 1.9
Portable sprinkler % 5.7 26.8 10.8 8.6 25.3 8.7 29.3 14.1 14.4 5.6
Automatic sprinkler with timer % 0.4 110.7 4.7 13.4 12.5 13.4 25.9 15.4 7.2 8.3
Automatic sprinkler without timer % 1.2 59.4 4.0 14.7 8.0 17.1 10.3 26.9 4.9 10.2
Never water the garden/no garden % 42.7 7.7 37.2 3.9 3.8 25.4 3.9 45.2 28.6 3.7
Other % 0.3 122.8 0.7 34.9 0.7 60.1 0.7 111.5 0.7 28.3
Proportion of households with a garden that water the garden in warmer months for the following times per week:
< 1 hr % 52.2 8.4 35.1 5.1 25.0 8.9 29.1 14.5 33.4 3.9

Independent Pricing and Regulatory Tribunal
42
Table A1.1 Summary Statistics for IPART Household Survey 2003 - Combined Dwellings by Consumption Note: A dash indicates that there was insufficient samples size to produce a reliable estimate. Numbers in italics are relative standard errors.
Units Dwelling Consumption Category
< 100 kL 101-300 kL 301-500 kL > 500 kL Total
Do not know/Unsure % - - 3.8 19.0 7.3 18.3 - - 4.8 12.2
1 or more hrs % 44.9 9.7 61.2 3.0 67.7 3.6 66.4 6.6 61.9 2.2
Proportion of households with a garden that water the garden in colder months for the following times per week:
< 1 hr % 81.4 4.2 74.2 2.2 74.9 3.0 73.6 5.6 75.1 1.6
Do not know/Unsure % - - 3.6 19.5 6.6 19.4 - - 4.4 12.8
1-2 hrs % 15.9 20.2 19.3 7.7 16.2 11.7 17.5 20.2 17.9 5.9
3 or more hrs % - - 2.8 22.1 2.3 33.4 - - 2.6 16.7
Proportion of households who use water for the following outdoor activities:
Washing footpaths/driveway % 4.5 30.4 6.5 11.4 12.9 13.1 17.0 20.1 8.3 7.7
Washing roof % 0.0 - 1.0 29.3 0.7 59.3 1.7 68.4 0.9 24.5
Washing courtyard/paved yard % 6.4 25.4 8.4 9.9 8.9 16.2 9.5 28.1 8.3 7.7
Washing the car % 23.1 12.1 45.4 3.3 66.7 3.6 66.4 6.5 48.5 2.4
Other % 6.4 25.3 5.2 12.8 3.9 25.0 5.8 36.6 5.1 10.0
None % 62.5 5.1 49.0 3.1 28.5 8.0 28.1 14.5 44.9 2.6
Proportion of households that are willing to or are currently doing the following to save water:
Very seldom use hose for cleaning driveways, paving etc % 66.1 4.7 74.7 1.7 83.4 2.3 87.4 3.4 76.3 1.3
Use car washing nozzle % 50.9 6.5 68.1 2.0 83.8 2.2 85.0 3.8 70.4 1.5
Never water garden between certain times % 63.5 5.0 64.9 2.2 86.5 2.0 82.8 4.1 70.5 1.5
Never water garden with sprinkler/system between certain times % 40.0 8.1 52.2 2.9 71.9 3.2 76.3 5.1 56.4 2.0
Change gardening practices % 47.6 6.9 55.1 2.7 72.3 3.1 72.7 5.6 59.0 1.9
Auto timers off when raining/wet % 26.6 11.0 31.6 4.4 47.9 5.3 45.9 9.9 35.3 3.1
Install water saving devices % 55.1 6.0 65.1 2.2 68.7 3.4 64.3 6.8 64.6 1.7
None % 0.0 - 0.5 43.5 0.4 84.7 0.7 111.5 0.4 36.5
Other % 9.2 20.8 4.6 13.7 0.5 68.8 0.0 - 4.0 11.4
Could you easily reduce the amount of water you use?
Yes % 25.5 10.7 31.2 4.6 40.1 5.4 45.3 9.0 33.8 3.2
No % 74.5 3.7 68.8 2.1 59.9 3.6 54.7 7.5 66.2 1.6
Willingness to have water restrictions
Once every year % 61.2 5.0 63.7 2.3 63.8 3.3 60.0 6.7 63.1 1.7

Appendix 1 Statistical tables
43
Table A1.1 Summary Statistics for IPART Household Survey 2003 - Combined Dwellings by Consumption Note: A dash indicates that there was insufficient samples size to produce a reliable estimate. Numbers in italics are relative standard errors.
Units Dwelling Consumption Category
< 100 kL 101-300 kL 301-500 kL > 500 kL Total
Once every two years or more % 11.4 17.5 11.7 8.5 10.3 13.1 12.7 21.5 11.4 6.3
Never % 7.5 22.1 7.6 10.8 10.3 13.1 14.7 19.8 8.8 7.3
Other % 5.9 25.1 4.7 13.9 2.6 27.4 - - 4.1 11.0
Whenever necessary of required % 10.2 18.6 9.6 9.6 11.5 12.4 10.0 24.6 10.2 6.7
All the time % 3.9 31.1 2.6 19.0 - - - - 2.4 14.6
Average ratings of water service characteristics important to households
Overall cost (1 Most - 8
Least) 4.0 3.5 3.6 1.9 3.5 2.6 3.6 4.8 3.6 1.3
Quality of water (1 Most - 8
Least) 2.3 4.1 2.5 2.1 2.3 3.0 2.4 5.2 2.4 1.5
Pressure of water (1 Most - 8
Least) 4.2 3.1 4.3 1.4 4.3 2.0 4.2 3.5 4.3 1.0
Continuity of water supply (1 Most - 8
Least) 3.2 3.6 3.2 1.8 3.2 2.7 3.2 5.0 3.2 1.3
Customer service (1 Most - 8
Least) 5.7 1.9 5.8 1.0 5.8 1.3 5.8 2.5 5.8 0.7
Incentives to reduce water use (1 Most - 8
Least) 5.4 2.2 5.4 1.1 5.6 1.4 5.7 2.4 5.5 0.8
Flexibility of billing arrangements (1 Most - 8
Least) 6.6 1.6 6.7 0.7 6.6 1.1 6.5 2.3 6.6 0.6
Good environmental management of water (1 Most - 8
Least) 4.4 3.2 4.6 1.5 4.5 2.1 4.7 4.0 4.6 1.1

Independent Pricing and Regulatory Tribunal
44
Table A1.2 Summary Statistics for IPART Household Survey 2003 - Houses by Consumption Note: A dash indicates that there was insufficient samples size to produce a reliable estimate. Numbers in italics are relative standard errors. Units House Consumption Category
< 100 kL 101-300 kL 301-500 kL > 500 kL Total
Estimated population No. 88,655 510,282 285,913 98,590 983,440
Proportion of households % 9.0 51.9 29.1 10.0 100.0
Sample size No. 207 936 500 144 1,787
Demographic characteristics Region Sydney % 77.1 5.3 85.0 1.7 90.3 1.8 94.5 2.2 86.8 1.1
Blue Mountains % - - 3.5 20.9 2.6 32.6 - - 3.1 16.2
Illawarra % 18.5 20.3 11.4 11.2 7.1 19.3 - - 10.1 8.6
Dwelling type
Separate house % 72.1 6.0 83.1 1.8 94.1 1.3 93.7 2.4 86.3 1.1
Dwelling/Non-dwelling combined and semi detached % 27.9 15.5 16.9 8.9 5.9 21.4 6.3 35.2 13.7 7.3
Land size
Small (Less than 500 square metres) % 31.7 16.7 20.4 8.7 14.4 13.4 13.2 24.3 18.6 6.5
Medium (500 to 900 square metres) % 61.3 9.0 68.0 3.0 69.3 3.7 68.4 6.4 68.0 2.1
Large (More than 900 square metres) % - - 11.5 12.2 16.3 12.5 18.5 19.9 13.5 7.9
Household structure
Single person (young, middle and mature) % 75.2 6.3 25.0 8.3 6.4 22.6 - - 21.6 6.3
Single parent (young, middle and mature family) % 7.6 38.1 16.2 10.9 12.9 15.4 7.9 33.6 13.4 8.4
Couple with children (young, middle and mature family) % 10.5 31.9 53.1 4.5 78.5 3.1 85.7 4.0 60.8 2.7
Couple no children (young and mature) % - - 5.7 19.4 - - - - 4.1 16.0
Ownership status
Owned fully/fully paid off % 65.8 7.0 60.0 3.3 54.3 4.9 53.6 8.5 58.2 2.4
Buying/paying off home % 15.7 22.4 23.2 7.3 26.1 9.0 24.4 16.1 23.5 5.2
Renting - Private % 12.0 26.1 12.8 10.4 15.3 12.6 13.0 23.6 13.5 7.3
Renting - Public/Housing Commission % 3.2 53.2 3.5 21.1 4.4 24.9 7.0 33.4 4.1 14.0
Other % - - - - - - - - 0.7 33.7
Average number of people in household No. 1.7 5.9 2.7 1.8 3.7 2.0 4.3 3.6 3.0 1.4
Average number of people aged 15 and over No. 1.5 4.8 2.1 1.5 2.7 2.1 3.3 3.8 2.4 1.3
Average number of people aged less than 15 years No. 0.2 36.6 0.5 7.0 1.0 7.0 1.0 12.0 0.7 4.7

Appendix 1 Statistical tables
45
Table A1.2 Summary Statistics for IPART Household Survey 2003 - Houses by Consumption Note: A dash indicates that there was insufficient samples size to produce a reliable estimate. Numbers in italics are relative standard errors. Units House Consumption Category
< 100 kL 101-300 kL 301-500 kL > 500 kL Total Average number of people who worked more than 35 hrs in the last week No. 0.3 19.0 0.8 4.4 1.3 5.4 1.3 7.3 1.0 3.2
Average number of people who have worked part-time in the last week No. 0.2 21.4 0.3 7.0 0.6 36.5 0.5 15.4 0.4 16.0
Average number of people who spend most days of the week at home No. 1.0 7.1 1.3 2.9 1.3 4.8 1.6 7.1 1.3 2.3
Average number of times moved in last 3 years No. 0.4 24.5 0.4 8.7 0.3 11.3 0.4 19.8 0.3 6.4
Average number of bedrooms No. 2.6 2.9 3.1 1.0 3.5 1.3 3.8 2.3 3.3 0.8
Income, Concession and Payment characteristics
Annual income
Less than $31,200 % 44.8 6.9 29.3 4.5 18.2 7.9 15.7 16.0 26.4 3.4
$31,201-$52,000 % 14.9 14.9 18.9 6.0 16.8 8.3 14.5 16.8 17.4 4.5
$52,001-$104,000 % 14.9 14.9 29.7 4.5 32.1 5.4 36.2 9.2 29.4 3.2
More than $104,000 % 12.4 16.6 11.5 8.0 16.7 8.3 19.4 14.1 13.9 5.1
Refused % 12.9 16.2 10.6 8.4 16.1 8.5 14.2 17.0 12.8 5.3
Concession cards
Has a concession card % 59.7 7.9 36.8 5.3 26.9 8.8 26.0 15.4 34.9 3.9
Has a pensioner concession card % 55.3 8.7 33.7 5.6 24.5 9.4 24.9 15.9 32.1 4.2
Has a Veterans' Affairs gold health card % 7.0 35.1 3.6 20.6 2.1 36.3 0.7 111.5 3.2 15.8
Awareness of water concessions for concession card holders
Aware % 82.0 5.9 79.2 3.4 66.5 7.3 73.9 10.8 76.4 2.7
Not aware % - - 9.9 20.0 16.8 23.1 - - 11.3 13.7
Not sure % - - 6.4 25.3 8.5 33.9 - - 7.0 17.9
Did not answer % - - 4.6 30.3 8.2 34.7 - - 5.3 20.6
Claims water concession, if aware
Does claim % 87.3 5.3 86.9 2.9 82.7 5.8 79.4 10.8 85.6 2.3
Does not claim % 10.6 40.3 11.6 20.6 12.7 33.3 - - 12.1 15.0
Renters who pay quarterly usage charges % 52.7 24.1 57.4 8.6 50.2 12.1 54.4 19.1 54.3 6.3
Renters who pay usage and pay directly to the water supplier % 40.7 43.5 22.4 24.5 23.2 31.4 10.0 86.2 22.6 17.3
Payment difficulties
Have had difficulty paying water bills % 11.1 27.3 7.5 14.1 10.3 15.8 7.8 31.5 8.7 9.4
Have had water disconnected % 0.9 102.0 0.1 115.1 0.5 78.0 0.0 - 0.3 54.5

Independent Pricing and Regulatory Tribunal
46
Table A1.2 Summary Statistics for IPART Household Survey 2003 - Houses by Consumption Note: A dash indicates that there was insufficient samples size to produce a reliable estimate. Numbers in italics are relative standard errors. Units House Consumption Category
< 100 kL 101-300 kL 301-500 kL > 500 kL Total
Water use characteristics
Average annual water consumption kL 65.2 3.6 205.8 1.1 380.3 0.8 687.2 3.1 292.1 1.8
Average annual water bill $ 433.4 2.5 593.8 0.5 765.4 0.5 1064.9 2.0 676.4 0.8
Average number of:
Single flush toilets No. 0.8 10.0 0.8 4.3 0.9 6.0 1.1 8.3 0.9 3.1
Dual flush toilets No. 0.7 11.2 1.0 4.1 1.2 5.4 1.3 9.8 1.1 3.0
Combined toilets No. 1.5 4.0 1.8 1.7 2.1 2.7 2.4 4.1 1.9 1.4
Amenities (incl pools and spas) No. 1.9 2.5 2.0 1.1 2.3 1.6 2.5 3.0 2.1 0.9
Appliances (dishwasher etc) No. 2.3 3.7 2.9 1.3 3.2 1.4 3.4 2.2 3.0 0.9
Proportion of households with:
Dishwasher % 14.9 23.0 40.6 4.8 53.0 5.0 64.0 6.9 44.3 3.2
Washing Machine % 95.8 2.0 98.9 0.4 99.6 0.3 99.6 0.6 98.9 0.3
Shower (hand held included) % 99.4 0.8 99.6 0.3 99.8 0.2 100.0 0.0 99.7 0.2
Bath % 79.9 4.8 84.2 1.7 86.2 2.1 90.8 2.9 85.1 1.2
Bath with Spa Jets % 2.4 60.9 6.7 14.9 12.6 14.1 15.8 21.1 8.9 9.2
Spa % 3.2 53.0 3.2 22.2 3.8 26.8 9.5 28.3 4.0 14.2
Swimming pool % 4.9 42.5 10.4 11.8 23.6 9.6 38.8 11.5 16.6 6.5
Proportion of households that use method for watering garden:
Hand held hose % 80.0 4.8 82.4 1.9 82.0 2.5 77.6 4.9 81.6 1.4
Portable sprinkler % 12.1 26.0 17.3 8.8 24.3 9.5 29.6 14.1 20.1 5.8
Automatic sprinkler with timer % 0.8 110.7 7.1 14.5 14.1 13.2 26.2 15.4 10.4 8.4
Automatic sprinkler without timer % 2.6 59.2 6.3 15.4 9.0 17.0 10.4 26.8 7.2 10.4
Never water the garden/no garden % 15.1 22.9 8.3 13.3 4.3 25.3 3.5 47.7 7.3 10.3
Other % 0.6 122.9 1.3 34.8 0.8 60.1 0.7 111.5 1.0 28.3
Proportion of households with a garden that water the garden in warmer months for the following times per week:
Less than 1 hr % 47.6 11.0 33.8 5.9 26.6 9.1 28.9 14.6 32.2 4.3
Do not know/Unsure % - - 2.4 26.6 3.9 27.3 - - 3.2 16.4
1-2 hrs % 33.2 14.9 36.2 5.6 35.8 7.3 31.0 13.9 35.3 4.1
3-4 hrs % 10.0 31.4 16.7 9.3 21.4 10.5 18.7 19.4 17.8 6.4
5-6 hrs % - - 5.1 18.0 4.7 24.6 - - 4.8 13.4
> 6 hrs % - - 5.8 16.8 7.7 19.0 10.8 26.8 6.7 11.2

Appendix 1 Statistical tables
47
Table A1.2 Summary Statistics for IPART Household Survey 2003 - Houses by Consumption Note: A dash indicates that there was insufficient samples size to produce a reliable estimate. Numbers in italics are relative standard errors. Units House Consumption Category
< 100 kL 101-300 kL 301-500 kL > 500 kL Total
Proportion of households with a garden that water the garden in colder months for the following times per week:
< 1 hr % 83.0 4.7 77.3 2.3 76.0 3.1 73.8 5.6 77.0 1.6
Do not know/Unsure % - - 1.2 38.1 3.0 30.9 - - 2.2 19.7
1-2 hrs % 13.1 27.0 18.3 8.8 18.3 11.6 17.4 20.3 17.8 6.4
3 or more hrs % - - 3.3 22.7 2.6 33.3 - - 3.0 17.1
Proportion of households who use water for the following outdoor activities:
Washing footpaths/driveway % 4.3 45.6 9.9 12.1 12.8 13.9 17.0 20.2 11.0 8.2
Washing roof % 0.0 - 0.9 41.5 0.8 59.3 1.8 68.4 0.9 30.4
Washing courtyard/paved yard % 3.3 51.9 10.4 11.8 10.0 16.1 9.6 28.1 9.5 8.9
Washing the car % 41.5 11.5 57.0 3.5 65.0 3.9 66.8 6.4 58.9 2.4
None % 51.6 9.3 36.2 5.3 29.6 8.3 27.9 14.7 34.8 3.9
Proportion of households that are willing to or are currently doing the following to save water:
Very seldom use hose for cleaning driveways, paving etc % 84.8 4.1 87.0 1.5 86.4 2.1 87.3 3.5 86.6 1.1
Use car washing nozzle % 60.0 7.9 77.6 2.2 83.4 2.4 85.0 3.8 78.4 1.5
Never water garden between certain times % 81.4 4.6 84.6 1.7 89.0 1.9 83.4 4.1 85.5 1.2
Never water garden with sprinkler/system between certain times % 55.6 8.6 68.1 2.7 74.2 3.2 77.0 5.0 69.6 1.9
Change gardening practices % 65.7 7.0 74.5 2.3 76.4 3.0 73.0 5.6 74.1 1.7
Auto timers off when raining/wet % 35.5 13.0 38.2 5.1 48.2 5.6 46.2 9.9 41.7 3.4
Install water saving devices % 60.8 7.7 69.9 2.6 69.8 3.5 64.3 6.8 68.5 2.0
None % 0.0 - 0.8 43.5 0.4 84.6 0.7 111.5 0.6 36.5
Other % 3.2 53.0 1.7 30.1 0.6 68.8 0.0 - 1.4 24.5
Could you easily reduce the amount of water you use?
Yes % 25.6 11.9 31.3 4.8 39.6 5.5 45.1 9.2 34.1 3.3
No % 74.4 4.1 68.7 2.2 60.4 3.6 54.9 7.6 65.9 1.7
Willingness to have water restrictions
Once every year % 58.9 5.8 63.6 2.5 63.6 3.4 59.0 7.0 62.7 1.8
Once every two years or more % 11.1 19.7 11.4 9.1 10.4 13.1 13.2 21.4 11.2 6.6
Never % 7.7 24.1 7.4 11.6 10.4 13.1 14.6 20.2 8.8 7.6
Other % 6.8 25.9 4.8 14.6 2.6 27.4 - - 4.2 11.3
Whenever necessary of required % 10.6 20.2 10.1 9.7 11.4 12.5 10.4 24.5 10.6 6.9

Independent Pricing and Regulatory Tribunal
48
Table A1.2 Summary Statistics for IPART Household Survey 2003 - Houses by Consumption Note: A dash indicates that there was insufficient samples size to produce a reliable estimate. Numbers in italics are relative standard errors. Units House Consumption Category
< 100 kL 101-300 kL 301-500 kL > 500 kL Total
All the time % 4.8 30.9 2.7 19.7 - - - - 2.5 14.9
Average ratings of water service characteristics important to households
Overall cost (1 Most - 8
Least) 3.9 4.1 3.6 2.0 3.5 2.6 3.5 5.0 3.6 1.4
Quality of water (1 Most - 8
Least) 2.3 4.6 2.5 2.1 2.3 3.0 2.4 5.2 2.4 1.6
Pressure of water (1 Most - 8
Least) 4.3 3.4 4.3 1.4 4.3 2.0 4.2 3.6 4.3 1.1
Continuity of water supply (1 Most - 8
Least) 3.2 3.9 3.2 1.9 3.2 2.7 3.2 5.2 3.2 1.4
Customer service (1 Most - 8
Least) 5.8 2.1 5.8 1.0 5.8 1.3 5.8 2.5 5.8 0.7
Incentives to reduce water use (1 Most - 8
Least) 5.5 2.4 5.4 1.2 5.6 1.5 5.7 2.5 5.5 0.8
Flexibility of billing arrangements (1 Most - 8
Least) 6.5 1.8 6.7 0.8 6.6 1.1 6.6 2.2 6.6 0.6
Good environmental management of water (1 Most - 8
Least) 4.5 3.6 4.5 1.6 4.5 2.1 4.8 4.0 4.5 1.2

Appendix 1 Statistical tables
49
Table A1.3 Summary Statistics for IPART Household Survey 2003 - Units by Consumption Note: A dash indicates there was insufficient samples size to produce a reliable estimate. Numbers in italics are relative standard errors.
Units Unit Consumption Category
< 100 kL 101-200 kL > 200 kL Total
Estimated population No. 98,361 295,853 145,476 539,690
Proportion of households % 18.2% 54.8% 27.0% 100.0%
Sample size No. 48 73 36 157
Demographic characteristics Region Sydney % 100.0 0.0 91.7 1.6 100.0 0.0 95.5 0.8
Blue Mountains % - - - - - - - -
Illawarra % - - - - - - - -
Dwelling type
Low rise units % 44.8 10.2 39.4 6.5 66.2 5.4 47.6 4.1
Units (3 storeys and above) % 55.2 8.2 60.6 4.2 33.8 10.5 52.4 3.7
Household structure
Single person (young, middle and mature) % 95.2 2.0 50.8 5.5 44.6 8.9 58.1 3.5
Single parent (young, middle and mature family) % - - - - - - 7.2 14.7
Couple with children (young, middle and mature family) % - - 26.0 9.4 41.5 9.5 25.8 6.9
Couple no children (young and mature) % - - - - - - 8.9 13.1
Ownership status
Owned fully/fully paid off % 38.1 11.7 39.5 6.5 38.4 9.5 39.0 4.9
Buying/paying off home % - - - - - - 8.2 13.0
Renting - Private % 51.1 9.0 45.2 5.8 - - 45.1 4.3
Renting - Public/Housing Commission % 10.8 26.2 6.8 19.4 7.6 26.2 7.8 13.4
Other % - - - - - - - -
Average number of people in household No. 1.5 5.4 2.1 2.8 2.7 4.2 2.2 2.3
Average number of people aged 15 and over No. 1.5 4.6 1.7 2.1 2.0 2.8 1.7 1.6
Average number of people aged less than 15 years No. 0.1 40.9 0.4 9.8 0.7 12.1 0.4 7.8
Average number of people who worked more than 35 hrs in the last week No. 0.8 7.8 0.7 5.8 0.8 8.0 0.7 4.1
Average number of people who have worked part-time in the last week No. 0.3 27.3 0.2 11.4 0.2 19.0 0.2 9.7
Average number of people who spend most days of the week at home No. 0.5 15.0 1.0 5.0 0.9 6.5 0.9 4.0
Average number of times moved in last 3 years No. 0.9 11.6 0.7 8.0 0.7 10.9 0.8 5.7

Independent Pricing and Regulatory Tribunal
50
Table A1.3 Summary Statistics for IPART Household Survey 2003 - Units by Consumption Note: A dash indicates there was insufficient samples size to produce a reliable estimate. Numbers in italics are relative standard errors.
Units Unit Consumption Category
< 100 kL 101-200 kL > 200 kL Total
Average number of bedrooms No. 1.6 3.5 2.0 1.3 2.3 2.9 2.0 1.3
Income, Concession and Payment characteristics
Annual income
Less than $31,200 % 50.5 14.7 44.0 13.3 46.3 17.7 46.5 8.6
$31,201-$52,000 % - - 21.0 22.9 - - 19.5 16.2
$52,001-$104,000 % - - 19.2 24.2 - - 22.3 15.0
More than $104,000 % - - - - - - 10.6 23.2
Concession cards
Has a concession card % 36.1 12.2 37.2 6.8 26.3 12.6 34.1 5.4
Has a pensioner concession card % 34.3 12.7 35.5 7.1 23.6 13.5 32.1 5.7
Has a Veterans' Affairs gold health card % 1.8 67.5 1.6 41.5 0.0 0.0 1.2 35.4
Awareness of water concessions for concession card holders
Aware % 43.4 17.5 61.2 6.9 - 3.0 65.0 4.9
Not aware % - - - - - - - -
Not sure % - - - - - - 12.0 18.1
Did not answer % - - - - - - 19.3 13.7
Claims water concession, if aware
Does claim % - - 85.6 4.6 - - 74.5 4.9
Does not claim % - - - - - - - -
Renters who pay quarterly usage charges % 23.6 21.0 16.5 16.4 8.2 36.4 15.9 12.3
Renters who pay usage and pay directly to the water supplier % - - - - - - - -
Payment difficulties
Have had difficulty paying water bills % 7.3 32.6 4.0 25.9 5.4 31.5 5.0 17.1
Water use characteristics
Average annual water consumption kL 81.6 1.5 145.2 0.9 276.5 2.6 169.0 2.0
Average annual water bill $ 236.8 6.2 254.6 3.2 468.2 3.9 308.9 2.6
Average number of:
Single flush toilets No. 0.7 6.0 0.7 4.7 0.6 6.8 0.7 3.3
Dual flush toilets No. 0.3 14.0 0.5 7.2 0.7 10.7 0.5 5.8
Combined toilets No. 1.0 0.0 1.2 2.0 1.3 3.8 1.2 1.6

Appendix 1 Statistical tables
51
Table A1.3 Summary Statistics for IPART Household Survey 2003 - Units by Consumption Note: A dash indicates there was insufficient samples size to produce a reliable estimate. Numbers in italics are relative standard errors.
Units Unit Consumption Category
< 100 kL 101-200 kL > 200 kL Total
Amenities (incl pools and spas) No. 1.7 2.3 1.9 0.9 1.9 1.4 1.9 0.8
Appliances (dishwasher etc) No. 2.0 3.2 2.1 2.6 2.3 3.0 2.2 1.8
Proportion of households with:
Dishwasher % 9.5 28.2 12.1 14.2 22.5 14.0 14.4 9.5
Washing Machine % 84.3 3.9 83.4 2.4 100.0 0.0 88.0 1.4
Shower (hand held included) % 100.0 0.0 99.7 0.3 100.0 0.0 99.8 0.2
Bath % 73.4 5.5 90.3 1.7 85.6 3.1 86.0 1.6
Bath with Spa Jets % 0.0 - 0.3 90.5 0.0 - 0.2 90.5
Spa % 0.0 - 0.0 - 2.7 45.2 0.7 45.5
Swimming pool % 0.0 - 1.6 41.5 2.7 45.2 1.6 30.6
Proportion of households that use method for watering garden:
Hand held hose % 23.4 16.6 16.4 11.9 35.3 10.2 22.8 7.2
Never water the garden/no garden % 67.5 6.3 72.5 3.2 57.4 6.5 67.5 2.7
Other % 9.1 28.9 12.3 14.0 18.4 15.8 13.4 9.9
Proportion of households with a garden that water the garden in warmer months for the following times per week:
< 1 hr % 62.9 12.4 42.5 11.7 - - 39.2 8.5
Do not know/Unsure % - - - - - - - -
1 or more hrs % - - 53.1 11.9 - - 47.9 8.4
Proportion of households with a garden that water the garden in colder months for the following times per week:
< 1 hr % 77.5 8.7 61.9 7.9 62.6 8.9 65.0 5.0
Do not know/Unsure % - - - - - - - -
1 or more hrs % - - - - - - 19.5 14.2
Proportion of households who use water for the following outdoor activities:
Washing footpaths/driveway % 4.8 40.9 2.8 30.9 3.4 40.1 3.3 21.0
Washing roof % 0.0 - 1.6 41.5 0.0 - 0.9 41.6
Washing courtyard/paved yard % 9.1 28.9 4.9 23.3 6.6 28.2 6.1 15.3
Washing the car % 6.6 34.5 28.3 8.4 47.9 7.8 29.6 6.0
Other % 7.3 32.6 4.9 23.3 0.0 - 4.0 19.1
None % 72.3 5.7 66.0 3.8 52.0 7.2 63.3 3.0
Proportion of households that are willing to or are currently doing the following to save water:
Very seldom use hose for cleaning driveways, paving etc % 49.2 9.3 59.4 4.4 59.1 6.3 57.5 3.4

Independent Pricing and Regulatory Tribunal
52
Table A1.3 Summary Statistics for IPART Household Survey 2003 - Units by Consumption Note: A dash indicates there was insufficient samples size to produce a reliable estimate. Numbers in italics are relative standard errors.
Units Unit Consumption Category
< 100 kL 101-200 kL > 200 kL Total
Use car washing nozzle % 42.7 10.6 56.9 4.6 62.1 5.9 55.7 3.5
Never water garden between certain times % 47.4 9.6 40.5 6.4 45.6 8.2 43.1 4.5
Never water garden with sprinkler/system between certain times % 25.9 15.5 31.5 7.8 38.7 9.5 32.4 5.6
Change gardening practices % 31.3 13.5 30.3 8.0 33.6 10.6 31.4 5.8
Auto timers off when raining/wet % 18.6 19.2 21.9 9.9 31.4 11.1 23.8 7.0
Install water saving devices % 50.0 9.2 65.5 3.8 46.4 8.1 57.5 3.3
None % 0.0 - 0.0 - 0.0 - 0.0 -
Other % 14.6 22.1 8.0 17.8 6.2 29.2 8.7 12.6
Could you easily reduce the amount of water you use?
Yes % 25.0 25.3 23.3 21.4 55.6 15.1 31.2 11.9
No % 75.0 8.4 76.7 6.5 44.4 18.9 68.8 5.4
Willingness to have water restrictions
Once every year % 70.8 10.9 67.1 8.2 66.7 13.7 68.2 5.9
Once every two years or more % - - - - - - 12.7 21.9
Never % - - - - - - 8.9 21.1
Other % - - - - - - - -
Whenever necessary of required % - - - - - - - -
All the time % - - - - - - - -
Average ratings of water service characteristics important to households
Overall cost (1 Most - 8
Least) 4.9 4.7 4.2 3.2 3.5 5.2 4.3 2.4
Quality of water (1 Most - 8
Least) 2.2 4.2 2.3 4.1 2.2 4.8 2.3 2.8
Pressure of water (1 Most - 8
Least) 4.1 4.5 4.2 2.2 4.5 3.9 4.3 1.8
Continuity of water supply (1 Most - 8
Least) 3.3 5.4 3.0 2.9 3.6 4.1 3.3 2.2
Customer service (1 Most - 8
Least) 5.5 2.9 5.7 1.7 5.4 2.7 5.6 1.3
Incentives to reduce water use (1 Most - 8
Least) 5.1 3.3 5.3 1.9 5.5 2.9 5.3 1.5

Appendix 1 Statistical tables
53
Table A1.3 Summary Statistics for IPART Household Survey 2003 - Units by Consumption Note: A dash indicates there was insufficient samples size to produce a reliable estimate. Numbers in italics are relative standard errors.
Units Unit Consumption Category
< 100 kL 101-200 kL > 200 kL Total
Flexibility of billing arrangements (1 Most - 8
Least) 6.7 3.4 6.4 3.0 5.8 5.7 6.4 2.2
Good environmental management of water (1 Most - 8
Least) 4.2 7.7 4.8 5.0 5.4 6.7 4.8 3.6

Independent Pricing and Regulatory Tribunal
54
Table A1.4 Summary Statistics for IPART Household Survey 2003 - Combined Dwellings by Income Note: A dash indicates there was insufficient sample size to produce a reliable estimate. Numbers in italics are relative standard errors. Households that refused to provide their income group have been omitted from this table.
Units Annual Household Income Category
< $31,200 $31,201-$52,000 $52,001-$104,000 > $104,000 Total
Estimated population No. 426,799 269,937 438,031 206,858 1,341,625
Proportion of households % 31.8 20.1 32.6 15.4 100.0
Sample size No. 1160 468 558 257 2443
Demographic characteristics Region Sydney % 85.3 1.5 88.0 1.7 89.9 1.2 95.4 1.2 88.9 0.7 Blue Mountains % 1.9 26.8 1.9 33.1 2.2 24.6 - - 1.8 15.5 Illawarra % 12.8 9.7 10.0 14.0 8.0 12.4 4.0 26.0 9.3 6.5 Dwelling type Separate house % 74.7 2.2 80.5 2.3 79.8 1.8 71.1 3.4 77.0 1.1 Dwelling/Non-dwelling combined and semi detached % 14.0 9.2 11.7 12.8 15.3 8.6 23.7 9.5 15.5 4.9 Low rise flats/units % 5.9 14.8 4.0 22.9 2.1 25.3 - - 3.7 10.7 Flats (3 storeys and above) % 5.4 15.5 3.8 23.5 2.8 21.5 - - 3.9 10.4 Land size Small (Less than 500 square metres) % 21.1 8.3 16.4 11.7 17.6 8.9 19.5 12.9 18.7 5.0 Medium (500 to 900 square metres) % 67.4 3.0 70.3 3.4 69.4 2.7 65.0 4.6 68.4 1.6 Large (More than 900 square metres) % 11.5 11.9 13.2 13.3 13.0 10.6 15.6 14.7 13.0 6.2 Household structure Single person (young, middle and mature) % 42.3 5.1 17.6 11.3 15.0 9.4 12.8 14.7 22.9 4.3 Single parent (young, middle and mature family) % 21.8 8.3 11.0 14.8 7.7 13.7 - - 11.6 6.4 Couple with children (young, middle and mature family) % 34.1 6.1 68.0 3.6 71.5 2.5 72.3 3.5 60.4 1.9 Couple no children (young and mature) % 1.9 31.8 3.3 28.0 5.8 16.0 11.6 15.5 5.2 10.0 Ownership status Owned fully/fully paid off % 55.1 3.3 50.9 4.6 44.8 4.1 48.0 5.5 49.8 2.1 Buying/paying off home % 9.2 11.7 23.5 8.4 41.2 4.4 38.6 6.7 27.0 3.4 Renting - Private % 12.9 9.6 19.7 9.4 12.5 9.7 13.0 13.8 14.2 5.1 Renting - Public/Housing Commission % 22.2 6.9 5.0 20.3 - - - - 8.6 6.8 Other % - - - - - - - - 0.4 32.8

Appendix 1 Statistical tables
55
Table A1.4 Summary Statistics for IPART Household Survey 2003 - Combined Dwellings by Income Note: A dash indicates there was insufficient sample size to produce a reliable estimate. Numbers in italics are relative standard errors. Households that refused to provide their income group have been omitted from this table.
Units Annual Household Income Category
< $31,200 $31,201-$52,000 $52,001-$104,000 > $104,000 Total
Average number of people in household No. 2.4 2.1 3.3 2.2 3.4 1.6 3.5 2.0 3.1 1.0
Average number of people aged 15 and over No. 1.9 1.9 2.5 2.0 2.7 1.5 2.7 2.1 2.4 1.0
Average number of people aged less than 15 years No. 0.5 7.6 0.8 6.4 0.8 5.1 0.8 7.1 0.7 3.2
Average number of people who worked more than 35 hrs No. 0.3 10.8 1.0 3.7 1.4 2.2 1.8 2.8 1.1 2.1
Average number of people who have worked part-time No. 0.2 9.8 0.4 7.8 0.5 5.1 0.7 43.4 0.4 11.9
Average number of people who spend most days of the week at home No. 1.5 2.3 1.4 3.7 1.1 3.5 0.9 6.9 1.3 1.8
Average number of times moved in last 3 yrs No. 0.3 9.2 0.4 9.8 0.5 7.0 0.5 9.4 0.4 4.3
Average number of bedrooms No. 2.8 1.1 3.2 1.3 3.3 1.0 3.5 1.5 3.2 0.6
Income, Concession and Payment characteristics
Concession cards
Has a concession card % 69.7 2.4 21.6 8.9 7.2 13.2 2.8 31.6 29.3 3.2
Has a pensioner concession card % 65.8 2.7 19.2 9.6 5.5 15.2 2.0 37.5 26.9 3.4
Has a Veterans' Affairs gold health card % 4.9 16.3 1.8 34.6 0.9 37.7 0.8 59.6 2.4 13.5
Has a concession card but not sure what it is called % 1.1 35.4 0.9 49.9 0.9 37.7 0.4 84.5 0.9 22.1
Awareness of water concessions for concession card holders
Aware % 69.1 3.0 81.0 4.9 49.4 14.0 - - 68.5 2.6
Not aware % 10.1 13.2 - - 24.5 24.2 - - 11.9 10.5
Not sure % 10.4 13.0 - - - - - - 9.3 12.1
Did not answer % 10.4 2.5 - - - - - - 10.3 11.4
Claims water concession if aware
Does claim % 81.8 2.5 83.5 5.0 78.9 10.3 - - 81.7 2.2
Does not claim % 12.3 14.3 12.7 29.3 - - - - 12.8 12.2
Renters who pay quarterly usage charges % 19.8 12.6 40.3 11.5 53.0 9.3 47.0 15.6 33.4 6.2
Renters who pay usage and pay directly to the water supplier % 24.4 24.9 31.3 22.1 - - - - 22.6 14.1
Payment difficulties
Have had difficulty paying water bills % 10.6 10.8 10.8 13.4 7.5 12.8 - - 8.4 6.9

Independent Pricing and Regulatory Tribunal
56
Table A1.4 Summary Statistics for IPART Household Survey 2003 - Combined Dwellings by Income Note: A dash indicates there was insufficient sample size to produce a reliable estimate. Numbers in italics are relative standard errors. Households that refused to provide their income group have been omitted from this table.
Units Annual Household Income Category
< $31,200 $31,201-$52,000 $52,001-$104,000 > $104,000 Total
Water use characteristics
Average annual water consumption kL 237.5 2.7 279.2 2.5 308.1 2.0 332.0 3.7 283.8 1.3
Average annual water bill $ 596.0 1.3 648.6 1.3 681.2 1.1 705.8 1.7 652.0 0.7
Average number of:
Single flush toilets No. 0.8 3.5 0.8 4.7 0.7 4.7 0.7 6.6 0.8 2.3
Dual flush toilets No. 0.7 4.4 0.9 5.1 1.2 3.3 1.5 5.0 1.0 2.2
Combined toilets No. 1.5 1.5 1.7 2.2 1.9 1.7 2.2 2.8 1.8 1.0
Amenities (incl pools and spas) No. 1.9 1.0 2.1 1.2 2.2 1.1 2.3 1.8 2.1 0.6
Appliances (dishwasher etc) No. 2.5 1.3 2.8 1.5 3.2 1.0 3.4 1.3 2.9 0.7
Proportion of households with:
Dishwasher % 18.9 7.7 36.0 6.2 56.0 3.2 70.0 3.5 42.4 2.4
Washing Machine % 96.9 0.7 98.3 0.6 98.7 0.4 98.4 0.7 98.0 0.3
Shower (hand held included) % 99.4 0.3 100.0 0.0 99.7 0.2 100.0 0.0 99.7 0.1
Bath % 81.0 1.8 84.1 2.0 87.2 1.4 85.8 2.2 84.4 0.9
Bath with Spa Jets % 3.5 19.5 7.0 17.0 10.6 10.6 13.0 13.8 8.0 7.1
Spa % 1.2 33.7 1.8 34.6 5.6 15.1 7.1 19.3 3.7 10.7
Swimming pool % 5.4 15.6 14.2 11.4 18.8 7.6 23.4 9.6 14.3 5.1
Proportion of households that use method for watering garden:
Hand held hose % 75.6 2.1 79.2 2.4 79.5 1.9 66.9 3.8 76.3 1.2
Portable sprinkler % 11.8 10.2 16.7 10.4 25.6 6.2 23.0 9.7 19.0 4.3
Automatic sprinkler with timer % 3.5 19.6 6.6 17.6 12.8 9.6 17.4 11.6 9.3 6.5
Automatic sprinkler without timer % 3.2 20.4 4.9 20.4 8.5 12.0 12.2 14.3 6.7 7.8
Never water the garden/no garden % 18.2 7.9 13.9 11.6 6.6 13.8 9.1 16.9 12.1 5.6
Other % 0.8 40.3 1.1 45.0 0.5 50.0 0.8 59.6 0.8 23.6
Proportion of households with a garden that water the garden in warmer months for the following times:
< 1 hr % 39.0 5.1 33.7 7.0 29.0 5.9 26.2 9.4 32.5 3.2
Do not know/Unsure % 2.9 23.9 4.7 22.6 2.2 25.4 - - 3.1 12.5
1 or more hrs % 58.1 3.5 61.6 4.0 68.8 2.5 70.3 3.6 64.5 1.7

Appendix 1 Statistical tables
57
Table A1.4 Summary Statistics for IPART Household Survey 2003 - Combined Dwellings by Income Note: A dash indicates there was insufficient sample size to produce a reliable estimate. Numbers in italics are relative standard errors. Households that refused to provide their income group have been omitted from this table.
Units Annual Household Income Category
< $31,200 $31,201-$52,000 $52,001-$104,000 > $104,000 Total
Proportion of households with a garden that water the garden in colder months for the following times:
< 1 hr % 80.3 2.0 78.2 2.7 76.1 2.1 73.4 3.4 77.3 1.2
Do not know/Unsure % 1.9 29.3 - - - - - - 2.0 15.6
1-2 hrs % 15.2 9.7 17.4 10.9 18.4 8.0 21.4 10.7 17.7 4.8
3 or more hrs % 2.5 25.5 - - 3.9 18.8 - - 2.9 12.9
Proportion of households who use water for the following outdoor activities:
Washing footpaths/driveway % 11.2 10.4 11.0 13.3 12.5 9.7 9.2 16.7 11.3 5.9
Washing roof % 0.4 61.8 1.5 37.4 1.4 31.1 0.8 59.6 1.0 20.9
Washing courtyard/paved yard % 6.4 14.2 9.2 14.6 11.9 10.0 13.9 13.3 9.9 6.3
Washing the car % 45.1 4.1 64.8 3.4 63.5 2.8 52.3 5.1 56.2 1.8
Other % 5.7 15.0 5.6 19.2 6.1 14.3 9.4 16.5 6.4 8.0
None % 46.9 3.9 30.6 7.0 30.5 5.5 39.5 6.6 37.1 2.7
Proportion of households that are willing to or are currently doing the following to save water:
Very seldom use hose for cleaning driveways, paving etc % 81.3 1.8 85.8 1.9 84.6 1.6 83.4 2.4 83.6 0.9
Use car washing nozzle % 70.2 2.4 78.6 2.4 82.6 1.7 75.1 3.1 76.7 1.2
Never water garden between certain times % 79.8 1.9 76.2 2.6 86.8 1.4 86.2 2.1 82.3 1.0
Never water garden with sprinkler/system between certain times % 59.7 3.0 60.8 3.7 72.0 2.3 73.6 3.2 66.1 1.5
Change gardening practices % 64.8 2.7 66.1 3.3 76.1 2.1 75.1 3.1 70.3 1.4
Auto timers off when raining/wet % 33.2 5.3 34.3 6.5 43.4 4.2 44.8 5.9 38.5 2.6
Install water saving devices % 65.5 2.7 69.9 3.1 67.1 2.6 66.9 3.7 67.1 1.5
None % 0.2 76.5 1.1 43.9 0.6 48.7 0.8 59.6 0.6 26.8
Other % 3.5 19.5 1.6 37.0 1.3 31.8 1.2 48.6 2.0 14.5
Could you easily reduce the amount of water you use?
Yes % 28.4 4.7 34.6 6.4 35.7 5.7 40.5 7.6 32.5 2.9
No % 71.6 1.9 65.4 3.4 64.3 3.2 59.5 5.2 67.5 1.4

Independent Pricing and Regulatory Tribunal
58
Table A1.4 Summary Statistics for IPART Household Survey 2003 - Combined Dwellings by Income Note: A dash indicates there was insufficient sample size to produce a reliable estimate. Numbers in italics are relative standard errors. Households that refused to provide their income group have been omitted from this table.
Units Annual Household Income Category
< $31,200 $31,201-$52,000 $52,001-$104,000 > $104,000 Total
Willingness to have water restrictions
Once every year % 65.3 2.1 63.5 3.5 63.4 3.2 59.9 5.1 63.9 1.5
Once every two years or more % 9.9 8.9 14.1 11.4 9.3 13.2 12.8 16.3 10.9 5.8
Never % 9.4 9.1 6.8 17.1 8.2 14.1 8.9 19.9 8.6 6.6
Other % 4.9 12.9 4.7 20.8 3.9 20.9 3.9 31.1 4.5 9.3
Whenever necessary of required % 8.8 9.5 9.4 14.4 11.5 11.8 12.1 16.9 9.9 6.1
All the time % 1.7 22.2 - - 3.6 22.0 - - 2.2 13.6
Average ratings of water service characteristics important to households
Overall cost (1 Most - 8
Least) 3.7 1.9 3.6 2.8 3.5 2.5 4.0 3.1 3.7 1.2
Quality of water (1 Most - 8
Least) 2.4 1.9 2.4 3.1 2.4 2.9 2.2 3.8 2.4 1.3
Pressure of water (1 Most - 8
Least) 4.2 1.4 4.3 2.0 4.4 1.8 4.2 2.7 4.2 0.9
Continuity of water supply (1 Most - 8
Least) 3.3 1.7 3.3 2.7 3.2 2.6 2.9 4.0 3.2 1.2
Customer service (1 Most - 8
Least) 5.6 0.9 5.7 1.5 5.9 1.2 6.0 1.6 5.7 0.6
Incentives to reduce water use (1 Most - 8
Least) 5.5 1.0 5.5 1.6 5.3 1.5 5.4 2.1 5.5 0.7
Flexibility of billing arrangements (1 Most - 8
Least) 6.4 0.8 6.5 1.2 6.8 0.9 7.0 1.2 6.6 0.5
Good environmental management of water (1 Most - 8
Least) 4.8 1.4 4.6 2.1 4.4 2.1 4.2 3.3 4.6 1.0

Appendix 2 Overview of the survey design and methodology
59
APPENDIX 2 OVERVIEW OF THE SURVEY DESIGN AND METHODOLOGY
We used a face-to-face (door-to-door) interview methodology for this survey. This approach was adopted to: • ensure maximum comparability with past surveys
• obtain consent signatures from respondents to permit water, gas and electricity agencies to release their billing data for inclusion in the analysis.
The interviews were conducted from June to August 2003. Sample size
A total of 2604 door-to-door interviews were completed across the Sydney Water Corporation areas with 600 of the total interviews being specifically samples from low-income areas to ensure a minimum low-income sample of at least 600 respondents. Sample selection
The 2003 survey used a random selection of Census Collector Districts (CDs) from Statistical Local Areas (SLAs). The full list of all of the postcodes included in the survey is shown below. The number of interviews was divided proportionally by the number of residents in each of the four key regions covered by Sydney Water. These proportions are shown in the table below. Postcodes were matched to SLAs and CDs were randomly select within each SLA. The number of CDs selected within each SLA was proportional to the number of dwellings within each SLA.21
Table A2.1 Postcodes for Sydney Water Sampling
Central Sydney Northern Sydney Illawarra Greater Western Sydney (incl. Blue Mountains)
2000-2050 2130-2139 2190-2195 2203-2234
2060-2080 2081-2114 2119-2122
2126 2157-2159
2500-2508 2515-2519 2525-2534
2115-2118 2125
2140-2156 2160-2164 2165-2177 2196-2200 2558-2574 2745-2786
Percentage of Sydney Water Region
31% 20% 7% 42%
21 This information was obtained from the Australian Bureau of Statistics publication, Census of Population
and Housing Selected Social and Housing Characteristics for Statistical Local Areas, New South Wales and Jervis Bay Territory, 2001.

Independent Pricing and Regulatory Tribunal
60
Selecting households
1. 2,000 randomly selected households A total of 260 Census Collectors’ Districts (CDs) were randomly selected. The number of CDs selected in each SLA was proportional to the size of the SLA. Five interviews were conducted in each CD with a skip pattern of at least 3 dwellings between successful interviews to minimise serial correlations. Start points were selected through random identification of a street intersection. A random number from 1-10 was allocated representing the number of dwellings away from the intersection where the first call was to be made. Interviewers called on every 3rd dwelling until a minimum of five interviews had been conducted in that CD. 2. Incremental 600 low-income households An additional 120 low income CDs were selected to provide an additional 600 interviews with low-income households. Additional low-income households were included to enable more in-depth analysis of energy and water usage for those households. Low-income households were defined as those households earning less than $31,200. A threshold of $31,200 was selected as this represents one of the cut offs used by the ABS for lower income groupings. Information on the Census Collector Districts (CDs) with severe disadvantage was obtained from the ABS and 120 additional CDs were selected from amongst these. Pre-survey letter
As an initial strategy to increase the response rate and to verify the official nature of the survey, a formal letter on the Tribunal’s letterhead was left at each household providing an invitation to participate and an explanation of the survey prior to the interviewer calling on the household. Piloting
An initial 30 face-to-face pilot interviews were conducted in Sydney, the Illawarra and Blue Mountains during May and June 2003. Changes were made to the questionnaire based on problems identified during piloting. Response Rate
An overall response rate of 33 per cent was achieved. This is based on households which were eligible but refused to participate when interviewers called. The response rate varied significantly between Sydney, the Illawarra and the Blue Mountains reflecting the characteristically greater willingness of households outside of large metropolitan areas such as Sydney to participate in surveys of this nature. The response rates for the three areas were as follows: • Blue Mountains - 48 per cent
• Illawarra – 58 per cent
• Sydney – 31 per cent. In total 16,327 households were visited where no one was home.
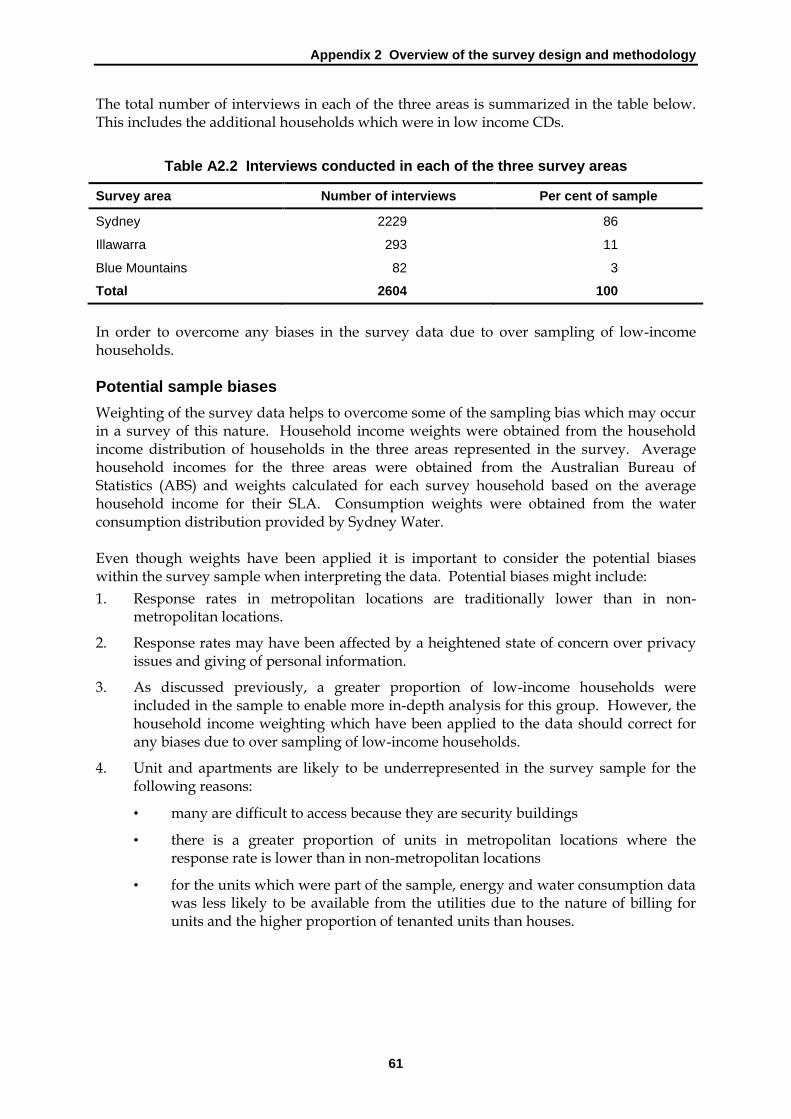
Appendix 2 Overview of the survey design and methodology
61
The total number of interviews in each of the three areas is summarized in the table below. This includes the additional households which were in low income CDs.
Table A2.2 Interviews conducted in each of the three survey areas
Survey area Number of interviews Per cent of sample
Sydney 2229 86
Illawarra 293 11
Blue Mountains 82 3
Total 2604 100
In order to overcome any biases in the survey data due to over sampling of low-income households. Potential sample biases
Weighting of the survey data helps to overcome some of the sampling bias which may occur in a survey of this nature. Household income weights were obtained from the household income distribution of households in the three areas represented in the survey. Average household incomes for the three areas were obtained from the Australian Bureau of Statistics (ABS) and weights calculated for each survey household based on the average household income for their SLA. Consumption weights were obtained from the water consumption distribution provided by Sydney Water. Even though weights have been applied it is important to consider the potential biases within the survey sample when interpreting the data. Potential biases might include: 1. Response rates in metropolitan locations are traditionally lower than in non-
metropolitan locations.
2. Response rates may have been affected by a heightened state of concern over privacy issues and giving of personal information.
3. As discussed previously, a greater proportion of low-income households were included in the sample to enable more in-depth analysis for this group. However, the household income weighting which have been applied to the data should correct for any biases due to over sampling of low-income households.
4. Unit and apartments are likely to be underrepresented in the survey sample for the following reasons:
• many are difficult to access because they are security buildings
• there is a greater proportion of units in metropolitan locations where the response rate is lower than in non-metropolitan locations
• for the units which were part of the sample, energy and water consumption data was less likely to be available from the utilities due to the nature of billing for units and the higher proportion of tenanted units than houses.

Independent Pricing and Regulatory Tribunal
62
Consumption and billing information from utilities
In order to obtain billing and consumption data for electricity, gas and water, survey participants were asked to sign a consent form allowing the relevant utilities to release that information to Taverner Research for inclusion in the data analysis. Participants who refused permission were not included in the survey. For those who gave permission, a signed consent form was forwarded to the relevant utilities in exchange for billing and consumption data. Account numbers were sought from respondents to facilitate the utilities accessing their information, however, a number of respondents were unable to provide account numbers because they had disposed of their bills. This made data retrieval more difficult for the utilities and hence not all billing and consumption data for respondents was obtained. The following table provides a breakdown of the number of respondents who gave permission for their information to be accessed and the percentage of customers for which utilities were able to provide consumption and billing data.
Table A2.3 Response rates from utilities for customer billing and consumption data
Respondents for which data was provided by utilities
Survey area Number of Respondents giving permission for data
to be accessed No %
Sydney Water Corporation 2534 2460 97
EnergyAustralia Electricity 1321 920 70
EnergyAustralia Gas 69 25 36*
AGL Gas 1172 1077 92
AGL Electricity 75 16 21*
Integral Energy 1296 1175 91
* Due to EnergyAustralia Gas and AGL Electricity customers being relatively new, very few complete data sets were provided for the customers for which data was available. This data was therefore excluded from the consumption and billing analysis.
Annualised billing and consumption data
Billing and consumption data were provided for each quarter by the utilities. Quarters added to 365 days for some utilities (eg, Sydney Water Corporation and AGL) but not for others. For those for whom quarters did not add to 365 days, the data was annualized. This involved dividing the total consumption and billing for all four quarters by the number of days represented by all four quarters and then multiplying that amount by 365 days. Billing and consumption data are, therefore, reported on an ‘annualised’ or ‘per annum’ basis (ie, over 365 days) for water, gas and electricity.
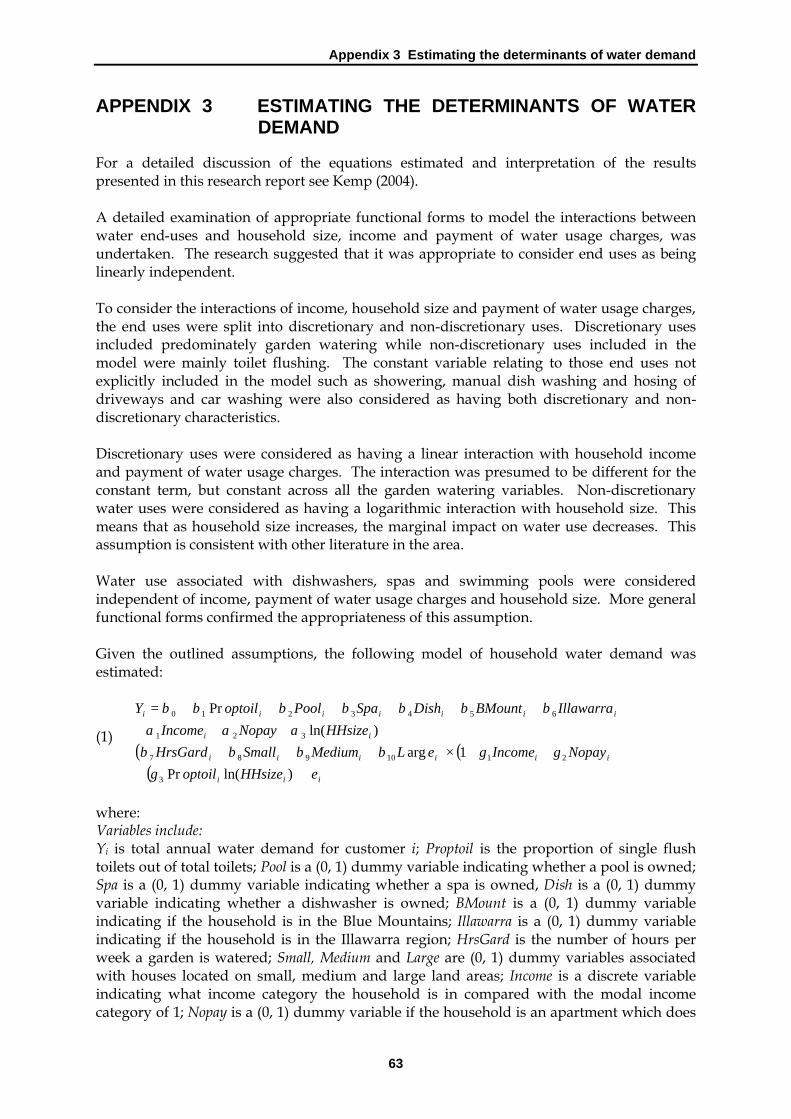
Appendix 3 Estimating the determinants of water demand
63
APPENDIX 3 ESTIMATING THE DETERMINANTS OF WATER DEMAND
For a detailed discussion of the equations estimated and interpretation of the results presented in this research report see Kemp (2004). A detailed examination of appropriate functional forms to model the interactions between water end-uses and household size, income and payment of water usage charges, was undertaken. The research suggested that it was appropriate to consider end uses as being linearly independent. To consider the interactions of income, household size and payment of water usage charges, the end uses were split into discretionary and non-discretionary uses. Discretionary uses included predominately garden watering while non-discretionary uses included in the model were mainly toilet flushing. The constant variable relating to those end uses not explicitly included in the model such as showering, manual dish washing and hosing of driveways and car washing were also considered as having both discretionary and non-discretionary characteristics. Discretionary uses were considered as having a linear interaction with household income and payment of water usage charges. The interaction was presumed to be different for the constant term, but constant across all the garden watering variables. Non-discretionary water uses were considered as having a logarithmic interaction with household size. This means that as household size increases, the marginal impact on water use decreases. This assumption is consistent with other literature in the area. Water use associated with dishwashers, spas and swimming pools were considered independent of income, payment of water usage charges and household size. More general functional forms confirmed the appropriateness of this assumption. Given the outlined assumptions, the following model of household water demand was estimated:
(1) ( ) ( )
( ) iii
iiiiii
ii
iiiiiii
eHHsizeoptoilNopayIncomeeLMediumSmallHrsGard
HHsizeNopayIncome
IllawarraBMountDishSpaPooloptoilY
++++×+++
+++++++++=
)ln(Pr1arg
)ln(
Pr
3
2110987
321
6543210
γγγββββ
αααβββββββ
where: Variables include: Yi is total annual water demand for customer i; Proptoil is the proportion of single flush toilets out of total toilets; Pool is a (0, 1) dummy variable indicating whether a pool is owned; Spa is a (0, 1) dummy variable indicating whether a spa is owned, Dish is a (0, 1) dummy variable indicating whether a dishwasher is owned; BMount is a (0, 1) dummy variable indicating if the household is in the Blue Mountains; Illawarra is a (0, 1) dummy variable indicating if the household is in the Illawarra region; HrsGard is the number of hours per week a garden is watered; Small, Medium and Large are (0, 1) dummy variables associated with houses located on small, medium and large land areas; Income is a discrete variable indicating what income category the household is in compared with the modal income category of 1; Nopay is a (0, 1) dummy variable if the household is an apartment which does
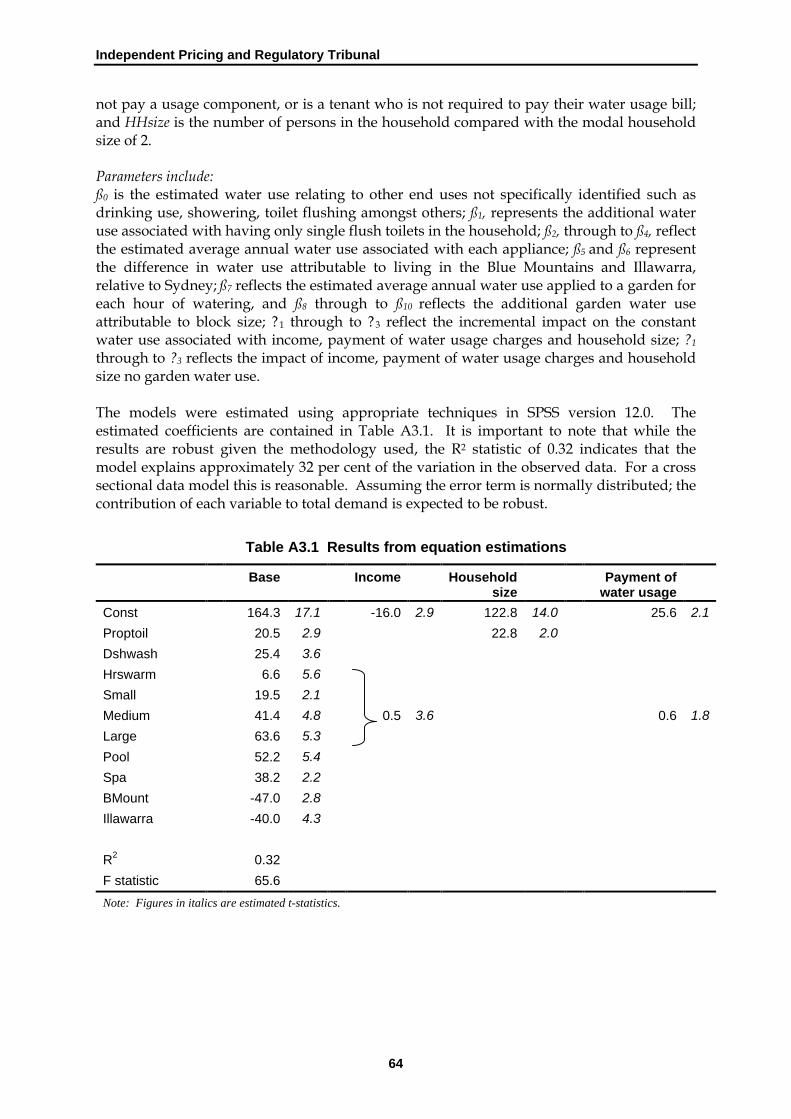
Independent Pricing and Regulatory Tribunal
64
not pay a usage component, or is a tenant who is not required to pay their water usage bill; and HHsize is the number of persons in the household compared with the modal household size of 2. Parameters include: ß0 is the estimated water use relating to other end uses not specifically identified such as drinking use, showering, toilet flushing amongst others; ß1, represents the additional water use associated with having only single flush toilets in the household; ß2, through to ß4, reflect the estimated average annual water use associated with each appliance; ß5 and ß6 represent the difference in water use attributable to living in the Blue Mountains and Illawarra, relative to Sydney; ß7 reflects the estimated average annual water use applied to a garden for each hour of watering, and ß8 through to ß10 reflects the additional garden water use attributable to block size; ?1 through to ?3 reflect the incremental impact on the constant water use associated with income, payment of water usage charges and household size; ?1 through to ?3 reflects the impact of income, payment of water usage charges and household size no garden water use. The models were estimated using appropriate techniques in SPSS version 12.0. The estimated coefficients are contained in Table A3.1. It is important to note that while the results are robust given the methodology used, the R2 statistic of 0.32 indicates that the model explains approximately 32 per cent of the variation in the observed data. For a cross sectional data model this is reasonable. Assuming the error term is normally distributed; the contribution of each variable to total demand is expected to be robust.
Table A3.1 Results from equation estimations
Base Income Household Payment of size water usage
Const 164.3 17.1 -16.0 2.9 122.8 14.0 25.6 2.1
Proptoil 20.5 2.9 22.8 2.0
Dshwash 25.4 3.6
Hrswarm 6.6 5.6
Small 19.5 2.1
Medium 41.4 4.8 0.5 3.6 0.6 1.8
Large 63.6 5.3
Pool 52.2 5.4
Spa 38.2 2.2
BMount -47.0 2.8
Illawarra -40.0 4.3
R2 0.32
F statistic 65.6
Note: Figures in italics are estimated t-statistics.

Appendix 4 Glossary
65
APPENDIX 4 GLOSSARY
Adult Person 15 years and over
Children Persons aged less than 15 years
Full time employment Paid employment of more than 35 hours per week, including paid holidays and including all second jobs
High consumption Water consumption above 500kL per annum
High income Household income above $104,000 per annum
House Separate house, combined dwelling/non-dwelling, and semi-detached/terrace/house/villa unit/town house/ duplex
Household A small group of persons who share the same living accommodation, who pool some, or all, of their income and wealth and who consume certain types of goods and services collectively, mainly housing and food (www.abs.gov.au)
Household income Total income of the household (not respondent), before taxes, from all sources including income from salaries, interest, dividends, bonuses, capital gains, profits and so on
Inclining-block tariff Price structure where consumption up to a set quantity (the step quantity) is charged at an initial price (the tier 1 price) and consumption above the step quantity is charged at a higher price (the tier 2 price)
Indoor amenity Facilities located inside the dwelling including toilets, showers, baths, spas, dishwashers and washing machines
Large land size Land more than 900 square metres
Low consumption Water consumption less than 100kL per annum
Low income Household income below $31,200 per annum
Medium land size Land between 500 to 900 square metres
Middle family Family with most children aged from 6 to 15 years and still at home
Mature family Family with most children over 15 years and still living at home
Part time employment Employment of 8 to 34 hours per week
Population All households in the Sydney, Blue Mountains and Illawarra regions
Price structure The mix of fixed charges, usage charges and price steps

Independent Pricing and Regulatory Tribunal
66
Relative standard error A measure of an estimate's reliability obtained by dividing the standard error of the estimate by the estimate itself. This quantity is expressed as a per cent of the estimate. Estimates with large RSEs are considered unreliable
Renters Customers paying rental for their primary place of residence regardless of whether they are paying the usage component of their (water) bills
Residential customers Customers in private dwellings, not including commercial and industrial customers
Sample Surveyed households in the Sydney, Blue Mountains and Illawarra regions
Significant 95 per cent probability that something is true
Single person Person living alone or sharing accommodation in a house or flat
Small land size Land less than 500 square metres
Standard error of the mean An estimate of the standard deviation of the sampling distribution of means, based on the data from one or more random samples.
Unit Granny flat, ‘low rise’ flats (less than 3 storeys), flats (3 storeys) and ‘high rise’ flats (more than 3 storeys)
Water usage charge Charge applied per kL of water consumed
Young family Family with mostly pre-school children

Appendix 5 Reference list
67
APPENDIX 5 REFERENCE LIST
IPART (2004), End of Term Review of the Operating Licences for Sydney Water Corporation and the Sydney Catchment Authority - Water Demand and Supply Balance - Issues Paper, January. IPART (2003), Investigation into Price Structures to Reduce the Demand for Water in the Sydney Basin - Issues Paper, December. Kemp, A. (2004), The determinants of urban residential water demand in Sydney, the Blue Mountains and Illawarra, IPART Secretariat Working Paper 1, April.