residential perceptions of the proposed all aboard florida … · residential perceptions of the...
TRANSCRIPT
Residential Perceptions of the
Proposed All Aboard Florida Project:
Survey Results
Dr. Jesse Saginor, AICP, Director of Housing, Economy, and Urban Development
Dr. Eric Dumbaugh, AICP, Director of Transportation and Livability
Nicole Estevez, Project Manager
Center for Urban and Environmental Solutions
Florida Atlantic University
2
Executive Summary
This report presents the survey results from a survey conducted in partnership between the Center for
Urban and Environmental Solutions (CUES) at Florida Atlantic University and the Martin County Property
Appraiser’s Office. The survey respondents were randomly selected based on geographic locations
corresponding to the possible impacts of the proposed All Aboard Florida project. These geographic
locations include residents living within 400 feet of the eastern Florida East Coast Railway track, residents
within 400 to 1,000 feet of the track, and residents living on the waterfront on the west side of the bridge
that would be lowered 32 additional times a day. Unlike many surveys conducted regarding the proposed
AAF project, this survey focused on residents most likely to be impacted by the proposed project.
Between June 29, 2015 and July 24, 2015, respondents returned 1,013 mail surveys for a response rate of
54 percent. Of these 1,013 surveys, 296 were from households within 400 feet of the east FEC railroad,
315 were from households from 400 feet to 1,000 feet of the east FEC railroad, and the remaining 402
were from waterfront households west of the rail bridge. Respondents were more likely to be residing in
their current home for more than five years, be a male, between the age of 50 to 69 years old, live in a
home with no more than two people, was either retired or still working full-time, made between $50,000
to $99,999, and held a Bachelor’s degree or higher. Regardless of respondent background or location, the
survey results are consistently negative in relation to a variety of aspects regarding the proposed AAF
project. Of all respondents, 86 percent strongly oppose the proposed AAF project, with only two percent
of people strongly support it and another two percent somewhat support it. Ninety-one percent of
residents believe that the proposed project will either slightly decrease or greatly decrease their
property’s value. In terms of the concern regarding the rail bridge needing to be lowered an additional
32 times, respondents who did not own a boat or go boating regularly showed a high level of concern.
Despite this level of concern across multiple facets of the proposed project, a majority of respondents
stated that they would not be moving due to the project. Taken together, these results show a clear lack
of support by those households most likely to be impacted.

3
I. Introduction
The purpose of this report is to present the results from a mail survey that was
administered in June to households within 400 feet of the eastern FEC rail line,
households within 400 to 1,000 feet of the eastern FEC rail line, and waterfront
households west of the bridge to measure perceptions related to the proposed All
Aboard Florida project. These three groups of households constitute the households
most likely to be impact by the proposed project. Rather than survey a sample of
people throughout Martin County, surveying these groups in particular assists in
determining the possible local impacts of the railroad. This report is a follow up to
the report released in June that analyzed the short-time impacts on property values
based on the All Aboard Florida announcement. While that report relied heavily on
statistical analysis to determine property impacts, this report uses a survey of
residents to gain insight on human perceptions of the proposed AAF project.
II. Survey Sample and Methodology
Based on the results from the peer-reviewed literature in the previous report released
in June, the aim of the survey was to focus on the households in the geographic areas
most likely to be impacted by the proposed AAF project. The goal was to measure
general support for or against the project and several underlying aspects of the
project ranging from the 32 additional times the bridge will be lowered to noise and
vibration concerns to frequency of use.
Using GIS data from the Martin County Property Appraiser’s Office, the mailing
addresses for property owners were generated for each geographic area. While the
survey responses were anonymous based on respondent, there was a key at the
bottom of each survey to denote whether the respondent was generally located in
the waterfront area west of the bridge, within 400 feet of the railroad, or within 400-
1,000 feet of the railroad. The purpose of this key was to determine whether there
are differences between these three groups related to their perceptions of various
aspects of the proposed AAF project.
The overall sample sizes and related data for the survey are outlined in Table 1. The
number of single family households in each area is based on the number of homes
using the single-family residences variable from the Martin County property data file.
The sample size needed is the number of surveys that need to be completed for a 95-
percent level of confidence and a five percent margin of error. Put simply, the
responses based on the survey sample size will be representative of all respondents,
while the margin of error provides a range of how the entire population would

4
respond to the survey. These benchmarks for this survey are fairly conservative for
typical survey administration regardless of the method of survey.
Table 1: Survey Sample Data
Geographic Area Number of Single Family
Households
Sample Size Needed
Surveys Mailed
Surveys Returned
Response Rate
Margin of Error
Waterfront area west of the bridge
2,005 323 646 402 62% 4.37%
Within 400 feet of FEC
1,212 292 584 296 51% 4.95%
Within 400-1,000 feet of FEC
2,556 334 668 315 47% 5.17%
Total 5,773 949 1,898 1,013 54% 2.80%
Using the random number function in Excel, random numbers were created for households in
each of three geographic locations. Assuming a response rate of 50 percent to get enough
responses to meet the sample size needed to have statistically valid results, the three groups
were sorted based on the order of random numbers for the mailing. For example, the first 646
random numbers when sorted from lowest number to highest number constituted the mailing
list for the waterfront area west of the bridge. These addresses were giving a number of “1” to
indicate that these addresses were in the first mailing group. While additional mailing groups
were created in a similar fashion, the response rates from the initial mailing provided enough
responses to not require a second mailing.
Once the initial survey was drafted, it was pre-tested on no fewer than two dozen people to
minimize the likelihood of bias in the question wording and to maximize clarity. Additionally, the
proper paperwork was filed through FAU’s Institutional Review Board for approval of
administering the survey.
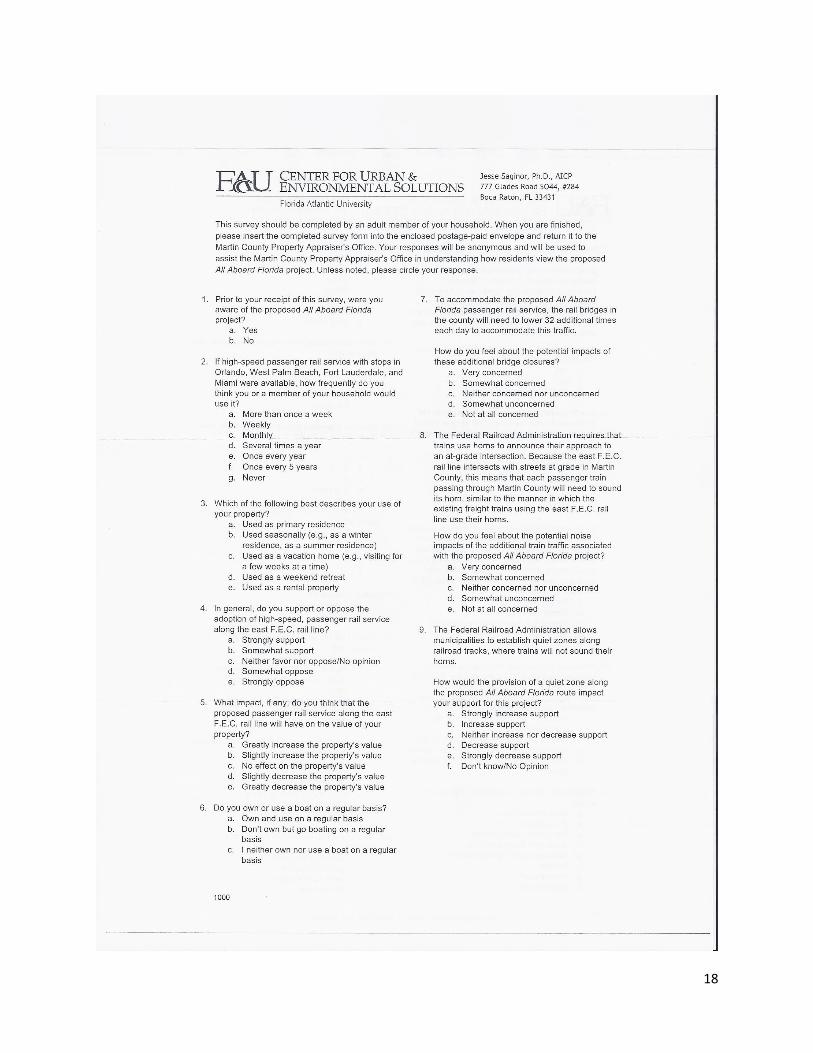
The survey instrument consists of 22 questions, with 11 of these questions focusing on the
respondent’s background and the other 11 questions revolving around various aspects of the
proposed AAF project. The full version of the surveys, along with the letter of solicitation from
the Martin County Property Appraiser’s Office, are in Appendix A. The 11 questions related to
the proposed AAF project address seven different aspects of the project. Two survey questions
(questions 1 and 4) focus on awareness and general level of support for the proposed project.
Two questions (questions 2 and 11) gauge the frequency of use, with one question asking about
the general frequency and the other question asking about frequency if there was a stop
eventually put in Martin County. One question (question 7) focuses on the large boating
community and level of concern regarding the bridge being lowered. Four questions (questions
8-10) cover noise and quiet zone aspects, while question 12 addresses concerns related to
vibrations from the additional train traffic. The other two questions ask respondents to
5
determine the impact of the proposed project on housing values and the other question
measures the likelihood of that respondent putting their house on the market in the future or
staying in their current home.
While the original project timeline targeted a May 1st date to administer the survey, finalizing the
survey and receiving the approval to administer the survey from FAU did not occur until mid-
June. Typically, a mail survey takes a minimum of 14 weeks for enough responses to be
generated. The survey was mailed out on June 26th to 1,898 households in the three geographic
areas. Given the fact that many people do not live in Martin County year-round, in addition to
the July 4th holiday weekend, the goal was to wait until the week of July 13th to determine
whether to send out a second round of surveys and to allow ample time for out-of-state property
owners to return surveys. Fortunately, the response rate was high enough that another round
of mailings was not necessary. Additionally, whereas the typical timeline for a mail survey is 14
weeks, this survey only took 4 weeks from initial mailing to get enough responses to report
statistically valid results.
III. Results
The results of the survey consistently demonstrate a solid level of opposition and concern
regarding multiple aspects of the proposed AAF project across all geographic areas. Additionally,
there is no single category (age, gender, income, educational attainment level, occupational
status, or property owner’s use of the property) that supports the proposed project. These
results are despite the fact that every attempt was made to minimize bias in the survey
instrument, including the wording and ensuring that the options included negative and positive
responses. This section of the report discusses highlights from the overall survey. The full results
of the survey, with their corresponding questions, are available in Appendix B.
a. Demographic Overview of Respondents
The survey included ten questions regarding the background of survey respondents. Based on
the summary of the data, the typical respondent was either retired or still working full time,
between the age of 50 and 69 years old, living in a household with no more than two people, was
male, had a Bachelor’s degree or higher, and earned between $50,000 and $99,999, had lived in
their current home for more than five years, and used the home as their primary residence. Fifty-
nine percent of the respondents were 60 or older, with slightly less than 10 percent of the
respondents stating that they were 80 or older. These demographic characteristics are fairly
representative of Martin County’s total population.

6
b. Awareness and Support for Proposed AAF Project
The first and fourth questions highlight general awareness of the proposed AAF project and
whether the respondent supports or opposes the project. Due to many residents only using their
homes on a seasonal basis, the possibility exists that some residents may not know the full extent
of the proposed AAF project. Based on 1,009 answers to the question, 97 percent of respondents
were aware of the proposed AAF project when they received the survey, with only 28 residents
stating that they were not aware of the project. A follow up question asked about whether the
respondent supported or opposed the project, with five options ranging from positive to negative
(Figure 1). This question gauges general opinions of the project before additional questions
asking about specific aspects of the project. Overall, 86 percent of respondents were strongly
opposed to the project, with a range from a low of 83 percent for people living within 400 feet
of the railroad to a high of 89 percent for people living on the waterfront west of the railroad
bridge. Supporters of the project were minimal, with only two percent of respondents
responding that they “strongly support” the project and another two percent responding that
they “somewhat support” the project. Slightly less than four percent of respondents “neither
favor nor oppose” or have “no opinion” of the project.
Figure 1: General Support or Opposition to Proposed AAF Project
8 9 13 14
357
9 8 14 19
246
7 6 922
266
0
50
100
150
200
250
300
350
400
Strongly support Somewhat support Neither favor noroppose/No opinion
Somewhat oppose Strongly oppose
Waterfront Within 400 feet of FEC Within 400-1,000 feet of FEC

7
c. Potential Frequency of Use
There were two questions regarding frequency of use in the survey. The first question revolves
around the frequency of use of AAF assuming that there will be no changes to the current plans
for AAF to only have stops in Orlando, West Palm Beach, Fort Lauderdale, and Miami. The second
question gauges frequency of use if there is a stop built in Martin County. While the first question
asks the likelihood of someone to use AAF based on the current plan, the second question aims
to see if that use would change if there was a stop actually in Martin County. Only 12 respondents
(only 1.2 percent of all respondents) would use AAF on a monthly basis or more often, while 86
percent of all respondents said they would never use AAF (Figure 2).
Figure 2: Frequency of AAF Use Based on Current Proposed Project
An AAF stop in Martin County aims to see if the drive from Martin County to the nearest stop in
West Palm Beach is a barrier to frequency of use. If someone has to drive at least 30 minutes to
get to the nearest AAF stop, it might be easier to just continue driving to the eventual destination,
whether it is Fort Lauderdale, Miami, or even Orlando. Respondents to this question, if there are
fewer “never” responses, indicate that a more convenient stop may overcome their lack of
support for AAF. While 86 percent of people responded “never” in Figure 2, the percentage of
respondents answering “never” with the addition of a stop in Martin County drops to 69 percent
in Figure 3. Additionally, the number of people using AAF at a frequency that is monthly or
greater increases slightly, from 1.2 percent without a stop in Martin County to 3.3 percent with
a stop in Martin County.
0 0 414 7
25
350
0 1 213 13 19
247
2 1 2 8 1022
268
0
50
100
150
200
250
300
350
400
More thanonce a week
Weekly Monthly Several times ayear
Once everyyear
Once every 5years
Never
Waterfront Within 400 feet of FEC Within 400-1,000 feet of FEC
8
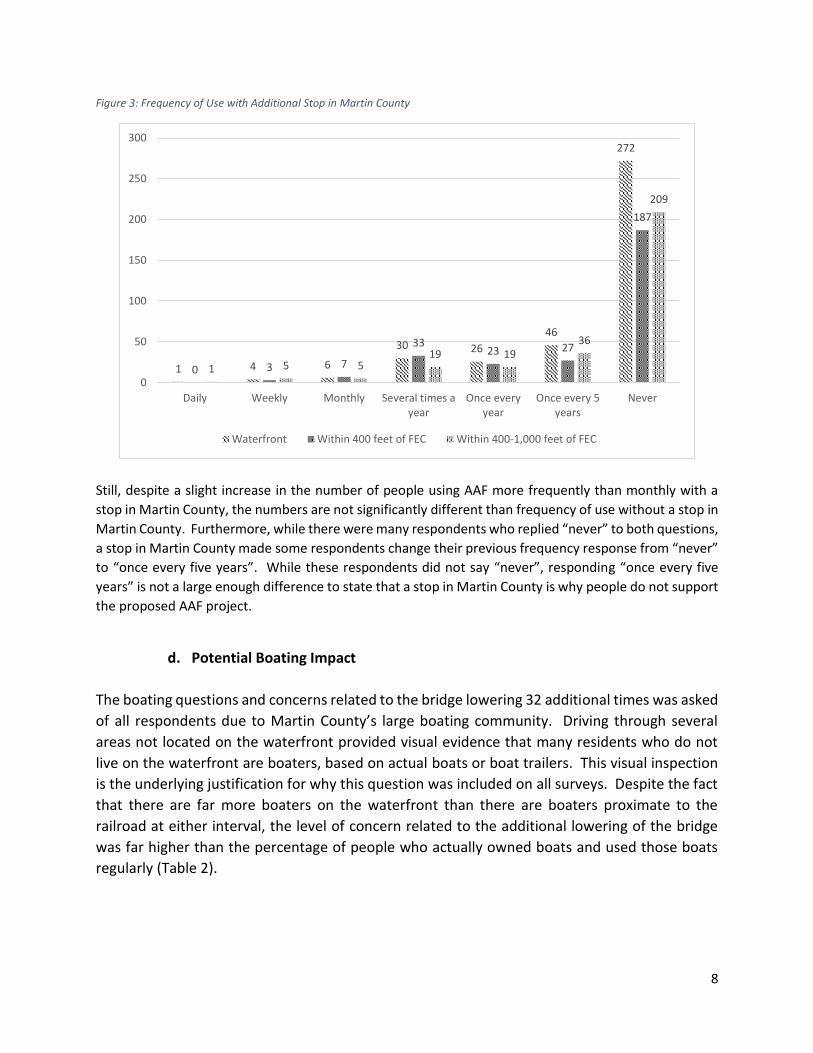
Figure 3: Frequency of Use with Additional Stop in Martin County
Still, despite a slight increase in the number of people using AAF more frequently than monthly with a
stop in Martin County, the numbers are not significantly different than frequency of use without a stop in
Martin County. Furthermore, while there were many respondents who replied “never” to both questions,
a stop in Martin County made some respondents change their previous frequency response from “never”
to “once every five years”. While these respondents did not say “never”, responding “once every five
years” is not a large enough difference to state that a stop in Martin County is why people do not support
the proposed AAF project.
d. Potential Boating Impact
The boating questions and concerns related to the bridge lowering 32 additional times was asked
of all respondents due to Martin County’s large boating community. Driving through several
areas not located on the waterfront provided visual evidence that many residents who do not
live on the waterfront are boaters, based on actual boats or boat trailers. This visual inspection
is the underlying justification for why this question was included on all surveys. Despite the fact
that there are far more boaters on the waterfront than there are boaters proximate to the
railroad at either interval, the level of concern related to the additional lowering of the bridge
was far higher than the percentage of people who actually owned boats and used those boats
regularly (Table 2).
1 4 6
30 26
46
272
0 3 7
3323 27
187
1 5 519 19
36
209
0
50
100
150
200
250
300
Daily Weekly Monthly Several times ayear
Once everyyear
Once every 5years
Never
Waterfront Within 400 feet of FEC Within 400-1,000 feet of FEC
9
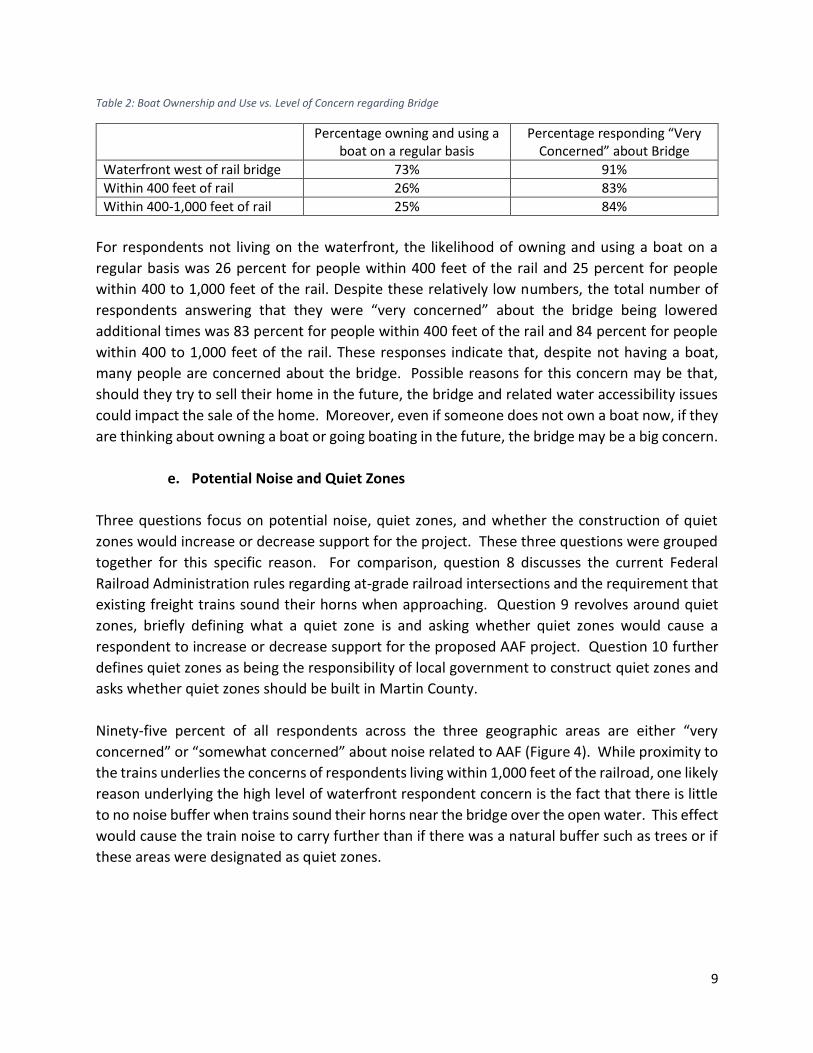
Table 2: Boat Ownership and Use vs. Level of Concern regarding Bridge
Percentage owning and using a boat on a regular basis
Percentage responding “Very Concerned” about Bridge
Waterfront west of rail bridge 73% 91%
Within 400 feet of rail 26% 83%
Within 400-1,000 feet of rail 25% 84%
For respondents not living on the waterfront, the likelihood of owning and using a boat on a
regular basis was 26 percent for people within 400 feet of the rail and 25 percent for people
within 400 to 1,000 feet of the rail. Despite these relatively low numbers, the total number of
respondents answering that they were “very concerned” about the bridge being lowered
additional times was 83 percent for people within 400 feet of the rail and 84 percent for people
within 400 to 1,000 feet of the rail. These responses indicate that, despite not having a boat,
many people are concerned about the bridge. Possible reasons for this concern may be that,
should they try to sell their home in the future, the bridge and related water accessibility issues
could impact the sale of the home. Moreover, even if someone does not own a boat now, if they
are thinking about owning a boat or going boating in the future, the bridge may be a big concern.
e. Potential Noise and Quiet Zones
Three questions focus on potential noise, quiet zones, and whether the construction of quiet
zones would increase or decrease support for the project. These three questions were grouped
together for this specific reason. For comparison, question 8 discusses the current Federal
Railroad Administration rules regarding at-grade railroad intersections and the requirement that
existing freight trains sound their horns when approaching. Question 9 revolves around quiet
zones, briefly defining what a quiet zone is and asking whether quiet zones would cause a
respondent to increase or decrease support for the proposed AAF project. Question 10 further
defines quiet zones as being the responsibility of local government to construct quiet zones and
asks whether quiet zones should be built in Martin County.
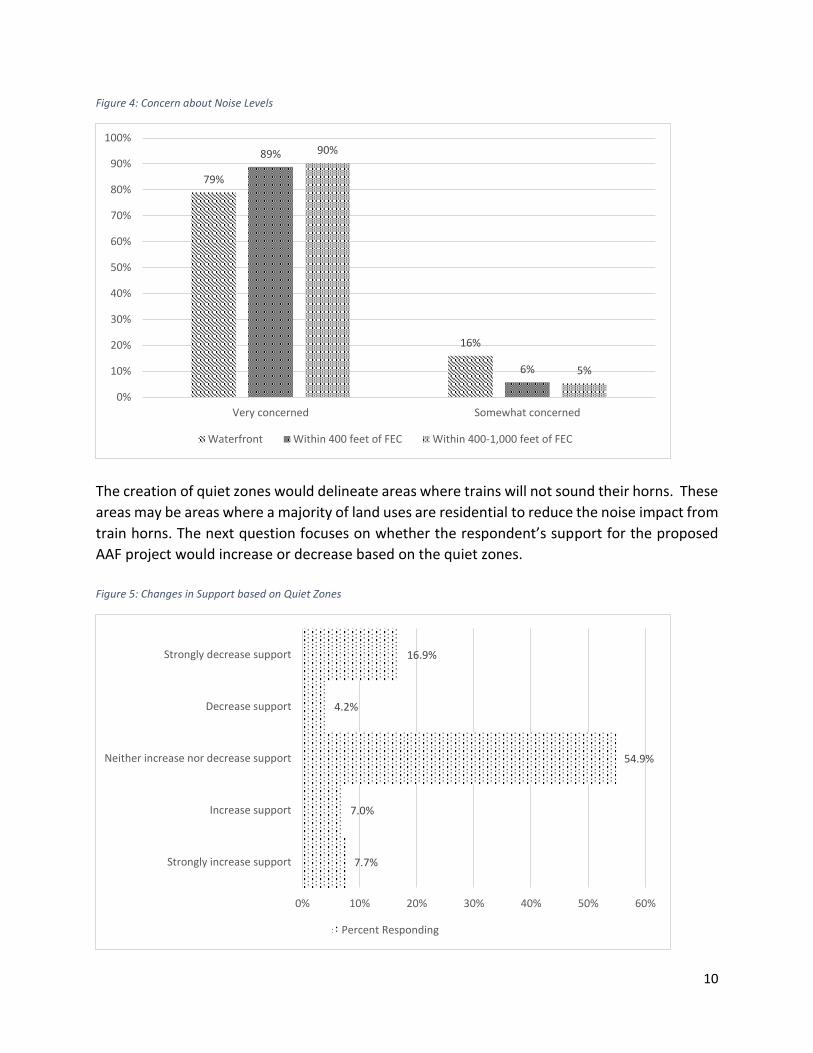
Ninety-five percent of all respondents across the three geographic areas are either “very
concerned” or “somewhat concerned” about noise related to AAF (Figure 4). While proximity to
the trains underlies the concerns of respondents living within 1,000 feet of the railroad, one likely
reason underlying the high level of waterfront respondent concern is the fact that there is little
to no noise buffer when trains sound their horns near the bridge over the open water. This effect
would cause the train noise to carry further than if there was a natural buffer such as trees or if
these areas were designated as quiet zones.
10
Figure 4: Concern about Noise Levels
The creation of quiet zones would delineate areas where trains will not sound their horns. These
areas may be areas where a majority of land uses are residential to reduce the noise impact from
train horns. The next question focuses on whether the respondent’s support for the proposed
AAF project would increase or decrease based on the quiet zones.
Figure 5: Changes in Support based on Quiet Zones
79%
16%
89%
6%
90%
5%
0%
10%
20%
30%
40%
50%
60%
70%
80%
90%
100%
Very concerned Somewhat concerned
Waterfront Within 400 feet of FEC Within 400-1,000 feet of FEC
7.7%
7.0%
54.9%
4.2%
16.9%
0% 10% 20% 30% 40% 50% 60%
Strongly increase support
Increase support
Neither increase nor decrease support
Decrease support
Strongly decrease support
Percent Responding

11
Figure 5 shows that even with the creation of quiet zones, nearly 55 percent of respondents said
that quiet zones will not increase or decrease their support for the proposed AAF project. Slightly
less than 15 percent of respondents said that quiet zones would either “increase support” or
“strongly increase support”. Given the general lack of support for the overall project, quiet zones
would further decrease support, with 17 percent of respondents reporting that quiet zones
would “greatly decrease support” for the proposed AAF project.
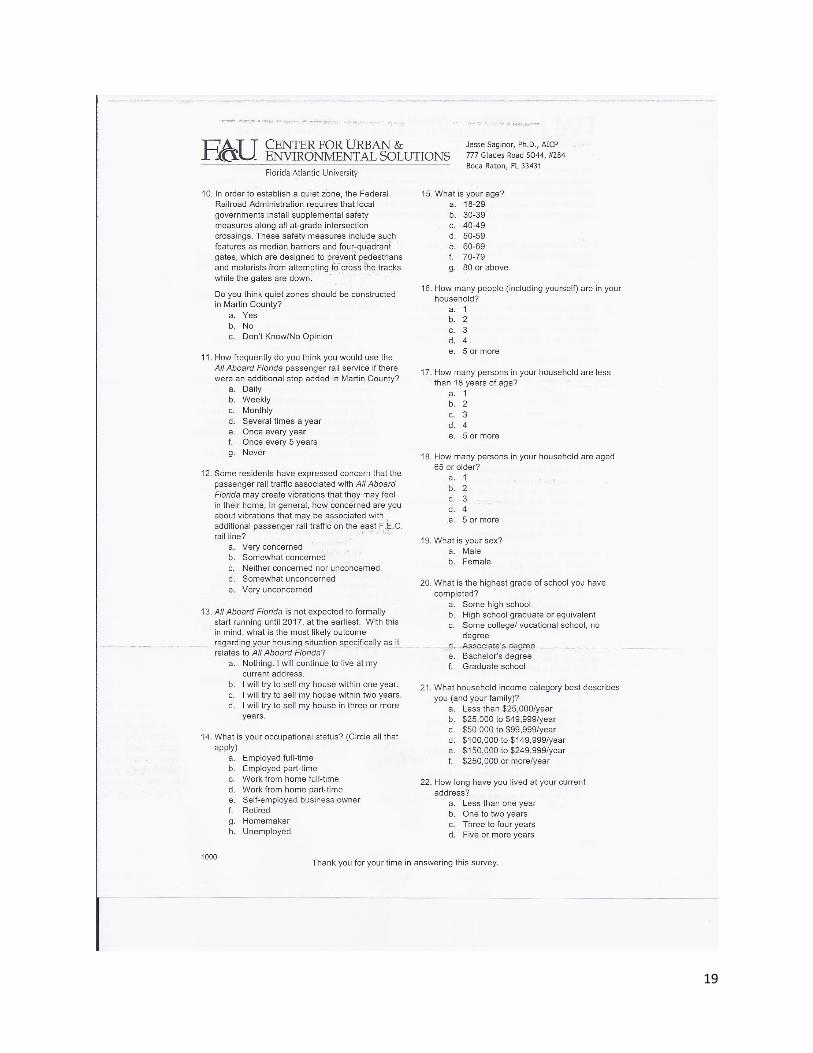
The last question regarding quiet zones further defines quiet by mentioning the construction
enhancements to maximize safety at crossings in quiet zones. The question is written as follows:
In order to establish a quiet zone, the Federal Railroad Administration requires that local
governments install supplemental safety measures along all at-grade intersection crossings.
These safety measures include such features as median barriers and four-quadrant gates,
which are designed to prevent pedestrians and motorists from attempting to cross the tracks
while the gates are down.
Do you think quiet zones should be constructed in Martin County?
A majority of respondents to this question (55.5 percent) answered that the quiet zones should
be built in Martin County, while 21 percent of respondents answered “Don’t know/No opinion”
and another 23.5 answered “No” (Figure 6).
Figure 6: Responses to whether Quiet Zones should be Constructed in Martin County
Irrespective of the answers, if the proposed AAF project comes to fruition, the construction of
quiet zones are likely to require funding from the county and municipalities. More importantly,
Yes, 55.5%No, 23.5%
Don't know/No opinion, 21.0%
12
the creation of these quiet zones will require extensive public relations to explain what quiet
zones are to the general public. Finally, there is a pretty solid chance that the crossing
improvements will result in temporary closures and delays at some at-grade intersections for
constructing the quiet zone crossing enhancements.
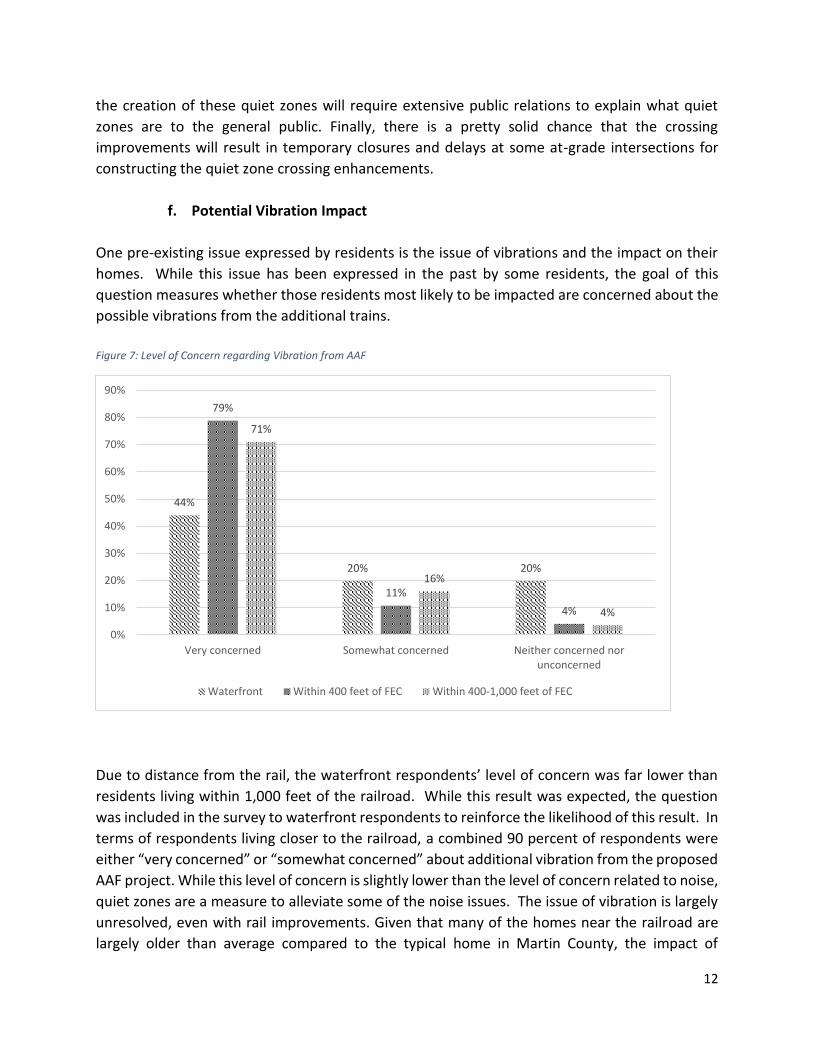
f. Potential Vibration Impact
One pre-existing issue expressed by residents is the issue of vibrations and the impact on their
homes. While this issue has been expressed in the past by some residents, the goal of this
question measures whether those residents most likely to be impacted are concerned about the
possible vibrations from the additional trains.
Figure 7: Level of Concern regarding Vibration from AAF
Due to distance from the rail, the waterfront respondents’ level of concern was far lower than
residents living within 1,000 feet of the railroad. While this result was expected, the question
was included in the survey to waterfront respondents to reinforce the likelihood of this result. In
terms of respondents living closer to the railroad, a combined 90 percent of respondents were
either “very concerned” or “somewhat concerned” about additional vibration from the proposed
AAF project. While this level of concern is slightly lower than the level of concern related to noise,
quiet zones are a measure to alleviate some of the noise issues. The issue of vibration is largely
unresolved, even with rail improvements. Given that many of the homes near the railroad are
largely older than average compared to the typical home in Martin County, the impact of
44%
20% 20%
79%
11%
4%
71%
16%
4%
0%
10%
20%
30%
40%
50%
60%
70%
80%
90%
Very concerned Somewhat concerned Neither concerned norunconcerned
Waterfront Within 400 feet of FEC Within 400-1,000 feet of FEC
13
vibration, in the long run, may become a greater cause for concern as the foundations of these
homes continue to age.
g. Potential Housing Impact and Situation
The impact on property and residential options for the future was asked in question 5 and
question 13. Question 5 simply asks whether the residents thought that the proposed AAF
project would greatly increase the property’s value, slightly increase the property’s value, have
no effect on property value, slightly decrease the property’s value, or greatly decrease the
property’s value. These options were included instead of attempting to list specific percentages,
mainly because a typical resident can have a general idea about the future direction of property
value, but may not have the required knowledge a realtor or appraiser has to determine the
specific percent decline or increase of a property.
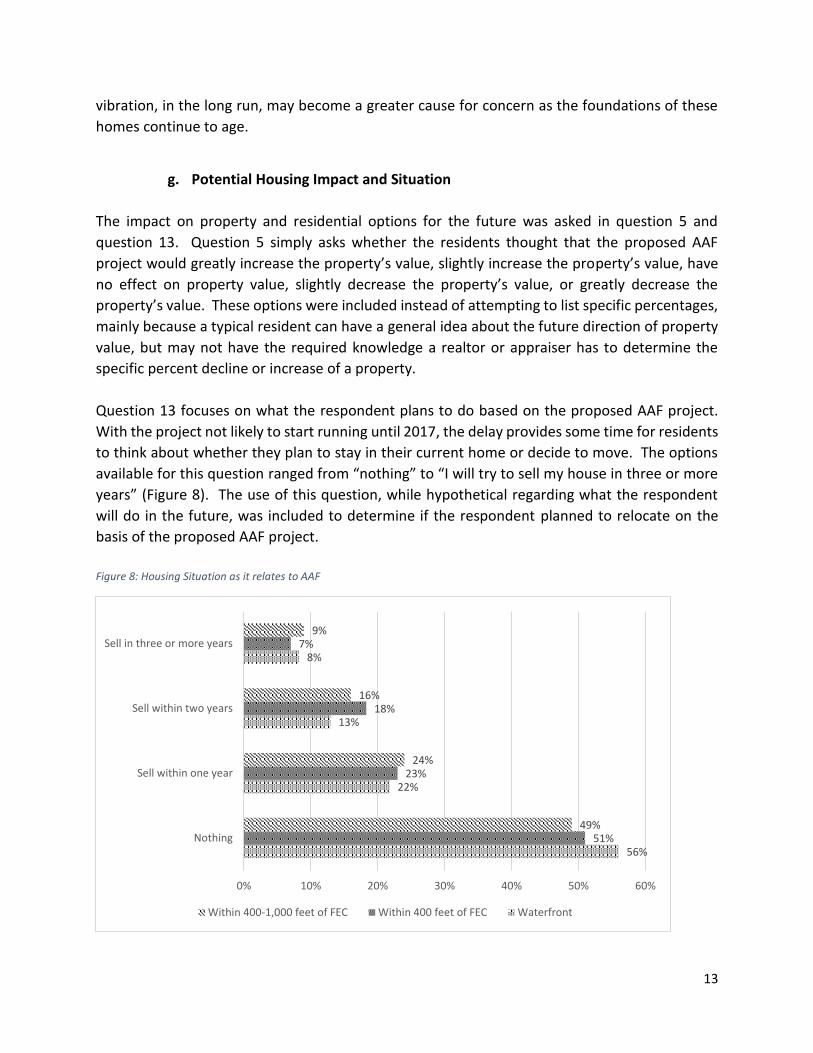
Question 13 focuses on what the respondent plans to do based on the proposed AAF project.
With the project not likely to start running until 2017, the delay provides some time for residents
to think about whether they plan to stay in their current home or decide to move. The options
available for this question ranged from “nothing” to “I will try to sell my house in three or more
years” (Figure 8). The use of this question, while hypothetical regarding what the respondent
will do in the future, was included to determine if the respondent planned to relocate on the
basis of the proposed AAF project.
Figure 8: Housing Situation as it relates to AAF
56%
22%
13%
8%
51%
23%
18%
7%
49%
24%
16%
9%
0% 10% 20% 30% 40% 50% 60%
Nothing
Sell within one year
Sell within two years
Sell in three or more years
Within 400-1,000 feet of FEC Within 400 feet of FEC Waterfront
14
The large number of “nothing” respondents should not be construed as supporting the proposed
AAF project. Further analysis of respondents to this question reveals that 62 percent of
respondents answering “nothing” to this question are 60 or older. Moreover, 11 percent of
respondents who answer “nothing” are over the age of 80. The hassle of moving elsewhere in
the twilight of their lives due to issues related to the train is not feasible for many people in
retirement.
IV. Conclusion
The overall purpose of this survey was to understand resident perceptions of the proposed AAF
project. These survey results provide insight into respondents’ perceived impacts of the project,
and should AAF come to fruition, a follow-up survey in a few years may determine whether the
worst fears of these residents came true, and whether their actual use of AAF is equally low
compared to their current likelihood of their use. Despite unbiased questions and rigorous
mining of the responses, there is little to no support of the proposed AAF project by those
respondents most likely to be impacted by the project. Quiet zones to minimize the impact of
noise on respondents did not register a major change in their level of support for the project.
Two other major areas of concern, additional bridge closures and the impact of vibrations, remain
as two largely unresolved issues should the AAF project move forward. To determine whether
the lack of support was due to the lack of a train stop in Martin County, respondent frequency of
use increased only slightly. Even with the convenience of a stop closer than the nearest stop in
West Palm Beach, respondent use of AAF does not drastically improve. In concluding, based on
multiple questions, the responses indicate a clear and consistent lack of support for the proposed
AAF project by those respondents most impacted by the project.

15
APPENDICES

16
Appendix A: Survey Letter of Solicitation and Survey Instrument

17
18
19
20
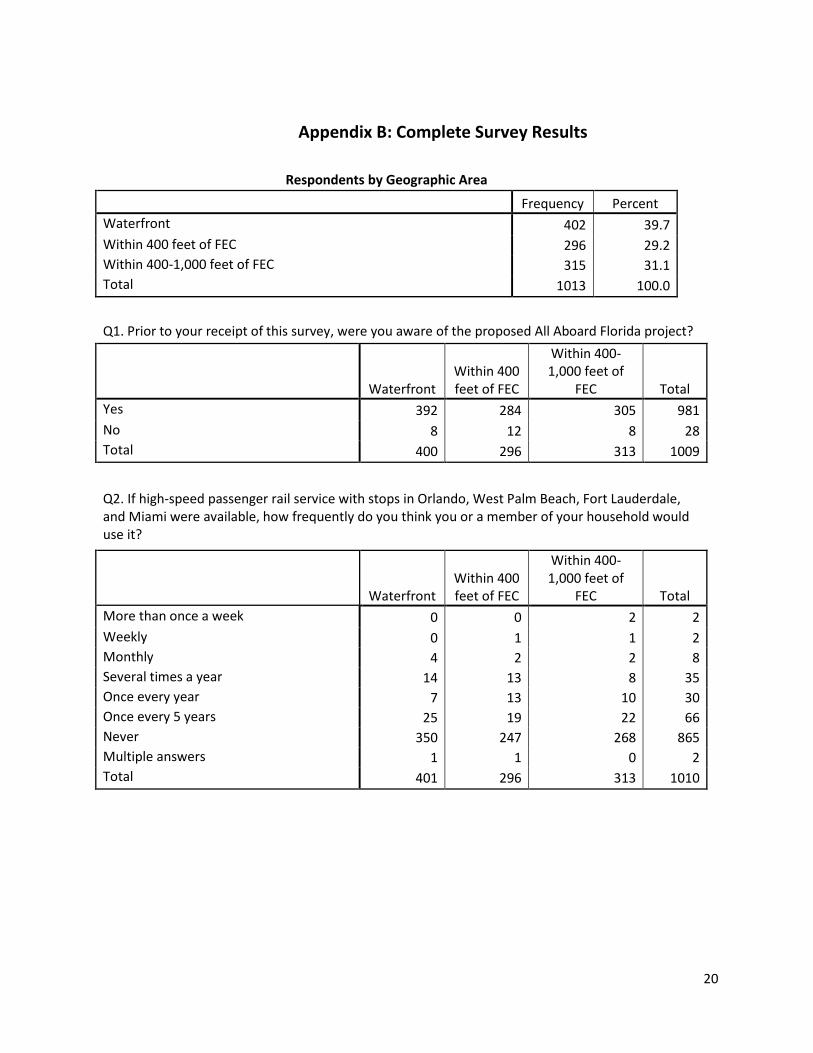
Appendix B: Complete Survey Results
Respondents by Geographic Area
Frequency Percent
Waterfront 402 39.7
Within 400 feet of FEC 296 29.2
Within 400-1,000 feet of FEC 315 31.1
Total 1013 100.0
Q1. Prior to your receipt of this survey, were you aware of the proposed All Aboard Florida project?
Waterfront Within 400 feet of FEC
Within 400-1,000 feet of
FEC Total
Yes 392 284 305 981
No 8 12 8 28
Total 400 296 313 1009
Q2. If high-speed passenger rail service with stops in Orlando, West Palm Beach, Fort Lauderdale, and Miami were available, how frequently do you think you or a member of your household would use it?
Waterfront Within 400 feet of FEC
Within 400-1,000 feet of
FEC Total
More than once a week 0 0 2 2
Weekly 0 1 1 2
Monthly 4 2 2 8
Several times a year 14 13 8 35
Once every year 7 13 10 30
Once every 5 years 25 19 22 66
Never 350 247 268 865
Multiple answers 1 1 0 2
Total 401 296 313 1010

21
Q3. Which of the following best describes your use of your property?
Waterfront Within 400 feet of FEC
Within 400-1,000 feet of
FEC Total
Used as primary residence 369 245 267 881
Used seasonally 13 20 26 59
Used as a vacation home 2 3 2 7
Used as a weekend retreat 3 1 0 4
Used as a rental property 13 24 13 50
Multiple answers 1 3 3 7
Total 401 296 311 1008
Q4. In general, do you support or oppose the adoption of high-speed, passenger rail service along the east F.E.C. rail line?
Waterfront Within 400 feet of FEC
Within 400-1,000 feet of
FEC Total
Strongly support 8 9 7 24
Somewhat support 9 8 6 23
Neither favor nor oppose/No opinion 13 14 9 36
Somewhat oppose 14 19 22 55
Strongly oppose 357 246 266 869
Multiple answers 0 0 2 2
Total 401 296 312 1009
Q5. What impact, if any, do you think that the proposed passenger rail service along the east F.E.C. rail line will have on the value of your property?
Waterfront Within 400 feet of FEC
Within 400-1,000 feet of
FEC Total
Greatly increase the property's value 3 3 0 6
Slightly increase the property's value 2 2 1 5
No effect on the property's value 48 14 19 81
Slightly decrease the property's value 67 28 45 140
Greatly decrease the property's value 277 246 244 767
Multiple answers 0 0 1 1
Total 397 293 310 1000
22
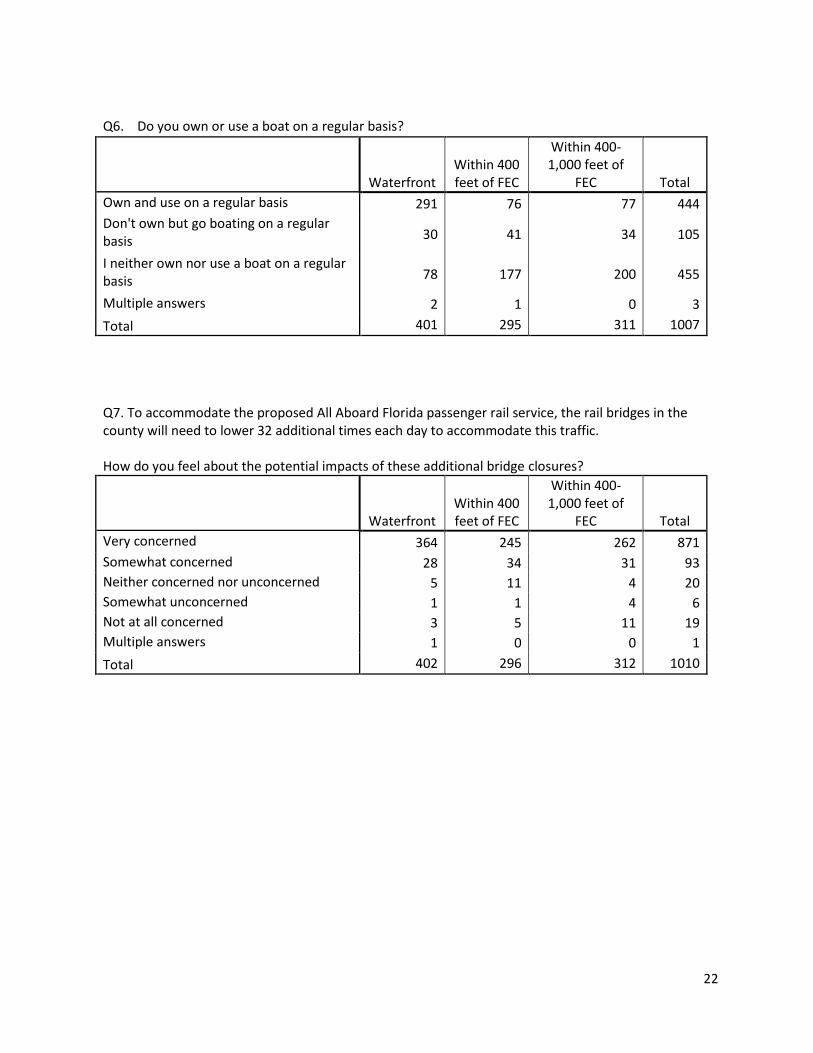
Q6. Do you own or use a boat on a regular basis?
Waterfront Within 400 feet of FEC
Within 400-1,000 feet of
FEC Total
Own and use on a regular basis 291 76 77 444
Don't own but go boating on a regular basis 30 41 34 105
I neither own nor use a boat on a regular basis 78 177 200 455
Multiple answers 2 1 0 3
Total 401 295 311 1007
Q7. To accommodate the proposed All Aboard Florida passenger rail service, the rail bridges in the county will need to lower 32 additional times each day to accommodate this traffic. How do you feel about the potential impacts of these additional bridge closures?
Waterfront Within 400 feet of FEC
Within 400-1,000 feet of
FEC Total
Very concerned 364 245 262 871
Somewhat concerned 28 34 31 93
Neither concerned nor unconcerned 5 11 4 20
Somewhat unconcerned 1 1 4 6
Not at all concerned 3 5 11 19
Multiple answers 1 0 0 1
Total 402 296 312 1010

23
Q8. The Federal Railroad Administration requires that trains use horns to announce their approach to an at-grade intersection. Because the east F.E.C. rail line intersects with streets at grade in Martin County, this means that each passenger train passing through Martin County will need to sound its horn, similar to the manner in which the existing freight trains using the east F.E.C. rail line use their horns.
How do you feel about the potential noise impacts of the additional train traffic associated with the proposed All Aboard Florida project?
Waterfront
Within 400 feet of FEC
Within 400-1,000 feet of
FEC Total
Very concerned 314 263 282 859
Somewhat concerned 65 18 17 100
Neither concerned nor unconcerned 11 6 6 23
Somewhat unconcerned 2 0 1 3
Not at all concerned 8 9 7 24
Total 400 296 313 1009
Q9. The Federal Railroad Administration allows municipalities to establish quiet zones along railroad tracks, where trains will not sound their horns. How would the provision of a quiet zone along the proposed All Aboard Florida route impact your support for this project?
Waterfront Within 400 feet of FEC
Within 400-1,000 feet of
FEC Total
Strongly increase support 20 32 25 77
Increase support 22 26 22 70
Neither increase nor decrease support 242 150 158 550
Decrease support 14 8 20 42
Strongly decrease support 66 50 53 169
Don't know/No opinion 33 24 32 89
Multiple answers 1 1 2 4
Total 398 291 312 1001

24
Q10. In order to establish a quiet zone, the Federal Railroad Administration requires that local governments install supplemental safety measures along all at-grade intersection crossings. These safety measures include such features as median barriers and four-quadrant gates, which are designed to prevent pedestrians and motorists from attempting to cross the tracks while the gates are down.
Do you think quiet zones should be constructed in Martin County?
Waterfront Within 400 feet of FEC
Within 400-1,000 feet of
FEC Total
Yes 182 175 171 528
No 94 63 66 223
Don't know/No opinion 106 42 52 200
Total 382 280 289 951
Q11. How frequently do you think you would use the All Aboard Florida passenger rail service if there were an additional stop added in Martin County?
Waterfront Within 400 feet of FEC
Within 400-1,000 feet of
FEC Total
Daily 1 0 1 2
Weekly 4 3 5 12
Monthly 6 7 5 18
Several times a year 30 33 19 82
Once every year 26 23 19 68
Once every 5 years 46 27 36 109
Never 272 187 209 668
Multiple answers 0 2 2 4
Total 385 282 296 963
25
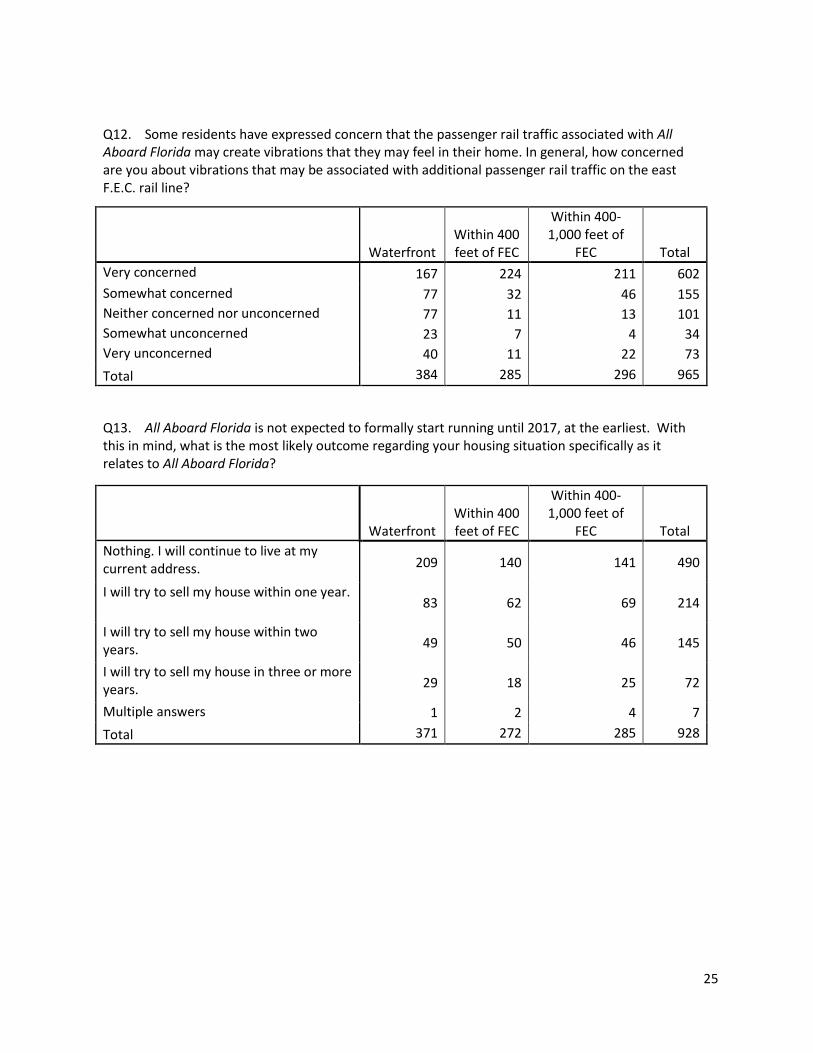
Q12. Some residents have expressed concern that the passenger rail traffic associated with All Aboard Florida may create vibrations that they may feel in their home. In general, how concerned are you about vibrations that may be associated with additional passenger rail traffic on the east F.E.C. rail line?
Waterfront Within 400 feet of FEC
Within 400-1,000 feet of
FEC Total
Very concerned 167 224 211 602
Somewhat concerned 77 32 46 155
Neither concerned nor unconcerned 77 11 13 101
Somewhat unconcerned 23 7 4 34
Very unconcerned 40 11 22 73
Total 384 285 296 965
Q13. All Aboard Florida is not expected to formally start running until 2017, at the earliest. With this in mind, what is the most likely outcome regarding your housing situation specifically as it relates to All Aboard Florida?
Waterfront Within 400 feet of FEC
Within 400-1,000 feet of
FEC Total
Nothing. I will continue to live at my current address. 209 140 141 490
I will try to sell my house within one year. 83 62 69 214
I will try to sell my house within two years. 49 50 46 145
I will try to sell my house in three or more years. 29 18 25 72
Multiple answers 1 2 4 7
Total 371 272 285 928
26
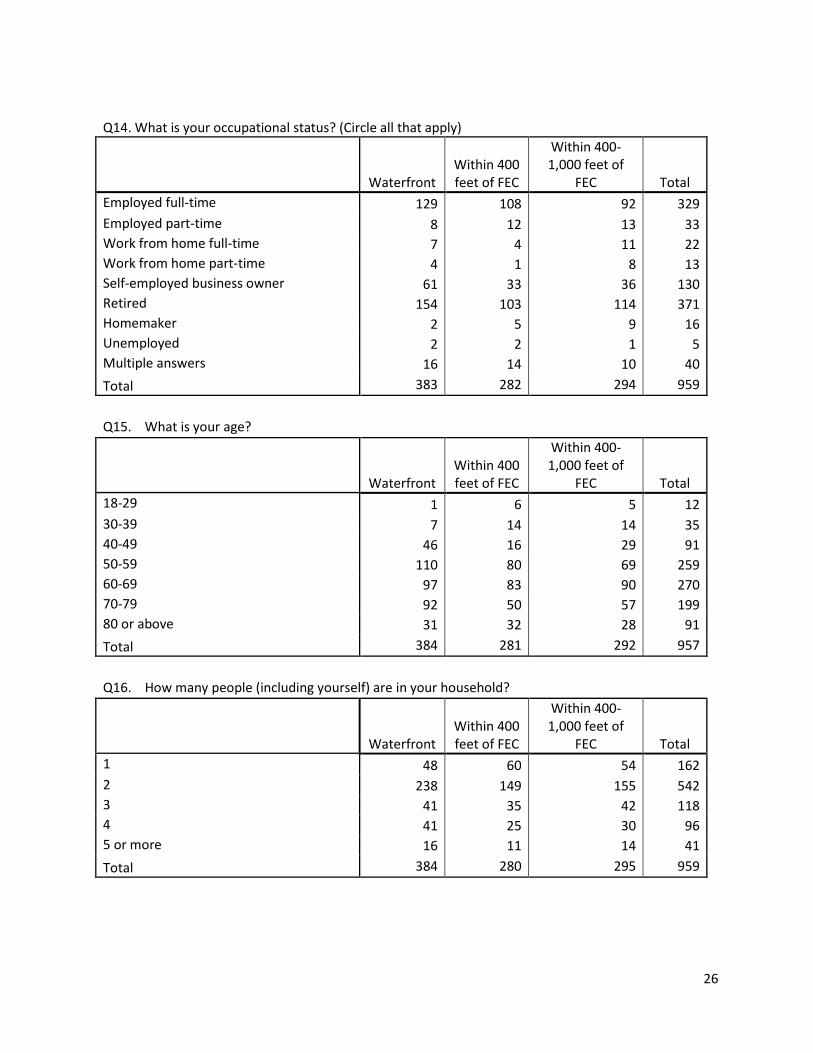
Q14. What is your occupational status? (Circle all that apply)
Waterfront Within 400 feet of FEC
Within 400-1,000 feet of
FEC Total
Employed full-time 129 108 92 329
Employed part-time 8 12 13 33
Work from home full-time 7 4 11 22
Work from home part-time 4 1 8 13
Self-employed business owner 61 33 36 130
Retired 154 103 114 371
Homemaker 2 5 9 16
Unemployed 2 2 1 5
Multiple answers 16 14 10 40
Total 383 282 294 959
Q15. What is your age?
Waterfront Within 400 feet of FEC
Within 400-1,000 feet of
FEC Total
18-29 1 6 5 12
30-39 7 14 14 35
40-49 46 16 29 91
50-59 110 80 69 259
60-69 97 83 90 270
70-79 92 50 57 199
80 or above 31 32 28 91
Total 384 281 292 957
Q16. How many people (including yourself) are in your household?
Waterfront Within 400 feet of FEC
Within 400-1,000 feet of
FEC Total
1 48 60 54 162
2 238 149 155 542
3 41 35 42 118
4 41 25 30 96
5 or more 16 11 14 41
Total 384 280 295 959
27
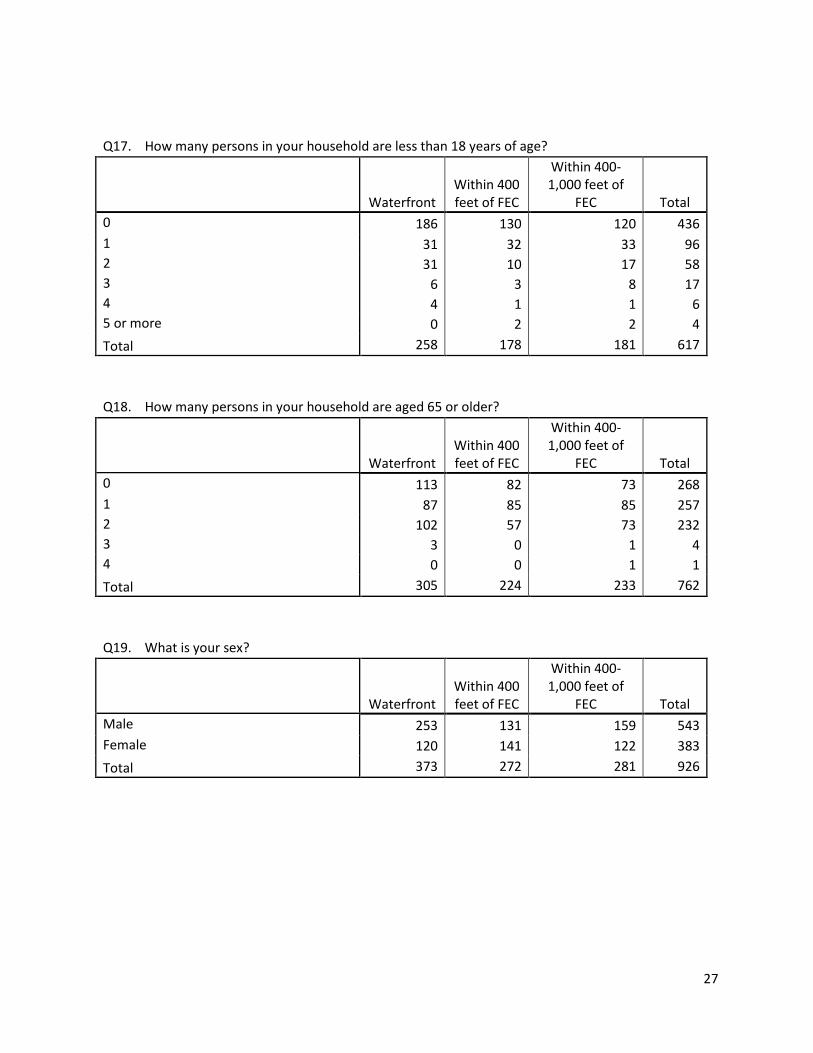
Q17. How many persons in your household are less than 18 years of age?
Waterfront Within 400 feet of FEC
Within 400-1,000 feet of
FEC Total
0 186 130 120 436
1 31 32 33 96
2 31 10 17 58
3 6 3 8 17
4 4 1 1 6
5 or more 0 2 2 4
Total 258 178 181 617
Q18. How many persons in your household are aged 65 or older?
Waterfront Within 400 feet of FEC
Within 400-1,000 feet of
FEC Total
0 113 82 73 268
1 87 85 85 257
2 102 57 73 232
3 3 0 1 4
4 0 0 1 1
Total 305 224 233 762
Q19. What is your sex?
Waterfront Within 400 feet of FEC
Within 400-1,000 feet of
FEC Total
Male 253 131 159 543
Female 120 141 122 383
Total 373 272 281 926

28
Q20. What is the highest grade of school you have completed?
Waterfront Within 400 feet of FEC
Within 400-1,000 feet of
FEC Total
Some high school 3 0 5 8
High school graduate or equivalent 25 34 36 95
Some college/vocational school, no degree 74 84 70 228
Associate's degree 40 31 33 104
Bachelor's degree 127 84 79 290
Graduate school 110 44 68 222
Total 379 277 291 947
Q21. What household income category best describes you (and your family)?
Waterfront Within 400 feet of FEC
Within 400-1,000 feet of
FEC Total
Less than $25,000/year 10 27 27 64
$25,000 to $49,999/year 29 48 47 124
$50,000 to $99,999/year 89 85 86 260
$100,000 to $149,999/year 70 43 40 153
$150,000 to $249,999/year 61 22 35 118
$250,000 or more/year 76 21 34 131
Total 335 246 269 850
Q22. How long have you lived at your current address?
Waterfront Within 400 feet of FEC
Within 400-1,000 feet of
FEC Total
Less than one year 19 8 8 35
One or two years 29 18 27 74
Three to four years 30 27 30 87
Five or more years 307 230 229 766
Multiple answers 1 0 0 1
Total 386 283 294 963