residential outdoor lighting power -...
TRANSCRIPT

CODE
NonAllo
Measur
Nonres
2016 C
Califor
Prepar
This report wthe auspices oCopyright 20Company, LoAll rights reseNeither PG&liability or rein this documcopyrights.
ES AND S
residewancere Number:
sidential Lig
CALIFORN
rnia Utilities
red by: Mich
With
was prepared by thof the California P014 Pacific Gas anos Angeles Departmerved, except that
&E, SCE, SDG&Eesponsibility for thment; or represen
STANDA
entiale2016-NR-LT
hting
NIA BUILD
Statewide C
hael Mutman
technical su
e California StatewPublic Utilities Comnd Electric Compament of Water andthis document ma
E, SoCalGas, LADhe accuracy, compts that its use will
ARDS EN
Outdo
TG3-F
DING ENE
Codes and St
nsky (TRC En
upport from D
wide Utility Codemmission. any, Southern Cald Power. ay be used, copied,DWP nor any of ipleteness or useful not infringe any
NHANCE
oor Li
ERGY EF
tandards Tea
nergy Servic
Darcie Chin
es and Standards P
ifornia Edison, So
, and distributed wits employees makulness of any datay privately-owned
EMENT I
ighting
FFICIENC
am
ces)
nnis (Clanton
Program and funde
outhern California
without modificatiokes any warranty,a, information, me
rights including,
NITIATI
g Pow
Y STAND
n & Associa
ed by the Californ
a Gas Company, S
on. , express of implieethod, product, po but not limited to
VE (CAS
wer
DARDS
December
tes, Inc.)
nia utility customer
San Diego Gas &
ed; or assumes anolicy or process do, patents, tradem
SE)
2014
rs under
Electric
ny legaldisclosed marks or
California Energy Commission
TN # 74 56
JAN 2 2015
DOCKETED
2016 Title 24 CASE Report –Measure Number: 2016-NR-LTG3-F Page i
TABLE OF CONTENTS
Executive Summary ............................................................................................... xi1. Introduction ............................................................................................... 12. Measure Description ................................................................................. 2
2.1 Measure Overview ....................................................................................................... 22.1.1 Measure Description ...................................................................................................... 22.1.2 Measure History ............................................................................................................. 32.1.3 Existing Standards .......................................................................................................... 42.1.4 Alignment with Zero Net Energy Goals ........................................................................ 42.1.5 Relationship to Other Title 24 Measures ....................................................................... 5
2.2 Summary of Changes to Code Documents ................................................................ 52.2.1 Catalogue of Proposed Changes .................................................................................... 52.2.2 Standards Change Summary .......................................................................................... 62.2.3 Standards Reference Appendices Change Summary ..................................................... 62.2.4 Nonresidential Alternative Calculation Method (ACM) Reference Manual Change
Summary ........................................................................................................................ 62.2.5 Compliance Forms Change Summary ........................................................................... 72.2.6 Simulation Engine Adaptations ..................................................................................... 72.2.7 Other Areas Affected ..................................................................................................... 7
2.3 Code Implementation .................................................................................................. 72.3.1 Verifying Code Compliance .......................................................................................... 72.3.2 Code Implementation ..................................................................................................... 72.3.3 Acceptance Testing ........................................................................................................ 7
2.4 Issues Addressed During CASE Development Process ............................................ 7
3. Market Analysis ......................................................................................... 83.1 Market Structure ......................................................................................................... 9
3.2 Market Availability and Current Practices ............................................................... 9
3.3 Useful Life, Persistence, and Maintenance ................................................................ 9
3.4 Market Impacts and Economic Assessments ........................................................... 103.4.1 Impact on Builders ....................................................................................................... 103.4.2 Impact on Building Designers ...................................................................................... 103.4.3 Impact on Occupational Safety and Health .................................................................. 103.4.4 Impact on Building Owners and Occupants ................................................................ 10

2016 Title 24 CASE Report –Measure Number: 2016-NR-LTG3-F Page ii
3.4.5 Impact on Retailers (including manufacturers and distributors) .................................. 103.4.6 Impact on Energy Consultants ..................................................................................... 103.4.7 Impact on Building Inspectors ..................................................................................... 103.4.8 Impact on Statewide Employment ............................................................................... 10
3.5 Economic Impacts ...................................................................................................... 103.5.1 Creation or Elimination of Jobs ................................................................................... 113.5.2 Creation or Elimination of Businesses within California ............................................ 113.5.3 Competitive Advantages or Disadvantages for Businesses within California ............. 133.5.4 Increase or Decrease of Investments in the State of California ................................... 133.5.5 Incentives for Innovation in Products, Materials, or Processes ................................... 143.5.6 Effects on the State General Fund, State Special Funds and Local Governments ....... 14
4. Methodology ............................................................................................. 154.1 Existing Conditions .................................................................................................... 15
4.2 Proposed Conditions .................................................................................................. 15
4.3 Calculation Methodology .......................................................................................... 15
4.4 Prototype Building Sites ............................................................................................ 18
4.5 Climate Dependent ..................................................................................................... 20
4.6 Time Dependent Valuation ....................................................................................... 20
4.7 Energy Impacts Methodology ................................................................................... 204.7.1 Per Unit Energy Impacts Methodology ....................................................................... 214.7.2 Statewide Energy Impacts Methodology ..................................................................... 21
4.8 Cost-effectiveness Methodology ................................................................................ 284.8.1 Incremental Cost Methodology .................................................................................... 284.8.2 Cost Savings Methodology .......................................................................................... 294.8.3 Cost-effectiveness Methodology .................................................................................. 29
4.9 Environmental Impacts Methodology ...................................................................... 304.9.1 Greenhouse Gas Emissions Impacts Methodology ...................................................... 304.9.2 Water Use Impacts Methodology ................................................................................ 304.9.3 Material Impacts Methodology (Optional) .................................................................. 304.9.4 Other Impacts Methodology ........................................................................................ 30
5. Analysis and Results ................................................................................ 305.1 Energy Impacts Results ............................................................................................. 305.1.1 Per Unit Energy Impacts Results ................................................................................. 325.1.2 Statewide Energy Impacts Results ............................................................................... 38
5.2 Cost-effectiveness Results .......................................................................................... 38

2016 Title 24 CASE Report –Measure Number: 2016-NR-LTG3-F Page iii
5.2.1 Incremental Cost Results ............................................................................................. 385.2.2 Cost Savings Results .................................................................................................... 395.2.3 Cost-effectiveness Results ........................................................................................... 41
5.3 Environmental Impacts Results ................................................................................ 425.3.1 Greenhouse Gas Emissions Results ............................................................................. 425.3.2 Water Use and Water Quality Impacts ......................................................................... 425.3.3 Material Impacts Results .............................................................................................. 425.3.4 Other Impacts Results .................................................................................................. 42
6. Proposed Language ................................................................................. 436.1 Standards .................................................................................................................... 43
6.2 Reference Appendices ................................................................................................ 49
6.3 ACM Reference Manual ............................................................................................ 49
6.4 Compliance Manuals ................................................................................................. 49
6.5 Compliance Forms ..................................................................................................... 49
7. References and Other Research ............................................................. 50Appendix A: Environmental Impacts Methodology .......................................... 52Appendix B: Outdoor Lighting Calculations Methodology .............................. 53Appendix C: Outdoor Lighting LPA Calculations Results ............................... 58Appendix D: Models for General Calculations ................................................... 70Appendix E: Lighting Use Profiles for Calculations .......................................... 72Appendix F: General Hardscape Cost Effectiveness Calculations ................... 79Appendix G: Statewide General Hardscape Area Estimates Information ...... 86Appendix H: Cost Effectiveness Calculation Information for Other Line Items .................................................................................................................................. 90Appendix I: Statewide Cost Effectiveness Calculation Results .......................145
2016 Title 24 CASE Report –Measure Number: 2016-NR-LTG3-F Page iv
List of Tables
Table 1: Scope of Code Change Proposal...................................................................................... xi
Table 2: Estimated First Year Energy Savings ............................................................................ xiv
Table 3: Cost-effectiveness Summary1 – Statewide Weighted Average Across Lighting Zones for all Measure Line-Items ........................................................................................................... xv
Table 4: Estimated Statewide Greenhouse Gas Emissions Impacts ............................................ xvi
Table 5: Scope of Code Change Proposal....................................................................................... 5
Table 6: Sections of Standards Impacted by Proposed Code Change ............................................ 5
Table 7: Industries Receiving Energy Efficiency Related Investment, by North American Industry Classification System (NAICS) Code ...................................................................... 13
Table 8: Sample of Calculations for Building Entrance Baseline Scenario ................................. 16
Table 9: Sample of Calculations for Building Entrance LED Scenario ....................................... 17
Table 10: Sample of Calculation of Building Entrance Efficacy Adjustments ............................ 17
Table 11: Prototype Sites used for Energy Impact Analysis ........................................................ 19
Table 12: Additional Ideal Prototype Site used for Energy Impact Analysis ............................... 19
Table 13: Prototype Sites used for Cost Impact Analysis............................................................. 20
Table 14: Key assumptions for per unit Energy Impacts Analysis ............................................... 21
Table 15: Lighting Zone Area and Likely Construction Activity within the Respective Lighting Zones in the State ................................................................................................................... 22
Table 16: Proxy Assumptions for Statewide Impacts Estimate Calculations for Specific Applications ........................................................................................................................... 23
Table 17: Proxy Assumptions for Statewide Impacts Estimate Calculations for General Hardscape ............................................................................................................................... 24
Table 18: Description of Space Types used in the Nonresidential New Construction Forecast .. 25
Table 19. Translation from FCZ to BCZ ...................................................................................... 26
Table 20: Estimated New Nonresidential Construction in 2017 by Climate Zone and Building Type (Million Square Feet) .................................................................................................... 27
Table 21: Key Assumptions for per unit Incremental Construction Cost ..................................... 29
Table 22: Outdoor Lighting LPA Recommendations Table ......................................................... 31
Table 23: Outdoor Lighting LPA Recommendations Reduction Percentage Table ..................... 32
Table 24: Effective Power Density Impacts per Square Foot of General Hardscape ................... 33
Table 25: Energy Impacts per Square Foot – General Hardscape ................................................ 33
Table 26: Energy Impacts per Unit – Other Line Items LZ1 ........................................................ 34
Table 27: Energy Impacts per Unit – Other Line Items LZ2 ........................................................ 35

2016 Title 24 CASE Report –Measure Number: 2016-NR-LTG3-F Page v
Table 28: Energy Impacts per Unit – Other Line Items LZ3 ........................................................ 36
Table 29: Energy Impacts per Unit – Other Line Items LZ4 ........................................................ 37
Table 30: Statewide Energy Impacts ............................................................................................ 38
Table 31: Lighting Zone Area Weighting Factors ........................................................................ 39
Table 32: Weighted TDV Energy Cost Savings Over 15 Years - Per Unit .................................. 40
Table 33: Per Unit Cost-effectiveness Summary – General Hardscape by Lighting Zone .......... 41
Table 34: Cost-effectiveness Summary1 – Statewide Weighted Average Across Lighting Zones for all Measure Line-Items ..................................................................................................... 41
Table 35: Statewide Greenhouse Gas Emissions Impacts ............................................................ 42
Table 36: Impacts of Water Use and Water Quality ..................................................................... 42
Table 37: Cost-effectiveness Summary1 – Weighted Average Across Lighting Zones ............. 146
List of Figures
Figure 1: Diagram of LED Chip Efficacy Projections .................................................................. 54
Figure 2: LED Chip Efficacy and Price Projections ..................................................................... 55
Figure 3: Roadway and Area Luminaire Efficacy Projections with 95% Confidence Bands. ..... 55
Figure 4: LED Luminaire Efficacy Projections Compared To ‘Best in Class’ HID and LFL Products .................................................................................................................................. 57
Figure 5: General Hardscape Possible LPA Calculation Results LZ1-1 ...................................... 58
Figure 6: General Hardscape Possible LPA Calculation Results LZ1-2 ...................................... 59
Figure 7: General Hardscape Possible LPA Calculation Results LZ1-3 ...................................... 60
Figure 8: General Hardscape Possible LPA Calculation Results LZ2-1 ...................................... 61
Figure 9: General Hardscape Possible LPA Calculation Results LZ2-2 ...................................... 62
Figure 10: General Hardscape Possible LPA Calculation Results LZ3-1 .................................... 63
Figure 11: General Hardscape Possible LPA Calculation Results LZ3-2 .................................... 64
Figure 12: General Hardscape Possible LPA Calculation Results LZ3-3 .................................... 65
Figure 13: General Hardscape Possible LPA Calculation Results LZ4-1 .................................... 66
Figure 14: General Hardscape Possible LPA Calculation Results LZ4-2 .................................... 67
Figure 15: General Hardscape Effective LPA Calculation Results .............................................. 68
Figure 16: General Hardscape Effective Watts Per Square Foot LPA Adjustment Results based on Nine Prototype Properties ................................................................................................. 69
Figure 17: Nine Site Prototypes Used to Calculate Reasonable Site Impact Calculations ........... 70

2016 Title 24 CASE Report –Measure Number: 2016-NR-LTG3-F Page vi
Figure 18: Three Site Prototypes Used to Calculate Cost Calculations for LED Lighting Systems ................................................................................................................................................ 71
Figure 19: Nonresidential Outdoor Lighting Use Curve for General Hardscape (Statewide Use Estimates Only) ...................................................................................................................... 72
Figure 20: Hotel Outdoor Lighting Use Curve for General Hardscape (Statewide Use Estimates Only)....................................................................................................................................... 73
Figure 21: Retail Outdoor Lighting Use Curve for General Hardscape (Statewide Use Estimates Only)....................................................................................................................................... 73
Figure 22: Schedule A: Winter and Summer Curves .................................................................... 74
Figure 23: Schedule B: Winter and Summer Curves .................................................................... 74
Figure 24: Schedule C: Winter and Summer Curves .................................................................... 75
Figure 25: General Hardscape Use Schedule ................................................................................ 75
Figure 26: ATM Use Schedule ..................................................................................................... 76
Figure 27: Retail Lighting Use Schedule ...................................................................................... 76
Figure 28: Service Station Canopies Use Schedule ...................................................................... 77
Figure 29: Service Station Hardscape Use Schedule .................................................................... 77
Figure 30: Lighting Application Schedule Use Matrix................................................................. 78
Figure 31: Luminaire Costs for Construction, Based on Factory Representative Quotes and Adjusted Forward ................................................................................................................... 79
Figure 32: Itemized Costs for Construction, Based on RS Means and Adjusted Forward ........... 80
Figure 33: Costing Calculations for LZ1 of Real Site Design ...................................................... 81
Figure 34: Costing Calculations for LZ2 of Real Site Design ...................................................... 82
Figure 35: Costing Calculations for LZ3 of Real Site Design ...................................................... 83
Figure 36: Costing Calculations for LZ4 of Real Site Design ...................................................... 84
Figure 37: Costing Calculations for Real Site Designs of Three Sites in Four Lighting Zones ... 85
Figure 38: Parking Space Requirements for Various Metropolitan Regions ............................... 88
Figure 39: Representative Code Parking Space Requirements Employed ................................... 88
Figure 40: Parking Space Area Multipliers Applied in Statewide Calculations ........................... 89
Figure 41: Building Entrances Calculation Results and Recommendations ................................ 90
Figure 42: Building Entrances Lumen Equivalency Calculation Pt. 1 ......................................... 91
Figure 43: Building Entrances Lumen Equivalency Calculation Pt. 2 ......................................... 92
Figure 44: Building Entrances Cost Calculation Pt. 1 .................................................................. 93
Figure 45: Building Entrances Cost Calculation Pt. 2 .................................................................. 94
Figure 46: Building Primary Entrances Calculation Results and Recommendations................... 95
2016 Title 24 CASE Report –Measure Number: 2016-NR-LTG3-F Page vii
Figure 47: Building Primary Entrances Lumen Equivalency Calculation Pt. 1 ........................... 95
Figure 48: Building Primary Entrances Lumen Equivalency Calculation Pt. 2 ........................... 96
Figure 49: Building Primary Entrances Cost Calculation Pt. 1 .................................................... 97
Figure 50: Building Primary Entrances Cost Calculation Pt. 2 .................................................... 98
Figure 51: Drive-Up Windows Calculation Results and Recommendations ................................ 99
Figure 52: Drive-Up Windows Lumen Equivalency Calculation Pt. 1 ........................................ 99
Figure 53: Drive-Up Windows Lumen Equivalency Calculation Pt. 2 ...................................... 100
Figure 54: Drive-Up Windows Cost Calculation Pt. 1 ............................................................... 101
Figure 55: Drive-Up Windows Cost Calculation Pt. 2 ............................................................... 102
Figure 56: Vehicle Service Station Uncovered Fuel Dispenser Calculation Results and Recommendations ................................................................................................................ 103
Figure 57: Vehicle Service Station Uncovered Fuel Dispenser Lumen Equivalency Calculation Pt. 1....................................................................................................................................... 103
Figure 58: Vehicle Service Station Uncovered Fuel Dispenser Lumen Equivalency Calculation Pt. 2....................................................................................................................................... 103
Figure 59: Vehicle Service Station Uncovered Fuel Dispenser Cost Calculation Pt. 1 ............. 104
Figure 60: Vehicle Service Station Uncovered Fuel Dispenser Cost Calculation Pt. 2 ............. 104
Figure 61: ATM Calculation Results and Recommendations .................................................... 105
Figure 62: Outdoor Sales Frontage Calculation Results and Recommendations ....................... 106
Figure 63: Outdoor Sales Frontage Lumen Equivalency Calculation Pt. 1 ................................ 106
Figure 64: Outdoor Sales Frontage Lumen Equivalency Calculation Pt. 2 ................................ 107
Figure 65: Outdoor Sales Frontage Cost Calculation Pt. 1 ......................................................... 108
Figure 66: Outdoor Sales Frontage Cost Calculation Pt. 2 ......................................................... 108
Figure 67: Building Facades Calculation Results and Recommendations ................................. 109
Figure 68: Building Facades Lumen Equivalency Calculation Pt. 1 .......................................... 110
Figure 69: Building Facades Lumen Equivalency Calculation Pt. 2 .......................................... 111
Figure 70: Building Facades Cost Calculation Pt. 1 ................................................................... 112
Figure 71: Building Facades Cost Calculation Pt. 2 ................................................................... 113
Figure 72: Outdoor Sales Lots Calculation Results and Recommendations .............................. 114
Figure 73: Outdoor Sales Lots Lumen Equivalency Calculation Pt. 1 ....................................... 114
Figure 74: Outdoor Sales Lots Lumen Equivalency Calculation Pt. 2 ....................................... 114
Figure 75: Outdoor Sales Lots Cost Calculation Pt. 1 ................................................................ 115
Figure 76: Outdoor Sales Lots Cost Calculation Pt. 2 ................................................................ 115
2016 Title 24 CASE Report –Measure Number: 2016-NR-LTG3-F Page viii
Figure 77: Vehicle Service Station Hardscape Calculation Results and Recommendations...... 116
Figure 78: Vehicle Service Station Hardscape Lumen Equivalency Calculation Pt. 1 .............. 116
Figure 79: Vehicle Service Station Hardscape Equivalency Calculation Pt. 2 ........................... 116
Figure 80: Vehicle Service Station Hardscape Cost Calculation Pt. 1 ....................................... 117
Figure 81: Vehicle Service Station Hardscape Cost Calculation Pt. 2 ....................................... 117
Figure 82: Vehicle Service Station Canopies Calculation Results and Recommendations........ 118
Figure 83: Vehicle Service Station Canopies Lumen Equivalency Calculation Pt. 1 ................ 118
Figure 84: Vehicle Service Station Canopies Equivalency Calculation Pt. 2 ............................. 119
Figure 85: Vehicle Service Station Canopies Cost Calculation Pt. 1 ......................................... 120
Figure 86: Vehicle Service Station Canopies Cost Calculation Pt. 2 ......................................... 121
Figure 87: Sales Canopies Calculation Results and Recommendations ..................................... 122
Figure 88: Sales Canopies Lumen Equivalency Calculation Pt. 1 .............................................. 122
Figure 89: Sales Canopies Equivalency Calculation Pt. 2 .......................................................... 123
Figure 90: Sales Canopies Cost Calculation Pt. 1....................................................................... 124
Figure 91: Sales Canopies Cost Calculation Pt. 2....................................................................... 125
Figure 92: Non-Sales Canopies Calculation Results and Recommendations ............................. 126
Figure 93: Non-Sales Canopies Lumen Equivalency Calculation Pt. 1 ..................................... 127
Figure 94: Non-Sales Canopies Equivalency Calculation Pt. 2 .................................................. 128
Figure 95: Non-Sales Canopies Cost Calculation Pt. 1 .............................................................. 129
Figure 96: Non-Sales Canopies Cost Calculation Pt. 2 .............................................................. 130
Figure 97: Guard Station Calculation Results and Recommendations ....................................... 131
Figure 98: Guard Station Lumen Equivalency Calculation Pt. 1 ................................................ 131
Figure 99: Guard Station Lumen Equivalency Calculation Pt. 2 ................................................ 132
Figure 100: Guard Station Cost Calculation Pt. 1 ....................................................................... 133
Figure 101: Guard Station Cost Calculation Pt. 2 ....................................................................... 134
Figure 102: Student Pick-up/Drop-off Zone Calculation Results and Recommendations ......... 135
Figure 103: Student Pick-up/Drop-off Zone Lumen Equivalency Calculation Pt. 1 .................. 135
Figure 104: Student Pick-up/Drop-off Zone Equivalency Calculation Pt. 2 .............................. 136
Figure 105: Student Pick-up/Drop-off Zone Cost Calculation Pt. 1 ........................................... 137
Figure 106: Student Pick-up/Drop-off Zone Cost Calculation Pt. 2 ........................................... 138
Figure 107: Outdoor Dining Calculation Results and Recommendations .................................. 139
Figure 108: Outdoor Dining Lumen Equivalency Calculation Pt. 1 .......................................... 139
Figure 109: Outdoor Dining Equivalency Calculation Pt. 2 ....................................................... 139
2016 Title 24 CASE Report –Measure Number: 2016-NR-LTG3-F Page ix
Figure 110: Outdoor Dining Cost Calculation Pt. 1 ................................................................... 140
Figure 111: Outdoor Dining Cost Calculation Pt. 2 ................................................................... 140
Figure 112: Special Security Lighting for Retail Calculation Results and Recommendations .. 141
Figure 113: Special Security Lighting for Retail Lumen Equivalency Calculation Pt. 1 ........... 141
Figure 114: Special Security Lighting for Retail Equivalency Calculation Pt. 2 ....................... 142
Figure 115: Special Security Lighting for Retail Cost Calculation Pt. 1 .................................... 143
Figure 116: Special Security Lighting for Retail Cost Calculation Pt. 2 .................................... 144
2016 Title 24 CASE Report –Measure Number: 2016-NR-LTG3-F Page x
Document Information Category: Codes and Standards
Keywords: Statewide Codes and Standards Team, Statewide CASE Team, Codes and Standards Enhancements, Title 24, 2016, efficiency, outdoor lighting, lighting power allowance, LPA, LED.
2016 Title 24 CASE Report –Measure Number: 2016-NR-LTG3-F Page xi
EXECUTIVE SUMMARY
IntroductionThe Codes and Standards Enhancement (CASE) initiative presents recommendations to support California Energy Commission’s (CEC) efforts to update California’s Building Energy Efficiency Standards (Title 24) to include new requirements or to upgrade existing requirements for various technologies. The four California Investor Owned Utilities (IOUs) – Pacific Gas and Electric Company, San Diego Gas and Electric, Southern California Edison and Southern California Gas Company – and Los Angeles Department of Water and Power (LADWP) sponsored this effort. The program goal is to prepare and submit proposals that will result in cost-effective enhancements to energy efficiency in buildings. This report and the code change proposal presented herein is a part of the effort to develop technical and cost-effectiveness information for proposed regulations on building energy efficient design practices and technologies.
The overall goal of this CASE Report is to propose a code change proposal for Nonresidential Outdoor Lighting Power Allowances (LPA). The report contains pertinent information that justifies the code change including:
Description of the code change proposal, the measure history, and existing standards (Section 2);
Market analysis, including a description of the market structure for specific technologies, market availability, and how the proposed standard will impact building owners and occupants, builders, and equipment manufacturers, distributers, and sellers (Section 3);
Methodology and assumption used in the analyses energy and electricity demand impacts, cost-effectiveness, and environmental impacts (Section 4);
Results of energy and electricity demand impacts analysis, Cost-effectiveness Analysis, and environmental impacts analysis (Section 5); and
Proposed code change language (Section 6).
Scope of Code Change Proposal Nonresidential Outdoor LPA will affect the following code documents listed in Table 1.
Table 1: Scope of Code Change Proposal Standards
Requirements (see note below)
Compliance Option Appendix Modeling
Algorithms Simulation
Engine Forms
M, Ps No No No No No Note: An (M) indicates mandatory requirements, (Ps) Prescriptive, (Pm) Performance.
2016 Title 24 CASE Report –Measure Number: 2016-NR-LTG3-F Page xii
Measure Description The Nonresidential Outdoor LPA measure intends to replace pulse start Metal Halide (PSMH) light sources with LED as the basis for the calculation of Lighting Power Allowances (LPA) for all exterior applications where it is technically feasible to do so.
Section 2 of this report provides detailed information about the code change proposal including: Section 2.2 Summary of Changes to Code Documents (page 5) provides a section-by-section description of the proposed changes to the standards, appendices, alternative compliance manual and other documents that will be modified by the proposed code change. See the following tables for an inventory of sections of each document that will be modified:
Table 5: Scope of Code Change Proposal (page 5) Table 6: Sections of Standards Impacted by Proposed Code Change (page 5)
Detailed proposed changes to the text of the building efficiency standards, the reference appendices, are given in Section 6 Proposed Language of this report. This section proposes modifications to language with additions identified with underlined text and deletions identified with struck out text.
The following documents will be modified by the proposed change:
SECTION 140.6 – PRESCRIPTIVE REQUIREMENTS FOR INDOOR LIGHTINGSubsection 140.6(a)3: Will have the exception for ATM lighting removed.
Table 140.6-C: Will add an allowance for ATM lighting in parking garages.
SECTION 140.7 – REQUIREMENTS FOR OUTDOOR LIGHTINGEXCEPTION 6 and 8 to Subsection 140.7(a): The edits will remove an exception for ATM lighting, lighting for tunnels, and lighting for bridges.
Subsection 140.7(d)1A: The edits will add bridge(s) and tunnel(s) to the general hardscape lighting allowance calculation instructions.
Tables 140.7-A & B: The tables will be modified with new LPA values to reduce energy consumption by using LED light sources as the new baseline for calculations. Further, language will be added to establish an LPA for ATM locations, and bridges and tunnels will be included in the allowance list.
Market Analysis and Regulatory Impact Assessment The industry as a whole is participating in the change to LED light sources. Manufacturers are actively funding R&D efforts for the LED market, putting most of their R&D funds into LED product development. (TRC 2014) As a result, manufacturers are already supporting this change and are working to be well positioned for this market shift.
This proposal is cost effective over the period of analysis. Overall this proposal increases the wealth of the State of California. California consumers and businesses save more money on energy than they do for financing the efficiency measure. As a result this leaves more money available for discretionary and investment purposes.
2016 Title 24 CASE Report –Measure Number: 2016-NR-LTG3-F Page xiii
The expected impacts of the proposed code change on various stakeholders are summarized below:
Impact on builders: The proposed measures will have little to no impact on builders.
Impact on building designers: The proposed code change is not expected to significantly impact building designers.
Impact on occupational safety and health: The proposed code change does not alter any existing federal, state, or local regulations pertaining to safety and health, including rules enforced by California Division of Occupational Safety and Health. All existing health and safety rules will remain in place. Complying with the proposed code changes is not anticipated to have any impact on the safety or health occupants or those involved with the construction, commissioning, and ongoing maintenance of the building.
Impact on building owners and occupants: Over the 15-year evaluation period the energy cost savings from this measure are higher than the incremental costs. The building owners and occupants who pay energy bills are expected to benefit from cost savings over the life of the building.
Impact on equipment retailers (including manufacturers and distributors): No impact anticipated.
Impact on energy consultants: The proposed code change is not expected to significantly impact energy consultants.
Impact on building inspectors: As compared to the overall code enforcement effort, this measure has negligible impact on the effort required to enforce the building codes.
Statewide Employment Impacts: The proposed changes to Title 24 are expected to result in positive job growth as noted below in Section 3.5. The particular measures proposed in this report are not expected to have an appreciable impact on employment in California.
Impacts on the creation or elimination of businesses in California: The proposed measure is not expected to have an appreciable impact on California businesses.
Impacts on the potential advantages or disadvantages to California businesses: In general California businesses would benefit from an overall reduction in energy costs. This could help California businesses gain competitive advantage over businesses operating in other states or countries and increase in investment in California. This particular measure is not expected to have an appreciable impact on any specific California business.
Impacts on the potential increase or decrease of investments in California: As described in Section 3.5 of this report, the California Air Resources Board (CARB) economic analysis of greenhouse gas reduction strategies for the State of California indicates that higher levels of energy efficiency and 33 percent Renewable Portfolio Standard (RPS) will increase investment in California by about 3 percent in 2020 compared to 20% RPS and lower levels of energy efficiency. After reviewing the CARB analysis, the Statewide CASE Team concluded that the majority of the increased investment of the more aggressive strategy is attributed to the benefits of efficiency

2016 Title 24 CASE Report –Measure Number: 2016-NR-LTG3-F Page xiv
(CARB 2010b Figures 7a and 10a). The specific code change proposal presented in this report is not expected to have an appreciable impact on investments in California.
Impacts on incentives for innovations in products, materials or processes: Updating Title 24 Standards could encourage innovation through the adoption of new technologies to better manage energy usage and achieve energy savings. It is not anticipated that this measure will have a significant impact on innovation.
Impacts on the State General Fund, Special Funds and local government: The proposed measure is not expected to have an appreciable impact on the State General Fund, Special Funds, or local government funds.
Cost of enforcement to State Government and local governments: All revisions to Title 24 will result in changes to Title 24 compliance determinations. State and local code officials will be required to learn how buildings can comply with the new provisions included in the 2016 Standards, however the Statewide CASE Team anticipates that the cost of training is part of the regular training activates that occur every time the code is updated. These proposed changes would not affect the complexity of the code significantly. Therefore, on-going costs are not expected to change significantly.
Impacts on migrant workers; persons by age group, race, or religion: This proposal and all measures adopted by CEC into Title 24, part 6 do not advantage or discriminate in regards to race, religion or age group.
Impact on Homeowners (including potential first time home owners): The proposal does not impact residential buildings. There is no expected impact on homeowners.
Impact on Renters: The energy cost savings from the proposed measures might be passed on to tenants.
Impact on Commuters: This proposal and all measures adopted by CEC into Title 24, Part 6 are not expected to have an impact on commuters.
Statewide Energy Impacts Table 2 shows the estimated energy savings over the first twelve months of implementation of the Nonresidential Outdoor Lighting Power Allowance measure.
Table 2: Estimated First Year Energy Savings
First Year Statewide Savings TDV Dollar
Savings ($ Millions)
ElectricitySavings (GWh)
PowerDemand
Reduction (MW)
Natural Gas Savings
(MMtherms)
TOTAL 44.3 N/A N/A 73.5
Section 4.7.1 discusses the methodology and Section 5.1.1 shows the results for the per unit energy impact analysis.

2016 Title 24 CASE Report –Measure Number: 2016-NR-LTG3-F Page xv
Cost-effectivenessThe per unit results of the Cost-effectiveness Analyses are presented in Table 3. The TDV Energy Costs Savings are the present valued energy cost savings over the 15 year period of analysis using CEC’s TDV methodology. The Total Incremental Cost represents the incremental initial construction and maintenance costs of the proposed measure relative to existing conditions (current minimally compliant construction practice). Costs incurred in the future (such as periodic maintenance costs or replacement costs) are discounted by a 3 percent real discount rate, per CEC’s LCC Methodology. The Benefit to Cost (B/C) Ratio is the incremental TDV Energy Costs Savings divided by the Total Incremental Costs. When the B/C ratio is greater than 1.0, the added cost of the measure is more than offset by the discounted energy cost savings and the measure is deemed to be cost effective.
Table 3: Cost-effectiveness Summary1 – Statewide Weighted Average Across Lighting Zones for all Measure Line-Items
Climate Zone Units
Benefit: TDV Energy Cost
Savings2
(2017 PV$)
Cost: Total Incremental
Cost3
(2017 PV$)
Change in Lifecycle Cost4
(2017 PV$)
Benefit to Cost Ratio5
Outdoor Lighting LPA (Entire Measure)
Per Square Foot 0.41 0.11 -0.41 3.8
1. Relative to existing conditions. All cost values presented in 2017 dollars. “Hospital” building category exclude from cost and savings projections.
2. Present value of TDV cost savings equals TDV electricity savings plus TDV natural gas savings; TDV$ = TDV$E + TDV$G.
3. Total incremental cost equals incremental construction cost (post adoption) plus present value of incremental maintenance cost; C = CIPA + CM.
4. Negative values indicate the measure is cost-effective. Change in lifecycle cost equals cost premium minus TDV energy cost savings; LCC = C – TDV$
5. The benefit to cost ratio is the TDV energy costs savings divided by the total incremental costs; B/C = TDV$ ÷ C. The measure is cost effective if the B/C ratio is greater than 1.0.
Section 4.8 discusses the methodology and Section 5.2 shows the results of the Cost Effectiveness Analysis
Greenhouse Gas and Water Related Impacts For more a detailed and extensive analysis of the possible environmental impacts from the implementation of the proposed measure, please refer to Section 5.3 of this report.
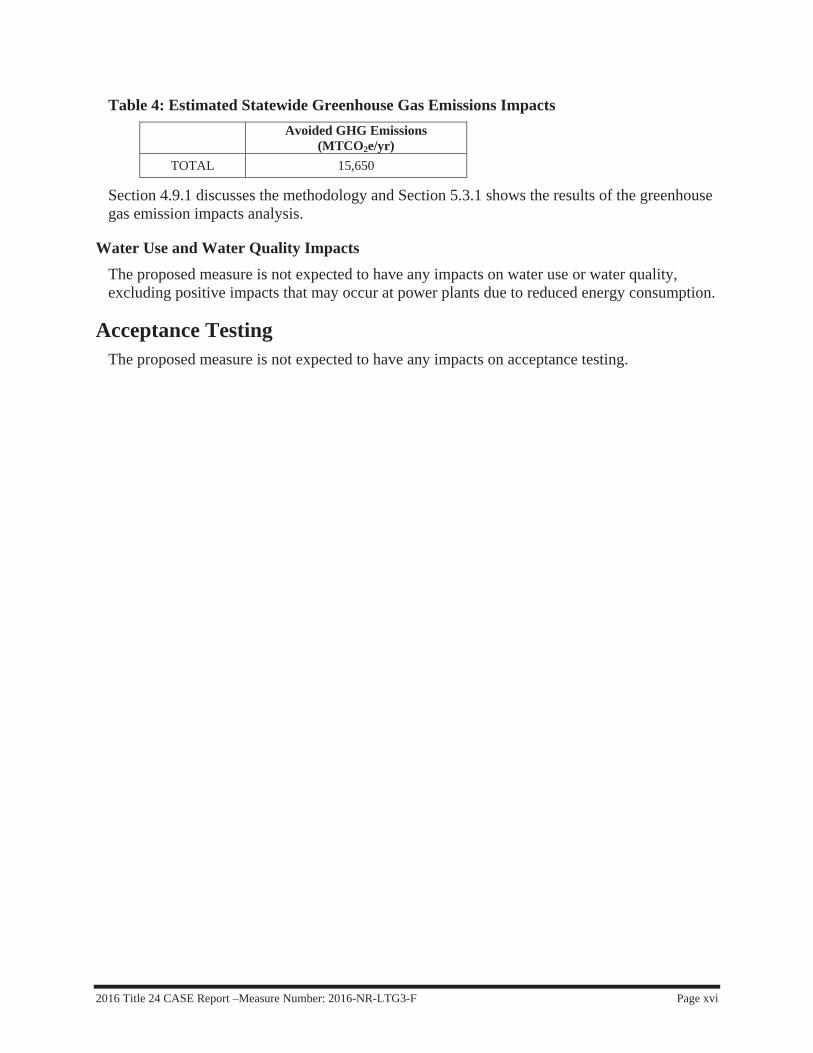
Greenhouse Gas Impacts Table 4 presents the estimated avoided greenhouse gas (GHG) emissions of the proposed code change for the first year the standards are in effect. Assumptions used in developing the GHG savings are provided in Section 4.9.1 on page 30 of this report.
2016 Title 24 CASE Report –Measure Number: 2016-NR-LTG3-F Page xvi
Table 4: Estimated Statewide Greenhouse Gas Emissions Impacts Avoided GHG Emissions
(MTCO2e/yr) TOTAL 15,650
Section 4.9.1 discusses the methodology and Section 5.3.1 shows the results of the greenhouse gas emission impacts analysis.
Water Use and Water Quality Impacts The proposed measure is not expected to have any impacts on water use or water quality, excluding positive impacts that may occur at power plants due to reduced energy consumption.
Acceptance Testing The proposed measure is not expected to have any impacts on acceptance testing.

2016 Title 24 CASE Report –Measure Number: 2016-NR-LTG3-F Page 1
1. INTRODUCTION
The Codes and Standards Enhancement (CASE) initiative presents recommendations to support California Energy Commission’s (CEC) efforts to update California’s Building Energy Efficiency Standards (Title 24) to include new requirements or to upgrade existing requirements for various technologies. The four California Investor Owned Utilities (IOUs) – Pacific Gas and Electric Company, San Diego Gas and Electric, Southern California Edison and Southern California Gas Company – and Los Angeles Department of Water and Power (LADWP) sponsored this effort. The program goal is to prepare and submit proposals that will result in cost-effective enhancements to energy efficiency in buildings. This report and the code change proposal presented herein is a part of the effort to develop technical and cost-effectiveness information for proposed regulations on building energy efficient design practices and technologies. The overall goal of this CASE Report is to propose a code change for the Nonresidential Outdoor Lighting Power Allowances. The report contains pertinent information that justifies the code change.
Section 2 of this CASE Report provides a description of the measure, how the measure came about, and how the measure helps achieve the state’s zero net energy (ZNE) goals. This section presents how the Statewide CASE Team envisions the proposed code change would be enforced and the expected compliance rates. This section also summarized key issues that were addressed during the CASE development process, including issues discussed during a public stakeholder meeting that the Statewide CASE Team hosted in May 2014.
Section 3 presents the market analysis, including a review of the current market structure, a discussion of product availability, and the useful life and persistence of the proposed measure. This section offers an overview of how the proposed standard will impact various stakeholders including builders, building designers, building occupants, equipment retailers (including manufacturers and distributors), energy consultants, and building inspectors. Finally, this section presents estimates of how the proposed change will impact statewide employment.
Section 4 describes the methodology and approach the Statewide CASE Team used to estimate energy, demand, costs, and environmental impacts. Key assumptions used in the analyses can also be found in Section 4.
Results from the energy, demand, costs, and environmental impacts analysis are presented in Section 5. The Statewide CASE Team calculated energy, demand, and environmental impacts using two metrics: (1) per unit, and (2) statewide impacts during the first year buildings complying with the 2016 Title 24 Standards are in operation. Time Dependent Valuation (TDV) energy impacts, which accounts for the higher value of peak savings, are presented for the first year both per unit and statewide. The incremental costs, relative to existing conditions are presented as are present value of year TDV energy cost savings and the overall cost impacts over the year period of analysis.
The report concludes with specific recommendations for language for the Standards, Appendices, Alternate Calculation Method (ACM) Reference Manual and Compliance Forms.

2016 Title 24 CASE Report –Measure Number: 2016-NR-LTG3-F Page 2
2. MEASURE DESCRIPTION
2.1 Measure Overview
2.1.1 Measure Description The Outdoor Lighting Power Allowance (LPA) values in Title 24 are subject to change as new technologies (in particular, light source technologies that increase lamp efficacy) become available to the market. As a result, the LPA values have continued to slowly move downward over time in response to these technological advancements, most recently for Pulse-Start Metal Halide (PSMH) technology.
LED light source technology is advancing rapidly, and the raw lamp efficacy of LED light sources are rapidly improving beyond that of both PSMH (the current baseline standard), and High Pressure Sodium (HPS) light sources. The lumen package efficacy is anticipated to exceed PSMH and HPS in several years. Further, the efficiency of LED luminaires is typically significantly higher than either PSMH or HPS luminaires. LED luminaires will exceed combined HID source luminaire efficacy sometime in late 2014 or 2015. (DOE 2013) Finally, LED luminaires can deliver light more uniformly to the target area, which will result in further savings opportunities.
In addition, LED light source technology has a variety of operational advantages over either PSMH or HPS, including:
much longer life expectancy (in some cases beyond 100,000 hours)
better lumen maintenance at a given age of operation
very good dimming efficacy curves
a large range of dimming capability (down to 10% in most cases)
rapid level changes that accommodates sensor integration
instant re-strike for On-Off-On switching capability
preservation of source color characteristics over full dimming range
As a result, LED is rapidly claiming a large portion of the exterior lighting market, and the market adoption of LED is anticipated to accelerate as the cost of LED products continues to decrease.
This measure intends to replace PSMH light sources with LED as the basis for the calculation of Lighting Power Allowances (LPA) for all exterior applications where it is technically feasible to do so.
At no point in this LPA adjustment will the lighting design criteria be changed. This basis of design has been established by the Illumination Engineering Society (IES) in a variety of sources and mapped as part of the previous Title 24 Outdoor Lighting Case Studies (CASE 2007). This matrix of design criteria was reviewed to ensure that no specific recommendations have changed, and therefore, no changes are needed to the illuminance criterion that establishes the LPA values.
2016 Title 24 CASE Report –Measure Number: 2016-NR-LTG3-F Page 3
Further, two specific applications have been identified that require attention. There currently is no allowance mechanism for lighting associated with ATM locations in Outdoor Lighting. This lighting is currently exempted from the code through an exception in 140.7(a). ASHRAE 90.1-2013 includes an allowance for this, and it is possible to establish a reasonable allowance for ATM locations and insert this allowance as a line-item into the tables of LPA values.
The other application requires some clarification in the language, but will require no additional LPA values established. This is lighting for tunnels and other covered pathways that would not normally be interpreted as Non-Sales Canopy applications. In this circumstance, the proposal is to add language including them in the Non-Sales Canopy category.
2.1.2 Measure History Outdoor lighting was first introduced into Title 24 in the 2005 code cycle. At that time, the outdoor lighting realm was predominately based upon probe-start Metal Halide (MH) and HPS light sources for large area lighting, fluorescent and compact fluorescent for smaller lumen package products, and very small amounts of other light source types under certain circumstances.
While HPS light sources are commonly used for roadway applications, when a white light source is desired (as is common for retail applications), MH lamps have been the only viable option for many years. This established MH as the de facto baseline technology for most Lighting Power Allowance (LPA) calculations because it is approximately 15% less efficacious than HPS under comparable circumstances. As a result, MH has been used as the light source technology for the simulations used to generate the LPA values established in Tables 140.7-A and 140.7-B.
Due to the enactment of the Energy Independence and Security Act (EISA) in 2007, MH lamps and ballasts were removed as a new luminaire option, so the MH lamp baseline shifted to PSMH lamps. These were employed in Title 24-2013, but the changes were subtle due to certain lamp and design interactions that reduced their apparent impact.
In approximately 2008, LED light sources started to become available, offering an alternative to MH or PSMH as a white light source. As LED technology has advanced, the quality of the light, the cost of the luminaires, the efficacy of the LED chips, and the rated life of the LED chips have all improved significantly.
A study by the US-DOE found that LED chips have improved in efficacy at a rate of approximately 10% per year recently, and this efficacy improvement is projected to continue for the next five years or more before slowing down. (DOE 2013) At the same time, the cost per kilolumen of the LED package has decreased by approximately 30% in 2012, another 50% is expected through 2015, and another 50% (to 25% of today’s cost) by 2018 (DOE 2013).
In the past, while LED technology has been a viable alternative to MH sources, it was at a cost premium that was hard to justify with the associated energy savings. In almost all metrics, (availability, cost of initial purchase, efficacy, and ongoing maintenance cost), this premium will be eliminated for most applications in time for the next cycle of Title 24 to take effect (currently scheduled for Jan. 1, 2017).
2016 Title 24 CASE Report –Measure Number: 2016-NR-LTG3-F Page 4
As a result, by 2017, LED light sources will have become the white light source of choice for almost all outdoor lighting applications, and will be both a major advancement in energy efficiency, and also a very cost effective design solution for the building industry to employ.
Using LED as a baseline is anticipated to result in an approximately 40% reduction in the LPA values in Tables 140.7-A & B. The full impact of a switch to LED as the basis of design is not a simple efficacy gain comparison for the general lighting applications; the LED products produce better illumination with better uniformity and lower waste from “spill light” than similar MH products due to more carefully directed light distribution. As a result, the impact is greater than a simple luminaire efficacy calculation may predict.
This measure provides a methodology to calculate the anticipated cost and efficacy implications of LED lighting products in advance of the timeframe of the Standard effective date. This is necessary because LED technology is advancing at a very rapid pace. The most appropriate LPA values are calculated based on reasonable predictions of where LED efficacy will be at the time of adoption, not on current performance of LED lighting products, which would place the LPA values approximately three years behind the LED efficacy curve.
This measure is proposed because the lighting market is rapidly advancing, and most of the current LPA values in Section 140.6 have not been reviewed and reduced since the 2008 revisions. In the future, the prevalence of LED in the market will make the LPA values easily achievable if they remain at current levels, causing Title 24 to lose savings opportunities due to inaction.
The move towards LED in the lighting industry is a fundamental shift towards electronics. However, this move is happening independent of codes and standards development. It is important that Title 24 keep in stride with this shift if it is to remain relevant as an energy code that challenges the building industry to higher levels of performance.
At this time, the shift to LED as the baseline is designated for Nonresidential Outdoor lighting only, and no other portions of Title 24.
2.1.3 Existing Standards Nonresidential Outdoor LPA is regulated in Section 140.7 of the Standards. This measure will not change the regulation infrastructure, but will change the values that are established as the permissible performance for outdoor lighting applications in Tables 140.7-A & B.
2.1.4 Alignment with Zero Net Energy Goals The Statewide CASE Team and the CEC are committed to achieving California’s zero-net-energy (ZNE) goal. This measure will help achieve ZNE goals by reducing the connected power and energy consumption of outdoor lighting associated with new construction. This measure will also set the foundation for future revisions that will help ensure ZNE goals are achieved. In particular, this measure could lead directly to the following changes in the 2019 and 2022 revision cycles:
Possible further reductions in outdoor LPA values in Tables 140.7-A and 140.7-B as the LED technology advances.
As an enabling technology, LED will permit more advanced lighting controls and controls strategies to be employed, saving on hours of operation.

2016 Title 24 CASE Report –Measure Number: 2016-NR-LTG3-F Page 5
2.1.5 Relationship to Other Title 24 Measures This measure does not specifically overlap with any other current measure directly. However, there is a Nonresidential Outdoor Lighting Controls measure that will be impacted by the LPA values that are established in this CASE.
2.2 Summary of Changes to Code DocumentsThe sections below provide a summary of how Title 24 documents will be modified by the proposed change. See Section 6 of this report for detailed proposed revisions to code language.
2.2.1 Catalogue of Proposed Changes ScopeTable 5 identifies the scope of the code change proposal. This measure will impact the following areas (marked by a “Yes”).
Table 5: Scope of Code Change Proposal
Mandatory Prescriptive Performance Compliance
Option Trade-
OffModeling
Algorithms Forms Yes Yes No No No No No
StandardsThe proposed code change will modify the sections of the California Building Energy Efficiency Standards (Title 24, Part 6) identified in Table 6.
Table 6: Sections of Standards Impacted by Proposed Code Change
Title 24, Part 6 Section Number Section Title
Mandatory (M) Prescriptive (Ps)
Performance (Pm)
Modify Existing (E) New Section (N)
10-114 Determination of Outdoor Lighting Zones and Administrative Rules for Use
M E
140.6 Prescriptive Requirements for Indoor Lighting Ps E
140.7 Requirements for Outdoor Lighting Ps E
AppendicesThe proposed code change is not anticipated to modify any sections of the appendices.
Nonresidential Alternative Calculation Method (ACM) Reference Manual The proposed code change is not anticipated to modify the Nonresidential Alternative Calculation Method References.
Simulation Engine Adaptations The proposed code change can be modeled using the current simulation engine. Changes to the simulation engine are not necessary.

2016 Title 24 CASE Report –Measure Number: 2016-NR-LTG3-F Page 6
2.2.2 Standards Change Summary This proposal would modify the following sections of the Building Energy Efficiency standards as shown below. See Section 6.1 Standards of this report for the detailed proposed revisions to the standards language.
Changes in Mandatory Requirements The changes focus on Tables 10-114-A, where the Lighting Zone definitions are described, and add the new Lighting Zone 0 into the table.
TABLE 10-114-A – LIGHTING ZONE CHARACTERISTICS AND RULES FOR AMENDMENTS BY LOCAL JURISDICTIONS The edits will add the description of Lighting Zone 0 to the table, and more accurately describe the ambient illumination using terminology that correlates with the Illumination Engineering Society.
Changes in Prescriptive Requirements There is a change in Section 140.6 (Indoor Lighting) to address ATM machines in Parking Garage situations.
The changes focus on Tables 140.7-A & B, where the LPA values for outdoor lighting are presented. All of these values are reduced based on the calculations of light source technology improvements.
SECTION 140.6 – PRESCRIPTIVE REQUIREMENTS FOR INDOOR LIGHTINGSubsection 140.6(a)3: Will have the exception for ATM lighting removed.
Table 140.6-C: Will add an allowance for ATM lighting in parking garages.
SECTION 140.7 – REQUIREMENTS FOR OUTDOOR LIGHTINGEXCEPTION 6 and 8 to Subsection 140.7(a): The edits will remove an exception for ATM lighting, lighting for tunnels, and lighting for bridges.
Subsection 140.7(d)1A: The edits will add bridge(s) and tunnel(s) to the general hardscape lighting allowance calculation instructions.
Tables 140.7-A & B: The tables will be modified with new LPA values to reduce energy consumption by using LED light sources as the new baseline for calculations. Further, language will be added to establish an LPA for ATM locations, and bridges and tunnels will be included in the allowance list.
2.2.3 Standards Reference Appendices Change Summary The proposed code change will not modify the appendices of the Standards.
2.2.4 Nonresidential Alternative Calculation Method (ACM) Reference Manual Change Summary
The proposed code change will not modify the ACM Reference Manuals.
2016 Title 24 CASE Report –Measure Number: 2016-NR-LTG3-F Page 7
2.2.5 Compliance Forms Change Summary The proposed code change will not modify the Compliance Forms.
2.2.6 Simulation Engine Adaptations The simulation engine is not anticipated to be affected by this measure.
2.2.7 Other Areas Affected There are anticipated to be no other areas affected by this measure.
2.3 Code Implementation
2.3.1 Verifying Code Compliance The existing code enforcement methods will remain in effect. No new compliance documents will be required, and no additional field verification or acceptance tests will be required.
2.3.2 Code ImplementationThe code compliance methods currently employed by designers and builders will remain the same with this new measure. Title 24 is currently regulating LPA for Outdoor Lighting in a manner that is compatible with the changes intended with this measure. The building industry is accustomed to using the LPA limits approach that has been established in the previous versions of Title 24, and this measure maintains this infrastructure.
This measure does not add significant expense to the design or construction process.
This measure makes no changes in the inspection process.
There is no anticipated resistance to this measure from the building industry beyond the normal reluctance to lower LPA values. However, this change reflects a significant change in the lighting LPA values associated with a new technology that is considerably higher in efficacy than the previous baseline technology (PSMH). As a result, there is a need to educate the stakeholders so they understand the impacts of the measure, how the changes were calculated, and what the impacts will be on the lighting industry in the State.
While the impacts are intended to be minimized through the naturally occurring shift to LED technology, there will be some that may cause hesitancy within the stakeholders. Statewide CASE Team effort is required to make the stakeholders comfortable with the new paradigm associated with designing based on LED light sources.
2.3.3 Acceptance Testing There are no new acceptance testing burdens created by this measure.
2.4 Issues Addressed During CASE Development Process The Statewide CASE Team solicited feedback from a variety of stakeholders when developing the code change proposal presented in this report. In addition to personal outreach to key stakeholders, the Statewide CASE Team conducted a public stakeholder meeting to discuss the
2016 Title 24 CASE Report –Measure Number: 2016-NR-LTG3-F Page 8
overall concept of this proposal. The details and final analysis results of this proposal have not been fully presented to stakeholders due to the compressed CEC schedule, and a further complication with potential revision to the lighting design criteria that should be applied for the measure (IES RP-20).
The issues that have been addressed to date during development of the code change proposal are summarized below.
The IES is in the process of producing a new Recommended Practice (RP-20) that addresses parking lot and parking garage lighting design criteria. This may apply to the general hardscape lighting criteria that should be applied in the LPA calculations. At this point, the new document is not available for review and has not been approved, so it is impossible to gauge precisely what the impact of the new design criteria will be, but preliminary reports indicate that it will considerably increase light levels to meet the new criteria.
Since the document is not finalized, and because the Title 24 update process must continue on its schedule to meet the CEC’s deadlines for the public process, the Statewide CASE Team has not made changes to the design criteria. However, if the new IES document does increase the energy consumption required to meet the criteria, the recommendation of the Statewide CASE Team may be to disregard the new RP-20 document and consider different sources for design criteria.
This issue is complicated by the lack of a public comment period associated with the development of this Recommended Practice (RP) document. Some RP documents and committees follow ANSI standards and include a comment period while others (RP-20 included) do not. It is the opinion of the Statewide CASE Team that this process is flawed, and that the IES must make corrective action to address this inconsistency. These documents are being presented to the building industry as the primary design ‘standard’, and while not legally binding, the criteria established by these documents are considered by many to be the metric for ‘good practice’. As a result, there is strong pressure to accommodate the criteria established in the documents.
Unfortunately, the criteria also have the result that they impact the energy consumption of lighting systems throughout the United States, and energy codes that are moving towards lower energy consumption may be negatively affected by a change in criteria that was implemented without full consideration of the wide-ranging impacts of the changes by the small group of people on the committee. Documents produced by the IES that impact energy consumption should go through a rigorous review to ensure that the science is correct and the design criteria is reasonable to balance the need for energy efficiency and the potential benefits and drawbacks associated with increased light levels driven by a desire for higher visual performance.
3. MARKET ANALYSIS
The Statewide CASE Team performed a market analysis with the goals of identifying current technology availability, current product availability, and market trends. The Statewide CASE Team considered how the proposed standard may impact the market in general and individual market players. The Statewide CASE Team gathered information about the incremental cost of
2016 Title 24 CASE Report –Measure Number: 2016-NR-LTG3-F Page 9
complying with the proposed measure. Estimates of market size and measure applicability were identified through research and outreach with key stakeholders including utility program staff, CEC, and a wide range of industry players who were invited to participate in a stakeholder meeting the utility team sponsored in 2014. Some of the resources the Statewide CASE Team used to complete this task include:
Interviews with manufacturers on outlook of technology development going forward.
Interviews with specifiers and sales representatives and previous research on market penetration of current technology advancements.
Review of recent market research and further interviews with market research authors and sources of ongoing projections on modifications of the market outlook.
Modeling of current and projected impacts of trends in technology advancements on market pricing, market share, efficacy, energy savings opportunities, cost effectiveness.
3.1 Market Structure Multiple manufacturers are producing LED lighting products for outdoor applications, including parking lot lighting, pedestrian poles, bollards, building-mounted area lights, and canopy lights. There are no concerns regarding availability of products as there are currently many available from many manufacturers.
Further, LED has become the only light source that is receiving substantial market research and development money, from both the Federal Government (through DOE research support), and independently by manufacturers working on the implementation of LED in their product lines.
3.2 Market Availability and Current Practices The industry as a whole is anticipating the change to LED light sources. Manufacturers are actively funding R&D efforts for the LED market, putting most of their R&D funds into LED product development. (TRC 2014) As a result, manufacturers are already anticipating this change and are working to be well positioned for this market shift.
This shift is occurring rapidly in the industry, with the most rapid move to LED occurring in lighting products that are small, low wattage, with directional light distributions, and in outdoor lighting products. These categories are the most naturally-suited for LED light sources and have shown the earliest adoption of the design standard. LED has almost completely taken the market share of some types of outdoor lighting products, and many manufacturers expect this to be mostly complete in all outdoor lighting product categories by 2017 (TRC 2014).
3.3 Useful Life, Persistence, and MaintenanceThe useful life of LED luminaires exceeds the 15 year measure duration considerably, and is expected to persist longer than incumbent lighting solutions in most cases. Maintenance with LED lighting products is expected to be decreased because the long life of the LED chips will remove the need for the normal lamp failure maintenance that is regularly associated with PSMH and other incumbent sources.
2016 Title 24 CASE Report –Measure Number: 2016-NR-LTG3-F Page 10
The methodology the Statewide CASE Team used to determine the costs associated with incremental maintenance costs, relative to existing conditions, is presented in Section 4.8.1. The incremental maintenance costs of the proposed code change are presented in Section 5.2.1.
3.4 Market Impacts and Economic Assessments
3.4.1 Impact on Builders No substantial impacts are anticipated.
3.4.2 Impact on Building Designers No substantial impacts are anticipated.
3.4.3 Impact on Occupational Safety and Health The proposed code change does not alter any existing federal, state, or local regulations pertaining to safety and health, including rules enforced by the California Department of Occupational Safety and Health (Cal/OSHA). All existing health and safety rules will remain in place. Complying with the proposed code change is not anticipated to have any impact on the safety or health occupants or those involved with the construction, commissioning, and ongoing maintenance of the building.
3.4.4 Impact on Building Owners and Occupants Over the 15-year evaluation period the energy cost savings from this measure are higher than the incremental costs. The building owners and occupants who pay energy bills are expected to benefit from cost savings over the life of the building.
3.4.5 Impact on Retailers (including manufacturers and distributors) The proposed code change is not expected to have a significant impact on retailers.
3.4.6 Impact on Energy Consultants The proposed code change is not expected to significantly impact energy consultants.
3.4.7 Impact on Building Inspectors As compared to the overall code enforcement effort, this measure has negligible impact on the effort required to enforce the building codes.
3.4.8 Impact on Statewide Employment The proposed changes to Title 24 are expected to result in positive job growth as noted below in Section 3.5. The particular measures proposed in this report are not expected to have an appreciable impact on employment in California.
3.5 Economic Impacts The proposed Title 24 code changes, including this measure, are expected to increase job creation, income, and investment in California. As a result of the proposed code changes, it is

2016 Title 24 CASE Report –Measure Number: 2016-NR-LTG3-F Page 11
anticipated that less money will be sent out of state to fund energy imports, and local spending is expected to increase due to higher disposable incomes due to reduced energy costs.1
These economic impacts of energy efficiency are documented in several resources including the California Air Resources Board’s (CARB) Updated Economic Analysis of California’s Climate Change Scoping Plan, which compares the economic impacts of several scenario cases (CARB, 2010b). CARB include one case (Case 1) with a 33% renewable portfolio standard (RPS) and higher levels of energy efficiency compared to an alternative case (Case 4) with a 20% RPS and lower levels of energy efficiency. Gross state production (GSP)2, personal income, and labor demand were between 0.6% and 1.1% higher in the case with the higher RPS and more energy efficiency (CARB 2010b, Table 26). While CARB’s analysis does not report the benefits of energy efficiency and the RPS separately, we expect that the benefits of the package of measures are primarily due to energy efficiency. Energy efficiency measures are expected to reduce costs by $2,133 million annually (CARB 2008, pC-117) whereas the RPS implementation is expected to cost $1,782 million annually, not including the benefits of GHG and air pollution reduction (CARB 2008, pC-130).
Macro-economic analysis of past energy efficiency programs and forward-looking analysis of energy efficiency policies and investments similarly show the benefits to California’s economy of investments in energy efficiency (Roland-Holst 2008; UC Berkeley 2011).
This measure is not anticipated to have a large economic impact on the industry because it functions as a reduction in LPA allowances in the current code infrastructure. In most cases, the greatest impact will be a change in the light source technology of luminaires that are specified. There may be a reduction in the amounts of lighting equipment specified as well, but the varying methods of compliance with the reduced LPA values does not dictate that reduces equipment specifications will occur. In most cases, the wattage of the equipment specified will be reduced, but the quantities nay not be greatly impacted.
3.5.1 Creation or Elimination of Jobs CARB’s economic analysis of higher levels of energy efficiency and 33% RPS implementation estimates that this scenario would result in a 1.1% increase in statewide labor demand in 2020 compared to 20% RPS and lower levels of energy efficiency (CARB 2010b, Tables 26 and 27). CARB’s economic analysis also estimates a 1.3% increase in small business employment levels in 2020 (CARB 2010b, Table 32).
3.5.2 Creation or Elimination of Businesses within California CARB’s economic analysis of higher levels of energy efficiency and 33% RPS implementation (as described above) estimates that this scenario would result in 0.6% additional GSP in 2020 compared to 20% RPS and lower levels of energy efficiency (CARB 2010b, Table ES-2). We expect that higher GSP will drive additional business creation in California. In particular, local
1 Energy efficiency measures may result in reduced power plant construction, both in-state and out-of-state. These plants tend to
be highly capital-intensive and often rely on equipment produced out of state, thus we expect that displaced power plant spending will be more than off-set from job growth in other sectors in California.
2 GSP is the sum of all value added by industries within the state plus taxes on production and imports.

2016 Title 24 CASE Report –Measure Number: 2016-NR-LTG3-F Page 12
small businesses that spend a much larger proportion of revenue on energy than other businesses (CARB 2010b, Figures 13 and 14) should disproportionately benefit from lower energy costs due to energy efficiency standards. Increased labor demand, as noted earlier, is another indication of business creation.
Table 7 below shows California industries that are expected to receive the economic benefit of the proposed Title 24 code changes. It is anticipated that these industries will expand due to an increase in funding as a result of energy efficiency improvements. The list of industries is based on the industries that the University of California, Berkeley identified as being impacted by energy efficiency programs (UC Berkeley 2011 Table 3.8).3
This list provided below is not specific to one individual code change proposal; rather it is an approximation of the industries that may receive benefit from the 2016 Title 24 code changes.
3 Table 3.8 of the UC Berkeley report includes industries that will receive benefits of a wide variety of efficiency interventions,
including Title 24 Standards and efficiency programs. The authors of the UC Berkeley report did not know in 2011 which Title 24 measures would be considered for the 2016 adoption cycle, so the UC Berkeley report was likely conservative in their approximations of industries impacted by Title 24. The Statewide CASE Team believes that industries impacted by utilities efficiency programs is a more realistic and reasonable proxy for industries potentially affected by upcoming Title 24 Standards. Therefore, the table provided in this CASE Report includes the industries that are listed as benefiting from Title 24 and utility energy efficiency programs.
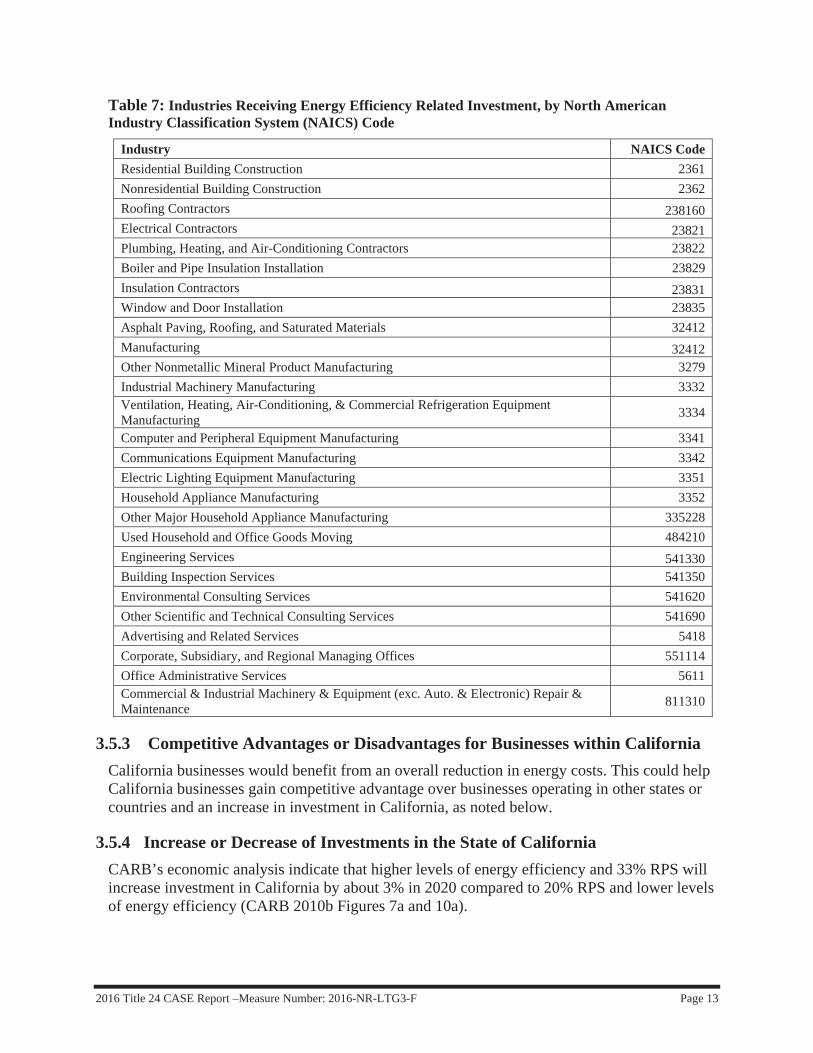
2016 Title 24 CASE Report –Measure Number: 2016-NR-LTG3-F Page 13
Table 7: Industries Receiving Energy Efficiency Related Investment, by North American Industry Classification System (NAICS) Code
Industry NAICS Code Residential Building Construction 2361 Nonresidential Building Construction 2362 Roofing Contractors 238160 Electrical Contractors 23821 Plumbing, Heating, and Air-Conditioning Contractors 23822 Boiler and Pipe Insulation Installation 23829 Insulation Contractors 23831 Window and Door Installation 23835 Asphalt Paving, Roofing, and Saturated Materials 32412 Manufacturing 32412 Other Nonmetallic Mineral Product Manufacturing 3279 Industrial Machinery Manufacturing 3332 Ventilation, Heating, Air-Conditioning, & Commercial Refrigeration Equipment Manufacturing 3334
Computer and Peripheral Equipment Manufacturing 3341 Communications Equipment Manufacturing 3342 Electric Lighting Equipment Manufacturing 3351 Household Appliance Manufacturing 3352 Other Major Household Appliance Manufacturing 335228 Used Household and Office Goods Moving 484210 Engineering Services 541330 Building Inspection Services 541350 Environmental Consulting Services 541620 Other Scientific and Technical Consulting Services 541690 Advertising and Related Services 5418 Corporate, Subsidiary, and Regional Managing Offices 551114 Office Administrative Services 5611 Commercial & Industrial Machinery & Equipment (exc. Auto. & Electronic) Repair & Maintenance 811310
3.5.3 Competitive Advantages or Disadvantages for Businesses within California California businesses would benefit from an overall reduction in energy costs. This could help California businesses gain competitive advantage over businesses operating in other states or countries and an increase in investment in California, as noted below.
3.5.4 Increase or Decrease of Investments in the State of California CARB’s economic analysis indicate that higher levels of energy efficiency and 33% RPS will increase investment in California by about 3% in 2020 compared to 20% RPS and lower levels of energy efficiency (CARB 2010b Figures 7a and 10a).

2016 Title 24 CASE Report –Measure Number: 2016-NR-LTG3-F Page 14
3.5.5 Incentives for Innovation in Products, Materials, or Processes Updating Title 24 Standards will encourage innovation through the adoption of new technologies to better manage energy usage and achieve energy savings. Significant impact on product innovation is not expected through these proposed changes, as they are primarily clarifications to improve compliance.
3.5.6 Effects on the State General Fund, State Special Funds and Local Governments
The Statewide CASE Team expects positive overall impacts on state and local government revenues due to higher GSP and personal income resulting in higher tax revenues, as noted earlier. Higher property valuations due to energy efficiency enhancements may also result in positive local property tax revenues. The Statewide CASE Team has not obtained specific data to quantify potential revenue benefits for this measure.
3.5.6.1 Cost of Enforcement There are no projected impediments to, or incentives for, innovation that would result from the proposed measures.
Cost to the State State government already has budget for code development, education, and compliance enforcement. While state government will be allocating resources to update the Title 24 Standards, including updating education and compliance materials and responding to questions about the revised standards, these activities are already covered by existing state budgets. The costs to state government are small when compared to the overall costs savings and policy benefits associated with the code change proposals.
Cost to Local Governments All revisions to Title 24 will result in changes to Title 24 compliance determinations. Local governments will need to train permitting staff on the revised Title 24 Standards. While this re-training is an expense to local governments, it is not a new cost associated with the 2016 code change cycle. The building code is updated on a triennial basis, and local governments plan and budget for retraining every time the code is updated. There are numerous resources available to local governments to support compliance training that can help mitigate the cost of retraining. For example, utilities offer compliance training such as “Decoding” talks to provide training and materials to local permitting departments. As noted earlier, although retraining is a cost of the revised standards, Title 24 energy efficiency standards are expected to increase economic growth and income with positive impacts on local revenue.
3.5.6.2 Impacts on Specific Persons The proposed changes to Title 24 are not expected to have a differential impact on any of the following groups relative to the state population as a whole:
Migrant Workers
Persons by age
Persons by race
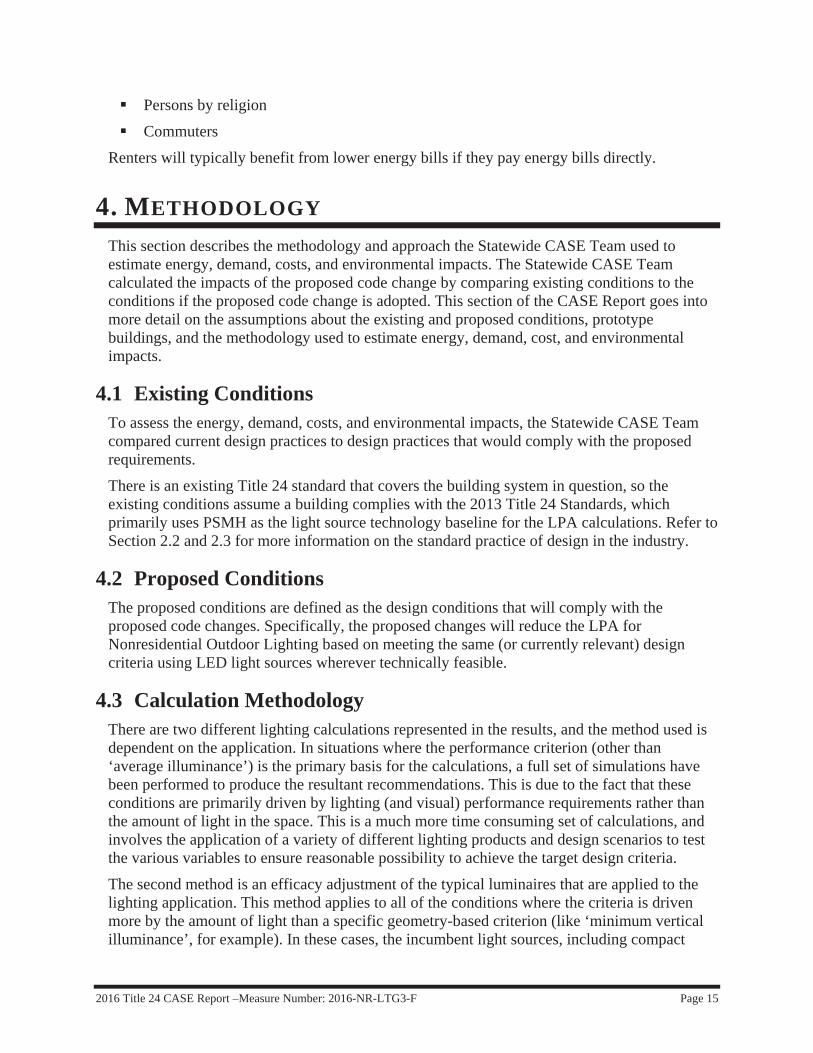
2016 Title 24 CASE Report –Measure Number: 2016-NR-LTG3-F Page 15
Persons by religion
Commuters
Renters will typically benefit from lower energy bills if they pay energy bills directly.
4. METHODOLOGY
This section describes the methodology and approach the Statewide CASE Team used to estimate energy, demand, costs, and environmental impacts. The Statewide CASE Team calculated the impacts of the proposed code change by comparing existing conditions to the conditions if the proposed code change is adopted. This section of the CASE Report goes into more detail on the assumptions about the existing and proposed conditions, prototype buildings, and the methodology used to estimate energy, demand, cost, and environmental impacts.
4.1 Existing Conditions To assess the energy, demand, costs, and environmental impacts, the Statewide CASE Team compared current design practices to design practices that would comply with the proposed requirements.
There is an existing Title 24 standard that covers the building system in question, so the existing conditions assume a building complies with the 2013 Title 24 Standards, which primarily uses PSMH as the light source technology baseline for the LPA calculations. Refer to Section 2.2 and 2.3 for more information on the standard practice of design in the industry.
4.2 Proposed Conditions The proposed conditions are defined as the design conditions that will comply with the proposed code changes. Specifically, the proposed changes will reduce the LPA for Nonresidential Outdoor Lighting based on meeting the same (or currently relevant) design criteria using LED light sources wherever technically feasible.
4.3 Calculation Methodology There are two different lighting calculations represented in the results, and the method used is dependent on the application. In situations where the performance criterion (other than ‘average illuminance’) is the primary basis for the calculations, a full set of simulations have been performed to produce the resultant recommendations. This is due to the fact that these conditions are primarily driven by lighting (and visual) performance requirements rather than the amount of light in the space. This is a much more time consuming set of calculations, and involves the application of a variety of different lighting products and design scenarios to test the various variables to ensure reasonable possibility to achieve the target design criteria.
The second method is an efficacy adjustment of the typical luminaires that are applied to the lighting application. This method applies to all of the conditions where the criteria is driven more by the amount of light than a specific geometry-based criterion (like ‘minimum vertical illuminance’, for example). In these cases, the incumbent light sources, including compact
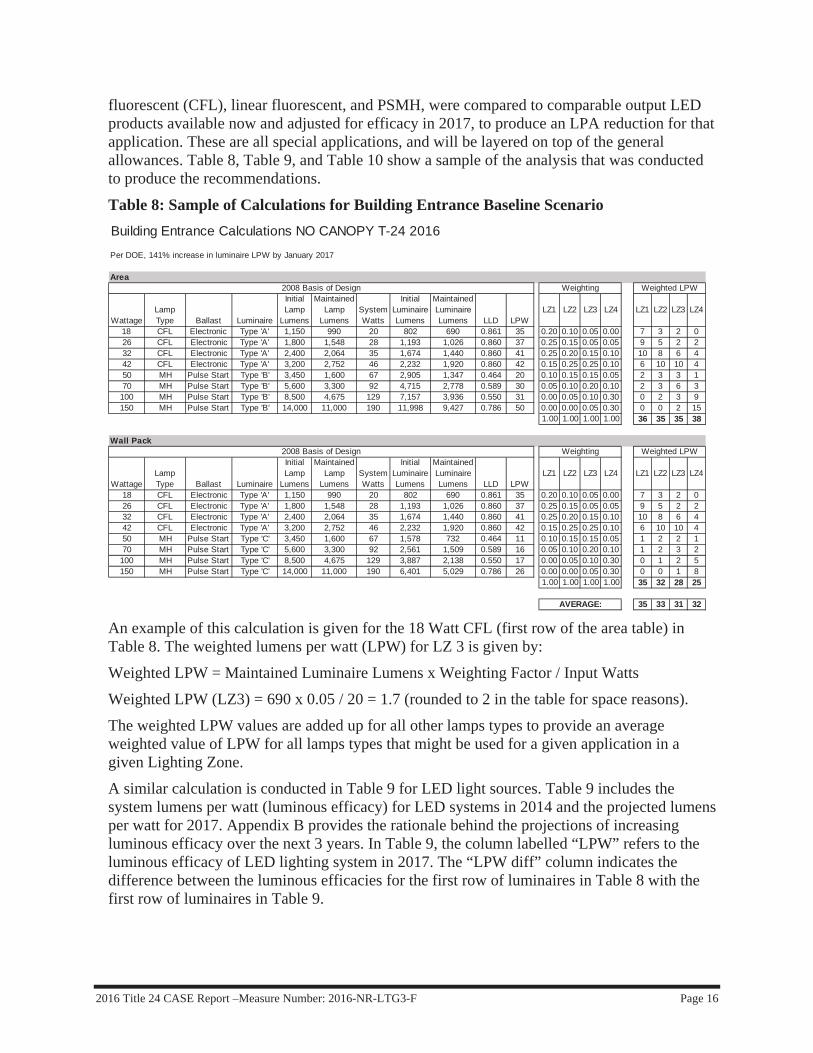
2016 Title 24 CASE Report –Measure Number: 2016-NR-LTG3-F Page 16
fluorescent (CFL), linear fluorescent, and PSMH, were compared to comparable output LED products available now and adjusted for efficacy in 2017, to produce an LPA reduction for that application. These are all special applications, and will be layered on top of the general allowances. Table 8, Table 9, and Table 10 show a sample of the analysis that was conducted to produce the recommendations.
Table 8: Sample of Calculations for Building Entrance Baseline Scenario
An example of this calculation is given for the 18 Watt CFL (first row of the area table) in Table 8. The weighted lumens per watt (LPW) for LZ 3 is given by:
Weighted LPW = Maintained Luminaire Lumens x Weighting Factor / Input Watts
Weighted LPW (LZ3) = 690 x 0.05 / 20 = 1.7 (rounded to 2 in the table for space reasons).
The weighted LPW values are added up for all other lamps types to provide an average weighted value of LPW for all lamps types that might be used for a given application in a given Lighting Zone.
A similar calculation is conducted in Table 9 for LED light sources. Table 9 includes the system lumens per watt (luminous efficacy) for LED systems in 2014 and the projected lumens per watt for 2017. Appendix B provides the rationale behind the projections of increasing luminous efficacy over the next 3 years. In Table 9, the column labelled “LPW” refers to the luminous efficacy of LED lighting system in 2017. The “LPW diff” column indicates the difference between the luminous efficacies for the first row of luminaires in Table 8 with the first row of luminaires in Table 9.
Building Entrance Calculations NO CANOPY T-24 2016
Per DOE, 141% increase in luminaire LPW by January 2017
Area
WattageLamp Type Ballast Luminaire
Initial Lamp
Lumens
Maintained Lamp
LumensSystem Watts
Initial Luminaire Lumens
Maintained Luminaire Lumens LLD LPW
LZ1 LZ2 LZ3 LZ4 LZ1 LZ2 LZ3 LZ4
18 CFL Electronic Type 'A' 1,150 990 20 802 690 0.861 35 0.20 0.10 0.05 0.00 7 3 2 026 CFL Electronic Type 'A' 1,800 1,548 28 1,193 1,026 0.860 37 0.25 0.15 0.05 0.05 9 5 2 232 CFL Electronic Type 'A' 2,400 2,064 35 1,674 1,440 0.860 41 0.25 0.20 0.15 0.10 10 8 6 442 CFL Electronic Type 'A' 3,200 2,752 46 2,232 1,920 0.860 42 0.15 0.25 0.25 0.10 6 10 10 450 MH Pulse Start Type 'B' 3,450 1,600 67 2,905 1,347 0.464 20 0.10 0.15 0.15 0.05 2 3 3 170 MH Pulse Start Type 'B' 5,600 3,300 92 4,715 2,778 0.589 30 0.05 0.10 0.20 0.10 2 3 6 3
100 MH Pulse Start Type 'B' 8,500 4,675 129 7,157 3,936 0.550 31 0.00 0.05 0.10 0.30 0 2 3 9150 MH Pulse Start Type 'B' 14,000 11,000 190 11,998 9,427 0.786 50 0.00 0.00 0.05 0.30 0 0 2 15
1.00 1.00 1.00 1.00 36 35 35 38
Wall Pack
WattageLamp Type Ballast Luminaire
Initial Lamp
Lumens
Maintained Lamp
LumensSystem Watts
Initial Luminaire Lumens
Maintained Luminaire Lumens LLD LPW
LZ1 LZ2 LZ3 LZ4 LZ1 LZ2 LZ3 LZ4
18 CFL Electronic Type 'A' 1,150 990 20 802 690 0.861 35 0.20 0.10 0.05 0.00 7 3 2 026 CFL Electronic Type 'A' 1,800 1,548 28 1,193 1,026 0.860 37 0.25 0.15 0.05 0.05 9 5 2 232 CFL Electronic Type 'A' 2,400 2,064 35 1,674 1,440 0.860 41 0.25 0.20 0.15 0.10 10 8 6 442 CFL Electronic Type 'A' 3,200 2,752 46 2,232 1,920 0.860 42 0.15 0.25 0.25 0.10 6 10 10 450 MH Pulse Start Type 'C' 3,450 1,600 67 1,578 732 0.464 11 0.10 0.15 0.15 0.05 1 2 2 170 MH Pulse Start Type 'C' 5,600 3,300 92 2,561 1,509 0.589 16 0.05 0.10 0.20 0.10 1 2 3 2
100 MH Pulse Start Type 'C' 8,500 4,675 129 3,887 2,138 0.550 17 0.00 0.05 0.10 0.30 0 1 2 5150 MH Pulse Start Type 'C' 14,000 11,000 190 6,401 5,029 0.786 26 0.00 0.00 0.05 0.30 0 0 1 8
1.00 1.00 1.00 1.00 35 32 28 25
35 33 31 32AVERAGE:
2008 Basis of Design Weighting Weighted LPW
2008 Basis of Design Weighting Weighted LPW
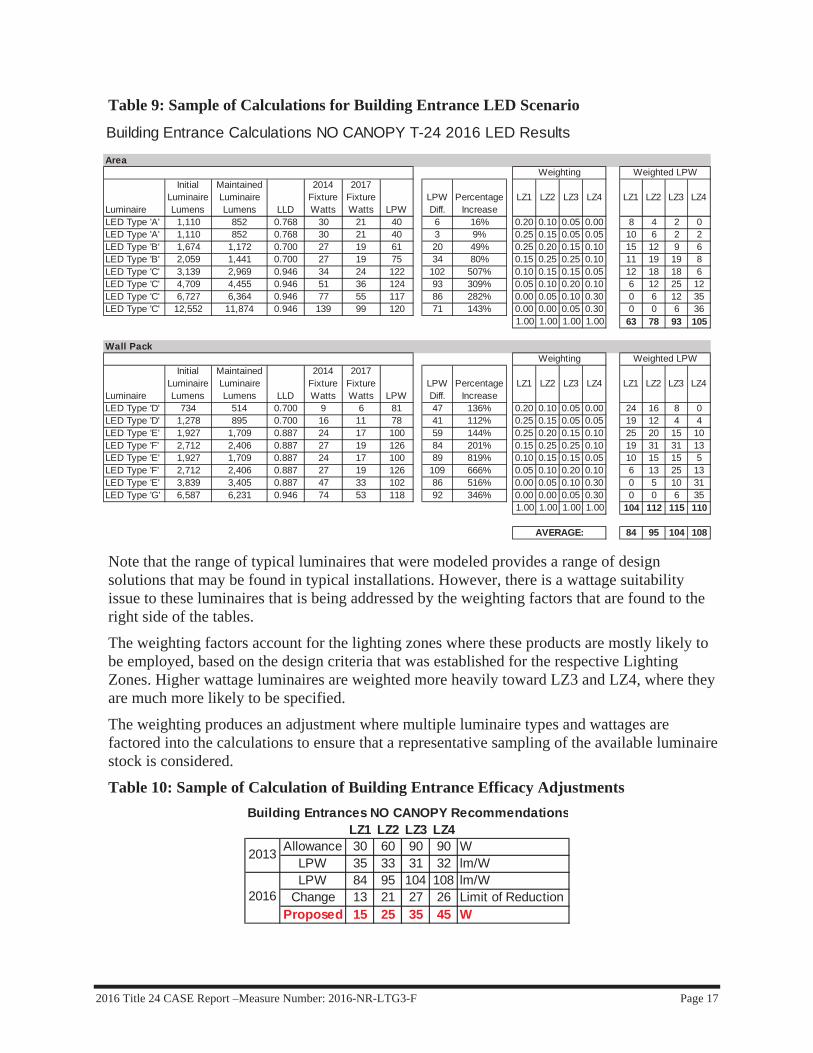
2016 Title 24 CASE Report –Measure Number: 2016-NR-LTG3-F Page 17
Table 9: Sample of Calculations for Building Entrance LED Scenario
Note that the range of typical luminaires that were modeled provides a range of design solutions that may be found in typical installations. However, there is a wattage suitability issue to these luminaires that is being addressed by the weighting factors that are found to the right side of the tables.
The weighting factors account for the lighting zones where these products are mostly likely to be employed, based on the design criteria that was established for the respective Lighting Zones. Higher wattage luminaires are weighted more heavily toward LZ3 and LZ4, where they are much more likely to be specified.
The weighting produces an adjustment where multiple luminaire types and wattages are factored into the calculations to ensure that a representative sampling of the available luminaire stock is considered.
Table 10: Sample of Calculation of Building Entrance Efficacy Adjustments
Building Entrance Calculations NO CANOPY T-24 2016 LED Results
Area
Luminaire
Initial Luminaire Lumens
Maintained Luminaire Lumens LLD
2014Fixture Watts
2017Fixture Watts LPW
LPW Diff.
Percentage Increase
LZ1 LZ2 LZ3 LZ4 LZ1 LZ2 LZ3 LZ4
LED Type 'A' 1,110 852 0.768 30 21 40 6 16% 0.20 0.10 0.05 0.00 8 4 2 0LED Type 'A' 1,110 852 0.768 30 21 40 3 9% 0.25 0.15 0.05 0.05 10 6 2 2LED Type 'B' 1,674 1,172 0.700 27 19 61 20 49% 0.25 0.20 0.15 0.10 15 12 9 6LED Type 'B' 2,059 1,441 0.700 27 19 75 34 80% 0.15 0.25 0.25 0.10 11 19 19 8LED Type 'C' 3,139 2,969 0.946 34 24 122 102 507% 0.10 0.15 0.15 0.05 12 18 18 6LED Type 'C' 4,709 4,455 0.946 51 36 124 93 309% 0.05 0.10 0.20 0.10 6 12 25 12LED Type 'C' 6,727 6,364 0.946 77 55 117 86 282% 0.00 0.05 0.10 0.30 0 6 12 35LED Type 'C' 12,552 11,874 0.946 139 99 120 71 143% 0.00 0.00 0.05 0.30 0 0 6 36
1.00 1.00 1.00 1.00 63 78 93 105
Wall Pack
Luminaire
Initial Luminaire Lumens
Maintained Luminaire Lumens LLD
2014Fixture Watts
2017Fixture Watts LPW
LPW Diff.
Percentage Increase
LZ1 LZ2 LZ3 LZ4 LZ1 LZ2 LZ3 LZ4
LED Type 'D' 734 514 0.700 9 6 81 47 136% 0.20 0.10 0.05 0.00 24 16 8 0LED Type 'D' 1,278 895 0.700 16 11 78 41 112% 0.25 0.15 0.05 0.05 19 12 4 4LED Type 'E' 1,927 1,709 0.887 24 17 100 59 144% 0.25 0.20 0.15 0.10 25 20 15 10LED Type 'F' 2,712 2,406 0.887 27 19 126 84 201% 0.15 0.25 0.25 0.10 19 31 31 13LED Type 'E' 1,927 1,709 0.887 24 17 100 89 819% 0.10 0.15 0.15 0.05 10 15 15 5LED Type 'F' 2,712 2,406 0.887 27 19 126 109 666% 0.05 0.10 0.20 0.10 6 13 25 13LED Type 'E' 3,839 3,405 0.887 47 33 102 86 516% 0.00 0.05 0.10 0.30 0 5 10 31LED Type 'G' 6,587 6,231 0.946 74 53 118 92 346% 0.00 0.00 0.05 0.30 0 0 6 35
1.00 1.00 1.00 1.00 104 112 115 110
84 95 104 108
Weighted LPW
Weighted LPW
AVERAGE:
Weighting
Weighting
Building Entrances NO CANOPY RecommendationsLZ1 LZ2 LZ3 LZ4
Allowance 30 60 90 90 WLPW 35 33 31 32 lm/WLPW 84 95 104 108 lm/W
Change 13 21 27 26 Limit of ReductionProposed 15 25 35 45 W
2016
2013

2016 Title 24 CASE Report –Measure Number: 2016-NR-LTG3-F Page 18
In all of these calculation sheets, the limits of the possible adjustment are presented (Limit of Reduction), and the proposed adjustment for Title 24 is also shown. In many cases the reductions are not nearly as aggressive as the LED light source calculations find to be technically possible. As this is the first opportunity to base Title 24 requirements on LED light sources, the Statewide CASE Team used a conservative approach. This approach provides a less significant reduction than may ultimately be possible, but the lighting design industry must become comfortable with the changing paradigm that LEDs represent before more aggressive LPA reductions can be implemented.
As an example in Table 10, Lighting Zone 3 currently has a lighting power allowance of 90 Watts per entrance. From our lighting model we estimate that this corresponds to an overall lighting system luminous efficacy of 31 lumens per Watt as shown above; the details how this 31 lm/W was calculated is shown in Table 8. The actual value is 31.4, rounded to 31 for space purposes. As shown in Table 10, the proposed system efficacy for LED entrance lighting systems is 104 lumens per watt for LZ3 (103.8 rounded to 104). From this information we can calculate the overall lumens per entrance delivered by CFLs or metal halide lighting using the current LPA and from this calculate the minimum amount of watts to provide the same amount for lumens by an LED system.
Current Lumens (LZ3) = Current Allowance [Watts] x Current System Efficacy [lm/W]
Current Allowed Lumens (LZ3) = 90 W x 31.4 lm/W = 2826 lumens
Minimum Proposed Watts (LZ3) = Current Allowed Lumens / Proposed System Efficacy
Minimum Proposed Watts (LZ3) = 2826 Lumens / 103.8 Lm/W = 27.2 Watts per entrance
Though 27.2 Watts per entrance is the lowest possible wattage allowance that could be proposed, this proposal is conservative and allows higher lighting wattage allowances. In this case the proposed lighting power allowance for LZ3 is 35 lumens per watt – 30% higher than the minimum wattage that could be technically justified, but still achieving a reduction of 62% of lighting power as compared to the current allowance of 90 Watts per entrance.
Appendix C contains these calculations for all outdoor lighting applications evaluated.
4.4 Prototype Building Sites This measure applies only to exterior lighting conditions, so the CEC building prototypes are not applicable. Instead, the Statewide CASE Team established nine building site prototypes to model representative site conditions; varying from an efficient (square) site with a simple building footprint and hardscape layout to more complex, less ideal site conditions. These prototypes enabled the Statewide CASE Team to compare LPA values in practical lighting layout conditions that represent the reasonable spectrum of conditions that may be encountered during a design project.
Further details on these sites are available in Appendix D.
Table 11 presents the details of the prototype sites used in the analysis.
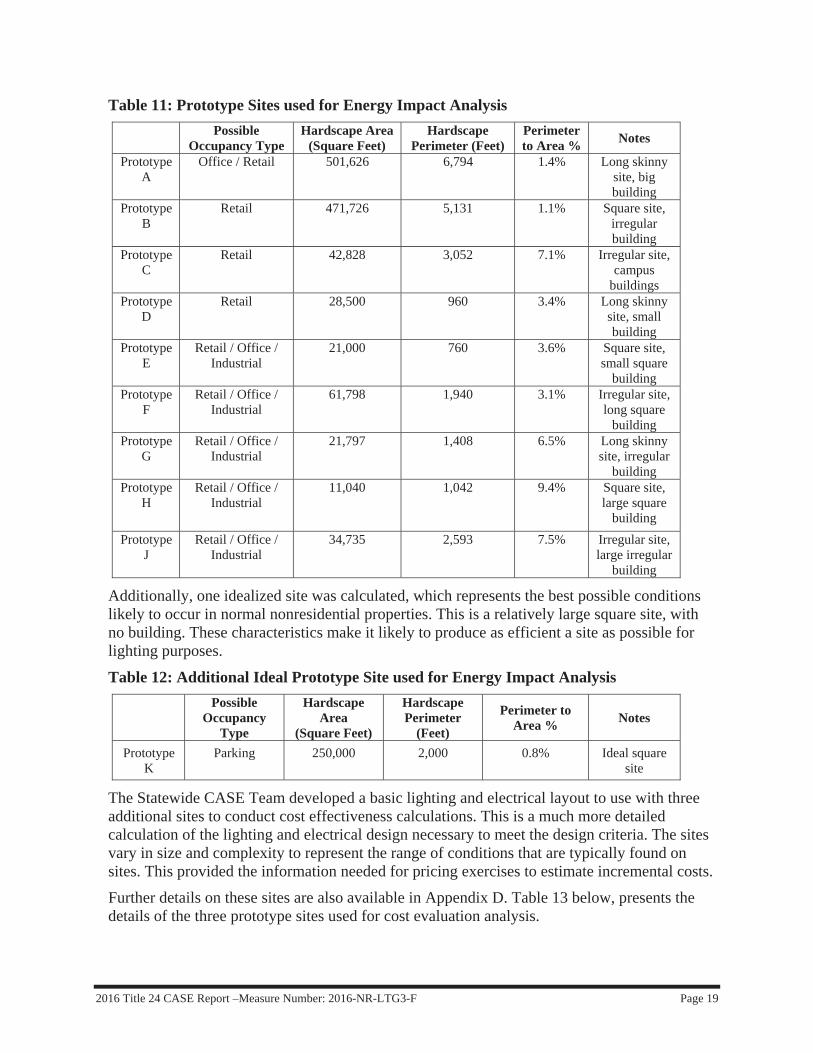
2016 Title 24 CASE Report –Measure Number: 2016-NR-LTG3-F Page 19
Table 11: Prototype Sites used for Energy Impact Analysis Possible
Occupancy Type Hardscape Area
(Square Feet) Hardscape
Perimeter (Feet) Perimeterto Area % Notes
Prototype A
Office / Retail 501,626 6,794 1.4% Long skinny site, big building
Prototype B
Retail 471,726 5,131 1.1% Square site, irregular building
Prototype C
Retail 42,828 3,052 7.1% Irregular site, campus
buildings Prototype
D Retail 28,500 960 3.4% Long skinny
site, small building
Prototype E
Retail / Office / Industrial
21,000 760 3.6% Square site, small square
building Prototype
F Retail / Office /
Industrial 61,798 1,940 3.1% Irregular site,
long square building
Prototype G
Retail / Office / Industrial
21,797 1,408 6.5% Long skinny site, irregular
building Prototype
H Retail / Office /
Industrial 11,040 1,042 9.4% Square site,
large square building
Prototype J
Retail / Office / Industrial
34,735 2,593 7.5% Irregular site, large irregular
building
Additionally, one idealized site was calculated, which represents the best possible conditions likely to occur in normal nonresidential properties. This is a relatively large square site, with no building. These characteristics make it likely to produce as efficient a site as possible for lighting purposes.
Table 12: Additional Ideal Prototype Site used for Energy Impact Analysis Possible
Occupancy Type
HardscapeArea
(Square Feet)
HardscapePerimeter
(Feet)
Perimeter to Area % Notes
Prototype K
Parking 250,000 2,000 0.8% Ideal square site
The Statewide CASE Team developed a basic lighting and electrical layout to use with three additional sites to conduct cost effectiveness calculations. This is a much more detailed calculation of the lighting and electrical design necessary to meet the design criteria. The sites vary in size and complexity to represent the range of conditions that are typically found on sites. This provided the information needed for pricing exercises to estimate incremental costs.
Further details on these sites are also available in Appendix D. Table 13 below, presents the details of the three prototype sites used for cost evaluation analysis.
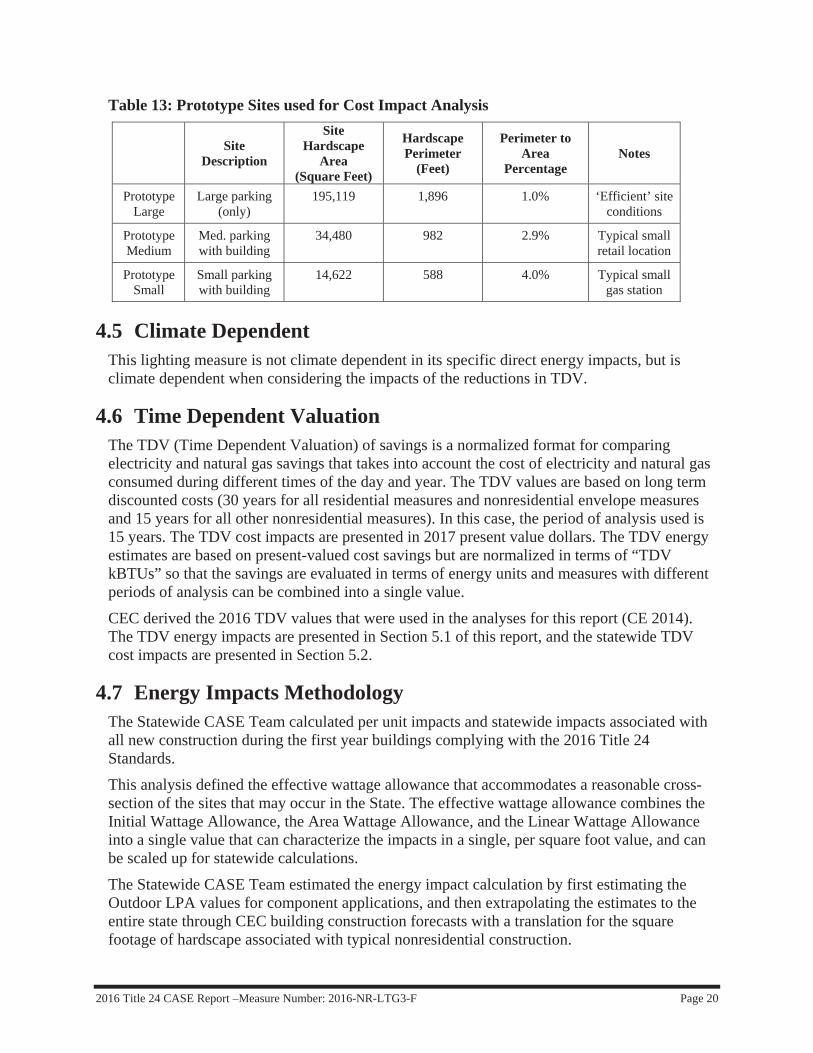
2016 Title 24 CASE Report –Measure Number: 2016-NR-LTG3-F Page 20
Table 13: Prototype Sites used for Cost Impact Analysis
SiteDescription
SiteHardscape
Area(Square Feet)
HardscapePerimeter
(Feet)
Perimeter to Area
Percentage Notes
Prototype Large
Large parking (only)
195,119 1,896 1.0% ‘Efficient’ site conditions
Prototype Medium
Med. parking with building
34,480 982 2.9% Typical small retail location
Prototype Small
Small parking with building
14,622 588 4.0% Typical small gas station
4.5 Climate DependentThis lighting measure is not climate dependent in its specific direct energy impacts, but is climate dependent when considering the impacts of the reductions in TDV.
4.6 Time Dependent Valuation The TDV (Time Dependent Valuation) of savings is a normalized format for comparing electricity and natural gas savings that takes into account the cost of electricity and natural gas consumed during different times of the day and year. The TDV values are based on long term discounted costs (30 years for all residential measures and nonresidential envelope measures and 15 years for all other nonresidential measures). In this case, the period of analysis used is 15 years. The TDV cost impacts are presented in 2017 present value dollars. The TDV energy estimates are based on present-valued cost savings but are normalized in terms of “TDV kBTUs” so that the savings are evaluated in terms of energy units and measures with different periods of analysis can be combined into a single value.
CEC derived the 2016 TDV values that were used in the analyses for this report (CE 2014). The TDV energy impacts are presented in Section 5.1 of this report, and the statewide TDV cost impacts are presented in Section 5.2.
4.7 Energy Impacts Methodology The Statewide CASE Team calculated per unit impacts and statewide impacts associated with all new construction during the first year buildings complying with the 2016 Title 24 Standards.
This analysis defined the effective wattage allowance that accommodates a reasonable cross-section of the sites that may occur in the State. The effective wattage allowance combines the Initial Wattage Allowance, the Area Wattage Allowance, and the Linear Wattage Allowance into a single value that can characterize the impacts in a single, per square foot value, and can be scaled up for statewide calculations.
The Statewide CASE Team estimated the energy impact calculation by first estimating the Outdoor LPA values for component applications, and then extrapolating the estimates to the entire state through CEC building construction forecasts with a translation for the square footage of hardscape associated with typical nonresidential construction.
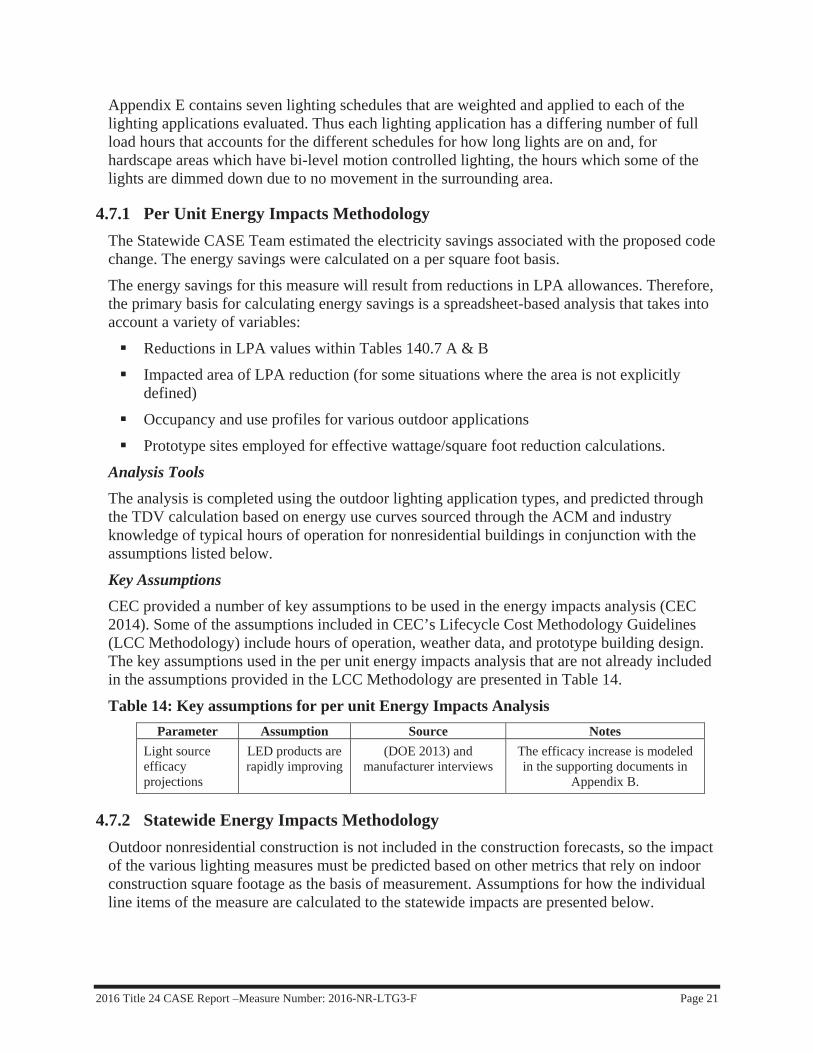
2016 Title 24 CASE Report –Measure Number: 2016-NR-LTG3-F Page 21
Appendix E contains seven lighting schedules that are weighted and applied to each of the lighting applications evaluated. Thus each lighting application has a differing number of full load hours that accounts for the different schedules for how long lights are on and, for hardscape areas which have bi-level motion controlled lighting, the hours which some of the lights are dimmed down due to no movement in the surrounding area.
4.7.1 Per Unit Energy Impacts Methodology The Statewide CASE Team estimated the electricity savings associated with the proposed code change. The energy savings were calculated on a per square foot basis.
The energy savings for this measure will result from reductions in LPA allowances. Therefore, the primary basis for calculating energy savings is a spreadsheet-based analysis that takes into account a variety of variables:
Reductions in LPA values within Tables 140.7 A & B
Impacted area of LPA reduction (for some situations where the area is not explicitly defined)
Occupancy and use profiles for various outdoor applications
Prototype sites employed for effective wattage/square foot reduction calculations.
Analysis Tools The analysis is completed using the outdoor lighting application types, and predicted through the TDV calculation based on energy use curves sourced through the ACM and industry knowledge of typical hours of operation for nonresidential buildings in conjunction with the assumptions listed below.
Key Assumptions CEC provided a number of key assumptions to be used in the energy impacts analysis (CEC 2014). Some of the assumptions included in CEC’s Lifecycle Cost Methodology Guidelines (LCC Methodology) include hours of operation, weather data, and prototype building design. The key assumptions used in the per unit energy impacts analysis that are not already included in the assumptions provided in the LCC Methodology are presented in Table 14.
Table 14: Key assumptions for per unit Energy Impacts Analysis Parameter Assumption Source Notes
Light source efficacy projections
LED products are rapidly improving
(DOE 2013) and manufacturer interviews
The efficacy increase is modeled in the supporting documents in
Appendix B.
4.7.2 Statewide Energy Impacts Methodology Outdoor nonresidential construction is not included in the construction forecasts, so the impact of the various lighting measures must be predicted based on other metrics that rely on indoor construction square footage as the basis of measurement. Assumptions for how the individual line items of the measure are calculated to the statewide impacts are presented below.
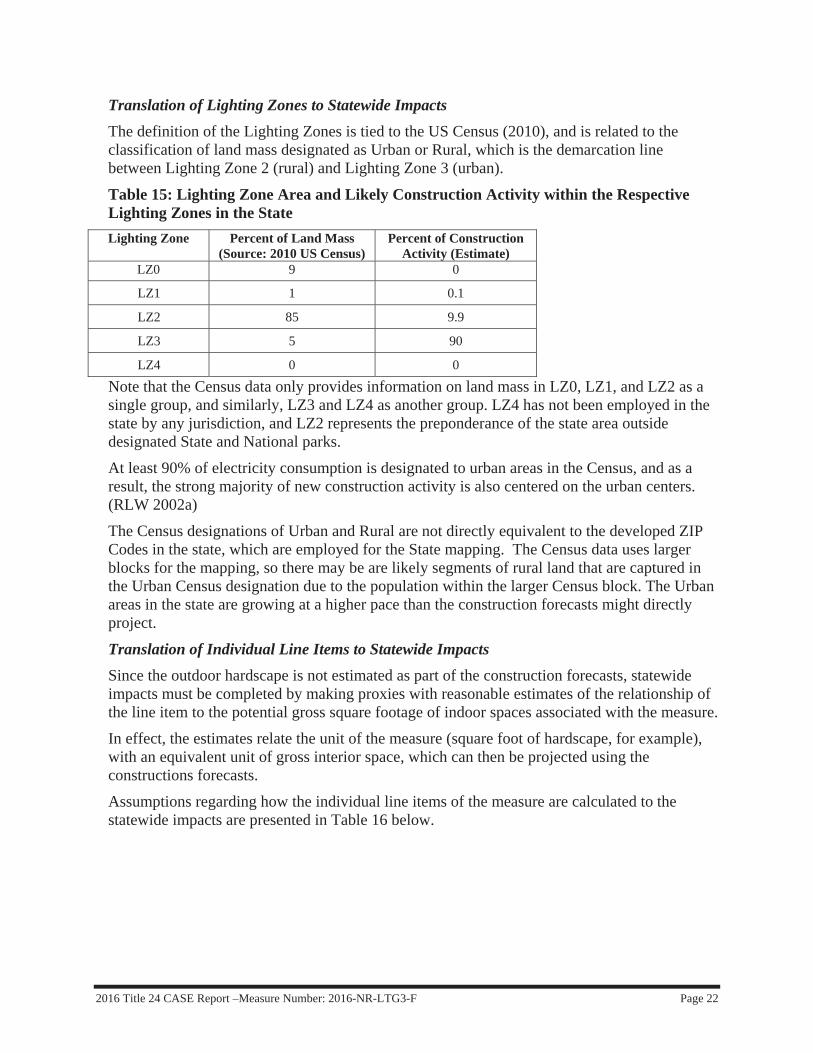
2016 Title 24 CASE Report –Measure Number: 2016-NR-LTG3-F Page 22
Translation of Lighting Zones to Statewide Impacts The definition of the Lighting Zones is tied to the US Census (2010), and is related to the classification of land mass designated as Urban or Rural, which is the demarcation line between Lighting Zone 2 (rural) and Lighting Zone 3 (urban).
Table 15: Lighting Zone Area and Likely Construction Activity within the Respective Lighting Zones in the State
Note that the Census data only provides information on land mass in LZ0, LZ1, and LZ2 as a single group, and similarly, LZ3 and LZ4 as another group. LZ4 has not been employed in the state by any jurisdiction, and LZ2 represents the preponderance of the state area outside designated State and National parks.
At least 90% of electricity consumption is designated to urban areas in the Census, and as a result, the strong majority of new construction activity is also centered on the urban centers. (RLW 2002a)
The Census designations of Urban and Rural are not directly equivalent to the developed ZIP Codes in the state, which are employed for the State mapping. The Census data uses larger blocks for the mapping, so there may be are likely segments of rural land that are captured in the Urban Census designation due to the population within the larger Census block. The Urban areas in the state are growing at a higher pace than the construction forecasts might directly project.
Translation of Individual Line Items to Statewide Impacts Since the outdoor hardscape is not estimated as part of the construction forecasts, statewide impacts must be completed by making proxies with reasonable estimates of the relationship of the line item to the potential gross square footage of indoor spaces associated with the measure.
In effect, the estimates relate the unit of the measure (square foot of hardscape, for example), with an equivalent unit of gross interior space, which can then be projected using the constructions forecasts.
Assumptions regarding how the individual line items of the measure are calculated to the statewide impacts are presented in Table 16 below.
Lighting Zone Percent of Land Mass (Source: 2010 US Census)
Percent of Construction Activity (Estimate)
LZ0 9 0
LZ1 1 0.1
LZ2 85 9.9
LZ3 5 90
LZ4 0 0
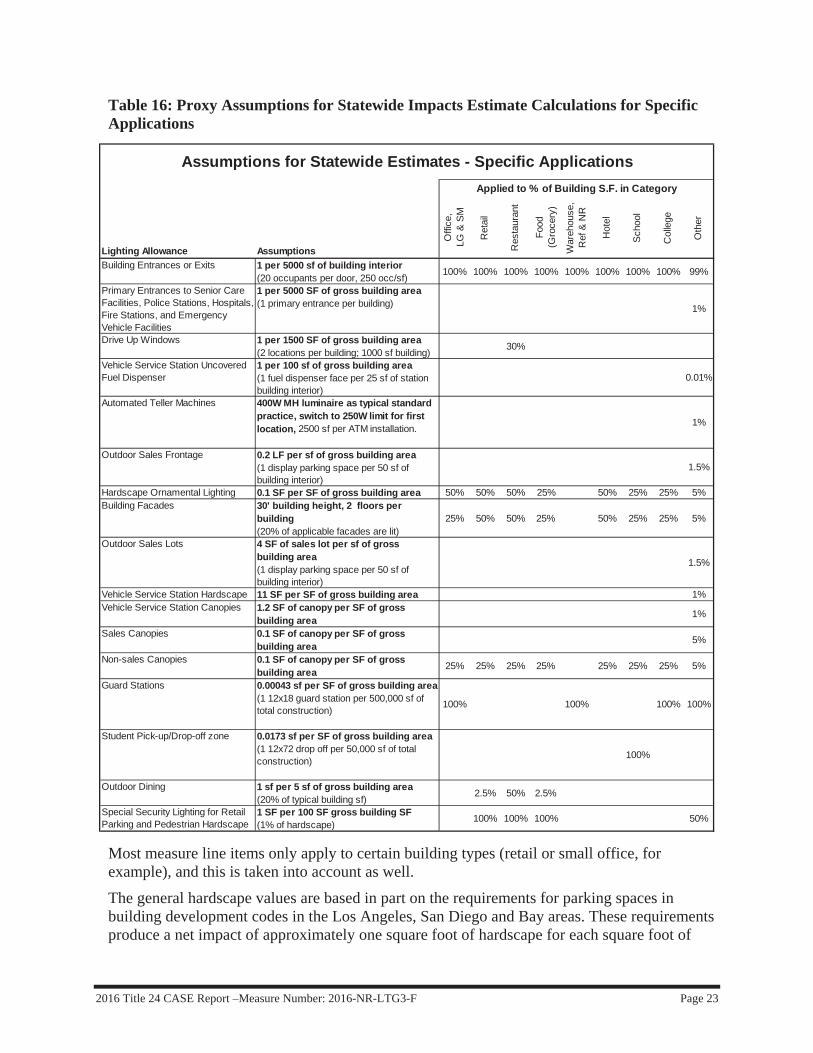
2016 Title 24 CASE Report –Measure Number: 2016-NR-LTG3-F Page 23
Table 16: Proxy Assumptions for Statewide Impacts Estimate Calculations for Specific Applications
Most measure line items only apply to certain building types (retail or small office, for example), and this is taken into account as well.
The general hardscape values are based in part on the requirements for parking spaces in building development codes in the Los Angeles, San Diego and Bay areas. These requirements produce a net impact of approximately one square foot of hardscape for each square foot of
Lighting Allowance Assumptions
Offi
ce,
LG &
SM
Ret
ail
Res
taur
ant
Food
(G
roce
ry)
War
ehou
se,
Ref
& N
R
Hot
el
Sch
ool
Col
lege
Oth
er
Building Entrances or Exits 1 per 5000 sf of building interior(20 occupants per door, 250 occ/sf) 100% 100% 100% 100% 100% 100% 100% 100% 99%
Primary Entrances to Senior Care Facilities, Police Stations, Hospitals, Fire Stations, and Emergency Vehicle Facilities
1 per 5000 SF of gross building area (1 primary entrance per building) 1%
Drive Up Windows 1 per 1500 SF of gross building area (2 locations per building; 1000 sf building) 30%
Vehicle Service Station Uncovered Fuel Dispenser
1 per 100 sf of gross building area (1 fuel dispenser face per 25 sf of station building interior)
0.01%
Automated Teller Machines 400W MH luminaire as typical standard practice, switch to 250W limit for first location, 2500 sf per ATM installation. 1%
Outdoor Sales Frontage 0.2 LF per sf of gross building area(1 display parking space per 50 sf of building interior)
1.5%
Hardscape Ornamental Lighting 0.1 SF per SF of gross building area 50% 50% 50% 25% 50% 25% 25% 5%Building Facades 30' building height, 2 floors per
building(20% of applicable facades are lit)
25% 50% 50% 25% 50% 25% 25% 5%
Outdoor Sales Lots 4 SF of sales lot per sf of gross building area(1 display parking space per 50 sf of building interior)
1.5%
Vehicle Service Station Hardscape 11 SF per SF of gross building area 1%Vehicle Service Station Canopies 1.2 SF of canopy per SF of gross
building area 1%
Sales Canopies 0.1 SF of canopy per SF of gross building area 5%
Non-sales Canopies 0.1 SF of canopy per SF of gross building area 25% 25% 25% 25% 25% 25% 25% 5%
Guard Stations 0.00043 sf per SF of gross building area(1 12x18 guard station per 500,000 sf of total construction) 100% 100% 100% 100%
Student Pick-up/Drop-off zone 0.0173 sf per SF of gross building area(1 12x72 drop off per 50,000 sf of total construction) 100%
Outdoor Dining 1 sf per 5 sf of gross building area(20% of typical building sf) 2.5% 50% 2.5%
Special Security Lighting for Retail Parking and Pedestrian Hardscape
1 SF per 100 SF gross building SF(1% of hardscape) 100% 100% 100% 50%
Assumptions for Statewide Estimates - Specific ApplicationsApplied to % of Building S.F. in Category
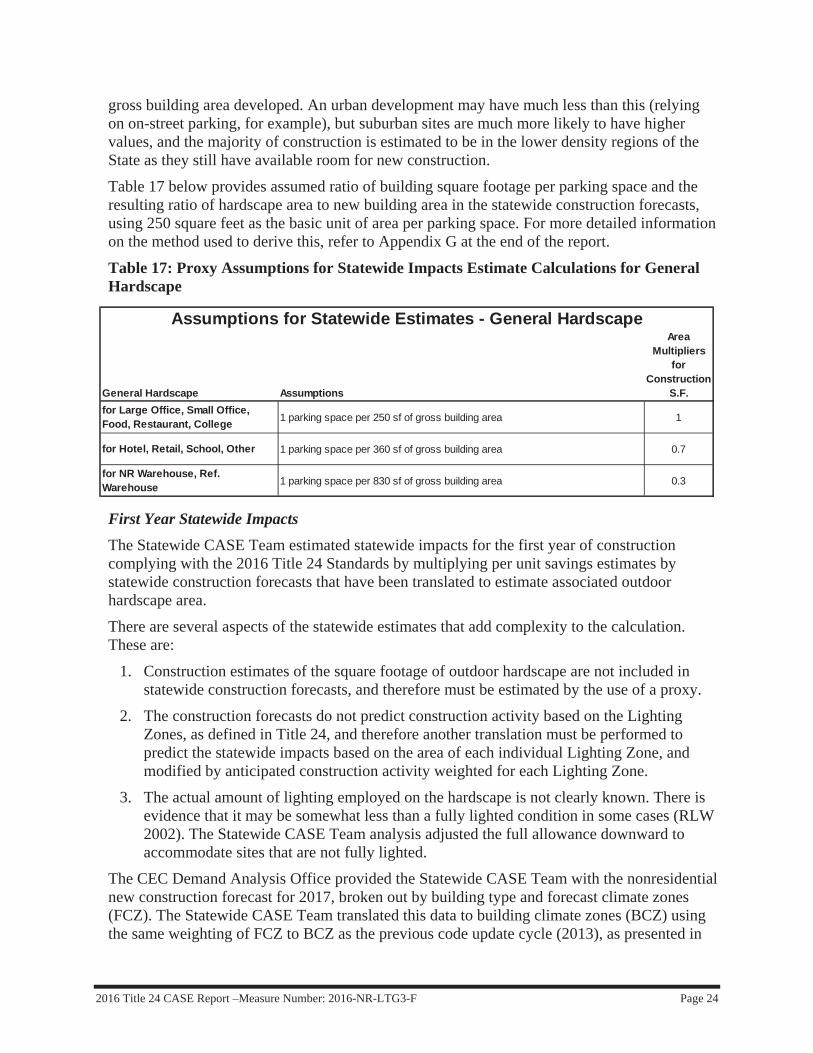
2016 Title 24 CASE Report –Measure Number: 2016-NR-LTG3-F Page 24
gross building area developed. An urban development may have much less than this (relying on on-street parking, for example), but suburban sites are much more likely to have higher values, and the majority of construction is estimated to be in the lower density regions of the State as they still have available room for new construction.
Table 17 below provides assumed ratio of building square footage per parking space and the resulting ratio of hardscape area to new building area in the statewide construction forecasts, using 250 square feet as the basic unit of area per parking space. For more detailed information on the method used to derive this, refer to Appendix G at the end of the report.
Table 17: Proxy Assumptions for Statewide Impacts Estimate Calculations for General Hardscape
First Year Statewide Impacts The Statewide CASE Team estimated statewide impacts for the first year of construction complying with the 2016 Title 24 Standards by multiplying per unit savings estimates by statewide construction forecasts that have been translated to estimate associated outdoor hardscape area.
There are several aspects of the statewide estimates that add complexity to the calculation. These are:
1. Construction estimates of the square footage of outdoor hardscape are not included in statewide construction forecasts, and therefore must be estimated by the use of a proxy.
2. The construction forecasts do not predict construction activity based on the Lighting Zones, as defined in Title 24, and therefore another translation must be performed to predict the statewide impacts based on the area of each individual Lighting Zone, and modified by anticipated construction activity weighted for each Lighting Zone.
3. The actual amount of lighting employed on the hardscape is not clearly known. There is evidence that it may be somewhat less than a fully lighted condition in some cases (RLW 2002). The Statewide CASE Team analysis adjusted the full allowance downward to accommodate sites that are not fully lighted.
The CEC Demand Analysis Office provided the Statewide CASE Team with the nonresidential new construction forecast for 2017, broken out by building type and forecast climate zones (FCZ). The Statewide CASE Team translated this data to building climate zones (BCZ) using the same weighting of FCZ to BCZ as the previous code update cycle (2013), as presented in
General Hardscape Assumptions
Area Multipliers
for Construction
S.F.for Large Office, Small Office, Food, Restaurant, College 1 parking space per 250 sf of gross building area 1
for Hotel, Retail, School, Other 1 parking space per 360 sf of gross building area 0.7
for NR Warehouse, Ref. Warehouse 1 parking space per 830 sf of gross building area 0.3
Assumptions for Statewide Estimates - General Hardscape
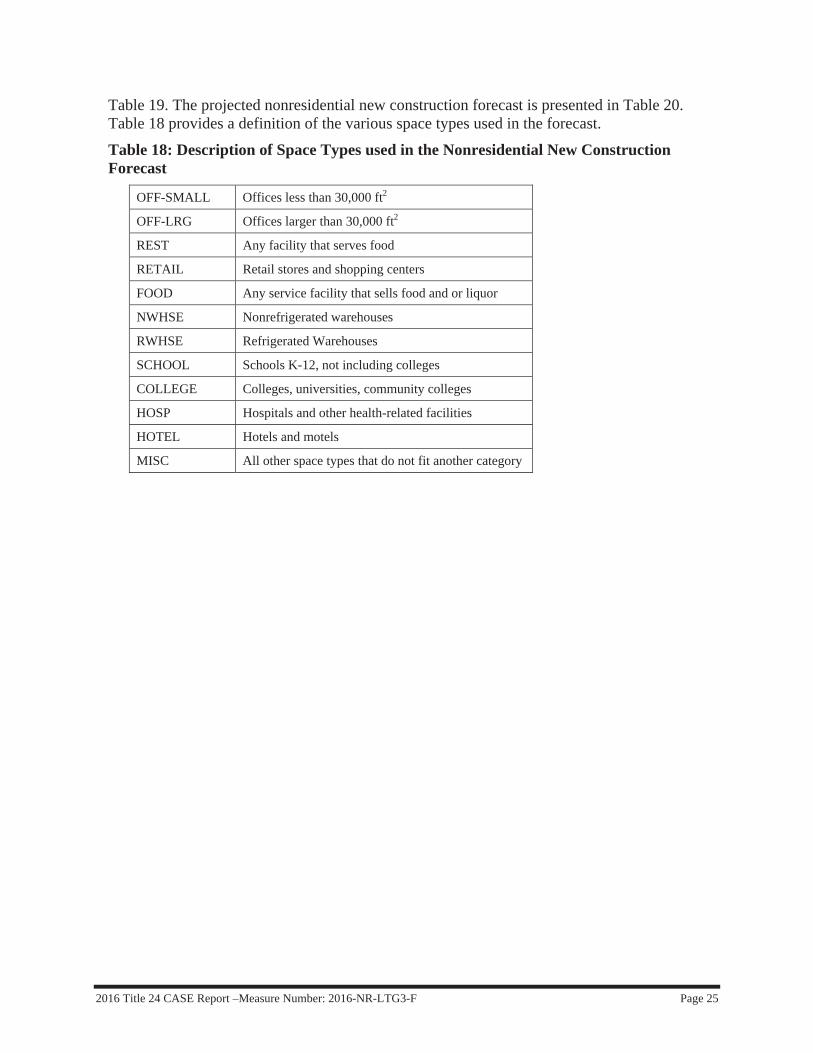
2016 Title 24 CASE Report –Measure Number: 2016-NR-LTG3-F Page 25
Table 19. The projected nonresidential new construction forecast is presented in Table 20. Table 18 provides a definition of the various space types used in the forecast.
Table 18: Description of Space Types used in the Nonresidential New Construction Forecast
OFF-SMALL Offices less than 30,000 ft2
OFF-LRG Offices larger than 30,000 ft2
REST Any facility that serves food
RETAIL Retail stores and shopping centers
FOOD Any service facility that sells food and or liquor
NWHSE Nonrefrigerated warehouses
RWHSE Refrigerated Warehouses
SCHOOL Schools K-12, not including colleges
COLLEGE Colleges, universities, community colleges
HOSP Hospitals and other health-related facilities
HOTEL Hotels and motels
MISC All other space types that do not fit another category

2016 Title 24 CASE Report –Measure Number: 2016-NR-LTG3-F Page 26
Table 19. Translation from FCZ to BCZ Source: CEC Demand Analysis Office
1 2 3 4 5 6 7 8 9 10 11 12 13 14 15 16 Grand Total1 22.5% 20.6% 0.0% 0.0% 0.0% 0.0% 0.0% 0.0% 0.0% 0.0% 9.8% 33.1% 0.2% 0.0% 0.0% 13.8% 100%2 0.0% 0.0% 0.0% 0.0% 0.0% 0.0% 0.0% 0.0% 0.0% 0.0% 22.0% 75.7% 0.0% 0.0% 0.0% 2.3% 100%3 0.0% 0.0% 0.0% 0.0% 0.0% 0.0% 0.0% 0.0% 0.0% 0.0% 21.0% 22.8% 54.5% 0.0% 0.0% 1.8% 100%4 0.2% 13.7% 8.4% 46.0% 8.9% 0.0% 0.0% 0.0% 0.0% 0.0% 0.0% 22.8% 0.0% 0.0% 0.0% 0.0% 100%5 0.0% 4.2% 89.1% 0.0% 0.0% 0.0% 0.0% 0.0% 0.0% 0.0% 0.0% 6.6% 0.0% 0.0% 0.0% 0.0% 100%6 0.0% 0.0% 0.0% 0.0% 0.0% 0.0% 0.0% 0.0% 0.0% 0.0% 0.0% 100.0% 0.0% 0.0% 0.0% 0.0% 100%7 0.0% 0.0% 0.0% 0.0% 0.0% 0.0% 0.0% 0.0% 0.0% 0.0% 0.0% 0.0% 75.8% 7.1% 0.0% 17.1% 100%8 0.0% 0.0% 0.0% 0.0% 0.0% 40.4% 0.0% 51.1% 8.1% 0.0% 0.0% 0.0% 0.0% 0.0% 0.0% 0.5% 100%9 0.0% 0.0% 0.0% 0.0% 0.0% 7.0% 0.0% 24.5% 57.9% 0.0% 0.0% 0.0% 0.0% 6.7% 0.0% 4.0% 100%10 0.0% 0.0% 0.0% 0.0% 0.0% 0.0% 0.0% 0.0% 0.0% 74.9% 0.0% 0.0% 0.0% 12.3% 7.9% 4.9% 100%11 0.0% 0.0% 0.0% 0.0% 0.0% 33.0% 0.0% 24.8% 42.2% 0.0% 0.0% 0.0% 0.0% 0.0% 0.0% 0.0% 100%12 0.0% 0.0% 0.0% 0.0% 0.0% 0.9% 0.0% 20.2% 75.2% 0.0% 0.0% 0.0% 0.0% 0.0% 0.0% 3.7% 100%13 0.0% 0.0% 0.0% 0.0% 0.0% 0.0% 69.6% 0.0% 0.0% 28.8% 0.0% 0.0% 0.0% 1.6% 0.1% 0.0% 100%14 0.0% 0.0% 0.0% 0.0% 0.0% 0.0% 0.0% 0.0% 100.0% 0.0% 0.0% 0.0% 0.0% 0.0% 0.0% 0.0% 100%15 0.0% 0.0% 0.0% 0.0% 0.0% 0.0% 0.0% 0.0% 0.0% 0.0% 0.0% 0.0% 0.0% 0.1% 99.9% 0.0% 100%16 0.0% 0.0% 0.0% 0.0% 0.0% 0.0% 0.0% 0.0% 100.0% 0.0% 0.0% 0.0% 0.0% 0.0% 0.0% 0.0% 100%17 3.0% 0.0% 0.0% 0.0% 0.0% 0.0% 0.0% 0.0% 0.0% 0.0% 0.0% 0.0% 0.0% 0.0% 0.0% 97.1% 100%
Fore
cast
Clim
ate
Zone
s (FC
Z)
Building Standards Climate Zones (BCZ)
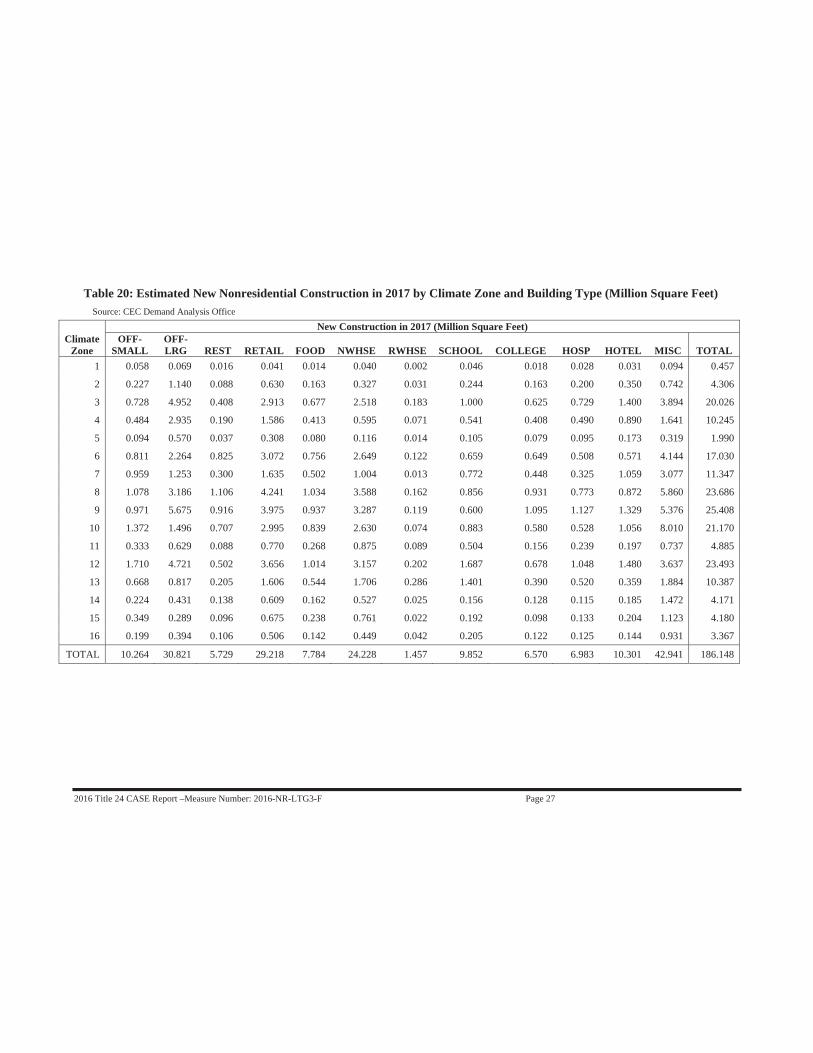
2016 Title 24 CASE Report –Measure Number: 2016-NR-LTG3-F Page 27
Table 20: Estimated New Nonresidential Construction in 2017 by Climate Zone and Building Type (Million Square Feet) Source: CEC Demand Analysis Office
Climate Zone
New Construction in 2017 (Million Square Feet) OFF-
SMALLOFF-LRG REST RETAIL FOOD NWHSE RWHSE SCHOOL COLLEGE HOSP HOTEL MISC TOTAL
1 0.058 0.069 0.016 0.041 0.014 0.040 0.002 0.046 0.018 0.028 0.031 0.094 0.457
2 0.227 1.140 0.088 0.630 0.163 0.327 0.031 0.244 0.163 0.200 0.350 0.742 4.306
3 0.728 4.952 0.408 2.913 0.677 2.518 0.183 1.000 0.625 0.729 1.400 3.894 20.026
4 0.484 2.935 0.190 1.586 0.413 0.595 0.071 0.541 0.408 0.490 0.890 1.641 10.245
5 0.094 0.570 0.037 0.308 0.080 0.116 0.014 0.105 0.079 0.095 0.173 0.319 1.990
6 0.811 2.264 0.825 3.072 0.756 2.649 0.122 0.659 0.649 0.508 0.571 4.144 17.030
7 0.959 1.253 0.300 1.635 0.502 1.004 0.013 0.772 0.448 0.325 1.059 3.077 11.347
8 1.078 3.186 1.106 4.241 1.034 3.588 0.162 0.856 0.931 0.773 0.872 5.860 23.686
9 0.971 5.675 0.916 3.975 0.937 3.287 0.119 0.600 1.095 1.127 1.329 5.376 25.408
10 1.372 1.496 0.707 2.995 0.839 2.630 0.074 0.883 0.580 0.528 1.056 8.010 21.170
11 0.333 0.629 0.088 0.770 0.268 0.875 0.089 0.504 0.156 0.239 0.197 0.737 4.885
12 1.710 4.721 0.502 3.656 1.014 3.157 0.202 1.687 0.678 1.048 1.480 3.637 23.493
13 0.668 0.817 0.205 1.606 0.544 1.706 0.286 1.401 0.390 0.520 0.359 1.884 10.387
14 0.224 0.431 0.138 0.609 0.162 0.527 0.025 0.156 0.128 0.115 0.185 1.472 4.171
15 0.349 0.289 0.096 0.675 0.238 0.761 0.022 0.192 0.098 0.133 0.204 1.123 4.180
16 0.199 0.394 0.106 0.506 0.142 0.449 0.042 0.205 0.122 0.125 0.144 0.931 3.367
TOTAL 10.264 30.821 5.729 29.218 7.784 24.228 1.457 9.852 6.570 6.983 10.301 42.941 186.148
2016 Title 24 CASE Report –Measure Number: 2016-NR-LTG3-F Page 28
4.8 Cost-effectiveness Methodology This measure proposes a mandatory requirement. As such, a lifecycle cost analysis is required to demonstrate that the measure is cost-effective over the 15 year period of analysis.
CEC’s procedures for calculating lifecycle cost-effectiveness are documented in LCC Methodology (CEC 2014). The Statewide CASE Team followed these guidelines when developing the Cost-effectiveness Analysis for this measure. CEC’s guidance dictated which costs were included in the analysis. Incremental equipment and maintenance costs over the 15 year period of analysis were included. The TDV energy cost savings from electricity savings were considered. Each of these components is discussed in more detail below.
Design costs were not included.
4.8.1 Incremental Cost Methodology The Statewide CASE Team estimated the incremental cost of LED lighting products based on current costs (sourced from sales representatives for manufacturers) and reductions in the cost per kilolumen of LED light source technology as detailed in a report to the DOE from Navigant (Navigant 2012). These estimates are reinforced using cost projections from another DOE study that provided cost estimates of actual luminaire product categories (DOE 2013).
The Statewide CASE Team estimated costs for non-volatile products (poles, foundations, etc.) based on a mix of manufacturer’s sales representative price quotes and general pricing experience through multiple construction projects. Costs for commodity items and labor (conductors, conduit, trenching, installation or equipment, etc.) are based on RS Means estimates collected during June 2014.
The Statewide CASE Team compared prices for three installation scenarios, which are the detailed project installation cost comparison examples described in Appendix F below.
Incremental Construction Cost Methodology As requested by CEC, the Statewide CASE Team estimated the Current Incremental Construction Costs and Post-adoption Incremental Construction Costs. The Current Incremental Construction Cost ( CIC) represents the cost of the incremental cost of the measure if a building meeting the proposed standard were built today. The Post-adoption Incremental Construction Cost ( CIPA) represents the anticipated cost assuming full market penetration of the measure as a result of the new Standards, resulting in possible reduction in unit costs as manufacturing practices improve over time and with increased production volume of qualifying products the year the Standard becomes effective.
For the general hardscape allowance, the Statewide CASE Team designed a lighting system to meet criteria for the same site conditions using an incumbent light source technology (PSMH) and the new baseline (LED). These two systems are optimized to efficiently meet lighting design criteria, the electrical needs of the system, and physical issues (pole heights, foundations, etc.).
Finally, the Statewide CASE Team estimated costs for the two systems using projected costs of LED in 2017 and current costs for PSMH products. This approach was applied to three

2016 Title 24 CASE Report –Measure Number: 2016-NR-LTG3-F Page 29
different sites to produce a reasonable estimate of the impact on a variety of site conditions. The cost difference between these scenarios provides the incremental cost of this measure.
For the specific lighting allowances in Table 140.7-B, the LED light source is unlikely to be able to substantially change the designs because there are other factors that determine the equipment locations and quantities. In these circumstances, a luminaire cannot be compared directly with other system changes being considered (an incumbent technology luminaire compared to an LED luminaire with no impacts on wiring, etc.). This simplifies the calculations, but will underestimate the positive impacts of the reduced wattage of the luminaires. Key assumptions used to derive cost are presented in Table 21.
Table 21: Key Assumptions for per unit Incremental Construction Cost Parameter Assumption Source Notes
Product Cost projections
LED costs are dropping rapidly
(DOE 2013) and manufacturer interviews for
confirmation
The cost of lighting products in 2017 is modeled in the supporting
documents in Appendix B.
Incremental Maintenance Cost Methodology Maintenance costs associated with LED lighting products are generally a reduction from the incumbent technology. The LCC analysis uses a 15 year life cycle, during which no maintenance is expected for any of the LED lighting equipment because the products are still within their life expectancy at that time (approximately 65,000 hours of operation). As a result, the maintenance impacts result in savings related to the elimination of typical cyclic maintenance associated with the lighting equipment (primarily lamp and ballast replacement with failure). This varies by lamp type and wattage, so the Statewide CASE Team used a reasonable cross-section of incumbent lamps to calculate maintenance costs for incumbent and LED systems.
4.8.2 Cost Savings Methodology Energy Cost Savings Methodology The PV of the energy savings were calculated using the method described in the LCC Methodology (CEC 2014). In short, the hourly energy savings estimates for the first year of building operation were multiplied by the 2016 TDV cost values to arrive at the PV of the cost savings over the 15 year period of analysis. This measure is not climate sensitive, so the hourly energy cost savings were calculated using the population-weighted TDV values.
Other Cost Savings Methodology Other than maintenance cost savings, this measure does not have any non-energy cost savings.
4.8.3 Cost-effectiveness Methodology The Statewide CASE Team calculated the cost-effectiveness using the LCC Methodology (CEC 2014). According to CEC’s definitions, a measure is cost effective if it reduces overall lifecycle cost from the current base case (existing conditions). The LCC Methodology clarifies that absolute lifecycle cost of the proposed measure does not need to be calculated. Rather, it is necessary to calculate the change in lifecycle cost from the existing conditions to the proposed conditions.
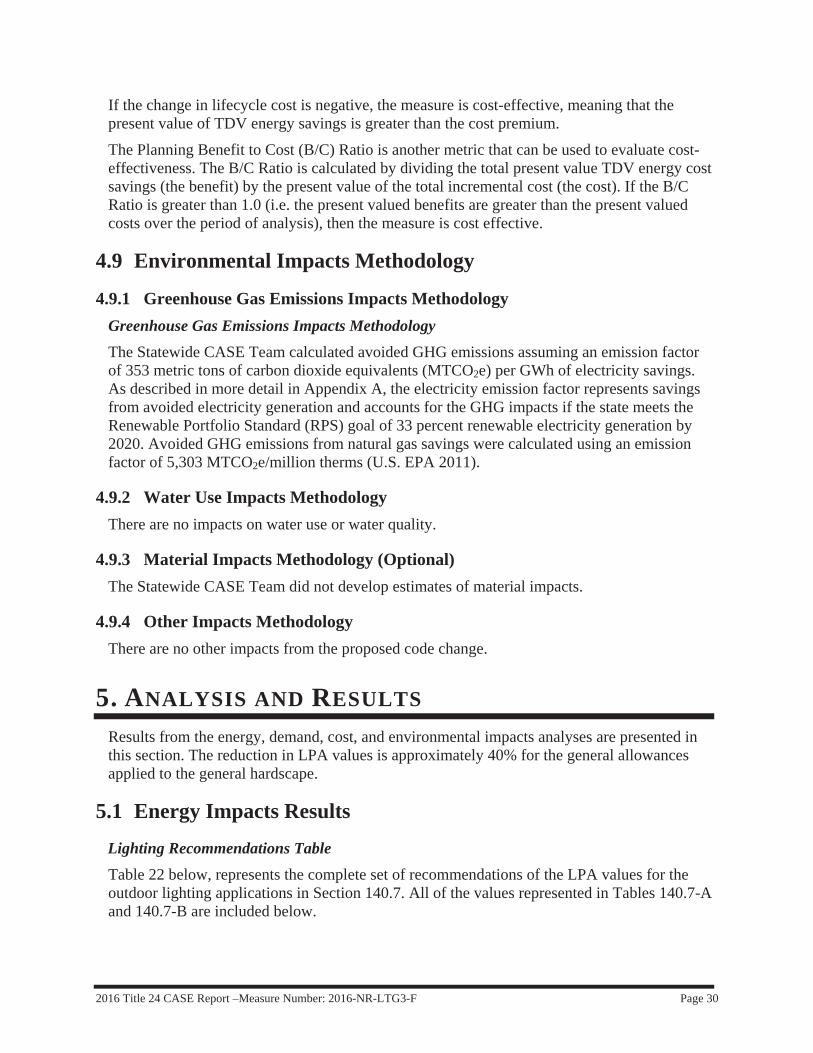
2016 Title 24 CASE Report –Measure Number: 2016-NR-LTG3-F Page 30
If the change in lifecycle cost is negative, the measure is cost-effective, meaning that the present value of TDV energy savings is greater than the cost premium.
The Planning Benefit to Cost (B/C) Ratio is another metric that can be used to evaluate cost-effectiveness. The B/C Ratio is calculated by dividing the total present value TDV energy cost savings (the benefit) by the present value of the total incremental cost (the cost). If the B/C Ratio is greater than 1.0 (i.e. the present valued benefits are greater than the present valued costs over the period of analysis), then the measure is cost effective.
4.9 Environmental Impacts Methodology
4.9.1 Greenhouse Gas Emissions Impacts Methodology Greenhouse Gas Emissions Impacts Methodology The Statewide CASE Team calculated avoided GHG emissions assuming an emission factor of 353 metric tons of carbon dioxide equivalents (MTCO2e) per GWh of electricity savings. As described in more detail in Appendix A, the electricity emission factor represents savings from avoided electricity generation and accounts for the GHG impacts if the state meets the Renewable Portfolio Standard (RPS) goal of 33 percent renewable electricity generation by 2020. Avoided GHG emissions from natural gas savings were calculated using an emission factor of 5,303 MTCO2e/million therms (U.S. EPA 2011).
4.9.2 Water Use Impacts Methodology There are no impacts on water use or water quality.
4.9.3 Material Impacts Methodology (Optional) The Statewide CASE Team did not develop estimates of material impacts.
4.9.4 Other Impacts Methodology There are no other impacts from the proposed code change.
5. ANALYSIS AND RESULTS
Results from the energy, demand, cost, and environmental impacts analyses are presented in this section. The reduction in LPA values is approximately 40% for the general allowances applied to the general hardscape.
5.1 Energy Impacts Results
Lighting Recommendations Table Table 22 below, represents the complete set of recommendations of the LPA values for the outdoor lighting applications in Section 140.7. All of the values represented in Tables 140.7-A and 140.7-B are included below.

2016 Title 24 CASE Report –Measure Number: 2016-NR-LTG3-F Page 31
Table 22: Outdoor Lighting LPA Recommendations Table
Table 23, below, represents the complete set of recommendations of the LPA values for the outdoor lighting applications in Section 140.7 and the percentage reduction for the LPA values based on this recommendation. All of the values represented in Tables 140.7-A and 140.7-B are included below.
Units LightingZone 1
LightingZone 2
LightingZone 3
LightingZone 4
LightingZone 1
LightingZone 2
LightingZone 3
LightingZone 4
AreaWattage Allowance (AWA) W/s 0.035 0.045 0.090 0.115 0.020 0.030 0.040 0.050LinearWattage Allowance (LWA) W/lf 0.25 0.45 0.60 0.85 0.15 0.25 0.35 0.45Initial Wattage Allowance (IWA) W 340 510 770 1030 340 450 520 640Building Entrances or Exits W 30 60 90 90 15 25 35 45Primary Entrances to Senior CareFacilities, Police Stations, Hospitals, FireStations, and Emergency Vehicle Facilities.
W 45 80 120 130 20 40 60 80
Drive UpWindows W 40 75 125 200 30 40 60 100Vehicle Service Station Uncovered FuelDispenser.
W 120 175 185 330 80 100 140 160
Automated TellerMachines WAllowanceper UnitLength
Outdoor Sales Frontage W/lf Noallowance
22.5 36 45 Noallowance
15 25 30
AllowanceperHardscapeArea
Hardscape Ornamental Lighting W/sf Noallowance
0.020 0.040 0.060 Noallowance
0.015 0.030 0.045
Building Facades W/sf Noallowance
0.18 0.35 0.50 Noallowance
0.15 0.25 0.35
Outdoor Sales Lots W/sf 0.164 0.555 0.758 1.285 0.100 0.250 0.500 1.000Vehicle Service Station Hardscape W/sf 0.014 0.155 0.308 0.485 0.010 0.100 0.150 0.200Vehicle Service Station Canopies W/sf 0.514 1.005 1.300 2.200 0.400 0.700 0.900 1.200Sales Canopies W/sf No
allowance0.655 0.908 1.135 No
allowance0.500 0.800 1.000
Non sales Canopies W/sf 0.084 0.205 0.408 0.585 0.080 0.160 0.300 0.400Guard Stations W/sf 0.154 0.355 0.708 0.985 0.100 0.300 0.500 0.750Student Pick up/Drop off zone W/sf No
allowance0.15 0.45 No
allowanceNo
allowance0.10 0.25 No
allowanceOutdoor Dining W/sf 0.014 0.135 0.240 0.400 0.010 0.100 0.150 0.200Special Security Lighting for Retail Parkingand Pedestrian Hardscape
W/sf 0.007 0.009 0.019 Noallowance
0.005 0.007 0.012 Noallowance
2013 2016 ProposedAllowance
Allowanceper SpecificArea
250W for first ATMplus 70Wper add'l ATMNot Included
AllowanceperApplication
GeneralHardscapeAllowance

2016 Title 24 CASE Report –Measure Number: 2016-NR-LTG3-F Page 32
Table 23: Outdoor Lighting LPA Recommendations Reduction Percentage Table
5.1.1 Per Unit Energy Impacts Results Table 24 below provides information on the per unit results for a comparison of the general hardscape lighting for ten different prototypical sites, comparing the results from an incumbent technology approach to an LED light source approach.
The sites include nine different site layouts, with a range of sizes and building complexity. One additional site is included that represents an ‘ideal’ site; the most efficient site that can be produced in a rectangular shape. For more details on the sites, refer to Appendix D at the end of the report.
This analysis establishes an effective wattage allowance that accommodates a reasonable cross-section of the sites that may occur in the State. The effective wattage allowance combines the Initial Wattage Allowance, the Area Wattage Allowance, and the Linear Wattage Allowance values found in Table 140.7-A of the Code into a single value that can
Units LightingZone 1
LightingZone 2
LightingZone 3
LightingZone 4
LZ1Reduced
By:
LZ2Reduced
By:
LZ3Reduced
By:
LZ3Reduced
By:AreaWattage Allowance (AWA) W/s 0.020 0.030 0.040 0.050 43% 33% 56% 57%LinearWattage Allowance (LWA) W/lf 0.15 0.25 0.35 0.45 40% 44% 42% 47%Initial Wattage Allowance (IWA) W 340 450 520 640 No Change 12% 32% 38%Building Entrances or Exits. W 15 25 35 45 50% 58% 61% 50%
Primary Entrances to Senior CareFacilities, Police Stations, Hospitals, FireStations, and Emergency Vehicle Facilities.
W 20 40 60 80 56% 50% 50% 38%
Drive UpWindows. W 30 40 60 100 25% 47% 52% 50%Vehicle Service Station Uncovered FuelDispenser.
W 80 100 140 160 33% 43% 24% 52%
Automated TellerMachines. WAllowanceper UnitLength
Outdoor Sales Frontage. W/lf Noallowance
15 25 30 No Change 33% 31% 33%
AllowanceperHardscapeArea
Hardscape Ornamental Lighting. W/sf Noallowance
0.015 0.030 0.045 No Change 25% 25% 25%
Building Facades. W/sf Noallowance
0.15 0.25 0.35 No Change 17% 29% 30%
Outdoor Sales Lots. W/sf 0.100 0.250 0.500 1.000 39% 55% 34% 22%Vehicle Service Station Hardscape. W/sf 0.010 0.100 0.150 0.200 29% 35% 51% 59%Vehicle Service Station Canopies. W/sf 0.400 0.700 0.900 1.200 22% 30% 31% 45%Sales Canopies. W/sf No
allowance0.500 0.800 1.000 No Change 24% 12% 12%
Non sales Canopies. W/sf 0.080 0.160 0.300 0.400 5% 22% 26% 32%Guard Stations. W/sf 0.100 0.300 0.500 0.750 35% 15% 29% 24%Student Pick up/Drop off zone. W/sf No
allowance0.10 0.25 No
allowanceNo Change 33% 44% No Change
Outdoor Dining. W/sf 0.010 0.100 0.150 0.200 29% 26% 38% 50%Special Security Lighting for Retail Parkingand Pedestrian Hardscape.
W/sf 0.005 0.007 0.012 Noallowance
29% 22% 37% No Change
2016 Proposed & Reduction PercentageAllowance
GeneralHardscapeAllowanceAllowanceperApplication
Allowanceper SpecificArea
250W for first ATMplus 70Wper add'l ATM New Allowance

2016 Title 24 CASE Report –Measure Number: 2016-NR-LTG3-F Page 33
characterize the impacts in a per square foot value of hardscape and can be scaled up for statewide calculations.
Table 24: Effective Power Density Impacts per Square Foot of General Hardscape
Lighting Zone
Per Unit Lighting Power Density Average of Prototypes,
2013 Standard
Average of Prototypes, Proposed
2016 Values
Power Density Reduction
(W/sf)
LZ1 0.056 0.037 0.019
LZ2 0.080 0.053 0.026
LZ3 0.139 0.068 0.072
LZ4 0.183 0.089 0.094
Note that the Lighting Zone is not the same as a Climate Zone. Lighting Zones are related primarily to population density, and are tied to the 2010 US Census. The correlation of Lighting Zones to Climates Zones and the resulting statewide impacts will be made in the next section.
Per unit energy and demand impacts for the general hardscape of the proposed measure are presented in Table 25. These are off-peak loads, so peak demand is not anticipated to be affected.
This measure is not anticipated to produce any peak energy demand savings, based on the nature of the nighttime operation of outdoor lighting systems. Therefore demand savings in this measure are assigned the ‘N/A’ designation.
Table 25: Energy Impacts per Square Foot – General Hardscape
Lighting Zone
Per Unit First Year Savings1 Per Unit TDV Savings2
Electricity Savings3 (kWh/yr)
Demand Savings
(kW)
Natural Gas Savings
(Therms/yr)
TDV Electricity Savings4 (2017 $)
LZ1 0.076 N/A N/A 0.13
LZ2 0.10 N/A N/A 0.17
LZ3 0.28 N/A N/A 0.47
LZ4 0.37 N/A N/A 0.62 1. Savings from one square foot for the first year the site is in operation. 2. TDV energy savings for one square foot over the 15 year period of analysis. 3. Site electricity savings. Does not include TDV of electricity savings. 4. Calculated using CEC’s 2016 TDV factors and methodology. Includes savings from electricity.
The energy impacts per unit for the specific applications found in Table 140.7-B of the Code are presented for Lighting Zones 1 – 4 in Table 26, Table 27, Table 28 and Table 29, respectively.
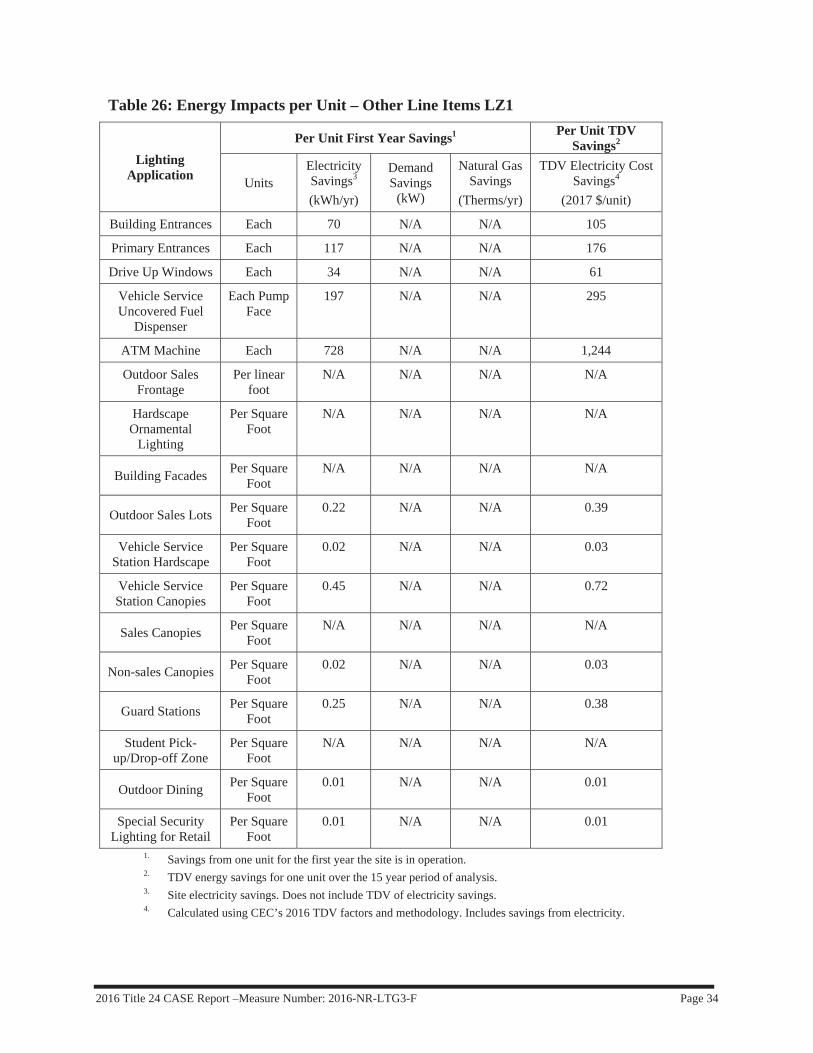
2016 Title 24 CASE Report –Measure Number: 2016-NR-LTG3-F Page 34
Table 26: Energy Impacts per Unit – Other Line Items LZ1
Lighting Application
Per Unit First Year Savings1 Per Unit TDV Savings2
Units Electricity Savings3 (kWh/yr)
Demand Savings
(kW)
Natural Gas Savings
(Therms/yr)
TDV Electricity Cost Savings4
(2017 $/unit)
Building Entrances Each 70 N/A N/A 105
Primary Entrances Each 117 N/A N/A 176
Drive Up Windows Each 34 N/A N/A 61
Vehicle Service Uncovered Fuel
Dispenser
Each Pump Face
197 N/A N/A 295
ATM Machine Each 728 N/A N/A 1,244
Outdoor Sales Frontage
Per linear foot
N/A N/A N/A N/A
Hardscape Ornamental
Lighting
Per Square Foot
N/A N/A N/A N/A
Building Facades Per Square Foot
N/A N/A N/A N/A
Outdoor Sales Lots Per Square Foot
0.22 N/A N/A 0.39
Vehicle Service Station Hardscape
Per Square Foot
0.02 N/A N/A 0.03
Vehicle Service Station Canopies
Per Square Foot
0.45 N/A N/A 0.72
Sales Canopies Per Square Foot
N/A N/A N/A N/A
Non-sales Canopies Per Square Foot
0.02 N/A N/A 0.03
Guard Stations Per Square Foot
0.25 N/A N/A 0.38
Student Pick-up/Drop-off Zone
Per Square Foot
N/A N/A N/A N/A
Outdoor Dining Per Square Foot
0.01 N/A N/A 0.01
Special Security Lighting for Retail
Per Square Foot
0.01 N/A N/A 0.01
1. Savings from one unit for the first year the site is in operation. 2. TDV energy savings for one unit over the 15 year period of analysis. 3. Site electricity savings. Does not include TDV of electricity savings. 4. Calculated using CEC’s 2016 TDV factors and methodology. Includes savings from electricity.

2016 Title 24 CASE Report –Measure Number: 2016-NR-LTG3-F Page 35
Table 27: Energy Impacts per Unit – Other Line Items LZ2
Lighting Application
Per Unit First Year Savings1 Per Unit TDV Savings2
Units Electricity Savings3 (kWh/yr)
Demand Savings
(kW)
Natural Gas Savings
(Therms/yr)
TDV Electricity Cost Savings4
(2017 $/unit)
Building Entrances Each 164 N/A N/A 164
Primary Entrances Each 188 N/A N/A 281
Drive Up Windows Each 120 N/A N/A 214
Vehicle Service Uncovered Fuel
Dispenser
Each Pump Face
352 N/A N/A 527
ATM Machine Each 728 N/A N/A 1,244
Outdoor Sales Frontage
Per linear foot
15 N/A N/A 23
Hardscape Ornamental
Lighting
Per Square Foot
0.01 N/A N/A 0.02
Building Facades Per Square Foot
0.14 N/A N/A 0.21
Outdoor Sales Lots Per Square Foot
1.1 N/A N/A 1.87
Vehicle Service Station Hardscape
Per Square Foot
0.27 N/A N/A 0.46
Vehicle Service Station Canopies
Per Square Foot
1.2 N/A N/A 1.92
Sales Canopies Per Square Foot
0.53 N/A N/A 0.95
Non-sales Canopies Per Square Foot
0.21 N/A N/A 0.32
Guard Stations Per Square Foot
0.26 N/A N/A 0.39
Student Pick-up/Drop-off Zone
Per Square Foot
0.08 N/A N/A 0.13
Outdoor Dining Per Square Foot
0.06 N/A N/A 0.09
Special Security Lighting for Retail
Per Square Foot
0.01 N/A N/A 0.01
1. Savings from one unit for the first year the site is in operation. 2. TDV energy savings for one unit over the 15 year period of analysis. 3. Site electricity savings. Does not include TDV of electricity savings. 4. Calculated using CEC’s 2016 TDV factors and methodology. Includes savings from electricity.

2016 Title 24 CASE Report –Measure Number: 2016-NR-LTG3-F Page 36
Table 28: Energy Impacts per Unit – Other Line Items LZ3
Lighting Application
Per Unit First Year Savings1 Per Unit TDV Savings2
Units Electricity Savings3 (kWh/yr)
Demand Savings
(kW)
Natural Gas Savings
(Therms/yr)
TDV Electricity Cost Savings4
(2017 $/unit)
Building Entrances Each 257 N/A N/A 386
Primary Entrances Each 281 N/A N/A 422
Drive Up Windows Each 223 N/A N/A 399
Vehicle Service Uncovered Fuel
Dispenser
Each Pump Face
211 N/A N/A 316
ATM Machine Each 728 N/A N/A 1,244
Outdoor Sales Frontage
Per linear foot
21 N/A N/A 34
Hardscape Ornamental
Lighting
Per Square Foot
0.02 N/A N/A 0.03
Building Facades Per Square Foot
0.34 N/A N/A 0.61
Outdoor Sales Lots Per Square Foot
0.89 N/A N/A 1.58
Vehicle Service Station Hardscape
Per Square Foot
0.65 N/A N/A 1.13
Vehicle Service Station Canopies
Per Square Foot
1.6 N/A N/A 2.52
Sales Canopies Per Square Foot
0.37 N/A N/A 0.66
Non-sales Canopies Per Square Foot
0.51 N/A N/A 0.76
Guard Stations Per Square Foot
0.98 N/A N/A 1.46
Student Pick-up/Drop-off Zone
Per Square Foot
0.31 N/A N/A 0.50
Outdoor Dining Per Square Foot
0.14 N/A N/A 0.23
Special Security Lighting for Retail
Per Square Foot
0.03 N/A N/A 0.05
1. Savings from one unit for the first year the site is in operation. 2. TDV energy savings for one unit for the first year the site is in operation. 3. Site electricity savings. Does not include TDV of electricity savings. 4. Calculated using CEC’s 2016 TDV factors and methodology. Includes savings from electricity.

2016 Title 24 CASE Report –Measure Number: 2016-NR-LTG3-F Page 37
Table 29: Energy Impacts per Unit – Other Line Items LZ4
Lighting Application
Per Unit First Year Savings1 Per Unit TDV Savings2
Units Electricity Savings3 (kWh/yr)
Demand Savings
(kW)
Natural Gas Savings
(Therms/yr)
TDV Electricity Cost Savings4
(2017 $/unit)
Building Entrances Each 211 N/A N/A 316
Primary Entrances Each 57 N/A N/A 351
Drive Up Windows Each 343 N/A N/A 614
Vehicle Service Uncovered Fuel
Dispenser
Each Pump Face
797 N/A N/A 1,195
ATM Machine Each 728 N/A N/A 1,244
Outdoor Sales Frontage
Per linear foot
29.0 N/A N/A 46
Hardscape Ornamental
Lighting
Per Square Foot
0.03 N/A N/A 0.05
Building Facades Per Square Foot
0.51 N/A N/A 0.92
Outdoor Sales Lots Per Square Foot
0.98 N/A N/A 1.75
Vehicle Service Station Hardscape
Per Square Foot
1.18 N/A N/A 2.03
Vehicle Service Station Canopies
Per Square Foot
3.9 N/A N/A 6.29
Sales Canopies Per Square Foot
0.46 N/A N/A 0.83
Non-sales Canopies Per Square Foot
0.87 N/A N/A 1.30
Guard Stations Per Square Foot
1.1 N/A N/A 1.65
Student Pick-up/Drop-off Zone
Per Square Foot
N/A N/A N/A N/A
Outdoor Dining Per Square Foot
0.31 N/A N/A 0.50
Special Security Lighting for Retail
Per Square Foot
N/A N/A N/A N/A
1. Savings from one unit for the first year the site is in operation. 2. TDV energy savings for one unit for the first year the site is in operation. 3. Site electricity savings. Does not include TDV of electricity savings. 4. Calculated using CEC’s 2016 TDV factors and methodology. Includes savings from electricity.

2016 Title 24 CASE Report –Measure Number: 2016-NR-LTG3-F Page 38
5.1.2 Statewide Energy Impacts Results First Year Statewide Energy Impacts The statewide energy impacts of the proposed measure are presented in Table 30. During the first year buildings complying with the 2016 Title 24 Standards are in operation, the proposed measure is expected to reduce annual statewide electricity use by 44.3 GWh. These are primarily off-peak loads, so there is no expected peak demand savings. Since these light sources are outdoors there are no interaction effects with air conditioning or heating loads.
Table 30: Statewide Energy Impacts
First Year Statewide Savings1 TDV Savings2
ElectricitySavings3 (GWh)
Demand Reduction (MW)
Natural Gas Savings
(MMtherms)
TDV Electricity Cost Savings4
(Million $) TOTAL 44.3 N/A N/A 73.5
1. First year savings from all buildings built statewide during the first year the 2016 Standards are in effect. 2. First year TDV savings from all buildings built statewide during the first year the 2016 Standards are in effect. 3. Site electricity savings. 4. Calculated using CEC’s 2016 TDV factors and methodology.
All assumptions and calculations used to derive per unit and statewide energy and demand savings are presented in Section 4.7 of this report.
5.2 Cost-effectiveness Results
5.2.1 Incremental Cost Results Incremental Construction Cost Results As shown in Appendix F, by 2017, many of the proposed lighting systems are likely to cost less than the incumbent PSMH lighting systems. This is considering cost forecasts for LED products, which estimate an approximate 30% reduction in luminaire costs by 2017 (DOE 2013).
Incremental Maintenance Cost Results The maintenance requirements associated with the code change proposal, relative to existing conditions, are described qualitatively in Section 3.3 of this report.
For the sake of the calculations, luminaire maintenance is not being considered in the comparative analysis. The incumbent systems all have higher maintenance costs compared to LED, and the very long life of LED makes them effectively last for the full duration of the 15 year life cycle without requiring maintenance. This produces a conservative life cycle comparison analysis, but the cost effectiveness is sufficiently high to be satisfactory even with this conservative position.

2016 Title 24 CASE Report –Measure Number: 2016-NR-LTG3-F Page 39
5.2.2 Cost Savings Results Energy Cost Savings Results The per unit TDV energy cost savings over the 15 year period of analysis are presented in Table 32. This measure is not climate zone dependent, so the information is presented as an average for the State. The energy and energy cost savings per unit per lighting zone is presented in Section 5.1.1. Table 32 contains the per unit energy cost savings averaged across all climate zones according to the weighting described in Table 31 below.
Table 31: Lighting Zone Area Weighting Factors Lighting Zone Energy Impact Weight (%)
LZ0 0 LZ1 0.1
LZ2 9.9
LZ3 90
LZ4 0
Note that Lighting Zone 0 (LZ0) is not currently defined in the existing Title 24 Building Standards. The Statewide CASE Team proposes this addition to the code to keep it aligned with the IES lighting zone definitions. LZ0 is specifically intended for undeveloped spaces in parks, and therefore has no substantial energy impact on the statewide values. As previously noted, LZ4 is also a lighting zone that must be requested from the CEC, and no municipality has chosen to do that yet, so this is also negligible at this point.

2016 Title 24 CASE Report –Measure Number: 2016-NR-LTG3-F Page 40
Table 32: Weighted TDV Energy Cost Savings Over 15 Years - Per Unit
Climate Zone Units TDV Electricity
Cost Savings (2017 PV $)
TDV Natural Gas Cost Savings
(2017 PV $)
Total TDV Energy Cost Savings (2017 PV $)
General Hardscape Per Square Foot
0.44 N/A 0.44
Building Entrances Each 372.54 N/A 372.54
Primary Entrances Each 407.74 N/A 407.74
Drive Up Windows Each 380.43 N/A 380.43
Vehicle Service Uncovered Fuel
Dispenser
Each Pump Face
337.29 N/A 337.29
ATM Machine Each 1,244.42 N/A 1,244.42
Outdoor Sales Frontage
Per linear foot
32.70 N/A 32.70
Hardscape Ornamental
Lighting
Per Square Foot
N/A N/A N/A
Building Facades Per Square Foot
0.57 N/A 0.57
Outdoor Sales Lots Per Square Foot
1.61 N/A 1.61
Vehicle Service Station Hardscape
Per Square Foot
1.06 N/A 1.06
Vehicle Service Station Canopies
Per Square Foot
2.46 N/A 2.46
Sales Canopies Per Square Foot
0.69 N/A 0.69
Non-sales Canopies Per Square Foot
0.71 N/A 0.71
Guard Stations Per Square Foot
1.36 N/A 1.36
Student Pick-up/Drop-off Zone
Per Square Foot
0.47 N/A 0.47
Outdoor Dining Per Square Foot
0.21 N/A 0.21
Special Security Lighting for Retail
Per Square Foot
0.05 N/A 0.05
Other Cost Savings Results Many of the proposed lighting systems are likely to cost less than the incumbent PSMH lighting systems. This is especially true when considering cost forecasts for LED products,

2016 Title 24 CASE Report –Measure Number: 2016-NR-LTG3-F Page 41
which estimate an approximate 30% reduction in luminaire costs by 2017 (DOE 2013). Refer to Appendix F at the end of the report for a comparison of the General Hardscape Costing exercise. However, this analysis conservatively assumes zero cost difference between the existing and proposed conditions in circumstances when the installed cost is lower.
5.2.3 Cost-effectiveness Results The General Hardscape cost effectiveness is shown per lighting zone in Table 33, as this is the largest component of the measure as a whole.
Table 33: Per Unit Cost-effectiveness Summary – General Hardscape by Lighting Zone
Lighting Zone
Benefit: TDV Energy Cost
Savings(2017 PV$/sf)
Cost: Total
IncrementalFirst Cost and Maintenance
Cost(2017 PV$)
Change in Lifecycle Cost(2017 PV$/sf)
Benefit to Cost (B/C) Ratio
LZ1 0.13 None or Lower -0.13 Infinite
LZ2 0.17 None or Lower -0.17 Infinite
LZ3 0.47 None or Lower -0.47 Infinite
LZ4 0.62 None or Lower -0.62 Infinite
Results for per unit lifecycle cost-effectiveness analysis are presented below in Table 34.
Table 34: Cost-effectiveness Summary1 – Statewide Weighted Average Across Lighting Zones for all Measure Line-Items
Climate Zone Units
Benefit: TDV Energy Cost
Savings2
(2017 PV$)
Cost: Total Incremental
Cost3
(2017 PV$)
Change in Lifecycle Cost4
(2017 PV$)
Benefit to Cost Ratio5
Outdoor Lighting LPA (Entire
Measure)
Per Square Foot 0.41 0.11 -0.41 3.8
1. Relative to existing conditions. All cost values presented in 2017 dollars. “Hospital” building category exclude from cost and savings projections.
2. Present value of TDV cost savings equals TDV electricity savings plus TDV natural gas savings; TDV$ = TDV$E + TDV$G.
3. Total incremental cost equals incremental construction cost (post adoption) plus present value of incremental maintenance cost; C = CIPA + CM.
4. Negative values indicate the measure is cost-effective. Change in lifecycle cost equals cost premium minus TDV energy cost savings; LCC = C – TDV$
5. The benefit to cost ratio is the TDV energy costs savings divided by the total incremental costs; B/C = TDV$ ÷ C. The measure is cost effective if the B/C ratio is greater than 1.0.
Given data regarding the new construction forecast for 2017, the Statewide CASE Team estimates that that lifecycle cost savings (over 15 years) of all buildings constructed during the first year the 2016 Standards are in effect will be $73.5 million.
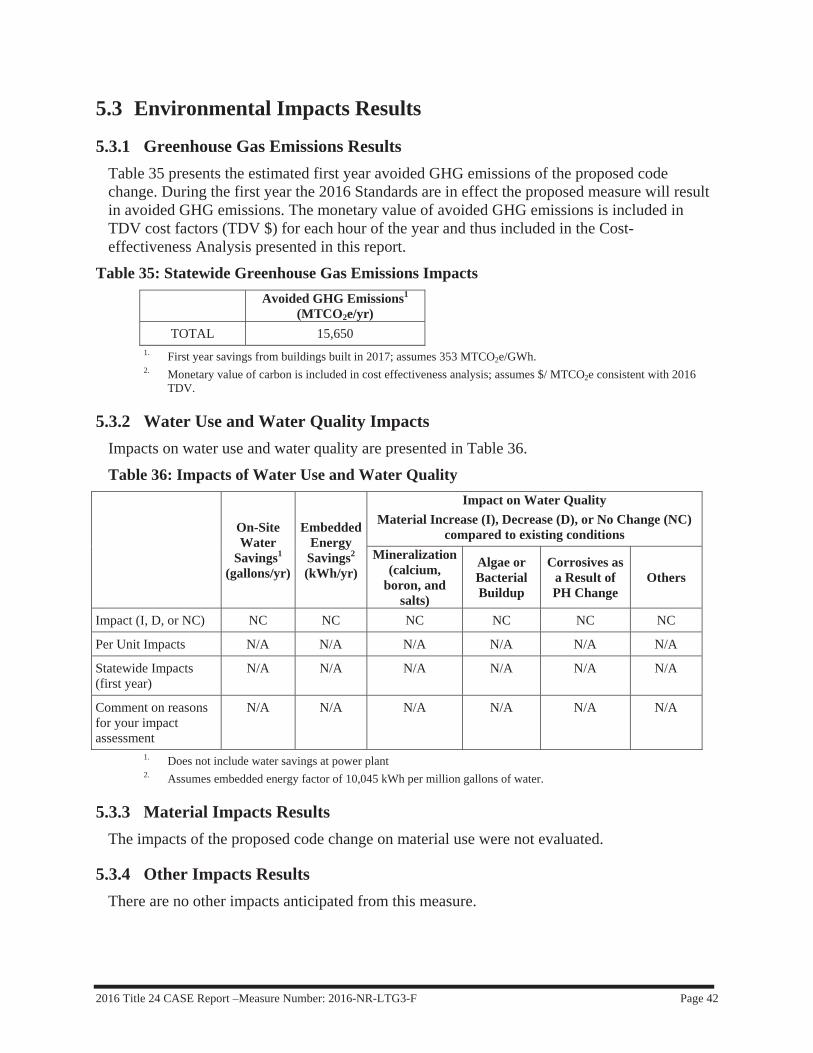
2016 Title 24 CASE Report –Measure Number: 2016-NR-LTG3-F Page 42
5.3 Environmental Impacts Results
5.3.1 Greenhouse Gas Emissions Results Table 35 presents the estimated first year avoided GHG emissions of the proposed code change. During the first year the 2016 Standards are in effect the proposed measure will result in avoided GHG emissions. The monetary value of avoided GHG emissions is included in TDV cost factors (TDV $) for each hour of the year and thus included in the Cost-effectiveness Analysis presented in this report.
Table 35: Statewide Greenhouse Gas Emissions Impacts Avoided GHG Emissions1
(MTCO2e/yr) TOTAL 15,650
1. First year savings from buildings built in 2017; assumes 353 MTCO2e/GWh. 2. Monetary value of carbon is included in cost effectiveness analysis; assumes $/ MTCO2e consistent with 2016
TDV.
5.3.2 Water Use and Water Quality Impacts Impacts on water use and water quality are presented in Table 36.
Table 36: Impacts of Water Use and Water Quality
On-Site Water
Savings1
(gallons/yr)
Embedded EnergySavings2
(kWh/yr)
Impact on Water Quality Material Increase (I), Decrease (D), or No Change (NC)
compared to existing conditions Mineralization
(calcium, boron, and
salts)
Algae or BacterialBuildup
Corrosives as a Result of PH Change
Others
Impact (I, D, or NC) NC NC NC NC NC NC
Per Unit Impacts N/A N/A N/A N/A N/A N/A
Statewide Impacts (first year)
N/A N/A N/A N/A N/A N/A
Comment on reasons for your impact assessment
N/A N/A N/A N/A N/A N/A
1. Does not include water savings at power plant 2. Assumes embedded energy factor of 10,045 kWh per million gallons of water.
5.3.3 Material Impacts ResultsThe impacts of the proposed code change on material use were not evaluated.
5.3.4 Other Impacts Results There are no other impacts anticipated from this measure.

2016 Title 24 CASE Report –Measure Number: 2016-NR-LTG3-F Page 43
6. PROPOSED LANGUAGE
The proposed changes to the Standards, Reference Appendices, and the ACM Reference Manuals are provided below. Changes to the 2013 documents are marked with underlining (new language) and strikethroughs (deletions).
6.1 StandardsSection 100.1 will be modified to add LZ0 to the definition of Outdoor Lighting Zone.
Table 10-114 A will be modified to add LZ0 to the table and redefine the Lighting Zone ambient illumination description to align with the IES definitions.
Table 130.2-A and –B will be modified to add LZ0 to the tables.
Section 140.7(a) will be modified to remove the exception for ATM lighting and also to remove tunnels and bridges from exceptions.
Tables 140.7-A and 140.7-B will be revised with new LPA values for all of the items within the table and an additional section regarding ATM Machine Lighting.
Section 140.6(a)3 will be revised to remove ATM lighting from the exception.
Table 140.6-C will be revised to add a note to the Parking Garage allowance for a specific ATM allowance.
Section 100.1 Definitions and Rules of Construction will be modified in the following manner: OUTDOOR LIGHTING ZONE is a geographic area designated by the California Energy Commission in accordance with Part 1, Section 10-114, that determines requirements for outdoor lighting, including lighting power densities and specific control, equipment or performance requirements. Lighting zones are numbered LZ0, LZ1, LZ2, LZ3 and LZ4.
Table 130.2-A will be modified in the following manner: TABLE 130.2-A Uplight Ratings (Maximum Zonal Lumens)
Secondary Solid Angle
Maximum Zonal Lumens per Outdoor Lighting Zone
LZ 0 OLZ 1 OLZ 2 OLZ 3 OLZ 4 Uplight High (UH) 100 to 180 degrees
0 10 50 500 1,000
Uplight Low (UL) 90 to <100 degrees
0 10 50 500 1,000
Table 130.2-B will be modified in the following manner: TABLE 130.2-B Glare Ratings (Maximum Zonal Lumens)
Glare Rating for Asymmetrical Luminaire Types (Type 1, Type II, Type III, Type IV)
Secondary Solid Angle
Maximum Zonal Lumens per Outdoor Lighting Zone
LZ 0 OLZ 1 OLZ 2 OLZ 3 OLZ 4 Forward Very High (FVH) 80 to 90 degrees
10 100 225 500 750
Backlight Very High (BVH) 80 to 90 degrees
10 100 225 500 750
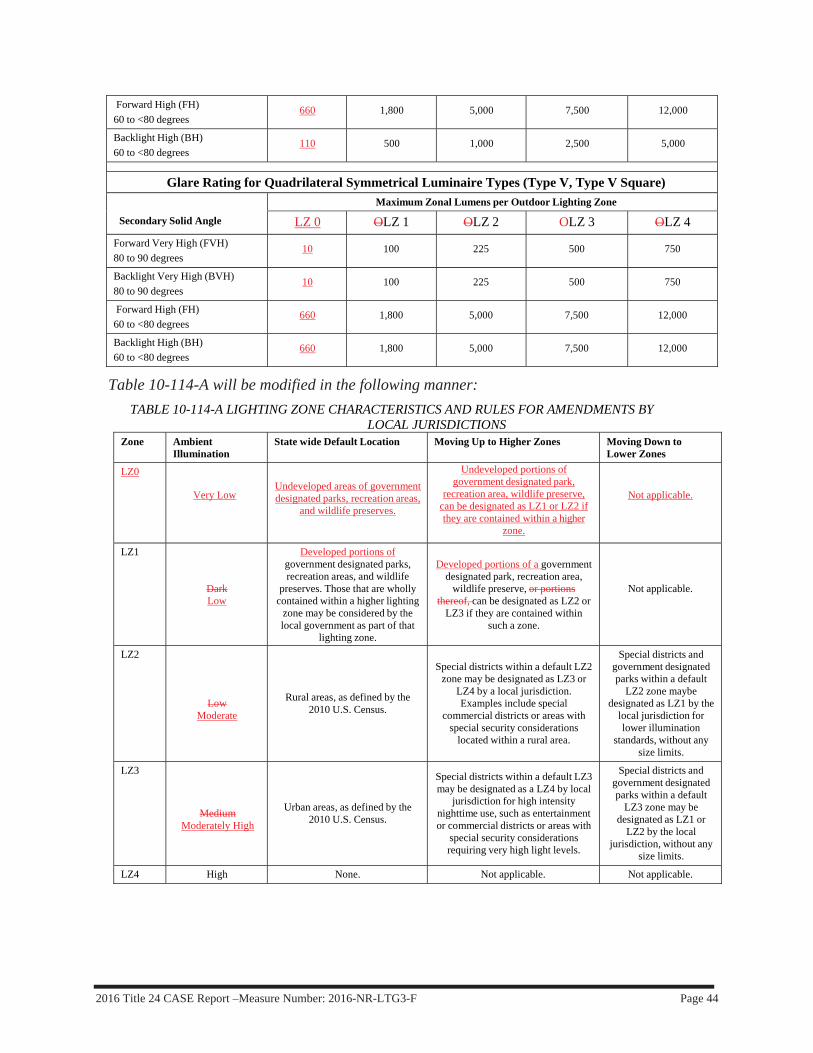
2016 Title 24 CASE Report –Measure Number: 2016-NR-LTG3-F Page 44
Forward High (FH) 60 to <80 degrees
660 1,800 5,000 7,500 12,000
Backlight High (BH) 60 to <80 degrees
110 500 1,000 2,500 5,000
Glare Rating for Quadrilateral Symmetrical Luminaire Types (Type V, Type V Square)
Secondary Solid Angle Maximum Zonal Lumens per Outdoor Lighting Zone
LZ 0 OLZ 1 OLZ 2 OLZ 3 OLZ 4 Forward Very High (FVH) 80 to 90 degrees
10 100 225 500 750
Backlight Very High (BVH) 80 to 90 degrees
10 100 225 500 750
Forward High (FH) 60 to <80 degrees
660 1,800 5,000 7,500 12,000
Backlight High (BH) 60 to <80 degrees
660 1,800 5,000 7,500 12,000
Table 10-114-A will be modified in the following manner: TABLE 10-114-A LIGHTING ZONE CHARACTERISTICS AND RULES FOR AMENDMENTS BY
LOCAL JURISDICTIONS Zone Ambient
Illumination State wide Default Location Moving Up to Higher Zones Moving Down to
Lower Zones
LZ0
Very Low
Undeveloped areas of government designated parks, recreation areas,
and wildlife preserves.
Undeveloped portions of government designated park,
recreation area, wildlife preserve, can be designated as LZ1 or LZ2 if they are contained within a higher
zone.
Not applicable.
LZ1
Dark Low
Developed portions of government designated parks, recreation areas, and wildlife
preserves. Those that are wholly contained within a higher lighting
zone may be considered by the local government as part of that
lighting zone.
Developed portions of a government designated park, recreation area,
wildlife preserve, or portions thereof, can be designated as LZ2 or
LZ3 if they are contained within such a zone.
Not applicable.
LZ2
Low Moderate
Rural areas, as defined by the 2010 U.S. Census.
Special districts within a default LZ2 zone may be designated as LZ3 or
LZ4 by a local jurisdiction. Examples include special
commercial districts or areas with special security considerations
located within a rural area.
Special districts and government designated parks within a default
LZ2 zone maybe designated as LZ1 by the
local jurisdiction for lower illumination
standards, without any size limits.
LZ3
Medium Moderately High
Urban areas, as defined by the 2010 U.S. Census.
Special districts within a default LZ3 may be designated as a LZ4 by local
jurisdiction for high intensity nighttime use, such as entertainment or commercial districts or areas with
special security considerations requiring very high light levels.
Special districts and government designated parks within a default
LZ3 zone may be designated as LZ1 or
LZ2 by the local jurisdiction, without any
size limits.
LZ4 High None. Not applicable. Not applicable.
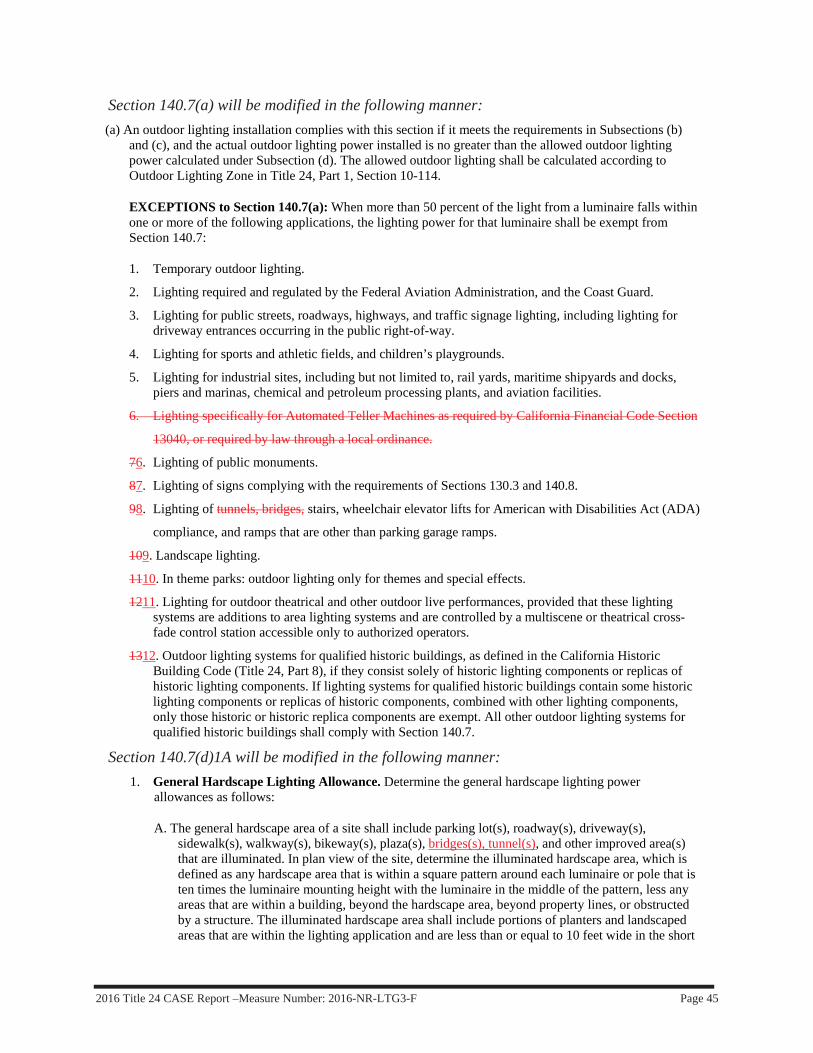
2016 Title 24 CASE Report –Measure Number: 2016-NR-LTG3-F Page 45
Section 140.7(a) will be modified in the following manner: (a) An outdoor lighting installation complies with this section if it meets the requirements in Subsections (b)
and (c), and the actual outdoor lighting power installed is no greater than the allowed outdoor lighting power calculated under Subsection (d). The allowed outdoor lighting shall be calculated according to Outdoor Lighting Zone in Title 24, Part 1, Section 10-114.
EXCEPTIONS to Section 140.7(a): When more than 50 percent of the light from a luminaire falls within one or more of the following applications, the lighting power for that luminaire shall be exempt from Section 140.7:
1. Temporary outdoor lighting.
2. Lighting required and regulated by the Federal Aviation Administration, and the Coast Guard.
3. Lighting for public streets, roadways, highways, and traffic signage lighting, including lighting for driveway entrances occurring in the public right-of-way.
4. Lighting for sports and athletic fields, and children’s playgrounds.
5. Lighting for industrial sites, including but not limited to, rail yards, maritime shipyards and docks, piers and marinas, chemical and petroleum processing plants, and aviation facilities.
6. Lighting specifically for Automated Teller Machines as required by California Financial Code Section
13040, or required by law through a local ordinance.
76. Lighting of public monuments.
87. Lighting of signs complying with the requirements of Sections 130.3 and 140.8.
98. Lighting of tunnels, bridges, stairs, wheelchair elevator lifts for American with Disabilities Act (ADA)
compliance, and ramps that are other than parking garage ramps.
109. Landscape lighting.
1110. In theme parks: outdoor lighting only for themes and special effects.
1211. Lighting for outdoor theatrical and other outdoor live performances, provided that these lighting systems are additions to area lighting systems and are controlled by a multiscene or theatrical cross-fade control station accessible only to authorized operators.
1312. Outdoor lighting systems for qualified historic buildings, as defined in the California Historic Building Code (Title 24, Part 8), if they consist solely of historic lighting components or replicas of historic lighting components. If lighting systems for qualified historic buildings contain some historic lighting components or replicas of historic components, combined with other lighting components, only those historic or historic replica components are exempt. All other outdoor lighting systems for qualified historic buildings shall comply with Section 140.7.
Section 140.7(d)1A will be modified in the following manner: 1. General Hardscape Lighting Allowance. Determine the general hardscape lighting power
allowances as follows:
A. The general hardscape area of a site shall include parking lot(s), roadway(s), driveway(s), sidewalk(s), walkway(s), bikeway(s), plaza(s), bridges(s), tunnel(s), and other improved area(s) that are illuminated. In plan view of the site, determine the illuminated hardscape area, which is defined as any hardscape area that is within a square pattern around each luminaire or pole that is ten times the luminaire mounting height with the luminaire in the middle of the pattern, less any areas that are within a building, beyond the hardscape area, beyond property lines, or obstructed by a structure. The illuminated hardscape area shall include portions of planters and landscaped areas that are within the lighting application and are less than or equal to 10 feet wide in the short

2016 Title 24 CASE Report –Measure Number: 2016-NR-LTG3-F Page 46
dimensions and are enclosed by hardscape or other improvement on at least three sides. Multiply the illuminated hardscape area by the Area Wattage Allowance (AWA) from TABLE 140.7-A for the appropriate Lighting Zone.
Table 140.7-A will be modified in the following manner: TABLE 140.7-A GENERAL HARDSCAPE LIGHTING POWER
ALLOWANCE Type of Power Allowance Lighting Zone 0 Lighting Zone 1 Lighting Zone 2 Lighting Zone 3 Lighting Zone 4
Area Wattage Allowance (AWA) See Note #1 Below 0.035 0.020 W/ft² 0.045 0.030 W/ft² 0.090 0.040 W/ft² 0.115 0.050 W/ft²
Linear Wattage Allowance (LWA)
0.25 0.15 W/lf 0.45 0.25 W/lf 0.60 0.35 W/lf 0.85 0.45 W/lf
Initial Wattage Allowance (IWA) 340 W 510 450 W 770 520 W 1030 640 W
Note #1: Lighting Zone 0: Continuous lighting is explicitly prohibited in Lighting Zone 0. Therefore, a single luminaire of 15 Watts or less may be installed at the entrance to a parking area, trail head, fee payment kiosk, outhouse, or toilet facility, as required to provide safe navigation of the site infrastructure. Luminaires shall be meet the maximum zonal lumen limits of LZ0 for Uplight and Glare in Tables 130.2-A and 130.2-B to comply with this zone.
Table 140.7-B will be modified in the following manner: TABLE 140.7-B ADDITIONAL LIGHTING POWER ALLOWANCE FOR SPECIFIC APPLICATIONS All
area and distance measurements in plan view unless otherwise noted. Lighting Application Lighting
Zone 0
Lighting
Zone 1
Lighting
Zone 2
Lighting
Zone 3
Lighting
Zone 4
WATTAGE ALLOWANCE PER APPLICATION. Use all that apply as appropriate.
Building Entrances or Exits. Allowance per door. Luminaires qualifying for this allowance shall be within 20 feet of the door.
See Note #1 Below
30 15 watts
60 25 watts
90 35 watts
90 45 watts
Primary Entrances to Senior Care Facilities, Police Stations, Hospitals, Fire Stations, and Emergency Vehicle Facilities. Allowance per primary entrance(s) only. Primary entrances shall provide access for the general public and shall not be used exclusively for staff or service personnel. This allowance shall be in addition to the building entrance or exit allowance above. Luminaires qualifying for this allowance shall be within 100 feet of the primary entrance.
No Allowance
45 20 watts
80 40 watts
120 60 watts
130 80 watts
Drive Up Windows. Allowance per customer service location. Luminaires qualifying for this allowance shall be within 2 mounting heights of the sill of the window.
No Allowance
40 30 watts
75 40 watts
125 60 watts
200 100 watts
Vehicle Service Station Uncovered Fuel Dispenser. Allowance per fueling dispenser. Luminaires qualifying for this allowance shall be within 2 mounting heights of the dispenser.
No Allowance
120 80 watts
175 100 watts
185 140 watts
330 160 watts
ATM Machine Lighting. Allowance per ATM machine. Luminaires qualifying for this allowance shall be within 50 feet of the dispenser.
No Allowance
250 watts for first ATM machine, 70 watts for each additional ATM machine
WATTAGE ALLOWANCE PER UNIT LENGTH (w/linear ft). May be used for one or two frontage side(s) per site.
Outdoor Sales Frontage. Allowance for frontage immediately adjacent to the principal viewing location(s) and unobstructed for its viewing length. A corner sales lot may include two adjacent sides provided that a different principal viewing location exists for each side. Luminaires qualifying for this allowance shall be located between the principal viewing location and the frontage outdoor sales area.
No Allowance
No
Allowance
22.5 15
W/linear ft
36 25
W/linear ft
45 30
W/linear ft
WATTAGE ALLOWANCE PER HARDSCAPE AREA (W/ft²). May be used for any illuminated hardscape area on the site.
Hardscape Ornamental Lighting. Allowance for the total site illuminated hardscape area. Luminaires qualifying for this allowance shall be rated for 100 watts or less as determined in accordance with Section 130.0(d), and shall be post- top luminaires, lanterns, pendant luminaires, or chandeliers.
No Allowance
No
Allowance
0.02 0.015
W/ft²
0.04 0.03
W/ft²
0.06 0.045
W/ft²
WATTAGE ALLOWANCE PER SPECIFIC AREA (W/ft²). Use as appropriate provided that none of the following specific applications shall be used for the same area.
Building Facades. Only areas of building façade that are illuminated shall qualify for this allowance. Luminaires qualifying for this allowance shall be aimed at the façade and shall be capable of illuminating it without obstruction or interference by permanent building features or other objects.
No Allowance
No
Allowance
0.18 0.15
W/ft²
0.35 0.25
W/ft²
0.50 0.35
W/ft²
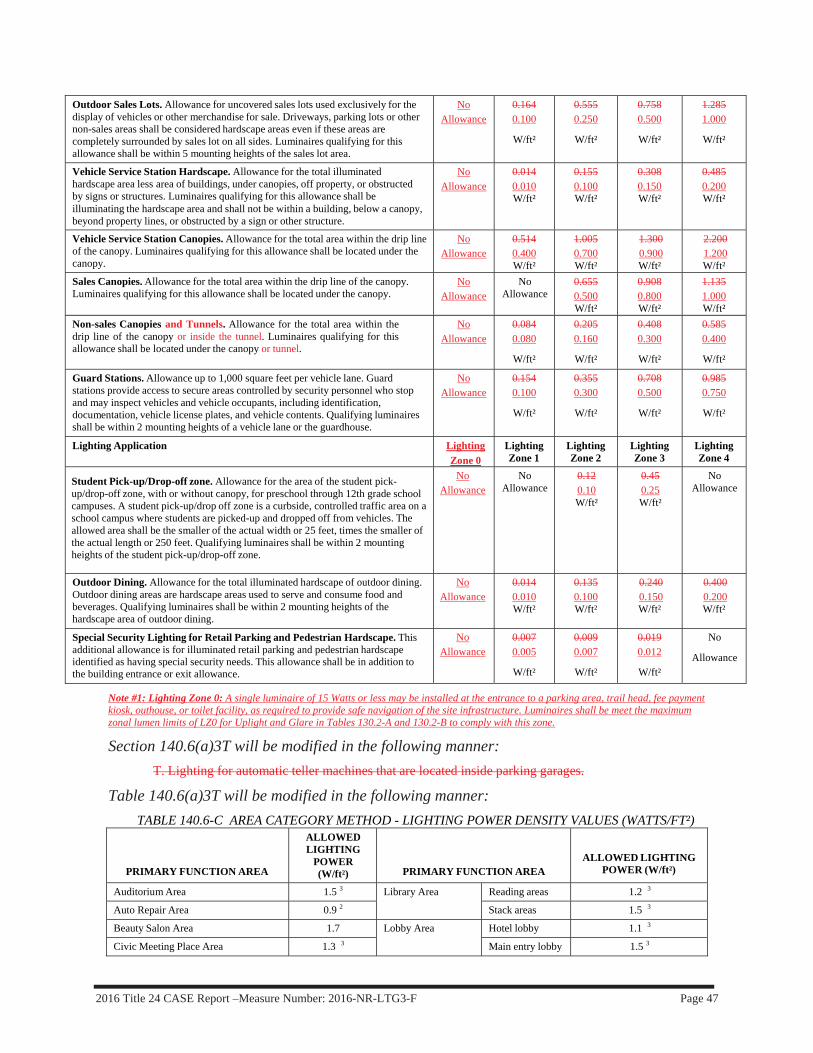
2016 Title 24 CASE Report –Measure Number: 2016-NR-LTG3-F Page 47
Outdoor Sales Lots. Allowance for uncovered sales lots used exclusively for the display of vehicles or other merchandise for sale. Driveways, parking lots or other non-sales areas shall be considered hardscape areas even if these areas are completely surrounded by sales lot on all sides. Luminaires qualifying for this allowance shall be within 5 mounting heights of the sales lot area.
No Allowance
0.164 0.100
W/ft²
0.555 0.250
W/ft²
0.758 0.500
W/ft²
1.285 1.000
W/ft²
Vehicle Service Station Hardscape. Allowance for the total illuminated hardscape area less area of buildings, under canopies, off property, or obstructed by signs or structures. Luminaires qualifying for this allowance shall be illuminating the hardscape area and shall not be within a building, below a canopy, beyond property lines, or obstructed by a sign or other structure.
No Allowance
0.014 0.010 W/ft²
0.155 0.100 W/ft²
0.308 0.150 W/ft²
0.485 0.200 W/ft²
Vehicle Service Station Canopies. Allowance for the total area within the drip line of the canopy. Luminaires qualifying for this allowance shall be located under the canopy.
No Allowance
0.514 0.400 W/ft²
1.005 0.700 W/ft²
1.300 0.900 W/ft²
2.200 1.200 W/ft²
Sales Canopies. Allowance for the total area within the drip line of the canopy. Luminaires qualifying for this allowance shall be located under the canopy.
No Allowance
No Allowance
0.655 0.500 W/ft²
0.908 0.800 W/ft²
1.135 1.000 W/ft²
Non-sales Canopies and Tunnels. Allowance for the total area within the drip line of the canopy or inside the tunnel. Luminaires qualifying for this allowance shall be located under the canopy or tunnel.
No Allowance
0.084 0.080
W/ft²
0.205 0.160
W/ft²
0.408 0.300
W/ft²
0.585 0.400
W/ft²
Guard Stations. Allowance up to 1,000 square feet per vehicle lane. Guard stations provide access to secure areas controlled by security personnel who stop and may inspect vehicles and vehicle occupants, including identification, documentation, vehicle license plates, and vehicle contents. Qualifying luminaires shall be within 2 mounting heights of a vehicle lane or the guardhouse.
No Allowance
0.154 0.100
W/ft²
0.355 0.300
W/ft²
0.708 0.500
W/ft²
0.985 0.750
W/ft²
Lighting Application Lighting Zone 0
Lighting Zone 1
Lighting Zone 2
Lighting Zone 3
Lighting Zone 4
Student Pick-up/Drop-off zone. Allowance for the area of the student pick-up/drop-off zone, with or without canopy, for preschool through 12th grade school campuses. A student pick-up/drop off zone is a curbside, controlled traffic area on a school campus where students are picked-up and dropped off from vehicles. The allowed area shall be the smaller of the actual width or 25 feet, times the smaller of the actual length or 250 feet. Qualifying luminaires shall be within 2 mounting heights of the student pick-up/drop-off zone.
No Allowance
No Allowance
0.12 0.10 W/ft²
0.45 0.25 W/ft²
No Allowance
Outdoor Dining. Allowance for the total illuminated hardscape of outdoor dining. Outdoor dining areas are hardscape areas used to serve and consume food and beverages. Qualifying luminaires shall be within 2 mounting heights of the hardscape area of outdoor dining.
No Allowance
0.014 0.010 W/ft²
0.135 0.100 W/ft²
0.240 0.150 W/ft²
0.400 0.200 W/ft²
Special Security Lighting for Retail Parking and Pedestrian Hardscape. This additional allowance is for illuminated retail parking and pedestrian hardscape identified as having special security needs. This allowance shall be in addition to the building entrance or exit allowance.
No Allowance
0.007 0.005
W/ft²
0.009 0.007
W/ft²
0.019 0.012
W/ft²
No
Allowance
Note #1: Lighting Zone 0: A single luminaire of 15 Watts or less may be installed at the entrance to a parking area, trail head, fee payment kiosk, outhouse, or toilet facility, as required to provide safe navigation of the site infrastructure. Luminaires shall be meet the maximum zonal lumen limits of LZ0 for Uplight and Glare in Tables 130.2-A and 130.2-B to comply with this zone.
Section 140.6(a)3T will be modified in the following manner: T. Lighting for automatic teller machines that are located inside parking garages.
Table 140.6(a)3T will be modified in the following manner: TABLE 140.6-C AREA CATEGORY METHOD - LIGHTING POWER DENSITY VALUES (WATTS/FT²)
PRIMARY FUNCTION AREA
ALLOWED LIGHTING
POWER (W/ft²)
PRIMARY FUNCTION AREA
ALLOWED LIGHTING
POWER (W/ft²)
Auditorium Area 1.5 3 Library Area Reading areas 1.2 3
Auto Repair Area 0.9 2 Stack areas 1.5 3
Beauty Salon Area 1.7 Lobby Area Hotel lobby 1.1 3
Civic Meeting Place Area 1.3 3 Main entry lobby 1.5 3

2016 Title 24 CASE Report –Measure Number: 2016-NR-LTG3-F Page 48
Classroom, Lecture, Training, Vocational Areas
5
1.2Locker/Dressing Room 0.8
Commercial and Industrial Storage
Areas (conditioned and unconditioned)0.6 Lounge Area 1.1 3
Commercial and Industrial Storage Areas (refrigerated) 0.7 Malls and Atria 1.2 3
Convention, Conference, Multipurpose and Meeting Center Areas
3
1.4Medical and Clinical Care Area 1.2
Corridor, Restroom, Stair, and Support
Areas
0.6 Office Area > 250 square feet 0.75
Dining Area 1.1 3 250 square feet 1.0
Electrical, Mechanical, Telephone Rooms
2
0.7Parking Garage Area
Parking Area10 0.14
Exercise Center, Gymnasium Areas 1.0 Dedicated Ramps 0.3
Exhibit, Museum Areas 2.0 Daylight Adaptation Zones 9
0.6
Financial Transaction Area 1.2 3 Religious Worship Area 1.5 3
General Commercial and Industrial Work Areas
Low bay 0.9 2
Retail Merchandise Sales, Wholesale Showroom Areas 1.2 6 and 7
High bay 1.0 2
Precision 1.2 4 Theater Area Motion picture 0.9 3
Grocery Sales Area 1.2 6 and 7 Performance 1.4 3
Hotel Function Area 1.5 3 Transportation Function Area 1.2
Kitchen, Food Preparation Areas 1.6 Videoconferencing Studio 1.2 8
Laboratory Area, Scientific 1.4 1 Waiting Area 1.1 3
Laundry Area 0.9 All other areas 0.6
Footnotes for this table are listed below.
FOOTNOTES FOR TABLE 140.6-C: See Section 140.6(c)2 for an explanation of additional lighting power available for specialized task work, ornamental, precision, accent, display, decorative, and white boards and chalk boards, in accordance with the footnotes in this table. The smallest of the added lighting power listed in each footnote below, or the actual design wattage, may be added to the allowed lighting power only when using the Area Category Method of compliance.Footnote number
Type of lighting system allowed Maximum allowed added lighting power. (W/ft2
of task area unless otherwise noted)
1 Specialized task work 0.2 W/ft2
2 Specialized task work 0.5 W/ft2
3 Ornamental lighting as defined in Section 100.1 and in accordance with Section 140.6.(c)2.
0.5 W/ft2
4 Precision commercial and industrial work 1.0 W/ft2
5 Per linear foot of white board or chalk board. 5.5 W per linear foot
6 Accent, display and feature lighting - luminaires shall be adjustable or directional
0.3 W/ft2
7 Decorative lighting - primary function shall be decorative and shall be in addition to general illumination.
0.2 W/ft2
8 Additional Videoconferencing Studio lighting complying with all of the requirements in Section 140.6(c)2Gvii.
1.5 W/ft2
9 Daylight Adaptation Zones shall be no longer than 66 feet from the entrance to the parking garage
10 Additional allowance for ATM locations in Parking Garages. Allowance per ATM
200 watts for first ATM location, 50 watts for each additional ATM location in a group.

2016 Title 24 CASE Report –Measure Number: 2016-NR-LTG3-F Page 49
6.2 Reference Appendices There are no proposed changes to the Reference Appendices.
6.3 ACM Reference Manual There are no proposed changes to the ACM Reference Manual.
6.4 Compliance Manuals There are no proposed changes to the compliance manuals.
6.5 Compliance Forms There are no proposed changes to the compliance forms.

2016 Title 24 CASE Report –Measure Number: 2016-NR-LTG3-F Page 50
7. REFERENCES AND OTHER RESEARCH
[CARB] California Air Resources Board. 2010. “Proposed Regulation for a California Renewable Electricity Standard Staff Report: Initial Statement of Reasons Appendix D.” http://www.arb.ca.gov/regact/2010/res2010/res10d.pdf. Accessed November 12, 2013.
__. 2011a. California Air Resources Board. “Appendix C: Cost Effectiveness Calculation Methodology.” March 10. http://www.arb.ca.gov/msprog/moyer/guidelines/2011gl/appc_3_10_11.pdf.
__. 2011b. “Emission Reduction Offsets Transaction Cost Summary Report for 2011.” http://www.arb.ca.gov/nsr/erco/erco.htm.
__. 2012. “Emission Reduction Offsets Transaction Cost Summary Report for 2012.” http://www.arb.ca.gov/nsr/erco/erco.htm.
__. 2013a. “Mail-Out #MSC 13-09.” March 25. http://www.arb.ca.gov/msprog/mailouts/msc1309/msc1309.pdf.
__. 2013b. “California Air Resources Board Quarterly Auction 3, May 2013 – Summary Results Report.” http://www.arb.ca.gov/cc/capandtrade/auction/may-2013/results.pdf.
[CASE 2007] C&S Team, 2007. Revised Report Outdoor Lighting. PG&E, SCE, SDGE IOU Statewide CASE Team, February 2007. http://www.energy.ca.gov/title24/2008standards/prerulemaking/documents/2007-02-26-27_workshop/supporting/2007-02-15_REVISED_REPORT_OUTDOOR_LIGHTING.PDF.
[CEC] California Energy Commission. 2014a. “Time Dependent Valuation of Energy for Developing Building Efficiency Standards: 2017 Time Dependent Valuation (TDV) Data Sources and Inputs.” July 2014. http://www.energy.ca.gov/title24/2016standards/prerulemaking/documents/2014-07-09_workshop/2016_TDV_Documents/Title24_2016_TDV_Methodology_Report%20v3.docx. Accessed July 2014.
[DOE 2013] U.S. Department of Energy. 2013. Solid-State Lighting Research and Development Multi-Year Program Plan. DOE/EERE 9061. Washington, D.C.: U.S. Department of Energy.
[LADBS2013] L.A. Department of Building and Safety. 203. Summary of Parking Regulations, Revised 2013.
[MTC2012] Metropolitan Transportation Commission, 2012. Survey of Bay Area Cities’ Parking Requirements: Summary Report, April, 2012. http://www.mtc.ca.gov/planning/smart_growth/parking/6-12/Final_Summary_of_MTC_Parking_Survey.pdf. Accessed 2014.
[NRC2013] National Research Council. 2013. Assessment of Advanced Solid State Lighting. Washington, D.C.: The National Academies Press.

2016 Title 24 CASE Report –Measure Number: 2016-NR-LTG3-F Page 51
[Navigant 2012] Navigant Consulting, Inc. 2012. Energy Savings Potential of Solid-State Lighting in General Illumination Applications. Washington, D.C.: U.S. Department of Energy.
[Navigant 2013] Navigant Consulting, Inc. 2013. Adoption of Light-Emitting Diodes in Common Lighting Applications. DOE/EE-1016. Washington, D.C.: U.S. Department of Energy.
[PNNL 2013] Pacific Northwest National Laboratory. 2013. SSL Pricing and Efficacy Trend Analysis for Utility Program Planning. PNNL-22908. Washington, D.C.: U.S. Department of Energy.
[RLW] RLW Analytics 2002. Integrated Energy Systems Productivity and Building Science: Outdoor Lighting Baseline Assessment. http://www.energy.ca.gov/title24/2005standards/archive/outdoor_lighting/documents/2003-05-06_LGHT-BASELINE.PDF
__. 2002a. Integrated Energy Systems Productivity and Building Science: Outdoor Lighting Baseline Assessment - Appendices. http://www.energy.ca.gov/2003publications/CEC-500-2003-082/CEC-500-2003-082-A-19.PDF
[SDMC2009] San Diego Municipal Code, 2009. Chapter 14: General Regulations, Revised 12-2009. http://puff.lbl.gov/transportation/transportation/pdf/sandiego-municipal-code-ch14.pdf. Accessed 2014.
[T24ACM] California Energy Commission. 2008. “Nonresidential Alternative Calculation Method (ACM) Approval Manual”. December 2008. http://www.energy.ca.gov/2008publications/CEC-400-2008-003/CEC-400-2008-003-CMF.PDF. Accessed May 2014.
[TRC 2014] TRC Energy Services. Communications with Manufacturers on the LED Market. Ongoing communications and observations from 2013 and 2014.
[U.S. EPA] United States Environmental Protection Agency. 2011. “Emission Factors for Greenhouse Gas Inventories.” http://www.epa.gov/climateleadership/documents/emission-factors.pdf. Accessed December 2, 2013.

2016 Title 24 CASE Report –Measure Number: 2016-NR-LTG3-F Page 52
APPENDIX A: ENVIRONMENTAL IMPACTSMETHODOLOGY
Greenhouse Gas Emissions Impacts Methodology The avoided GHG emissions were calculated assuming an emission factor of 353 metric tons of carbon dioxide equivalents (MTCO2e) per GWh of electricity savings. The Statewide CASE Team calculated air quality impacts associated with the electricity savings from the proposed measure using emission factors that indicate emissions per GWh of electricity generated.4 When evaluating the impact of increasing the Renewable Portfolio Standard (RPS) from 20 percent renewables by 2020 to 33 percent renewables by 2020, California Air Resources Board (CARB) published data on expected air pollution emissions for various future electricity generation scenarios (CARB 2010). The Statewide CASE Team used data from CARB’s analysis to inform the air quality analysis presented in this report.
The GHG emissions factor is a projection for 2020 assuming the state will meet the 33 percent RPS goal. CARB calculated the emissions for two scenarios: (1) a high load scenario in which load continues at the same rate; and (2) a low load rate that assumes the state will successfully implement energy efficiency strategies outlined in the AB32 scoping plan thereby reducing overall electricity load in the state.
To be conservative, the Statewide CASE Team calculated the emissions factors of the incremental electricity between the low and high load scenarios. These emission factors are intended to provide a benchmark of emission reductions attributable to energy efficiency measures that could help achieve the low load scenario. The incremental emissions were calculated by dividing the difference between California emissions in the high and low generation forecasts by the difference between total electricity generated in those two scenarios. While emission rates may change over time, 2020 was considered a representative year for this measure.
Avoided GHG emissions from natural gas savings were calculated using an emission factor of 5,303 MTCO2e/million therms (U.S. EPA 2011).
4 California power plants are subject to a GHG cap and trade program and linked offset programs until 2020 and potentially
beyond.
2016 Title 24 CASE Report –Measure Number: 2016-NR-LTG3-F Page 53
APPENDIX B: OUTDOOR LIGHTINGCALCULATIONS METHODOLOGY
General Hardscape Area Lighting Calculations Rationale There are a number of issues that make the change to LED as the basis of design more difficult than a simple recalculation of the LPA values based on the efficacy of the LED lamps compared to PSMH lamps. Each of these items will be addressed individually. These factors include:
The efficacy of the LED products is increasing at a rate of approximately 10% per year. The luminaire efficacy (the light source efficacy times the luminaire efficiency) produces a very different result than the raw lamp efficacy. LED lumen maintenance is not as straightforward as incumbent technology. The light distribution from LED products designed for outdoor hardscape lighting is very different than for incumbent PSMH products. The lighting design criteria for parking lots and other outdoor hardscape spaces dictates the LPA results in a manner that is sometimes non-intuitive.
LED Efficacy is Rapidly Improving LED technology is being pushed rapidly towards higher efficacy values with every new generation of chips introduced to market. The current rate of improvement is in the range of 10% per annum, and this rate of improvement is expected to be maintained for the near future (at least for the next five years or so). Some LED products are improving faster, in particular ‘warm’ LED chips, which are generally preferred by many in the industry for aesthetic reasons.
They are also strongly preferred by some specifiers because they typically have a lower amount of light in the blue end of the spectrum where there is considerable concern regarding the interruption of human and other species circadian rhythms as a result of melatonin disruption caused by nighttime exposure to light sources rich in blue wavelengths.
As a result, the ‘warm’ LED chips (generally color temperatures lower than approximately 4100K) are considered preferable for outdoor specifications.
Because the LED chips are improving so rapidly, it is important to set the LPA values based on the performance of the chips that will be available at the time of implementation of the 2106 Title 24 Standards. To set the values based on current (2014) chip efficacy values would result in a table of LPA values that are obsolete by approximately 30% by 2017. As a result, it is important to predict the efficacy of the available lighting equipment in 2017 and establish values based on that expectation of efficacy.
Since the Standards will be in effect for three years (from January 1, 2017 until implementation of the 2019 Title 24 Standards on January 1, 2020), the LPA values will be approximately 30% too high by the end of the expected effective period of the 2016 Standards, even though the LPA values will be current at the beginning of the effective period. This makes it important that the LPA values be continually evaluated and updated at

2016 Title 2
each coof TitleStates, buildin
The DOcited as(DOE 2
Figure ‘warm’
Figure
The infyear, soStandar
24 CASE Report
ode cycle to e 24; to achieand to work
ngs.
OE has prods the primary2013)
1 below, pro’ LEDs.
e 1: Diagram
formation ono that the vards impleme
t –Measure Num
ensure that teve the high
k toward an a
duced severaly resource fo
ovides a grap
m of LED C
n the graph calues can be pentation time
mber: 2016-NR-L
the values cohest cost effeachievable Z
l LED chip tor the projec
phic of the p
hip Efficacy
can be translplaced at theeframe.
LTG3-F
ontinue to efective energyZero Net Ene
tracking repoctions of LED
projections o
y Projection
ated into thee appropriate
ffectively woy efficiency sergy Goal in
orts in the paD efficacy a
of LED effic
ns
e projectionse point in tim
ork toward tstandards in
n 2030 for No
ast, and this as we move f
acy for both
s shown in Fme for the Ti
P
the overall gn the United onresidentia
informationforward in ti
h ‘cool’ and
Figure 2, yeaitle 24
Page 54
oals
al
n is ime.
ar by

2016 Title 2
Figure
Furtherluminathe lumincludiboard lindepenfrom thbeen m
FigureBands.
24 CASE Report
e 2: LED Ch
r, the DOE paires. The datminaires haveing the qualitlosses, heat rndent of the he DOE repo
made to the y
e 3: Roadwa.
t –Measure Num
hip Efficacy
produced a reta containede other variaty of the optrejection, anLED chip e
ort on specifiyear 2017 (PN
ay and Area
mber: 2016-NR-L
y and Price P
eport in 201d in this repoables that imptical materiad other factofficacy impr
fic luminaireNNL 2013).
a Luminaire
LTG3-F
Projections
3 that providrt deviates frpact the totals used to reors that all hrovements. Fs, which hel
e Efficacy P
des informatfrom the chipal efficacy ofedirect the ligave the poss
Figure 3 belolps to reinfor
rojections w
tion on the ep tracking ref the lightingght, driver losibility to imow provides rce the proje
with 95% C
P
efficacy of eports becausg equipmentosses, chip
mprove with tinformation
ections that h
Confidence
Page 55
se ,
time n have

2016 Title 24 CASE Report –Measure Number: 2016-NR-LTG3-F Page 56
As a result, the luminaire efficacy of the products used in the calculations has been adjusted upwards to reflect the 2017 performance of LED products.
Luminaire efficacy is Different from Lamp Efficacy The introduction of LED light sources in the lighting industry has caused the industry to reset its expectations for the way light is produced and controlled from a luminaire. With incumbent technology (HPS, PSMH, CFL, incandescent, etc.) the light is emitted from the lamp, redirected by reflectors in the luminaire, and delivered to the task location as efficiently as possible. Light from many lamp types is produced in all directions, so a considerable amount of resources is spent to redirect the light that is going in the opposite direction from that desired back toward the task area. This sometimes requires two bounces off a reflector, and then through a coverglass.
The resultant luminaire efficiency (the percentage of light output compared to the bare lamp output) is often in the 70% range, with many sources as low as about 50%, and very few as high as 80%.
As a result, a comparison of lamp efficacy between PSMH and LED will yield a false picture of the actual performance of the respective light sources. Previously, these differences were minimal when comparing MH to PSMH, for example, because both systems had the same optical limitations to deal with.
While LED lamp efficacy is not expected to exceed PSMH or even CFL lamp efficacy for several more years, the information provided through LED market research indicates that when accounting for the losses associated with the luminaires, LED is now equal to, or better than almost all other light sources available on the market in high quality luminaire products (DOE 2013).
Figure 4 below, provides the DOE projection for LED luminaire efficacy compared to HID and linear fluorescent products, and shows the clear improvement of LED in time, and that projected point where the LED luminaires will have the highest efficacy, which appears to happen in late 2014 or early 2015.

2016 Title 2
FigureLFL P
24 CASE Report
e 4: LED LuProducts
t –Measure Num
uminaire Ef
mber: 2016-NR-L
fficacy Proje
LTG3-F
ections Commpared To ‘‘Best in Cla
P
ass’ HID and
Page 57
d
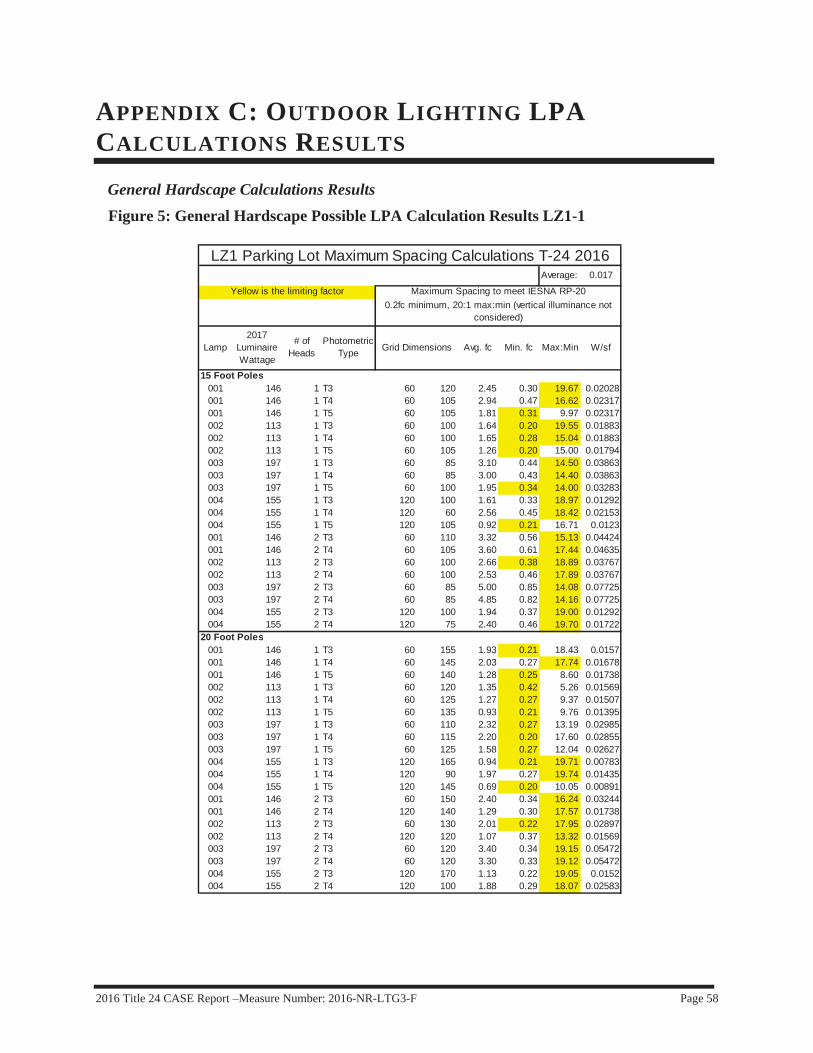
2016 Title 24 CASE Report –Measure Number: 2016-NR-LTG3-F Page 58
APPENDIX C: OUTDOOR LIGHTING LPACALCULATIONS RESULTS
General Hardscape Calculations Results
Figure 5: General Hardscape Possible LPA Calculation Results LZ1-1
Average: 0.017
001 146 1 T3 60 120 2.45 0.30 19.67 0.02028001 146 1 T4 60 105 2.94 0.47 16.62 0.02317001 146 1 T5 60 105 1.81 0.31 9.97 0.02317002 113 1 T3 60 100 1.64 0.20 19.55 0.01883002 113 1 T4 60 100 1.65 0.28 15.04 0.01883002 113 1 T5 60 105 1.26 0.20 15.00 0.01794003 197 1 T3 60 85 3.10 0.44 14.50 0.03863003 197 1 T4 60 85 3.00 0.43 14.40 0.03863003 197 1 T5 60 100 1.95 0.34 14.00 0.03283004 155 1 T3 120 100 1.61 0.33 18.97 0.01292004 155 1 T4 120 60 2.56 0.45 18.42 0.02153004 155 1 T5 120 105 0.92 0.21 16.71 0.0123001 146 2 T3 60 110 3.32 0.56 15.13 0.04424001 146 2 T4 60 105 3.60 0.61 17.44 0.04635002 113 2 T3 60 100 2.66 0.38 18.89 0.03767002 113 2 T4 60 100 2.53 0.46 17.89 0.03767003 197 2 T3 60 85 5.00 0.85 14.08 0.07725003 197 2 T4 60 85 4.85 0.82 14.16 0.07725004 155 2 T3 120 100 1.94 0.37 19.00 0.01292004 155 2 T4 120 75 2.40 0.46 19.70 0.01722
001 146 1 T3 60 155 1.93 0.21 18.43 0.0157001 146 1 T4 60 145 2.03 0.27 17.74 0.01678001 146 1 T5 60 140 1.28 0.25 8.60 0.01738002 113 1 T3 60 120 1.35 0.42 5.26 0.01569002 113 1 T4 60 125 1.27 0.27 9.37 0.01507002 113 1 T5 60 135 0.93 0.21 9.76 0.01395003 197 1 T3 60 110 2.32 0.27 13.19 0.02985003 197 1 T4 60 115 2.20 0.20 17.60 0.02855003 197 1 T5 60 125 1.58 0.27 12.04 0.02627004 155 1 T3 120 165 0.94 0.21 19.71 0.00783004 155 1 T4 120 90 1.97 0.27 19.74 0.01435004 155 1 T5 120 145 0.69 0.20 10.05 0.00891001 146 2 T3 60 150 2.40 0.34 16.24 0.03244001 146 2 T4 120 140 1.29 0.30 17.57 0.01738002 113 2 T3 60 130 2.01 0.22 17.95 0.02897002 113 2 T4 120 120 1.07 0.37 13.32 0.01569003 197 2 T3 60 120 3.40 0.34 19.15 0.05472003 197 2 T4 60 120 3.30 0.33 19.12 0.05472004 155 2 T3 120 170 1.13 0.22 19.05 0.0152004 155 2 T4 120 100 1.88 0.29 18.07 0.02583
LZ1 Parking Lot Maximum Spacing Calculations T-24 2016
Maximum Spacing to meet IESNA RP-200.2fc minimum, 20:1 max:min (vertical illuminance not
considered)
Max:Min W/sf
Yellow is the limiting factor
LampPhotometric
Type Grid Dimensions Avg. fc Min. fc2017
Luminaire Wattage
# of Heads
15 Foot Poles
20 Foot Poles

2016 Title 24 CASE Report –Measure Number: 2016-NR-LTG3-F Page 59
Figure 6: General Hardscape Possible LPA Calculation Results LZ1-2
Average: 0.017
001 146 1 T3 60 185 1.57 0.23 12.26 0.01315001 146 1 T4 60 180 1.45 0.24 12.58 0.01352001 146 1 T5 60 170 0.95 0.23 6.09 0.01431002 113 1 T3 60 155 1.03 0.23 7.70 0.01215002 113 1 T4 60 150 0.94 0.22 7.64 0.01256002 113 1 T5 60 165 0.68 0.21 6.57 0.01141003 197 1 T3 60 140 1.79 0.33 8.82 0.02345003 197 1 T4 60 140 1.74 0.32 8.81 0.02345003 197 1 T5 60 155 1.17 0.20 11.30 0.02118004 155 1 T3 120 190 0.83 0.20 13.10 0.0068004 155 1 T4 120 115 1.57 0.20 19.65 0.01123004 155 1 T5 120 170 0.57 0.20 6.95 0.0076001 146 2 T3 60 195 1.85 0.23 19.22 0.02496001 146 2 T4 120 170 1.07 0.22 16.86 0.01431002 113 2 T3 60 165 1.57 0.21 14.48 0.02283002 113 2 T4 120 150 0.85 0.21 15.19 0.01256003 197 2 T3 60 145 2.83 0.32 15.34 0.04529003 197 2 T4 120 140 1.42 0.24 17.04 0.02345004 155 2 T3 120 210 0.91 0.22 12.91 0.0123004 155 2 T4 120 130 1.43 0.21 18.29 0.01987
001 146 1 T3 60 220 1.22 0.21 10.43 0.01106001 146 1 T4 60 210 1.13 0.21 11.05 0.01159001 146 1 T5 60 200 0.72 0.22 4.64 0.01217002 113 1 T3 60 185 0.80 0.20 6.80 0.01018002 113 1 T4 60 175 0.79 0.21 6.71 0.01076002 113 1 T5 60 190 0.52 0.23 4.30 0.00991003 197 1 T3 60 170 1.40 0.21 10.71 0.01931003 197 1 T4 60 170 1.36 0.20 10.38 0.01931003 197 1 T5 60 180 0.89 0.26 6.27 0.01824004 155 1 T3 120 210 0.74 0.21 10.19 0.00615004 155 1 T4 120 130 1.31 0.21 14.48 0.00994004 155 1 T5 120 190 0.50 0.20 4.80 0.0068001 146 2 T3 60 230 1.44 0.20 16.85 0.02116001 146 2 T4 120 200 0.91 0.21 13.43 0.01217002 113 2 T3 60 190 1.27 0.22 10.82 0.01982002 113 2 T4 120 175 0.74 0.22 9.95 0.01076003 197 2 T3 60 180 2.15 0.23 16.61 0.03648003 197 2 T4 120 165 1.22 0.23 12.78 0.0199004 155 2 T3 120 245 0.78 0.21 11.81 0.01054004 155 2 T4 120 150 1.21 0.20 15.70 0.01722
Max:Min W/sf
25 Foot Poles
30 Foot Poles
LZ1 Parking Lot Maximum Spacing Calculations T-24 2016
Yellow is the limiting factor Maximum Spacing to meet IESNA RP-200.2fc minimum, 20:1 max:min (vertical illuminance not
considered)
Lamp2017
Luminaire Wattage
# of Heads
Photometric Type Grid Dimensions Avg. fc Min. fc
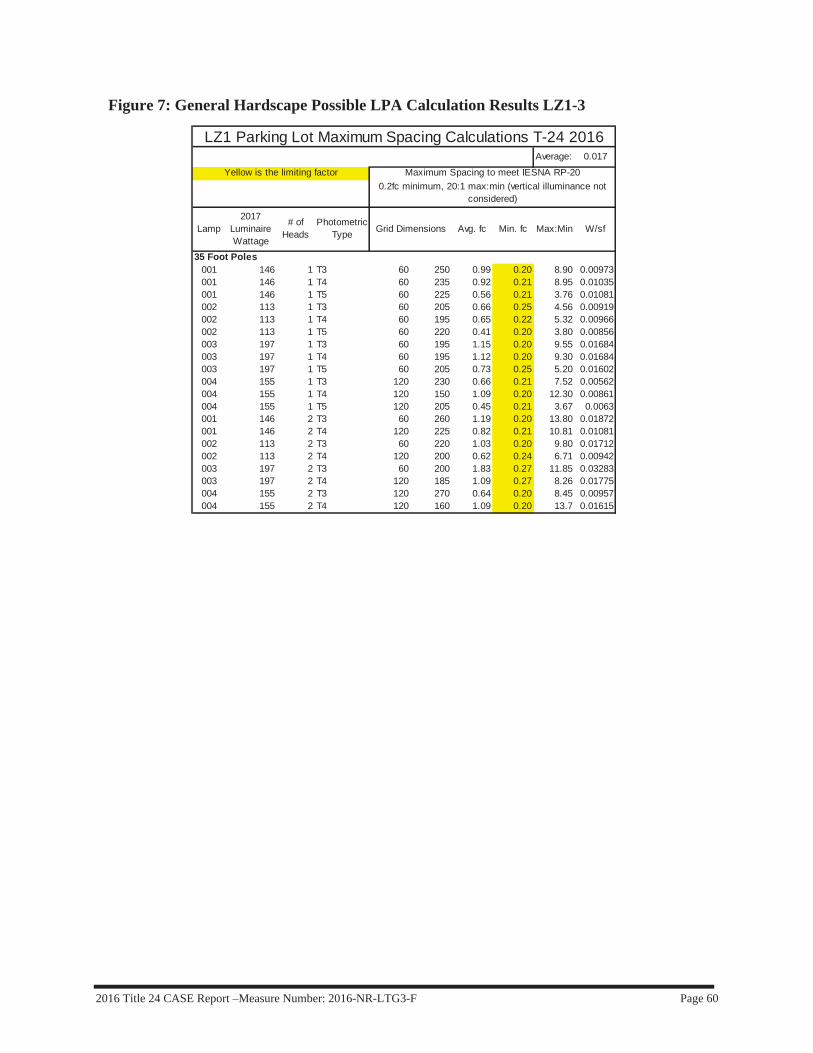
2016 Title 24 CASE Report –Measure Number: 2016-NR-LTG3-F Page 60
Figure 7: General Hardscape Possible LPA Calculation Results LZ1-3
Average: 0.017
001 146 1 T3 60 250 0.99 0.20 8.90 0.00973001 146 1 T4 60 235 0.92 0.21 8.95 0.01035001 146 1 T5 60 225 0.56 0.21 3.76 0.01081002 113 1 T3 60 205 0.66 0.25 4.56 0.00919002 113 1 T4 60 195 0.65 0.22 5.32 0.00966002 113 1 T5 60 220 0.41 0.20 3.80 0.00856003 197 1 T3 60 195 1.15 0.20 9.55 0.01684003 197 1 T4 60 195 1.12 0.20 9.30 0.01684003 197 1 T5 60 205 0.73 0.25 5.20 0.01602004 155 1 T3 120 230 0.66 0.21 7.52 0.00562004 155 1 T4 120 150 1.09 0.20 12.30 0.00861004 155 1 T5 120 205 0.45 0.21 3.67 0.0063001 146 2 T3 60 260 1.19 0.20 13.80 0.01872001 146 2 T4 120 225 0.82 0.21 10.81 0.01081002 113 2 T3 60 220 1.03 0.20 9.80 0.01712002 113 2 T4 120 200 0.62 0.24 6.71 0.00942003 197 2 T3 60 200 1.83 0.27 11.85 0.03283003 197 2 T4 120 185 1.09 0.27 8.26 0.01775004 155 2 T3 120 270 0.64 0.20 8.45 0.00957004 155 2 T4 120 160 1.09 0.20 13.7 0.01615
0.2fc minimum, 20:1 max:min (vertical illuminance not considered)
Lamp2017
Luminaire Wattage
# of Heads
Photometric Type Grid Dimensions Avg. fc Min. fc Max:Min W/sf
LZ1 Parking Lot Maximum Spacing Calculations T-24 2016
Yellow is the limiting factor Maximum Spacing to meet IESNA RP-20
35 Foot Poles

2016 Title 24 CASE Report –Measure Number: 2016-NR-LTG3-F Page 61
Figure 8: General Hardscape Possible LPA Calculation Results LZ2-1
Average: 0.018
001 146 1 T3 60 155 1.93 0.21 0.13 18.43 0.0157001 146 1 T4 60 145 2.03 0.27 0.13 17.74 0.01678001 146 1 T5 60 125 1.42 0.54 0.10 3.98 0.01947002 113 1 T3 60 115 1.43 0.49 0.13 4.57 0.01638002 113 1 T4 60 115 1.38 0.52 0.12 4.87 0.01638002 113 1 T5 60 115 1.08 0.63 0.12 3.25 0.01638003 197 1 T3 60 110 2.32 0.27 0.10 13.19 0.02985003 197 1 T4 60 105 2.40 0.59 0.13 5.97 0.03127003 197 1 T5 60 110 1.83 0.94 0.13 3.39 0.02985004 155 1 T3 120 165 0.94 0.21 0.15 19.71 0.00783004 155 1 T4 120 90 1.97 0.27 0.67 19.74 0.01435004 155 1 T5 120 145 0.69 0.20 0.18 10.05 0.00891001 146 2 T3 60 150 2.40 0.34 0.23 16.24 0.03244001 146 2 T4 120 140 1.29 0.30 0.20 17.57 0.01738002 113 2 T3 60 125 2.14 0.35 0.10 11.29 0.03013002 113 2 T4 120 120 1.07 0.37 0.11 13.32 0.01569003 197 2 T3 60 115 3.64 0.40 0.12 17.00 0.0571003 197 2 T4 60 115 3.54 0.39 0.12 16.90 0.0571004 155 2 T3 120 170 1.13 0.22 0.18 19.05 0.0152004 155 2 T4 120 100 1.88 0.29 0.69 18.07 0.02583
001 146 1 T3 60 185 1.57 0.23 0.10 12.26 0.01315001 146 1 T4 60 165 1.62 0.41 0.12 7.66 0.01475001 146 1 T5 60 155 1.07 0.44 0.10 3.18 0.0157002 113 1 T3 60 140 1.12 0.59 0.12 2.95 0.01345002 113 1 T4 60 135 1.07 0.54 0.11 3.19 0.01395002 113 1 T5 60 145 0.77 0.46 0.11 3.00 0.01299003 197 1 T3 60 130 1.93 0.54 0.11 5.39 0.02526003 197 1 T4 60 130 1.87 0.53 0.11 5.32 0.02526003 197 1 T5 60 135 1.33 0.74 0.11 3.05 0.02432004 155 1 T3 120 190 0.73 0.20 0.18 13.10 0.0068004 155 1 T4 120 115 1.57 0.20 0.82 19.65 0.01123004 155 1 T5 120 170 0.57 0.20 0.18 6.95 0.0076001 146 2 T3 60 195 1.85 0.23 0.11 19.22 0.02496001 146 2 T4 120 170 1.07 0.22 0.23 16.86 0.01431002 113 2 T3 60 150 1.80 0.46 0.11 6.54 0.02511002 113 2 T4 120 150 0.85 0.21 0.12 15.19 0.01256003 197 2 T3 60 140 2.88 0.56 0.10 8.71 0.0469003 197 2 T4 120 125 1.57 0.41 0.11 9.98 0.02627004 155 2 T3 120 210 0.91 0.22 0.16 12.91 0.0123004 155 2 T4 120 130 1.43 0.21 0.66 18.29 0.01987
LZ2 Parking Lot Maximum Spacing Calculations T-24 2016
Yellow is the limiting factor Maximum Spacing to meet IESNA RP-20.2fc minimum horizontal, .1fc minimum vertical at center, 20:1
max:min
Lamp Luminaire Wattage
# of Heads
Photometric Type
Grid Dimensions Avg. fc Vert. fcMin. fc Max:Min W/sf
20 Foot Poles
25 Foot Poles

2016 Title 24 CASE Report –Measure Number: 2016-NR-LTG3-F Page 62
Figure 9: General Hardscape Possible LPA Calculation Results LZ2-2
Average: 0.018
001 146 1 T3 60 205 1.32 0.33 0.12 6.76 0.01187001 146 1 T4 60 195 1.25 0.41 0.11 5.66 0.01248001 146 1 T5 60 175 0.82 0.47 0.11 2.23 0.0139002 113 1 T3 60 165 0.89 0.55 0.11 2.47 0.01141002 113 1 T4 60 155 0.86 0.52 0.11 2.71 0.01215002 113 1 T5 60 170 0.59 0.35 0.11 2.83 0.01108003 197 1 T3 60 150 1.59 0.72 0.10 3.13 0.02189003 197 1 T4 60 145 1.61 0.91 0.14 2.40 0.02264003 197 1 T5 60 160 1.00 0.60 0.13 2.72 0.02052004 155 1 T3 120 210 0.74 0.21 0.21 10.19 0.00615004 155 1 T4 120 130 1.31 0.21 0.79 14.48 0.00994004 155 1 T5 120 190 0.50 0.20 0.17 4.80 0.0068001 146 2 T3 60 210 1.58 0.36 0.12 9.39 0.02317001 146 2 T4 120 200 0.91 0.21 0.19 13.43 0.01217002 113 2 T3 60 170 1.41 0.67 0.12 3.55 0.02216002 113 2 T4 120 175 0.74 0.22 0.11 9.95 0.01076003 197 2 T3 60 160 2.42 0.73 0.11 5.23 0.04104003 197 2 T4 120 165 1.22 0.23 0.10 12.78 0.0199004 155 2 T3 120 245 0.78 0.21 0.14 11.81 0.01054004 155 2 T4 120 150 1.21 0.2 0.55 15.7 0.01722
001 146 1 T3 60 230 1.07 0.34 0.11 5.24 0.01058001 146 1 T4 60 210 1.01 0.42 0.11 4.48 0.01159001 146 1 T5 60 200 0.63 0.42 0.10 1.83 0.01217002 113 1 T3 60 185 0.73 0.53 0.11 2.15 0.01018002 113 1 T4 60 175 0.70 0.46 0.11 2.54 0.01076002 113 1 T5 60 195 0.47 0.28 0.10 2.75 0.00966003 197 1 T3 60 170 1.30 0.76 0.14 2.51 0.01931003 197 1 T4 60 170 1.26 0.74 0.13 2.50 0.01931003 197 1 T5 60 185 0.80 0.48 0.10 2.71 0.01775004 155 1 T3 120 230 0.66 0.21 0.22 7.52 0.00562004 155 1 T4 120 150 1.09 0.20 0.65 12.30 0.00861004 155 1 T5 120 205 0.45 0.21 0.16 3.67 0.0063001 146 2 T3 60 235 1.33 0.38 0.11 7.26 0.02071001 146 2 T4 120 225 0.82 0.21 0.18 10.81 0.01081002 113 2 T3 60 190 1.19 0.70 0.13 2.81 0.01982002 113 2 T4 120 200 0.62 0.24 0.11 6.71 0.00942003 197 2 T3 60 175 2.11 0.93 0.14 3.47 0.03752003 197 2 T4 120 185 1.09 0.27 0.14 8.26 0.01775004 155 2 T3 120 270 0.68 0.20 0.14 8.45 0.00957004 155 2 T4 120 160 1.09 0.22 0.54 11.86 0.01615
W/sfGrid Dimensions Avg. fc Min. fc Vert. fc Max:Min
30 Foot Poles
35 Foot Poles
LZ2 Parking Lot Maximum Spacing Calculations T-24 2016
Yellow is the limiting factor Maximum Spacing to meet IESNA RP-20.2fc minimum horizontal, .1fc minimum vertical at center, 20:1
max:min
Lamp Luminaire Wattage
# of Heads
Photometric Type
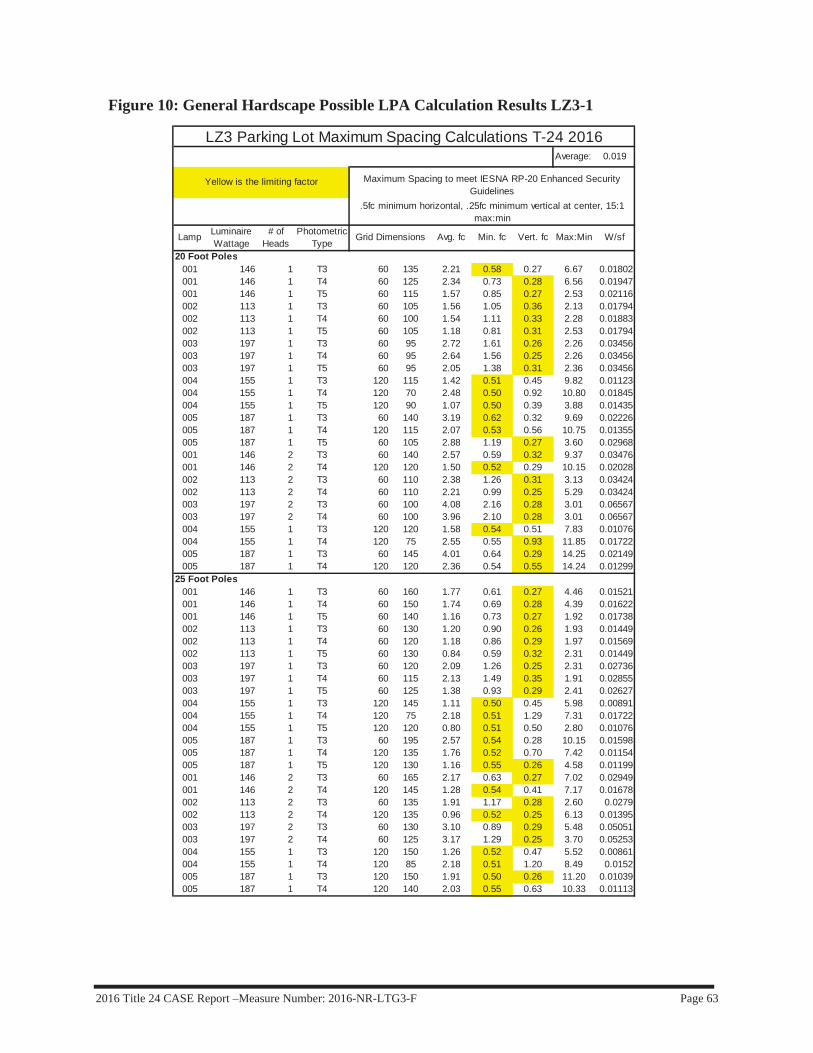
2016 Title 24 CASE Report –Measure Number: 2016-NR-LTG3-F Page 63
Figure 10: General Hardscape Possible LPA Calculation Results LZ3-1
Average: 0.019
001 146 1 T3 60 135 2.21 0.58 0.27 6.67 0.01802001 146 1 T4 60 125 2.34 0.73 0.28 6.56 0.01947001 146 1 T5 60 115 1.57 0.85 0.27 2.53 0.02116002 113 1 T3 60 105 1.56 1.05 0.36 2.13 0.01794002 113 1 T4 60 100 1.54 1.11 0.33 2.28 0.01883002 113 1 T5 60 105 1.18 0.81 0.31 2.53 0.01794003 197 1 T3 60 95 2.72 1.61 0.26 2.26 0.03456003 197 1 T4 60 95 2.64 1.56 0.25 2.26 0.03456003 197 1 T5 60 95 2.05 1.38 0.31 2.36 0.03456004 155 1 T3 120 115 1.42 0.51 0.45 9.82 0.01123004 155 1 T4 120 70 2.48 0.50 0.92 10.80 0.01845004 155 1 T5 120 90 1.07 0.50 0.39 3.88 0.01435005 187 1 T3 60 140 3.19 0.62 0.32 9.69 0.02226005 187 1 T4 120 115 2.07 0.53 0.56 10.75 0.01355005 187 1 T5 60 105 2.88 1.19 0.27 3.60 0.02968001 146 2 T3 60 140 2.57 0.59 0.32 9.37 0.03476001 146 2 T4 120 120 1.50 0.52 0.29 10.15 0.02028002 113 2 T3 60 110 2.38 1.26 0.31 3.13 0.03424002 113 2 T4 60 110 2.21 0.99 0.25 5.29 0.03424003 197 2 T3 60 100 4.08 2.16 0.28 3.01 0.06567003 197 2 T4 60 100 3.96 2.10 0.28 3.01 0.06567004 155 1 T3 120 120 1.58 0.54 0.51 7.83 0.01076004 155 1 T4 120 75 2.55 0.55 0.93 11.85 0.01722005 187 1 T3 60 145 4.01 0.64 0.29 14.25 0.02149005 187 1 T4 120 120 2.36 0.54 0.55 14.24 0.01299
001 146 1 T3 60 160 1.77 0.61 0.27 4.46 0.01521001 146 1 T4 60 150 1.74 0.69 0.28 4.39 0.01622001 146 1 T5 60 140 1.16 0.73 0.27 1.92 0.01738002 113 1 T3 60 130 1.20 0.90 0.26 1.93 0.01449002 113 1 T4 60 120 1.18 0.86 0.29 1.97 0.01569002 113 1 T5 60 130 0.84 0.59 0.32 2.31 0.01449003 197 1 T3 60 120 2.09 1.26 0.25 2.31 0.02736003 197 1 T4 60 115 2.13 1.49 0.35 1.91 0.02855003 197 1 T5 60 125 1.38 0.93 0.29 2.41 0.02627004 155 1 T3 120 145 1.11 0.50 0.45 5.98 0.00891004 155 1 T4 120 75 2.18 0.51 1.29 7.31 0.01722004 155 1 T5 120 120 0.80 0.51 0.50 2.80 0.01076005 187 1 T3 60 195 2.57 0.54 0.28 10.15 0.01598005 187 1 T4 120 135 1.76 0.52 0.70 7.42 0.01154005 187 1 T5 120 130 1.16 0.55 0.26 4.58 0.01199001 146 2 T3 60 165 2.17 0.63 0.27 7.02 0.02949001 146 2 T4 120 145 1.28 0.54 0.41 7.17 0.01678002 113 2 T3 60 135 1.91 1.17 0.28 2.60 0.0279002 113 2 T4 120 135 0.96 0.52 0.25 6.13 0.01395003 197 2 T3 60 130 3.10 0.89 0.29 5.48 0.05051003 197 2 T4 60 125 3.17 1.29 0.25 3.70 0.05253004 155 1 T3 120 150 1.26 0.52 0.47 5.52 0.00861004 155 1 T4 120 85 2.18 0.51 1.20 8.49 0.0152005 187 1 T3 120 150 1.91 0.50 0.26 11.20 0.01039005 187 1 T4 120 140 2.03 0.55 0.63 10.33 0.01113
Min. fc Vert. fc Max:Min W/sf
20 Foot Poles
25 Foot Poles
LZ3 Parking Lot Maximum Spacing Calculations T-24 2016
Yellow is the limiting factor Maximum Spacing to meet IESNA RP-20 Enhanced Security Guidelines
.5fc minimum horizontal, .25fc minimum vertical at center, 15:1 max:min
Lamp Luminaire Wattage
# of Heads
Photometric Type
Grid Dimensions Avg. fc

2016 Title 24 CASE Report –Measure Number: 2016-NR-LTG3-F Page 64
Figure 11: General Hardscape Possible LPA Calculation Results LZ3-2
Average: 0.019
001 146 1 T3 60 185 1.46 0.59 0.26 3.78 0.01315001 146 1 T4 60 170 1.39 0.69 0.26 3.36 0.01431001 146 1 T5 60 160 0.89 0.68 0.27 1.50 0.01521002 113 1 T3 60 150 0.97 0.74 0.31 1.82 0.01256002 113 1 T4 60 140 0.93 0.65 0.27 2.12 0.01345002 113 1 T5 60 145 0.69 0.52 0.34 1.94 0.01299003 197 1 T3 60 140 1.70 1.26 0.27 1.79 0.02345003 197 1 T4 60 140 1.65 1.22 0.26 1.79 0.02345003 197 1 T5 60 145 1.12 0.75 0.30 2.19 0.02264004 155 1 T3 120 165 0.95 0.51 0.44 4.71 0.00783004 155 1 T4 120 80 2.02 0.54 1.47 5.93 0.01615004 155 1 T5 120 135 0.69 0.51 0.47 2.04 0.00957005 187 1 T3 60 195 2.17 0.54 0.27 8.37 0.01598005 187 1 T4 120 145 1.51 0.54 0.61 5.28 0.01075005 187 1 T5 120 150 1.00 0.50 0.35 3.62 0.01039001 146 2 T3 60 190 1.74 0.64 0.25 5.28 0.02561001 146 2 T4 120 165 1.12 0.51 0.49 5.63 0.01475002 113 2 T3 60 155 1.57 1.04 0.32 2.32 0.0243002 113 2 T4 120 140 0.90 0.51 0.56 4.31 0.01345003 197 2 T3 60 140 2.76 1.99 0.38 1.92 0.0469003 197 2 T4 120 135 1.48 0.80 0.30 3.68 0.02432004 155 1 T3 120 175 1.08 0.52 0.43 4.81 0.00738004 155 1 T4 120 95 1.89 0.51 1.34 6.98 0.0136005 187 1 T3 120 190 1.50 0.52 0.27 7.83 0.0082005 187 1 T4 120 160 1.75 0.59 0.54 7.53 0.00974
001 146 1 T3 60 205 1.21 0.61 0.25 2.93 0.01187001 146 1 T4 60 185 1.16 0.71 0.28 2.65 0.01315001 146 1 T5 60 175 0.72 0.66 0.28 1.20 0.0139002 113 1 T3 60 170 0.79 0.60 0.27 1.90 0.01108002 113 1 T4 60 155 0.79 0.54 0.29 2.17 0.01215002 113 1 T5 60 145 0.63 0.51 0.30 1.53 0.01299003 197 1 T3 60 160 1.38 1.12 0.28 1.71 0.02052003 197 1 T4 60 160 1.34 1.09 0.27 1.70 0.02052003 197 1 T5 60 165 0.90 0.61 0.29 2.13 0.0199004 155 1 T3 120 165 0.92 0.51 0.51 3.35 0.00783004 155 1 T4 120 90 1.72 0.53 1.49 5.00 0.01435004 155 1 T5 120 135 0.66 0.50 0.53 1.66 0.00957005 187 1 T3 120 190 1.18 0.53 0.47 3.58 0.0082005 187 1 T4 120 175 1.29 0.54 0.48 4.31 0.0089005 187 1 T5 120 165 0.91 0.51 0.42 2.80 0.00944001 146 2 T3 60 205 1.52 0.74 0.28 3.73 0.02374001 146 2 T4 120 180 1.00 0.54 0.53 4.13 0.01352002 113 2 T3 60 175 1.30 0.90 0.30 2.19 0.02152002 113 2 T4 120 150 0.83 0.52 0.60 3.12 0.01256003 197 2 T3 60 165 2.23 1.45 0.29 2.23 0.0398003 197 2 T4 120 175 1.15 0.50 0.25 4.46 0.01876004 155 1 T3 120 200 0.91 0.51 0.38 3.35 0.00646004 155 1 T4 120 105 1.62 0.53 1.4 5.34 0.0123005 187 1 T3 120 210 1.35 0.52 0.35 5.98 0.00742005 187 1 T4 120 185 1.51 0.51 0.39 7.57 0.00842
Max:Min W/sfPhotometric Type
Grid Dimensions Avg. fc Min. fc Vert. fc
30 Foot Poles
35 Foot Poles
LZ3 Parking Lot Maximum Spacing Calculations T-24 2016
Yellow is the limiting factor Maximum Spacing to meet IESNA RP-20 Enhanced Security Guidelines
.5fc minimum horizontal, .25fc minimum vertical at center, 15:1 max:min
Lamp Luminaire Wattage
# of Heads

2016 Title 24 CASE Report –Measure Number: 2016-NR-LTG3-F Page 65
Figure 12: General Hardscape Possible LPA Calculation Results LZ3-3
Average: 0.019
001 146 1 T3 120 195 0.75 0.51 0.49 1.98 0.00624001 146 1 T4 120 185 0.76 0.52 0.55 2.19 0.00658001 146 1 T5 120 115 0.73 0.51 0.85 1.78 0.01058002 113 1 T3 120 120 0.65 0.52 0.55 1.42 0.00785002 113 1 T4 120 110 0.68 0.53 0.50 1.62 0.00856002 113 1 T5 120 70 0.63 0.51 0.3 1.41 0.01345003 197 1 T3 120 180 0.71 0.56 0.42 1.70 0.00912003 197 1 T4 120 180 0.67 0.54 0.41 1.70 0.00912003 197 1 T5 120 150 0.63 0.52 0.60 1.56 0.01094004 155 1 T3 120 155 0.90 0.51 0.62 2.88 0.00833004 155 1 T4 120 100 1.747 0.53 1.36 4.53 0.01292004 155 1 T5 120 120 0.7 0.51 0.79 1.90 0.01076005 187 1 T3 120 205 1.09 0.53 0.52 3.08 0.0076005 187 1 T4 120 195 1.11 0.52 0.40 3.67 0.00799005 187 1 T5 120 190 0.82 0.52 0.43 2.15 0.0082001 146 2 T3 120 115 0.85 0.51 0.39 3.39 0.02116001 146 2 T4 120 200 0.89 0.50 0.46 3.60 0.01217002 113 2 T3 120 185 0.71 0.51 0.53 2.12 0.01018002 113 2 T4 120 160 0.75 0.52 0.50 2.46 0.01177003 197 2 T3 120 195 1.06 0.51 0.29 3.49 0.01684003 197 2 T4 120 195 1.02 0.50 0.25 3.44 0.01684004 155 1 T3 120 220 0.81 0.51 0.35 2.96 0.00587004 155 1 T4 120 115 1.41 0.52 1.29 4.88 0.01123005 187 1 T3 120 230 1.22 0.51 0.36 4.88 0.00678005 187 1 T4 120 205 1.31 0.51 0.34 6.27 0.0076
.5fc minimum horizontal, .25fc minimum vertical at center, 15:1 max:min
Lamp Luminaire Wattage
# of Heads
Photometric Type
Grid Dimensions Avg. fc Min. fc Vert. fc Max:Min W/sf
LZ3 Parking Lot Maximum Spacing Calculations T-24 2016
Yellow is the limiting factor Maximum Spacing to meet IESNA RP-20 Enhanced Security Guidelines
40 Foot Poles

2016 Title 24 CASE Report –Measure Number: 2016-NR-LTG3-F Page 66
Figure 13: General Hardscape Possible LPA Calculation Results LZ4-1
Average: 0.020
001 146 1 T3 60 160 1.67 1.07 0.59 2.06 0.01521001 146 1 T4 60 150 1.58 1.04 0.58 2.24 0.01622001 146 1 T5 60 110 1.29 1.02 1.17 1.72 0.02212002 113 1 T3 60 120 1.21 1.08 0.87 1.26 0.01569002 113 1 T4 60 110 1.18 1.06 0.79 1.31 0.01712002 113 1 T5 60 80 1.14 1.02 0.71 1.25 0.02354003 197 1 T3 60 140 1.70 1.26 0.27 1.79 0.02345003 197 1 T4 60 140 1.65 1.22 0.26 1.79 0.02345003 197 1 T5 60 125 1.29 1.05 0.77 1.57 0.02627004 155 1 T3 120 100 1.47 1.04 1.04 2.20 0.01292004 155 1 T4 60 105 2.30 1.02 1.04 4.84 0.0246004 155 1 T5 60 110 1.35 1.01 0.75 1.68 0.02348005 187 1 T3 120 140 1.60 1.01 0.53 2.46 0.01113005 187 1 T4 120 130 1.76 1.13 1.47 2.46 0.01199005 187 1 T5 120 125 1.21 1.00 0.89 1.89 0.01247001 146 2 T3 60 170 1.95 1.03 0.48 3.29 0.02863001 146 2 T4 120 125 1.43 1.07 1.09 2.66 0.01947002 113 2 T3 60 155 1.07 1.04 0.32 2.32 0.0243002 113 2 T4 60 130 1.64 1.02 0.60 2.44 0.02897003 197 2 T3 60 140 2.76 1.99 0.38 1.92 0.0469003 197 2 T4 120 80 2.44 1.15 0.63 3.69 0.04104004 155 1 T3 120 125 1.45 1.06 0.88 2.42 0.01033004 155 1 T4 120 110 2.28 1.02 0.89 4.74 0.01174005 187 1 T3 120 150 1.89 1.01 0.58 4.04 0.01039005 187 1 T4 120 140 2.00 1.06 1.13 4.20 0.01113
001 146 1 T3 60 175 1.41 1.06 0.58 1.70 0.0139001 146 1 T4 60 160 1.33 1.03 0.52 1.83 0.01521001 146 1 T5 60 90 1.27 1.11 0.92 1.24 0.02704002 113 1 T3 60 100 1.31 1.10 0.71 1.35 0.01883002 113 1 T4 60 100 1.18 1.00 0.58 1.38 0.01883002 113 1 T5 60 70 1.04 1.01 0.56 1.05 0.0269003 197 1 T3 60 160 1.38 1.12 0.28 1.71 0.02052003 197 1 T4 60 160 1.34 1.09 0.27 1.70 0.02052003 197 1 T5 60 125 1.17 1.00 0.60 1.32 0.02627004 155 1 T3 60 160 1.43 1.00 0.50 2.85 0.01615004 155 1 T4 60 110 1.79 1.02 0.72 3.65 0.02348004 155 1 T5 60 80 1.50 1.05 1.23 1.83 0.03229005 187 1 T3 120 160 1.39 1.07 0.78 1.80 0.00974005 187 1 T4 120 150 1.48 1.01 1.04 2.28 0.01039005 187 1 T5 120 125 1.19 1.05 1.39 1.66 0.01247001 146 2 T3 60 190 1.62 1.01 0.43 2.74 0.02561001 146 2 T4 120 135 1.33 1.01 1.10 2.28 0.01802002 113 2 T3 60 165 1.38 1.01 0.46 1.96 0.02283002 113 2 T4 60 135 1.50 1.08 0.61 1.84 0.0279003 197 2 T3 60 165 2.23 1.45 0.29 2.23 0.0398003 197 2 T4 120 100 1.96 1.11 1.41 2.66 0.03283004 155 1 T3 120 135 1.30 1.01 0.88 1.87 0.00957004 155 1 T4 120 115 1.88 1.04 0.63 3.97 0.01123005 187 1 T3 120 170 1.66 1.03 0.75 3.04 0.00917005 187 1 T4 120 155 1.79 1.11 0.95 3.49 0.01005
LZ4 Parking Lot Maximum Spacing Calculations T-24 2016
Yellow is the limiting factor Maximum Spacing to meet IESNA RP-20 Enhanced Security Guidelines
1.0fc minimum horizontal, .25fc minimum vertical at center, 15:1 max:min
Lamp Luminaire Wattage
# of Heads
Photometric Type
Grid Dimensions Avg. fc
30 Foot Poles
35 Foot Poles
Min. fc Vert. fc Max:Min W/sf

2016 Title 24 CASE Report –Measure Number: 2016-NR-LTG3-F Page 67
Figure 14: General Hardscape Possible LPA Calculation Results LZ4-2
Average: 0.020
001 146 1 T3 60 185 1.21 1.02 0.54 1.42 0.01315001 146 1 T4 120 80 1.42 1.05 1.05 1.58 0.01521001 146 1 T5 60 80 1.07 1.03 0.58 1.07 0.03042002 113 1 T3 60 100 1.15 1.04 0.51 1.24 0.01883002 113 1 T4 60 85 1.16 1.04 0.48 1.26 0.02216002 113 1 T5 60 40 1.1 1.05 0.39 1.11 0.04708003 197 1 T3 120 90 1.31 1.14 0.89 1.29 0.01824003 197 1 T4 120 90 1.27 1.10 0.86 1.30 0.01824003 197 1 T5 60 110 1.19 1.01 0.49 1.35 0.02985004 155 1 T3 60 150 1.36 1.02 0.66 2.16 0.01722004 155 1 T4 60 105 1.58 1.04 0.57 2.96 0.0246004 155 1 T5 60 70 1.36 1.04 0.86 1.60 0.0369005 187 1 T3 120 170 1.3 1.01 0.95 1.64 0.00917005 187 1 T4 120 160 1.33 1.03 0.83 1.83 0.00974005 187 1 T5 120 120 1.21 1.01 1.67 1.66 0.01299001 146 2 T3 120 145 1.22 1.00 1.07 1.76 0.01678001 146 2 T4 120 135 1.29 1.02 1.08 1.86 0.01802002 113 2 T3 60 170 1.25 1.03 0.50 1.65 0.02216002 113 2 T4 60 145 1.15 1.00 0.47 1.72 0.02598003 197 2 T3 120 130 1.56 1.02 1.29 2.08 0.02526003 197 2 T4 120 120 1.64 1.05 1.33 2.13 0.02736004 155 1 T3 120 110 1.43 1.06 1.23 1.68 0.01174004 155 1 T4 120 110 1.66 1.01 0.51 2.96 0.01174005 187 1 T3 120 180 1.55 1.05 0.85 2.39 0.00866005 187 1 T4 120 165 1.61 1.06 0.79 3.03 0.00944
Avg. fc Min. fc Vert. fc Max:Min W/sf
40 Foot Poles
LZ4 Parking Lot Maximum Spacing Calculations T-24 2016
Yellow is the limiting factor Maximum Spacing to meet IESNA RP-20 Enhanced Security Guidelines
1.0fc minimum horizontal, .25fc minimum vertical at center, 15:1 max:min
Lamp Luminaire Wattage
# of Heads
Photometric Type
Grid Dimensions
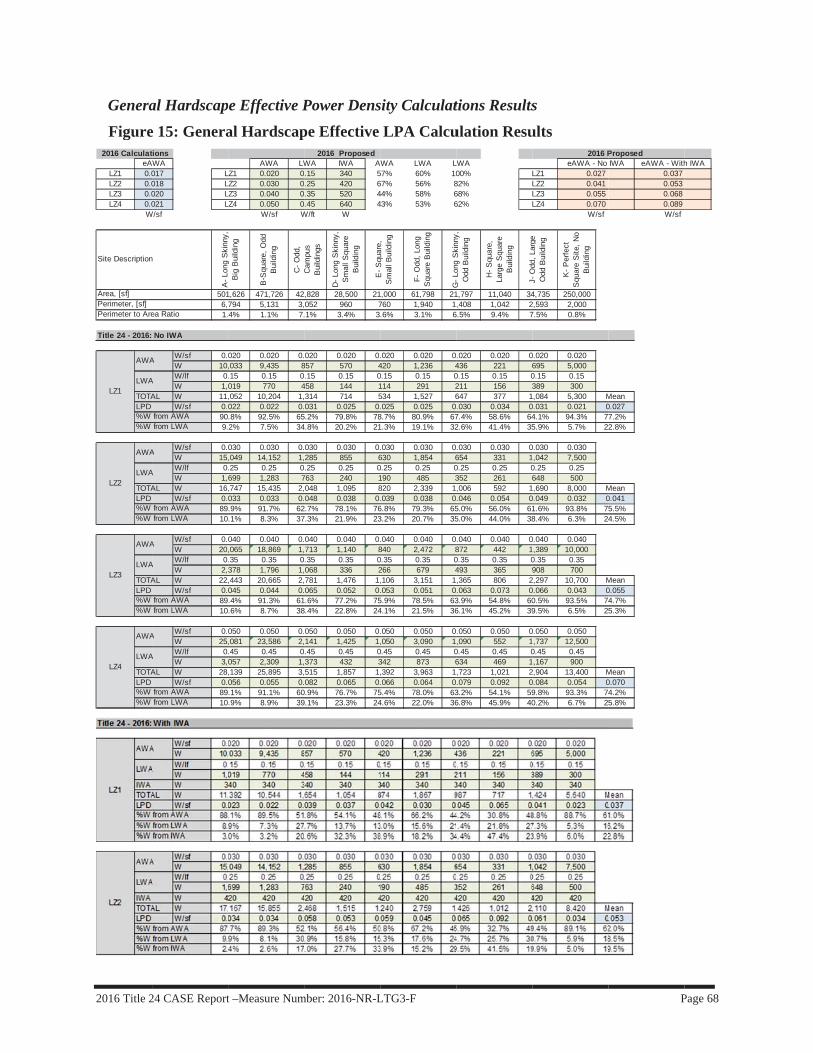
2016 Title 2
Genera
Figure
eALZ1 0.0LZ2 0.0LZ3 0.0LZ4 0.0
W
Title 24 - 2016:
TOTALPD
TOTALPD
TOTALPD
TOTALPD
2016 Calculat
Site Description
Area, [sf]
LZ4
AWA
LWA
%W %W
Perimeter, [sf]
LZ3
AWA
LWA
%W %W
LZ2
AWA
LWA
%W %W
Perimeter to Are
LZ1
AWA
LWA
%W %W
24 CASE Report
al Hardscap
e 15: Genera
WA017 L018 L020 L021 L
W/sfA
- Lon
g S
kinn
y,
5016,1.
No IWA
W/sf 0.W 10,W/lf 0.W 1,
AL W 11,W/sf 0.
909.
W/sf 0.W 15,W/lf 0.W 1,
AL W 16,W/sf 0.
8910
W/sf 0.W 20,W/lf 0.W 2,
AL W 22,W/sf 0.
8910
W/sf 0.W 25,W/lf 0.W 3,
AL W 28,W/sf 0.
8910
tions
n
A
A
from AWAfrom LWA
A
A
from AWAfrom LWA
A
A
from AWAfrom LWA
ea Ratio
A
A
from AWAfrom LWA
t –Measure Num
pe Effective P
al Hardscap
AWA LWLZ1 0.020 0LZ2 0.030 0LZ3 0.040 0LZ4 0.050 0
W/sf Wg
y,B
ig B
uild
ing
B-S
quar
e, O
dd
Bui
ldin
g
C- O
dd,
C1,626 471,726 42794 5,131 3,4% 1.1% 7.
020 0.020 0.,033 9,435 8.15 0.15 0019 770 4,052 10,204 1,022 0.022 0..8% 92.5% 652% 7.5% 34
030 0.030 0.,049 14,152 1,.25 0.25 0699 1,283 7,747 15,435 2,033 0.033 0..9% 91.7% 62.1% 8.3% 37
040 0.040 0.,065 18,869 1,.35 0.35 0378 1,796 1,,443 20,665 2,045 0.044 0..4% 91.3% 61.6% 8.7% 38
050 0.050 0.,081 23,586 2,.45 0.45 0057 2,309 1,,139 25,895 3,056 0.055 0..1% 91.1% 60.9% 8.9% 39
mber: 2016-NR-L
Power Dens
pe Effective
WA IWA A.15 340 5.25 420 6.35 520 4.45 640 4
W/ft W
Cam
pus
Bui
ldin
gs
D- L
ong
Ski
nny,
S
mal
l Squ
are
Bui
ldin
g
E-S
quar
e
,828 28,500 21052 960 7.1% 3.4% 3
020 0.020 0.857 570 4.15 0.15 0
458 144 1314 714 5031 0.025 0.
5.2% 79.8% 784.8% 20.2% 21
030 0.030 0.285 855 6.25 0.25 0
763 240 1048 1,095 8048 0.038 0.
2.7% 78.1% 767.3% 21.9% 23
040 0.040 0.713 1,140 8.35 0.35 0068 336 2781 1,476 1,065 0.052 0..6% 77.2% 75
8.4% 22.8% 24
050 0.050 0.141 1,425 1,.45 0.45 0373 432 3515 1,857 1,082 0.065 0.
0.9% 76.7% 759.1% 23.3% 24
2016 Proposed
LTG3-F
sity Calculat
LPA Calcu
AWA LWA L57% 60% 1067% 56% 844% 58% 643% 53% 6
ES
quar
e,S
mal
l Bui
ldin
g
F- O
dd, L
ong
Squ
are
Bui
ldin
g
G-L
ong
Ski
nny
,000 61,798 21760 1,940 1.6% 3.1% 6
.020 0.020 0420 1,236 40.15 0.15 0114 291 2534 1,527 6.025 0.025 08.7% 80.9% 671.3% 19.1% 32
.030 0.030 0630 1,854 60.25 0.25 0190 485 3820 2,339 1.039 0.038 06.8% 79.3% 653.2% 20.7% 35
.040 0.040 0840 2,472 80.35 0.35 0266 679 4,106 3,151 1.053 0.051 05.9% 78.5% 634.1% 21.5% 36
.050 0.050 0,050 3,090 1
0.45 0.45 0342 873 6,392 3,963 1.066 0.064 05.4% 78.0% 634.6% 22.0% 36
tions Results
ulation Resu
LWA00%82%68%62%
GLo
ngS
kinn
y,O
dd B
uild
ing
H- S
quar
e,
Larg
e S
quar
e B
uild
ing
JO
ddLa
rge
1,797 11,040 34,408 1,042 2
6.5% 9.4% 7
.020 0.020 0436 221 60.15 0.15 0211 156 3647 377 1.030 0.034 07.4% 58.6% 642.6% 41.4% 35
.030 0.030 0654 331 10.25 0.25 0352 261 6,006 592 1.046 0.054 05.0% 56.0% 615.0% 44.0% 38
.040 0.040 0872 442 10.35 0.35 0493 365 9,365 806 2.063 0.073 03.9% 54.8% 606.1% 45.2% 39
.050 0.050 0,090 552 1
0.45 0.45 0634 469 1,723 1,021 2.079 0.092 03.2% 54.1% 596.8% 45.9% 40
s
ults
LZ1LZ2LZ3LZ4
J-O
dd,L
arge
Odd
Bui
ldin
g
K- P
erfe
ct
Squ
are
Site
, No
Bui
ldin
g
4,735 250,0002,593 2,0007.5% 0.8%
0.020 0.020695 5,0000.15 0.15389 300,084 5,300 M
0.031 0.021 04.1% 94.3% 75.9% 5.7% 22
0.030 0.030,042 7,500
0.25 0.25648 500,690 8,000 M
0.049 0.032 01.6% 93.8% 78.4% 6.3% 24
0.040 0.040,389 10,000
0.35 0.35908 700
2,297 10,700 M0.066 0.043 00.5% 93.5% 749.5% 6.5% 2
0.050 0.050,737 12,500
0.45 0.45,167 900
2,904 13,400 M0.084 0.054 09.8% 93.3% 740.2% 6.7% 2
2016 PeAWA - No
0.027
W/sf
0.0410.0550.070
P
Mean0.0277.2%2.8%
Mean0.0415.5%4.5%
Mean0.0554.7%5.3%
Mean0.0704.2%5.8%
ProposedIWA eAWA - With
0.037
W/sf
0.0530.0680.089
Page 68
h IWA

2016 Title 24 CASE Report –Measure Number: 2016-NR-LTG3-F Page 69
Figure 15: General Hardscape Effective LPA Calculation Results (continued)
Figure 16: General Hardscape Effective Watts Per Square Foot LPA Adjustment Results based on Nine Prototype Properties
W/sf 0.050 0.050 0.050 0.050 0.050 0.050 0.050 0.050 0.050 0.050W 25,081 23,586 2,141 1,425 1,050 3,090 1,090 552 1,737 12,500W/lf 0.05 0.05 0.05 0.05 0.05 0.05 0.05 0.05 0.05 0.05W 340 257 153 48 38 97 70 52 130 100
IWA W 520 520 520 520 520 520 520 520 520 520TOTAL W 25,941 24,363 2,814 1,993 1,608 3,707 1,680 1,124 2,386 13,120 MeanLPD W/sf 0.052 0.052 0.066 0.070 0.077 0.060 0.077 0.102 0.069 0.052 0.068
96.7% 96.8% 76.1% 71.5% 65.3% 83.4% 64.9% 49.1% 72.8% 95.3% 77.2%1.3% 1.1% 5.4% 2.4% 2.4% 2.6% 4.2% 4.6% 5.4% 0.8% 3.0%2.0% 2.1% 18.5% 26.1% 32.3% 14.0% 30.9% 46.3% 21.8% 4.0% 19.8%
W/sf 0.050 0.050 0.050 0.050 0.050 0.050 0.050 0.050 0.050 0.050W 25,081 23,586 2,141 1,425 1,050 3,090 1,090 552 1,737 12,500W/lf 0.45 0.45 0.45 0.45 0.45 0.45 0.45 0.45 0.45 0.45W 3,057 2,309 1,373 432 342 873 634 469 1,167 900
IWA W 640 640 640 640 640 640 640 640 640 640TOTAL W 28,779 26,535 4,155 2,497 2,032 4,603 2,363 1,661 3,544 14,040 MeanLPD W/sf 0.057 0.056 0.097 0.088 0.097 0.074 0.108 0.150 0.102 0.056 0.089
87.2% 88.9% 51.5% 57.1% 51.7% 67.1% 46.1% 33.2% 49.0% 89.0% 62.1%10.6% 8.7% 33.1% 17.3% 16.8% 19.0% 26.8% 28.2% 32.9% 6.4% 20.0%2.2% 2.4% 15.4% 25.6% 31.5% 13.9% 27.1% 38.5% 18.1% 4.6% 17.9%
AWA
LWA
%W from AWA%W from LWA
AWA
LWA
%W from AWA%W from LWA%W from IWA
LZ3
LZ4
%W from IWA
Site Description
A- L
ong
Skin
ny, B
ig
Build
ing
B-Sq
uare
, Odd
Bu
ildin
g
C- O
dd, C
ampu
s Bu
ildin
gs
D- L
ong
Skin
ny, S
mal
l Sq
uare
Bui
ldin
g
E- S
quar
e, S
mal
l Bu
ildin
g
F- O
dd, L
ong
Squa
re
Build
ing
G- L
ong
Skin
ny, O
dd
Build
ing
H- S
quar
e, L
arge
Sq
uare
Bui
ldin
g
J- O
dd, L
arge
Odd
Bu
ildin
g
K- P
erfe
ct S
quar
e Si
te,
No B
uild
ing
Area, [sf] 501,626 471,726 42,828 28,500 21,000 61,798 21,797 11,040 34,735 250,000Perimeter, [sf] 6,794 5,131 3,052 960 760 1,940 1,408 1,042 2,593 2,000Perimeter to Area Ratio 1.4% 1.1% 7.1% 3.4% 3.6% 3.1% 6.5% 9.4% 7.5% 0.8%
Title 24 - 2013LZ1 0.038 0.038 0.053 0.043 0.044 0.043 0.051 0.059 0.054 0.037 0.046LZ2 0.051 0.050 0.077 0.060 0.061 0.059 0.074 0.087 0.079 0.049 0.065LZ3 0.098 0.097 0.133 0.110 0.112 0.109 0.129 0.147 0.135 0.095 0.116LZ4 0.127 0.124 0.176 0.144 0.146 0.142 0.170 0.195 0.178 0.122 0.152
Title 24 - 2016LZ1 0.022 0.022 0.031 0.025 0.025 0.025 0.030 0.034 0.031 0.021 0.027LZ2 0.033 0.033 0.048 0.038 0.039 0.038 0.046 0.054 0.049 0.032 0.041LZ3 0.045 0.044 0.065 0.052 0.053 0.051 0.063 0.073 0.066 0.043 0.055LZ4 0.056 0.055 0.082 0.065 0.066 0.064 0.079 0.092 0.084 0.054 0.070
Aver
age
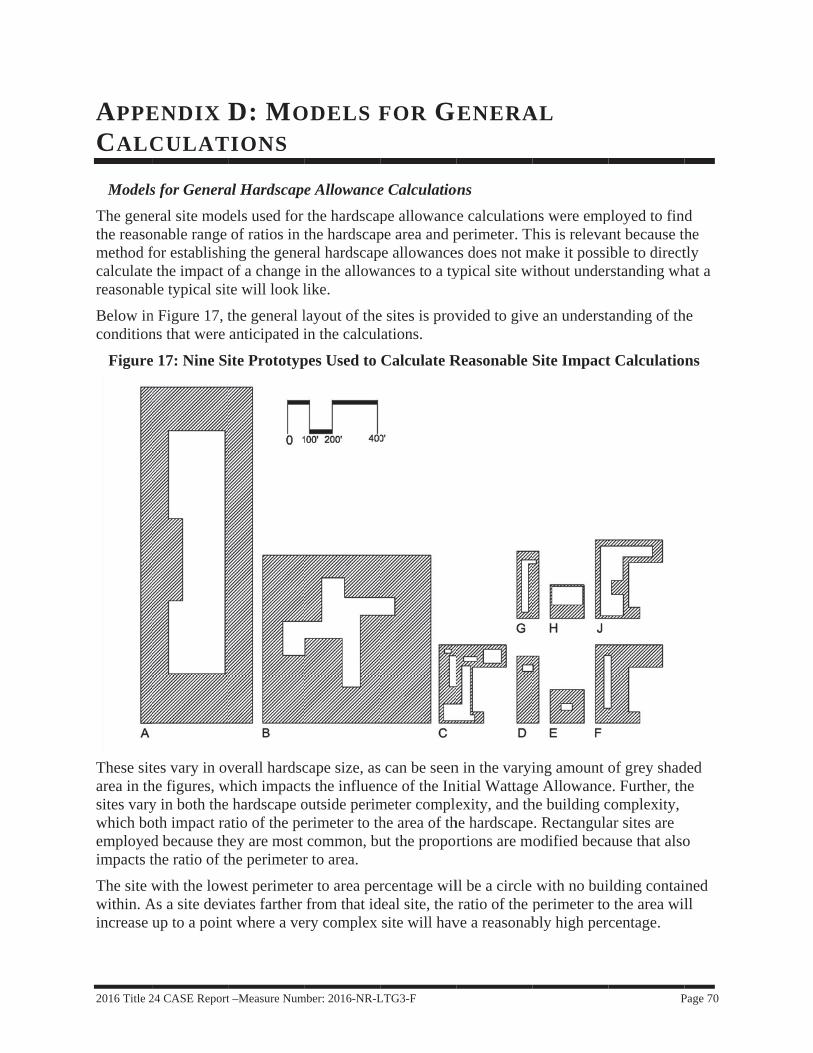
2016 Title 2
APPECALC
ModelsThe genethe reasomethod fcalculatereasonab
Below incondition
Figure
These sitarea in thsites varywhich boemployedimpacts t
The site wwithin. Aincrease
24 CASE Report
ENDIXCULAT
s for Generaeral site modonable range for establishi the impact ole typical sit
n Figure 17, tns that were
e 17: Nine Si
tes vary in ovhe figures, wy in both theoth impact rad because ththe ratio of th
with the lowAs a site deviup to a point
t –Measure Num
D: MOTIONS
al Hardscapdels used for
of ratios in ting the generof a change te will look l
the general lanticipated i
ite Prototyp
verall hardscwhich impact
hardscape oatio of the pehey are most he perimeter
west perimeteiates farther t where a ve
mber: 2016-NR-L
ODELS F
e Allowancethe hardscapthe hardscapral hardscapin the allowlike.
layout of thein the calcul
pes Used to
cape size, asts the influenoutside perimerimeter to thcommon, bu
r to area.
er to area perfrom that id
ery complex
LTG3-F
FOR G
e Calculatiope allowancpe area and ppe allowanceances to a ty
e sites is provlations.
Calculate R
s can be seennce of the Inimeter complehe area of thut the propor
rcentage wildeal site, the site will hav
ENERA
onse calculationperimeter. Thes does not mypical site w
vided to give
Reasonable
n in the varyiitial Wattageexity, and th
he hardscapertions are m
ll be a circle ratio of the p
ve a reasonab
AL
ns were emphis is releva
make it possiwithout under
e an underst
Site Impact
ing amount oe Allowance
he building ce. Rectangula
modified beca
with no buiperimeter tobly high per
P
ployed to finant because thible to directrstanding wh
tanding of th
t Calculatio
of grey shade. Further, thcomplexity, ar sites are ause that also
ilding contaio the area wilcentage.
Page 70
d he tly hat a
he
ns
ded he
o
ined ll

2016 Title 2
The effecshown instatewide
ModelsThere aredesign ofapproachefficacy, have cost
The secothe LPA Most of tof using L
Figure 18costing c
FigureSystem
24 CASE Report
ctive site caln Figure 17. Te impacts ca
s for Cost Efe two methof a lighting sh is valid in a
but also in tt implication
ond is a one-fvalues of spthese applicaLED produc
8 below, procomparisons
e 18: Three ms
t –Measure Num
lculation for The averagelculations.
ffectivenessds used to m
system, whica circumstanterms of somns independe
for-one compecific applications are uncts, so the co
ovides the sitfor the gene
Site Prototy
mber: 2016-NR-L
the general e of these site
Calculationmake cost effch was emplonce where theme other aspeent of the eff
mparison of lications, like nlikely to redomparison w
te geometry eral hardscap
ypes Used to
LTG3-F
hardscape rees is used to
nsfectiveness coyed for thee LED technect, like poleficacy issues
ighting equipthe lighting
duce the equwas done usin
for three apppe cost effec
o Calculate
epresents an represent a
calculations. general har
nology is a be spacing or s.
pment. This at building
uipment quanng a one-for-
plications thctiveness calc
Cost Calcu
n average of typical site
The first is rdscape calcubenefit not onpole height,
approach wentrances, fontity substan-one compar
hat were usedculations.
ulations for L
P
the nine sitefor per unit
the completulations. Thinly in terms , which will
was employedor example. ntially as a rerison.
d to make
LED Lighti
Page 71
es and
te is of
d for
esult
ing
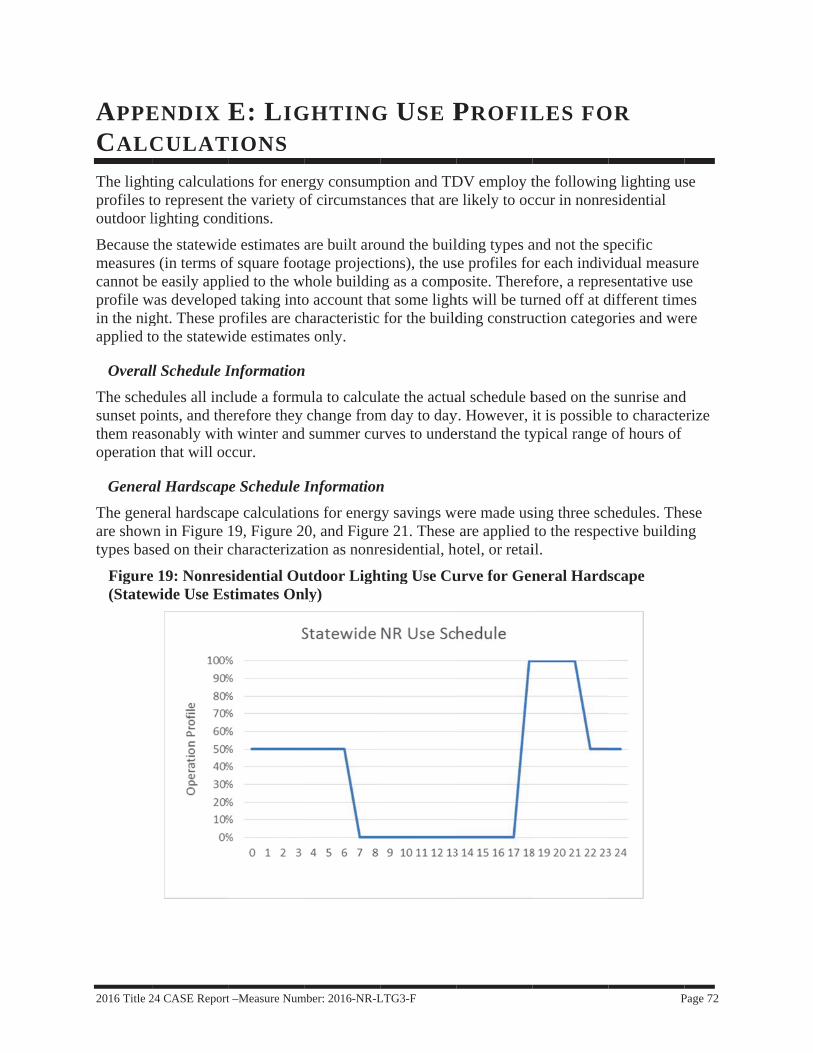
2016 Title 2
APPECALC
The lightprofiles toutdoor l
Because measurescannot beprofile win the nigapplied to
OveralThe schesunset pothem reasoperation
GeneraThe geneare showtypes bas
Figure(Statew
24 CASE Report
ENDIXCULAT
ting calculatto represent tlighting cond
the statewids (in terms oe easily appl
was developeght. These pro the statewi
ll Schedule Iedules all incoints, and thesonably withn that will oc
al Hardscaperal hardscap
wn in Figure sed on their c
e 19: Nonreswide Use Es
t –Measure Num
E: LIGTIONS
ions for enerthe variety oditions.
de estimates f square foolied to the wd taking intorofiles are chide estimate
Informationclude a formuerefore they h winter andccur.
pe Schedule Ipe calculatio19, Figure 2characterizat
sidential Oustimates On
mber: 2016-NR-L
GHTING
rgy consumpof circumstan
are built arotage projecti
whole buildino account thaharacteristic s only.
nula to calculchange from
d summer cur
Informationons for energ0, and Figurtion as nonre
utdoor Lighly)
LTG3-F
G USE P
ption and TDnces that are
ound the builions), the us
ng as a compat some lighfor the build
late the actuam day to dayrves to unde
ngy savings wre 21. These esidential, h
hting Use Cu
PROFIL
DV employ te likely to oc
lding types ase profiles foposite. Therehts will be tuding constru
al schedule by. However, erstand the ty
were made usare applied
hotel, or retai
urve for Gen
LES FO
the followinccur in nonre
and not the sor each indivefore, a repreurned off at duction catego
based on theit is possibleypical range
sing three schto the respecil.
neral Hards
P
OR
ng lighting usesidential
specific vidual measuesentative usdifferent timeories and we
e sunrise ande to characteof hours of
hedules. Thective buildin
scape
Page 72
se
ure se es re
d erize
ese ng

2016 Title 2
FigureEstima
FigureEstima
SpecifiThe specbelow. Tnarrowly
24 CASE Report
e 20: Hotel Oates Only)
e 21: Retail Oates Only)
ic Lighting Acific applicathe specific l
y focused on
t –Measure Num
Outdoor Lig
Outdoor Li
Application tions calculalighting appla small subs
mber: 2016-NR-L
ghting Use C
ighting Use
Schedule Inations for enelications are set of lightin
LTG3-F
Curve for G
Curve for G
nformationergy savingsnot represen
ng on a site.
General Har
General Har
s were made ntative of a l
rdscape (Sta
rdscape (St
using schedlarge site, bu
P
atewide Use
tatewide Use
dules provideut more
Page 73
e
e
ed
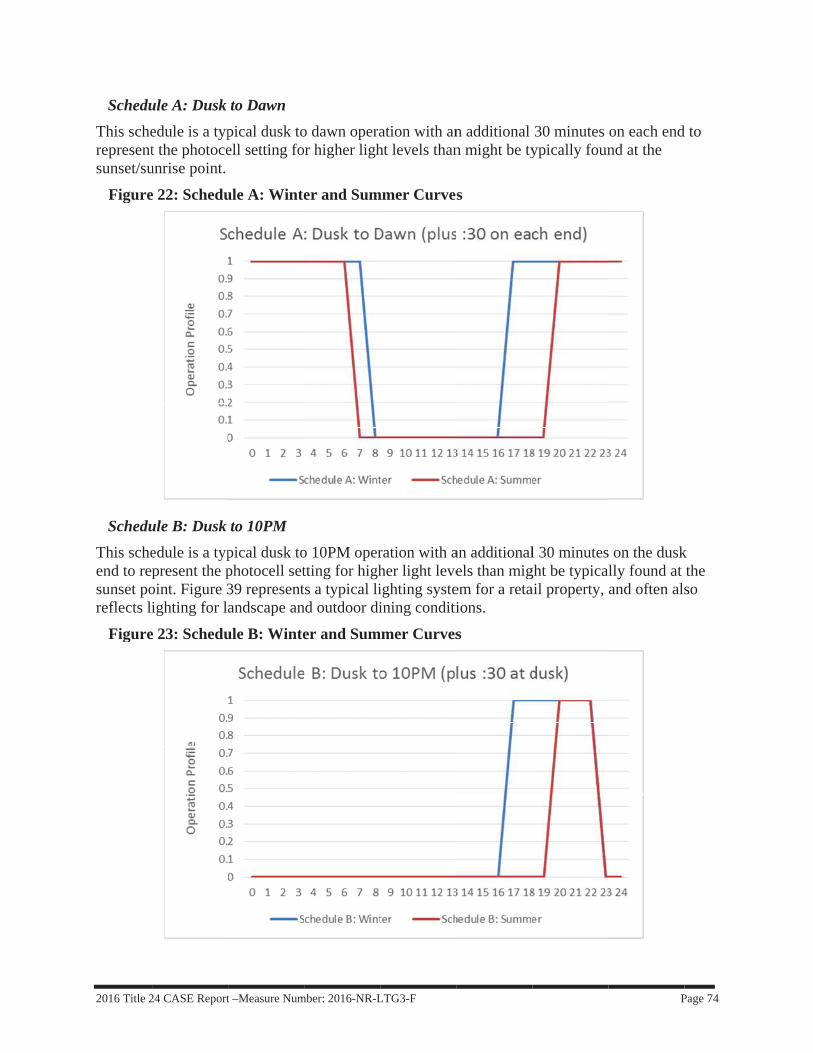
2016 Title 2
ScheduThis scherepresentsunset/su
Figure
ScheduThis scheend to repsunset poreflects li
Figure
24 CASE Report
ule A: Dusk edule is a typt the photoceunrise point.
e 22: Schedu
ule B: Dusk edule is a typpresent the p
oint. Figure 3ighting for la
e 23: Schedu
t –Measure Num
to Dawn pical dusk toell setting fo
ule A: Winte
to 10PM pical dusk tophotocell set39 representandscape an
ule B: Winte
mber: 2016-NR-L
o dawn operar higher ligh
er and Sum
o 10PM opertting for hights a typical lind outdoor di
er and Sum
LTG3-F
ation with anht levels than
mmer Curve
ration with aher light leveighting systeining conditi
mmer Curves
n additional n might be ty
s
an additionalels than migem for a retaions.
s
30 minutes ypically foun
l 30 minutesght be typicaail property,
P
on each endnd at the
s on the dusklly found at and often als
Page 74
d to
k the so
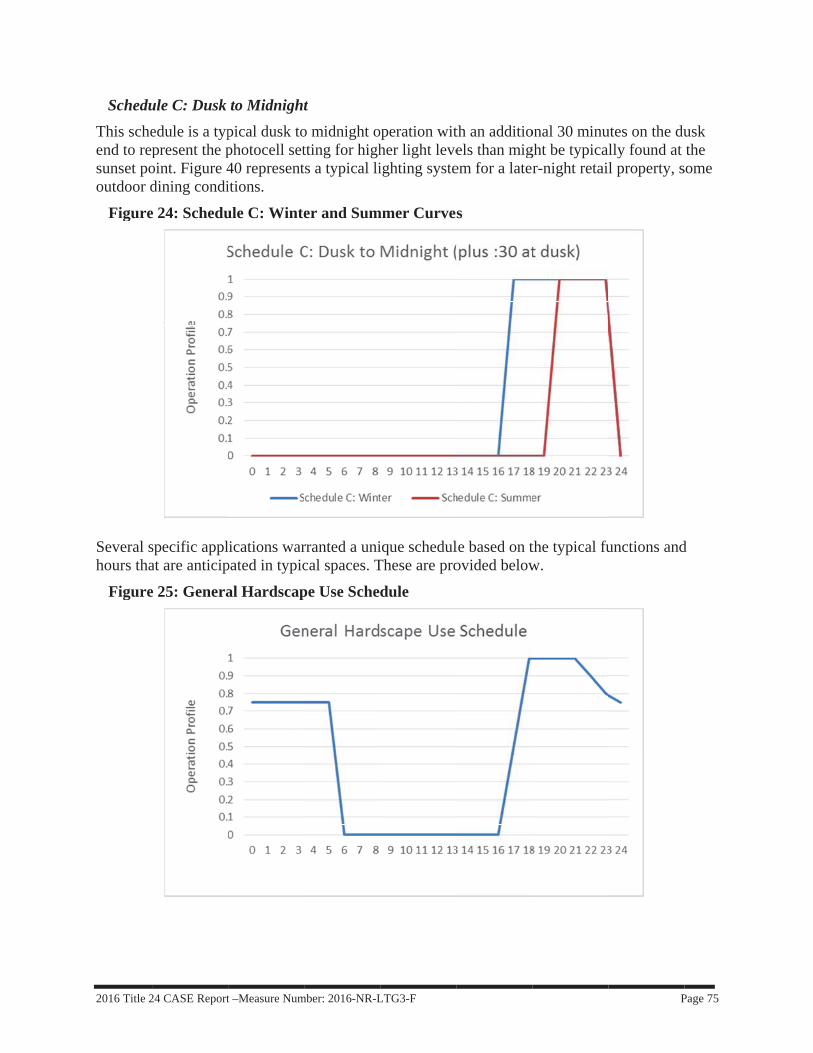
2016 Title 2
ScheduThis scheend to repsunset pooutdoor d
Figure
Several shours tha
Figure
24 CASE Report
ule C: Dusk edule is a typpresent the p
oint. Figure 4dining condi
e 24: Schedu
specific applat are anticip
e 25: Genera
t –Measure Num
to Midnightpical dusk tophotocell set40 representitions.
ule C: Winte
lications warpated in typic
al Hardscap
mber: 2016-NR-L
to midnight otting for hights a typical li
er and Sum
rranted a unical spaces. T
pe Use Sche
LTG3-F
operation wither light leveighting syste
mmer Curve
ique schedulThese are pro
dule
th an additioels than migem for a later
s
le based on tovided below
onal 30 minught be typicar-night retai
the typical fuw.
P
utes on the dully found at l property, s
unctions and
Page 75
usk the
some
d
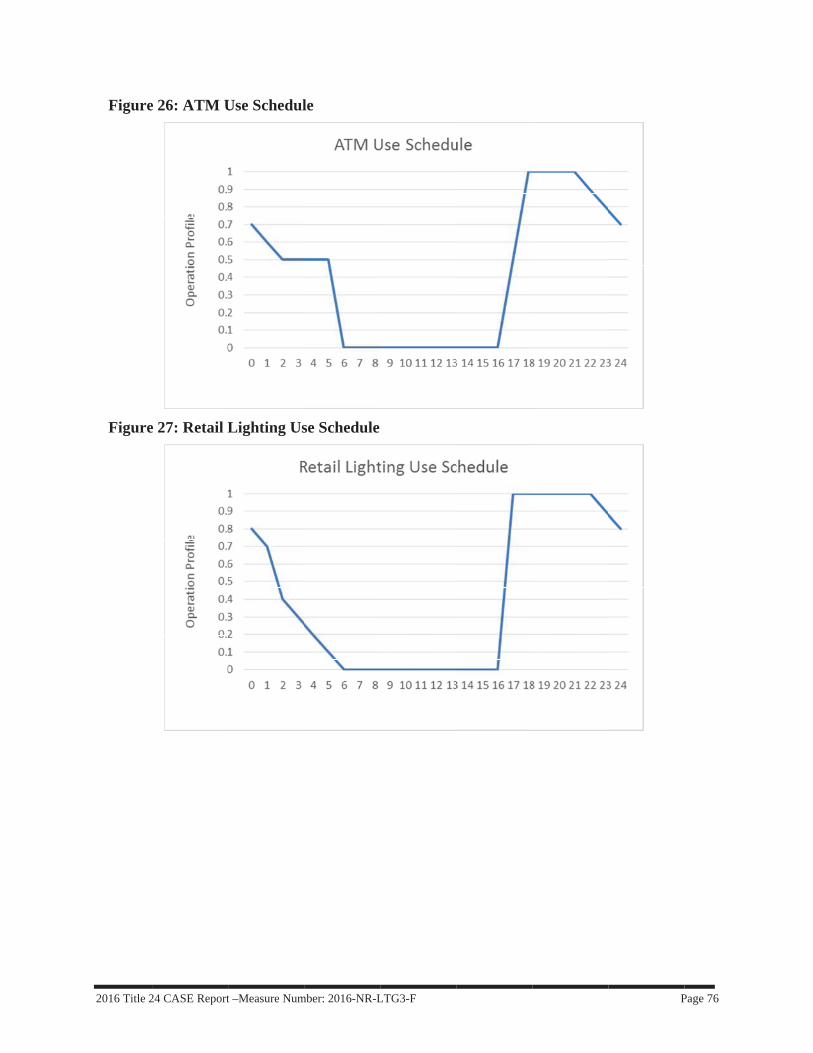
2016 Title 2
Figure
Figure
24 CASE Report
e 26: ATM U
e 27: Retail L
t –Measure Num
Use Schedul
Lighting Us
mber: 2016-NR-L
le
se Schedule
LTG3-F
P
Page 76
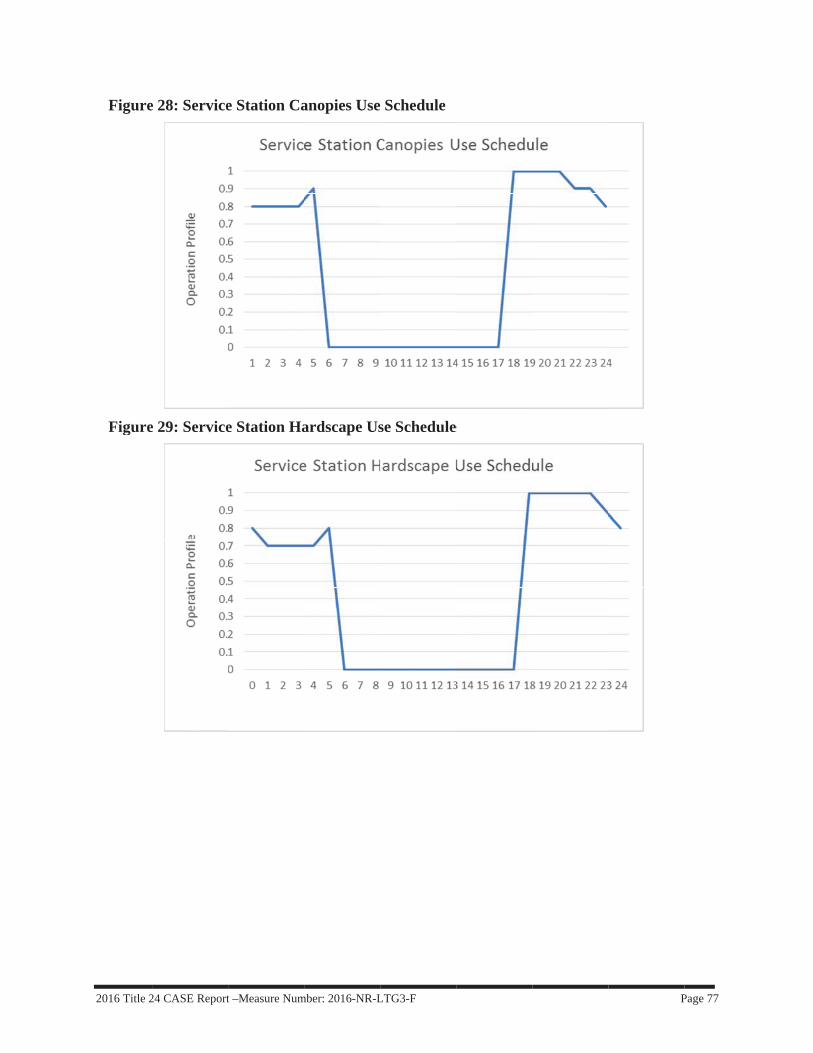
2016 Title 2
Figure
Figure
24 CASE Report
e 28: Service
e 29: Service
t –Measure Num
e Station Ca
e Station Ha
mber: 2016-NR-L
anopies Use
ardscape Us
LTG3-F
Schedule
se Schedulee
P
Page 77

2016 Title 24 CASE Report –Measure Number: 2016-NR-LTG3-F Page 78
Figure 30 provides information on the various outdoor lighting applications that are designated in the LPA tables and identifies which of the above schedules are applied to these for energy consumption and cost effectiveness calculations.
Figure 30: Lighting Application Schedule Use Matrix Lighting Application Use Schedule Applied
General Hardscape General Hardscape Building Entrances Schedule A Primary Entrances Schedule A Drive Up Windows Retail Lighting
Vehicle Service Uncovered Fuel Dispenser Schedule A ATM Machine ATM
Outdoor Sales Frontage Schedule C Hardscape Ornamental Lighting Schedule C
Building Facades Retail Lighting Outdoor Sales Lots Retail Lighting
Vehicle Service Station Hardscape Service Station Hardscape
Vehicle Service Station Canopies Service Station Canopies Sales Canopies Retail Lighting
Non-sales Canopies Schedule A Guard Stations Schedule A
Student Pick-up/Drop-off Zone Schedule B Outdoor Dining Schedule B
Special Security Lighting for Retail Schedule A

2016 Title 24 CASE Report –Measure Number: 2016-NR-LTG3-F Page 79
APPENDIX F: GENERAL HARDSCAPE COST EFFECTIVENESS CALCULATIONS
The tables below provide the details of the cost calculation runs for the general hardscape cost effectiveness calculations.
The information was collected by polling manufacturer representatives and producing a reasonable average for similarly-specified products, including Type III and Type IV luminaires and those with house-side shields (designated as (HS) in the Item labels.
The cost for the products is based on current pricing, and projects forward to 2017 through cost escalation. The LED products are projected forward in efficacy, with Columns 3 through 5 (lm, 2014 $/kms, and 2017$/klm) predicting the cost per lumen of the product based on the DOE cost projections. The result is Column 6, which shows the 2017 cost of the luminaires.
Column 7 (2017 Cost with Installation) adds the projected cost of installation based on Means cost estimations and cost escalation. The final column projects the cost of the product if the current LED technology were employed in 2017, with no cost per lumen savings due to the rapidly advancing LED technology.
Figure 31: Luminaire Costs for Construction, Based on Factory Representative Quotes and Adjusted Forward
Item 2014Cost lm 2014 $/kms 2017 $/klm** 2017 Cost***2017 Cost withInstallation*
2017 Cost without$/Klm Reduction
PSMH, Small (HS) 887.5$ 944.59$ 1,086.28$ 1,086.28$PSMH, Small 846.0$ 900.43$ 1,035.49$ 1,035.49$PSMH, Large (HS) 1,161.5$ 1,236.22$ 1,421.66$ 1,421.66$PSMH, Large 1,079.0$ 1,148.41$ 1,320.68$ 1,320.68$LED, Small (HS) 1,068.0$ 4,319 247.28$ 173.10$ 859.74$ 988.70$ 1,307.21$LED, Small 1,056.0$ 5,129 205.89$ 144.12$ 850.08$ 977.59$ 1,292.53$LED, Medium (HS) 1,675.0$ 9,487 176.56$ 123.59$ 1,348.38$ 1,550.63$ 2,050.17$LED, Medium 1,663.0$ 10,705 155.35$ 108.74$ 1,338.72$ 1,539.52$ 2,035.48$LED, Large OPT1 (HS) 1,675.0$ 15,790 106.08$ 74.26$ 1,348.38$ 1,550.63$ 2,050.17$LED, Large OPT1 1,663.0$ 17,928 92.76$ 64.93$ 1,338.72$ 1,539.52$ 2,035.48$25ft Pole 829.0$ 882.33$ 1,014.68$ 1,014.68$30ft Pole 1,045.0$ 1,112.23$ 1,279.06$ 1,279.06$35ft Pole OPT1 1,304.0$ 1,387.89$ 1,596.07$ 1,596.07$PSMH, Wall Pack 322.0$ 342.71$ 394.12$ 394.12$LED, Large OPT2 1,366.0$ 11,294 120.95$ 84.66$ 1,099.63$ 1,264.57$ 1,671.96$35ft Pole OPT2 1,516.0$ 1,613.53$ 1,855.56$ 1,855.56$39ft Pole OPT2 1,874.0$ 1,994.56$ 2,293.74$ 2,293.74$
Notes:*Installation Mark Up 0.15**2017 LED Cost 0.3**2017 LED Source Report_SSL Trend Analysis 2013.pdf, Executive Summary***Retail Rate Escalation 0.021***Retail Rate Source Title24_2013_TDV_Methodology_Report_23Feb2011.pdf, Retail Rate Escalation

2016 Title 24 CASE Report –Measure Number: 2016-NR-LTG3-F Page 80
Figure 32: Itemized Costs for Construction, Based on RS Means and Adjusted Forward
The cost estimating process involves producing a design on each lot in order to develop the quantities of equipment needed to meet the IES design criteria for each scenario. These lighting designs are also put through an electrical design step to predict the cost implications of the electrical supply system, since this is a substantial portion of the total cost of a parking lot lighting design. The quantity take-offs of the lighting and electrical systems are built upon the information visible in Figure 32 above and are shown in summary form in the following Tables.
Conduit orMat. Fittings Boxes Trenching %
2012 SubTotal
1/2" EMTw/fittings and boxes 3.13 0.757 0.305 1.312 4.19$ 5.50$ 5.73$ 6.10$3/4" Sched 80 PVC w/box 300' 4.11 1.048 1.000 8.95 1.312 15.11$ 19.82$ 20.66$ 21.99$1" Sched 80 PVC w/box 300' 5.43 1.175 1.000 8.95 1.312 16.56$ 21.72$ 22.64$ 24.10$1 1/4" Sched 80 PVC w/box 300' 6.95 1.301 1.333 8.95 1.312 18.53$ 24.32$ 25.35$ 26.98$1 1/2" Sched 80 PVC w/box 300' 7.75 1.447 1.667 8.95 1.312 19.81$ 26.00$ 27.10$ 28.84$2" Sched 80 PVC w/box 300' 10.07 1.724 2.000 8.95 1.312 22.74$ 29.84$ 31.11$ 33.11$THWN #12AWGCU 0.5185 1.312 0.52$ 0.68$ 0.71$ 0.75$THWN #10AWGCU 0.63 1.312 0.63$ 0.83$ 0.86$ 0.92$THWN #8AWGCU 0.85 1.312 0.85$ 1.12$ 1.16$ 1.24$THWN #6AWGCU 1.21 1.312 1.21$ 1.59$ 1.65$ 1.76$THWN #4AWGCU 1.68 1.312 1.68$ 2.20$ 2.30$ 2.45$THWN #3AWGCU 1.965 1.312 1.97$ 2.58$ 2.69$ 2.86$THWN #2AWGCU 2.345 1.312 2.35$ 3.08$ 3.21$ 3.41$FOUNDATIONS (Mat. & Labor)Foundation 25' pole CDOT 575 75 420.15 1.242 1,070.15$ 1,329.13$ 1,385.54$ 1,474.67$Foundation 30' pole CDOT 637 75 495 1.242 1,207.00$ 1,499.09$ 1,562.72$ 1,663.25$Foundation 35' pole CDOT 762 75 619 1.242 1,456.00$ 1,808.35$ 1,885.10$ 2,006.37$Foundation 39' pole CDOT 762 75 619 1.242 1,456.00$ 1,808.35$ 1,885.10$ 2,006.37$LIGHT STANDARDPOLES (Labor Only)Light Standard 25' pole 451 1.312 451.00$ 591.71$ 616.82$ 656.51$Light Standard 30' pole 502.6 1.312 502.60$ 659.41$ 687.40$ 731.62$Light Standard 35' pole 525 1.312 525.00$ 688.80$ 718.03$ 764.23$Light Standard 39' pole 678 1.312 678.00$ 889.54$ 927.29$ 986.94$LUMINAIRES (Labor Only)70WPSMH, Small 33 1.312 33.00$ 43.30$ 45.13$ 48.04$PSMHWallpack 33 1.312 33.00$ 43.30$ 45.13$ 48.04$100WPSMH, Small 39.5 1.312 39.50$ 51.82$ 54.02$ 57.50$150WPSMH, Small 103 1.312 103.00$ 135.14$ 140.87$ 149.93$400WPSMH, Large 103 1.312 103.00$ 135.14$ 140.87$ 149.93$LED, Small 33 1.312 33.00$ 43.30$ 45.13$ 48.04$LED, Medium 103 1.312 103.00$ 135.14$ 140.87$ 149.93$LED, Large OPT1 103 1.312 103.00$ 135.14$ 140.87$ 149.93$PULL BOXES (Polymer Concrete Tier22)11"x18"x12"Dp. Bottomless 475 375 1.312 850.00$ 1,115.20$ 1,162.53$ 1,237.32$PANEL BOARD ADDER100A 120/240V 1PH, 30 POLE 1975 500 1.312 2,475.00$ 3,247.20$ 3,385.01$ 3,602.78$
2012Means
ITEM 2012 Cost 2014 Cost 2017 Cost
San Fancisco Adder

2016 Title 24 CASE Report –Measure Number: 2016-NR-LTG3-F Page 81
Figure 33: Costing Calculations for LZ1 of Real Site Design Small Parking Small Parking
Item Quantity 2014 Cost 2017Cost 2017 Total Cost Item Quantity 2014 Cost 2017CostCost, $/Klm
CostCost,
withoutPSMH, Small (HS) 7 888$ 1,086$ 7,604$ LED, Small (HS) 4 1,068$ 989$ 3,955$ 5,229$Labor, Luminaire 7 45$ 48$ 336$ Labor, Luminaire 4 45$ 48$ 192$ 192$25ft Pole 7 829$ 1,015$ 7,103$ 25ft Pole 4 829$ 1,015$ 4,059$ 4,059$Labor, Pole 7 617$ 657$ 4,596$ Labor, Pole 4 617$ 657$ 2,626$ 2,626$Foundation 7 1,386$ 1,475$ 10,323$ Foundation 4 1,386$ 1,475$ 5,899$ 5,899$Conduit 3/4"PVC 605 21$ 22$ 13,305$ Conduit 3/4"PVC 425 21$ 22$ 9,347$ 9,347$Wiring #10AWGCU 1685 1$ 1$ 1,545$ Wiring #12AWGCU 1975 1$ 1$ 1,491$ 1,491$
Total 44,812$ Total 27,568$ 28,842$
Medium Parking Medium Parking
Item Quantity 2014 Cost 2017Cost 2017 Total Cost Item Quantity 2014 Cost 2017CostCost, $/Klm
CostCost,
withoutPSMH, Small (HS) 6 888$ 1,086$ 6,518$ LED, Small (HS) 3 1,068$ 989$ 2,966$ 3,922$PSMH, Small 12 846$ 1,035$ 12,426$ LED, Small 8 1,056$ 978$ 7,821$ 10,340$Labor, Luminaire 18 45$ 48$ 865$ Labor, Luminaire 11 45$ 48$ 528$ 528$PSMH, Wall Pack 3 322$ 394$ 1,182$ 25ft Pole 7 829$ 1,015$ 7,103$ 7,103$Labor, Luminaire 3 45$ 48$ 144$ Labor, Pole 7 617$ 657$ 4,596$ 4,596$25ft Pole 12 829$ 1,015$ 12,176$ Foundation 7 1,386$ 1,475$ 10,323$ 10,323$Labor, Pole 12 617$ 657$ 7,878$ Conduit 1"PVC 620 23$ 24$ 14,941$ 14,941$Foundation 12 1,386$ 1,475$ 17,696$ Wiring #8 AWGCU 3050 1$ 1$ 3,774$ 3,774$Conduit 1 1/2"PVC 910 27$ 29$ 26,246$ Total 33,336$ 55,526$Conduit 1/2"EMT 150 6$ 6$ 915$Wiring #4 AWGCU 3590 2$ 2$ 8,779$Wiring #12AWGCU 620 1$ 1$ 468$
Total 95,294$
Large Parking Large Parking
Item Quantity 2014 Cost 2017Cost 2017 Total Cost Item Quantity 2014 Cost 2017CostCost, $/Klm
CostCost,
withoutPSMH, Small (HS) 24 888$ 1,086$ 26,071$ LED, Small 56 1,056$ 978$ 54,745$ 72,381$PSMH, Small 42 846$ 1,035$ 43,491$ Labor, Luminaire 56 45$ 48$ 2,690$ 2,690$Labor, Luminaire 66 45$ 48$ 3,170$ 25ft Pole 35 829$ 1,015$ 35,514$ 35,514$30ft Pole 45 1,045$ 1,279$ 57,558$ Labor, Pole 35 617$ 657$ 22,978$ 22,978$Labor, Pole 45 687$ 732$ 32,923$ Foundation 35 1,386$ 1,475$ 51,613$ 51,613$Foundation 45 1,563$ 1,663$ 74,846$ Conduit 2"PVC 2580 31$ 33$ 85,418$ 85,418$Conduit 2"PVC 3090 31$ 33$ 102,303$ Wiring #6 AWGCU 13580 2$ 2$ 23,919$ 23,919$Wiring #4 AWGCU 15887 2$ 2$ 38,852$ Total 276,877$ 294,514$
Total 379,214$

2016 Title 24 CASE Report –Measure Number: 2016-NR-LTG3-F Page 82
Figure 34: Costing Calculations for LZ2 of Real Site Design
Small Parking Small Parking
Item Quantity 2014 Cost 2017Cost 2017 Total Cost Item Quantity 2014 Cost 2017CostCost, $/Klm
CostCost,
withoutPSMH, Small (HS) 7 888$ 945$ 6,612$ LED, Small (HS) 4 1,068$ 989$ 3,955$ 5,229$Labor, Luminaire 7 45$ 48$ 336$ Labor, Luminaire 4 45$ 48$ 192$ 192$25ft Pole 7 829$ 1,015$ 7,103$ 25ft Pole 4 829$ 1,015$ 4,059$ 4,059$Labor, Pole 7 617$ 657$ 4,596$ Labor, Pole 4 617$ 657$ 2,626$ 2,626$Foundation 7 1,386$ 1,475$ 10,323$ Foundation 4 1,386$ 1,475$ 5,899$ 5,899$Conduit 3/4"PVC 605 21$ 22$ 13,305$ Conduit 3/4"PVC 425 21$ 22$ 9,347$ 9,347$Wiring #10AWGCU 1685 1$ 1$ 1,545$ Wiring #12AWGCU 1975 1$ 1$ 1,491$ 1,491$
Total 43,820$ Total 27,568$ 28,842$
Medium Parking Medium Parking
Item Quantity 2014 Cost 2017Cost 2017 Total Cost Item Quantity 2014 Cost 2017CostCost, $/Klm
CostCost,
withoutPSMH, Small (HS) 6 888$ 1,086$ 6,518$ LED, Small (HS) 3 1,068$ 989$ 2,966$ 3,922$PSMH, Small 12 846$ 1,035$ 12,426$ LED, Small 8 1,056$ 978$ 7,821$ 10,340$Labor, Luminaire 18 45$ 48$ 865$ Labor, Luminaire 11 45$ 48$ 528$ 528$PSMH, Wall Pack 2 322$ 394$ 788$ 25ft Pole 7 829$ 1,015$ 7,103$ 7,103$Labor, Luminaire 2 45$ 48$ 96$ Labor, Pole 7 617$ 657$ 4,596$ 4,596$25ft Pole 12 829$ 1,015$ 12,176$ Foundation 7 1,386$ 1,475$ 10,323$ 10,323$Labor, Pole 12 617$ 657$ 7,878$ Conduit 1"PVC 620 23$ 24$ 14,941$ 14,941$Foundation 12 1,386$ 1,475$ 17,696$ Wiring #8 AWGCU 3050 1$ 1$ 3,774$ 3,774$Conduit 1 1/2"PVC 910 27$ 29$ 26,246$ Total 33,336$ 55,526$Conduit 1/2"EMT 150 6$ 6$ 915$Wiring #4 AWGCU 3590 2$ 2$ 8,779$Wiring #12AWGCU 620 1$ 1$ 468$
Total 94,852$
Large Parking Large Parking
Item Quantity 2014 Cost 2017Cost 2017 Total Cost Item Quantity 2014 Cost 2017CostCost, $/Klm
CostCost,
withoutPSMH, Small (HS) 16 888$ 945$ 15,114$ LED, Small 56 1,056$ 978$ 54,745$ 72,381$PSMH, Small 42 846$ 1,035$ 43,491$ Labor, Luminaire 56 45$ 48$ 2,690$ 2,690$Labor, Luminaire 58 54$ 57$ 3,335$ 25ft Pole 35 829$ 1,015$ 35,514$ 35,514$25ft Pole 37 829$ 1,015$ 37,543$ Labor, Pole 35 617$ 657$ 22,978$ 22,978$Labor, Pole 37 617$ 657$ 24,291$ Foundation 35 1,386$ 1,475$ 51,613$ 51,613$Foundation 37 1,386$ 1,475$ 54,563$ Conduit 2"PVC 2580 31$ 33$ 85,418$ 85,418$Conduit 2"PVC 2875 31$ 33$ 95,185$ Wiring #6 AWGCU 13580 2$ 2$ 23,919$ 23,919$Wiring #4 AWGCU 13935 2$ 2$ 34,078$ Total 276,877$ 294,514$
Total 307,599$

2016 Title 24 CASE Report –Measure Number: 2016-NR-LTG3-F Page 83
Figure 35: Costing Calculations for LZ3 of Real Site Design
Small Parking Small Parking LED
Item Quantity 2014 Cost 2017Cost 2017 Total Cost Item Quantity 2014 Cost 2017Cost
2017 TotalCost, $/Klm
CostReduction
2017 TotalCost,
without$/Klm
ReductionPSMH, Small (HS) 7 888$ 1,086$ 7,604$ LED, Medium (HS) 4 1,675$ 1,551$ 6,203$ 8,201$Labor, Luminaire 7 141$ 150$ 1,050$ Labor, Luminaire 4 54$ 57$ 230$ 230$30ft Pole 7 1,045$ 1,279$ 8,953$ 30ft Pole 4 1,045$ 1,279$ 5,116$ 5,116$Labor, Pole 7 687$ 732$ 5,121$ Labor, Pole 4 687$ 732$ 2,926$ 2,926$Foundation 7 1,563$ 1,663$ 11,643$ Foundation 4 1,563$ 1,663$ 6,653$ 6,653$Conduit 1"PVC 605 23$ 24$ 14,580$ Conduit 3/4"PVC 360 21$ 22$ 7,917$ 7,917$Wiring #8AWGCU 1685 1$ 1$ 2,085$ Wiring #12AWGCU 1350 1$ 1$ 1,019$ 1,019$
Total 51,036$ Total 30,064$ 32,063$
Medium Parking Medium Parking LED
Item Quantity 2014 Cost 2017Cost 2017 Total Cost Item Quantity 2014 Cost 2017Cost
2017 TotalCost, $/Klm
CostReduction
2017 TotalCost,
without$/Klm
ReductionPSMH, Small (HS) 5 888$ 1,086$ 5,431$ LED, Medium (HS) 4 1,675$ 1,551$ 6,203$ 8,201$PSMH, Small 8 846$ 1,035$ 8,284$ LED, Medium 8 1,663$ 1,540$ 12,316$ 16,284$Labor, Luminaire 13 141$ 150$ 1,949$ Labor, Luminaire 12 54$ 57$ 690$ 690$PSMH, Wall Pack 1 322$ 394$ 394$ 30ft Pole 8 1,045$ 1,279$ 10,232$ 10,232$Labor, Luminaire 1 45$ 48$ 48$ Labor, Pole 8 687$ 732$ 5,853$ 5,853$35ft Pole OPT1 9 1,304$ 1,596$ 14,365$ Foundation 8 1,563$ 1,663$ 13,306$ 13,306$Labor, Pole 9 718$ 764$ 6,878$ Conduit 1 1/4"PVC 635 25.35$ 26.98$ 17,132$ 17,132$Foundation 9 1,885$ 2,006$ 18,057$ Wiring #6 AWGCU 3250 2$ 2$ 5,724$ 5,724$Conduit 2"PVC 760 31.11$ 33.11$ 25,162$ Total 48,600$ 77,423$Conduit 1/2"EMT 100 6$ 6$ 610$Wiring #2 AWGCU 2990 3$ 3$ 10,206$Wiring #12AWGCU 305 1$ 1$ 230$
Total 91,615$
Large Parking Large Parking LED
Item Quantity 2014 Cost 2017Cost 2017 Total Cost Item Quantity 2014 Cost 2017Cost
2017 TotalCost, $/Klm
CostReduction
2017 TotalCost,
without$/Klm
ReductionPSMH, Small (HS) 16 888$ 945$ 15,114$ LED, Large OPT1 34 1,663$ 1,540$ 52,344$ 69,206$PSMH, Small 42 846$ 1,035$ 43,491$ Labor, Luminaire 34 141$ 150$ 5,098$ 5,098$Labor, Luminaire 58 141$ 150$ 8,696$ 35ft Pole OPT1 22 1,304$ 1,596$ 35,114$ 35,114$35ft Pole OPT1 28 1,304$ 1,596$ 44,690$ Labor, Pole 22 718$ 764$ 16,813$ 16,813$Labor, Pole 28 718$ 764$ 21,398$ Foundation 22 1,885$ 2,006$ 44,140$ 44,140$Foundation 28 1,885$ 2,006$ 56,178$ Conduit 2"PVC 3065 31$ 33$ 101,475$ 101,475$Conduit 2"PVC 3055 31.11$ 33.11$ 101,144$ Wiring #4 AWGCU 17395 2$ 2$ 42,540$ 42,540$Wiring #4 AWGCU 19220 2$ 2$ 47,003$ Total 297,523$ 314,386$Panel & feeder Add 1 3,247$ 3,603$ 3,603$
Total 337,714$
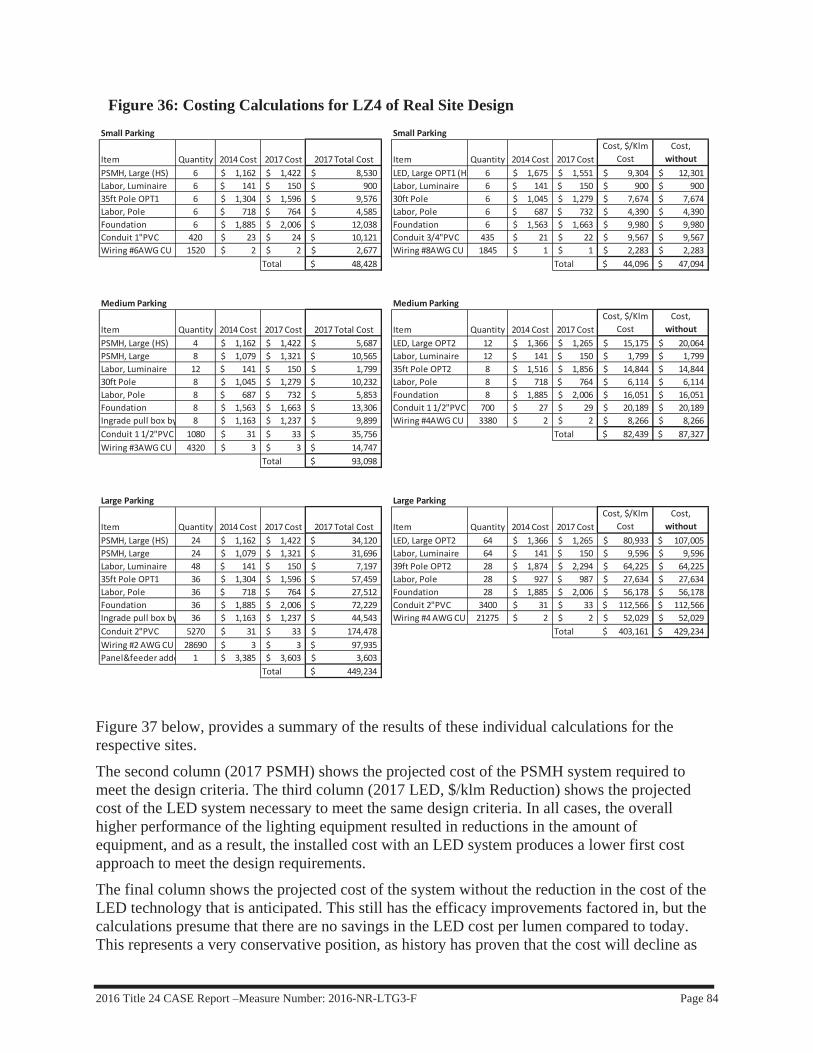
2016 Title 24 CASE Report –Measure Number: 2016-NR-LTG3-F Page 84
Figure 36: Costing Calculations for LZ4 of Real Site Design
Figure 37 below, provides a summary of the results of these individual calculations for the respective sites.
The second column (2017 PSMH) shows the projected cost of the PSMH system required to meet the design criteria. The third column (2017 LED, $/klm Reduction) shows the projected cost of the LED system necessary to meet the same design criteria. In all cases, the overall higher performance of the lighting equipment resulted in reductions in the amount of equipment, and as a result, the installed cost with an LED system produces a lower first cost approach to meet the design requirements.
The final column shows the projected cost of the system without the reduction in the cost of the LED technology that is anticipated. This still has the efficacy improvements factored in, but the calculations presume that there are no savings in the LED cost per lumen compared to today. This represents a very conservative position, as history has proven that the cost will decline as
Small Parking Small Parking
Item Quantity 2014 Cost 2017Cost 2017 Total Cost Item Quantity 2014 Cost 2017CostCost, $/Klm
CostCost,
withoutPSMH, Large (HS) 6 1,162$ 1,422$ 8,530$ LED, Large OPT1 (HS 6 1,675$ 1,551$ 9,304$ 12,301$Labor, Luminaire 6 141$ 150$ 900$ Labor, Luminaire 6 141$ 150$ 900$ 900$35ft Pole OPT1 6 1,304$ 1,596$ 9,576$ 30ft Pole 6 1,045$ 1,279$ 7,674$ 7,674$Labor, Pole 6 718$ 764$ 4,585$ Labor, Pole 6 687$ 732$ 4,390$ 4,390$Foundation 6 1,885$ 2,006$ 12,038$ Foundation 6 1,563$ 1,663$ 9,980$ 9,980$Conduit 1"PVC 420 23$ 24$ 10,121$ Conduit 3/4"PVC 435 21$ 22$ 9,567$ 9,567$Wiring #6AWGCU 1520 2$ 2$ 2,677$ Wiring #8AWGCU 1845 1$ 1$ 2,283$ 2,283$
Total 48,428$ Total 44,096$ 47,094$
Medium Parking Medium Parking
Item Quantity 2014 Cost 2017Cost 2017 Total Cost Item Quantity 2014 Cost 2017CostCost, $/Klm
CostCost,
withoutPSMH, Large (HS) 4 1,162$ 1,422$ 5,687$ LED, Large OPT2 12 1,366$ 1,265$ 15,175$ 20,064$PSMH, Large 8 1,079$ 1,321$ 10,565$ Labor, Luminaire 12 141$ 150$ 1,799$ 1,799$Labor, Luminaire 12 141$ 150$ 1,799$ 35ft Pole OPT2 8 1,516$ 1,856$ 14,844$ 14,844$30ft Pole 8 1,045$ 1,279$ 10,232$ Labor, Pole 8 718$ 764$ 6,114$ 6,114$Labor, Pole 8 687$ 732$ 5,853$ Foundation 8 1,885$ 2,006$ 16,051$ 16,051$Foundation 8 1,563$ 1,663$ 13,306$ Conduit 1 1/2"PVC 700 27$ 29$ 20,189$ 20,189$Ingrade pull box by 8 1,163$ 1,237$ 9,899$ Wiring #4AWGCU 3380 2$ 2$ 8,266$ 8,266$Conduit 1 1/2"PVC 1080 31$ 33$ 35,756$ Total 82,439$ 87,327$Wiring #3AWGCU 4320 3$ 3$ 14,747$
Total 93,098$
Large Parking Large Parking
Item Quantity 2014 Cost 2017Cost 2017 Total Cost Item Quantity 2014 Cost 2017CostCost, $/Klm
CostCost,
withoutPSMH, Large (HS) 24 1,162$ 1,422$ 34,120$ LED, Large OPT2 64 1,366$ 1,265$ 80,933$ 107,005$PSMH, Large 24 1,079$ 1,321$ 31,696$ Labor, Luminaire 64 141$ 150$ 9,596$ 9,596$Labor, Luminaire 48 141$ 150$ 7,197$ 39ft Pole OPT2 28 1,874$ 2,294$ 64,225$ 64,225$35ft Pole OPT1 36 1,304$ 1,596$ 57,459$ Labor, Pole 28 927$ 987$ 27,634$ 27,634$Labor, Pole 36 718$ 764$ 27,512$ Foundation 28 1,885$ 2,006$ 56,178$ 56,178$Foundation 36 1,885$ 2,006$ 72,229$ Conduit 2"PVC 3400 31$ 33$ 112,566$ 112,566$Ingrade pull box by 36 1,163$ 1,237$ 44,543$ Wiring #4 AWGCU 21275 2$ 2$ 52,029$ 52,029$Conduit 2"PVC 5270 31$ 33$ 174,478$ Total 403,161$ 429,234$Wiring #2 AWGCU 28690 3$ 3$ 97,935$Panel&feeder adde 1 3,385$ 3,603$ 3,603$
Total 449,234$

2016 Title 24 CASE Report –Measure Number: 2016-NR-LTG3-F Page 85
the technology improves. Even so, the LED lighting systems project to have lower first-cost in 2017.
As a result, the general hardscape cost effectiveness results suggest that the LED baseline measure will not add additional cost to the lighting system compared to the incumbent PSMH technology.
Figure 37: Costing Calculations for Real Site Designs of Three Sites in Four Lighting Zones
2017 PSMH 2017 LED, $/klmReduction
2017 LED,without$/klm Reduction
Small Parking 44,812$ 27,568$ $ 28,842Medium Parking 95,294$ 33,336$ $ 55,526Large Parking 379,214$ 276,877$ $ 294,514
2017 PSMH 2017 LED, $/klmReduction
2017 LED,without$/klm Reduction
Small Parking 43,820$ 27,568$ $ 28,842Medium Parking 94,852$ 33,336$ $ 55,526Large Parking 307,599$ 276,877$ $ 294,514
2017 PSMH 2017 LED, $/klmReduction
2017 LED,without$/klm Reduction
Small Parking 51,036$ 30,064$ $ 32,063Medium Parking 91,615$ 48,600$ $ 77,423Large Parking 337,714$ 297,523$ $ 314,386
2017 PSMH 2017 LED, $/klmReduction
2017 LED,without$/klm Reduction
Small Parking 48,428$ 44,096$ $ 47,094Medium Parking 93,098$ 82,439$ $ 87,327Large Parking 449,234$ 403,161$ $ 429,234
LZ1 2017 Cost
LZ2 2017 Cost
LZ3 2017 Cost
LZ4 2017 Cost

2016 Title 24 CASE Report –Measure Number: 2016-NR-LTG3-F Page 86
APPENDIX G: STATEWIDE GENERAL HARDSCAPEAREA ESTIMATES INFORMATION
Since the outdoor hardscape is not estimated as part of the construction forecasts, statewide impacts must be completed by making proxies with reasonable estimates of the relationship of the line item to the potential gross square footage of indoor spaces associated with the measure.
In effect, the estimates relate the unit of the measure (square foot of hardscape), with an equivalent unit of gross interior space, which can then be projected using the construction forecasts. Most measure line items only apply to certain building types (retail or small office, for example), and this is taken into account as well.
The process to develop the relationship of General Hardscape square footage to building gross square footage for statewide construction estimates is as follows:
1. Establish the square footage of a parking space (which will be the basic unit of comparison because of the code use of minimum spaces per square foot).
2. Determine any modifications to the basic unit required for specific building types to accommodate specific design requirements. This is primarily to adjust for warehouse buildings.
3. Determine the basic parking requirements for the listed building types in the construction forecasts.
4. Create a table of adjustment factors to apply to the respective building types, normalizing the value back to a single square footage unit to make the calculations work in a direct manner.
Step #1: Establish ‘per space’ Square Footage The Statewide CASE Team first established the approximate square footage of hardscape associated with a single parking space, using the following assumptions that are based on general design documents and traditional design standards:
Each parking space is approximately 144 square feet (8 feet by 18 feet).
There is a drive lane to gain access to the space, and the minimum amount is one-half of the drive lane directly in front of the parking space. This adds 80 square feet (8 feet by 10 feet).
The parking is only ‘funded’ to 75% on-site. This reduces the vehicle hardscape from 224 square feet to 168 square feet. There are many reasons this may occur, including trade-offs with mass transit, on-street parking, garage space parking, etc. Many municipalities permit trades of this kind. The actual amount is unclear, so this adjustment is an estimate based on reasonable expectations.
There is vehicular hardscape that is not specifically associated with the parking lot. This adds 40 square feet per space. This constitutes all of the hardscape on a site that is oriented to vehicles, but not specifically included in the parking space requirements that
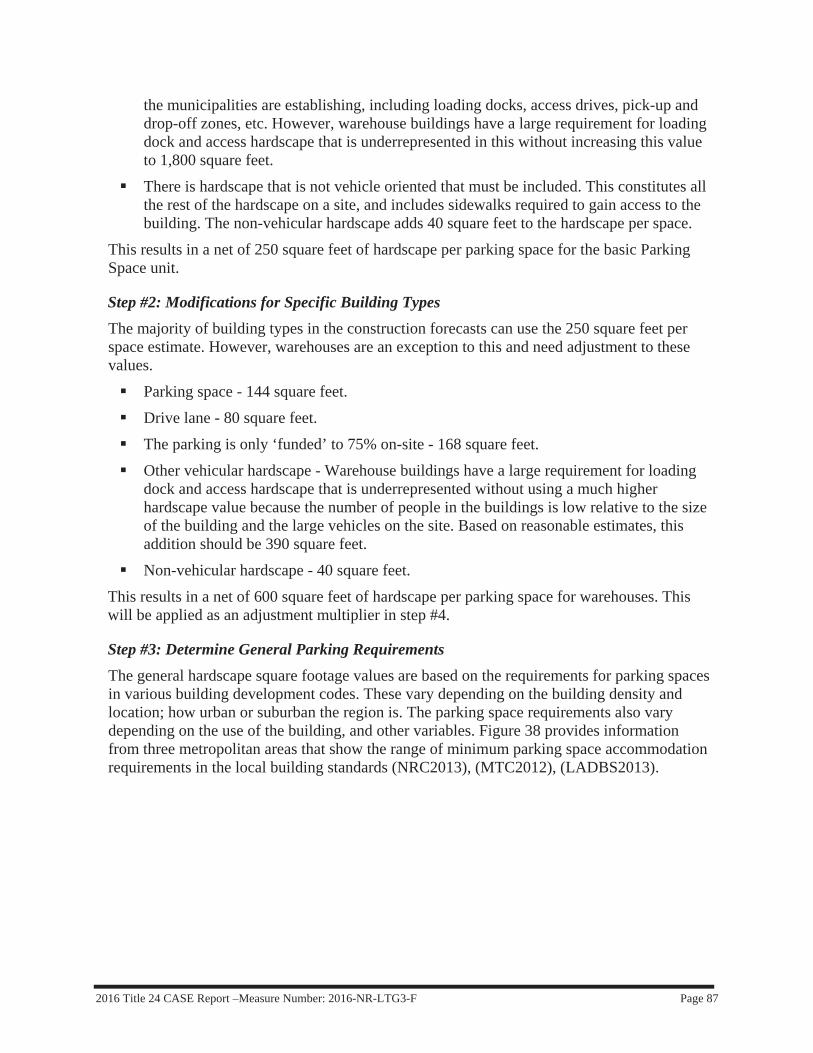
2016 Title 24 CASE Report –Measure Number: 2016-NR-LTG3-F Page 87
the municipalities are establishing, including loading docks, access drives, pick-up and drop-off zones, etc. However, warehouse buildings have a large requirement for loading dock and access hardscape that is underrepresented in this without increasing this value to 1,800 square feet.
There is hardscape that is not vehicle oriented that must be included. This constitutes all the rest of the hardscape on a site, and includes sidewalks required to gain access to the building. The non-vehicular hardscape adds 40 square feet to the hardscape per space.
This results in a net of 250 square feet of hardscape per parking space for the basic Parking Space unit.
Step #2: Modifications for Specific Building Types The majority of building types in the construction forecasts can use the 250 square feet per space estimate. However, warehouses are an exception to this and need adjustment to these values.
Parking space - 144 square feet.
Drive lane - 80 square feet.
The parking is only ‘funded’ to 75% on-site - 168 square feet.
Other vehicular hardscape - Warehouse buildings have a large requirement for loading dock and access hardscape that is underrepresented without using a much higher hardscape value because the number of people in the buildings is low relative to the size of the building and the large vehicles on the site. Based on reasonable estimates, this addition should be 390 square feet.
Non-vehicular hardscape - 40 square feet.
This results in a net of 600 square feet of hardscape per parking space for warehouses. This will be applied as an adjustment multiplier in step #4.
Step #3: Determine General Parking Requirements The general hardscape square footage values are based on the requirements for parking spaces in various building development codes. These vary depending on the building density and location; how urban or suburban the region is. The parking space requirements also vary depending on the use of the building, and other variables. Figure 38 provides information from three metropolitan areas that show the range of minimum parking space accommodation requirements in the local building standards (NRC2013), (MTC2012), (LADBS2013).
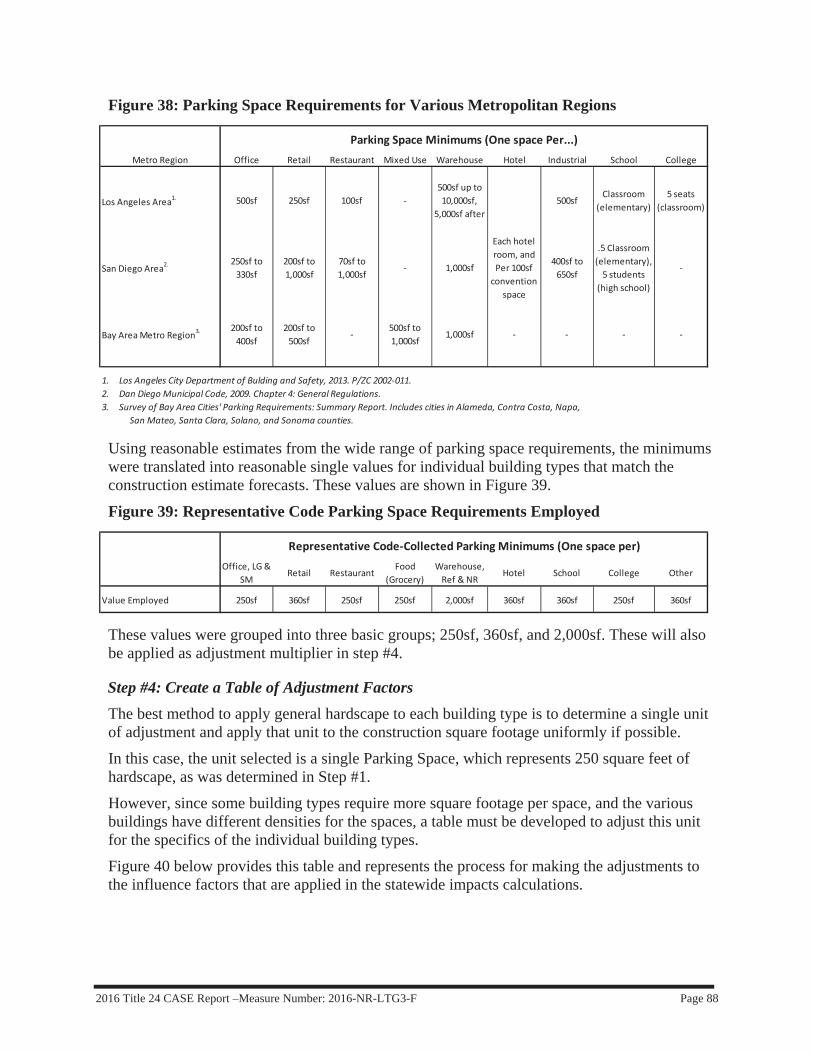
2016 Title 24 CASE Report –Measure Number: 2016-NR-LTG3-F Page 88
Figure 38: Parking Space Requirements for Various Metropolitan Regions
Using reasonable estimates from the wide range of parking space requirements, the minimums were translated into reasonable single values for individual building types that match the construction estimate forecasts. These values are shown in Figure 39.
Figure 39: Representative Code Parking Space Requirements Employed
These values were grouped into three basic groups; 250sf, 360sf, and 2,000sf. These will also be applied as adjustment multiplier in step #4.
Step #4: Create a Table of Adjustment Factors The best method to apply general hardscape to each building type is to determine a single unit of adjustment and apply that unit to the construction square footage uniformly if possible.
In this case, the unit selected is a single Parking Space, which represents 250 square feet of hardscape, as was determined in Step #1.
However, since some building types require more square footage per space, and the various buildings have different densities for the spaces, a table must be developed to adjust this unit for the specifics of the individual building types.
Figure 40 below provides this table and represents the process for making the adjustments to the influence factors that are applied in the statewide impacts calculations.
Metro Region Office Retail Restaurant Mixed Use Warehouse Hotel Industrial School College
Los Angeles Area1. 500sf 250sf 100sf500sf up to10,000sf,
5,000sf after500sf
Classroom(elementary)
5 seats(classroom)
San Diego Area2.250sf to330sf
200sf to1,000sf
70sf to1,000sf
1,000sf
Each hotelroom, andPer 100sfconvention
space
400sf to650sf
.5 Classroom(elementary),5 students
(high school)
Bay AreaMetro Region3.200sf to400sf
200sf to500sf
500sf to1,000sf
1,000sf
1. Los Angeles City Department of Bulding and Safety, 2013. P/ZC 2002 011.2. Dan Diego Municipal Code, 2009. Chapter 4: General Regulations.3. Survey of Bay Area Cities' Parking Requirements: Summary Report. Includes cities in Alameda, Contra Costa, Napa,
San Mateo, Santa Clara, Solano, and Sonoma counties.
Parking Space Minimums (One space Per...)
Office, LG&SM
Retail RestaurantFood
(Grocery)Warehouse,Ref & NR
Hotel School College Other
Value Employed 250sf 360sf 250sf 250sf 2,000sf 360sf 360sf 250sf 360sf
Representative Code Collected Parking Minimums (One space per)
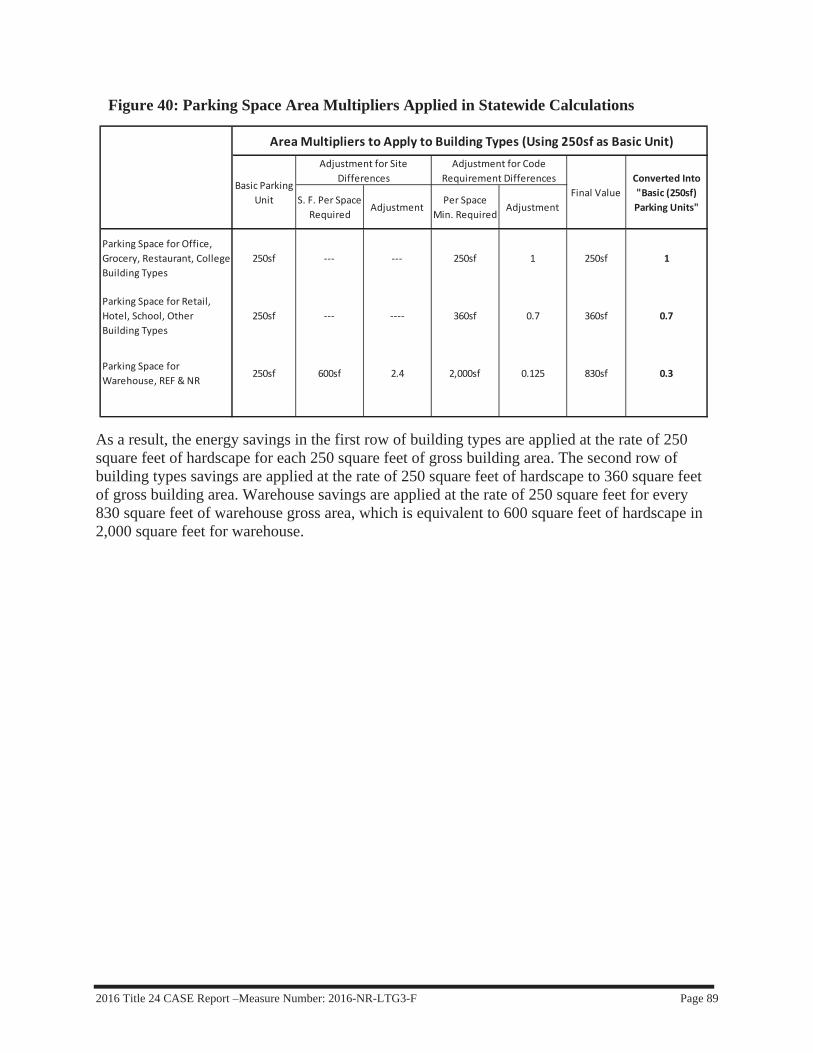
2016 Title 24 CASE Report –Measure Number: 2016-NR-LTG3-F Page 89
Figure 40: Parking Space Area Multipliers Applied in Statewide Calculations
As a result, the energy savings in the first row of building types are applied at the rate of 250 square feet of hardscape for each 250 square feet of gross building area. The second row of building types savings are applied at the rate of 250 square feet of hardscape to 360 square feet of gross building area. Warehouse savings are applied at the rate of 250 square feet for every 830 square feet of warehouse gross area, which is equivalent to 600 square feet of hardscape in 2,000 square feet for warehouse.
S. F. Per SpaceRequired
AdjustmentPer Space
Min. RequiredAdjustment
Parking Space for Office,Grocery, Restaurant, CollegeBuilding Types
250sf 250sf 1 250sf 1
Parking Space for Retail,Hotel, School, OtherBuilding Types
250sf 360sf 0.7 360sf 0.7
Parking Space forWarehouse, REF &NR
250sf 600sf 2.4 2,000sf 0.125 830sf 0.3
AreaMultipliers to Apply to Building Types (Using 250sf as Basic Unit)Adjustment for Site
DifferencesAdjustment for Code
Requirement DifferencesFinal Value
Converted Into"Basic (250sf)Parking Units"
Basic ParkingUnit
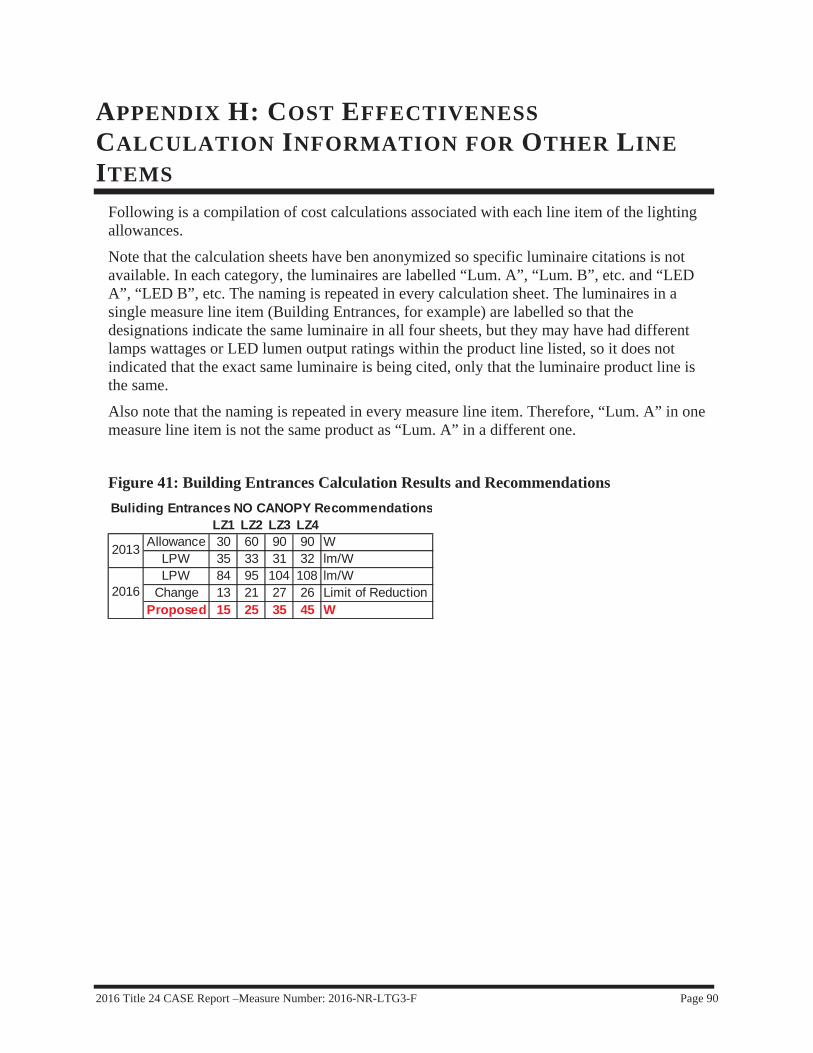
2016 Title 24 CASE Report –Measure Number: 2016-NR-LTG3-F Page 90
APPENDIX H: COST EFFECTIVENESSCALCULATION INFORMATION FOR OTHER LINEITEMS
Following is a compilation of cost calculations associated with each line item of the lighting allowances.
Note that the calculation sheets have ben anonymized so specific luminaire citations is not available. In each category, the luminaires are labelled “Lum. A”, “Lum. B”, etc. and “LED A”, “LED B”, etc. The naming is repeated in every calculation sheet. The luminaires in a single measure line item (Building Entrances, for example) are labelled so that the designations indicate the same luminaire in all four sheets, but they may have had different lamps wattages or LED lumen output ratings within the product line listed, so it does not indicated that the exact same luminaire is being cited, only that the luminaire product line is the same.
Also note that the naming is repeated in every measure line item. Therefore, “Lum. A” in one measure line item is not the same product as “Lum. A” in a different one.
Figure 41: Building Entrances Calculation Results and Recommendations
Buliding Entrances NO CANOPY RecommendationsLZ1 LZ2 LZ3 LZ4
Allowance 30 60 90 90 WLPW 35 33 31 32 lm/WLPW 84 95 104 108 lm/W
Change 13 21 27 26 Limit of ReductionProposed 15 25 35 45 W
2016
2013
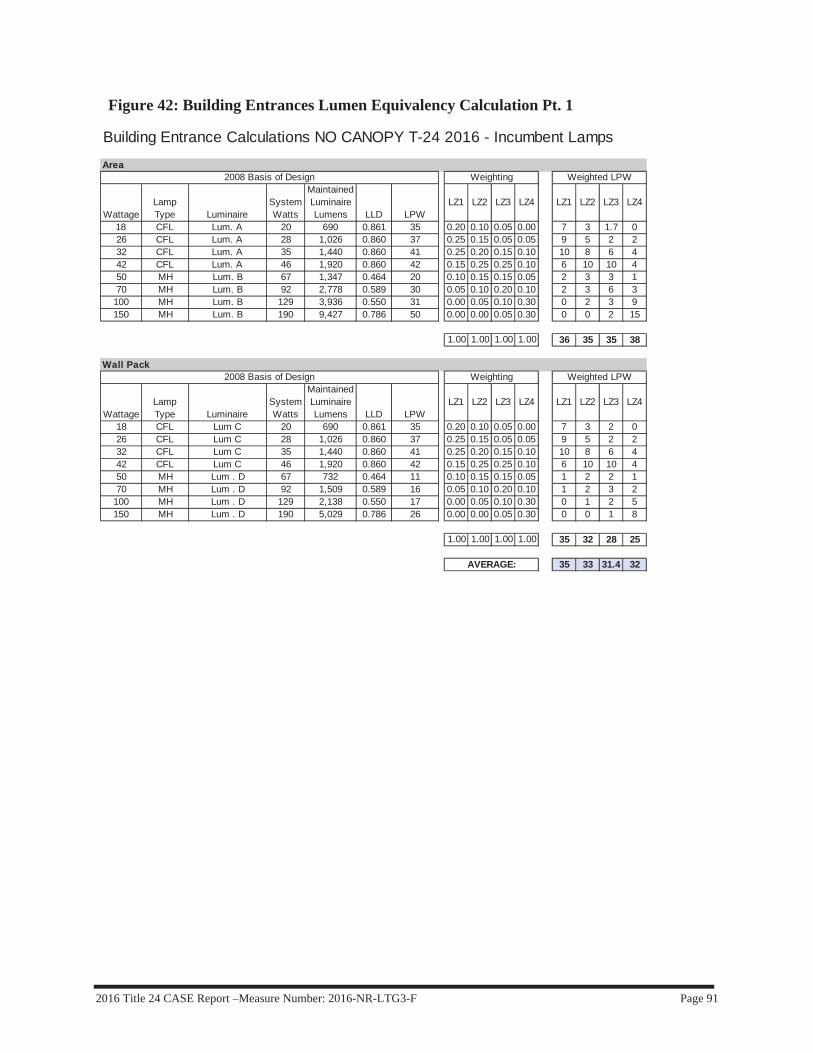
2016 Title 24 CASE Report –Measure Number: 2016-NR-LTG3-F Page 91
Figure 42: Building Entrances Lumen Equivalency Calculation Pt. 1
Building Entrance Calculations NO CANOPY T-24 2016 - Incumbent Lamps
Area
WattageLamp Type Luminaire
System Watts
Maintained Luminaire Lumens LLD LPW
LZ1 LZ2 LZ3 LZ4 LZ1 LZ2 LZ3 LZ4
18 CFL Lum. A 20 690 0.861 35 0.20 0.10 0.05 0.00 7 3 1.7 026 CFL Lum. A 28 1,026 0.860 37 0.25 0.15 0.05 0.05 9 5 2 232 CFL Lum. A 35 1,440 0.860 41 0.25 0.20 0.15 0.10 10 8 6 442 CFL Lum. A 46 1,920 0.860 42 0.15 0.25 0.25 0.10 6 10 10 450 MH Lum. B 67 1,347 0.464 20 0.10 0.15 0.15 0.05 2 3 3 170 MH Lum. B 92 2,778 0.589 30 0.05 0.10 0.20 0.10 2 3 6 3
100 MH Lum. B 129 3,936 0.550 31 0.00 0.05 0.10 0.30 0 2 3 9150 MH Lum. B 190 9,427 0.786 50 0.00 0.00 0.05 0.30 0 0 2 15
1.00 1.00 1.00 1.00 36 35 35 38
Wall Pack
WattageLamp Type Luminaire
System Watts
Maintained Luminaire Lumens LLD LPW
LZ1 LZ2 LZ3 LZ4 LZ1 LZ2 LZ3 LZ4
18 CFL Lum C 20 690 0.861 35 0.20 0.10 0.05 0.00 7 3 2 026 CFL Lum C 28 1,026 0.860 37 0.25 0.15 0.05 0.05 9 5 2 232 CFL Lum C 35 1,440 0.860 41 0.25 0.20 0.15 0.10 10 8 6 442 CFL Lum C 46 1,920 0.860 42 0.15 0.25 0.25 0.10 6 10 10 450 MH Lum . D 67 732 0.464 11 0.10 0.15 0.15 0.05 1 2 2 170 MH Lum . D 92 1,509 0.589 16 0.05 0.10 0.20 0.10 1 2 3 2
100 MH Lum . D 129 2,138 0.550 17 0.00 0.05 0.10 0.30 0 1 2 5150 MH Lum . D 190 5,029 0.786 26 0.00 0.00 0.05 0.30 0 0 1 8
1.00 1.00 1.00 1.00 35 32 28 25
35 33 31.4 32
2008 Basis of Design
2008 Basis of Design
Weighting Weighted LPW
Weighting Weighted LPW
AVERAGE:
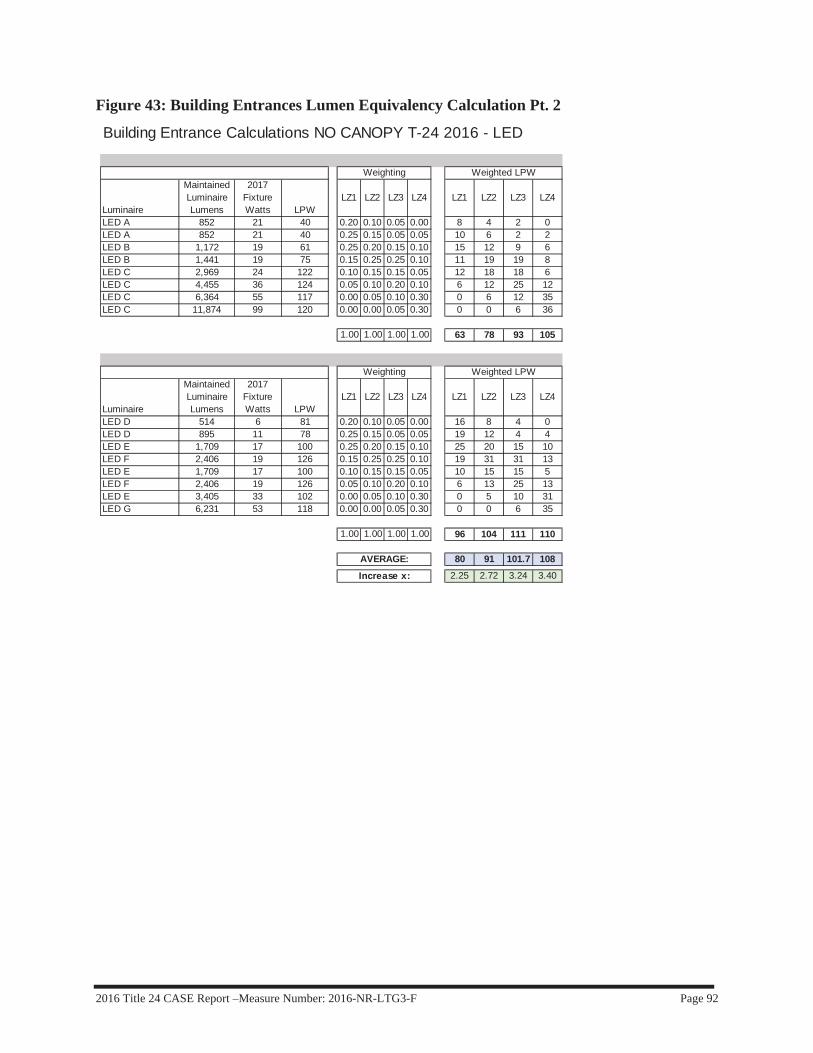
2016 Title 24 CASE Report –Measure Number: 2016-NR-LTG3-F Page 92
Figure 43: Building Entrances Lumen Equivalency Calculation Pt. 2
Building Entrance Calculations NO CANOPY T-24 2016 - LED
Luminaire
Maintained Luminaire Lumens
2017 Fixture Watts LPW
LZ1 LZ2 LZ3 LZ4 LZ1 LZ2 LZ3 LZ4
LED A 852 21 40 0.20 0.10 0.05 0.00 8 4 2 0LED A 852 21 40 0.25 0.15 0.05 0.05 10 6 2 2LED B 1,172 19 61 0.25 0.20 0.15 0.10 15 12 9 6LED B 1,441 19 75 0.15 0.25 0.25 0.10 11 19 19 8LED C 2,969 24 122 0.10 0.15 0.15 0.05 12 18 18 6LED C 4,455 36 124 0.05 0.10 0.20 0.10 6 12 25 12LED C 6,364 55 117 0.00 0.05 0.10 0.30 0 6 12 35LED C 11,874 99 120 0.00 0.00 0.05 0.30 0 0 6 36
1.00 1.00 1.00 1.00 63 78 93 105
Luminaire
Maintained Luminaire Lumens
2017 Fixture Watts LPW
LZ1 LZ2 LZ3 LZ4 LZ1 LZ2 LZ3 LZ4
LED D 514 6 81 0.20 0.10 0.05 0.00 16 8 4 0LED D 895 11 78 0.25 0.15 0.05 0.05 19 12 4 4LED E 1,709 17 100 0.25 0.20 0.15 0.10 25 20 15 10LED F 2,406 19 126 0.15 0.25 0.25 0.10 19 31 31 13LED E 1,709 17 100 0.10 0.15 0.15 0.05 10 15 15 5LED F 2,406 19 126 0.05 0.10 0.20 0.10 6 13 25 13LED E 3,405 33 102 0.00 0.05 0.10 0.30 0 5 10 31LED G 6,231 53 118 0.00 0.00 0.05 0.30 0 0 6 35
1.00 1.00 1.00 1.00 96 104 111 110
80 91 101.7 1082.25 2.72 3.24 3.40Increase x:
Weighted LPW
Weighted LPW
AVERAGE:
Weighting
Weighting
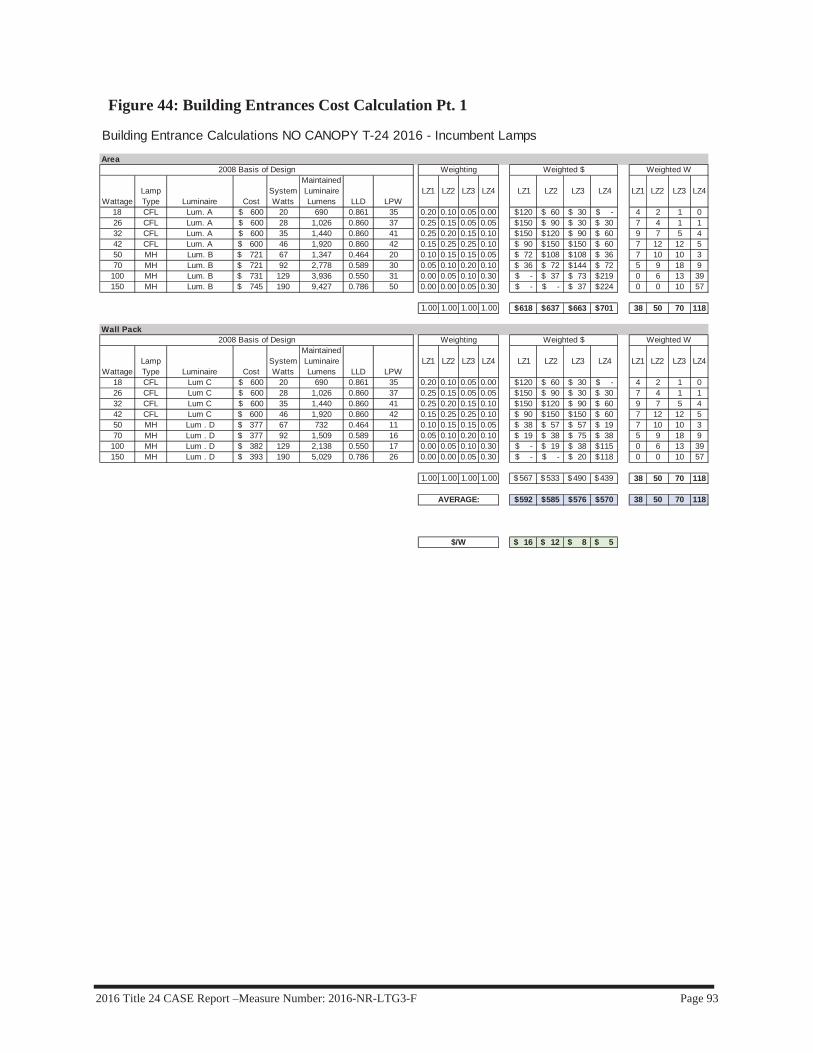
2016 Title 24 CASE Report –Measure Number: 2016-NR-LTG3-F Page 93
Figure 44: Building Entrances Cost Calculation Pt. 1
Building Entrance Calculations NO CANOPY T-24 2016 - Incumbent Lamps
Area
WattageLamp Type Luminaire Cost
System Watts
Maintained Luminaire Lumens LLD LPW
LZ1 LZ2 LZ3 LZ4 LZ1 LZ2 LZ3 LZ4 LZ1 LZ2 LZ3 LZ4
18 CFL Lum. A $ 600 20 690 0.861 35 0.20 0.10 0.05 0.00 120$ 60$ 30$ -$ 4 2 1 026 CFL Lum. A $ 600 28 1,026 0.860 37 0.25 0.15 0.05 0.05 150$ 90$ 30$ 30$ 7 4 1 132 CFL Lum. A $ 600 35 1,440 0.860 41 0.25 0.20 0.15 0.10 150$ 120$ 90$ 60$ 9 7 5 442 CFL Lum. A 600$ 46 1,920 0.860 42 0.15 0.25 0.25 0.10 90$ 150$ 150$ 60$ 7 12 12 550 MH Lum. B 721$ 67 1,347 0.464 20 0.10 0.15 0.15 0.05 72$ 108$ 108$ 36$ 7 10 10 370 MH Lum. B 721$ 92 2,778 0.589 30 0.05 0.10 0.20 0.10 36$ 72$ 144$ 72$ 5 9 18 9
100 MH Lum. B 731$ 129 3,936 0.550 31 0.00 0.05 0.10 0.30 -$ 37$ 73$ 219$ 0 6 13 39150 MH Lum. B 745$ 190 9,427 0.786 50 0.00 0.00 0.05 0.30 -$ -$ 37$ 224$ 0 0 10 57
1.00 1.00 1.00 1.00 618$ 637$ 663$ 701$ 38 50 70 118
Wall Pack
WattageLamp Type Luminaire Cost
System Watts
Maintained Luminaire Lumens LLD LPW
LZ1 LZ2 LZ3 LZ4 LZ1 LZ2 LZ3 LZ4 LZ1 LZ2 LZ3 LZ4
18 CFL Lum C $ 600 20 690 0.861 35 0.20 0.10 0.05 0.00 120$ 60$ 30$ -$ 4 2 1 026 CFL Lum C $ 600 28 1,026 0.860 37 0.25 0.15 0.05 0.05 150$ 90$ 30$ 30$ 7 4 1 132 CFL Lum C $ 600 35 1,440 0.860 41 0.25 0.20 0.15 0.10 150$ 120$ 90$ 60$ 9 7 5 442 CFL Lum C 600$ 46 1,920 0.860 42 0.15 0.25 0.25 0.10 90$ 150$ 150$ 60$ 7 12 12 550 MH Lum . D 377$ 67 732 0.464 11 0.10 0.15 0.15 0.05 38$ 57$ 57$ 19$ 7 10 10 370 MH Lum . D 377$ 92 1,509 0.589 16 0.05 0.10 0.20 0.10 19$ 38$ 75$ 38$ 5 9 18 9
100 MH Lum . D 382$ 129 2,138 0.550 17 0.00 0.05 0.10 0.30 -$ 19$ 38$ 115$ 0 6 13 39150 MH Lum . D 393$ 190 5,029 0.786 26 0.00 0.00 0.05 0.30 -$ -$ 20$ 118$ 0 0 10 57
1.00 1.00 1.00 1.00 567$ 533$ 490$ 439$ 38 50 70 118
592$ 585$ 576$ 570$ 38 50 70 118
16$ 12$ 8$ 5$
2008 Basis of Design Weighting Weighted WWeighted $
$/W
2008 Basis of Design Weighting Weighted W
AVERAGE:
Weighted $

2016 Title 24 CASE Report –Measure Number: 2016-NR-LTG3-F Page 94
Figure 45: Building Entrances Cost Calculation Pt. 2
Building Entrance Calculations NO CANOPY T-24 2016 - LED
Luminaire
Maintained Luminaire Lumens Cost
2017 Fixture Watts LPW
LZ1 LZ2 LZ3 LZ4 LZ1 LZ2 LZ3 LZ4 LZ1 LZ2 LZ3 LZ4
LED A 852 979$ 21 40 0.20 0.10 0.05 0.00 196$ 98$ 49$ -$ 4 2 1 0LED A 852 979$ 21 40 0.25 0.15 0.05 0.05 245$ 147$ 49$ 49$ 5 3 1 1LED B 1,172 670$ 19 61 0.25 0.20 0.15 0.10 168$ 134$ 101$ 67$ 5 4 3 2LED B 1,441 701$ 19 75 0.15 0.25 0.25 0.10 105$ 175$ 175$ 70$ 3 5 5 2LED C 2,969 1,428$ 24 122 0.10 0.15 0.15 0.05 143$ 214$ 214$ 71$ 2 4 4 1LED C 4,455 1,428$ 36 124 0.05 0.10 0.20 0.10 71$ 143$ 286$ 143$ 2 4 7 4LED C 6,364 1,428$ 55 117 0.00 0.05 0.10 0.30 -$ 71$ 143$ 429$ 0 3 5 16LED C 11,874 1,537$ 99 120 0.00 0.00 0.05 0.30 -$ -$ 77$ 461$ 0 0 5 30
1.00 1.00 1.00 1.00 928$ 983$ 1,093$ 1,290$ 21 24 31 56
Luminaire
Maintained Luminaire Lumens Cost
2017 Fixture Watts LPW
LZ1 LZ2 LZ3 LZ4 LZ1 LZ2 LZ3 LZ4 LZ1 LZ2 LZ3 LZ4
LED D 514 207$ 6 81 0.20 0.10 0.05 0.00 41$ 21$ 10$ -$ 16 8 4 0LED D 895 237$ 11 78 0.25 0.15 0.05 0.05 59$ 36$ 12$ 12$ 19 12 4 4LED E 1,709 444$ 17 100 0.25 0.20 0.15 0.10 111$ 89$ 67$ 44$ 25 20 15 10LED F 2,406 775$ 19 126 0.15 0.25 0.25 0.10 116$ 194$ 194$ 77$ 19 31 31 13LED E 1,709 444$ 17 100 0.10 0.15 0.15 0.05 44$ 67$ 67$ 22$ 10 15 15 5LED F 2,406 775$ 19 126 0.05 0.10 0.20 0.10 39$ 77$ 155$ 77$ 6 13 25 13LED E 3,405 444$ 33 102 0.00 0.05 0.10 0.30 -$ 22$ 44$ 133$ 0 5 10 31LED G 6,231 1,512$ 53 118 0.00 0.00 0.05 0.30 -$ -$ 76$ 453$ 0 0 6 35
1.00 1.00 1.00 1.00 411$ 505$ 624$ 820$ 96 104 111 110
669$ 744$ 859$ 1,055$ 59 64 71 83
1.55 1.27 1.01 0.70
11$ 12$ 12$ 13$
Weighted LPW
Weighting Weighted WWeighted Cost
Weighted Cost
$/W
Weighting
AVERAGE:
Increase x:

2016 Title 24 CASE Report –Measure Number: 2016-NR-LTG3-F Page 95
Figure 46: Building Primary Entrances Calculation Results and Recommendations
Figure 47: Building Primary Entrances Lumen Equivalency Calculation Pt. 1
Building Primary Entrances RecommendationsLZ1 LZ2 LZ3 LZ4
Allowance 45 80 120 130 WLPW 25 25 25 26 lm/WLPW 72 79 86 92 lm/W
Change 16 25 34 36 Limit of ReductionProposed 20 40 60 80 W
2013
2016
Primary Entrances Calculations T-24 2016 - Incumbent Lamps
Downlight
WattageLamp Type Luminaire
System Watts
Maintained Luminaire Lumens LLD LPW
LZ1 LZ2 LZ3 LZ4 LZ1 LZ2 LZ3 LZ4
32 CFL Lum. A 36 646 0.860 18 0.50 0.35 0.10 0.05 9 6 2 142 CFL Lum. A 47 861 0.860 18 0.30 0.30 0.20 0.15 5 5 4 370 PSMH Lum. B 90 1,433 0.589 16 0.15 0.20 0.25 0.25 2 3 4 4100 PSMH Lum. B 129 2,030 0.550 16 0.05 0.10 0.30 0.30 1 2 5 5150 PSMH Lum. C 190 5,081 0.786 27 0.00 0.05 0.10 0.15 0 1 3 4175 PSMH Lum. C 198 3,834 0.648 19 0.00 0.00 0.05 0.10 0 0 1 2
1.00 1.00 1.00 1.00 18 18 18 18
Wall Pack
WattageLamp Type Luminaire
System Watts
Maintained Luminaire Lumens LLD LPW
LZ1 LZ2 LZ3 LZ4 LZ1 LZ2 LZ3 LZ4
26 CFL Lum. D 27 710 0.860 26 0.40 0.20 0.10 0.00 11 5 3 032 CFL Lum. D 36 947 0.860 26 0.25 0.25 0.15 0.05 7 7 4 142 CFL Lum. D 47 1,262 0.860 27 0.20 0.20 0.15 0.10 5 5 4 370 PSMH Lum. D 90 1,509 0.589 17 0.10 0.15 0.20 0.10 2 3 3 2100 PSMH Lum. D 129 2,138 0.550 17 0.05 0.10 0.20 0.15 1 2 3 2150 PSMH Lum. D 190 5,029 0.786 26 0.00 0.05 0.05 0.25 0 1 1 7175 PSMH Lum. E 198 4,944 0.648 25 0.00 0.05 0.10 0.25 0 1 2 6250 PSMH Lum. E 291 6,552 0.611 23 0.00 0.00 0.05 0.10 0 0 1 2
1.00 1.00 1.00 1.00 25 24 22 23
Area
WattageLamp Type Luminaire
System Watts
Maintained Luminaire Lumens LLD LPW
LZ1 LZ2 LZ3 LZ4 LZ1 LZ2 LZ3 LZ4
18 CFL Lum. F 19 690 0.861 36 0.05 0.05 0.00 0.00 2 2 0 026 CFL Lum. F 27 1,026 0.860 38 0.10 0.05 0.00 0.00 4 2 0 032 CFL Lum. F 36 1,440 0.860 40 0.20 0.10 0.10 0.00 8 4 4 042 CFL Lum. F 47 1,920 0.860 41 0.20 0.15 0.10 0.10 8 6 4 450 MH Lum. G 67 1,347 0.464 20 0.20 0.20 0.15 0.10 4 4 3 270 MH Lum. G 92 2,778 0.589 30 0.15 0.25 0.25 0.20 5 8 8 6100 MH Lum. G 129 3,936 0.550 31 0.10 0.15 0.25 0.30 3 5 8 9150 MH Lum. G 190 9,427 0.786 50 0.00 0.05 0.15 0.30 0 2 7 15
1.00 1.00 1.00 1.00 33 32 34 36
25 25 25 26AVERAGE:
2008 Basis of Design Weighting Weighted LPW
2008 Basis of Design Weighting Weighted LPW
2008 Basis of Design Weighting Weighted LPW

2016 Title 24 CASE Report –Measure Number: 2016-NR-LTG3-F Page 96
Figure 48: Building Primary Entrances Lumen Equivalency Calculation Pt. 2
Primary Entrances Calculations T-24 2016 - LED
Luminaire
Maintained Luminaire Lumens LLD
2017 Fixture Watts LPW
LZ1 LZ2 LZ3 LZ4 LZ1 LZ2 LZ3 LZ4
LED A 549 0.700 18 31 0.50 0.35 0.10 0.05 16 11 3 2LED B 823 0.700 20 42 0.30 0.30 0.20 0.15 13 13 8 6LED C 1,710 0.700 26 66 0.15 0.20 0.25 0.25 10 13 17 17LED D 2,207 0.700 35 63 0.05 0.10 0.30 0.30 3 6 19 19LED E 4,610 0.700 62 74 0.00 0.05 0.10 0.15 0 4 7 11LED F 4,174 0.700 49 85 0.00 0.00 0.05 0.10 0 0 4 9
1.00 1.00 1.00 1.00 41 47 59 63
Luminaire
Maintained Luminaire Lumens LLD
2017 Fixture Watts LPW
LZ1 LZ2 LZ3 LZ4 LZ1 LZ2 LZ3 LZ4
LED G 514 0.700 6 81 0.40 0.20 0.10 0.00 33 16 8 0LED G 895 0.700 11 78 0.25 0.25 0.15 0.05 19 19 12 4LED H 1,373 0.958 13 108 0.20 0.20 0.15 0.10 22 22 16 11LED H 2,341 0.903 27 87 0.10 0.15 0.20 0.10 9 13 17 9LED J 2,733 0.700 35 77 0.05 0.10 0.20 0.15 4 8 15 12LED K 5,312 0.887 50 106 0.00 0.05 0.05 0.25 0 5 5 26LED K 6,645 0.887 61 108 0.00 0.05 0.10 0.25 0 5 11 27LED L 10,251 0.887 101 102 0.00 0.00 0.05 0.10 0 0 5 10
1.00 1.00 1.00 1.00 86 89 90 99
Luminaire
Maintained Luminaire Lumens LLD
2017 Fixture Watts LPW
LZ1 LZ2 LZ3 LZ4 LZ1 LZ2 LZ3 LZ4
LED M 852 0.768 21 40 0.05 0.05 0.00 0.00 2 2 0 0LED M 852 0.768 21 40 0.10 0.05 0.00 0.00 4 2 0 0LED N 1,172 0.700 19 61 0.20 0.10 0.10 0.00 12 6 6 0LED N 1,441 0.700 19 75 0.20 0.15 0.10 0.10 15 11 8 8LED P 2,969 0.946 24 122 0.20 0.20 0.15 0.10 24 24 18 12LED P 4,455 0.946 36 124 0.15 0.25 0.25 0.20 19 31 31 25LED P 6,364 0.946 55 117 0.10 0.15 0.25 0.30 12 17 29 35LED P 11,874 0.946 99 120 0.00 0.05 0.15 0.30 0 6 18 36
1.00 1.00 1.00 1.00 88 100 110 116
72 79 86 92AVERAGE:
2016 LED Equivalency Weighting Weighted LPW
2016 LED Equivalency Weighting Weighted LPW
Weighted LPW2016 LED Equivalency Weighting
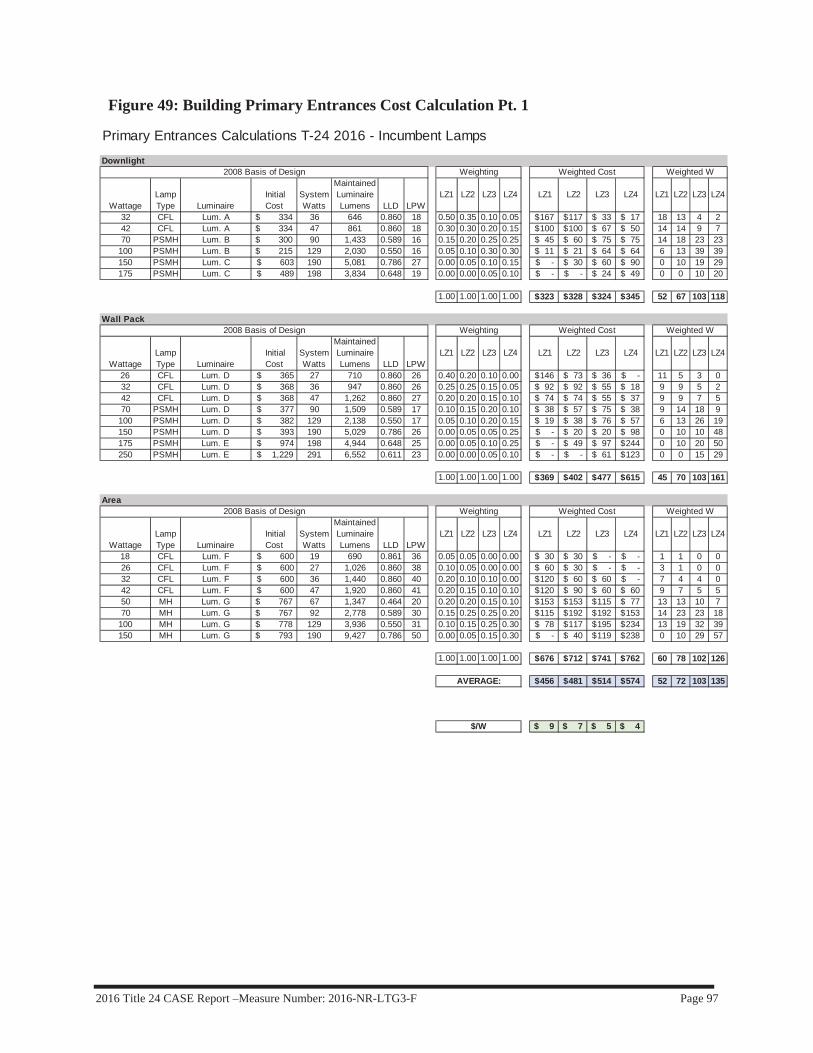
2016 Title 24 CASE Report –Measure Number: 2016-NR-LTG3-F Page 97
Figure 49: Building Primary Entrances Cost Calculation Pt. 1
Primary Entrances Calculations T-24 2016 - Incumbent Lamps
Downlight
WattageLamp Type Luminaire
Initial Cost
System Watts
Maintained Luminaire Lumens LLD LPW
LZ1 LZ2 LZ3 LZ4 LZ1 LZ2 LZ3 LZ4 LZ1 LZ2 LZ3 LZ4
32 CFL Lum. A 334$ 36 646 0.860 18 0.50 0.35 0.10 0.05 167$ 117$ 33$ 17$ 18 13 4 242 CFL Lum. A 334$ 47 861 0.860 18 0.30 0.30 0.20 0.15 100$ 100$ 67$ 50$ 14 14 9 770 PSMH Lum. B 300$ 90 1,433 0.589 16 0.15 0.20 0.25 0.25 45$ 60$ 75$ 75$ 14 18 23 23
100 PSMH Lum. B 215$ 129 2,030 0.550 16 0.05 0.10 0.30 0.30 11$ 21$ 64$ 64$ 6 13 39 39150 PSMH Lum. C $ 603 190 5,081 0.786 27 0.00 0.05 0.10 0.15 -$ 30$ 60$ 90$ 0 10 19 29175 PSMH Lum. C $ 489 198 3,834 0.648 19 0.00 0.00 0.05 0.10 -$ -$ 24$ 49$ 0 0 10 20
1.00 1.00 1.00 1.00 323$ 328$ 324$ 345$ 52 67 103 118
Wall Pack
WattageLamp Type Luminaire
Initial Cost
System Watts
Maintained Luminaire Lumens LLD LPW
LZ1 LZ2 LZ3 LZ4 LZ1 LZ2 LZ3 LZ4 LZ1 LZ2 LZ3 LZ4
26 CFL Lum. D $ 365 27 710 0.860 26 0.40 0.20 0.10 0.00 146$ 73$ 36$ -$ 11 5 3 032 CFL Lum. D $ 368 36 947 0.860 26 0.25 0.25 0.15 0.05 92$ 92$ 55$ 18$ 9 9 5 242 CFL Lum. D $ 368 47 1,262 0.860 27 0.20 0.20 0.15 0.10 74$ 74$ 55$ 37$ 9 9 7 570 PSMH Lum. D $ 377 90 1,509 0.589 17 0.10 0.15 0.20 0.10 38$ 57$ 75$ 38$ 9 14 18 9
100 PSMH Lum. D $ 382 129 2,138 0.550 17 0.05 0.10 0.20 0.15 19$ 38$ 76$ 57$ 6 13 26 19150 PSMH Lum. D $ 393 190 5,029 0.786 26 0.00 0.05 0.05 0.25 -$ 20$ 20$ 98$ 0 10 10 48175 PSMH Lum. E $ 974 198 4,944 0.648 25 0.00 0.05 0.10 0.25 -$ 49$ 97$ 244$ 0 10 20 50250 PSMH Lum. E $ 1,229 291 6,552 0.611 23 0.00 0.00 0.05 0.10 -$ -$ 61$ 123$ 0 0 15 29
1.00 1.00 1.00 1.00 369$ 402$ 477$ 615$ 45 70 103 161
Area
WattageLamp Type Luminaire
Initial Cost
System Watts
Maintained Luminaire Lumens LLD LPW
LZ1 LZ2 LZ3 LZ4 LZ1 LZ2 LZ3 LZ4 LZ1 LZ2 LZ3 LZ4
18 CFL Lum. F $ 600 19 690 0.861 36 0.05 0.05 0.00 0.00 30$ 30$ -$ -$ 1 1 0 026 CFL Lum. F $ 600 27 1,026 0.860 38 0.10 0.05 0.00 0.00 60$ 30$ -$ -$ 3 1 0 032 CFL Lum. F $ 600 36 1,440 0.860 40 0.20 0.10 0.10 0.00 120$ 60$ 60$ -$ 7 4 4 042 CFL Lum. F $ 600 47 1,920 0.860 41 0.20 0.15 0.10 0.10 120$ 90$ 60$ 60$ 9 7 5 550 MH Lum. G 767$ 67 1,347 0.464 20 0.20 0.20 0.15 0.10 153$ 153$ 115$ 77$ 13 13 10 770 MH Lum. G 767$ 92 2,778 0.589 30 0.15 0.25 0.25 0.20 115$ 192$ 192$ 153$ 14 23 23 18
100 MH Lum. G 778$ 129 3,936 0.550 31 0.10 0.15 0.25 0.30 78$ 117$ 195$ 234$ 13 19 32 39150 MH Lum. G 793$ 190 9,427 0.786 50 0.00 0.05 0.15 0.30 -$ 40$ 119$ 238$ 0 10 29 57
1.00 1.00 1.00 1.00 676$ 712$ 741$ 762$ 60 78 102 126
456$ 481$ 514$ 574$ 52 72 103 135
9$ 7$ 5$ 4$ $/W
AVERAGE:
2008 Basis of Design
2008 Basis of Design
2008 Basis of Design
Weighted Cost
Weighted Cost
Weighted Cost
Weighting Weighted W
Weighting Weighted W
Weighting Weighted W
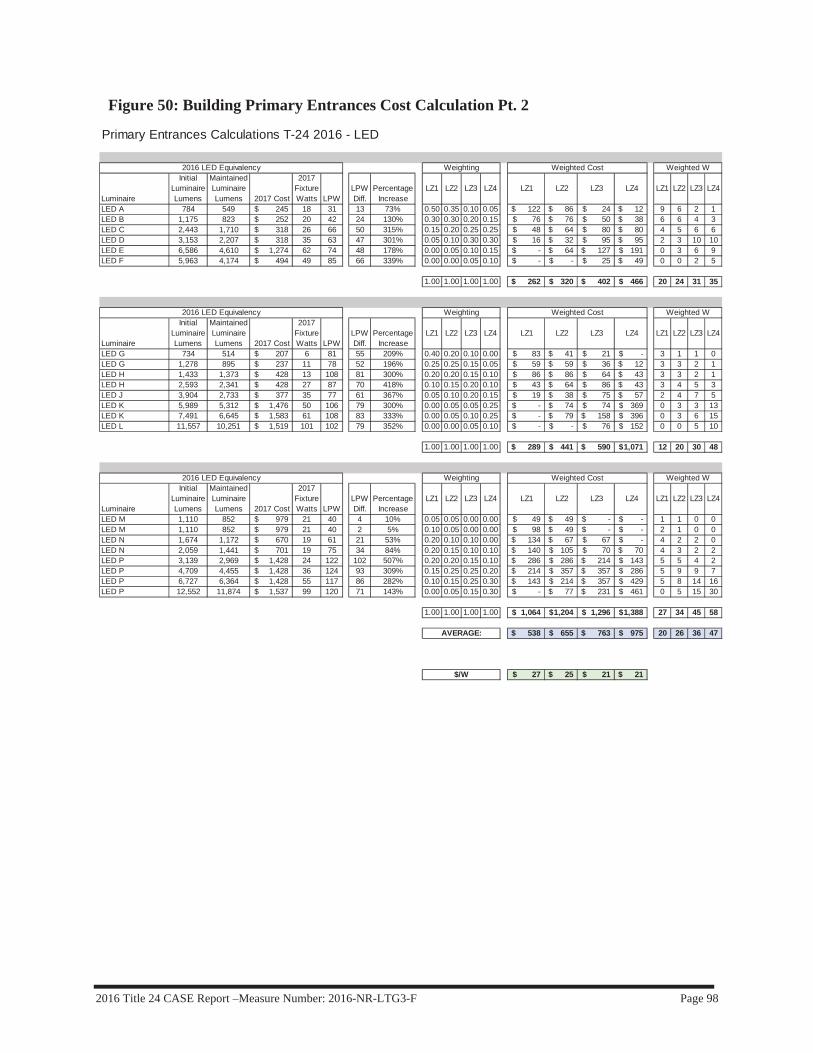
2016 Title 24 CASE Report –Measure Number: 2016-NR-LTG3-F Page 98
Figure 50: Building Primary Entrances Cost Calculation Pt. 2
Primary Entrances Calculations T-24 2016 - LED
Luminaire
Initial Luminaire Lumens
Maintained Luminaire Lumens 2017 Cost
2017 Fixture Watts LPW
LPW Diff.
Percentage Increase
LZ1 LZ2 LZ3 LZ4 LZ1 LZ2 LZ3 LZ4 LZ1 LZ2 LZ3 LZ4
LED A 784 549 245$ 18 31 13 73% 0.50 0.35 0.10 0.05 122$ 86$ 24$ 12$ 9 6 2 1LED B 1,175 823 252$ 20 42 24 130% 0.30 0.30 0.20 0.15 76$ 76$ 50$ 38$ 6 6 4 3LED C 2,443 1,710 318$ 26 66 50 315% 0.15 0.20 0.25 0.25 48$ 64$ 80$ 80$ 4 5 6 6LED D 3,153 2,207 318$ 35 63 47 301% 0.05 0.10 0.30 0.30 16$ 32$ 95$ 95$ 2 3 10 10LED E 6,586 4,610 1,274$ 62 74 48 178% 0.00 0.05 0.10 0.15 -$ 64$ 127$ 191$ 0 3 6 9LED F 5,963 4,174 494$ 49 85 66 339% 0.00 0.00 0.05 0.10 -$ -$ 25$ 49$ 0 0 2 5
1.00 1.00 1.00 1.00 262$ 320$ 402$ 466$ 20 24 31 35
Luminaire
Initial Luminaire Lumens
Maintained Luminaire Lumens 2017 Cost
2017 Fixture Watts LPW
LPW Diff.
Percentage Increase
LZ1 LZ2 LZ3 LZ4 LZ1 LZ2 LZ3 LZ4 LZ1 LZ2 LZ3 LZ4
LED G 734 514 207$ 6 81 55 209% 0.40 0.20 0.10 0.00 83$ 41$ 21$ -$ 3 1 1 0LED G 1,278 895 237$ 11 78 52 196% 0.25 0.25 0.15 0.05 59$ 59$ 36$ 12$ 3 3 2 1LED H 1,433 1,373 428$ 13 108 81 300% 0.20 0.20 0.15 0.10 86$ 86$ 64$ 43$ 3 3 2 1LED H 2,593 2,341 428$ 27 87 70 418% 0.10 0.15 0.20 0.10 43$ 64$ 86$ 43$ 3 4 5 3LED J 3,904 2,733 377$ 35 77 61 367% 0.05 0.10 0.20 0.15 19$ 38$ 75$ 57$ 2 4 7 5LED K 5,989 5,312 1,476$ 50 106 79 300% 0.00 0.05 0.05 0.25 -$ 74$ 74$ 369$ 0 3 3 13LED K 7,491 6,645 1,583$ 61 108 83 333% 0.00 0.05 0.10 0.25 -$ 79$ 158$ 396$ 0 3 6 15LED L 11,557 10,251 1,519$ 101 102 79 352% 0.00 0.00 0.05 0.10 -$ -$ 76$ 152$ 0 0 5 10
1.00 1.00 1.00 1.00 289$ 441$ 590$ 1,071$ 12 20 30 48
Luminaire
Initial Luminaire Lumens
Maintained Luminaire Lumens 2017 Cost
2017 Fixture Watts LPW
LPW Diff.
Percentage Increase
LZ1 LZ2 LZ3 LZ4 LZ1 LZ2 LZ3 LZ4 LZ1 LZ2 LZ3 LZ4
LED M 1,110 852 979$ 21 40 4 10% 0.05 0.05 0.00 0.00 49$ 49$ -$ -$ 1 1 0 0LED M 1,110 852 979$ 21 40 2 5% 0.10 0.05 0.00 0.00 98$ 49$ -$ -$ 2 1 0 0LED N 1,674 1,172 670$ 19 61 21 53% 0.20 0.10 0.10 0.00 134$ 67$ 67$ -$ 4 2 2 0LED N 2,059 1,441 701$ 19 75 34 84% 0.20 0.15 0.10 0.10 140$ 105$ 70$ 70$ 4 3 2 2LED P 3,139 2,969 1,428$ 24 122 102 507% 0.20 0.20 0.15 0.10 286$ 286$ 214$ 143$ 5 5 4 2LED P 4,709 4,455 1,428$ 36 124 93 309% 0.15 0.25 0.25 0.20 214$ 357$ 357$ 286$ 5 9 9 7LED P 6,727 6,364 1,428$ 55 117 86 282% 0.10 0.15 0.25 0.30 143$ 214$ 357$ 429$ 5 8 14 16LED P 12,552 11,874 1,537$ 99 120 71 143% 0.00 0.05 0.15 0.30 -$ 77$ 231$ 461$ 0 5 15 30
1.00 1.00 1.00 1.00 1,064$ 1,204$ 1,296$ 1,388$ 27 34 45 58
538$ 655$ 763$ 975$ 20 26 36 47
27$ 25$ 21$ 21$
Weighted Cost
Weighted Cost
Weighted Cost
$/W
AVERAGE:
2016 LED Equivalency
2016 LED Equivalency
2016 LED Equivalency
Weighted W
Weighting Weighted W
Weighting Weighted W
Weighting
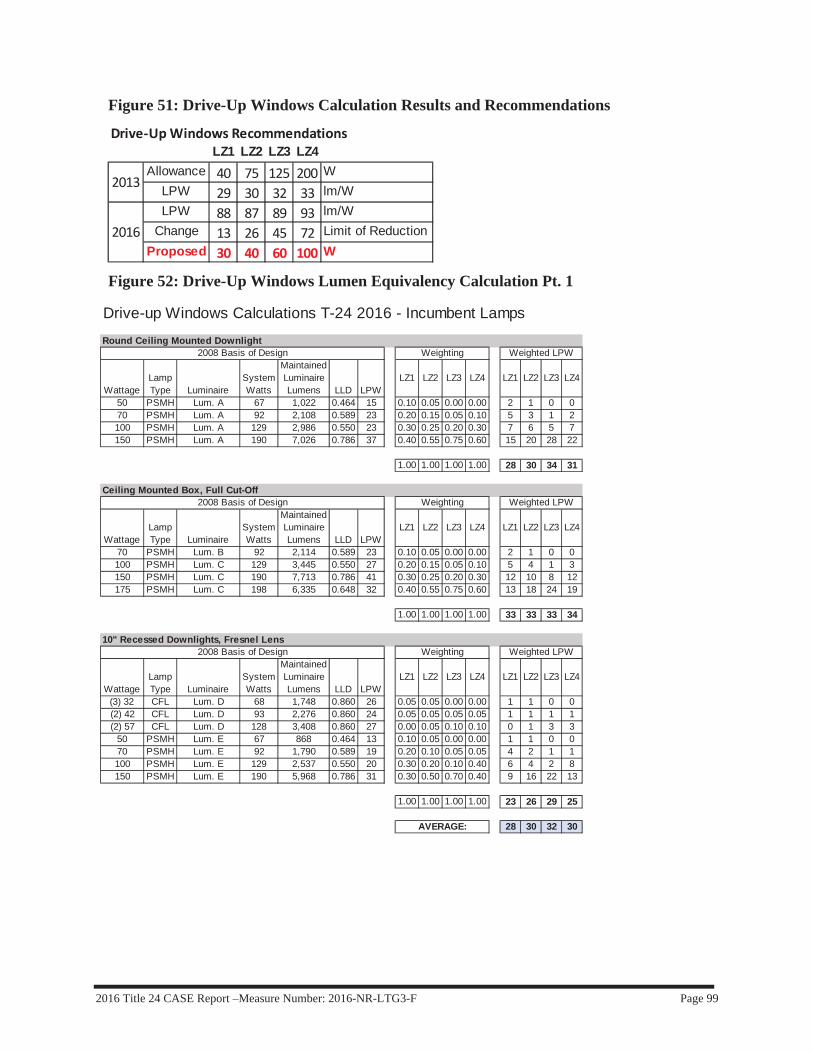
2016 Title 24 CASE Report –Measure Number: 2016-NR-LTG3-F Page 99
Figure 51: Drive-Up Windows Calculation Results and Recommendations
Figure 52: Drive-Up Windows Lumen Equivalency Calculation Pt. 1
Drive UpWindows RecommendationsLZ1 LZ2 LZ3 LZ4
Allowance 40 75 125 200 WLPW 29 30 32 33 lm/WLPW 88 87 89 93 lm/W
Change 13 26 45 72 Limit of ReductionProposed 30 40 60 100 W
2013
2016
Drive-up Windows Calculations T-24 2016 - Incumbent Lamps
Round Ceiling Mounted Downlight
WattageLamp Type Luminaire
System Watts
Maintained Luminaire Lumens LLD LPW
LZ1 LZ2 LZ3 LZ4 LZ1 LZ2 LZ3 LZ4
50 PSMH Lum. A 67 1,022 0.464 15 0.10 0.05 0.00 0.00 2 1 0 070 PSMH Lum. A 92 2,108 0.589 23 0.20 0.15 0.05 0.10 5 3 1 2100 PSMH Lum. A 129 2,986 0.550 23 0.30 0.25 0.20 0.30 7 6 5 7150 PSMH Lum. A 190 7,026 0.786 37 0.40 0.55 0.75 0.60 15 20 28 22
1.00 1.00 1.00 1.00 28 30 34 31
Ceiling Mounted Box, Full Cut-Off
WattageLamp Type Luminaire
System Watts
Maintained Luminaire Lumens LLD LPW
LZ1 LZ2 LZ3 LZ4 LZ1 LZ2 LZ3 LZ4
70 PSMH Lum. B 92 2,114 0.589 23 0.10 0.05 0.00 0.00 2 1 0 0100 PSMH Lum. C 129 3,445 0.550 27 0.20 0.15 0.05 0.10 5 4 1 3150 PSMH Lum. C 190 7,713 0.786 41 0.30 0.25 0.20 0.30 12 10 8 12175 PSMH Lum. C 198 6,335 0.648 32 0.40 0.55 0.75 0.60 13 18 24 19
1.00 1.00 1.00 1.00 33 33 33 34
10" Recessed Downlights, Fresnel Lens
WattageLamp Type Luminaire
System Watts
Maintained Luminaire Lumens LLD LPW
LZ1 LZ2 LZ3 LZ4 LZ1 LZ2 LZ3 LZ4
(3) 32 CFL Lum. D 68 1,748 0.860 26 0.05 0.05 0.00 0.00 1 1 0 0(2) 42 CFL Lum. D 93 2,276 0.860 24 0.05 0.05 0.05 0.05 1 1 1 1(2) 57 CFL Lum. D 128 3,408 0.860 27 0.00 0.05 0.10 0.10 0 1 3 3
50 PSMH Lum. E 67 868 0.464 13 0.10 0.05 0.00 0.00 1 1 0 070 PSMH Lum. E 92 1,790 0.589 19 0.20 0.10 0.05 0.05 4 2 1 1100 PSMH Lum. E 129 2,537 0.550 20 0.30 0.20 0.10 0.40 6 4 2 8150 PSMH Lum. E 190 5,968 0.786 31 0.30 0.50 0.70 0.40 9 16 22 13
1.00 1.00 1.00 1.00 23 26 29 25
28 30 32 30
2008 Basis of Design
2008 Basis of Design
2008 Basis of Design Weighting Weighted LPW
AVERAGE:
Weighting Weighted LPW
Weighting Weighted LPW
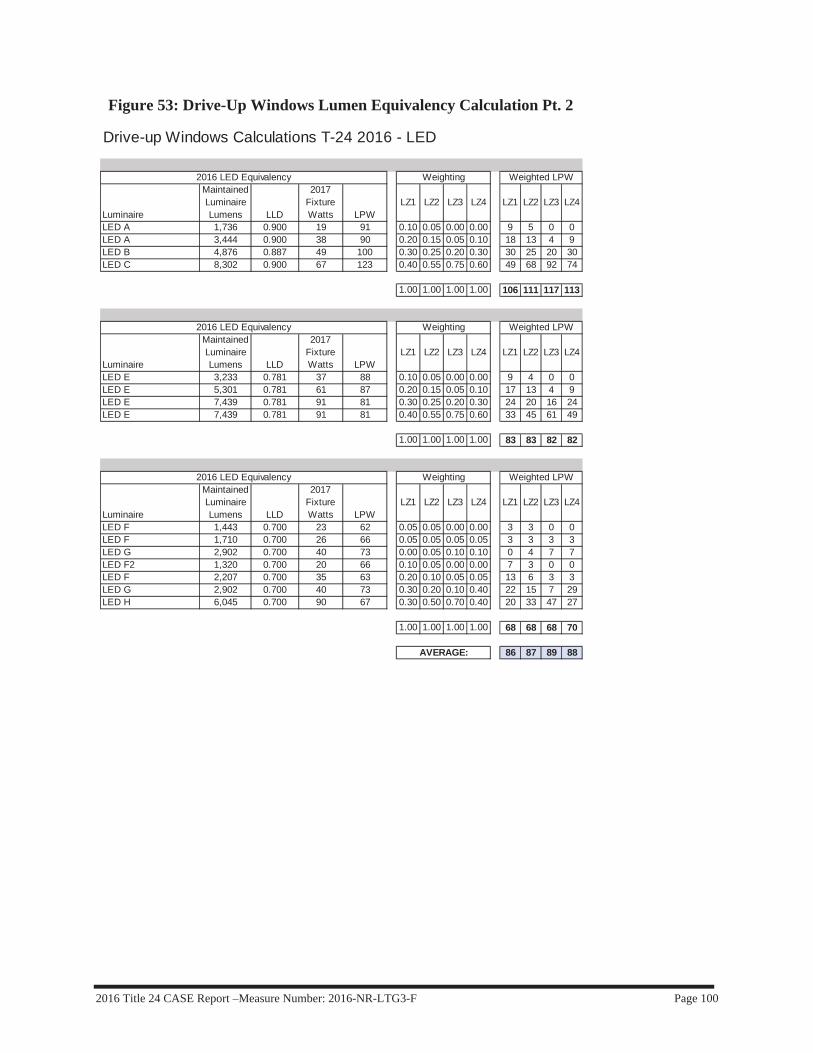
2016 Title 24 CASE Report –Measure Number: 2016-NR-LTG3-F Page 100
Figure 53: Drive-Up Windows Lumen Equivalency Calculation Pt. 2
Drive-up Windows Calculations T-24 2016 - LED
Luminaire
Maintained Luminaire Lumens LLD
2017 Fixture Watts LPW
LZ1 LZ2 LZ3 LZ4 LZ1 LZ2 LZ3 LZ4
LED A 1,736 0.900 19 91 0.10 0.05 0.00 0.00 9 5 0 0LED A 3,444 0.900 38 90 0.20 0.15 0.05 0.10 18 13 4 9LED B 4,876 0.887 49 100 0.30 0.25 0.20 0.30 30 25 20 30LED C 8,302 0.900 67 123 0.40 0.55 0.75 0.60 49 68 92 74
1.00 1.00 1.00 1.00 106 111 117 113
Luminaire
Maintained Luminaire Lumens LLD
2017 Fixture Watts LPW
LZ1 LZ2 LZ3 LZ4 LZ1 LZ2 LZ3 LZ4
LED E 3,233 0.781 37 88 0.10 0.05 0.00 0.00 9 4 0 0LED E 5,301 0.781 61 87 0.20 0.15 0.05 0.10 17 13 4 9LED E 7,439 0.781 91 81 0.30 0.25 0.20 0.30 24 20 16 24LED E 7,439 0.781 91 81 0.40 0.55 0.75 0.60 33 45 61 49
1.00 1.00 1.00 1.00 83 83 82 82
Luminaire
Maintained Luminaire Lumens LLD
2017 Fixture Watts LPW
LZ1 LZ2 LZ3 LZ4 LZ1 LZ2 LZ3 LZ4
LED F 1,443 0.700 23 62 0.05 0.05 0.00 0.00 3 3 0 0LED F 1,710 0.700 26 66 0.05 0.05 0.05 0.05 3 3 3 3LED G 2,902 0.700 40 73 0.00 0.05 0.10 0.10 0 4 7 7LED F2 1,320 0.700 20 66 0.10 0.05 0.00 0.00 7 3 0 0LED F 2,207 0.700 35 63 0.20 0.10 0.05 0.05 13 6 3 3LED G 2,902 0.700 40 73 0.30 0.20 0.10 0.40 22 15 7 29LED H 6,045 0.700 90 67 0.30 0.50 0.70 0.40 20 33 47 27
1.00 1.00 1.00 1.00 68 68 68 70
86 87 89 88
2016 LED Equivalency
2016 LED Equivalency
2016 LED Equivalency
AVERAGE:
Weighting Weighted LPW
Weighting Weighted LPW
Weighting Weighted LPW
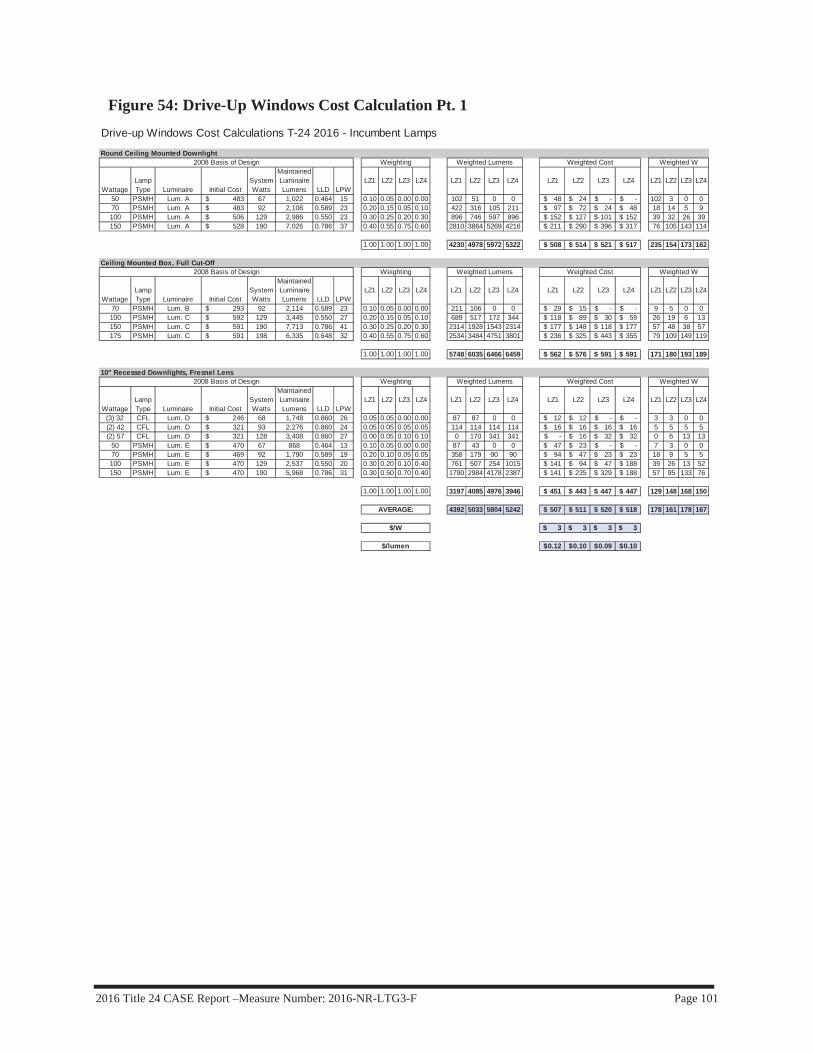
2016 Title 24 CASE Report –Measure Number: 2016-NR-LTG3-F Page 101
Figure 54: Drive-Up Windows Cost Calculation Pt. 1
Drive-up Windows Cost Calculations T-24 2016 - Incumbent Lamps
Round Ceiling Mounted Downlight
WattageLamp Type Luminaire Initial Cost
System Watts
Maintained Luminaire Lumens LLD LPW
LZ1 LZ2 LZ3 LZ4 LZ1 LZ2 LZ3 LZ4 LZ1 LZ2 LZ3 LZ4 LZ1 LZ2 LZ3 LZ4
50 PSMH Lum. A 483$ 67 1,022 0.464 15 0.10 0.05 0.00 0.00 102 51 0 0 48$ 24$ -$ -$ 102 3 0 070 PSMH Lum. A 483$ 92 2,108 0.589 23 0.20 0.15 0.05 0.10 422 316 105 211 97$ 72$ 24$ 48$ 18 14 5 9100 PSMH Lum. A 506$ 129 2,986 0.550 23 0.30 0.25 0.20 0.30 896 746 597 896 152$ 127$ 101$ 152$ 39 32 26 39150 PSMH Lum. A 528$ 190 7,026 0.786 37 0.40 0.55 0.75 0.60 2810 3864 5269 4216 211$ 290$ 396$ 317$ 76 105 143 114
1.00 1.00 1.00 1.00 4230 4978 5972 5322 508$ 514$ 521$ 517$ 235 154 173 162
Ceiling Mounted Box, Full Cut-Off
WattageLamp Type Luminaire Initial Cost
System Watts
Maintained Luminaire Lumens LLD LPW
LZ1 LZ2 LZ3 LZ4 LZ1 LZ2 LZ3 LZ4 LZ1 LZ2 LZ3 LZ4 LZ1 LZ2 LZ3 LZ4
70 PSMH Lum. B 293$ 92 2,114 0.589 23 0.10 0.05 0.00 0.00 211 106 0 0 29$ 15$ -$ -$ 9 5 0 0100 PSMH Lum. C 592$ 129 3,445 0.550 27 0.20 0.15 0.05 0.10 689 517 172 344 118$ 89$ 30$ 59$ 26 19 6 13150 PSMH Lum. C 591$ 190 7,713 0.786 41 0.30 0.25 0.20 0.30 2314 1928 1543 2314 177$ 148$ 118$ 177$ 57 48 38 57175 PSMH Lum. C 591$ 198 6,335 0.648 32 0.40 0.55 0.75 0.60 2534 3484 4751 3801 236$ 325$ 443$ 355$ 79 109 149 119
1.00 1.00 1.00 1.00 5748 6035 6466 6459 562$ 576$ 591$ 591$ 171 180 193 189
10" Recessed Downlights, Fresnel Lens
WattageLamp Type Luminaire Initial Cost
System Watts
Maintained Luminaire Lumens LLD LPW
LZ1 LZ2 LZ3 LZ4 LZ1 LZ2 LZ3 LZ4 LZ1 LZ2 LZ3 LZ4 LZ1 LZ2 LZ3 LZ4
(3) 32 CFL Lum. D 246$ 68 1,748 0.860 26 0.05 0.05 0.00 0.00 87 87 0 0 12$ 12$ -$ -$ 3 3 0 0(2) 42 CFL Lum. D 321$ 93 2,276 0.860 24 0.05 0.05 0.05 0.05 114 114 114 114 16$ 16$ 16$ 16$ 5 5 5 5(2) 57 CFL Lum. D 321$ 128 3,408 0.860 27 0.00 0.05 0.10 0.10 0 170 341 341 -$ 16$ 32$ 32$ 0 6 13 13
50 PSMH Lum. E 470$ 67 868 0.464 13 0.10 0.05 0.00 0.00 87 43 0 0 47$ 23$ -$ -$ 7 3 0 070 PSMH Lum. E 469$ 92 1,790 0.589 19 0.20 0.10 0.05 0.05 358 179 90 90 94$ 47$ 23$ 23$ 18 9 5 5100 PSMH Lum. E 470$ 129 2,537 0.550 20 0.30 0.20 0.10 0.40 761 507 254 1015 141$ 94$ 47$ 188$ 39 26 13 52150 PSMH Lum. E 470$ 190 5,968 0.786 31 0.30 0.50 0.70 0.40 1790 2984 4178 2387 141$ 235$ 329$ 188$ 57 95 133 76
1.00 1.00 1.00 1.00 3197 4085 4976 3946 451$ 443$ 447$ 447$ 129 148 168 150
4392 5033 5804 5242 507$ 511$ 520$ 518$ 178 161 178 167
3$ 3$ 3$ 3$
0.12$ 0.10$ 0.09$ 0.10$
2008 Basis of Design Weighting Weighted W
AVERAGE:
Weighted Cost
2008 Basis of Design Weighting Weighted WWeighted Cost
2008 Basis of Design Weighting Weighted WWeighted Cost
$/lumen
Weighted Lumens
Weighted Lumens
Weighted Lumens
$/W
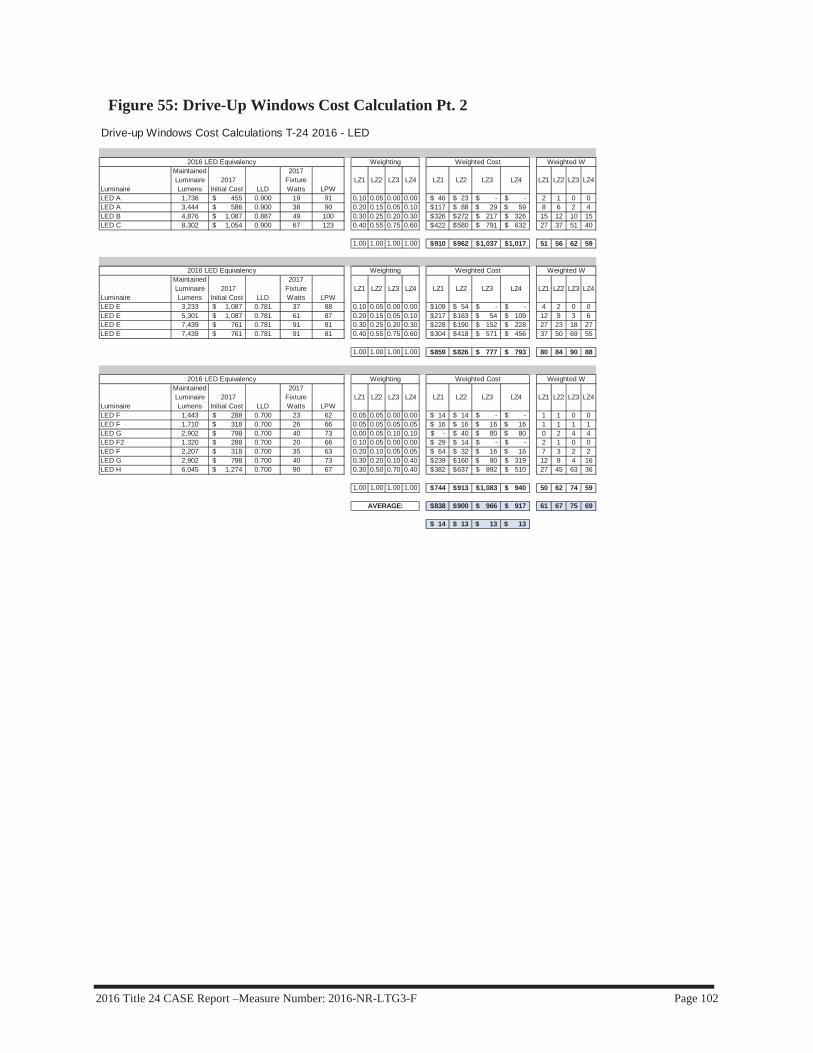
2016 Title 24 CASE Report –Measure Number: 2016-NR-LTG3-F Page 102
Figure 55: Drive-Up Windows Cost Calculation Pt. 2
Drive-up Windows Cost Calculations T-24 2016 - LED
Luminaire
Maintained Luminaire Lumens
2017 Initial Cost LLD
2017 Fixture Watts LPW
LZ1 LZ2 LZ3 LZ4 LZ1 LZ2 LZ3 LZ4 LZ1 LZ2 LZ3 LZ4
LED A 1,736 455$ 0.900 19 91 0.10 0.05 0.00 0.00 46$ 23$ -$ -$ 2 1 0 0LED A 3,444 586$ 0.900 38 90 0.20 0.15 0.05 0.10 117$ 88$ 29$ 59$ 8 6 2 4LED B 4,876 1,087$ 0.887 49 100 0.30 0.25 0.20 0.30 326$ 272$ 217$ 326$ 15 12 10 15LED C 8,302 1,054$ 0.900 67 123 0.40 0.55 0.75 0.60 422$ 580$ 791$ 632$ 27 37 51 40
1.00 1.00 1.00 1.00 910$ 962$ 1,037$ 1,017$ 51 56 62 59
Luminaire
Maintained Luminaire Lumens
2017 Initial Cost LLD
2017 Fixture Watts LPW
LZ1 LZ2 LZ3 LZ4 LZ1 LZ2 LZ3 LZ4 LZ1 LZ2 LZ3 LZ4
LED E 3,233 1,087$ 0.781 37 88 0.10 0.05 0.00 0.00 109$ 54$ -$ -$ 4 2 0 0LED E 5,301 1,087$ 0.781 61 87 0.20 0.15 0.05 0.10 217$ 163$ 54$ 109$ 12 9 3 6LED E 7,439 761$ 0.781 91 81 0.30 0.25 0.20 0.30 228$ 190$ 152$ 228$ 27 23 18 27LED E 7,439 761$ 0.781 91 81 0.40 0.55 0.75 0.60 304$ 418$ 571$ 456$ 37 50 69 55
1.00 1.00 1.00 1.00 859$ 826$ 777$ 793$ 80 84 90 88
Luminaire
Maintained Luminaire Lumens
2017 Initial Cost LLD
2017 Fixture Watts LPW
LZ1 LZ2 LZ3 LZ4 LZ1 LZ2 LZ3 LZ4 LZ1 LZ2 LZ3 LZ4
LED F 1,443 288$ 0.700 23 62 0.05 0.05 0.00 0.00 14$ 14$ -$ -$ 1 1 0 0LED F 1,710 318$ 0.700 26 66 0.05 0.05 0.05 0.05 16$ 16$ 16$ 16$ 1 1 1 1LED G 2,902 798$ 0.700 40 73 0.00 0.05 0.10 0.10 -$ 40$ 80$ 80$ 0 2 4 4LED F2 1,320 288$ 0.700 20 66 0.10 0.05 0.00 0.00 29$ 14$ -$ -$ 2 1 0 0LED F 2,207 318$ 0.700 35 63 0.20 0.10 0.05 0.05 64$ 32$ 16$ 16$ 7 3 2 2LED G 2,902 798$ 0.700 40 73 0.30 0.20 0.10 0.40 239$ 160$ 80$ 319$ 12 8 4 16LED H 6,045 1,274$ 0.700 90 67 0.30 0.50 0.70 0.40 382$ 637$ 892$ 510$ 27 45 63 36
1.00 1.00 1.00 1.00 744$ 913$ 1,083$ 940$ 50 62 74 59
838$ 900$ 966$ 917$ 61 67 75 69
14$ 13$ 13$ 13$
2016 LED Equivalency
2016 LED Equivalency Weighting
2016 LED Equivalency Weighting Weighted WWeighted Cost
Weighted WWeighted Cost
Weighted WWeighted Cost
AVERAGE:
Weighting

2016 Title 24 CASE Report –Measure Number: 2016-NR-LTG3-F Page 103
Figure 56: Vehicle Service Station Uncovered Fuel Dispenser Calculation Results and Recommendations
Figure 57: Vehicle Service Station Uncovered Fuel Dispenser Lumen Equivalency Calculation Pt. 1
Figure 58: Vehicle Service Station Uncovered Fuel Dispenser Lumen Equivalency Calculation Pt. 2
Uncovered Fuel Dispensers RecommendationsLZ1 LZ2 LZ3 LZ4
Allowance 120 175 185 330 WLPW 27 27 26 26 lm/WLPW 85 89 93 97 lm/W
Change 38 52 52 90 Limit of ReductionProposed 80 100 140 160 W
2013
2016
Uncovered Fuel Dispensers Calculations T-24 2016 - Incumbent Lamps
Area
WattageLamp Type Luminaire
System Watts
Maintained Luminaire Lumens LLD LPW
LZ1 LZ2 LZ3 LZ4 LZ1 LZ2 LZ3 LZ4
100 PSMH Lum. A 129 2,809 0.550 22 0.20 0.10 0.05 0.00 4 2 1 0150 PSMH Lum. A 190 6,558 0.786 35 0.30 0.20 0.10 0.05 10 7 3 2175 PSMH Lum. A 198 5,053 0.648 26 0.30 0.30 0.30 0.25 8 8 8 6250 PSMH Lum. A 291 6,697 0.611 23 0.20 0.30 0.35 0.40 5 7 8 9400 PSMH Lum. A 452 13,641 0.723 30 0.00 0.10 0.20 0.30 0 3 6 9
1.00 1.00 1.00 1.00 27 27 26 26
27 27 26 26
2008 Basis of Design
AVERAGE:
Weighting Weighted LPW
Uncovered Fuel Dispensers Calculations T-24 2016 - LED
Luminaire
Maintained Luminaire Lumens
2017 Fixture Watts LPW
LZ1 LZ2 LZ3 LZ4 LZ1 LZ2 LZ3 LZ4
LED A 3,331 37 89 0.20 0.10 0.05 0.00 18 9 4 0LED A 5,965 76 79 0.30 0.20 0.10 0.05 24 16 8 4LED A 5,391 60 90 0.30 0.30 0.30 0.25 27 27 27 23LED A 7,662 90 85 0.20 0.30 0.35 0.40 17 25 30 34LED B 16,942 139 122 0.00 0.10 0.20 0.30 0 12 24 37
1.00 1.00 1.00 1.00 85 89 93 97
85 89 93 97
Weighting Weighted LPW2016 LED Equivalency
AVERAGE:

2016 Title 24 CASE Report –Measure Number: 2016-NR-LTG3-F Page 104
Figure 59: Vehicle Service Station Uncovered Fuel Dispenser Cost Calculation Pt. 1
Figure 60: Vehicle Service Station Uncovered Fuel Dispenser Cost Calculation Pt. 2
Uncovered Fuel Dispensers Calculations T-24 2016 - Incumbent Lamps
Area
WattageLamp Type Luminaire
System Watts
Initial Cost
Maintained Luminaire Lumens LPW
LZ1 LZ2 LZ3 LZ4 LZ1 LZ2 LZ3 LZ4 LZ1 LZ2 LZ3 LZ4
100 PSMH Lum. A 129 1,035$ 2,809 22 0.20 0.10 0.05 0.00 207$ 104$ 52$ -$ 26 13 6 0150 PSMH Lum. A 190 1,035$ 6,558 35 0.30 0.20 0.10 0.05 311$ 207$ 104$ 52$ 57 38 19 10175 PSMH Lum. A 198 1,035$ 5,053 26 0.30 0.30 0.30 0.25 311$ 311$ 311$ 259$ 59 59 59 50250 PSMH Lum. A 291 1,235$ 6,697 23 0.20 0.30 0.35 0.40 247$ 370$ 432$ 494$ 58 87 102 116400 PSMH Lum. A 452 1,235$ 13,641 30 0.00 0.10 0.20 0.30 -$ 123$ 247$ 370$ 0 45 90 136
1.00 1.00 1.00 1.00 1,075$ 1,115$ 1,145$ 1,175$ 200 243 277 311
1,075$ 1,115$ 1,145$ 1,175$ 200 243 277 311
5$ 5$ 4$ 4$
2008 Basis of Design Weighting Weighted W
AVERAGE:
Weighted Cost
$/W
Uncovered Fuel Dispensers Calculations T-24 2016 -LED
Luminaire
Maintained Luminaire Lumens 2017 Cost
2017Fixture Watts LPW
LZ1 LZ2 LZ3 LZ4 LZ1 LZ2 LZ3 LZ4 LZ1 LZ2 LZ3 LZ4
LED A 3,331 1,204$ 37 89 0.20 0.10 0.05 0.00 241$ 120$ 60$ -$ 7 4 2 0LED A 5,965 1,720$ 76 79 0.30 0.20 0.10 0.05 516$ 344$ 172$ 86$ 23 15 8 4LED A 5,391 1,810$ 60 90 0.30 0.30 0.30 0.25 543$ 543$ 543$ 453$ 18 18 18 15LED A 7,662 1,810$ 90 85 0.20 0.30 0.35 0.40 362$ 543$ 634$ 724$ 18 27 32 36LED B 16,942 808$ 139 122 0.00 0.10 0.20 0.30 -$ 81$ 162$ 242$ 0 14 28 42
1.00 1.00 1.00 1.00 1,662$ 1,631$ 1,570$ 1,505$ 66 78 87 97
1,662$ 1,631$ 1,570$ 1,505$ 66 78 87 97
25$ 21$ 18$ 16$
Weighted LPW2016 LED Equivalency Weighting
AVERAGE:
Weighted Cost
$/W

2016 Title 24 CASE Report –Measure Number: 2016-NR-LTG3-F Page 105
Figure 61: ATM Calculation Results and Recommendations
Lumen equivalency calculations were mot performed for the ATM allowance. Instead, a lighting system was calculated to meet the illuminance calculations and was used as the proposal.
ATMRecommendationsLZ1 LZ2 LZ3 LZ4
Watts for First ATM 185 185 186 185Watts for Add'l ATMs 60 60 60 60Watts for First ATM 250 250 250 250
Watts for Add'l ATMs 70 70 70 70
2016Limit of Reduction
Proposed

2016 Title 24 CASE Report –Measure Number: 2016-NR-LTG3-F Page 106
Figure 62: Outdoor Sales Frontage Calculation Results and Recommendations
Figure 63: Outdoor Sales Frontage Lumen Equivalency Calculation Pt. 1
Outdoor Sales Frontage RecommendationsLZ1 LZ2 LZ3 LZ4
Allowance 22.5 36.0 45.0 W/lfLPW 33 34 38 44 lm/WLPW 95 102 110 108 lm/W
Change 7 12 18 Limit of ReductionProposed 15 25 30 W/lf
2008
2016
Sales Frontage Calculations T-24 2016 - Incumbent Lamps
Area
WattageLamp Type Luminaire
System Watts
Maintained Luminaire Lumens LLD LPW
LZ1 LZ2 LZ3 LZ4 LZ1 LZ2 LZ3 LZ4
100 PSMH Lum. A 129 2,809 0.550 22 0.10 0.05 0.00 0.00 2 1 0 0150 PSMH Lum. A 190 6,558 0.786 35 0.20 0.10 0.00 0.00 7 3 0 0175 PSMH Lum. A 198 5,053 0.648 26 0.25 0.20 0.10 0.00 6 5 3 0250 PSMH Lum. A 291 6,697 0.611 23 0.20 0.25 0.20 0.10 5 6 5 2320 PSMH Lum. A 368 11,997 0.704 33 0.15 0.20 0.20 0.15 5 7 7 5400 PSMH Lum. A 452 13,641 0.723 30 0.10 0.15 0.25 0.20 3 5 8 6750 PSMH Lum. A 818 37,028 0.824 45 0.00 0.05 0.15 0.25 0 2 7 11
1000 PSMH Lum. A 1080 57,062 0.801 53 0.00 0.00 0.10 0.30 0 0 5 16
1.00 1.00 1.00 1.00 28 29 33 40
Flood
WattageLamp Type Luminaire
System Watts
Maintained Luminaire Lumens LLD LPW
LZ1 LZ2 LZ3 LZ4 LZ1 LZ2 LZ3 LZ4
100 PSMH Lum. B 129 3,488 0.550 27 0.10 0.05 0.00 0.00 3 1 0 0150 PSMH Lum. B 190 8,207 0.786 43 0.20 0.10 0.00 0.00 9 4 0 0175 PSMH Lum. B 198 6,192 0.648 31 0.25 0.20 0.10 0.00 8 6 3 0250 PSMH Lum. B 291 9,645 0.611 33 0.20 0.25 0.20 0.10 7 8 7 3320 PSMH Lum. B 368 17,273 0.704 47 0.15 0.20 0.20 0.15 7 9 9 7400 PSMH Lum. B 452 19,640 0.723 43 0.10 0.15 0.25 0.20 4 7 11 9750 PSMH Lum. B 818 37,800 0.824 46 0.00 0.05 0.15 0.25 0 2 7 12
1000 PSMH Lum. B 1080 58,253 0.801 54 0.00 0.00 0.10 0.30 0 0 5 16
1.00 1.00 1.00 1.00 37 38 42 47
33 34 38 44
2008 Basis of Design
AVERAGE:
Weighting Weighted LPW
2008 Basis of Design Weighting Weighted LPW

2016 Title 24 CASE Report –Measure Number: 2016-NR-LTG3-F Page 107
Figure 64: Outdoor Sales Frontage Lumen Equivalency Calculation Pt. 2
Sales Frontage Calculations T-24 2016 - LED
Luminaire
Maintained Luminaire Lumens
2017Fixture Watts LPW
LZ1 LZ2 LZ3 LZ4 LZ1 LZ2 LZ3 LZ4
LED A 3,331 37 89 0.10 0.05 0.00 0.00 9 4 0 0LED A 5,965 76 79 0.20 0.10 0.00 0.00 16 8 0 0LED A 5,391 60 90 0.25 0.20 0.10 0.00 23 18 9 0LED A 7,662 90 85 0.20 0.25 0.20 0.10 17 21 17 8LED B 15,789 130 122 0.15 0.20 0.20 0.15 18 24 24 18LED B 16,942 139 122 0.10 0.15 0.25 0.20 12 18 30 24LED C 39,885 378 106 0.00 0.05 0.15 0.25 0 5 16 26LED C 48,959 589 83 0.00 0.00 0.10 0.30 0 0 8 25
1.00 1.00 1.00 1.00 95 99 105 102
Luminaire
Maintained Luminaire Lumens
2017Fixture Watts LPW
LZ1 LZ2 LZ3 LZ4 LZ1 LZ2 LZ3 LZ4
LED E 6,988 58 120 0.10 0.05 0.00 0.00 12 6 0 0LED F 8,719 112 78 0.20 0.10 0.00 0.00 16 8 0 0LED E 9,151 78 117 0.25 0.20 0.10 0.00 29 23 12 0LED E 12,699 121 105 0.20 0.25 0.20 0.10 21 26 21 11LED F 20,183 179 113 0.15 0.20 0.20 0.15 17 23 23 17LED G 23,812 189 126 0.10 0.15 0.25 0.20 13 19 31 25LED G 47,655 378 126 0.00 0.05 0.15 0.25 0 6 19 32LED G 58,496 589 99 0.00 0.00 0.10 0.30 0 0 10 30
1.00 1.00 1.00 1.00 107 111 116 114
101 105 110 108
Weighting Weighted LPW2016 LED Equivalency
AVERAGE:
Weighted LPW2016 LED Equivalency Weighting

2016 Title 24 CASE Report –Measure Number: 2016-NR-LTG3-F Page 108
Figure 65: Outdoor Sales Frontage Cost Calculation Pt. 1
Figure 66: Outdoor Sales Frontage Cost Calculation Pt. 2
Sales Frontage Calculations T-24 2016 - Incumbent Lamps
Area
WattageLamp Type Luminaire Initial Cost
System Watts
Maintained Luminaire Lumens LLD LPW
LZ1 LZ2 LZ3 LZ4 LZ1 LZ2 LZ3 LZ4 LZ1 LZ2 LZ3 LZ4
100 PSMH Lum. A 1,035$ 129 2,809 0.550 22 0.10 0.05 0.00 0.00 104$ 52$ -$ -$ 13 6 0 0150 PSMH Lum. A 1,035$ 190 6,558 0.786 35 0.20 0.10 0.00 0.00 207$ 104$ -$ -$ 38 19 0 0175 PSMH Lum. A 1,235$ 198 5,053 0.648 26 0.25 0.20 0.10 0.00 309$ 247$ 123$ -$ 50 40 20 0250 PSMH Lum. A 1,235$ 291 6,697 0.611 23 0.20 0.25 0.20 0.10 247$ 309$ 247$ 123$ 58 73 58 29320 PSMH Lum. A 1,235$ 368 11,997 0.704 33 0.15 0.20 0.20 0.15 185$ 247$ 247$ 185$ 55 74 74 55400 PSMH Lum. A 1,265$ 452 13,641 0.723 30 0.10 0.15 0.25 0.20 126$ 190$ 316$ 253$ 45 68 113 90750 PSMH Lum. A 1,265$ 818 37,028 0.824 45 0.00 0.05 0.15 0.25 -$ 63$ 190$ 316$ 0 41 123 205
1000 PSMH Lum. A 1,265$ 1080 57,062 0.801 53 0.00 0.00 0.10 0.30 -$ -$ 126$ 379$ 0 0 108 324
1.00 1.00 1.00 1.00 1,178$ 1,211$ 1,250$ 1,257$ 259 320 495 703
Flood
WattageLamp Type Luminaire Initial Cost
System Watts
Maintained Luminaire Lumens LLD LPW
LZ1 LZ2 LZ3 LZ4 LZ1 LZ2 LZ3 LZ4 LZ1 LZ2 LZ3 LZ4
100 PSMH Lum. B 1,007$ 129 3,488 0.550 27 0.10 0.05 0.00 0.00 101$ 50$ -$ -$ 13 6 0 0150 PSMH Lum. B 1,007$ 190 8,207 0.786 43 0.20 0.10 0.00 0.00 201$ 101$ -$ -$ 38 19 0 0175 PSMH Lum. B 1,007$ 198 6,192 0.648 31 0.25 0.20 0.10 0.00 252$ 201$ 101$ -$ 50 40 20 0250 PSMH Lum. B 1,007$ 291 9,645 0.611 33 0.20 0.25 0.20 0.10 201$ 252$ 201$ 101$ 58 73 58 29320 PSMH Lum. B 1,219$ 368 17,273 0.704 47 0.15 0.20 0.20 0.15 183$ 244$ 244$ 183$ 55 74 74 55400 PSMH Lum. B 1,219$ 452 19,640 0.723 43 0.10 0.15 0.25 0.20 122$ 183$ 305$ 244$ 45 68 113 90750 PSMH Lum. B 1,219$ 818 37,800 0.824 46 0.00 0.05 0.15 0.25 -$ 61$ 183$ 305$ 0 41 123 205
1000 PSMH Lum. B 1,219$ 1080 58,253 0.801 54 0.00 0.00 0.10 0.30 -$ -$ 122$ 366$ 0 0 108 324
1.00 1.00 1.00 1.00 1,060$ 1,092$ 1,156$ 1,198$ 259 320 495 703
1,119$ 1,151$ 1,203$ 1,228$ 259 320 495 703
4.32$ 3.60$ 2.43$ 1.75$
AVERAGE:
Weighted Cost
Weighted Cost
$/W
2008 Basis of Design Weighting Weighted W
2008 Basis of Design Weighting Weighted W
Sales Frontage Calculations T-24 2016 - LED
Luminaire
Maintained Luminaire Lumens 2017 Cost
2017 Fixture Watts LPW
LZ1 LZ2 LZ3 LZ4 LZ1 LZ2 LZ3 LZ4 LZ1 LZ2 LZ3 LZ4
LED A 3,331 1,204$ 37 89 0.10 0.05 0.00 0.00 120$ 60$ -$ -$ 4 2 0 0LED A 5,965 1,720$ 76 79 0.20 0.10 0.00 0.00 344$ 172$ -$ -$ 15 8 0 0LED A 5,391 1,810$ 60 90 0.25 0.20 0.10 0.00 453$ 362$ 181$ -$ 15 12 6 0LED A 7,662 1,810$ 90 85 0.20 0.25 0.20 0.10 362$ 453$ 362$ 181$ 18 23 18 9LED B 15,789 795$ 130 122 0.15 0.20 0.20 0.15 119$ 159$ 159$ 119$ 19 26 26 19LED B 16,942 808$ 139 122 0.10 0.15 0.25 0.20 81$ 121$ 202$ 162$ 14 21 35 28LED C 39,885 1,313$ 378 106 0.00 0.05 0.15 0.25 -$ 66$ 197$ 328$ 0 19 57 95LED C 48,959 1,626$ 589 83 0.00 0.00 0.10 0.30 -$ -$ 163$ 488$ 0 0 59 177
1.00 1.00 1.00 1.00 1,479$ 1,393$ 1,264$ 1,278$ 85 110 200 328
Luminaire
Maintained Luminaire Lumens 2017 Cost
2017 Fixture Watts LPW
LZ1 LZ2 LZ3 LZ4 LZ1 LZ2 LZ3 LZ4 LZ1 LZ2 LZ3 LZ4
LED E 6,988 1,013$ 58 120 0.10 0.05 0.00 0.00 101$ 51$ -$ -$ 6 3 0 0LED F 8,719 1,966$ 112 78 0.20 0.10 0.00 0.00 393$ 197$ -$ -$ 22 11 0 0LED E 9,151 1,013$ 78 117 0.25 0.20 0.10 0.00 253$ 203$ 101$ -$ 20 16 8 0LED E 12,699 1,383$ 121 105 0.20 0.25 0.20 0.10 277$ 346$ 277$ 138$ 24 30 24 12LED F 20,183 2,117$ 179 113 0.15 0.20 0.20 0.15 318$ 423$ 423$ 318$ 27 36 36 27LED G 23,812 788$ 189 126 0.10 0.15 0.25 0.20 79$ 118$ 197$ 158$ 19 28 47 38LED G 47,655 1,356$ 378 126 0.00 0.05 0.15 0.25 -$ 68$ 203$ 339$ 0 19 57 95LED G 58,496 1,418$ 589 99 0.00 0.00 0.10 0.30 -$ -$ 142$ 425$ 0 0 59 177
1.00 1.00 1.00 1.00 1,421$ 1,405$ 1,344$ 1,378$ 118 143 231 348
1,450$ 1,399$ 1,304$ 1,328$ 102 126 216 338
14.28$ 11.07$ 6.05$ 3.93$
AVERAGE:
$/W
Weighted WWeighted Cost
2016 LED Equivalency Weighting Weighted WWeighted Cost
2016 LED Equivalency Weighting
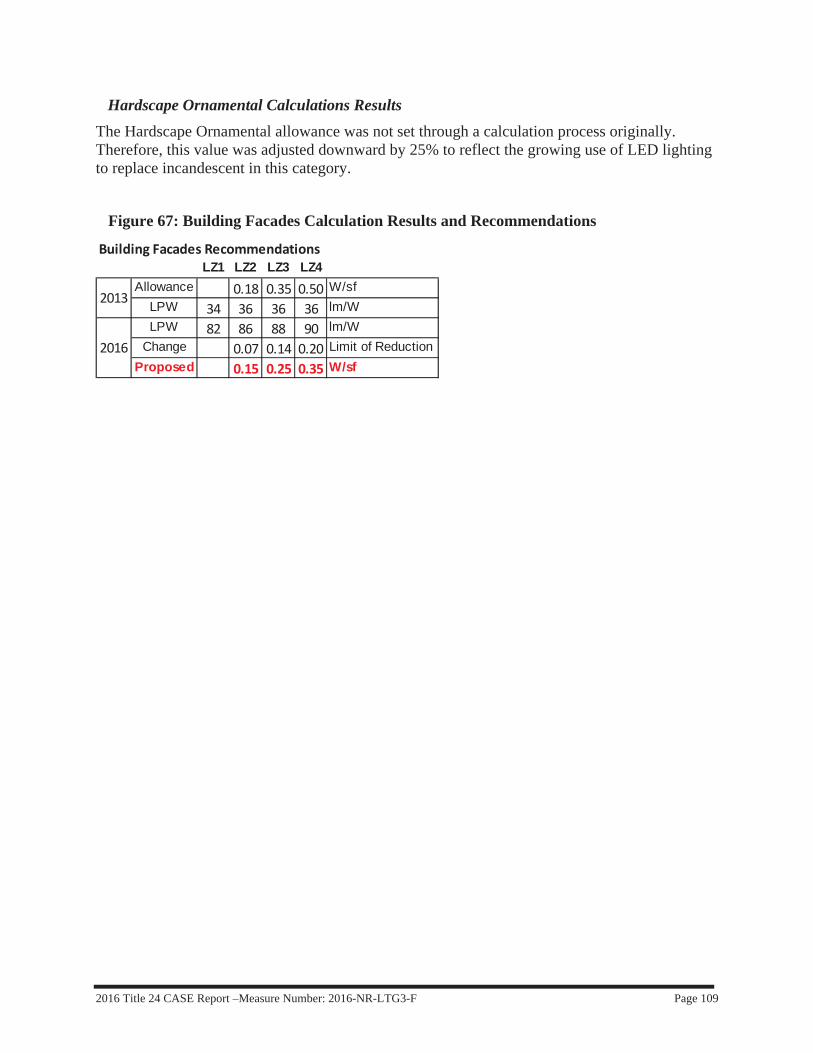
2016 Title 24 CASE Report –Measure Number: 2016-NR-LTG3-F Page 109
Hardscape Ornamental Calculations Results The Hardscape Ornamental allowance was not set through a calculation process originally. Therefore, this value was adjusted downward by 25% to reflect the growing use of LED lighting to replace incandescent in this category.
Figure 67: Building Facades Calculation Results and Recommendations
Building Facades RecommendationsLZ1 LZ2 LZ3 LZ4
Allowance 0.18 0.35 0.50 W/sfLPW 34 36 36 36 lm/WLPW 82 86 88 90 lm/W
Change 0.07 0.14 0.20 Limit of ReductionProposed 0.15 0.25 0.35 W/sf
2013
2016
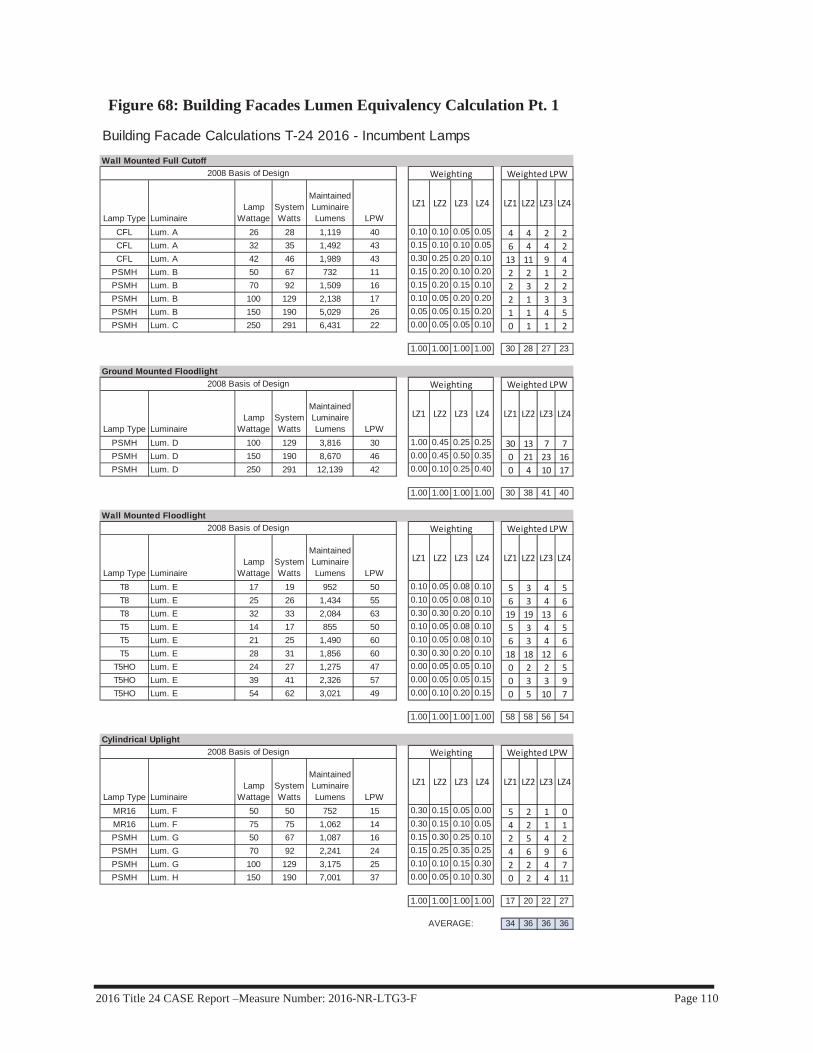
2016 Title 24 CASE Report –Measure Number: 2016-NR-LTG3-F Page 110
Figure 68: Building Facades Lumen Equivalency Calculation Pt. 1
Building Facade Calculations T-24 2016 - Incumbent Lamps
Wall Mounted Full Cutoff
Lamp Type LuminaireLamp
WattageSystem Watts
Maintained Luminaire Lumens LPW
LZ1 LZ2 LZ3 LZ4 LZ1 LZ2 LZ3 LZ4
CFL Lum. A 26 28 1,119 40 0.10 0.10 0.05 0.05 4 4 2 2CFL Lum. A 32 35 1,492 43 0.15 0.10 0.10 0.05 6 4 4 2CFL Lum. A 42 46 1,989 43 0.30 0.25 0.20 0.10 13 11 9 4
PSMH Lum. B 50 67 732 11 0.15 0.20 0.10 0.20 2 2 1 2PSMH Lum. B 70 92 1,509 16 0.15 0.20 0.15 0.10 2 3 2 2PSMH Lum. B 100 129 2,138 17 0.10 0.05 0.20 0.20 2 1 3 3PSMH Lum. B 150 190 5,029 26 0.05 0.05 0.15 0.20 1 1 4 5PSMH Lum. C 250 291 6,431 22 0.00 0.05 0.05 0.10 0 1 1 2
1.00 1.00 1.00 1.00 30 28 27 23
Ground Mounted Floodlight
Lamp Type LuminaireLamp
WattageSystem Watts
Maintained Luminaire Lumens LPW
LZ1 LZ2 LZ3 LZ4 LZ1 LZ2 LZ3 LZ4
PSMH Lum. D 100 129 3,816 30 1.00 0.45 0.25 0.25 30 13 7 7PSMH Lum. D 150 190 8,670 46 0.00 0.45 0.50 0.35 0 21 23 16PSMH Lum. D 250 291 12,139 42 0.00 0.10 0.25 0.40 0 4 10 17
1.00 1.00 1.00 1.00 30 38 41 40
Wall Mounted Floodlight
Lamp Type LuminaireLamp
WattageSystem Watts
Maintained Luminaire Lumens LPW
LZ1 LZ2 LZ3 LZ4 LZ1 LZ2 LZ3 LZ4
T8 Lum. E 17 19 952 50 0.10 0.05 0.08 0.10 5 3 4 5T8 Lum. E 25 26 1,434 55 0.10 0.05 0.08 0.10 6 3 4 6T8 Lum. E 32 33 2,084 63 0.30 0.30 0.20 0.10 19 19 13 6T5 Lum. E 14 17 855 50 0.10 0.05 0.08 0.10 5 3 4 5T5 Lum. E 21 25 1,490 60 0.10 0.05 0.08 0.10 6 3 4 6T5 Lum. E 28 31 1,856 60 0.30 0.30 0.20 0.10 18 18 12 6
T5HO Lum. E 24 27 1,275 47 0.00 0.05 0.05 0.10 0 2 2 5T5HO Lum. E 39 41 2,326 57 0.00 0.05 0.05 0.15 0 3 3 9T5HO Lum. E 54 62 3,021 49 0.00 0.10 0.20 0.15 0 5 10 7
1.00 1.00 1.00 1.00 58 58 56 54
Cylindrical Uplight
Lamp Type LuminaireLamp
WattageSystem Watts
Maintained Luminaire Lumens LPW
LZ1 LZ2 LZ3 LZ4 LZ1 LZ2 LZ3 LZ4
MR16 Lum. F 50 50 752 15 0.30 0.15 0.05 0.00 5 2 1 0MR16 Lum. F 75 75 1,062 14 0.30 0.15 0.10 0.05 4 2 1 1PSMH Lum. G 50 67 1,087 16 0.15 0.30 0.25 0.10 2 5 4 2PSMH Lum. G 70 92 2,241 24 0.15 0.25 0.35 0.25 4 6 9 6PSMH Lum. G 100 129 3,175 25 0.10 0.10 0.15 0.30 2 2 4 7PSMH Lum. H 150 190 7,001 37 0.00 0.05 0.10 0.30 0 2 4 11
1.00 1.00 1.00 1.00 17 20 22 27
34 36 36 36AVERAGE:
2008 Basis of Design Weighting Weighted LPW
2008 Basis of Design Weighting Weighted LPW
2008 Basis of Design Weighting Weighted LPW
2008 Basis of Design Weighting Weighted LPW

2016 Title 24 CASE Report –Measure Number: 2016-NR-LTG3-F Page 111
Figure 69: Building Facades Lumen Equivalency Calculation Pt. 2
Building Facade Calculations T-24 2016 - LED
Lamp Type Luminaire
2017 Fixture Watts
Maintained Luminaire Lumens LLD LPW
LZ1 LZ2 LZ3 LZ4 LZ1 LZ2 LZ3 LZ4
LED LED A 19 1,600 0.930 84 0.10 0.10 0.05 0.05 8 8 4 4LED LED A 19 1,600 0.930 84 0.15 0.10 0.10 0.05 13 8 8 4LED LED A 19 1,967 0.930 103 0.30 0.25 0.20 0.10 31 26 21 10LED LED A 19 1,600 0.930 84 0.15 0.20 0.10 0.20 13 17 8 17LED LED B 24 2,502 0.887 105 0.15 0.20 0.15 0.10 16 21 16 11LED LED B 35 3,049 0.781 86 0.10 0.05 0.20 0.20 9 4 17 17LED LED C 50 5,312 0.887 106 0.05 0.05 0.15 0.20 5 5 16 21LED LED C 77 7,992 0.887 103 0.00 0.05 0.05 0.10 0 5 5 10
1.00 1.00 1.00 1.00 94 95 96 95
Lamp Type Luminaire
2017 Fixture Watts
Maintained Luminaire Lumens LLD LPW
LZ1 LZ2 LZ3 LZ4 LZ1 LZ2 LZ3 LZ4
LED LED D 67 6,082 0.930 91 1.00 0.45 0.25 0.25 91 41 23 23LED LED E 96 11,439 0.927 119 0.00 0.45 0.50 0.35 0 53 59 42LED LED E 156 14,847 0.840 95 0.00 0.10 0.25 0.40 0 10 24 38
1.00 1.00 1.00 1.00 91 104 106 102
Lamp Type Luminaire
2017 Fixture Watts
Maintained Luminaire Lumens LLD LPW
LZ1 LZ2 LZ3 LZ4 LZ1 LZ2 LZ3 LZ4
LED LED F 13 1,083 0.938 80 0.10 0.05 0.08 0.10 8 4 6 8LED LED G 21 1,395 0.915 66 0.10 0.05 0.08 0.10 7 3 5 7LED LED F 25 2,167 0.938 87 0.30 0.30 0.20 0.10 26 26 17 9LED LED F 13 1,083 0.938 80 0.10 0.05 0.08 0.10 8 4 6 8LED LED G 21 1,395 0.915 66 0.10 0.05 0.08 0.10 7 3 5 7LED LED G 21 1,395 0.915 66 0.30 0.30 0.20 0.10 20 20 13 7LED LED G 21 1,395 0.915 66 0.00 0.05 0.05 0.10 0 3 3 7LED LED G 42 2,638 0.915 62 0.00 0.05 0.05 0.15 0 3 3 9LED LED F 35 3,163 0.938 89 0.00 0.10 0.20 0.15 0 9 18 13
1.00 1.00 1.00 1.00 75 76 77 74
Lamp Type Luminaire
2017 Fixture Watts
Maintained Luminaire Lumens LLD LPW
LZ1 LZ2 LZ3 LZ4 LZ1 LZ2 LZ3 LZ4
LED LED H 11 635 0.700 60 0.30 0.15 0.05 0.00 18 9 3 0LED LED H 11 635 0.700 60 0.30 0.15 0.10 0.05 18 9 6 3LED LED H 30 1,845 0.700 62 0.15 0.30 0.25 0.10 9 19 15 6LED LED H 39 2,638 0.700 68 0.15 0.25 0.35 0.25 10 17 24 17LED LED J 57 7,044 0.700 123 0.10 0.10 0.15 0.30 12 12 18 37LED LED J 77 6,740 0.700 88 0.00 0.05 0.10 0.30 0 4 9 26
1.00 1.00 1.00 1.00 68 70 75 89
82 86 88 90AVERAGE:
Weighting Weighted LPW
2016 LED Equivalency Weighting Weighted LPW
2016 LED Equivalency
Weighted LPW
2016 LED Equivalency Weighting Weighted LPW
2016 LED Equivalency Weighting

2016 Title 24 CASE Report –Measure Number: 2016-NR-LTG3-F Page 112
Figure 70: Building Facades Cost Calculation Pt. 1
Building Facade Calculations T-24 2016 - Incumbent Lamps
Wall Mounted Full Cutoff
Lamp Type LuminaireLamp
WattageSystem Watts
Initial Cost
Maintained Luminaire Lumens LPW
LZ1 LZ2 LZ3 LZ4 LZ1 LZ2 LZ3 LZ4 LZ1 LZ2 LZ3 LZ4
CFL Lum. A 26 28 351$ 1,119 40 0.10 0.10 0.05 0.05 35$ 35$ 18$ 18$ 3 3 1 1CFL Lum. A 32 35 371$ 1,492 43 0.15 0.10 0.10 0.05 56$ 37$ 37$ 19$ 5 4 4 2CFL Lum. A 42 46 402$ 1,989 43 0.30 0.25 0.20 0.10 121$ 101$ 80$ 40$ 14 12 9 5
PSMH Lum. B 50 67 368$ 732 11 0.15 0.20 0.10 0.20 55$ 74$ 37$ 74$ 10 13 7 13PSMH Lum. B 70 92 377$ 1,509 16 0.15 0.20 0.15 0.10 57$ 75$ 57$ 38$ 14 18 14 9PSMH Lum. B 100 129 377$ 2,138 17 0.10 0.05 0.20 0.20 38$ 19$ 75$ 75$ 13 6 26 26PSMH Lum. B 150 190 382$ 5,029 26 0.05 0.05 0.15 0.20 19$ 19$ 57$ 76$ 10 10 29 38PSMH Lum. C 250 291 393$ 6,431 22 0.00 0.05 0.05 0.10 $ 20$ 20$ 39$ 0 15 15 29
1.00 1.00 1.00 1.00 380$ 380$ 381$ 379$ 68 80 103 123
Ground Mounted Floodlight
Lamp Type LuminaireLamp
WattageSystem Watts
Initial Cost
Maintained Luminaire Lumens LPW
LZ1 LZ2 LZ3 LZ4 LZ1 LZ2 LZ3 LZ4 LZ1 LZ2 LZ3 LZ4
PSMH Lum. D 100 129 506$ 3,816 30 1.00 0.45 0.25 0.25 506$ 227$ 126$ 126$ 129 58 32 32PSMH Lum. D 150 190 515$ 8,670 46 0.00 0.45 0.50 0.35 $ 232$ 257$ 180$ 0 86 95 67PSMH Lum. D 250 291 637$ 12,139 42 0.00 0.10 0.25 0.40 $ 64$ 159$ 255$ 0 29 73 116
1.00 1.00 1.00 1.00 506$ 523$ 543$ 562$ 129 173 200 215
Wall Mounted Floodlight
Lamp Type LuminaireLamp
WattageSystem Watts
Initial Cost
Maintained Luminaire Lumens LPW
LZ1 LZ2 LZ3 LZ4 LZ1 LZ2 LZ3 LZ4 LZ1 LZ2 LZ3 LZ4
T8 Lum. E 17 19 775$ 952 50 0.10 0.05 0.08 0.10 77$ 39$ 58$ 77$ 2 1 1 2T8 Lum. E 25 26 472$ 1,434 55 0.10 0.05 0.08 0.10 47$ 24$ 35$ 47$ 3 1 2 3T8 Lum. E 32 33 553$ 2,084 63 0.30 0.30 0.20 0.10 166$ 166$ 111$ 55$ 10 10 7 3T5 Lum. E 14 17 480$ 855 50 0.10 0.05 0.08 0.10 48$ 24$ 36$ 48$ 2 1 1 2T5 Lum. E 21 25 517$ 1,490 60 0.10 0.05 0.08 0.10 52$ 26$ 39$ 52$ 3 1 2 3T5 Lum. E 28 31 392$ 1,856 60 0.30 0.30 0.20 0.10 118$ 118$ 78$ 39$ 9 9 6 3
T5HO Lum. E 24 27 336$ 1,275 47 0.00 0.05 0.05 0.10 $ 17$ 17$ 34$ 0 1 1 3T5HO Lum. E 39 41 362$ 2,326 57 0.00 0.05 0.05 0.15 $ 18$ 18$ 54$ 0 2 2 6T5HO Lum. E 54 62 392$ 3,021 49 0.00 0.10 0.20 0.15 $ 39$ 78$ 59$ 0 6 12 9
1.00 1.00 1.00 1.00 508$ 470$ 471$ 466$ 28 33 35 33
Cylindrical Uplight
Lamp Type LuminaireLamp
WattageSystem Watts
Initial Cost
Maintained Luminaire Lumens LPW
LZ1 LZ2 LZ3 LZ4 LZ1 LZ2 LZ3 LZ4 LZ1 LZ2 LZ3 LZ4
MR16 Lum. F 50 50 91$ 752 15 0.30 0.15 0.05 0.00 27$ 14$ 5$ $ 15 8 3 0MR16 Lum. F 75 75 91$ 1,062 14 0.30 0.15 0.10 0.05 27$ 14$ 9$ 5$ 23 11 8 4PSMH Lum. G 50 67 589$ 1,087 16 0.15 0.30 0.25 0.10 88$ 177$ 147$ 59$ 10 20 17 7PSMH Lum. G 70 92 589$ 2,241 24 0.15 0.25 0.35 0.25 88$ 147$ 206$ 147$ 14 23 32 23PSMH Lum. G 100 129 589$ 3,175 25 0.10 0.10 0.15 0.30 59$ 59$ 88$ 177$ 13 13 19 39PSMH Lum. H 150 190 1,676$ 7,001 37 0.00 0.05 0.10 0.30 $ 84$ 168$ 503$ 0 10 19 57
1.00 1.00 1.00 1.00 290$ 494$ 623$ 890$ 74 84 97 129
421$ 467$ 505$ 574$ 75 93 109 125
5.63$ 5.04$ 4.63$ 4.59$
2008 Basis of Design Weighting Weighted W
2008 Basis of Design Weighting Weighted W
2008 Basis of Design Weighting Weighted W
2008 Basis of Design Weighting Weighted W
$/W
AVERAGE:
Weighted Cost
Weighted Cost
Weighted Cost
Weighted Cost
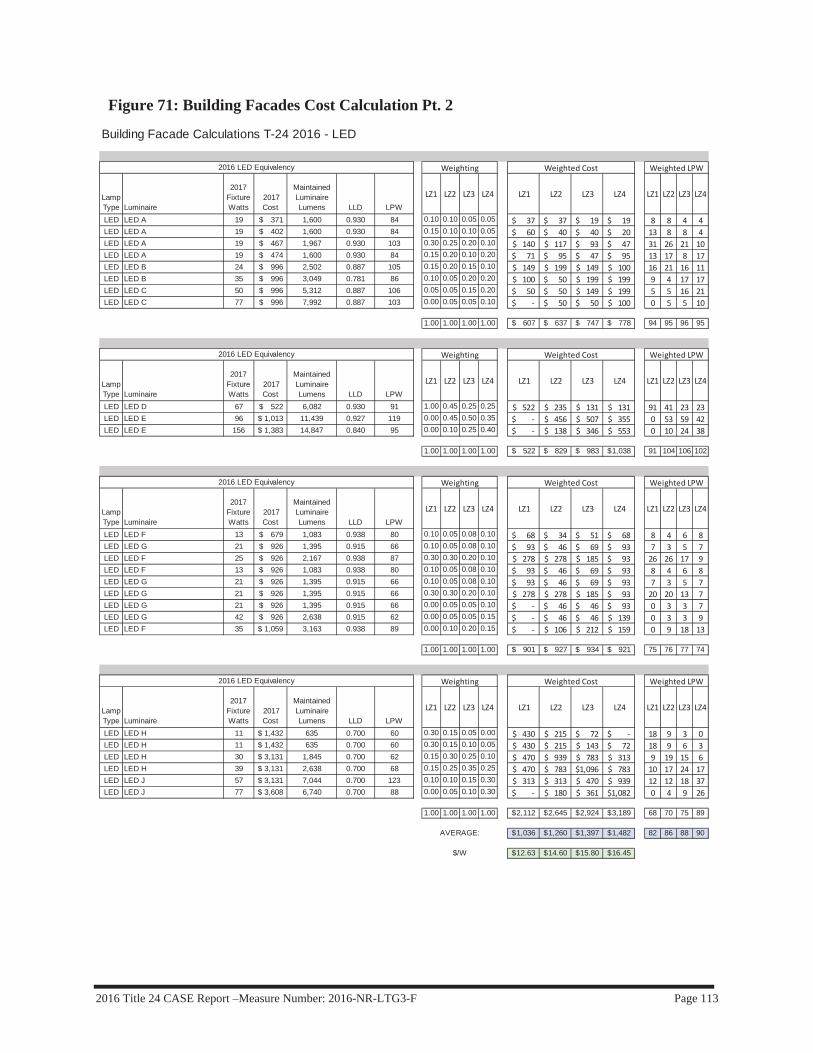
2016 Title 24 CASE Report –Measure Number: 2016-NR-LTG3-F Page 113
Figure 71: Building Facades Cost Calculation Pt. 2
Building Facade Calculations T-24 2016 - LED
Lamp Type Luminaire
2017 Fixture Watts
2017 Cost
Maintained Luminaire Lumens LLD LPW
LZ1 LZ2 LZ3 LZ4 LZ1 LZ2 LZ3 LZ4 LZ1 LZ2 LZ3 LZ4
LED LED A 19 371$ 1,600 0.930 84 0.10 0.10 0.05 0.05 37$ 37$ 19$ 19$ 8 8 4 4LED LED A 19 402$ 1,600 0.930 84 0.15 0.10 0.10 0.05 60$ 40$ 40$ 20$ 13 8 8 4LED LED A 19 467$ 1,967 0.930 103 0.30 0.25 0.20 0.10 140$ 117$ 93$ 47$ 31 26 21 10LED LED A 19 474$ 1,600 0.930 84 0.15 0.20 0.10 0.20 71$ 95$ 47$ 95$ 13 17 8 17LED LED B 24 996$ 2,502 0.887 105 0.15 0.20 0.15 0.10 149$ 199$ 149$ 100$ 16 21 16 11LED LED B 35 996$ 3,049 0.781 86 0.10 0.05 0.20 0.20 100$ 50$ 199$ 199$ 9 4 17 17LED LED C 50 996$ 5,312 0.887 106 0.05 0.05 0.15 0.20 50$ 50$ 149$ 199$ 5 5 16 21LED LED C 77 996$ 7,992 0.887 103 0.00 0.05 0.05 0.10 $ 50$ 50$ 100$ 0 5 5 10
1.00 1.00 1.00 1.00 607$ 637$ 747$ 778$ 94 95 96 95
Lamp Type Luminaire
2017 Fixture Watts
2017 Cost
Maintained Luminaire Lumens LLD LPW
LZ1 LZ2 LZ3 LZ4 LZ1 LZ2 LZ3 LZ4 LZ1 LZ2 LZ3 LZ4
LED LED D 67 522$ 6,082 0.930 91 1.00 0.45 0.25 0.25 522$ 235$ 131$ 131$ 91 41 23 23LED LED E 96 1,013$ 11,439 0.927 119 0.00 0.45 0.50 0.35 $ 456$ 507$ 355$ 0 53 59 42LED LED E 156 1,383$ 14,847 0.840 95 0.00 0.10 0.25 0.40 $ 138$ 346$ 553$ 0 10 24 38
1.00 1.00 1.00 1.00 522$ 829$ 983$ 1,038$ 91 104 106 102
Lamp Type Luminaire
2017 Fixture Watts
2017 Cost
Maintained Luminaire Lumens LLD LPW
LZ1 LZ2 LZ3 LZ4 LZ1 LZ2 LZ3 LZ4 LZ1 LZ2 LZ3 LZ4
LED LED F 13 679$ 1,083 0.938 80 0.10 0.05 0.08 0.10 68$ 34$ 51$ 68$ 8 4 6 8LED LED G 21 926$ 1,395 0.915 66 0.10 0.05 0.08 0.10 93$ 46$ 69$ 93$ 7 3 5 7LED LED F 25 926$ 2,167 0.938 87 0.30 0.30 0.20 0.10 278$ 278$ 185$ 93$ 26 26 17 9LED LED F 13 926$ 1,083 0.938 80 0.10 0.05 0.08 0.10 93$ 46$ 69$ 93$ 8 4 6 8LED LED G 21 926$ 1,395 0.915 66 0.10 0.05 0.08 0.10 93$ 46$ 69$ 93$ 7 3 5 7LED LED G 21 926$ 1,395 0.915 66 0.30 0.30 0.20 0.10 278$ 278$ 185$ 93$ 20 20 13 7LED LED G 21 926$ 1,395 0.915 66 0.00 0.05 0.05 0.10 $ 46$ 46$ 93$ 0 3 3 7LED LED G 42 926$ 2,638 0.915 62 0.00 0.05 0.05 0.15 $ 46$ 46$ 139$ 0 3 3 9LED LED F 35 1,059$ 3,163 0.938 89 0.00 0.10 0.20 0.15 $ 106$ 212$ 159$ 0 9 18 13
1.00 1.00 1.00 1.00 901$ 927$ 934$ 921$ 75 76 77 74
Lamp Type Luminaire
2017 Fixture Watts
2017 Cost
Maintained Luminaire Lumens LLD LPW
LZ1 LZ2 LZ3 LZ4 LZ1 LZ2 LZ3 LZ4 LZ1 LZ2 LZ3 LZ4
LED LED H 11 1,432$ 635 0.700 60 0.30 0.15 0.05 0.00 430$ 215$ 72$ $ 18 9 3 0LED LED H 11 1,432$ 635 0.700 60 0.30 0.15 0.10 0.05 430$ 215$ 143$ 72$ 18 9 6 3LED LED H 30 3,131$ 1,845 0.700 62 0.15 0.30 0.25 0.10 470$ 939$ 783$ 313$ 9 19 15 6LED LED H 39 3,131$ 2,638 0.700 68 0.15 0.25 0.35 0.25 470$ 783$ 1,096$ 783$ 10 17 24 17LED LED J 57 3,131$ 7,044 0.700 123 0.10 0.10 0.15 0.30 313$ 313$ 470$ 939$ 12 12 18 37LED LED J 77 3,608$ 6,740 0.700 88 0.00 0.05 0.10 0.30 $ 180$ 361$ 1,082$ 0 4 9 26
1.00 1.00 1.00 1.00 2,112$ 2,645$ 2,924$ 3,189$ 68 70 75 89
1,036$ 1,260$ 1,397$ 1,482$ 82 86 88 90
12.63$ 14.60$ 15.80$ 16.45$
Weighted LPW
2016 LED Equivalency Weighting Weighted LPW
2016 LED Equivalency Weighting
Weighted LPW
2016 LED Equivalency Weighting Weighted LPW
2016 LED Equivalency Weighting
Weighted Cost
Weighted Cost
Weighted Cost
Weighted Cost
$/W
AVERAGE:
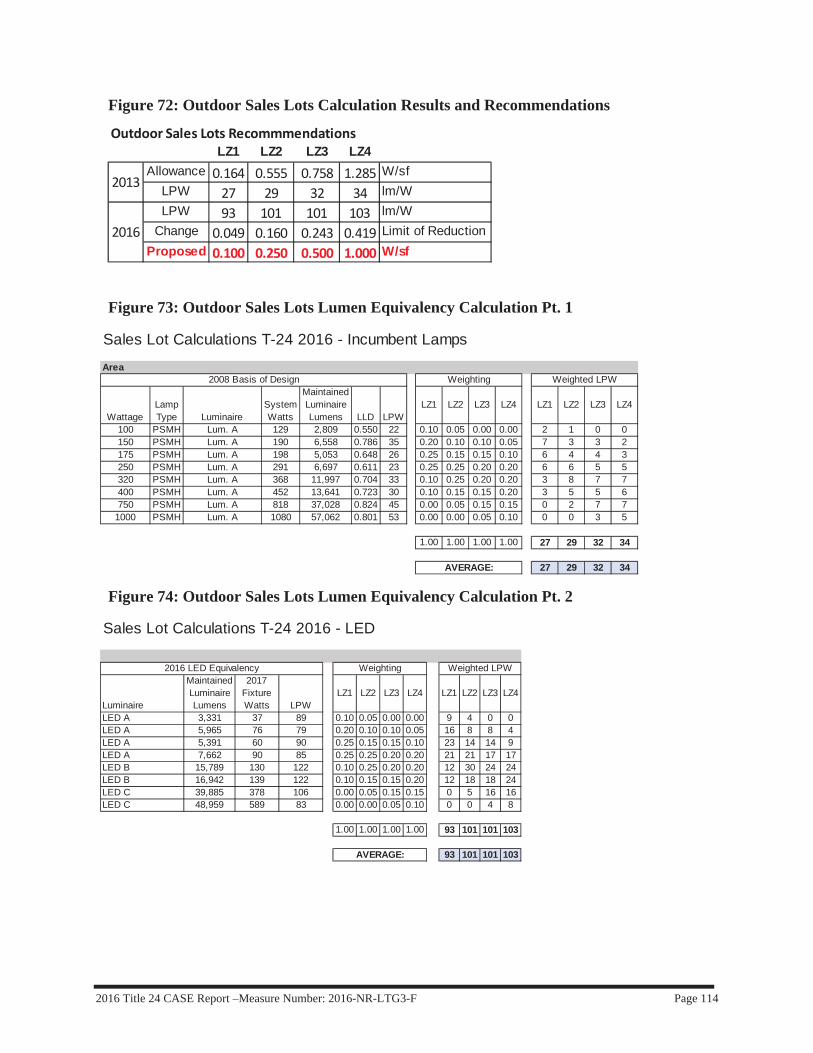
2016 Title 24 CASE Report –Measure Number: 2016-NR-LTG3-F Page 114
Figure 72: Outdoor Sales Lots Calculation Results and Recommendations
Figure 73: Outdoor Sales Lots Lumen Equivalency Calculation Pt. 1
Figure 74: Outdoor Sales Lots Lumen Equivalency Calculation Pt. 2
Outdoor Sales Lots RecommmendationsLZ1 LZ2 LZ3 LZ4
Allowance 0.164 0.555 0.758 1.285 W/sfLPW 27 29 32 34 lm/WLPW 93 101 101 103 lm/W
Change 0.049 0.160 0.243 0.419 Limit of ReductionProposed 0.100 0.250 0.500 1.000 W/sf
2013
2016
Sales Lot Calculations T-24 2016 - Incumbent Lamps
Area
WattageLamp Type Luminaire
System Watts
Maintained Luminaire Lumens LLD LPW
LZ1 LZ2 LZ3 LZ4 LZ1 LZ2 LZ3 LZ4
100 PSMH Lum. A 129 2,809 0.550 22 0.10 0.05 0.00 0.00 2 1 0 0150 PSMH Lum. A 190 6,558 0.786 35 0.20 0.10 0.10 0.05 7 3 3 2175 PSMH Lum. A 198 5,053 0.648 26 0.25 0.15 0.15 0.10 6 4 4 3250 PSMH Lum. A 291 6,697 0.611 23 0.25 0.25 0.20 0.20 6 6 5 5320 PSMH Lum. A 368 11,997 0.704 33 0.10 0.25 0.20 0.20 3 8 7 7400 PSMH Lum. A 452 13,641 0.723 30 0.10 0.15 0.15 0.20 3 5 5 6750 PSMH Lum. A 818 37,028 0.824 45 0.00 0.05 0.15 0.15 0 2 7 7
1000 PSMH Lum. A 1080 57,062 0.801 53 0.00 0.00 0.05 0.10 0 0 3 5
1.00 1.00 1.00 1.00 27 29 32 34
27 29 32 34
2008 Basis of Design
AVERAGE:
Weighting Weighted LPW
Sales Lot Calculations T-24 2016 - LED
Luminaire
Maintained Luminaire Lumens
2017 Fixture Watts LPW
LZ1 LZ2 LZ3 LZ4 LZ1 LZ2 LZ3 LZ4
LED A 3,331 37 89 0.10 0.05 0.00 0.00 9 4 0 0LED A 5,965 76 79 0.20 0.10 0.10 0.05 16 8 8 4LED A 5,391 60 90 0.25 0.15 0.15 0.10 23 14 14 9LED A 7,662 90 85 0.25 0.25 0.20 0.20 21 21 17 17LED B 15,789 130 122 0.10 0.25 0.20 0.20 12 30 24 24LED B 16,942 139 122 0.10 0.15 0.15 0.20 12 18 18 24LED C 39,885 378 106 0.00 0.05 0.15 0.15 0 5 16 16LED C 48,959 589 83 0.00 0.00 0.05 0.10 0 0 4 8
1.00 1.00 1.00 1.00 93 101 101 103
93 101 101 103
Weighting Weighted LPW2016 LED Equivalency
AVERAGE:

2016 Title 24 CASE Report –Measure Number: 2016-NR-LTG3-F Page 115
Figure 75: Outdoor Sales Lots Cost Calculation Pt. 1
Figure 76: Outdoor Sales Lots Cost Calculation Pt. 2
Sales Lot Calculations T-24 2016 - Incumbent Lamps
Area
WattageLamp Type Luminaire
System Watts
Initial Cost
Maintained Luminaire Lumens LLD LPW
LZ1 LZ2 LZ3 LZ4 LZ1 LZ2 LZ3 LZ4 LZ1 LZ2 LZ3 LZ4
100 PSMH Lum. A 129 1,035$ 2,809 0.550 22 0.10 0.05 0.00 0.00 104$ 52$ -$ -$ 13 6 0 0150 PSMH Lum. A 190 1,035$ 6,558 0.786 35 0.20 0.10 0.10 0.05 207$ 104$ 104$ 52$ 38 19 19 10175 PSMH Lum. A 198 1,035$ 5,053 0.648 26 0.25 0.15 0.15 0.10 259$ 155$ 155$ 104$ 50 30 30 20250 PSMH Lum. A 291 1,235$ 6,697 0.611 23 0.25 0.25 0.20 0.20 309$ 309$ 247$ 247$ 73 73 58 58320 PSMH Lum. A 368 864$ 11,997 0.704 33 0.10 0.25 0.20 0.20 86$ 216$ 173$ 173$ 37 92 74 74400 PSMH Lum. A 452 864$ 13,641 0.723 30 0.10 0.15 0.15 0.20 86$ 130$ 130$ 173$ 45 68 68 90750 PSMH Lum. A 818 1,265$ 37,028 0.824 45 0.00 0.05 0.15 0.15 -$ 63$ 190$ 190$ 0 41 123 123
1000 PSMH Lum. A 1080 1,265$ 57,062 0.801 53 0.00 0.00 0.05 0.10 -$ -$ 63$ 126$ 0 0 54 108
1.00 1.00 1.00 1.00 1,051$ 1,028$ 1,061$ 1,064$ 255 329 425 482
1,051$ 1,028$ 1,061$ 1,064$ 255 329 425 482
4.12$ 3.13$ 2.50$ 2.21$
AVERAGE:
Weighted Cost
$/W:
2008 Basis of Design Weighting Weighted W
Sales Lot Calculations T-24 2016 - LED
Luminaire
Initial Luminaire Lumens
Maintained Luminaire Lumens 2017 Cost LLD
2014 Fixture Watts
2017 Fixture Watts LPW LPW Diff.
Percentage Increase
LZ1 LZ2 LZ3 LZ4 LZ1 LZ2 LZ3 LZ4 LZ1 LZ2 LZ3 LZ4
LED A 4,759 3,331 1,204$ 0.700 53 37 89 68 310% 0.10 0.05 0.00 0.00 120$ 60$ -$ -$ 4 2 0 0LED A 8,522 5,965 1,720$ 0.700 107 76 79 44 128% 0.20 0.10 0.10 0.05 344$ 172$ 172$ 86$ 15 8 8 4LED A 7,701 5,391 1,810$ 0.700 84 60 90 65 254% 0.25 0.15 0.15 0.10 453$ 272$ 272$ 181$ 15 9 9 6LED A 10,945 7,662 1,810$ 0.700 128 90 85 62 268% 0.25 0.25 0.20 0.20 453$ 453$ 362$ 362$ 23 23 18 18LED B 17,800 15,789 795$ 0.887 183 130 122 89 273% 0.10 0.25 0.20 0.20 80$ 199$ 159$ 159$ 13 32 26 26LED B 19,100 16,942 808$ 0.887 196 139 122 92 304% 0.10 0.15 0.15 0.20 81$ 121$ 121$ 162$ 14 21 21 28LED C 45,687 39,885 1,313$ 0.873 533 378 106 60 133% 0.00 0.05 0.15 0.15 -$ 66$ 197$ 197$ 0 19 57 57LED C 61,352 48,959 1,626$ 0.798 831 589 83 30 57% 0.00 0.00 0.05 0.10 -$ -$ 81$ 163$ 0 0 29 59
1.00 1.00 1.00 1.00 1,530$ 1,342$ 1,364$ 1,309$ 83 113 168 197
1,530$ 1,342$ 1,364$ 1,309$ 83 113 168 197
18.36$ 11.85$ 8.14$ 6.64$
AVERAGE:
Weighted Cost
$/W:
Weighted W2016 LED Equivalency Weighting
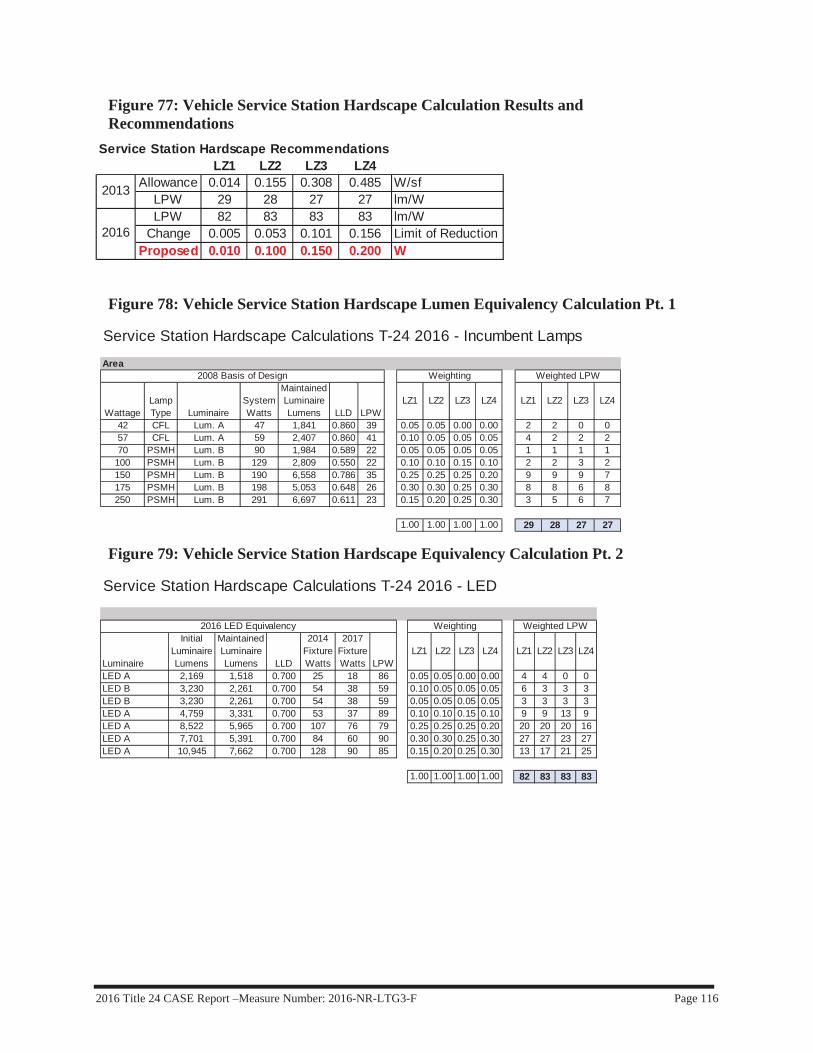
2016 Title 24 CASE Report –Measure Number: 2016-NR-LTG3-F Page 116
Figure 77: Vehicle Service Station Hardscape Calculation Results and Recommendations
Figure 78: Vehicle Service Station Hardscape Lumen Equivalency Calculation Pt. 1
Figure 79: Vehicle Service Station Hardscape Equivalency Calculation Pt. 2
Service Station Hardscape RecommendationsLZ1 LZ2 LZ3 LZ4
Allowance 0.014 0.155 0.308 0.485 W/sfLPW 29 28 27 27 lm/WLPW 82 83 83 83 lm/W
Change 0.005 0.053 0.101 0.156 Limit of ReductionProposed 0.010 0.100 0.150 0.200 W
2013
2016
Service Station Hardscape Calculations T-24 2016 - Incumbent Lamps
Area
WattageLamp Type Luminaire
System Watts
Maintained Luminaire Lumens LLD LPW
LZ1 LZ2 LZ3 LZ4 LZ1 LZ2 LZ3 LZ4
42 CFL Lum. A 47 1,841 0.860 39 0.05 0.05 0.00 0.00 2 2 0 057 CFL Lum. A 59 2,407 0.860 41 0.10 0.05 0.05 0.05 4 2 2 270 PSMH Lum. B 90 1,984 0.589 22 0.05 0.05 0.05 0.05 1 1 1 1
100 PSMH Lum. B 129 2,809 0.550 22 0.10 0.10 0.15 0.10 2 2 3 2150 PSMH Lum. B 190 6,558 0.786 35 0.25 0.25 0.25 0.20 9 9 9 7175 PSMH Lum. B 198 5,053 0.648 26 0.30 0.30 0.25 0.30 8 8 6 8250 PSMH Lum. B 291 6,697 0.611 23 0.15 0.20 0.25 0.30 3 5 6 7
1.00 1.00 1.00 1.00 29 28 27 27
2008 Basis of Design Weighting Weighted LPW
Service Station Hardscape Calculations T-24 2016 - LED
Luminaire
Initial Luminaire Lumens
Maintained Luminaire Lumens LLD
2014 Fixture Watts
2017 Fixture Watts LPW
LZ1 LZ2 LZ3 LZ4 LZ1 LZ2 LZ3 LZ4
LED A 2,169 1,518 0.700 25 18 86 0.05 0.05 0.00 0.00 4 4 0 0LED B 3,230 2,261 0.700 54 38 59 0.10 0.05 0.05 0.05 6 3 3 3LED B 3,230 2,261 0.700 54 38 59 0.05 0.05 0.05 0.05 3 3 3 3LED A 4,759 3,331 0.700 53 37 89 0.10 0.10 0.15 0.10 9 9 13 9LED A 8,522 5,965 0.700 107 76 79 0.25 0.25 0.25 0.20 20 20 20 16LED A 7,701 5,391 0.700 84 60 90 0.30 0.30 0.25 0.30 27 27 23 27LED A 10,945 7,662 0.700 128 90 85 0.15 0.20 0.25 0.30 13 17 21 25
1.00 1.00 1.00 1.00 82 83 83 83
Weighted LPW2016 LED Equivalency Weighting
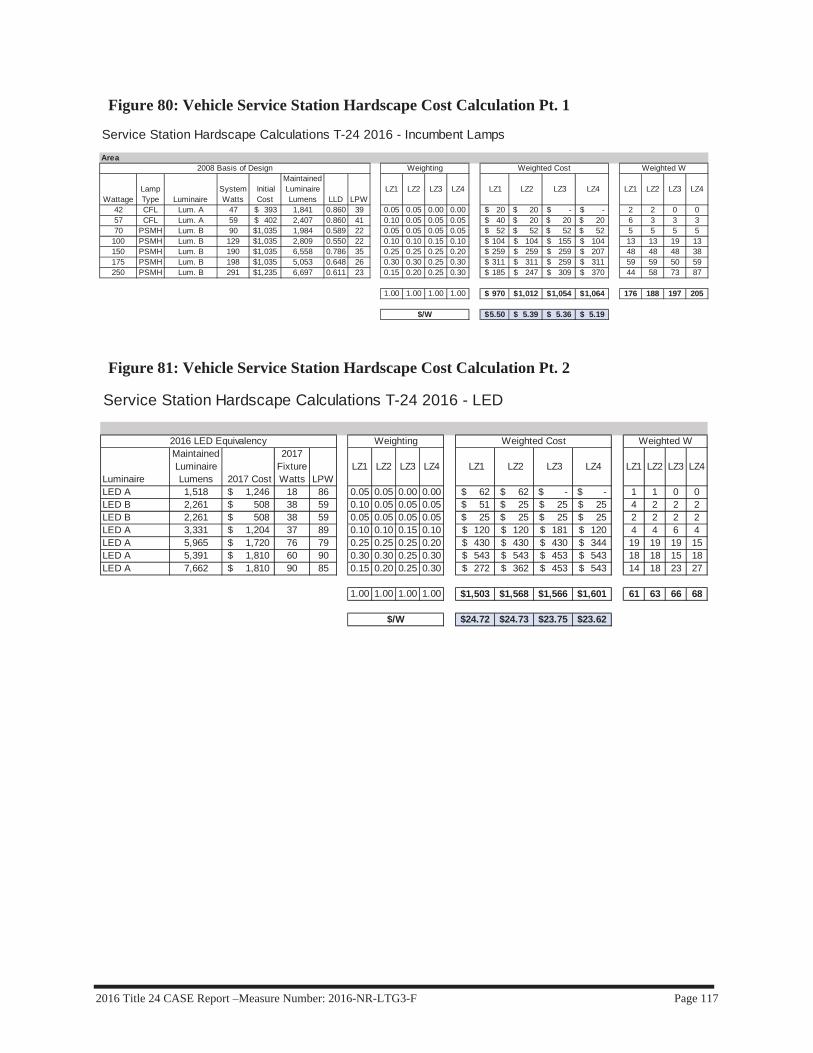
2016 Title 24 CASE Report –Measure Number: 2016-NR-LTG3-F Page 117
Figure 80: Vehicle Service Station Hardscape Cost Calculation Pt. 1
Figure 81: Vehicle Service Station Hardscape Cost Calculation Pt. 2
Service Station Hardscape Calculations T-24 2016 - Incumbent Lamps
Area
WattageLamp Type Luminaire
System Watts
Initial Cost
Maintained Luminaire Lumens LLD LPW
LZ1 LZ2 LZ3 LZ4 LZ1 LZ2 LZ3 LZ4 LZ1 LZ2 LZ3 LZ4
42 CFL Lum. A 47 393$ 1,841 0.860 39 0.05 0.05 0.00 0.00 20$ 20$ -$ -$ 2 2 0 057 CFL Lum. A 59 402$ 2,407 0.860 41 0.10 0.05 0.05 0.05 40$ 20$ 20$ 20$ 6 3 3 370 PSMH Lum. B 90 1,035$ 1,984 0.589 22 0.05 0.05 0.05 0.05 52$ 52$ 52$ 52$ 5 5 5 5
100 PSMH Lum. B 129 1,035$ 2,809 0.550 22 0.10 0.10 0.15 0.10 104$ 104$ 155$ 104$ 13 13 19 13150 PSMH Lum. B 190 1,035$ 6,558 0.786 35 0.25 0.25 0.25 0.20 259$ 259$ 259$ 207$ 48 48 48 38175 PSMH Lum. B 198 1,035$ 5,053 0.648 26 0.30 0.30 0.25 0.30 311$ 311$ 259$ 311$ 59 59 50 59250 PSMH Lum. B 291 1,235$ 6,697 0.611 23 0.15 0.20 0.25 0.30 185$ 247$ 309$ 370$ 44 58 73 87
1.00 1.00 1.00 1.00 970$ 1,012$ 1,054$ 1,064$ 176 188 197 205
5.50$ 5.39$ 5.36$ 5.19$
Weighted Cost
$/W
2008 Basis of Design Weighting Weighted W
Service Station Hardscape Calculations T-24 2016 - LED
Luminaire
Maintained Luminaire Lumens 2017 Cost
2017 Fixture Watts LPW
LZ1 LZ2 LZ3 LZ4 LZ1 LZ2 LZ3 LZ4 LZ1 LZ2 LZ3 LZ4
LED A 1,518 1,246$ 18 86 0.05 0.05 0.00 0.00 62$ 62$ -$ -$ 1 1 0 0LED B 2,261 508$ 38 59 0.10 0.05 0.05 0.05 51$ 25$ 25$ 25$ 4 2 2 2LED B 2,261 508$ 38 59 0.05 0.05 0.05 0.05 25$ 25$ 25$ 25$ 2 2 2 2LED A 3,331 1,204$ 37 89 0.10 0.10 0.15 0.10 120$ 120$ 181$ 120$ 4 4 6 4LED A 5,965 1,720$ 76 79 0.25 0.25 0.25 0.20 430$ 430$ 430$ 344$ 19 19 19 15LED A 5,391 1,810$ 60 90 0.30 0.30 0.25 0.30 543$ 543$ 453$ 543$ 18 18 15 18LED A 7,662 1,810$ 90 85 0.15 0.20 0.25 0.30 272$ 362$ 453$ 543$ 14 18 23 27
1.00 1.00 1.00 1.00 1,503$ 1,568$ 1,566$ 1,601$ 61 63 66 68
24.72$ 24.73$ 23.75$ 23.62$
Weighted WWeighted Cost
$/W
2016 LED Equivalency Weighting
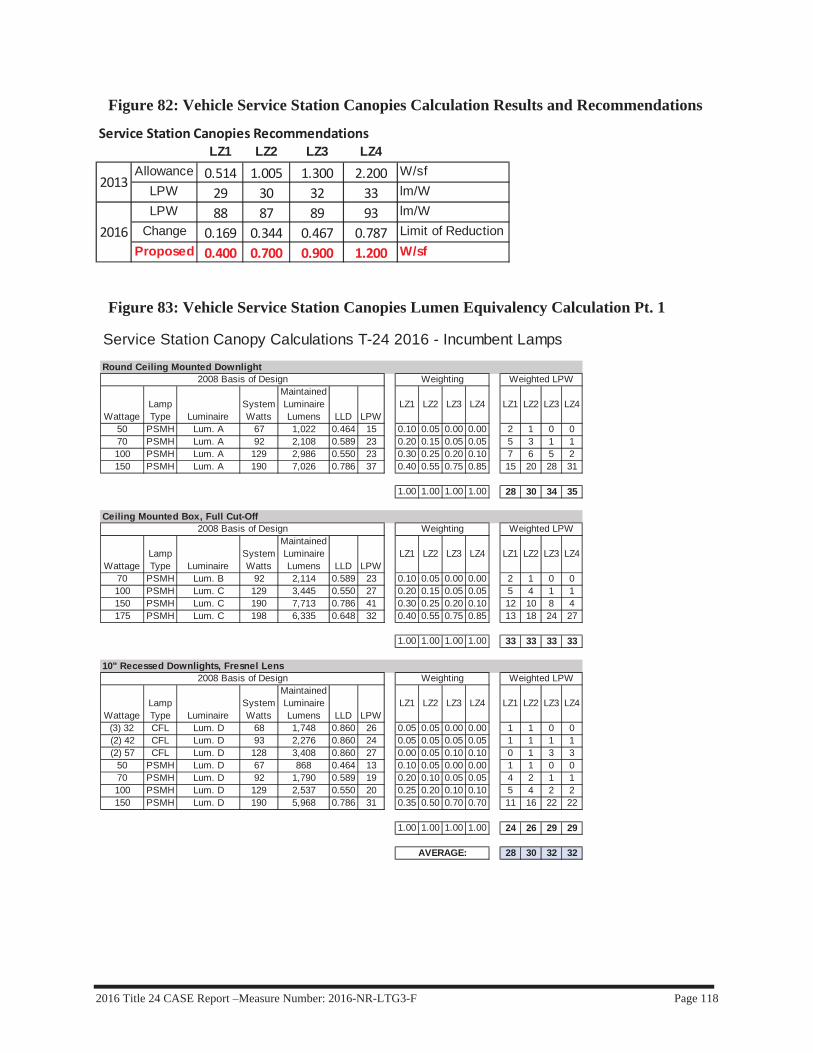
2016 Title 24 CASE Report –Measure Number: 2016-NR-LTG3-F Page 118
Figure 82: Vehicle Service Station Canopies Calculation Results and Recommendations
Figure 83: Vehicle Service Station Canopies Lumen Equivalency Calculation Pt. 1
Service Station Canopies RecommendationsLZ1 LZ2 LZ3 LZ4
Allowance 0.514 1.005 1.300 2.200 W/sfLPW 29 30 32 33 lm/WLPW 88 87 89 93 lm/W
Change 0.169 0.344 0.467 0.787 Limit of ReductionProposed 0.400 0.700 0.900 1.200 W/sf
2013
2016
Service Station Canopy Calculations T-24 2016 - Incumbent Lamps
Round Ceiling Mounted Downlight
WattageLamp Type Luminaire
System Watts
Maintained Luminaire Lumens LLD LPW
LZ1 LZ2 LZ3 LZ4 LZ1 LZ2 LZ3 LZ4
50 PSMH Lum. A 67 1,022 0.464 15 0.10 0.05 0.00 0.00 2 1 0 070 PSMH Lum. A 92 2,108 0.589 23 0.20 0.15 0.05 0.05 5 3 1 1100 PSMH Lum. A 129 2,986 0.550 23 0.30 0.25 0.20 0.10 7 6 5 2150 PSMH Lum. A 190 7,026 0.786 37 0.40 0.55 0.75 0.85 15 20 28 31
1.00 1.00 1.00 1.00 28 30 34 35
Ceiling Mounted Box, Full Cut-Off
WattageLamp Type Luminaire
System Watts
Maintained Luminaire Lumens LLD LPW
LZ1 LZ2 LZ3 LZ4 LZ1 LZ2 LZ3 LZ4
70 PSMH Lum. B 92 2,114 0.589 23 0.10 0.05 0.00 0.00 2 1 0 0100 PSMH Lum. C 129 3,445 0.550 27 0.20 0.15 0.05 0.05 5 4 1 1150 PSMH Lum. C 190 7,713 0.786 41 0.30 0.25 0.20 0.10 12 10 8 4175 PSMH Lum. C 198 6,335 0.648 32 0.40 0.55 0.75 0.85 13 18 24 27
1.00 1.00 1.00 1.00 33 33 33 33
10" Recessed Downlights, Fresnel Lens
WattageLamp Type Luminaire
System Watts
Maintained Luminaire Lumens LLD LPW
LZ1 LZ2 LZ3 LZ4 LZ1 LZ2 LZ3 LZ4
(3) 32 CFL Lum. D 68 1,748 0.860 26 0.05 0.05 0.00 0.00 1 1 0 0(2) 42 CFL Lum. D 93 2,276 0.860 24 0.05 0.05 0.05 0.05 1 1 1 1(2) 57 CFL Lum. D 128 3,408 0.860 27 0.00 0.05 0.10 0.10 0 1 3 3
50 PSMH Lum. D 67 868 0.464 13 0.10 0.05 0.00 0.00 1 1 0 070 PSMH Lum. D 92 1,790 0.589 19 0.20 0.10 0.05 0.05 4 2 1 1100 PSMH Lum. D 129 2,537 0.550 20 0.25 0.20 0.10 0.10 5 4 2 2150 PSMH Lum. D 190 5,968 0.786 31 0.35 0.50 0.70 0.70 11 16 22 22
1.00 1.00 1.00 1.00 24 26 29 29
28 30 32 32AVERAGE:
Weighting Weighted LPW
Weighting Weighted LPW
2008 Basis of Design
2008 Basis of Design
2008 Basis of Design Weighting Weighted LPW
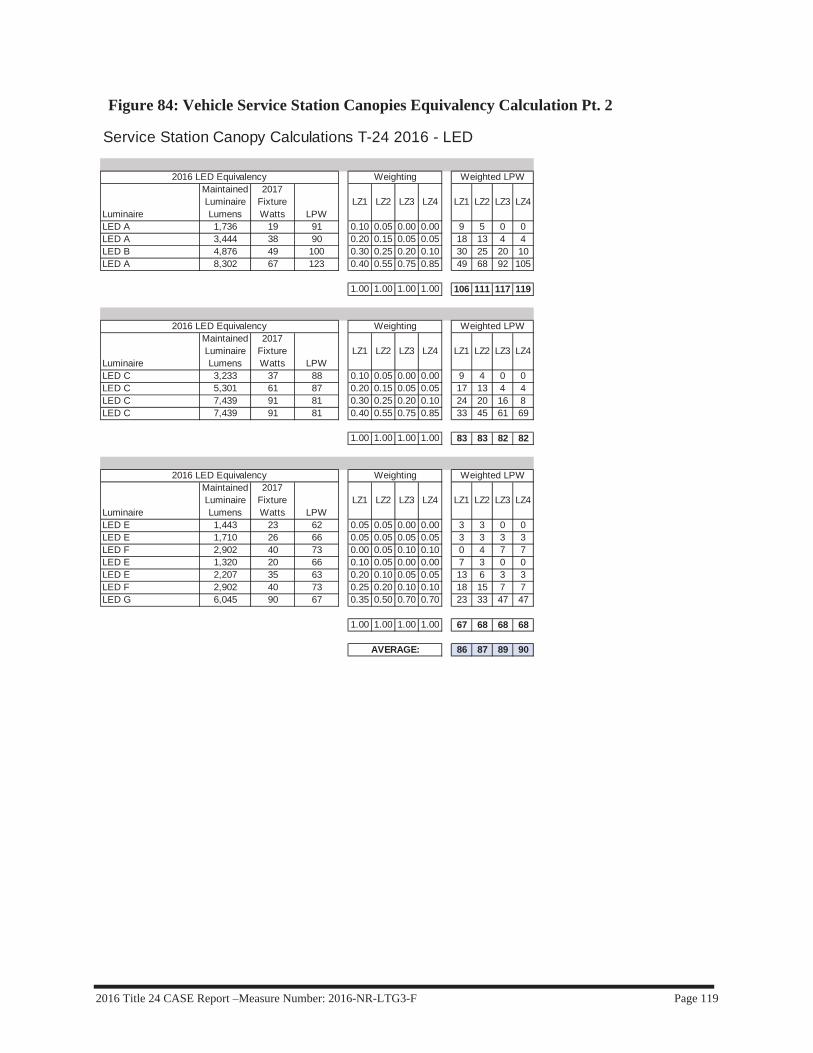
2016 Title 24 CASE Report –Measure Number: 2016-NR-LTG3-F Page 119
Figure 84: Vehicle Service Station Canopies Equivalency Calculation Pt. 2
Service Station Canopy Calculations T-24 2016 - LED
Luminaire
Maintained Luminaire Lumens
2017 Fixture Watts LPW
LZ1 LZ2 LZ3 LZ4 LZ1 LZ2 LZ3 LZ4
LED A 1,736 19 91 0.10 0.05 0.00 0.00 9 5 0 0LED A 3,444 38 90 0.20 0.15 0.05 0.05 18 13 4 4LED B 4,876 49 100 0.30 0.25 0.20 0.10 30 25 20 10LED A 8,302 67 123 0.40 0.55 0.75 0.85 49 68 92 105
1.00 1.00 1.00 1.00 106 111 117 119
Luminaire
Maintained Luminaire Lumens
2017 Fixture Watts LPW
LZ1 LZ2 LZ3 LZ4 LZ1 LZ2 LZ3 LZ4
LED C 3,233 37 88 0.10 0.05 0.00 0.00 9 4 0 0LED C 5,301 61 87 0.20 0.15 0.05 0.05 17 13 4 4LED C 7,439 91 81 0.30 0.25 0.20 0.10 24 20 16 8LED C 7,439 91 81 0.40 0.55 0.75 0.85 33 45 61 69
1.00 1.00 1.00 1.00 83 83 82 82
Luminaire
Maintained Luminaire Lumens
2017 Fixture Watts LPW
LZ1 LZ2 LZ3 LZ4 LZ1 LZ2 LZ3 LZ4
LED E 1,443 23 62 0.05 0.05 0.00 0.00 3 3 0 0LED E 1,710 26 66 0.05 0.05 0.05 0.05 3 3 3 3LED F 2,902 40 73 0.00 0.05 0.10 0.10 0 4 7 7LED E 1,320 20 66 0.10 0.05 0.00 0.00 7 3 0 0LED E 2,207 35 63 0.20 0.10 0.05 0.05 13 6 3 3LED F 2,902 40 73 0.25 0.20 0.10 0.10 18 15 7 7LED G 6,045 90 67 0.35 0.50 0.70 0.70 23 33 47 47
1.00 1.00 1.00 1.00 67 68 68 68
86 87 89 90AVERAGE:
Weighting Weighted LPW
Weighting Weighted LPW
Weighting Weighted LPW
2016 LED Equivalency
2016 LED Equivalency
2016 LED Equivalency

2016 Title 24 CASE Report –Measure Number: 2016-NR-LTG3-F Page 120
Figure 85: Vehicle Service Station Canopies Cost Calculation Pt. 1
Service Station Canopy Calculations T-24 2016 - Incumbent Lamps
Round Ceiling Mounted Downlight
WattageLamp Type Luminaire
System Watts
Initial Cost
Maintained Luminaire Lumens LLD LPW
LZ1 LZ2 LZ3 LZ4 LZ1 LZ2 LZ3 LZ4 LZ1 LZ2 LZ3 LZ4
50 PSMH Lum. A 67 483$ 1,022 0.464 15 0.10 0.05 0.00 0.00 48$ 24$ -$ -$ 7 3 0 070 PSMH Lum. A 92 483$ 2,108 0.589 23 0.20 0.15 0.05 0.05 97$ 72$ 24$ 24$ 18 14 5 5100 PSMH Lum. A 129 506$ 2,986 0.550 23 0.30 0.25 0.20 0.10 152$ 127$ 101$ 51$ 39 32 26 13150 PSMH Lum. A 190 528$ 7,026 0.786 37 0.40 0.55 0.75 0.85 211$ 290$ 396$ 449$ 76 105 143 162
1.00 1.00 1.00 1.00 508$ 514$ 521$ 523$ 140 154 173 179
Ceiling Mounted Box, Full Cut-Off
WattageLamp Type Luminaire
System Watts
Initial Cost
Maintained Luminaire Lumens LLD LPW
LZ1 LZ2 LZ3 LZ4 LZ1 LZ2 LZ3 LZ4 LZ1 LZ2 LZ3 LZ4
70 PSMH Lum. B 92 293$ 2,114 0.589 23 0.10 0.05 0.00 0.00 29$ 15$ -$ -$ 9 5 0 0100 PSMH Lum. C 129 592$ 3,445 0.550 27 0.20 0.15 0.05 0.05 118$ 89$ 30$ 30$ 26 19 6 6150 PSMH Lum. C 190 592$ 7,713 0.786 41 0.30 0.25 0.20 0.10 178$ 148$ 118$ 59$ 57 48 38 19175 PSMH Lum. C 198 591$ 6,335 0.648 32 0.40 0.55 0.75 0.85 236$ 325$ 443$ 503$ 79 109 149 168
1.00 1.00 1.00 1.00 562$ 577$ 591$ 591$ 171 180 193 194
10" Recessed Downlights, Fresnel Lens
WattageLamp Type Luminaire
System Watts
Initial Cost
Maintained Luminaire Lumens LLD LPW
LZ1 LZ2 LZ3 LZ4 LZ1 LZ2 LZ3 LZ4 LZ1 LZ2 LZ3 LZ4
(3) 32 CFL Lum. D 68 246$ 1,748 0.860 26 0.05 0.05 0.00 0.00 12$ 12$ -$ -$ 3 3 0 0(2) 42 CFL Lum. D 93 321$ 2,276 0.860 24 0.05 0.05 0.05 0.05 16$ 16$ 16$ 16$ 5 5 5 5(2) 57 CFL Lum. D 128 321$ 3,408 0.860 27 0.00 0.05 0.10 0.10 -$ 16$ 32$ 32$ 0 6 13 13
50 PSMH Lum. D 67 248$ 868 0.464 13 0.10 0.05 0.00 0.00 25$ 12$ -$ -$ 7 3 0 070 PSMH Lum. D 92 265$ 1,790 0.589 19 0.20 0.10 0.05 0.05 53$ 26$ 13$ 13$ 18 9 5 5100 PSMH Lum. D 129 265$ 2,537 0.550 20 0.25 0.20 0.10 0.10 66$ 53$ 26$ 26$ 32 26 13 13150 PSMH Lum. D 190 358$ 5,968 0.786 31 0.35 0.50 0.70 0.70 125$ 179$ 250$ 250$ 67 95 133 133
1.00 1.00 1.00 1.00 298$ 315$ 338$ 338$ 132 148 168 168
456$ 468$ 484$ 484$ 148 161 178 180
3.09$ 2.92$ 2.72$ 2.69$
2008 Basis of Design Weighting Weighted WWeighted Cost
2008 Basis of Design Weighting Weighted WWeighted Cost
$/W
2008 Basis of Design Weighting Weighted W
AVERAGE:
Weighted Cost

2016 Title 24 CASE Report –Measure Number: 2016-NR-LTG3-F Page 121
Figure 86: Vehicle Service Station Canopies Cost Calculation Pt. 2
Service Station Canopy Calculations T-24 2016 - LED
Luminaire
Maintained Luminaire Lumens 2017 Cost
2017 Fixture Watts LPW
LZ1 LZ2 LZ3 LZ4 LZ1 LZ2 LZ3 LZ4 LZ1 LZ2 LZ3 LZ4
LED A 1,736 455$ 19 91 0.10 0.05 0.00 0.00 46$ 23$ -$ -$ 2 1 0 0LED A 3,444 586$ 38 90 0.20 0.15 0.05 0.05 117$ 88$ 29$ 29$ 8 6 2 2LED B 4,876 1,087$ 49 100 0.30 0.25 0.20 0.10 326$ 272$ 217$ 109$ 15 12 10 5LED A 8,302 1,054$ 67 123 0.40 0.55 0.75 0.85 422$ 580$ 791$ 896$ 27 37 51 57
1.00 1.00 1.00 1.00 910$ 962$ 1,037$ 1,034$ 51 56 62 64
Luminaire
Maintained Luminaire Lumens 2017 Cost
2017 Fixture Watts LPW
LZ1 LZ2 LZ3 LZ4 LZ1 LZ2 LZ3 LZ4 LZ1 LZ2 LZ3 LZ4
LED C 3,233 1,087$ 37 88 0.10 0.05 0.00 0.00 109$ 54$ -$ -$ 4 2 0 0LED C 5,301 1,087$ 61 87 0.20 0.15 0.05 0.05 217$ 163$ 54$ 54$ 12 9 3 3LED C 7,439 1,087$ 91 81 0.30 0.25 0.20 0.10 326$ 272$ 217$ 109$ 27 23 18 9LED C 7,439 761$ 91 81 0.40 0.55 0.75 0.85 304$ 418$ 571$ 647$ 37 50 69 78
1.00 1.00 1.00 1.00 956$ 908$ 842$ 810$ 80 84 90 90
Luminaire
Maintained Luminaire Lumens 2017 Cost
2017 Fixture Watts LPW
LZ1 LZ2 LZ3 LZ4 LZ1 LZ2 LZ3 LZ4 LZ1 LZ2 LZ3 LZ4
LED E 1,443 272$ 23 62 0.05 0.05 0.00 0.00 14$ 14$ -$ -$ 1 1 0 0LED E 1,710 288$ 26 66 0.05 0.05 0.05 0.05 14$ 14$ 14$ 14$ 1 1 1 1LED F 2,902 798$ 40 73 0.00 0.05 0.10 0.10 -$ 40$ 80$ 80$ 0 2 4 4LED E 1,320 318$ 20 66 0.10 0.05 0.00 0.00 32$ 16$ -$ -$ 2 1 0 0LED E 2,207 334$ 35 63 0.20 0.10 0.05 0.05 67$ 33$ 17$ 17$ 7 3 2 2LED F 2,902 798$ 40 73 0.25 0.20 0.10 0.10 199$ 160$ 80$ 80$ 10 8 4 4LED G 6,045 1,274$ 90 67 0.35 0.50 0.70 0.70 446$ 637$ 892$ 892$ 32 45 63 63
1.00 1.00 1.00 1.00 772$ 914$ 1,083$ 1,083$ 53 62 74 74
880$ 928$ 987$ 975$ 61 67 75 76
14.34$ 13.77$ 13.08$ 12.82$
Weighted WWeighted Cost2016 LED Equivalency Weighting
Weighted WWeighted Cost
2016 LED Equivalency Weighting Weighted WWeighted Cost
$/W
2016 LED Equivalency Weighting
AVERAGE:

2016 Title 24 CASE Report –Measure Number: 2016-NR-LTG3-F Page 122
Figure 87: Sales Canopies Calculation Results and Recommendations
Figure 88: Sales Canopies Lumen Equivalency Calculation Pt. 1
Sales Canopies RecommendationsLZ1 LZ2 LZ3 LZ4
Allowance 0.655 0.908 1.135 W/sfLPW 35 36 35 36 lm/WLPW 67 69 71 70 lm/W
Change 0.341 0.449 0.579 Limit of ReductionProposed 0.500 0.800 1.000 W/sf
2013
2016
Sales Canopy Calculations T-24 2016 - Incumbent Lamps
Downlight
Lamp Type Luminaire Wattage
System Watts LLD
Maintained Luminaire Lumens LPW
LZ1 LZ2 LZ3 LZ4 LZ1 LZ2 LZ3 LZ4
CFL Lum. A 13 16 0.861 493 31 0.05 0.00 0.00 0.00 2 0 0 0CFL Lum. A 18 20 0.860 763 38 0.05 0.05 0.00 0.00 2 2 0 0CFL Lum. B 26 29 0.860 851 29 0.05 0.05 0.05 0.00 1 1 1 0CFL Lum. B 32 36 0.860 1,134 32 0.10 0.05 0.05 0.05 3 2 2 2CFL Lum. B 42 46 0.860 1,513 33 0.10 0.10 0.05 0.05 3 3 2 2CFL Lum. C (3) 32 68 0.860 1,748 26 0.15 0.10 0.10 0.10 4 3 3 3CFL Lum. C (2) 42 93 0.860 2,276 24 0.15 0.10 0.10 0.10 4 2 2 2CFL Lum. C (2) 57 128 0.860 3,408 27 0.05 0.05 0.05 0.10 1 1 1 3
PSMH Lum. D 50 67 0.464 1,022 15 0.15 0.05 0.05 0.05 2 1 1 1PSMH Lum. D 70 92 0.589 2,108 23 0.10 0.15 0.15 0.05 2 3 3 1PSMH Lum. D 100 129 0.550 2,986 23 0.05 0.15 0.15 0.10 1 3 3 2PSMH Lum. D 150 190 0.786 7,026 37 0.00 0.10 0.10 0.15 0 4 4 6PSMH Lum. E 175 198 0.694 5,447 28 0.00 0.05 0.10 0.15 0 1 3 4PSMH Lum. E 250 291 0.733 8,096 28 0.00 0.00 0.05 0.10 0 0 1 3
1.00 1.00 1.00 1.00 26 27 27 28
Recessed Linear Fluorescent
Lamp Type Luminaire Wattage
System Watts LLD
Maintained Luminaire Lumens LPW
LZ1 LZ2 LZ3 LZ4 LZ1 LZ2 LZ3 LZ4
T8 Lum. F 25 26 0.940 1,023 39 0.10 0.10 0.05 0.05 4 4 2 2T8 Lum. F 32 33 0.940 1,403 43 0.15 0.10 0.05 0.05 6 4 2 2T8 Lum. F (2) 25 52 0.940 2,021 39 0.10 0.10 0.10 0.05 4 4 4 2T8 Lum. F (2) 32 66 0.940 2,558 39 0.15 0.10 0.15 0.10 6 4 6 4T5 Lum. F 21 25 0.950 1,293 52 0.10 0.10 0.05 0.05 5 5 3 3T5 Lum. F 28 31 0.950 1,768 57 0.15 0.10 0.05 0.05 9 6 3 3T5 Lum. G (2) 21 50 0.950 2,417 48 0.10 0.10 0.10 0.05 5 5 5 2T5 Lum. H (2) 28 62 0.950 2,560 41 0.15 0.10 0.15 0.15 6 4 6 6
T5HO Lum. J 39 41 0.931 1,649 40 0.00 0.05 0.10 0.10 0 2 4 4T5HO Lum. H 54 62 0.930 2,972 48 0.00 0.05 0.10 0.10 0 2 5 5T5HO Lum. K (2) 39 82 0.931 3,862 47 0.00 0.05 0.05 0.10 0 2 2 5T5HO Lum. K (2) 54 124 0.930 5,540 45 0.00 0.05 0.05 0.15 0 2 2 7
1.00 1.00 1.00 1.00 45 45 44 44
35 36 35 36
2008 Basis of Design
2008 Basis of Design
Weighting Weighted LPW
AVERAGE:
Weighting Weighted LPW
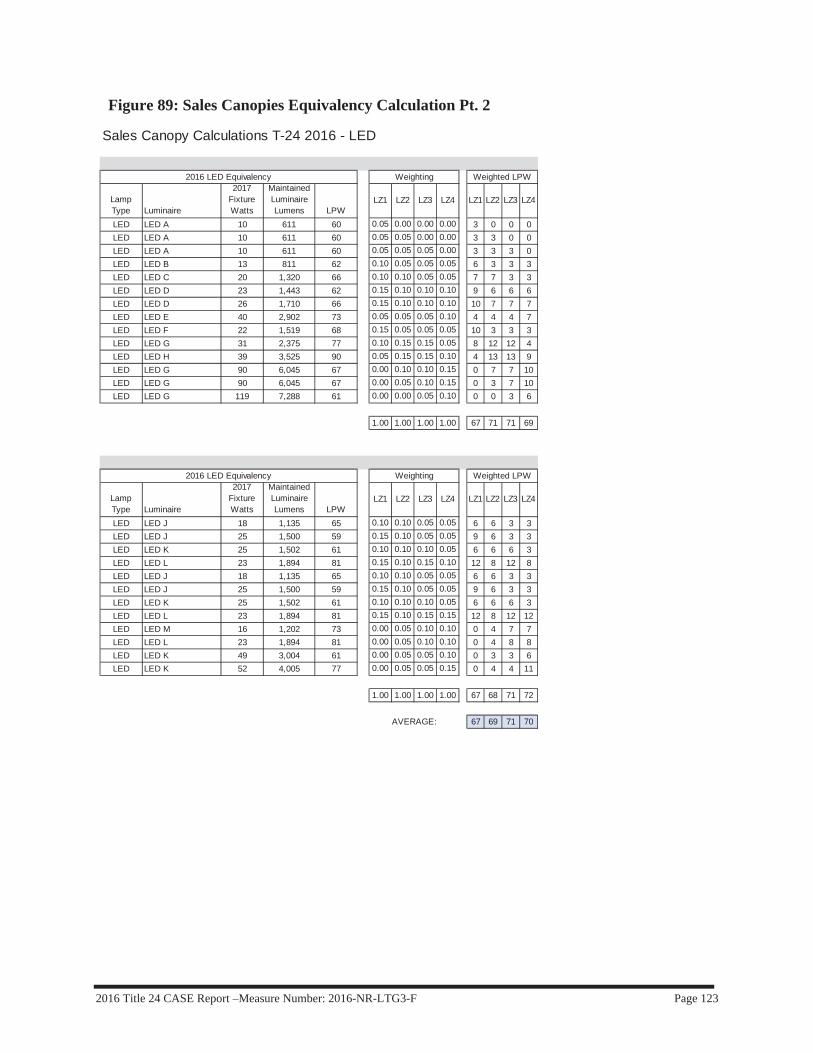
2016 Title 24 CASE Report –Measure Number: 2016-NR-LTG3-F Page 123
Figure 89: Sales Canopies Equivalency Calculation Pt. 2
Sales Canopy Calculations T-24 2016 - LED
Lamp Type Luminaire
2017Fixture Watts
Maintained Luminaire Lumens LPW
LZ1 LZ2 LZ3 LZ4 LZ1 LZ2 LZ3 LZ4
LED LED A 10 611 60 0.05 0.00 0.00 0.00 3 0 0 0LED LED A 10 611 60 0.05 0.05 0.00 0.00 3 3 0 0LED LED A 10 611 60 0.05 0.05 0.05 0.00 3 3 3 0LED LED B 13 811 62 0.10 0.05 0.05 0.05 6 3 3 3LED LED C 20 1,320 66 0.10 0.10 0.05 0.05 7 7 3 3LED LED D 23 1,443 62 0.15 0.10 0.10 0.10 9 6 6 6LED LED D 26 1,710 66 0.15 0.10 0.10 0.10 10 7 7 7LED LED E 40 2,902 73 0.05 0.05 0.05 0.10 4 4 4 7LED LED F 22 1,519 68 0.15 0.05 0.05 0.05 10 3 3 3LED LED G 31 2,375 77 0.10 0.15 0.15 0.05 8 12 12 4LED LED H 39 3,525 90 0.05 0.15 0.15 0.10 4 13 13 9LED LED G 90 6,045 67 0.00 0.10 0.10 0.15 0 7 7 10LED LED G 90 6,045 67 0.00 0.05 0.10 0.15 0 3 7 10LED LED G 119 7,288 61 0.00 0.00 0.05 0.10 0 0 3 6
1.00 1.00 1.00 1.00 67 71 71 69
Lamp Type Luminaire
2017Fixture Watts
Maintained Luminaire Lumens LPW
LZ1 LZ2 LZ3 LZ4 LZ1 LZ2 LZ3 LZ4
LED LED J 18 1,135 65 0.10 0.10 0.05 0.05 6 6 3 3LED LED J 25 1,500 59 0.15 0.10 0.05 0.05 9 6 3 3LED LED K 25 1,502 61 0.10 0.10 0.10 0.05 6 6 6 3LED LED L 23 1,894 81 0.15 0.10 0.15 0.10 12 8 12 8LED LED J 18 1,135 65 0.10 0.10 0.05 0.05 6 6 3 3LED LED J 25 1,500 59 0.15 0.10 0.05 0.05 9 6 3 3LED LED K 25 1,502 61 0.10 0.10 0.10 0.05 6 6 6 3LED LED L 23 1,894 81 0.15 0.10 0.15 0.15 12 8 12 12LED LED M 16 1,202 73 0.00 0.05 0.10 0.10 0 4 7 7LED LED L 23 1,894 81 0.00 0.05 0.10 0.10 0 4 8 8LED LED K 49 3,004 61 0.00 0.05 0.05 0.10 0 3 3 6LED LED K 52 4,005 77 0.00 0.05 0.05 0.15 0 4 4 11
1.00 1.00 1.00 1.00 67 68 71 72
67 69 71 70
2016 LED Equivalency
2016 LED Equivalency
Weighting Weighted LPW
Weighting Weighted LPW
AVERAGE:

2016 Title 24 CASE Report –Measure Number: 2016-NR-LTG3-F Page 124
Figure 90: Sales Canopies Cost Calculation Pt. 1
Sales Canopy Calculations T-24 2016 - Incumbent Lamps
Downlight
Lamp Type Luminaire Wattage
System Watts Initial Cost LLD
Maintained Luminaire Lumens LPW
LZ1 LZ2 LZ3 LZ4 LZ1 LZ2 LZ3 LZ4 LZ1 LZ2 LZ3 LZ4
CFL Lum. A 13 16 147$ 0.861 493 31 0.05 0.00 0.00 0.00 7$ -$ -$ -$ 1 0 0 0CFL Lum. A 18 20 176$ 0.860 763 38 0.05 0.05 0.00 0.00 9$ 9$ -$ -$ 1 1 0 0CFL Lum. B 26 29 636$ 0.860 851 29 0.05 0.05 0.05 0.00 32$ 32$ 32$ -$ 1 1 1 0CFL Lum. B 32 36 446$ 0.860 1,134 32 0.10 0.05 0.05 0.05 45$ 22$ 22$ 22$ 4 2 2 2CFL Lum. B 42 46 446$ 0.860 1,513 33 0.10 0.10 0.05 0.05 45$ 45$ 22$ 22$ 5 5 2 2CFL Lum. C (3) 32 68 246$ 0.860 1,748 26 0.15 0.10 0.10 0.10 37$ 25$ 25$ 25$ 10 7 7 7CFL Lum. C (2) 42 93 321$ 0.860 2,276 24 0.15 0.10 0.10 0.10 48$ 32$ 32$ 32$ 14 9 9 9CFL Lum. C (2) 57 128 321$ 0.860 3,408 27 0.05 0.05 0.05 0.10 16$ 16$ 16$ 32$ 6 6 6 13
PSMH Lum. D 50 67 483$ 0.464 1,022 15 0.15 0.05 0.05 0.05 72$ 24$ 24$ 24$ 10 3 3 3PSMH Lum. D 70 92 483$ 0.589 2,108 23 0.10 0.15 0.15 0.05 48$ 72$ 72$ 24$ 9 14 14 5PSMH Lum. D 100 129 506$ 0.550 2,986 23 0.05 0.15 0.15 0.10 25$ 76$ 76$ 51$ 6 19 19 13PSMH Lum. D 150 190 528$ 0.786 7,026 37 0.00 0.10 0.10 0.15 -$ 53$ 53$ 79$ 0 19 19 29PSMH Lum. E 175 198 470$ 0.694 5,447 28 0.00 0.05 0.10 0.15 -$ 23$ 47$ 70$ 0 10 20 30PSMH Lum. E 250 291 469$ 0.733 8,096 28 0.00 0.00 0.05 0.10 -$ -$ 23$ 47$ 0 0 15 29
1.00 1.00 1.00 1.00 384$ 429$ 445$ 429$ 68 97 118 141
Recessed Linear Fluorescent
Lamp Type Luminaire Wattage
System Watts Initial Cost LLD
Maintained Luminaire Lumens LPW
LZ1 LZ2 LZ3 LZ4 LZ1 LZ2 LZ3 LZ4 LZ1 LZ2 LZ3 LZ4
T8 Lum. F 25 26 423$ 0.940 1,023 39 0.10 0.10 0.05 0.05 42$ 42$ 21$ 21$ 3 3 1 1T8 Lum. F 32 33 423$ 0.940 1,403 43 0.15 0.10 0.05 0.05 63$ 42$ 21$ 21$ 5 3 2 2T8 Lum. F (2) 25 52 425$ 0.940 2,021 39 0.10 0.10 0.10 0.05 42$ 42$ 42$ 21$ 5 5 5 3T8 Lum. F (2) 32 66 425$ 0.940 2,558 39 0.15 0.10 0.15 0.10 64$ 42$ 64$ 42$ 10 7 10 7T5 Lum. F 21 25 423$ 0.950 1,293 52 0.10 0.10 0.05 0.05 42$ 42$ 21$ 21$ 3 3 1 1T5 Lum. F 28 31 423$ 0.950 1,768 57 0.15 0.10 0.05 0.05 63$ 42$ 21$ 21$ 5 3 2 2T5 Lum. G (2) 21 50 425$ 0.950 2,417 48 0.10 0.10 0.10 0.05 42$ 42$ 42$ 21$ 5 5 5 3T5 Lum. H (2) 28 62 425$ 0.950 2,560 41 0.15 0.10 0.15 0.15 64$ 42$ 64$ 64$ 9 6 9 9T5HO Lum. J 39 41 312$ 0.931 1,649 40 0.00 0.05 0.10 0.10 -$ 16$ 31$ 31$ 0 2 4 4T5HO Lum. H 54 62 312$ 0.930 2,972 48 0.00 0.05 0.10 0.10 -$ 16$ 31$ 31$ 0 3 6 6T5HO Lum. K (2) 39 82 469$ 0.931 3,862 47 0.00 0.05 0.05 0.10 -$ 23$ 23$ 47$ 0 4 4 8T5HO Lum. K (2) 54 124 471$ 0.930 5,540 45 0.00 0.05 0.05 0.15 -$ 24$ 24$ 71$ 0 6 6 19
1.00 1.00 1.00 1.00 424$ 417$ 406$ 413$ 44 50 56 64
412$ 421$ 418$ 418$ 56 73 87 103
7.37$ 5.74$ 4.81$ 4.08$
2008 Basis of Design Weighting Weighted W
2008 Basis of Design Weighting Weighted W
AVERAGE:
Weighted Cost
Weighted Cost
$/W
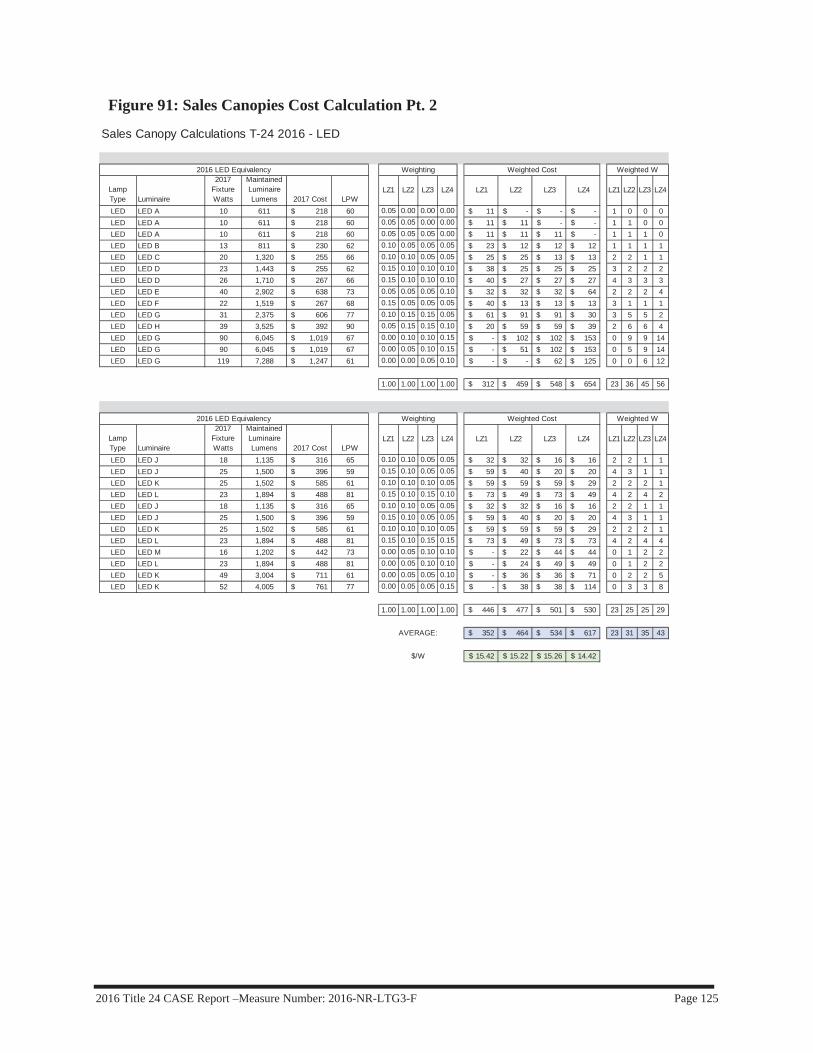
2016 Title 24 CASE Report –Measure Number: 2016-NR-LTG3-F Page 125
Figure 91: Sales Canopies Cost Calculation Pt. 2
Sales Canopy Calculations T-24 2016 - LED
Lamp Type Luminaire
2017 Fixture Watts
Maintained Luminaire Lumens 2017 Cost LPW
LZ1 LZ2 LZ3 LZ4 LZ1 LZ2 LZ3 LZ4 LZ1 LZ2 LZ3 LZ4
LED LED A 10 611 218$ 60 0.05 0.00 0.00 0.00 11$ -$ -$ -$ 1 0 0 0LED LED A 10 611 218$ 60 0.05 0.05 0.00 0.00 11$ 11$ -$ -$ 1 1 0 0LED LED A 10 611 218$ 60 0.05 0.05 0.05 0.00 11$ 11$ 11$ -$ 1 1 1 0LED LED B 13 811 230$ 62 0.10 0.05 0.05 0.05 23$ 12$ 12$ 12$ 1 1 1 1LED LED C 20 1,320 255$ 66 0.10 0.10 0.05 0.05 25$ 25$ 13$ 13$ 2 2 1 1LED LED D 23 1,443 255$ 62 0.15 0.10 0.10 0.10 38$ 25$ 25$ 25$ 3 2 2 2LED LED D 26 1,710 267$ 66 0.15 0.10 0.10 0.10 40$ 27$ 27$ 27$ 4 3 3 3LED LED E 40 2,902 638$ 73 0.05 0.05 0.05 0.10 32$ 32$ 32$ 64$ 2 2 2 4LED LED F 22 1,519 267$ 68 0.15 0.05 0.05 0.05 40$ 13$ 13$ 13$ 3 1 1 1LED LED G 31 2,375 606$ 77 0.10 0.15 0.15 0.05 61$ 91$ 91$ 30$ 3 5 5 2LED LED H 39 3,525 392$ 90 0.05 0.15 0.15 0.10 20$ 59$ 59$ 39$ 2 6 6 4LED LED G 90 6,045 1,019$ 67 0.00 0.10 0.10 0.15 -$ 102$ 102$ 153$ 0 9 9 14LED LED G 90 6,045 1,019$ 67 0.00 0.05 0.10 0.15 -$ 51$ 102$ 153$ 0 5 9 14LED LED G 119 7,288 1,247$ 61 0.00 0.00 0.05 0.10 -$ -$ 62$ 125$ 0 0 6 12
1.00 1.00 1.00 1.00 312$ 459$ 548$ 654$ 23 36 45 56
Lamp Type Luminaire
2017 Fixture Watts
Maintained Luminaire Lumens 2017 Cost LPW
LZ1 LZ2 LZ3 LZ4 LZ1 LZ2 LZ3 LZ4 LZ1 LZ2 LZ3 LZ4
LED LED J 18 1,135 316$ 65 0.10 0.10 0.05 0.05 32$ 32$ 16$ 16$ 2 2 1 1LED LED J 25 1,500 396$ 59 0.15 0.10 0.05 0.05 59$ 40$ 20$ 20$ 4 3 1 1LED LED K 25 1,502 585$ 61 0.10 0.10 0.10 0.05 59$ 59$ 59$ 29$ 2 2 2 1LED LED L 23 1,894 488$ 81 0.15 0.10 0.15 0.10 73$ 49$ 73$ 49$ 4 2 4 2LED LED J 18 1,135 316$ 65 0.10 0.10 0.05 0.05 32$ 32$ 16$ 16$ 2 2 1 1LED LED J 25 1,500 396$ 59 0.15 0.10 0.05 0.05 59$ 40$ 20$ 20$ 4 3 1 1LED LED K 25 1,502 585$ 61 0.10 0.10 0.10 0.05 59$ 59$ 59$ 29$ 2 2 2 1LED LED L 23 1,894 488$ 81 0.15 0.10 0.15 0.15 73$ 49$ 73$ 73$ 4 2 4 4LED LED M 16 1,202 442$ 73 0.00 0.05 0.10 0.10 -$ 22$ 44$ 44$ 0 1 2 2LED LED L 23 1,894 488$ 81 0.00 0.05 0.10 0.10 -$ 24$ 49$ 49$ 0 1 2 2LED LED K 49 3,004 711$ 61 0.00 0.05 0.05 0.10 -$ 36$ 36$ 71$ 0 2 2 5LED LED K 52 4,005 761$ 77 0.00 0.05 0.05 0.15 -$ 38$ 38$ 114$ 0 3 3 8
1.00 1.00 1.00 1.00 446$ 477$ 501$ 530$ 23 25 25 29
352$ 464$ 534$ 617$ 23 31 35 43
15.42$ 15.22$ 15.26$ 14.42$
Weighted W
2016 LED Equivalency Weighting Weighted WWeighted Cost
Weighted Cost2016 LED Equivalency Weighting
AVERAGE:
$/W
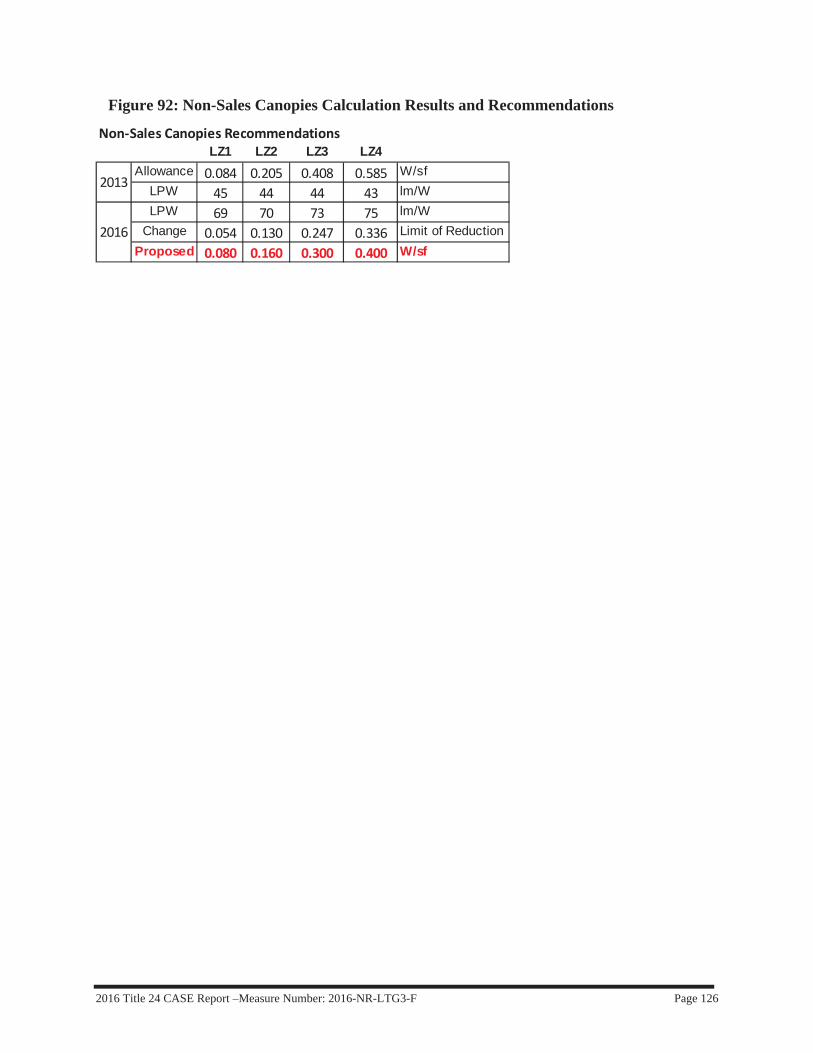
2016 Title 24 CASE Report –Measure Number: 2016-NR-LTG3-F Page 126
Figure 92: Non-Sales Canopies Calculation Results and Recommendations
Non Sales Canopies RecommendationsLZ1 LZ2 LZ3 LZ4
Allowance 0.084 0.205 0.408 0.585 W/sfLPW 45 44 44 43 lm/WLPW 69 70 73 75 lm/W
Change 0.054 0.130 0.247 0.336 Limit of ReductionProposed 0.080 0.160 0.300 0.400 W/sf
2013
2016

2016 Title 24 CASE Report –Measure Number: 2016-NR-LTG3-F Page 127
Figure 93: Non-Sales Canopies Lumen Equivalency Calculation Pt. 1
Non Sales Canopy Calculations T-24 2016 - Incumbent Lamps
Downlight
LampType Luminaire Wattage
SystemWatts LLD
MaintainedLuminaireLumens LPW
LZ1 LZ2 LZ3 LZ4 LZ1 LZ2 LZ3 LZ4
CFL Lum. A 13 16 0.861 493 31 0.20 0.15 0.10 0.05 6 5 3 2CFL Lum. A 18 20 0.860 763 38 0.20 0.20 0.15 0.05 8 8 6 2CFL Lum. B 26 29 0.860 851 29 0.20 0.20 0.15 0.10 6 6 4 3CFL Lum. B 32 36 0.860 1,134 32 0.10 0.10 0.15 0.15 3 3 5 5CFL Lum. B 42 46 0.860 1,513 33 0.05 0.10 0.15 0.20 2 3 5 7PSMH Lum. B 50 67 0.464 1,022 15 0.10 0.05 0.05 0.05 2 1 1 1PSMH Lum. B 70 92 0.589 2,108 23 0.10 0.05 0.10 0.10 2 1 2 2PSMH Lum. B 100 129 0.550 2,986 23 0.05 0.10 0.10 0.15 1 2 2 3PSMH Lum. B 150 190 0.786 7,026 37 0.00 0.05 0.05 0.15 0 2 2 6
1.00 1.00 1.00 1.00 29 31 30 30
Recessed Linear Fluorescent
LampType Luminaire Wattage
SystemWatts LLD
MaintainedLuminaireLumens LPW
LZ1 LZ2 LZ3 LZ4 LZ1 LZ2 LZ3 LZ4
T8 Lum. C 25 26 0.940 1,023 39 0.05 0.05 0.05 0.05 2 2 2 2T8 Lum. C 32 33 0.940 1,403 43 0.20 0.15 0.15 0.10 9 6 6 4T8 Lum. C (2) 25 52 0.940 2,021 39 0.05 0.10 0.05 0.05 2 4 2 2T8 Lum. C (2) 32 66 0.940 2,558 39 0.20 0.20 0.20 0.15 8 8 8 6T5 Lum. C 21 25 0.950 1,293 52 0.05 0.05 0.05 0.05 3 3 3 3T5 Lum. C 28 31 0.950 1,768 57 0.20 0.15 0.15 0.10 11 9 9 6T5 Lum. D (2) 21 50 0.950 2,417 48 0.05 0.10 0.05 0.05 2 5 2 2T5 Lum. C (2) 28 62 0.950 2,560 41 0.20 0.20 0.20 0.15 8 8 8 6T5HO Lum. E 39 41 0.931 1,649 40 0.00 0.00 0.05 0.05 0 0 2 2T5HO Lum. C 54 62 0.930 2,972 48 0.00 0.00 0.05 0.10 0 0 2 5T5HO Lum. F (2) 39 82 0.931 3,862 47 0.00 0.00 0.00 0.05 0 0 0 2T5HO Lum. F (2) 54 124 0.930 5,540 45 0.00 0.00 0.00 0.10 0 0 0 4
1.00 1.00 1.00 1.00 45 44 44 45
Gasket Linear Fluorescent
LampType Luminaire Wattage
SystemWatts LLD
MaintainedLuminaireLumens LPW
LZ1 LZ2 LZ3 LZ4 LZ1 LZ2 LZ3 LZ4
T8 Lum. G 17 19 0.940 954 50 0.05 0.05 0.05 0.05 3 3 3 3T8 Lum. G 32 33 0.940 2,084 63 0.20 0.15 0.15 0.10 13 9 9 6T8 Lum. G (2) 17 38 0.940 1,907 50 0.05 0.10 0.05 0.05 3 5 3 3T8 Lum. G (2) 32 66 0.940 4,167 63 0.20 0.20 0.20 0.15 13 13 13 9T5 Lum. G 14 17 0.950 856 50 0.05 0.05 0.05 0.05 3 3 3 3T5 Lum. G 28 31 0.950 1,856 60 0.20 0.15 0.15 0.10 12 9 9 6T5 Lum. G (2) 14 34 0.950 1,713 50 0.05 0.10 0.05 0.05 3 5 3 3T5 Lum. G (2) 28 62 0.950 3,712 60 0.20 0.20 0.20 0.15 12 12 12 9T5HO Lum. G 24 27 0.872 1,277 47 0.00 0.00 0.05 0.05 0 0 2 2T5HO Lum. G 54 62 0.930 3,109 50 0.00 0.00 0.05 0.10 0 0 3 5T5HO Lum. G (2) 24 54 0.872 2,554 47 0.00 0.00 0.00 0.05 0 0 0 2T5HO Lum. G (2) 54 124 0.930 6,218 50 0.00 0.00 0.00 0.10 0 0 0 5
1.00 1.00 1.00 1.00 59 58 58 56
45 44 44 43AVERAGE:
Weighting Weighted LPW
Weighting Weighted LPW
2008 Basis of Design
2008 Basis of Design
2008 Basis of Design
Weighting Weighted LPW

2016 Title 24 CASE Report –Measure Number: 2016-NR-LTG3-F Page 128
Figure 94: Non-Sales Canopies Equivalency Calculation Pt. 2
Non Sales Canopy Calculations T-24 2016 - LED
LampType Luminaire
2017FixtureWatts
MaintainedLuminaireLumens LPW
LZ1 LZ2 LZ3 LZ4 LZ1 LZ2 LZ3 LZ4
LED LED A 10 611 60 0.20 0.15 0.10 0.05 12 9 6 3LED LED A 10 611 60 0.20 0.20 0.15 0.05 12 12 9 3LED LED A 10 611 60 0.20 0.20 0.15 0.10 12 12 9 6LED LED B 13 811 62 0.10 0.10 0.15 0.15 6 6 9 9LED LED C 20 1,320 66 0.05 0.10 0.15 0.20 3 7 10 13LED LED D 22 1,519 68 0.10 0.05 0.05 0.05 7 3 3 3LED LED E 35 2,202 63 0.10 0.05 0.10 0.10 6 3 6 6LED LED F 39 3,525 90 0.05 0.10 0.10 0.15 4 9 9 13LED LED G 90 6,045 67 0.00 0.05 0.05 0.15 0 3 3 10
1.00 1.00 1.00 1.00 63 65 65 68
LampType Luminaire
2017FixtureWatts
MaintainedLuminaireLumens LPW
LZ1 LZ2 LZ3 LZ4 LZ1 LZ2 LZ3 LZ4
LED LED H 18 1,135 65 0.05 0.05 0.05 0.05 3 3 3 3LED LED H 25 1,500 59 0.20 0.15 0.15 0.10 12 9 9 6LED LED J 25 1,502 61 0.05 0.10 0.05 0.05 3 6 3 3LED LED K 23 1,894 81 0.20 0.20 0.20 0.15 16 16 16 12LED LED H 18 1,135 65 0.05 0.05 0.05 0.05 3 3 3 3LED LED H 25 1,500 59 0.20 0.15 0.15 0.10 12 9 9 6LED LED J 25 1,502 61 0.05 0.10 0.05 0.05 3 6 3 3LED LED K 23 1,894 81 0.20 0.20 0.20 0.15 16 16 16 12LED LED L 16 2,919 177 0.00 0.00 0.05 0.05 0 0 9 9LED LED K 23 1,894 81 0.00 0.00 0.05 0.10 0 0 4 8LED LED J 49 3,004 61 0.00 0.00 0.00 0.05 0 0 0 3LED LED J 52 4,005 77 0.00 0.00 0.00 0.10 0 0 0 8
1.00 1.00 1.00 1.00 69 69 76 76
LampType Luminaire
2017FixtureWatts
MaintainedLuminaireLumens LPW
LZ1 LZ2 LZ3 LZ4 LZ1 LZ2 LZ3 LZ4
LED LEDM 22 1,457 66 0.05 0.05 0.05 0.05 3 3 3 3LED LEDM 21 1,562 73 0.20 0.15 0.15 0.10 15 11 11 7LED LEDM 22 1,457 66 0.05 0.10 0.05 0.05 3 7 3 3LED LED N 43 3,797 88 0.20 0.20 0.20 0.15 18 18 18 13LED LEDM 22 1,457 66 0.05 0.05 0.05 0.05 3 3 3 3LED LEDM 21 1,562 73 0.20 0.15 0.15 0.10 15 11 11 7LED LEDM 22 1,457 66 0.05 0.10 0.05 0.05 3 7 3 3LED LED P 42 3,443 82 0.20 0.20 0.20 0.15 16 16 16 12LED LEDM 22 1,457 66 0.00 0.00 0.05 0.05 0 0 3 3LED LED N 27 2,776 102 0.00 0.00 0.05 0.10 0 0 5 10LED LED P 28 2,766 98 0.00 0.00 0.00 0.05 0 0 0 5LED LED P 56 4,580 82 0.00 0.00 0.00 0.10 0 0 0 8
1.00 1.00 1.00 1.00 77 76 78 80
69 70 73 75
Weighting Weighted LPW
Weighting Weighted LPW
Weighting Weighted LPW
AVERAGE:
2016 LED Equivalency
2016 LED Equivalency
2016 LED Equivalency
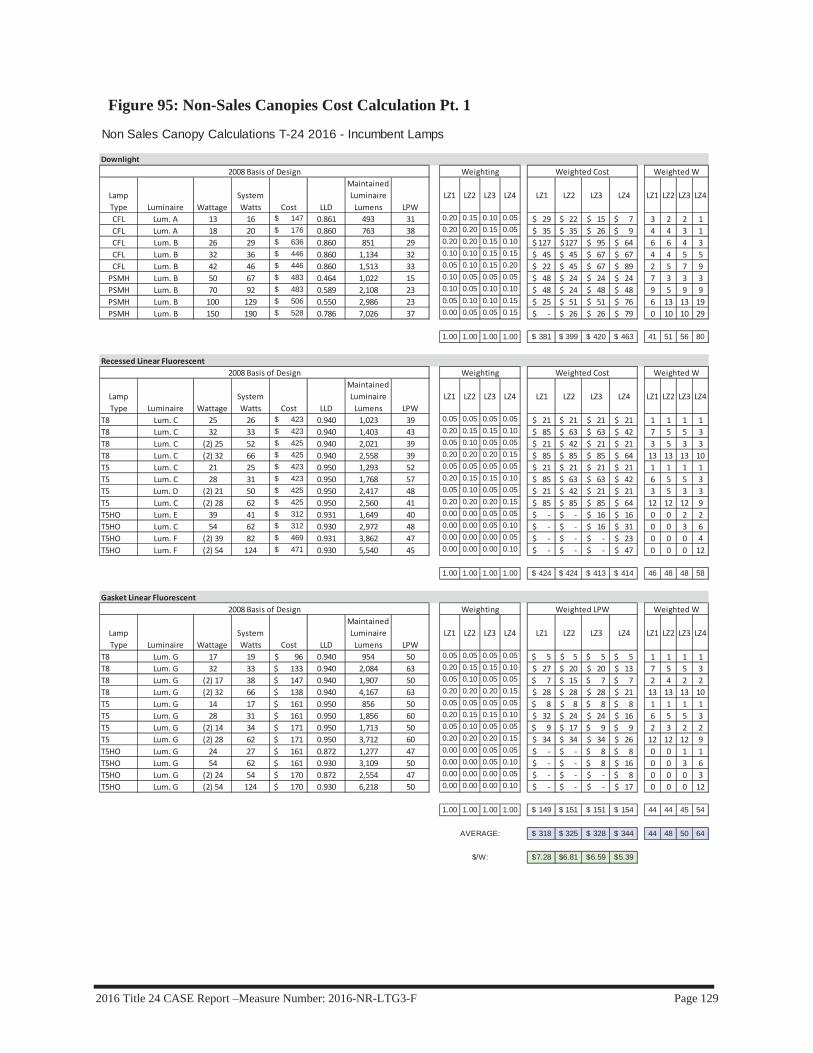
2016 Title 24 CASE Report –Measure Number: 2016-NR-LTG3-F Page 129
Figure 95: Non-Sales Canopies Cost Calculation Pt. 1
Non Sales Canopy Calculations T-24 2016 - Incumbent Lamps
Downlight
LampType Luminaire Wattage
SystemWatts Cost LLD
MaintainedLuminaireLumens LPW
LZ1 LZ2 LZ3 LZ4 LZ1 LZ2 LZ3 LZ4 LZ1 LZ2 LZ3 LZ4
CFL Lum. A 13 16 147$ 0.861 493 31 0.20 0.15 0.10 0.05 29$ 22$ 15$ 7$ 3 2 2 1CFL Lum. A 18 20 176$ 0.860 763 38 0.20 0.20 0.15 0.05 35$ 35$ 26$ 9$ 4 4 3 1CFL Lum. B 26 29 636$ 0.860 851 29 0.20 0.20 0.15 0.10 127$ 127$ 95$ 64$ 6 6 4 3CFL Lum. B 32 36 446$ 0.860 1,134 32 0.10 0.10 0.15 0.15 45$ 45$ 67$ 67$ 4 4 5 5CFL Lum. B 42 46 446$ 0.860 1,513 33 0.05 0.10 0.15 0.20 22$ 45$ 67$ 89$ 2 5 7 9PSMH Lum. B 50 67 483$ 0.464 1,022 15 0.10 0.05 0.05 0.05 48$ 24$ 24$ 24$ 7 3 3 3PSMH Lum. B 70 92 483$ 0.589 2,108 23 0.10 0.05 0.10 0.10 48$ 24$ 48$ 48$ 9 5 9 9PSMH Lum. B 100 129 506$ 0.550 2,986 23 0.05 0.10 0.10 0.15 25$ 51$ 51$ 76$ 6 13 13 19PSMH Lum. B 150 190 528$ 0.786 7,026 37 0.00 0.05 0.05 0.15 $ 26$ 26$ 79$ 0 10 10 29
1.00 1.00 1.00 1.00 381$ 399$ 420$ 463$ 41 51 56 80
Recessed Linear Fluorescent
LampType Luminaire Wattage
SystemWatts Cost LLD
MaintainedLuminaireLumens LPW
LZ1 LZ2 LZ3 LZ4 LZ1 LZ2 LZ3 LZ4 LZ1 LZ2 LZ3 LZ4
T8 Lum. C 25 26 423$ 0.940 1,023 39 0.05 0.05 0.05 0.05 21$ 21$ 21$ 21$ 1 1 1 1T8 Lum. C 32 33 423$ 0.940 1,403 43 0.20 0.15 0.15 0.10 85$ 63$ 63$ 42$ 7 5 5 3T8 Lum. C (2) 25 52 425$ 0.940 2,021 39 0.05 0.10 0.05 0.05 21$ 42$ 21$ 21$ 3 5 3 3T8 Lum. C (2) 32 66 425$ 0.940 2,558 39 0.20 0.20 0.20 0.15 85$ 85$ 85$ 64$ 13 13 13 10T5 Lum. C 21 25 423$ 0.950 1,293 52 0.05 0.05 0.05 0.05 21$ 21$ 21$ 21$ 1 1 1 1T5 Lum. C 28 31 423$ 0.950 1,768 57 0.20 0.15 0.15 0.10 85$ 63$ 63$ 42$ 6 5 5 3T5 Lum. D (2) 21 50 425$ 0.950 2,417 48 0.05 0.10 0.05 0.05 21$ 42$ 21$ 21$ 3 5 3 3T5 Lum. C (2) 28 62 425$ 0.950 2,560 41 0.20 0.20 0.20 0.15 85$ 85$ 85$ 64$ 12 12 12 9T5HO Lum. E 39 41 312$ 0.931 1,649 40 0.00 0.00 0.05 0.05 $ $ 16$ 16$ 0 0 2 2T5HO Lum. C 54 62 312$ 0.930 2,972 48 0.00 0.00 0.05 0.10 $ $ 16$ 31$ 0 0 3 6T5HO Lum. F (2) 39 82 469$ 0.931 3,862 47 0.00 0.00 0.00 0.05 $ $ $ 23$ 0 0 0 4T5HO Lum. F (2) 54 124 471$ 0.930 5,540 45 0.00 0.00 0.00 0.10 $ $ $ 47$ 0 0 0 12
1.00 1.00 1.00 1.00 424$ 424$ 413$ 414$ 46 48 48 58
Gasket Linear Fluorescent
LampType Luminaire Wattage
SystemWatts Cost LLD
MaintainedLuminaireLumens LPW
LZ1 LZ2 LZ3 LZ4 LZ1 LZ2 LZ3 LZ4 LZ1 LZ2 LZ3 LZ4
T8 Lum. G 17 19 96$ 0.940 954 50 0.05 0.05 0.05 0.05 5$ 5$ 5$ 5$ 1 1 1 1T8 Lum. G 32 33 133$ 0.940 2,084 63 0.20 0.15 0.15 0.10 27$ 20$ 20$ 13$ 7 5 5 3T8 Lum. G (2) 17 38 147$ 0.940 1,907 50 0.05 0.10 0.05 0.05 7$ 15$ 7$ 7$ 2 4 2 2T8 Lum. G (2) 32 66 138$ 0.940 4,167 63 0.20 0.20 0.20 0.15 28$ 28$ 28$ 21$ 13 13 13 10T5 Lum. G 14 17 161$ 0.950 856 50 0.05 0.05 0.05 0.05 8$ 8$ 8$ 8$ 1 1 1 1T5 Lum. G 28 31 161$ 0.950 1,856 60 0.20 0.15 0.15 0.10 32$ 24$ 24$ 16$ 6 5 5 3T5 Lum. G (2) 14 34 171$ 0.950 1,713 50 0.05 0.10 0.05 0.05 9$ 17$ 9$ 9$ 2 3 2 2T5 Lum. G (2) 28 62 171$ 0.950 3,712 60 0.20 0.20 0.20 0.15 34$ 34$ 34$ 26$ 12 12 12 9T5HO Lum. G 24 27 161$ 0.872 1,277 47 0.00 0.00 0.05 0.05 $ $ 8$ 8$ 0 0 1 1T5HO Lum. G 54 62 161$ 0.930 3,109 50 0.00 0.00 0.05 0.10 $ $ 8$ 16$ 0 0 3 6T5HO Lum. G (2) 24 54 170$ 0.872 2,554 47 0.00 0.00 0.00 0.05 $ $ $ 8$ 0 0 0 3T5HO Lum. G (2) 54 124 170$ 0.930 6,218 50 0.00 0.00 0.00 0.10 $ $ $ 17$ 0 0 0 12
1.00 1.00 1.00 1.00 149$ 151$ 151$ 154$ 44 44 45 54
318$ 325$ 328$ 344$ 44 48 50 64
7.28$ 6.81$ 6.59$ 5.39$
Weighted Cost
Weighted Cost
Weighted LPW
$/W:
2008Basis of Design Weighting Weighted W
AVERAGE:
2008Basis of Design Weighting Weighted W
2008Basis of Design Weighting Weighted W
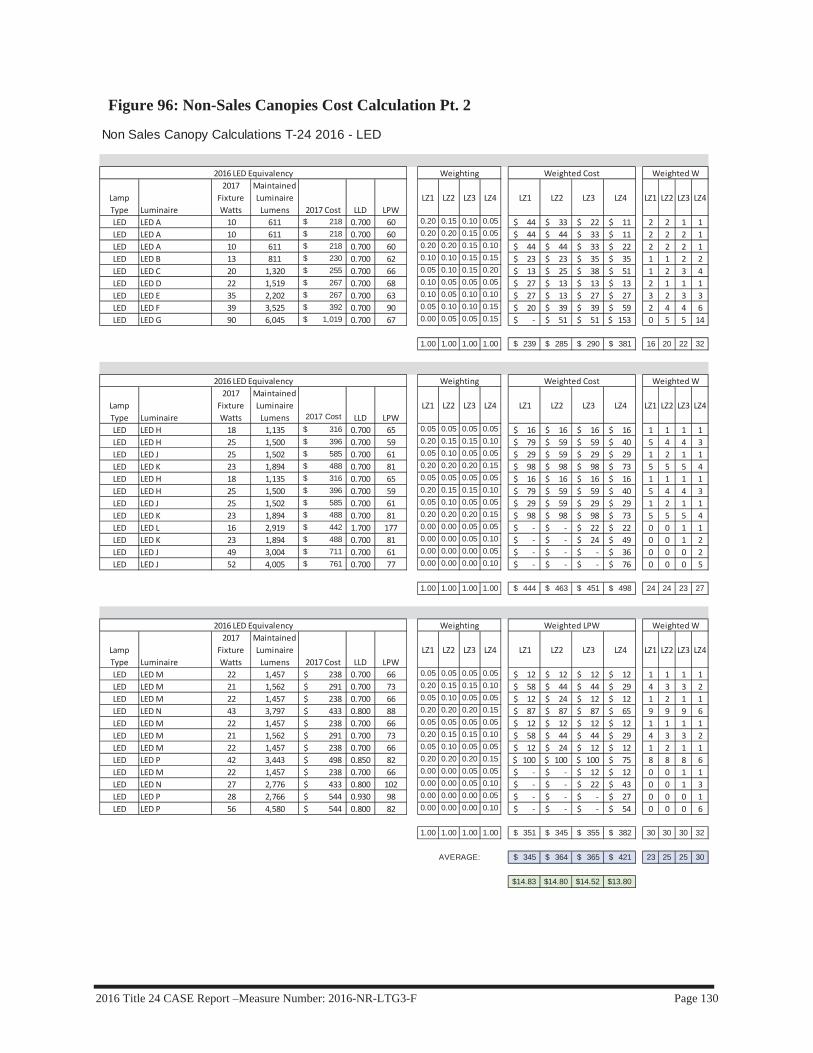
2016 Title 24 CASE Report –Measure Number: 2016-NR-LTG3-F Page 130
Figure 96: Non-Sales Canopies Cost Calculation Pt. 2
Non Sales Canopy Calculations T-24 2016 - LED
LampType Luminaire
2017FixtureWatts
MaintainedLuminaireLumens 2017 Cost LLD LPW
LZ1 LZ2 LZ3 LZ4 LZ1 LZ2 LZ3 LZ4 LZ1 LZ2 LZ3 LZ4
LED LED A 10 611 218$ 0.700 60 0.20 0.15 0.10 0.05 44$ 33$ 22$ 11$ 2 2 1 1LED LED A 10 611 218$ 0.700 60 0.20 0.20 0.15 0.05 44$ 44$ 33$ 11$ 2 2 2 1LED LED A 10 611 218$ 0.700 60 0.20 0.20 0.15 0.10 44$ 44$ 33$ 22$ 2 2 2 1LED LED B 13 811 230$ 0.700 62 0.10 0.10 0.15 0.15 23$ 23$ 35$ 35$ 1 1 2 2LED LED C 20 1,320 255$ 0.700 66 0.05 0.10 0.15 0.20 13$ 25$ 38$ 51$ 1 2 3 4LED LED D 22 1,519 267$ 0.700 68 0.10 0.05 0.05 0.05 27$ 13$ 13$ 13$ 2 1 1 1LED LED E 35 2,202 267$ 0.700 63 0.10 0.05 0.10 0.10 27$ 13$ 27$ 27$ 3 2 3 3LED LED F 39 3,525 392$ 0.700 90 0.05 0.10 0.10 0.15 20$ 39$ 39$ 59$ 2 4 4 6LED LED G 90 6,045 1,019$ 0.700 67 0.00 0.05 0.05 0.15 $ 51$ 51$ 153$ 0 5 5 14
1.00 1.00 1.00 1.00 239$ 285$ 290$ 381$ 16 20 22 32
LampType Luminaire
2017FixtureWatts
MaintainedLuminaireLumens 2017 Cost LLD LPW
LZ1 LZ2 LZ3 LZ4 LZ1 LZ2 LZ3 LZ4 LZ1 LZ2 LZ3 LZ4
LED LED H 18 1,135 316$ 0.700 65 0.05 0.05 0.05 0.05 16$ 16$ 16$ 16$ 1 1 1 1LED LED H 25 1,500 396$ 0.700 59 0.20 0.15 0.15 0.10 79$ 59$ 59$ 40$ 5 4 4 3LED LED J 25 1,502 585$ 0.700 61 0.05 0.10 0.05 0.05 29$ 59$ 29$ 29$ 1 2 1 1LED LED K 23 1,894 488$ 0.700 81 0.20 0.20 0.20 0.15 98$ 98$ 98$ 73$ 5 5 5 4LED LED H 18 1,135 316$ 0.700 65 0.05 0.05 0.05 0.05 16$ 16$ 16$ 16$ 1 1 1 1LED LED H 25 1,500 396$ 0.700 59 0.20 0.15 0.15 0.10 79$ 59$ 59$ 40$ 5 4 4 3LED LED J 25 1,502 585$ 0.700 61 0.05 0.10 0.05 0.05 29$ 59$ 29$ 29$ 1 2 1 1LED LED K 23 1,894 488$ 0.700 81 0.20 0.20 0.20 0.15 98$ 98$ 98$ 73$ 5 5 5 4LED LED L 16 2,919 442$ 1.700 177 0.00 0.00 0.05 0.05 $ $ 22$ 22$ 0 0 1 1LED LED K 23 1,894 488$ 0.700 81 0.00 0.00 0.05 0.10 $ $ 24$ 49$ 0 0 1 2LED LED J 49 3,004 711$ 0.700 61 0.00 0.00 0.00 0.05 $ $ $ 36$ 0 0 0 2LED LED J 52 4,005 761$ 0.700 77 0.00 0.00 0.00 0.10 $ $ $ 76$ 0 0 0 5
1.00 1.00 1.00 1.00 444$ 463$ 451$ 498$ 24 24 23 27
LampType Luminaire
2017FixtureWatts
MaintainedLuminaireLumens 2017 Cost LLD LPW
LZ1 LZ2 LZ3 LZ4 LZ1 LZ2 LZ3 LZ4 LZ1 LZ2 LZ3 LZ4
LED LEDM 22 1,457 238$ 0.700 66 0.05 0.05 0.05 0.05 12$ 12$ 12$ 12$ 1 1 1 1LED LEDM 21 1,562 291$ 0.700 73 0.20 0.15 0.15 0.10 58$ 44$ 44$ 29$ 4 3 3 2LED LEDM 22 1,457 238$ 0.700 66 0.05 0.10 0.05 0.05 12$ 24$ 12$ 12$ 1 2 1 1LED LED N 43 3,797 433$ 0.800 88 0.20 0.20 0.20 0.15 87$ 87$ 87$ 65$ 9 9 9 6LED LEDM 22 1,457 238$ 0.700 66 0.05 0.05 0.05 0.05 12$ 12$ 12$ 12$ 1 1 1 1LED LEDM 21 1,562 291$ 0.700 73 0.20 0.15 0.15 0.10 58$ 44$ 44$ 29$ 4 3 3 2LED LEDM 22 1,457 238$ 0.700 66 0.05 0.10 0.05 0.05 12$ 24$ 12$ 12$ 1 2 1 1LED LED P 42 3,443 498$ 0.850 82 0.20 0.20 0.20 0.15 100$ 100$ 100$ 75$ 8 8 8 6LED LEDM 22 1,457 238$ 0.700 66 0.00 0.00 0.05 0.05 $ $ 12$ 12$ 0 0 1 1LED LED N 27 2,776 433$ 0.800 102 0.00 0.00 0.05 0.10 $ $ 22$ 43$ 0 0 1 3LED LED P 28 2,766 544$ 0.930 98 0.00 0.00 0.00 0.05 $ $ $ 27$ 0 0 0 1LED LED P 56 4,580 544$ 0.800 82 0.00 0.00 0.00 0.10 $ $ $ 54$ 0 0 0 6
1.00 1.00 1.00 1.00 351$ 345$ 355$ 382$ 30 30 30 32
345$ 364$ 365$ 421$ 23 25 25 30
14.83$ 14.80$ 14.52$ 13.80$
AVERAGE:
Weighting2016 LED Equivalency WeightedWWeighted LPW
2016 LED Equivalency Weighting Weighted WWeighted Cost
WeightedWWeighted Cost2016 LED Equivalency Weighting

2016 Title 24 CASE Report –Measure Number: 2016-NR-LTG3-F Page 131
Figure 97: Guard Station Calculation Results and Recommendations
Figure 98: Guard Station Lumen Equivalency Calculation Pt. 1
Guard Station RecommendationsLZ1 LZ2 LZ3 LZ4
Allowance 0.154 0.355 0.708 0.985 WLPW 31 30 28 29 lm/WLPW 77 80 83 86 lm/W
Change 0.062 0.133 0.240 0.329 Limit of ReductionProposed 0.100 0.300 0.500 0.750 W/sf
2013
2016
Guard Station Calculations T-24 2016 - Incumbent Lamps
Wall Pack
WattageLamp Type Luminaire
System Watts
Maintained Luminaire Lumens LLD LPW
LZ1 LZ2 LZ3 LZ4 LZ1 LZ2 LZ3 LZ4
26 CFL Lum. A 27 710 0.860 26 0.20 0.10 0.05 0.05 5 3 1 132 CFL Lum. A 36 947 0.860 26 0.25 0.15 0.05 0.05 7 4 1 142 CFL Lum. A 47 1,262 0.860 27 0.25 0.20 0.10 0.05 7 5 3 170 PSMH Lum. A 90 1,509 0.589 17 0.15 0.25 0.25 0.15 3 4 4 3100 PSMH Lum. A 129 2,138 0.550 17 0.10 0.15 0.25 0.20 2 2 4 3150 PSMH Lum. A 190 5,029 0.786 26 0.05 0.10 0.15 0.20 1 3 4 5175 PSMH Lum. B 198 4,944 0.648 25 0.00 0.05 0.10 0.20 0 1 2 5250 PSMH Lum. B 291 6,552 0.611 23 0.00 0.00 0.05 0.10 0 0 1 2
1.00 1.00 1.00 1.00 24 23 21 22
Area
WattageLamp Type Luminaire
System Watts
Maintained Luminaire Lumens LLD LPW
LZ1 LZ2 LZ3 LZ4 LZ1 LZ2 LZ3 LZ4
18 CFL Lum. C 19 690 0.861 36 0.05 0.05 0.00 0.00 2 2 0 026 CFL Lum. C 27 1,026 0.860 38 0.20 0.10 0.05 0.05 8 4 2 232 CFL Lum. C 36 1,440 0.860 40 0.20 0.15 0.05 0.05 8 6 2 242 CFL Lum. C 47 1,920 0.860 41 0.25 0.20 0.10 0.05 10 8 4 270 PSMH Lum. D 90 1,984 0.589 22 0.15 0.20 0.25 0.15 3 4 6 3100 PSMH Lum. D 129 2,809 0.550 22 0.10 0.15 0.25 0.20 2 3 5 4150 PSMH Lum. D 190 6,558 0.786 35 0.05 0.10 0.15 0.20 2 3 5 7175 PSMH Lum. D 198 5,053 0.648 26 0.00 0.05 0.10 0.20 0 1 3 5250 PSMH Lum. D 291 6,697 0.611 23 0.00 0.00 0.05 0.10 0 0 1 2
1.00 1.00 1.00 1.00 35 32 28 28
Pole Mounted Flood
WattageLamp Type Luminaire
System Watts
Maintained Luminaire Lumens LLD LPW
LZ1 LZ2 LZ3 LZ4 LZ1 LZ2 LZ3 LZ4
70 PSMH Lum. E 90 2,769 0.589 31 0.30 0.25 0.15 0.10 9 8 5 3100 PSMH Lum. E 129 3,923 0.550 30 0.25 0.25 0.15 0.15 8 8 5 5150 PSMH Lum. E 190 9,229 0.786 49 0.20 0.20 0.20 0.20 10 10 10 10175 PSMH Lum. E 198 6,964 0.648 35 0.15 0.15 0.25 0.25 5 5 9 9250 PSMH Lum. E 291 9,230 0.611 32 0.10 0.15 0.25 0.30 3 5 8 10
1.00 1.00 1.00 1.00 35 35 36 36
31 30 28 29
2008 Basis of Design
2008 Basis of Design
AVERAGE:
Weighting Weighted LPW
Weighting Weighted LPW
2008 Basis of Design Weighting Weighted LPW

2016 Title 24 CASE Report –Measure Number: 2016-NR-LTG3-F Page 132
Figure 99: Guard Station Lumen Equivalency Calculation Pt. 2
Guard Station Calculations T-24 2016 - LED
Luminaire
Maintained Luminaire Lumens LLD
2014 Fixture Watts
2017 Fixture Watts LPW
LZ1 LZ2 LZ3 LZ4 LZ1 LZ2 LZ3 LZ4
LED A 514 0.700 9 6 81 0.20 0.10 0.05 0.05 16 8 4 4LED A 895 0.700 16 11 78 0.25 0.15 0.05 0.05 19 12 4 4LED B 1,373 0.958 18 13 108 0.25 0.20 0.10 0.05 27 22 11 5LED B 2,341 0.903 38 27 87 0.15 0.25 0.25 0.15 13 22 22 13LED C 2,733 0.700 50 35 77 0.10 0.15 0.25 0.20 8 12 19 15LED D 5,312 0.887 71 50 106 0.05 0.10 0.15 0.20 5 11 16 21LED D 6,645 0.887 87 61 108 0.00 0.05 0.10 0.20 0 5 11 22LED E 9,622 0.946 110 78 123 0.00 0.00 0.05 0.10 0 0 6 12
1.00 1.00 1.00 1.00 89 91 93 97
Luminaire
Maintained Luminaire Lumens LLD
2014 Fixture Watts
2017 Fixture Watts LPW
LZ1 LZ2 LZ3 LZ4 LZ1 LZ2 LZ3 LZ4
LED F 852 0.768 30 21 40 0.05 0.05 0.00 0.00 2 2 0 0LED F 852 0.768 30 21 40 0.20 0.10 0.05 0.05 8 4 2 2LED G 1,172 0.700 27 19 61 0.20 0.15 0.05 0.05 12 9 3 3LED G 1,441 0.700 27 19 75 0.25 0.20 0.10 0.05 19 15 8 4LED G 2,261 0.700 54 38 59 0.15 0.20 0.25 0.15 9 12 15 9LED H 3,331 0.700 53 37 89 0.10 0.15 0.25 0.20 9 13 22 18LED H 5,965 0.700 107 76 79 0.05 0.10 0.15 0.20 4 8 12 16LED H 5,391 0.700 84 60 90 0.00 0.05 0.10 0.20 0 5 9 18LED H 7,662 0.700 128 90 85 0.00 0.00 0.05 0.10 0 0 4 8
1.00 1.00 1.00 1.00 63 68 75 78
Luminaire
Maintained Luminaire Lumens LLD
2014 Fixture Watts
2017 Fixture Watts LPW
LZ1 LZ2 LZ3 LZ4 LZ1 LZ2 LZ3 LZ4
LED J 2,946 0.700 45 32 92 0.30 0.25 0.15 0.10 28 23 14 9LED J 4,613 0.700 94 67 69 0.25 0.25 0.15 0.15 17 17 10 10LED K 9,058 0.700 179 127 71 0.20 0.20 0.20 0.20 14 14 14 14LED K 7,294 0.700 149 106 69 0.15 0.15 0.25 0.25 10 10 17 17LED L 12,700 0.858 170 121 105 0.10 0.15 0.25 0.30 11 16 26 32
1.00 1.00 1.00 1.00 80 81 82 83
77 80 83 86
Weighted LPW
Weighting Weighted LPW
2016 LED Equivalency
2016 LED Equivalency
AVERAGE:
Weighting
Weighted LPW2016 LED Equivalency Weighting

2016 Title 24 CASE Report –Measure Number: 2016-NR-LTG3-F Page 133
Figure 100: Guard Station Cost Calculation Pt. 1
Guard Station Calculations T-24 2016 - Incumbent Lamps
Wall Pack
WattageLamp Type Luminaire
System Watts Cost
Maintained Luminaire Lumens LLD LPW
LZ1 LZ2 LZ3 LZ4 LZ1 LZ2 LZ3 LZ4 LZ1 LZ2 LZ3 LZ4
26 CFL Lum. A 27 365$ 710 0.860 26 0.20 0.10 0.05 0.05 73$ 36$ 18$ 18$ 5 3 1 132 CFL Lum. A 36 368$ 947 0.860 26 0.25 0.15 0.05 0.05 92$ 55$ 18$ 18$ 9 5 2 242 CFL Lum. A 47 368$ 1,262 0.860 27 0.25 0.20 0.10 0.05 92$ 74$ 37$ 18$ 12 9 5 270 PSMH Lum. A 90 377$ 1,509 0.589 17 0.15 0.25 0.25 0.15 57$ 94$ 94$ 57$ 14 23 23 14100 PSMH Lum. A 129 382$ 2,138 0.550 17 0.10 0.15 0.25 0.20 38$ 57$ 96$ 76$ 13 19 32 26150 PSMH Lum. A 190 393$ 5,029 0.786 26 0.05 0.10 0.15 0.20 20$ 39$ 59$ 79$ 10 19 29 38175 PSMH Lum. B 198 974$ 4,944 0.648 25 0.00 0.05 0.10 0.20 -$ 49$ 97$ 195$ 0 10 20 40250 PSMH Lum. B 291 1,229$ 6,552 0.611 23 0.00 0.00 0.05 0.10 -$ -$ 61$ 123$ 0 0 15 29
1.00 1.00 1.00 1.00 372$ 405$ 481$ 584$ 62 88 125 152
Area
WattageLamp Type Luminaire
System Watts Cost
Maintained Luminaire Lumens LLD LPW
LZ1 LZ2 LZ3 LZ4 LZ1 LZ2 LZ3 LZ4 LZ1 LZ2 LZ3 LZ4
18 CFL Lum. C 19 600$ 690 0.861 36 0.05 0.05 0.00 0.00 30$ 30$ -$ -$ 1 1 0 026 CFL Lum. C 27 600$ 1,026 0.860 38 0.20 0.10 0.05 0.05 120$ 60$ 30$ 30$ 5 3 1 132 CFL Lum. C 36 600$ 1,440 0.860 40 0.20 0.15 0.05 0.05 120$ 90$ 30$ 30$ 7 5 2 242 CFL Lum. C 47 600$ 1,920 0.860 41 0.25 0.20 0.10 0.05 150$ 120$ 60$ 30$ 12 9 5 270 PSMH Lum. D 90 1,035$ 1,984 0.589 22 0.15 0.20 0.25 0.15 155$ 207$ 259$ 155$ 14 18 23 14100 PSMH Lum. D 129 1,035$ 2,809 0.550 22 0.10 0.15 0.25 0.20 104$ 155$ 259$ 207$ 13 19 32 26150 PSMH Lum. D 190 1,035$ 6,558 0.786 35 0.05 0.10 0.15 0.20 52$ 104$ 155$ 207$ 10 19 29 38175 PSMH Lum. D 198 1,235$ 5,053 0.648 26 0.00 0.05 0.10 0.20 -$ 62$ 123$ 247$ 0 10 20 40250 PSMH Lum. D 291 1,235$ 6,697 0.611 23 0.00 0.00 0.05 0.10 -$ -$ 62$ 123$ 0 0 15 29
1.00 1.00 1.00 1.00 731$ 828$ 978$ 1,030$ 61 85 125 152
Pole Mounted Flood
WattageLamp Type Luminaire
System Watts Cost
Maintained Luminaire Lumens LLD LPW
LZ1 LZ2 LZ3 LZ4 LZ1 LZ2 LZ3 LZ4 LZ1 LZ2 LZ3 LZ4
70 PSMH Lum. E 90 335$ 2,769 0.589 31 0.30 0.25 0.15 0.10 101$ 84$ 50$ 34$ 27 23 14 9100 PSMH Lum. E 129 355$ 3,923 0.550 30 0.25 0.25 0.15 0.15 89$ 89$ 53$ 53$ 32 32 19 19150 PSMH Lum. E 190 358$ 9,229 0.786 49 0.20 0.20 0.20 0.20 72$ 72$ 72$ 72$ 38 38 38 38175 PSMH Lum. E 198 358$ 6,964 0.648 35 0.15 0.15 0.25 0.25 54$ 54$ 89$ 89$ 30 30 50 50250 PSMH Lum. E 291 358$ 9,230 0.611 32 0.10 0.15 0.25 0.30 36$ 54$ 89$ 107$ 29 44 73 87
1.00 1.00 1.00 1.00 350$ 352$ 354$ 355$ 156 166 193 203
484$ 528$ 605$ 657$ 93 113 148 169
5.20$ 4.67$ 4.08$ 3.89$
2008 Basis of Design Weighting Weighted WWeighted Cost
2008 Basis of Design Weighting Weighted WWeighted Cost
$/W
2008 Basis of Design Weighting Weighted W
AVERAGE:
Weighted Cost

2016 Title 24 CASE Report –Measure Number: 2016-NR-LTG3-F Page 134
Figure 101: Guard Station Cost Calculation Pt. 2
Guard Station Calculations T-24 2016 - LED
Luminaire
Maintained Luminaire Lumens
2017 Cost
2017Fixture Watts LPW
LZ1 LZ2 LZ3 LZ4 LZ1 LZ2 LZ3 LZ4 LZ1 LZ2 LZ3 LZ4
LED A 514 207$ 6 81 0.20 0.10 0.05 0.05 41$ 21$ 10$ 10$ 1 1 0 0LED A 895 237$ 11 78 0.25 0.15 0.05 0.05 59$ 36$ 12$ 12$ 3 2 1 1LED B 1,373 428$ 13 108 0.25 0.20 0.10 0.05 107$ 86$ 43$ 21$ 3 3 1 1LED B 2,341 428$ 27 87 0.15 0.25 0.25 0.15 64$ 107$ 107$ 64$ 4 7 7 4LED C 2,733 996$ 35 77 0.10 0.15 0.25 0.20 100$ 149$ 249$ 199$ 4 5 9 7LED D 5,312 1,476$ 50 106 0.05 0.10 0.15 0.20 74$ 148$ 221$ 295$ 3 5 8 10LED D 6,645 1,583$ 61 108 0.00 0.05 0.10 0.20 -$ 79$ 158$ 317$ 0 3 6 12LED E 9,622 1,512$ 78 123 0.00 0.00 0.05 0.10 -$ -$ 76$ 151$ 0 0 4 8
1.00 1.00 1.00 1.00 445$ 625$ 876$ 1,070$ 17 25 35 43
Luminaire
Maintained Luminaire Lumens
2017 Cost
2017Fixture Watts LPW
LZ1 LZ2 LZ3 LZ4 LZ1 LZ2 LZ3 LZ4 LZ1 LZ2 LZ3 LZ4
LED F 852 979$ 21 40 0.05 0.05 0.00 0.00 49$ 49$ -$ -$ 1 1 0 0LED F 852 979$ 21 40 0.20 0.10 0.05 0.05 196$ 98$ 49$ 49$ 4 2 1 1LED G 1,172 670$ 19 61 0.20 0.15 0.05 0.05 134$ 101$ 34$ 34$ 4 3 1 1LED G 1,441 701$ 19 75 0.25 0.20 0.10 0.05 175$ 140$ 70$ 35$ 5 4 2 1LED G 2,261 508$ 38 59 0.15 0.20 0.25 0.15 76$ 102$ 127$ 76$ 6 8 10 6LED H 3,331 1,204$ 37 89 0.10 0.15 0.25 0.20 120$ 181$ 301$ 241$ 4 6 9 7LED H 5,965 1,720$ 76 79 0.05 0.10 0.15 0.20 86$ 172$ 258$ 344$ 4 8 11 15LED H 5,391 1,810$ 60 90 0.00 0.05 0.10 0.20 -$ 91$ 181$ 362$ 0 3 6 12LED H 7,662 1,810$ 90 85 0.00 0.00 0.05 0.10 -$ -$ 91$ 181$ 0 0 5 9
1.00 1.00 1.00 1.00 837$ 932$ 1,110$ 1,321$ 27 34 45 52
Luminaire
Maintained Luminaire Lumens
2017 Cost
2017Fixture Watts LPW
LZ1 LZ2 LZ3 LZ4 LZ1 LZ2 LZ3 LZ4 LZ1 LZ2 LZ3 LZ4
LED J 2,946 522$ 32 92 0.30 0.25 0.15 0.10 157$ 131$ 78$ 52$ 10 8 5 3LED J 4,613 522$ 67 69 0.25 0.25 0.15 0.15 131$ 131$ 78$ 78$ 17 17 10 10LED K 9,058 1,060$ 127 71 0.20 0.20 0.20 0.20 212$ 212$ 212$ 212$ 25 25 25 25LED K 7,294 994$ 106 69 0.15 0.15 0.25 0.25 149$ 149$ 249$ 249$ 16 16 26 26LED L 12,700 1,383$ 121 105 0.10 0.15 0.25 0.30 138$ 207$ 346$ 415$ 12 18 30 36
1.00 1.00 1.00 1.00 787$ 830$ 963$ 1,006$ 80 84 97 101
690$ 796$ 983$ 1,133$ 41 48 59 65
16.7$ 16.7$ 16.68$ 17.31$
Weighted WWeighted Cost2016 LED Equivalency Weighting
Weighted WWeighted Cost
2016 LED Equivalency Weighting Weighted WWeighted Cost
$/W
2016 LED Equivalency Weighting
AVERAGE:
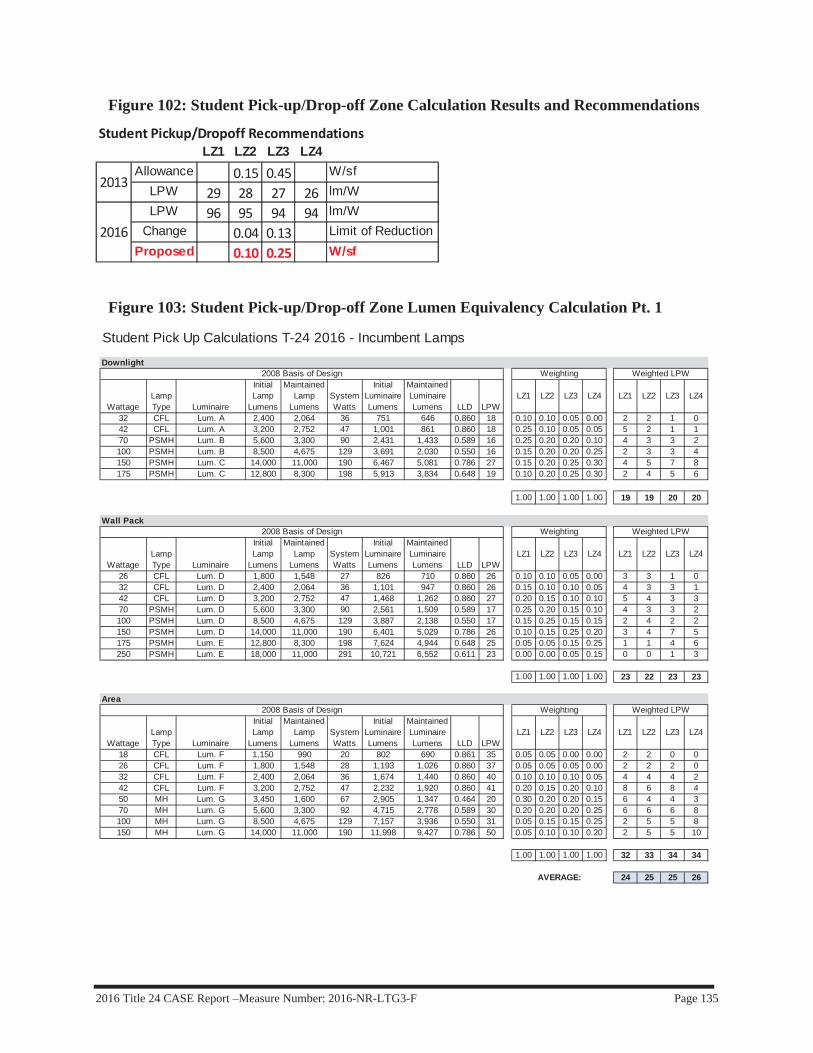
2016 Title 24 CASE Report –Measure Number: 2016-NR-LTG3-F Page 135
Figure 102: Student Pick-up/Drop-off Zone Calculation Results and Recommendations
Figure 103: Student Pick-up/Drop-off Zone Lumen Equivalency Calculation Pt. 1
Student Pickup/Dropoff RecommendationsLZ1 LZ2 LZ3 LZ4
Allowance 0.15 0.45 W/sfLPW 29 28 27 26 lm/WLPW 96 95 94 94 lm/W
Change 0.04 0.13 Limit of ReductionProposed 0.10 0.25 W/sf
2013
2016
Student Pick Up Calculations T-24 2016 - Incumbent Lamps
Downlight
WattageLamp Type Luminaire
Initial Lamp
Lumens
Maintained Lamp
LumensSystem Watts
Initial Luminaire Lumens
Maintained Luminaire Lumens LLD LPW
LZ1 LZ2 LZ3 LZ4 LZ1 LZ2 LZ3 LZ4
32 CFL Lum. A 2,400 2,064 36 751 646 0.860 18 0.10 0.10 0.05 0.00 2 2 1 042 CFL Lum. A 3,200 2,752 47 1,001 861 0.860 18 0.25 0.10 0.05 0.05 5 2 1 170 PSMH Lum. B 5,600 3,300 90 2,431 1,433 0.589 16 0.25 0.20 0.20 0.10 4 3 3 2100 PSMH Lum. B 8,500 4,675 129 3,691 2,030 0.550 16 0.15 0.20 0.20 0.25 2 3 3 4150 PSMH Lum. C 14,000 11,000 190 6,467 5,081 0.786 27 0.15 0.20 0.25 0.30 4 5 7 8175 PSMH Lum. C 12,800 8,300 198 5,913 3,834 0.648 19 0.10 0.20 0.25 0.30 2 4 5 6
1.00 1.00 1.00 1.00 19 19 20 20
Wall Pack
WattageLamp Type Luminaire
Initial Lamp
Lumens
Maintained Lamp
LumensSystem Watts
Initial Luminaire Lumens
Maintained Luminaire Lumens LLD LPW
LZ1 LZ2 LZ3 LZ4 LZ1 LZ2 LZ3 LZ4
26 CFL Lum. D 1,800 1,548 27 826 710 0.860 26 0.10 0.10 0.05 0.00 3 3 1 032 CFL Lum. D 2,400 2,064 36 1,101 947 0.860 26 0.15 0.10 0.10 0.05 4 3 3 142 CFL Lum. D 3,200 2,752 47 1,468 1,262 0.860 27 0.20 0.15 0.10 0.10 5 4 3 370 PSMH Lum. D 5,600 3,300 90 2,561 1,509 0.589 17 0.25 0.20 0.15 0.10 4 3 3 2100 PSMH Lum. D 8,500 4,675 129 3,887 2,138 0.550 17 0.15 0.25 0.15 0.15 2 4 2 2150 PSMH Lum. D 14,000 11,000 190 6,401 5,029 0.786 26 0.10 0.15 0.25 0.20 3 4 7 5175 PSMH Lum. E 12,800 8,300 198 7,624 4,944 0.648 25 0.05 0.05 0.15 0.25 1 1 4 6250 PSMH Lum. E 18,000 11,000 291 10,721 6,552 0.611 23 0.00 0.00 0.05 0.15 0 0 1 3
1.00 1.00 1.00 1.00 23 22 23 23
Area
WattageLamp Type Luminaire
Initial Lamp
Lumens
Maintained Lamp
LumensSystem Watts
Initial Luminaire Lumens
Maintained Luminaire Lumens LLD LPW
LZ1 LZ2 LZ3 LZ4 LZ1 LZ2 LZ3 LZ4
18 CFL Lum. F 1,150 990 20 802 690 0.861 35 0.05 0.05 0.00 0.00 2 2 0 026 CFL Lum. F 1,800 1,548 28 1,193 1,026 0.860 37 0.05 0.05 0.05 0.00 2 2 2 032 CFL Lum. F 2,400 2,064 36 1,674 1,440 0.860 40 0.10 0.10 0.10 0.05 4 4 4 242 CFL Lum. F 3,200 2,752 47 2,232 1,920 0.860 41 0.20 0.15 0.20 0.10 8 6 8 450 MH Lum. G 3,450 1,600 67 2,905 1,347 0.464 20 0.30 0.20 0.20 0.15 6 4 4 370 MH Lum. G 5,600 3,300 92 4,715 2,778 0.589 30 0.20 0.20 0.20 0.25 6 6 6 8100 MH Lum. G 8,500 4,675 129 7,157 3,936 0.550 31 0.05 0.15 0.15 0.25 2 5 5 8150 MH Lum. G 14,000 11,000 190 11,998 9,427 0.786 50 0.05 0.10 0.10 0.20 2 5 5 10
1.00 1.00 1.00 1.00 32 33 34 34
24 25 25 26AVERAGE:
2008 Basis of Design
2008 Basis of Design
2008 Basis of Design
Weighting Weighted LPW
Weighting Weighted LPW
Weighting Weighted LPW
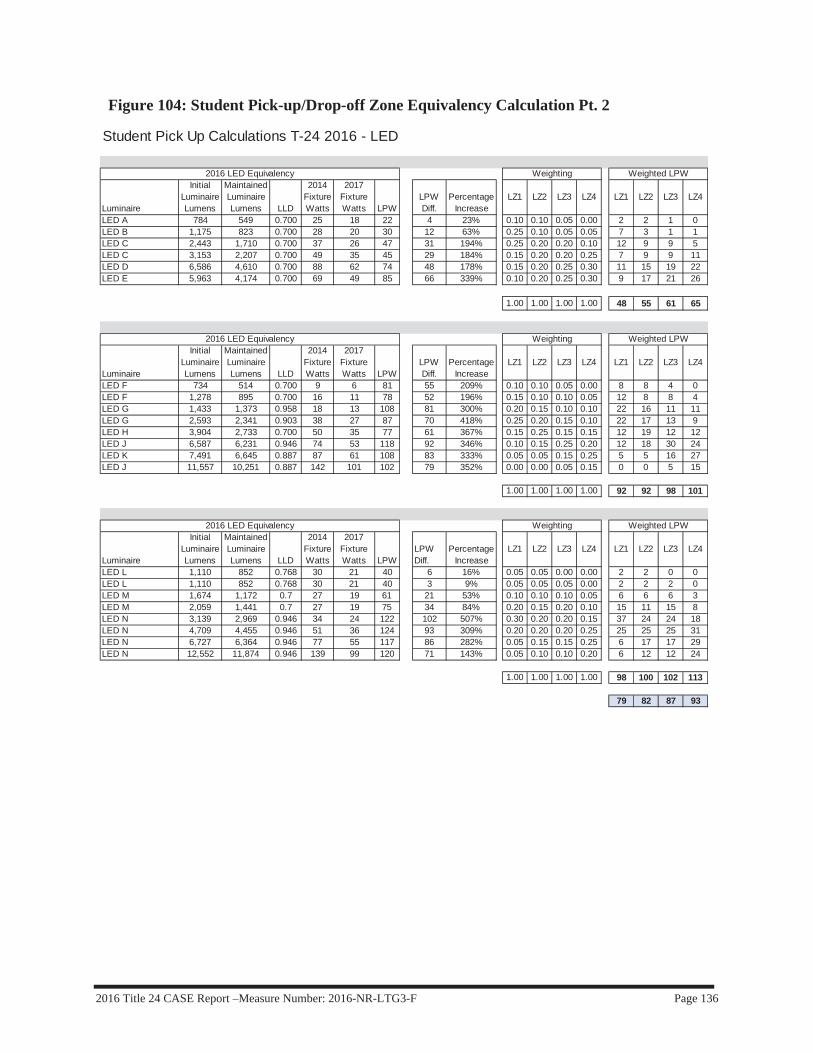
2016 Title 24 CASE Report –Measure Number: 2016-NR-LTG3-F Page 136
Figure 104: Student Pick-up/Drop-off Zone Equivalency Calculation Pt. 2
Student Pick Up Calculations T-24 2016 - LED
Luminaire
Initial Luminaire Lumens
Maintained Luminaire Lumens LLD
2014 Fixture Watts
2017 Fixture Watts LPW
LPW Diff.
Percentage Increase
LZ1 LZ2 LZ3 LZ4 LZ1 LZ2 LZ3 LZ4
LED A 784 549 0.700 25 18 22 4 23% 0.10 0.10 0.05 0.00 2 2 1 0LED B 1,175 823 0.700 28 20 30 12 63% 0.25 0.10 0.05 0.05 7 3 1 1LED C 2,443 1,710 0.700 37 26 47 31 194% 0.25 0.20 0.20 0.10 12 9 9 5LED C 3,153 2,207 0.700 49 35 45 29 184% 0.15 0.20 0.20 0.25 7 9 9 11LED D 6,586 4,610 0.700 88 62 74 48 178% 0.15 0.20 0.25 0.30 11 15 19 22LED E 5,963 4,174 0.700 69 49 85 66 339% 0.10 0.20 0.25 0.30 9 17 21 26
1.00 1.00 1.00 1.00 48 55 61 65
Luminaire
Initial Luminaire Lumens
Maintained Luminaire Lumens LLD
2014 Fixture Watts
2017 Fixture Watts LPW
LPW Diff.
Percentage Increase
LZ1 LZ2 LZ3 LZ4 LZ1 LZ2 LZ3 LZ4
LED F 734 514 0.700 9 6 81 55 209% 0.10 0.10 0.05 0.00 8 8 4 0LED F 1,278 895 0.700 16 11 78 52 196% 0.15 0.10 0.10 0.05 12 8 8 4LED G 1,433 1,373 0.958 18 13 108 81 300% 0.20 0.15 0.10 0.10 22 16 11 11LED G 2,593 2,341 0.903 38 27 87 70 418% 0.25 0.20 0.15 0.10 22 17 13 9LED H 3,904 2,733 0.700 50 35 77 61 367% 0.15 0.25 0.15 0.15 12 19 12 12LED J 6,587 6,231 0.946 74 53 118 92 346% 0.10 0.15 0.25 0.20 12 18 30 24LED K 7,491 6,645 0.887 87 61 108 83 333% 0.05 0.05 0.15 0.25 5 5 16 27LED J 11,557 10,251 0.887 142 101 102 79 352% 0.00 0.00 0.05 0.15 0 0 5 15
1.00 1.00 1.00 1.00 92 92 98 101
Luminaire
Initial Luminaire Lumens
Maintained Luminaire Lumens LLD
2014 Fixture Watts
2017 Fixture Watts LPW
LPW Diff.
Percentage Increase
LZ1 LZ2 LZ3 LZ4 LZ1 LZ2 LZ3 LZ4
LED L 1,110 852 0.768 30 21 40 6 16% 0.05 0.05 0.00 0.00 2 2 0 0LED L 1,110 852 0.768 30 21 40 3 9% 0.05 0.05 0.05 0.00 2 2 2 0LED M 1,674 1,172 0.7 27 19 61 21 53% 0.10 0.10 0.10 0.05 6 6 6 3LED M 2,059 1,441 0.7 27 19 75 34 84% 0.20 0.15 0.20 0.10 15 11 15 8LED N 3,139 2,969 0.946 34 24 122 102 507% 0.30 0.20 0.20 0.15 37 24 24 18LED N 4,709 4,455 0.946 51 36 124 93 309% 0.20 0.20 0.20 0.25 25 25 25 31LED N 6,727 6,364 0.946 77 55 117 86 282% 0.05 0.15 0.15 0.25 6 17 17 29LED N 12,552 11,874 0.946 139 99 120 71 143% 0.05 0.10 0.10 0.20 6 12 12 24
1.00 1.00 1.00 1.00 98 100 102 113
79 82 87 93
Weighting Weighted LPW
Weighting Weighted LPW
Weighting Weighted LPW2016 LED Equivalency
2016 LED Equivalency
2016 LED Equivalency

2016 Title 24 CASE Report –Measure Number: 2016-NR-LTG3-F Page 137
Figure 105: Student Pick-up/Drop-off Zone Cost Calculation Pt. 1
Student Pick Up Calculations T-24 2016 - Incumbent Lamps
Downlight
WattageLamp Type Luminaire
System Watts Cost
Maintained Luminaire Lumens LLD LPW
LZ1 LZ2 LZ3 LZ4 LZ1 LZ2 LZ3 LZ4 LZ1 LZ2 LZ3 LZ4
32 CFL Lum. A 36 334$ 646 0.860 18 0.10 0.10 0.05 0.00 33$ 33$ 17$ -$ 4 4 2 042 CFL Lum. A 47 334$ 861 0.860 18 0.25 0.10 0.05 0.05 83$ 33$ 17$ 17$ 12 5 2 270 PSMH Lum. B 90 300$ 1,433 0.589 16 0.25 0.20 0.20 0.10 75$ 60$ 60$ 30$ 23 18 18 9100 PSMH Lum. B 129 215$ 2,030 0.550 16 0.15 0.20 0.20 0.25 32$ 43$ 43$ 54$ 19 26 26 32150 PSMH Lum. C 190 603$ 5,081 0.786 27 0.15 0.20 0.25 0.30 90$ 121$ 151$ 181$ 29 38 48 57175 PSMH Lum. C 198 489$ 3,834 0.648 19 0.10 0.20 0.25 0.30 49$ 98$ 122$ 147$ 20 40 50 59
1.00 1.00 1.00 1.00 363$ 388$ 409$ 428$ 106 130 145 160
Wall Pack
WattageLamp Type Luminaire
System Watts Cost
Maintained Luminaire Lumens LLD LPW
LZ1 LZ2 LZ3 LZ4 LZ1 LZ2 LZ3 LZ4 LZ1 LZ2 LZ3 LZ4
26 CFL Lum. D 27 365$ 710 0.860 26 0.10 0.10 0.05 0.00 36$ 36$ 18$ -$ 3 3 1 032 CFL Lum. D 36 368$ 947 0.860 26 0.15 0.10 0.10 0.05 55$ 37$ 37$ 18$ 5 4 4 242 CFL Lum. D 47 368$ 1,262 0.860 27 0.20 0.15 0.10 0.10 74$ 55$ 37$ 37$ 9 7 5 570 PSMH Lum. D 90 377$ 1,509 0.589 17 0.25 0.20 0.15 0.10 94$ 75$ 57$ 38$ 23 18 14 9100 PSMH Lum. D 129 382$ 2,138 0.550 17 0.15 0.25 0.15 0.15 57$ 96$ 57$ 57$ 19 32 19 19150 PSMH Lum. D 190 393$ 5,029 0.786 26 0.10 0.15 0.25 0.20 39$ 59$ 98$ 79$ 19 29 48 38175 PSMH Lum. E 198 1,289$ 4,944 0.648 25 0.05 0.05 0.15 0.25 64$ 64$ 193$ 322$ 10 10 30 50250 PSMH Lum. E 291 1,229$ 6,552 0.611 23 0.00 0.00 0.05 0.15 -$ -$ 61$ 184$ 0 0 15 44
0.75 0.80 0.85 0.95 421$ 423$ 559$ 735$ 88 102 134 166
Area
WattageLamp Type Luminaire
System Watts Cost
Maintained Luminaire Lumens LLD LPW
LZ1 LZ2 LZ3 LZ4 LZ1 LZ2 LZ3 LZ4 LZ1 LZ2 LZ3 LZ4
18 CFL Lum. F 20 600$ 690 0.861 35 0.05 0.05 0.00 0.00 30$ 30$ -$ -$ 1 1 0 026 CFL Lum. F 28 600$ 1,026 0.860 37 0.05 0.05 0.05 0.00 30$ 30$ 30$ -$ 1 1 1 032 CFL Lum. F 36 600$ 1,440 0.860 40 0.10 0.10 0.10 0.05 60$ 60$ 60$ 30$ 4 4 4 242 CFL Lum. F 47 600$ 1,920 0.860 41 0.20 0.15 0.20 0.10 120$ 90$ 120$ 60$ 9 7 9 550 MH Lum. G 67 767$ 1,347 0.464 20 0.30 0.20 0.20 0.15 230$ 153$ 153$ 115$ 20 13 13 1070 MH Lum. G 92 767$ 2,778 0.589 30 0.20 0.20 0.20 0.25 153$ 153$ 153$ 192$ 18 18 18 23100 MH Lum. G 129 778$ 3,936 0.550 31 0.05 0.15 0.15 0.25 39$ 117$ 117$ 195$ 6 19 19 32150 MH Lum. G 190 793$ 9,427 0.786 50 0.05 0.10 0.10 0.20 40$ 79$ 79$ 159$ 10 19 19 38
1.00 1.00 1.00 1.00 702$ 713$ 713$ 750$ 70 83 85 110
414$ 431$ 485$ 552$ 97$ 117$ 136$ 157$
4.28$ 3.69$ 3.57$ 3.52$
2008 Basis of Design Weighting Weighted W
2008 Basis of Design Weighting Weighted W
2008 Basis of Design Weighting Weighted W
AVERAGE:
Weighted Cost
Weighted Cost
Weighted Cost
$/W

2016 Title 24 CASE Report –Measure Number: 2016-NR-LTG3-F Page 138
Figure 106: Student Pick-up/Drop-off Zone Cost Calculation Pt. 2
Student Pick Up Calculations T-24 2016 - LED
Luminaire
Maintained Luminaire Lumens 2017 Cost
2017 Fixture Watts LPW
LZ1 LZ2 LZ3 LZ4 LZ1 LZ2 LZ3 LZ4 LZ1 LZ2 LZ3 LZ4
LED A 549 220$ 18 22 0.10 0.10 0.05 0.00 22$ 22$ 11$ -$ 2 2 1 0LED B 823 227$ 20 30 0.25 0.10 0.05 0.05 57$ 23$ 11$ 11$ 5 2 1 1LED C 1,710 314$ 26 47 0.25 0.20 0.20 0.10 78$ 63$ 63$ 31$ 6 5 5 3LED C 2,207 229$ 35 45 0.15 0.20 0.20 0.25 34$ 46$ 46$ 57$ 5 7 7 9LED D 4,610 625$ 62 74 0.15 0.20 0.25 0.30 94$ 125$ 156$ 187$ 9 12 16 19LED E 4,174 445$ 49 85 0.10 0.20 0.25 0.30 45$ 89$ 111$ 134$ 5 10 12 15
1.00 1.00 1.00 1.00 330$ 367$ 398$ 421$ 33 38 42 46
Luminaire
Maintained Luminaire Lumens 2017 Cost
2017 Fixture Watts LPW
LZ1 LZ2 LZ3 LZ4 LZ1 LZ2 LZ3 LZ4 LZ1 LZ2 LZ3 LZ4
LED F 514 186$ 6 81 0.10 0.10 0.05 0.00 19$ 19$ 9$ -$ 1 1 0 0LED F 895 213$ 11 78 0.15 0.10 0.10 0.05 32$ 21$ 21$ 11$ 2 1 1 1LED G 1,373 386$ 13 108 0.20 0.15 0.10 0.10 77$ 58$ 39$ 39$ 3 2 1 1LED G 2,341 386$ 27 87 0.25 0.20 0.15 0.10 96$ 77$ 58$ 39$ 7 5 4 3LED H 2,733 339$ 35 77 0.15 0.25 0.15 0.15 51$ 85$ 51$ 51$ 5 9 5 5LED J 6,231 1,360$ 53 118 0.10 0.15 0.25 0.20 136$ 204$ 340$ 272$ 5 8 13 11LED K 6,645 1,424$ 61 108 0.05 0.05 0.15 0.25 71$ 71$ 214$ 356$ 3 3 9 15LED J 10,251 1,367$ 101 102 0.00 0.00 0.05 0.15 -$ -$ 68$ 205$ 0 0 5 15
1.00 1.00 1.00 1.00 482$ 535$ 800$ 972$ 25 29 40 51
Luminaire
Maintained Luminaire Lumens 2017 Cost
2017 Fixture Watts LPW
LZ1 LZ2 LZ3 LZ4 LZ1 LZ2 LZ3 LZ4 LZ1 LZ2 LZ3 LZ4
LED L 852 881$ 21 40 0.05 0.05 0.00 0.00 44$ 44$ -$ -$ 1 1 0 0LED L 852 881$ 21 40 0.05 0.05 0.05 0.00 44$ 44$ 44$ -$ 1 1 1 0LED M 1,172 603$ 19 61 0.10 0.10 0.10 0.05 60$ 60$ 60$ 30$ 2 2 2 1LED M 1,441 603$ 19 75 0.20 0.15 0.20 0.10 121$ 90$ 121$ 60$ 4 3 4 2LED N 2,969 1,286$ 24 122 0.30 0.20 0.20 0.15 386$ 257$ 257$ 193$ 7 5 5 4LED N 4,455 1,286$ 36 124 0.20 0.20 0.20 0.25 257$ 257$ 257$ 321$ 7 7 7 9LED N 6,364 1,286$ 55 117 0.05 0.15 0.15 0.25 64$ 193$ 193$ 321$ 3 8 8 14LED N 11,874 1,384$ 99 120 0.05 0.10 0.10 0.20 69$ 138$ 138$ 277$ 5 10 10 20
1.00 1.00 1.00 1.00 1,045$ 1,084$ 1,070$ 1,203$ 30 37 37 49
447$ 489$ 586$ 664$ 30$ 35$ 41$ 48$
14.84$ 13.88$ 14.42$ 13.98$
Weighted W
Weighted W
2016 LED Equivalency Weighting Weighted W
Weighted Cost
Weighted Cost
Weighted Cost2016 LED Equivalency Weighting
2016 LED Equivalency Weighting

2016 Title 24 CASE Report –Measure Number: 2016-NR-LTG3-F Page 139
Figure 107: Outdoor Dining Calculation Results and Recommendations
Figure 108: Outdoor Dining Lumen Equivalency Calculation Pt. 1
Figure 109: Outdoor Dining Equivalency Calculation Pt. 2
Outdoor Dining RecommendationsLZ1 LZ2 LZ3 LZ4
Allowance 0.014 0.135 0.240 0.400 W/sfLPW 7 7 8 8 lm/WLPW 74 80 84 88 lm/W
Change 0.001 0.012 0.022 0.037 Limit of ReductionProposed 0.010 0.100 0.150 0.200 W/sf
2013
2016
Outdoor Dining Calculations T-24 2016 - Incumbent Lamps
String Light
Lamp Type Lamp ManufacturerSystem Watts
Maintained Lumens LLD LPW
LZ1 LZ2 LZ3 LZ4 LZ1 LZ2 LZ3 LZ4
Incandescent G16.5 Lum. A 15 81 0.9 5 0.25 0.15 0.10 0.05 1 1 1 0Incandescent G16.5 Lum. A 25 153 0.9 6 0.15 0.20 0.15 0.10 1 1 1 1Incandescent G16.5 Lum. A 40 297 0.9 7 0.10 0.15 0.25 0.35 1 1 2 3Incandescent B10 Lum. A 15 105 0.9 7 0.25 0.15 0.10 0.05 2 1 1 0Incandescent B10 Lum. A 25 189 0.9 8 0.15 0.20 0.15 0.10 1 2 1 1Incandescent B10 Lum. A 40 414 0.9 10 0.10 0.15 0.25 0.35 1 2 3 4
1.00 1.00 1.00 1.00 7 7 8 8
7 7 8 8
2008 Basis of Design Weighting Weighted LPW
AVERAGE:
Outdoor Dining Calculations T-24 2016 - LED
Lamp Type Lamp
2017 Fixture Watts
Maitained Lumens LPW
LZ1 LZ2 LZ3 LZ4 LZ1 LZ2 LZ3 LZ4
LED LED A 1.3 53 59 0.25 0.15 0.10 0.05 15 9 6 3LED LED B 2.1 126 85 0.15 0.20 0.15 0.10 13 17 13 8LED LED C 3.2 189 85 0.10 0.15 0.25 0.35 8 13 21 30LED LED D 1.7 70 59 0.25 0.15 0.10 0.05 15 9 6 3LED LED E 2.1 129 86 0.15 0.20 0.15 0.10 13 17 13 9LED LED F 5.0 350 101 0.10 0.15 0.25 0.35 10 15 25 35
1.00 1.00 1.00 1.00 74 80 84 88
74 80 84 88
Weighted LPW
AVERAGE:
2016 LED Equivalency Weighting

2016 Title 24 CASE Report –Measure Number: 2016-NR-LTG3-F Page 140
Figure 110: Outdoor Dining Cost Calculation Pt. 1
Figure 111: Outdoor Dining Cost Calculation Pt. 2
Outdoor Dining Calculations T-24 2016 - Incumbent Lamps
String Light
Lamp Type Lamp ManufacturerSystem Watts
Maintained Lumens Cost LLD LPW
LZ1 LZ2 LZ3 LZ4 LZ1 LZ2 LZ3 LZ4 LZ1 LZ2 LZ3 LZ4
Incandescent G16.5 Lum. A 15 81 $ 2 0.9 5 0.25 0.15 0.10 0.05 0$ 0$ 0$ 0$ 4 2 2 1Incandescent G16.5 Lum. A 25 153 $ 2 0.9 6 0.15 0.20 0.15 0.10 0$ 0$ 0$ 0$ 4 5 4 3Incandescent G16.5 Lum. A 40 297 $ 2 0.9 7 0.10 0.15 0.25 0.35 0$ 0$ 0$ 1$ 4 6 10 14Incandescent B10 Lum. A 15 105 $ 1 0.9 7 0.25 0.15 0.10 0.05 0$ 0$ 0$ 0$ 4 2 2 1Incandescent B10 Lum. A 25 189 $ 1 0.9 8 0.15 0.20 0.15 0.10 0$ 0$ 0$ 0$ 4 5 4 3Incandescent B10 Lum. A 40 414 $ 1 0.9 10 0.10 0.15 0.25 0.35 0$ 0$ 0$ 0$ 4 6 10 14
1.00 1.00 1.00 1.00 1$ 1$ 1$ 1$ 23 27 31 35
1$ 1$ 1$ 1$ 23 27 31 35
0.06$ 0.05$ 0.05$ 0.04$
AVERAGE:
Weighted Cost
$/W
2008Basis of Design Weighting Weighted W
Outdoor Dining Calculations T-24 2016 - LED
Lamp Type Lamp
2017 Fixture Watts
Maitained Lumens Cost LPW
LZ1 LZ2 LZ3 LZ4 LZ1 LZ2 LZ3 LZ4 LZ1 LZ2 LZ3 LZ4
LED LED A 1.3 53 $ 12 59 0.25 0.15 0.10 0.05 3$ 2$ 1$ 1$ 0 0 0 0LED LED B 2.1 126 $ 10 85 0.15 0.20 0.15 0.10 2$ 2$ 2$ 1$ 0 0 0 0LED LED C 3.2 189 $ 18 85 0.10 0.15 0.25 0.35 2$ 3$ 4$ 6$ 0 0 1 1LED LED D 1.7 70 $ 12 59 0.25 0.15 0.10 0.05 3$ 2$ 1$ 1$ 0 0 0 0LED LED E 2.1 129 $ 10 86 0.15 0.20 0.15 0.10 2$ 2$ 2$ 1$ 0 0 0 0LED LED F 5.0 350 $ 32 101 0.10 0.15 0.25 0.35 3$ 5$ 8$ 11$ 0 1 1 2
1.00 1.00 1.00 1.00 14$ 15$ 18$ 21$ 2 3 3 3
14$ 15$ 18$ 21$ 2 3 3 3
6$ 6$ 6$ 6$
AVERAGE:
Weighted Cost WeightedW2016 LED Equivalency Weighting

2016 Title 24 CASE Report –Measure Number: 2016-NR-LTG3-F Page 141
Figure 112: Special Security Lighting for Retail Calculation Results and Recommendations
Figure 113: Special Security Lighting for Retail Lumen Equivalency Calculation Pt. 1
Special Security Lighting for Retail RecommendationsLZ1 LZ2 LZ3 LZ4
Allowance 0.007 0.009 0.019 W/sfLPW 30 29 27 28 lm/WLPW 75 77 81 84 lm/W
Change 0.003 0.003 0.006 Limit of ReductionProposed 0.005 0.007 0.012 W
2013
2016
Special Security Calculations T-24 2016 - Incumbent Lamps
Wall Pack
WattageLamp Type Luminaire
System Watts
Maintained Luminaire Lumens LLD LPW
LZ1 LZ2 LZ3 LZ4 LZ1 LZ2 LZ3 LZ4
26 CFL Lum. A 27 710 0.860 26 0.25 0.15 0.10 0.10 7 4 3 332 CFL Lum. A 36 947 0.860 26 0.25 0.25 0.15 0.15 7 7 4 442 CFL Lum. A 47 1,262 0.860 27 0.25 0.25 0.20 0.15 7 7 5 470 PSMH Lum. A 90 1,509 0.589 17 0.10 0.15 0.15 0.10 2 3 3 2100 PSMH Lum. A 129 2,138 0.550 17 0.10 0.10 0.20 0.15 2 2 3 2150 PSMH Lum. A 190 5,029 0.786 26 0.05 0.10 0.15 0.20 1 3 4 5175 PSMH Lum. B 198 4,944 0.648 25 0.00 0.00 0.05 0.10 0 0 1 2250 PSMH Lum. B 291 6,552 0.611 23 0.00 0.00 0.00 0.05 0 0 0 1
1.00 1.00 1.00 1.00 25 24 23 24
Area
WattageLamp Type Luminaire
System Watts
Maintained Luminaire Lumens LLD LPW
LZ1 LZ2 LZ3 LZ4 LZ1 LZ2 LZ3 LZ4
18 CFL Lum. C 19 690 0.861 36 0.10 0.10 0.05 0.00 4 4 2 026 CFL Lum. C 27 1,026 0.860 38 0.25 0.15 0.10 0.10 9 6 4 432 CFL Lum. C 36 1,440 0.860 40 0.20 0.20 0.15 0.15 8 8 6 642 CFL Lum. C 47 1,920 0.860 41 0.20 0.25 0.15 0.15 8 10 6 670 PSMH Lum. D 90 1,984 0.589 22 0.10 0.15 0.15 0.10 2 3 3 2100 PSMH Lum. D 129 2,809 0.550 22 0.10 0.10 0.20 0.15 2 2 4 3150 PSMH Lum. D 190 6,558 0.786 35 0.05 0.05 0.15 0.20 2 2 5 7175 PSMH Lum. D 198 5,053 0.648 26 0.00 0.00 0.05 0.10 0 0 1 3250 PSMH Lum. D 291 6,697 0.611 23 0.00 0.00 0.00 0.05 0 0 0 1
1.00 1.00 1.00 1.00 35 35 32 32
30 29 27 28AVERAGE:
Weighting Weighted LPW
Weighting Weighted LPW
2008 Basis of Design
2008 Basis of Design

2016 Title 24 CASE Report –Measure Number: 2016-NR-LTG3-F Page 142
Figure 114: Special Security Lighting for Retail Equivalency Calculation Pt. 2
Special Security Calculations T-24 2016 - LED
Luminaire
Maintained Luminaire Lumens
2017 Fixture Watts LPW
LZ1 LZ2 LZ3 LZ4 LZ1 LZ2 LZ3 LZ4
LED A 514 6 81 0.25 0.15 0.10 0.10 20 12 8 8LED A 895 11 78 0.25 0.25 0.15 0.15 19 19 12 12LED B 1,373 13 108 0.25 0.25 0.20 0.15 27 27 22 16LED B 2,341 27 87 0.10 0.15 0.15 0.10 9 13 13 9LED C 2,733 35 77 0.10 0.10 0.20 0.15 8 8 15 12LED D 6,231 53 118 0.05 0.10 0.15 0.20 6 12 18 24LED E 6,645 61 108 0.00 0.00 0.05 0.10 0 0 5 11LED D 10,251 101 102 0.00 0.00 0.00 0.05 0 0 0 5
1.00 1.00 1.00 1.00 89 91 93 96
Luminaire
Maintained Luminaire Lumens
2017 Fixture Watts LPW
LZ1 LZ2 LZ3 LZ4 LZ1 LZ2 LZ3 LZ4
LED F 852 21 40 0.10 0.10 0.05 0.00 4 4 2 0LED F 852 21 40 0.25 0.15 0.10 0.10 10 6 4 4LED G 1,172 19 61 0.20 0.20 0.15 0.15 12 12 9 9LED G 1,441 19 75 0.20 0.25 0.15 0.15 15 19 11 11LED G 2,261 38 59 0.10 0.15 0.15 0.10 6 9 9 6LED H 3,331 37 89 0.10 0.10 0.20 0.15 9 9 18 13LED H 5,965 76 79 0.05 0.05 0.15 0.20 4 4 12 16LED H 5,391 60 90 0.00 0.00 0.05 0.10 0 0 5 9LED H 7,662 90 85 0.00 0.00 0.00 0.05 0 0 0 4
1.00 1.00 1.00 1.00 60 63 69 73
75 77 81 84AVERAGE:
Weighting Weighted LPW
Weighting Weighted LPW
2016 LED Equivalency
2016 LED Equivalency
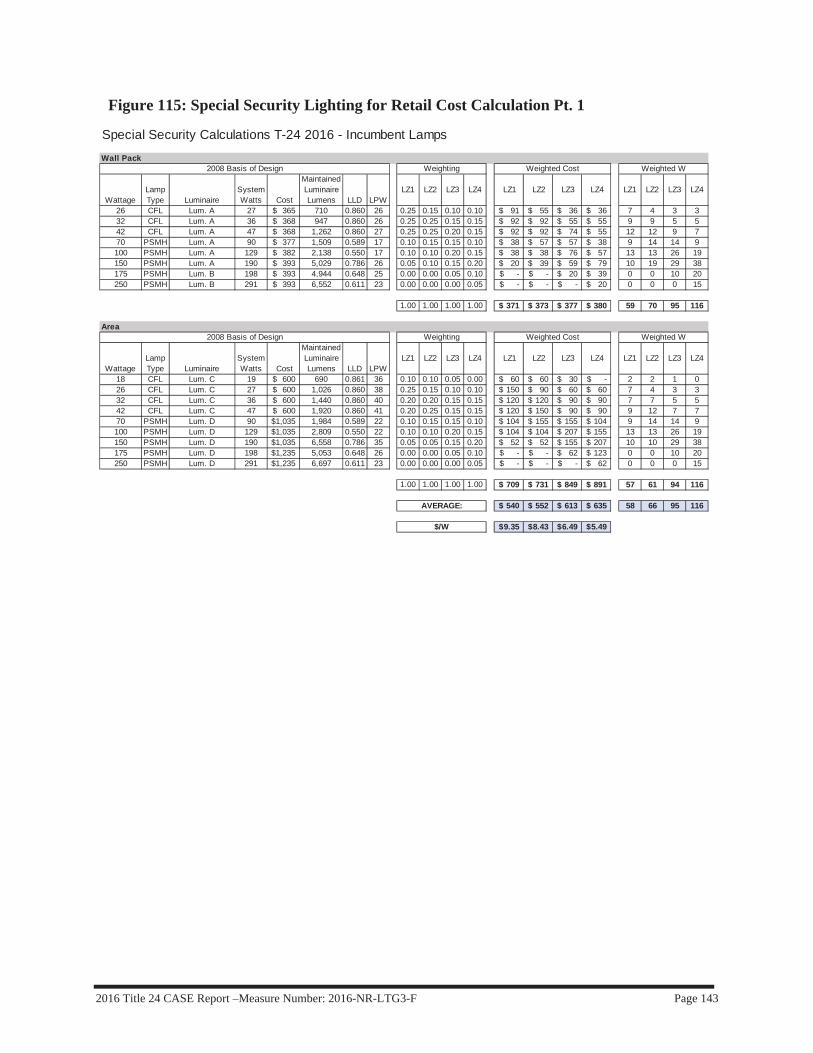
2016 Title 24 CASE Report –Measure Number: 2016-NR-LTG3-F Page 143
Figure 115: Special Security Lighting for Retail Cost Calculation Pt. 1
Special Security Calculations T-24 2016 - Incumbent Lamps
Wall Pack
WattageLamp Type Luminaire
System Watts Cost
Maintained Luminaire Lumens LLD LPW
LZ1 LZ2 LZ3 LZ4 LZ1 LZ2 LZ3 LZ4 LZ1 LZ2 LZ3 LZ4
26 CFL Lum. A 27 365$ 710 0.860 26 0.25 0.15 0.10 0.10 91$ 55$ 36$ 36$ 7 4 3 332 CFL Lum. A 36 368$ 947 0.860 26 0.25 0.25 0.15 0.15 92$ 92$ 55$ 55$ 9 9 5 542 CFL Lum. A 47 368$ 1,262 0.860 27 0.25 0.25 0.20 0.15 92$ 92$ 74$ 55$ 12 12 9 770 PSMH Lum. A 90 377$ 1,509 0.589 17 0.10 0.15 0.15 0.10 38$ 57$ 57$ 38$ 9 14 14 9100 PSMH Lum. A 129 382$ 2,138 0.550 17 0.10 0.10 0.20 0.15 38$ 38$ 76$ 57$ 13 13 26 19150 PSMH Lum. A 190 393$ 5,029 0.786 26 0.05 0.10 0.15 0.20 20$ 39$ 59$ 79$ 10 19 29 38175 PSMH Lum. B 198 393$ 4,944 0.648 25 0.00 0.00 0.05 0.10 -$ -$ 20$ 39$ 0 0 10 20250 PSMH Lum. B 291 393$ 6,552 0.611 23 0.00 0.00 0.00 0.05 -$ -$ -$ 20$ 0 0 0 15
1.00 1.00 1.00 1.00 371$ 373$ 377$ 380$ 59 70 95 116
Area
WattageLamp Type Luminaire
System Watts Cost
Maintained Luminaire Lumens LLD LPW
LZ1 LZ2 LZ3 LZ4 LZ1 LZ2 LZ3 LZ4 LZ1 LZ2 LZ3 LZ4
18 CFL Lum. C 19 600$ 690 0.861 36 0.10 0.10 0.05 0.00 60$ 60$ 30$ -$ 2 2 1 026 CFL Lum. C 27 600$ 1,026 0.860 38 0.25 0.15 0.10 0.10 150$ 90$ 60$ 60$ 7 4 3 332 CFL Lum. C 36 600$ 1,440 0.860 40 0.20 0.20 0.15 0.15 120$ 120$ 90$ 90$ 7 7 5 542 CFL Lum. C 47 600$ 1,920 0.860 41 0.20 0.25 0.15 0.15 120$ 150$ 90$ 90$ 9 12 7 770 PSMH Lum. D 90 1,035$ 1,984 0.589 22 0.10 0.15 0.15 0.10 104$ 155$ 155$ 104$ 9 14 14 9100 PSMH Lum. D 129 1,035$ 2,809 0.550 22 0.10 0.10 0.20 0.15 104$ 104$ 207$ 155$ 13 13 26 19150 PSMH Lum. D 190 1,035$ 6,558 0.786 35 0.05 0.05 0.15 0.20 52$ 52$ 155$ 207$ 10 10 29 38175 PSMH Lum. D 198 1,235$ 5,053 0.648 26 0.00 0.00 0.05 0.10 -$ -$ 62$ 123$ 0 0 10 20250 PSMH Lum. D 291 1,235$ 6,697 0.611 23 0.00 0.00 0.00 0.05 -$ -$ -$ 62$ 0 0 0 15
1.00 1.00 1.00 1.00 709$ 731$ 849$ 891$ 57 61 94 116
540$ 552$ 613$ 635$ 58 66 95 116
9.35$ 8.43$ 6.49$ 5.49$
AVERAGE:
Weighted Cost
Weighted Cost
$/W
2008 Basis of Design Weighting Weighted W
2008 Basis of Design Weighting Weighted W

2016 Title 24 CASE Report –Measure Number: 2016-NR-LTG3-F Page 144
Figure 116: Special Security Lighting for Retail Cost Calculation Pt. 2
Special Security Calculations T-24 2016 - LED
Luminaire
Maintained Luminaire Lumens Cost
2017 Fixture Watts LPW
LZ1 LZ2 LZ3 LZ4 LZ1 LZ2 LZ3 LZ4 LZ1 LZ2 LZ3 LZ4
LED A 514 207$ 6 81 0.25 0.15 0.10 0.10 52$ 31$ 21$ 21$ 2 1 1 1LED A 895 237$ 11 78 0.25 0.25 0.15 0.15 59$ 59$ 36$ 36$ 3 3 2 2LED B 1,373 428$ 13 108 0.25 0.25 0.20 0.15 107$ 107$ 86$ 64$ 3 3 3 2LED B 2,341 428$ 27 87 0.10 0.15 0.15 0.10 43$ 64$ 64$ 43$ 3 4 4 3LED C 2,733 996$ 35 77 0.10 0.10 0.20 0.15 100$ 100$ 199$ 149$ 4 4 7 5LED D 6,231 1,583$ 53 118 0.05 0.10 0.15 0.20 79$ 158$ 237$ 317$ 3 5 8 11LED E 6,645 1,583$ 61 108 0.00 0.00 0.05 0.10 -$ -$ 79$ 158$ 0 0 3 6LED D 10,251 1,583$ 101 102 0.00 0.00 0.00 0.05 -$ -$ -$ 79$ 0 0 0 5
1.00 1.00 1.00 1.00 440$ 520$ 722$ 867$ 17 20 27 34
Luminaire
Maintained Luminaire Lumens
2017 Fixture Watts LPW
LZ1 LZ2 LZ3 LZ4 LZ1 LZ2 LZ3 LZ4 LZ1 LZ2 LZ3 LZ4
LED F 852 979$ 21 40 0.10 0.10 0.05 0.00 98$ 98$ 49$ -$ 2 2 1 0LED F 852 979$ 21 40 0.25 0.15 0.10 0.10 245$ 147$ 98$ 98$ 5 3 2 2LED G 1,172 670$ 19 61 0.20 0.20 0.15 0.15 134$ 134$ 101$ 101$ 4 4 3 3LED G 1,441 670$ 19 75 0.20 0.25 0.15 0.15 134$ 168$ 101$ 101$ 4 5 3 3LED G 2,261 508$ 38 59 0.10 0.15 0.15 0.10 51$ 76$ 76$ 51$ 4 6 6 4LED H 3,331 1,204$ 37 89 0.10 0.10 0.20 0.15 120$ 120$ 241$ 181$ 4 4 7 6LED H 5,965 1,720$ 76 79 0.05 0.05 0.15 0.20 86$ 86$ 258$ 344$ 4 4 11 15LED H 5,391 1,810$ 60 90 0.00 0.00 0.05 0.10 -$ -$ 91$ 181$ 0 0 3 6LED H 7,662 1,810$ 90 85 0.00 0.00 0.00 0.05 -$ -$ -$ 91$ 0 0 0 5
1.00 1.00 1.00 1.00 868$ 829$ 1,013$ 1,146$ 26 27 37 43
654$ 674$ 868$ 1,006$ 21 24 32 38
30.43$ 28.65$ 27.32$ 26.14$
AVERAGE:
Weighted W
2016 LED Equivalency Weighting Weighted WWeighted Cost
Weighted Cost2016 LED Equivalency Weighting
2016 Title 24 CASE Report –Measure Number: 2016-NR-LTG3-F Page 145
APPENDIX I: STATEWIDE COST EFFECTIVENESSCALCULATION RESULTS
Since the outdoor hardscape is not estimated as part of the construction forecasts, statewide estimates for this measure are more difficult to establish. As stated in the main body of the report, the Statewide CASE Team made construction percentage estimates based on economic activity to predict the LZ percentages of the total construction activity per building type.
Note that the cost effectiveness values are based on calculating the reduction in wattage from the previous allowance to the proposed allowance, and are not based on the technical feasibility of the swap from an incumbent light source technology to LED, which results in a lumen-for-lumen equivalent comparison.
The allowances do not reduce fully to the lumen equivalent values as projected by the Statewide CASE Team research as an accommodation for both the uncertainty of forward efficacy projections and LED price reductions, the specific LPA values proposed are not as aggressive as they may have been. This approach was taken as a prudent level of conservatism for the changes as an acknowledgement that the changes are substantial and will create an impact in the lighting design industry in California.
This proposal for the change from incumbent light source technologies to LED is intended to provide a measure of improvement in energy use in the state without the change being too disruptive or difficult to accommodate. If this were a change in the LPA values based on advancement of the technology of the light sources (for example, when the industry went from T12 lamps to T8 lamps), the values in the LPA table would be much more aggressively set than this CASE recommends.
With the exception of the general hardscape allowance, the calculations for cost effectiveness provide a comparison of a single luminaire-for-luminaire exchange with no additional savings associated with reduced load on the electrical system (reduced wire size of fewer circuits) or better lumen distribution associated with a product. This likely overstates the added cost for the LED technology, and does not include any benefits from enhanced controls approaches that are enabled when using the LED technology.
These two factors contribute to overstate incremental costs and understate energy savings in a lumen-comparable lighting system.

2016 Title 24 CASE Report –Measure Number: 2016-NR-LTG3-F Page 146
Table 37: Cost-effectiveness Summary1 – Weighted Average Across Lighting Zones
Climate Zone Units
Benefit: TDV Energy Cost
Savings2
(2017 PV$)
Cost: Total Incremental
Cost3
(2017 PV$)
Change in Lifecycle Cost4
(2017 PV$)
Benefit to Cost Ratio5
General Hardscape Per Square Foot 0.44 Lower -0.44 Infinite
Building Entrances Each 372.54 Lower -372.54 Infinite
Primary Entrances Each 407.74 665.23 -407.74 0.61
Drive Up Windows Each 380.43 392.00 -380.43 0.97
Vehicle Service Uncovered Fuel
Dispenser
Each Pump Face 337.29 1,719.88 -337.29 0.20
ATM Machine Each 1,244.42 288.00 -1,244.42 4.3
Outdoor Sales Frontage Per linear foot 32.70 69.09 -32.70 0.47
Hardscape Ornamental Lighting
Per Square Foot N/A N/A N/A N/A
Building Facades Per Square Foot 0.57 2.18 -0.57 0.26
Outdoor Sales Lots Per Square Foot 1.61 2.08 -1.61 0.77
Vehicle Service Station Hardscape
Per Square Foot 1.06 1.86 -1.06 0.57
Vehicle Service Station Canopies
Per Square Foot 2.46 9.10 -2.46 0.27
Sales Canopies Per Square Foot 0.69 7.44 -0.69 0.09
Non-sales Canopies Per Square Foot 0.71 1.60 -0.71 0.45
Guard Stations Per Square Foot 1.36 5.24 -1.36 0.26
Student Pick-up/Drop-off Zone
Per Square Foot 0.47 1.88 -.47 0.25
Outdoor Dining Per Square Foot 0.21 0.93 -0.21 0.23
Special Security Lighting for Retail
Per Square Foot 0.05 0.20 -0.05 0.23
1. Relative to existing conditions. All cost values presented in 2017 dollars. 2. Present value of TDV cost savings equals TDV electricity savings plus TDV natural gas savings; TDV$ =
TDV$E + TDV$G. 3. Total incremental cost equals incremental construction cost (post adoption) plus present value of incremental
maintenance cost; C = CIPA + CM. 4. Negative values indicate the measure is cost-effective. Change in lifecycle cost equals cost premium minus TDV
energy cost savings; LCC = C – TDV$ 5. The benefit to cost ratio is the TDV energy costs savings divided by the total incremental costs; B/C = TDV$ ÷
C. The measure is cost effective if the B/C ratio is greater than 1.0.