residential market update cologne 2 half of 2013€¦ · location project name number of housing...
TRANSCRIPT
Residential City Profile
New arrivals prefer the Cathedral City’s central locations
Increase in new-build completions
New-build completions well below demand level
Big rental price increase in Chorweiler
Slightly subdued upward trend in rental prices
Strong price dynamic in sought-after locations
Price rise of one third for condominiums since 2009
Surprising level of transaction volume
Residential Market Update Cologne 2nd half of 2013

On Point • Residential City Profile Cologne • Update 2nd half of 2013 2
Socio-economic trends in the second half of 2013
Economy and demographics by comparison
Sources: destatis, municipal statistics offices, GfK GeoMarketing GmbH,Federal Employent Agency, Oxford Economics
German economy
According to preliminary estimates by the Federal Statistics Office, the Gross Domestic Product (GDP) increased by 0.5% (price, sea-sonally and calendar adjusted) over the year 2013. Despite an eco-nomically weak period at the start of 2013, the economy revived over the course of the year, and was significantly boosted by both private and government spending, whilst investment and foreign trade served to slow down economic growth.The labour market was also affected by this weaker economic devel-opment: despite record high employment figures averaging 41.8 mil-lion (+0.6% compared to the previous year), the employment rate rose by only half the level of the previous two years. The unemploy-ment rate stagnated at 6.7% in December 2013 compared to De-cember 2012. At the same time, the downwards trend in gross sala-ries of employees in the third quarter of 2013 continued, with a fall of 0.3% registered since the same period in 2012.Over the course of 2013, the ifo Business Climate Index recovered noticeably, reaching an index rate of 109.5 points in December 2013. The assessment of future business development in particular improved significantly over the year, reflecting the increased opti-mism of companies. Leading economic institutes expect further re-
covery in the economy in 2014; most of which will be supported by domestic demand. Their forecasts indicate growth in GDP of 1.6% over the full year.
Cologne economy
According to a survey by the Cologne Chamber of Commerce in Au-tumn 2013, the upswing continued in the cathedral city. Companies surveyed assessed their business conditions as significantly impro-ved compared to the first half of the year. The year-long upward trend in business expectations continued, due in particular to greater optimism relating to growth in exports. The construction industry is in good shape, as are the transport sector, service, wholesale and re-tail sectors and a number of manufacturing industries. Manpower and investment plans in Cologne’s economy remained subdued in the second half of the year. The unemployment rate in Cologne rose in December 2013 to 9.5%, which equates to a rise of 0.5% points year-on-year.
Division of Cologne districts and areas
District Area
Innenstadt (city centre)
Altstadt-Süd, Altstadt-Nord, Neustadt-Süd, Neustadt-Nord, Deutz
Rodenkirchen Bayenthal, Godorf, Hahnwald, Immendorf, Marienburg, Meschenich, Raderberg, Raderthal, Rodenkirchen, Sürth, Rondorf, Weiß, Zollstock
Lindenthal Braunsfeld, Junkersdorf, Klettenberg, Lindenthal, Lövenich, Müngersdorf, Sülz, Weiden, Widdersdorf
Ehrenfeld Bickendorf, Bocklemünd/Mengenich, Ehrenfeld, Neuehrenfeld, Ossendorf, Vogelsang
Nippes Bilderstöckchen, Longerich, Mauenheim, Niehl, Nippes, Riehl, Weidenpesch
Chorweiler Blumenberg, Chorweiler, Esch/Auweiler, Fühlingen, Heimersdorf, Lindweiler, Merkenich, Pesch, Roggendorf/Thenhoven, Seeberg, Volkhoven/Weiler, Worringen
Porz Eil, Elsdorf, Ensen, Finkenberg, Gremberghoven, Grengel, Langel, Libur, Lind, Poll, Porz, Urbach, Wahn, Wahnheide, Westhoven, Zündorf
Kalk Brück, Höhenberg, Humboldt/Gremberg, Kalk, Merheim, Neubrück, Ostheim, Rath/Heumar, Vingst
Mülheim Buchforst, Buchheim, Dellbrück, Dünnwald, Flittard, Höhenhaus, Holweide, Mülheim, Stammheim

On Point • Residential City Profile Cologne • Update 2nd half of 2013 3
New arrivals prefer the Cathedral City’s central locations
The high level of inward migration into the Cathedral City continued unabated in 2012, and has even become a little stronger compared to the previous year. The overall trend for population growth in Co-logne is continuing. The city centre is benefiting in particular from im-migration, but the districts close to the city centre such as Lindenthal and Ehrenfeld continue to be popular with new arrivals. Within the city centre, migratory movements are slightly differentiated. Nippes and Kalk are still reasonably priced and are benefiting from the growth in population compared to the city as a whole. Due to their peripheral locations, the districts of Chorweiler in the north and Porz in the south, and also parts of Rodenkirchen, have not been able to profit as greatly from the inward migration into Cologne. In these dis-tricts, the population is decreasing, due in part to ageing. In contrast, in the districts of Lindenthal and Ehrenfeld, where many young fami-lies live and take advantage of the urban lifestyle, the birth rate is correspondingly high. The growth in household numbers in Cologne is significantly higher than the growth in population because of the further reduction in household size, reflecting the renewed growth in the proportion of single-person households. Only in Lindenthal, which is home to many families, is the population increasing faster than the number of households, but even here the most important demand group in the housing market comprises single-person households. The falling population and household numbers in the city centre have been caused by the combination of apartments with-in buildings, a decreasing proportion of flat-sharing communities and, at the same time, a low level of construction activity.
Development of inhabitants and households between 2007 and 2012 (%)
Population and households 2012
Population Households
District TotalDevelopment
since 2007 (%)Migration balance*
Natural popula-tion growth* Total
Development since 2007 (%)
Single-person households (%)
Innenstadt 127,827 -0.7 2,791 132 83,116 -0.6 67.8Rodenkirchen 103,140 1.7 274 -206 52,137 2.3 47.2Lindenthal 143,149 3.0 1,367 192 78,804 2.4 54.3Ehrenfeld 105,493 1.5 976 179 57,368 3.6 53.8Nippes 113,945 3.5 535 75 59,511 3.6 50.4Chorweiler 80,895 -1.1 -89 4 34,942 3.6 31.9Porz 109,039 2.0 276 -130 51,926 2.8 40.3Kalk 114,885 5.8 780 144 55,725 5.8 44.9Mülheim 146,182 1.1 808 52 73,692 3.4 46.6
Cologne 1,044,555 1.9 7,718 442 547,221 2.8 50.4
*Migration balance includes the difference between immigration and emigration. Natural population growth means the difference between births and deaths. Sources: Office for Urban Development and Statistics Cologne, Jones Lang LaSalle GmbH
Source: Office for Urban Development and Statistics Cologne
On Point • Residential City Profile Cologne • Update 2nd half of 2013 4
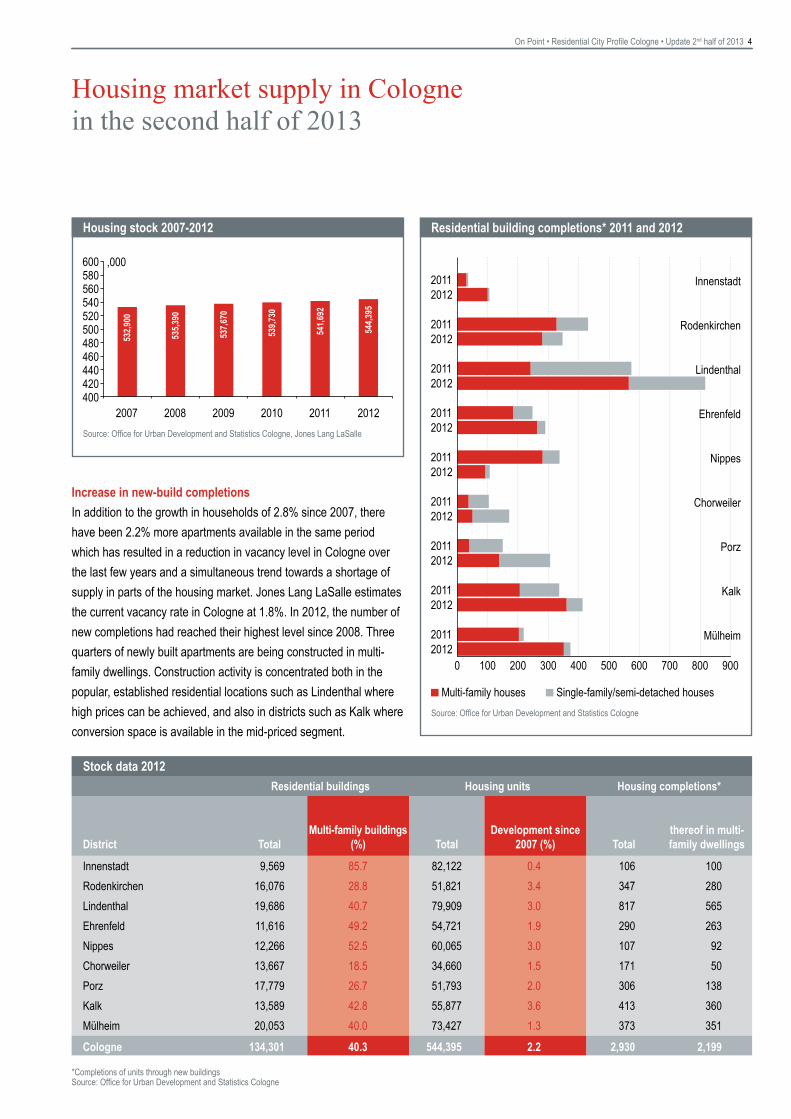
Housing stock 2007-2012
Increase in new-build completions
In addition to the growth in households of 2.8% since 2007, there have been 2.2% more apartments available in the same period which has resulted in a reduction in vacancy level in Cologne over the last few years and a simultaneous trend towards a shortage of supply in parts of the housing market. Jones Lang LaSalle estimates the current vacancy rate in Cologne at 1.8%. In 2012, the number of new completions had reached their highest level since 2008. Three quarters of newly built apartments are being constructed in multi-family dwellings. Construction activity is concentrated both in the popular, established residential locations such as Lindenthal where high prices can be achieved, and also in districts such as Kalk where conversion space is available in the mid-priced segment.
Residential building completions* 2011 and 2012
Stock data 2012
Residential buildings Housing units Housing completions*
District TotalMulti-family buildings
(%) TotalDevelopment since
2007 (%) Totalthereof in multi-family dwellings
Innenstadt 9,569 85.7 82,122 0.4 106 100Rodenkirchen 16,076 28.8 51,821 3.4 347 280Lindenthal 19,686 40.7 79,909 3.0 817 565Ehrenfeld 11,616 49.2 54,721 1.9 290 263Nippes 12,266 52.5 60,065 3.0 107 92Chorweiler 13,667 18.5 34,660 1.5 171 50Porz 17,779 26.7 51,793 2.0 306 138Kalk 13,589 42.8 55,877 3.6 413 360Mülheim 20,053 40.0 73,427 1.3 373 351
Cologne 134,301 40.3 544,395 2.2 2,930 2,199
*Completions of units through new buildings Source: Office for Urban Development and Statistics Cologne
Housing market supply in Cologne in the second half of 2013
Source: Office for Urban Development and Statistics Cologne, Jones Lang LaSalle
Source: Office for Urban Development and Statistics Cologne
On Point • Residential City Profile Cologne • Update 2nd half of 2013 5
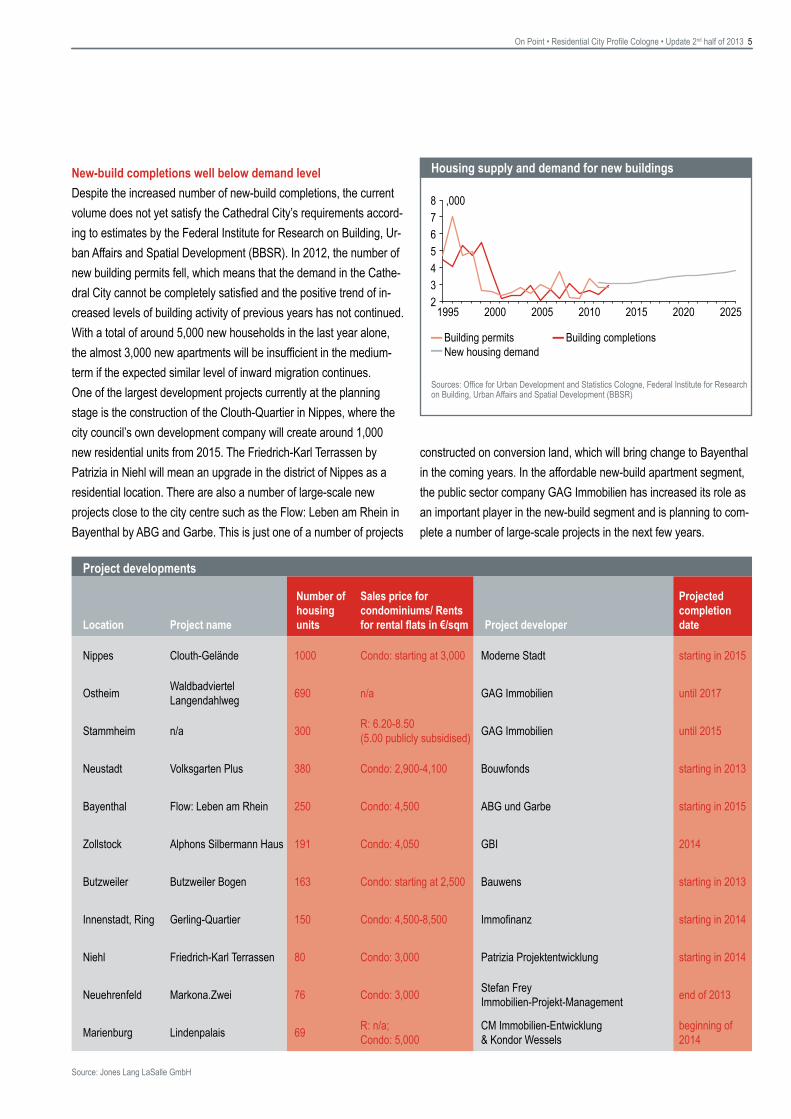
Housing supply and demand for new buildingsNew-build completions well below demand level
Despite the increased number of new-build completions, the current volume does not yet satisfy the Cathedral City’s requirements accord-ing to estimates by the Federal Institute for Research on Building, Ur-ban Affairs and Spatial Development (BBSR). In 2012, the number of new building permits fell, which means that the demand in the Cathe-dral City cannot be completely satisfied and the positive trend of in-creased levels of building activity of previous years has not continued. With a total of around 5,000 new households in the last year alone, the almost 3,000 new apartments will be insufficient in the medium-term if the expected similar level of inward migration continues.One of the largest development projects currently at the planning stage is the construction of the Clouth-Quartier in Nippes, where the city council’s own development company will create around 1,000 new residential units from 2015. The Friedrich-Karl Terrassen by Patrizia in Niehl will mean an upgrade in the district of Nippes as a residential location. There are also a number of large-scale new projects close to the city centre such as the Flow: Leben am Rhein in Bayenthal by ABG and Garbe. This is just one of a number of projects
constructed on conversion land, which will bring change to Bayenthal in the coming years. In the affordable new-build apartment segment, the public sector company GAG Immobilien has increased its role as an important player in the new-build segment and is planning to com-plete a number of large-scale projects in the next few years.
Sources: Office for Urban Development and Statistics Cologne, Federal Institute for Research on Building, Urban Affairs and Spatial Development (BBSR)
Project developments
Location Project name
Number of housing units
Sales price for condominiums/ Rents for rental flats in €/sqm Project developer
Projected completion date
Nippes Clouth-Gelände 1000 Condo: starting at 3,000 Moderne Stadt starting in 2015
Ostheim Waldbadviertel Langendahlweg 690 n/a GAG Immobilien until 2017
Stammheim n/a 300 R: 6.20-8.50 (5.00 publicly subsidised) GAG Immobilien until 2015
Neustadt Volksgarten Plus 380 Condo: 2,900-4,100 Bouwfonds starting in 2013
Bayenthal Flow: Leben am Rhein 250 Condo: 4,500 ABG und Garbe starting in 2015
Zollstock Alphons Silbermann Haus 191 Condo: 4,050 GBI 2014
Butzweiler Butzweiler Bogen 163 Condo: starting at 2,500 Bauwens starting in 2013
Innenstadt, Ring Gerling-Quartier 150 Condo: 4,500-8,500 Immofinanz starting in 2014
Niehl Friedrich-Karl Terrassen 80 Condo: 3,000 Patrizia Projektentwicklung starting in 2014
Neuehrenfeld Markona.Zwei 76 Condo: 3,000 Stefan Frey Immobilien-Projekt-Management end of 2013
Marienburg Lindenpalais 69 R: n/a; Condo: 5,000
CM Immobilien-Entwicklung & Kondor Wessels
beginning of 2014
Source: Jones Lang LaSalle GmbH

On Point • Residential City Profile Cologne • Update 2nd half of 2013 6
Rental housing market in Cologne in the second half of 2013
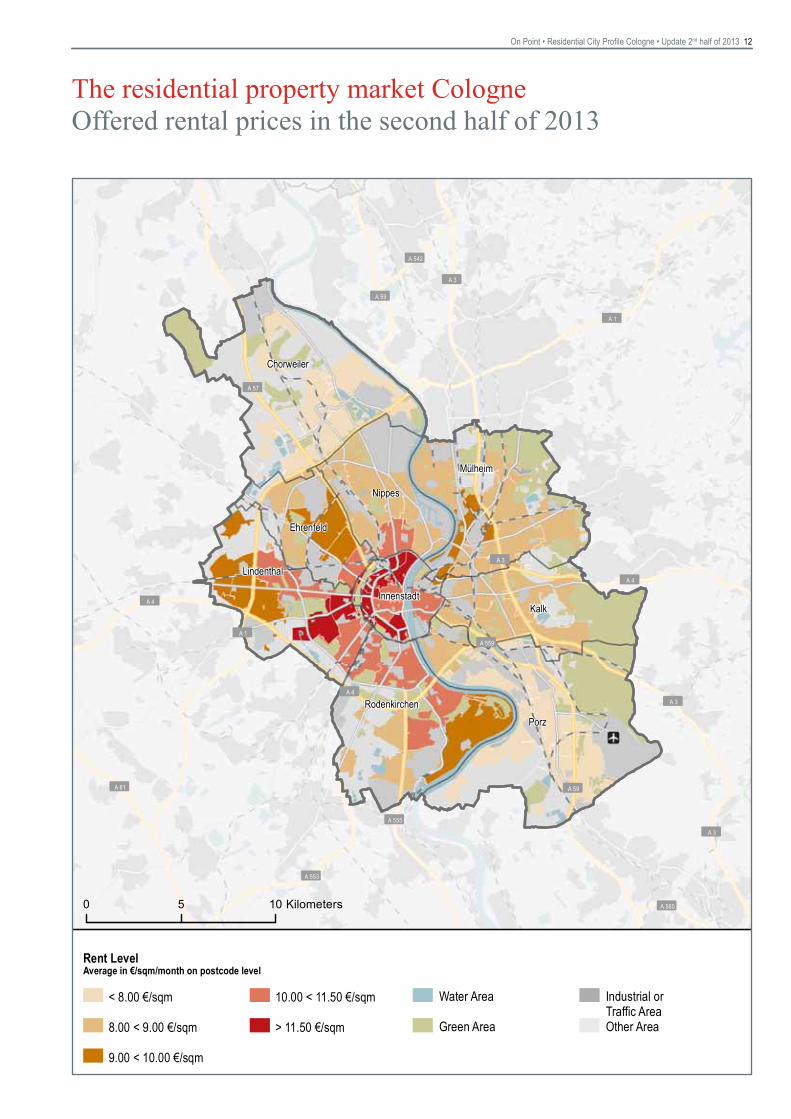
Big rental price increase in Chorweiler
In the second half of 2013, the average asking rent in Cologne rose by 4.8% to € 9.45 per sqm. Compared to the first half year, this is an in-crease of € 0.15 per sqm or 1.6%. All districts in the Cathedral City have experienced an increase in rental prices. But it is not just the ex-pensive popular locations such as the city centre or Lindenthal where the rents are rising strongest (as it was as late as 2012), but also in-creasingly in the formerly more reasonably priced locations such as Chorweiler and Mülheim, which have seen an above-average increase
Rental price bands for offered apartments
in rents. Chorweiler is leader with a rental growth of over 7% year-on-year. Those seeking rental apartments focus their search increasingly on less popular residential locations, which is reflected in a rental price rise in these areas. In contrast, the market has levelled off in the more expensive districts, which has meant slightly falling rents in Lindenthal compared to the first half year. Prices are also stagnating in Nippes, which had experienced high price rises in the past. Prime rents in Co-logne city centre have increased significantly to over € 18.15 per sqm. This equates to an increase of almost € 2.00 per sqm within one year.
Sources: IDN ImmoDaten GmbH, Jones Lang LaSalle GmbH
Rental price bands for offered apartments (2nd half of 2013 in €/sqm/month)
District 10% 25%Median rent*
(50%)Development since
H2 2012 (%) 75% 90%
Innenstadt 8.80 10.10 11.80 3.0 13.75 18.15Rodenkirchen 7.65 8.60 10.00 4.7 11.50 12.95Lindenthal 8.10 9.15 10.65 1.3 12.15 14.05Ehrenfeld 7.55 8.65 10.00 1.3 11.85 13.80Nippes 6.00 7.50 9.00 0.6 10.35 12.35Chorweiler 5.60 6.50 7.50 7.3 8.50 9.55Porz 6.55 7.10 7.75 3.6 8.75 9.80Kalk 6.70 7.50 8.20 4.5 9.30 10.85Mülheim 6.80 7.55 8.50 6.3 9.50 11.20Cologne 6.90 7.90 9.45 4.8 11.40 13.65
*Median rent: 50 per cent of the listings are above 50 per cent below this figure Sources: IDN ImmoDaten GmbH, Jones Lang LaSalle GmbH

On Point • Residential City Profile Cologne • Update 2nd half of 2013 7
Slightly subdued upward trend in rental prices
The moderate upward trend in rental prices continues but at a slightly subdued level in the second half of 2013. Thus, the upward trend which has characterised the Cologne rental apartment market since 2009 continues. Since the start of 2009, rents in the Cathedral City have risen by 15%, which equates to an annual growth rate of 3.2%. However over the long-term, rents have risen by an average of just 0.8% p.a., which is considerably below the inflation rate. Cologne is therefore one of the large cities which has shown a moderate rental price rise in the last few years. In the current market environment with a significant rise in demand and a lack of increased building activity, the likelihood of further rental price increases in Cologne is high.In the new-build segment, which includes apartments constructed since 2009, the average rent is € 11.50 per sqm, which equates to a rise of around 3% year-on-year. Therefore, prices for new-build apartments in Cologne are rising much faster than for the market as a whole. In the city centre, the most expensive district in terms of new-build apartments, prices have actually fallen slightly. Prime rents for new-builds are around € 20.00 per sqm and are achieved in locations on the Rhein such as the Rheinauhafen. In terms of build-ing age categories, the highest year-on-year price rise of over 10% is for apartments dating from the 1950s. These previously basic apartments are now mainly refurbished and offer a higher level of comfort than apartments from the 1970s, and is reflected in the rela-tive rental price levels.
Rental price by unit size (Median in €/sqm/month)*District < 45 sqm 45-65 sqm 66-90 sqm > 90 sqm
Innenstadt 12.95 11.65 10.95 11.50Rodenkirchen 11.10 9.65 9.50 10.70Lindenthal 11.60 10.25 10.15 10.90Ehrenfeld 10.90 10.15 9.40 9.85Nippes 10.95 9.00 8.45 8.90Chorweiler 9.35 7.45 7.40 7.55Porz 9.70 7.85 7.40 7.85Kalk 9.55 8.35 7.90 8.20Mülheim 10.00 8.40 8.10 8.50Cologne 11.10 9.15 8.65 9.80
*Median rent: 50 per cent of the listings are above 50 per cent below this figure Sources: IDN ImmoDaten GmbH, Jones Lang LaSalle GmbH
Rental price by building age (Median in €/sqm/month)*
District < 1919 1920-1945 1946-1960 1961-1975 1976-1990 1991-2008 > 2009
Innenstadt 12.05 n/a 10.80 11.25 11.35 12.25 13.00Rodenkirchen 9.35 n/a 9.05 8.70 10.10 10.45 11.30Lindenthal 11.30 10.95 10.90 9.00 9.55 10.40 12.45Ehrenfeld 10.90 n/a 9.55 8.35 n/a 10.35 12.00Nippes 11.30 9.90 8.70 8.50 9.00 9.00 10.35Chorweiler 7.35 n/a n/a 7.35 7.05 8.00 8.55Porz 8.00 n/a 7.30 7.35 8.05 7.95 9.30Kalk 8.05 n/a 7.65 8.00 7.30 8.70 10.15Mülheim 9.00 n/a 8.15 8.35 7.90 8.55 9.50Cologne 10.90 10.30 9.15 8.25 8.80 9.55 11.50
*Median rent: 50 per cent of the listings are above 50 per cent below this figure Sources: IDN ImmoDaten GmbH, Jones Lang LaSalle GmbH
Development of rental prices (Median in €/sqm/month)
Sources: IDN ImmoDaten GmbH, Jones Lang LaSalle GmbH

On Point • Residential City Profile Cologne • Update 2nd half of 2013 8
Strong price dynamic in sought-after locations
In the second half of 2013, asking prices for condominiums rose by 19.3% to € 2,470 per sqm. Ignoring new-build apartments, the price rise would have been around 40% less, but would have still been high at around 11%. Expensive new-build schemes exerted a great influ-ence on the price difference between districts. Popular locations are generally those showing the highest price increases. Taking the exist-ing stock into account, the districts of Lindenthal (23%), Rodenkirch-en (21%) and to a lesser extent the city centre (12%) experienced the
highest price increases. Prices here were highest at around € 3,000 to € 3,700 per sqm. Prime sale prices in Cologne of around € 10,500 per sqm are achieved in the locations on the Rhein. In the new trendy locations Ehrenfeld and Nippes, expensive new-build projects are also driving prices which are now € 2,300 to € 2,900 per sqm and therefore at a comparatively moderate level, but nonetheless still above the average price. In addition to the expensive city centre loca-tions, there are more reasonably priced peripheral districts where condominiums cost between € 1,500 and € 1,800 per sqm.
Purchase price bands for condominiums
Condominium market in Cologne in the second half of 2013
Purchase price bands for condominiums (2nd half of 2013 in €/sqm)
District 10% 25%Median price*
(50%)Development since
H2 2012 (%) 75% 90%
Innenstadt 2,270 2,810 3,700 16.0 4,450 5,900Rodenkirchen 1,610 2,470 3,380 16.7 4,240 4,900Lindenthal 1,530 2,060 2,980 14.6 3,840 4,440Ehrenfeld 1,580 2,330 2,890 17.3 3,170 3,530Nippes 1,530 1,960 2,340 15.4 3,020 3,290Chorweiler 770 1,210 1,750 5.9 2,130 2,470Porz 1,170 1,310 1,590 7.1 2,120 2,920Kalk 1,100 1,310 1,530 5.2 1,820 2,230Mülheim 1,120 1,460 1,780 1.2 2,310 2,890Cologne 1,280 1,660 2,470 19.3 3,380 4,290
*Median price: 50 per cent of the listings are above 50 per cent below this figure Sources: IDN ImmoDaten GmbH, Jones Lang LaSalle GmbH
Sources: IDN ImmoDaten GmbH, Jones Lang LaSalle GmbH
On Point • Residential City Profile Cologne • Update 2nd half of 2013 9
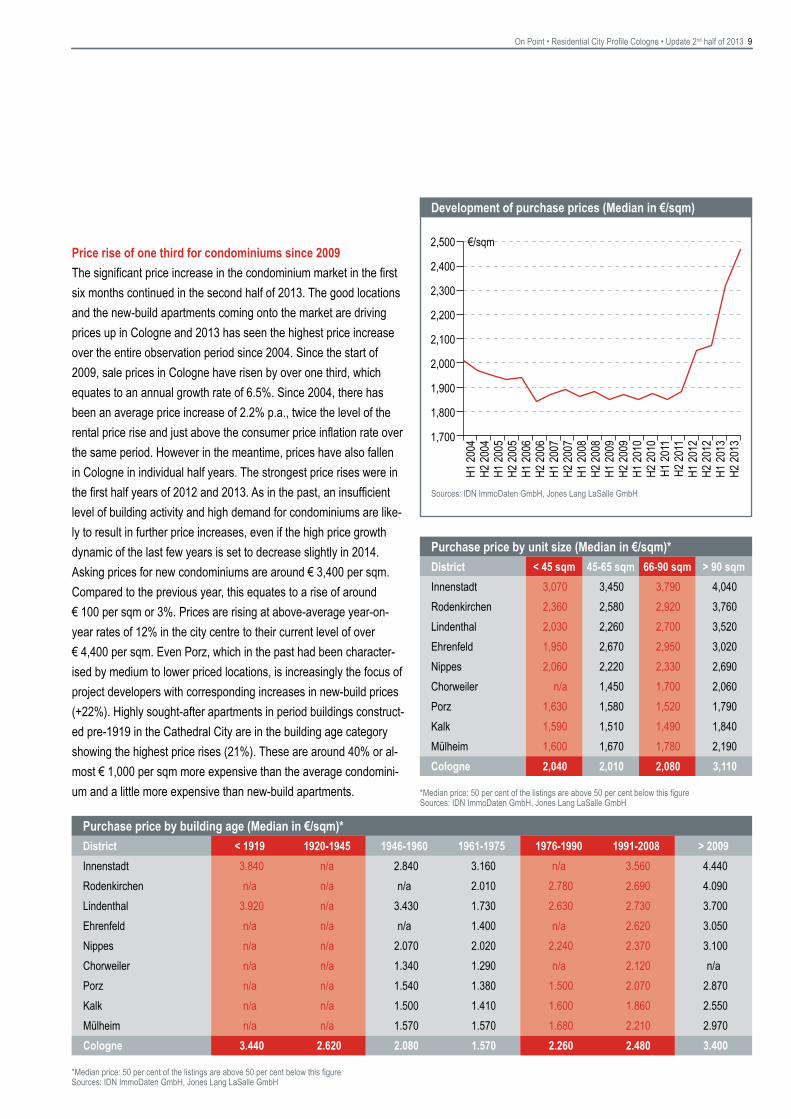
Price rise of one third for condominiums since 2009
The significant price increase in the condominium market in the first six months continued in the second half of 2013. The good locations and the new-build apartments coming onto the market are driving prices up in Cologne and 2013 has seen the highest price increase over the entire observation period since 2004. Since the start of 2009, sale prices in Cologne have risen by over one third, which equates to an annual growth rate of 6.5%. Since 2004, there has been an average price increase of 2.2% p.a., twice the level of the rental price rise and just above the consumer price inflation rate over the same period. However in the meantime, prices have also fallen in Cologne in individual half years. The strongest price rises were in the first half years of 2012 and 2013. As in the past, an insufficient level of building activity and high demand for condominiums are like-ly to result in further price increases, even if the high price growth dynamic of the last few years is set to decrease slightly in 2014.Asking prices for new condominiums are around € 3,400 per sqm. Compared to the previous year, this equates to a rise of around € 100 per sqm or 3%. Prices are rising at above-average year-on-year rates of 12% in the city centre to their current level of over € 4,400 per sqm. Even Porz, which in the past had been character-ised by medium to lower priced locations, is increasingly the focus of project developers with corresponding increases in new-build prices (+22%). Highly sought-after apartments in period buildings construct-ed pre-1919 in the Cathedral City are in the building age category showing the highest price rises (21%). These are around 40% or al-most € 1,000 per sqm more expensive than the average condomini-um and a little more expensive than new-build apartments.
Purchase price by building age (Median in €/sqm)*
District < 1919 1920-1945 1946-1960 1961-1975 1976-1990 1991-2008 > 2009
Innenstadt 3.840 n/a 2.840 3.160 n/a 3.560 4.440Rodenkirchen n/a n/a n/a 2.010 2.780 2.690 4.090Lindenthal 3.920 n/a 3.430 1.730 2.630 2.730 3.700Ehrenfeld n/a n/a n/a 1.400 n/a 2.620 3.050Nippes n/a n/a 2.070 2.020 2.240 2.370 3.100Chorweiler n/a n/a 1.340 1.290 n/a 2.120 n/aPorz n/a n/a 1.540 1.380 1.500 2.070 2.870Kalk n/a n/a 1.500 1.410 1.600 1.860 2.550Mülheim n/a n/a 1.570 1.570 1.680 2.210 2.970Cologne 3.440 2.620 2.080 1.570 2.260 2.480 3.400
*Median price: 50 per cent of the listings are above 50 per cent below this figure Sources: IDN ImmoDaten GmbH, Jones Lang LaSalle GmbH
Development of purchase prices (Median in €/sqm)
Sources: IDN ImmoDaten GmbH, Jones Lang LaSalle GmbH
Purchase price by unit size (Median in €/sqm)*
District < 45 sqm 45-65 sqm 66-90 sqm > 90 sqm
Innenstadt 3,070 3,450 3,790 4,040Rodenkirchen 2,360 2,580 2,920 3,760Lindenthal 2,030 2,260 2,700 3,520Ehrenfeld 1,950 2,670 2,950 3,020Nippes 2,060 2,220 2,330 2,690Chorweiler n/a 1,450 1,700 2,060Porz 1,630 1,580 1,520 1,790Kalk 1,590 1,510 1,490 1,840Mülheim 1,600 1,670 1,780 2,190Cologne 2,040 2,010 2,080 3,110
*Median price: 50 per cent of the listings are above 50 per cent below this figure Sources: IDN ImmoDaten GmbH, Jones Lang LaSalle GmbH
On Point • Residential City Profile Cologne • Update 2nd half of 2013 10
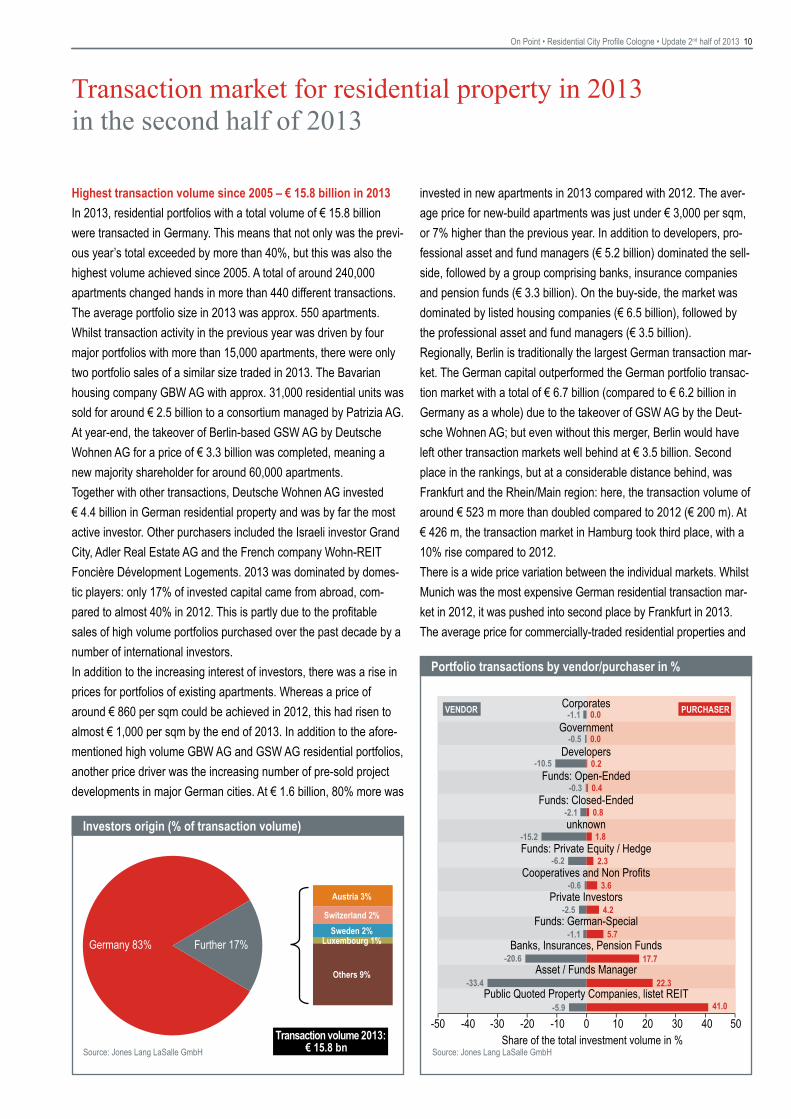
Highest transaction volume since 2005 – € 15.8 billion in 2013
In 2013, residential portfolios with a total volume of € 15.8 billion were transacted in Germany. This means that not only was the previ-ous year’s total exceeded by more than 40%, but this was also the highest volume achieved since 2005. A total of around 240,000 apartments changed hands in more than 440 different transactions. The average portfolio size in 2013 was approx. 550 apartments. Whilst transaction activity in the previous year was driven by four major portfolios with more than 15,000 apartments, there were only two portfolio sales of a similar size traded in 2013. The Bavarian housing company GBW AG with approx. 31,000 residential units was sold for around € 2.5 billion to a consortium managed by Patrizia AG. At year-end, the takeover of Berlin-based GSW AG by Deutsche Wohnen AG for a price of € 3.3 billion was completed, meaning a new majority shareholder for around 60,000 apartments. Together with other transactions, Deutsche Wohnen AG invested € 4.4 billion in German residential property and was by far the most active investor. Other purchasers included the Israeli investor Grand City, Adler Real Estate AG and the French company Wohn-REIT Foncière Dévelopment Logements. 2013 was dominated by domes-tic players: only 17% of invested capital came from abroad, com-pared to almost 40% in 2012. This is partly due to the profitable sales of high volume portfolios purchased over the past decade by a number of international investors. In addition to the increasing interest of investors, there was a rise in prices for portfolios of existing apartments. Whereas a price of around € 860 per sqm could be achieved in 2012, this had risen to almost € 1,000 per sqm by the end of 2013. In addition to the afore-mentioned high volume GBW AG and GSW AG residential portfolios, another price driver was the increasing number of pre-sold project developments in major German cities. At € 1.6 billion, 80% more was
Transaction market for residential property in 2013 in the second half of 2013
Investors origin (% of transaction volume)
Portfolio transactions by vendor/purchaser in %
invested in new apartments in 2013 compared with 2012. The aver-age price for new-build apartments was just under € 3,000 per sqm, or 7% higher than the previous year. In addition to developers, pro-fessional asset and fund managers (€ 5.2 billion) dominated the sell-side, followed by a group comprising banks, insurance companies and pension funds (€ 3.3 billion). On the buy-side, the market was dominated by listed housing companies (€ 6.5 billion), followed by the professional asset and fund managers (€ 3.5 billion). Regionally, Berlin is traditionally the largest German transaction mar-ket. The German capital outperformed the German portfolio transac-tion market with a total of € 6.7 billion (compared to € 6.2 billion in Germany as a whole) due to the takeover of GSW AG by the Deut-sche Wohnen AG; but even without this merger, Berlin would have left other transaction markets well behind at € 3.5 billion. Second place in the rankings, but at a considerable distance behind, was Frankfurt and the Rhein/Main region: here, the transaction volume of around € 523 m more than doubled compared to 2012 (€ 200 m). At € 426 m, the transaction market in Hamburg took third place, with a 10% rise compared to 2012. There is a wide price variation between the individual markets. Whilst Munich was the most expensive German residential transaction mar-ket in 2012, it was pushed into second place by Frankfurt in 2013. The average price for commercially-traded residential properties and
Source: Jones Lang LaSalle GmbHSource: Jones Lang LaSalle GmbH

On Point • Residential City Profile Cologne • Update 2nd half of 2013 11
vestments. However, a transaction volume of almost € 230 m was recorded in the fourth quarter of 2013, which equates to a rise of al-most 40% above the previous year’s level. Even the largest single deal in terms of residential units in the first half year was concluded in the fourth quarter. The sale of a residential and commercial com-plex with 210 apartments to a regional housing association earned some € 27 m for a closed-ended residential property fund. Overall, more than 1,500 apartments changed hands at an average lot size of more than 60 apartments per transaction. As in other cities, project developments have driven transaction activity. Over half the volume, or 600 apartments, were sold via forward deals. These projects were purchased mainly by conservative investors such as insurance companies and pension funds. Together with the purchase of other existing properties, they contributed a share of more than 50% to the residential investment volume in the cathedral city, fol-lowed by professional asset and fund managers with a share of around 25%. The average price for apartments in multi-family dwell-ings in Cologne is € 2,100 per sqm, which makes it the third most expensive German city in terms of transaction prices.
portfolios was € 2,900 per sqm or € 220,000 per residential unit. In Hamburg, the price was around € 2,200 per sqm or € 150,000 per residential unit. Cologne’s residential market was the biggest sur-prise, moving into third place. Residential properties and portfolios were traded here at an average price of € 2,100 per sqm or € 150,000 per apartment. The average price in Munich fell to € 1,800 per sqm and thus somewhat less than € 110,000 per residential unit. By con-trast, Berlin’s average of € 65,000 per residential unit or slightly less than € 1,100 per sqm is significantly less expensive. The gross yield range stretched from over 10% in less well-structured regions to be-low 5% in the city centres of Munich, Hamburg and even Berlin. The residential transaction market is also expected to perform well in 2014. Even if the number of high volume transactions reduces, port-folio break-ups, rationalisations of existing portfolios and other consol-idations in the market are expected to produce a total transaction vol-ume of at least € 11 billion.
Surprising level of transaction volume
By the middle of the year, it looked like there would be a slump in the Cologne transaction market for commercially-traded residential in-
Selected residential portfolio transactions
Location Vendor PurchaserHousing
unitsPurchase price
in € million Date Annotations
Berlin Free float Deutsche Wohnen AG 52,557 3,321.7 Q4 2013 Takeover GSW AG
Munich, Nuremberg and others
Bayern LB Consortium led by Patrizia Immobilien AG
32,000 2,453.0 Q2 2013 GBW portfolio
Berlin Blackstone Deutsche Wohnen AG 6,900 369.0 Q2 2013 Remaining Level One portfolio
Berlin, Dresden confidential Foncière Dévelopment Logements
4,000 351.0 Q4 2013
Berlin, Düsseldorf confidential Private equity investors 8,500 confidential Q4 2013
Berlin, Frankfurt, Leipzig, Dresden and others
Corestate Capital AG several German institutional investors
3,700 250.0 Q1 2013
Berlin, Nürnberg, Essen, Dresden
confidential Grand City Properties 4,400 confidential Q3 2013
Berlin Petrus Advisors Deutsche Wohnen AG 5,210 230.0 Q1 2013 Petrus portfolios
Duisburg, Düsseldorf Immeo Wohnen Adler Real Estate AG 4,290 210.8 Q2 2013 e.g. former ThyssenKrupp portfolio
Berlin Lincoln Equities GSW Immobilien AG 2,800 201.0 Q3 2013 two portfolios
Source: Jones Lang LaSalle GmbH
On Point • Residential City Profile Cologne • Update 2nd half of 2013 12
Chorweiler
Ehrenfeld
InnenstadtKalk
Lindenthal
Mülheim
Nippes
PorzRodenkirchen
ìA 560
ìA 542
ìA 3
ìA 61
ìA 559
ìA 4
ìA 3
ìA 3
ìA 553
ìA 59
ìA 555
ìA 4
ìA 59
ìA 4
ìA 3
ìA 1
ìA 57
ìA 1
Page 11 of 16
Source: Jones Lang LaSalle, IDN Immodaten GmbH, Infas Geodaten GmbH
Rent LevelAverage in €/sqm/month on postcode level
Water Area
Green Area
Industrial orTraffic AreaOther Area
0 5 10 Kilometers
Köln
8.00 < 9.00 €/sqm
< 8.00 €/sqm
9.00 < 10.00 €/sqm
10.00 < 11.50 €/sqm
> 11.50 €/sqm
The residential property market Cologne Offered rental prices in the second half of 2013

On Point • Residential City Profile Cologne • Update 2nd half of 2013 13
Glossary
General information
Rental/purchase prices The average prices (median and arithmetic mean) compiled in this report are based on property advertisements that the IDN Immodaten portal retrieves and evaluates from 113 sources such as daily newspapers and online property sites. Jones Lang LaSalle validates the acquired primary data and verifies the results. The rental and purchase prices reported in the Residential City Profiles are advertised prices and rents. That means they could be slightly higher or lower by the time of the final contract, particularly in the case of condominiums.
Basic statistical terms
Average Average value is a colloquial term used for a series of mean values. Arithmetic mean and median are more commonly used terms.
Arithmetic mean The arithmetic mean is calculated based on the sum of all occurring values divided by the number of these values. Also called the standard average value, this measurement is particularly sensitive to outliers, as high values have a disproportionate influence on the average. In order to reduce this sensitivity, the arithmetic mean is frequently given a “weight”. For example, rents are each multiplied by the space. The sum of this weight is then divided by the total space.
Median (Central value) – The numerical value separating the higher half of a sample from the lower half. In an ordered list (e.g. rent/purchase price lists in € per sqm) the median divides the list into two equal halves. 50% of the prices are above and 50% are below the median value. If there is an even number of prices, the median is defined as the mean of the two middle values. The advantage of the median is that it does not react to outliers in the list and is therefore a robust way of measuring the average.
Quartile Quartiles divide an ordered list into quarters. The value that separates the first 25% of the list represents the first quartile. The middle 50% of an ordered list is located between the second and third quartiles.
Percentile Along the lines of quartiles, percentiles divide ordered lists into 100 equal parts. In the Residential City Profile, the 10th and the 90th percentile are used in order to define the upper and lower 10% of the purchase prices and rents.
Box plot A box plot can illustrate a total of five values to provide a detailed description and spread of rents and purchase prices. A line is also added to indicate the 10th and 90th percentile. The median value and the second and third quartiles are plotted as a box or a bar on the straight line.
Terms for settlement structure and population dynamics
Wilhelmian building period The Wilhelmian period relates to the era between 1850 and 1914. In the course of the increased industrialisation of cities at the time, large settlements were established on the former city outskirts to accommodate the rapidly growing city populations. Four- to six-storey building complexes or tenements were erected with richly decorated facades.
Large (residential) estate Large residential estates were established between the 1950s and the end of the 1980s primarily on the outskirts of large European cities. The buildings were erected quickly due to their homogenous building structure and the use of industrial mass-production methods. The main characteristics of the buildings are that they contain many floors packed densely together and provide at least 1,000 residential units. The objective was to create plenty of modern and affordable housing in the fastest possible time. In Germany, the largest estates are located in Berlin (Marzahn, Hellersdorf and Lichtenberg with around 160,000 units); Halle-Neustadt (41,000), Leipzig-Grünau (40,000), Chemnitz (31,000), Munich-Neuperlach (24,000), Schwerin (20,700) and Cologne-Chorweiler (20,000).
Suburbanisation The economic and demographic expansion of cities into their suburbs since the Second World War. Also associated with this is the intra-regional shift of settlements to the city outskirts. Typical suburban settlements are not built up and are dominated by one- and two-family houses and terrace houses built in similar styles.
Population change Term to represent changes in the number of inhabitants in a region. The difference between immigration and emigration is described as net migration, and the difference between births and deaths is described as natural population development.
Singularisation The singularisation of living forms, a concept that emerged from gerontology to describe the solitary living of people from an older age. People of advancing age live alone because of the death of their partner and the less frequent use of family networks. The term has also recently been applied to younger people who live alone. However, the growing number of single-person households in Germany is primarily due to the ageing of society.

Contact
jll.de/research
Copyright © JONES LANG LASALLE GmbH, 2014.No part of this publication may be reproduced or transmitted in any form or by any means without prior written consent of Jones Lang LaSalle. It is based on material that we believe to be reliable. Whilst every effort has been made to ensure its accuracy, we cannot offer any warranty that it con-tains no factual errors. We would like to be told of any such errors in order to correct them.
Roman Heidrich
Team Leader Residential Valuation Advisory BerlinBerlintel +49 (0) 30 203980 [email protected]
Andrew Groom
Head of Valuation & Transaction Advisory GermanyFrankfurttel +49 (0) 69 2003 [email protected]
Helge Scheunemann
Head of Research GermanyHamburgtel +49 (0) 40 350011 [email protected]
Sebastian Grimm
Team Leader Residential Valuation Advisory FrankfurtFrankfurttel +49 (0) 69 2003 [email protected]