residential heating biofuels market state of the...
TRANSCRIPT

Residential heating biofuels market state of the art
Grant Agreement N° 691763 Acronym BIOMASUD PLUS
Full Title Developing the sustainable market of residential Mediterranean solid biofuels
Work Package (WP) 2
Authors
Hajdana Rukavina, Melani Furlan (ZEZ); Karampinis Emmanouil, Margaritis
Nikos, Panagiotis Vounatsos (CERTH); Laura Bau, Valter Francescato (AIEL);
Teresa Almeida and Sónia Figo (CBE); Špela Ščap, dr. Nike Krajnc, M.Sc. Mitja Piškur (GIS); Pablo Rodero Masdemont, Alicia Mira Uguina (AVEBIOM); Berrin ENGİN, Yeliz ÇETİN (TUBITAK)
Document Type Deliverable 2.1
Document Title State of the art of the biomass market. Report of Croatia
CO Confidential, only for members of the
Consortium (including the Commission Services)
PU Public X
PP Restricted to other programme participants
(including the Commission Services)
RE Restricted to a group specified by the
Consortium (including the Commission Services)

2
This project has received funding from the European Union's Horizon 2020 research and innovation program under grant agreement No. 691763
Disclaimer
The content of the publication herein is the sole responsibility of the publishers and it does not
necessarily represent the views expressed by the European Commission or its services.
While the information contained in the documents is believed to be accurate, the authors(s) or any
other participant in the BIOMASUD PLUS consortium make no warranty of any kind with regard to this
material including, but not limited to the implied warranties of merchantability and fitness for a
particular purpose.
Neither the BIOMASUD PLUS Consortium nor any of its members, their officers, employees or agents
shall be responsible or liable in negligence or otherwise howsoever in respect of any inaccuracy or
omission herein.
Without derogating from the generality of the foregoing neither the BIOMASUD PLUS Consortium nor
any of its members, their officers, employees or agents shall be liable for any direct or indirect or
consequential loss or damage caused by or arising from any information advice or inaccuracy or
omission herein.

3
This project has received funding from the European Union's Horizon 2020 research and innovation program under grant agreement No. 691763
Index
State of the art of the biomass market. Report of Croatia .............................. 7
INTRODUCTION ......................................................................................................... 8
MAIN COMMERCIALIZED SOLID BIOFUELS IN CROATIA ............................................ 8
BIOMASSES WITH POTENTIAL INTEREST IN CROATIA ............................................. 21
EXPORTATIONS / IMPORTS OF THE SOLID BIOMASSES IN CROATIA....................... 23
MAIN SUPPORTS FOR THE USE OF BIOMASS IN CROATIA ...................................... 26
MAIN PROBLAMATIC OF THE USE OF BIOMASS IN CROATIA .................................. 27
CONCLUSIONS ......................................................................................................... 28
REFERENCES ............................................................................................................ 29
State of the art of the biomass market. Report of Greece ............................. 30
INTRODUCTION ....................................................................................................... 31
MAIN COMMERCIALIZED SOLID BIOFUELS IN GREECE............................................ 31
BIOMASSES WITH POTENTIAL INTEREST IN GREECE ............................................... 36
EXPORTS / IMPORTS OF THE SOLID BIOMASSES IN GREECE ................................... 41
MAIN SUPPORTS FOR THE USE OF BIOMASS IN GREECE ........................................ 43
MAIN PROBLEMS FOR THE USE OF BIOMASS IN GREECE ....................................... 46
CONCLUSIONS ......................................................................................................... 46
REFERENCES ............................................................................................................ 47
State of the art of the biomass market. Report of Italy ................................. 50
INTRODUCTION ....................................................................................................... 51
MAIN COMMERCIALIZED SOLID BIOFUELS IN ITALY ............................................... 53
BIOMASSES WITH POTENTIAL INTEREST IN ITALY................................................... 55
EXPORTATIONS / IMPORTS OF THE SOLID BIOMASSES IN ITALY ............................ 56
MAIN SUPPORTS FOR THE USE OF BIOMASS IN ITALY ............................................ 57
MAIN PROBLEMATIC OF THE USE OF BIOMASS IN ITALY ........................................ 62
CONCLUSIONS ......................................................................................................... 63

4
This project has received funding from the European Union's Horizon 2020 research and innovation program under grant agreement No. 691763
State of the art of the biomass market. Report of Portugal ........................... 64
INTRODUCTION ....................................................................................................... 65
MAIN COMMERCIALIZED SOLID BIOFUELS IN PORTUGAL ...................................... 68
BIOMASSES WITH POTENTIAL INTEREST IN PORTUGAL.......................................... 69
EXPORTATIONS / IMPORTS OF THE SOLID BIOMASSES IN PORTUGAL ................... 70
MAIN SUPPORTS FOR THE USE OF BIOMASS IN PORTUGAL ................................... 70
MAIN PROBLAMATIC OF THE USE OF BIOMASS IN PORTUGAL] ............................. 72
CONCLUSIONS ......................................................................................................... 73
REFERENCES ............................................................................................................ 74
State of the art of the biomass market. Report of Slovenia ........................... 75
INTRODUCTION ....................................................................................................... 76
MAIN COMMERCIALIZED SOLID BIOFUELS IN SLOVENIA ........................................ 79
BIOMASSES WITH POTENTIAL INTEREST IN SLOVENIA ........................................... 81
EXPORT / IMPORT OF THE SOLID BIOMASSES IN SLOVENIA ................................... 83
POLICY SUPPORT FOR THE USE OF BIOMASS IN SLOVENIA .................................... 85
MAIN BARRIERS FOR USE OF BIOMASS IN SLOVENIA ............................................. 86
CONCLUSIONS ......................................................................................................... 88
REFERENCES ............................................................................................................ 89
State of the art of the biomass market. Report of Spain ............................... 90
INTRODUCTION ....................................................................................................... 91
MAIN COMMERCIALIZED SOLID BIOFUELS IN SPAIN .............................................. 94
BIOMASSES WITH POTENTIAL INTEREST IN SPAIN .................................................. 99
EXPORTATIONS / IMPORTS OF THE SOLID BIOMASSES IN SPAIN ......................... 100
MAIN SUPPORTS FOR THE USE OF BIOMASS IN SPAIN ......................................... 101
MAIN PROBLAMATIC OF THE USE OF BIOMASS IN SPAIN .................................... 103
CONCLUSIONS ....................................................................................................... 104
REFERENCES .......................................................................................................... 105
State of the art of the biomass market. Report of Turkey ........................... 107

5
This project has received funding from the European Union's Horizon 2020 research and innovation program under grant agreement No. 691763
INTRODUCTION ..................................................................................................... 108
MAIN COMMERCIALIZED SOLID BIOFUELS IN TURKIYE......................................... 108
BIOMASSES WITH POTENTIAL INTEREST IN TURKIYE ............................................ 108
EXPORTATIONS / IMPORTS OF THE SOLID BIOMASSES IN TURKEY ...................... 109
MAIN SUPPORTS FOR THE USE OF BIOMASS IN TURKEY ...................................... 110
MAIN PROBLEMATIC OF THE USE OF BIOMASS IN TURKEY .................................. 110
CONCLUSIONS ....................................................................................................... 110
REFERENCES .......................................................................................................... 111
Market data for Croatia ............................................................................. 112
Market data for Greece .............................................................................. 124
Market data for Italy .................................................................................. 141
Market data for Portugal ........................................................................... 148
Market data for Slovenia ............................................................................ 156
Market data for Spain ................................................................................ 166
Market data for Turkey .............................................................................. 178
Consolidated SWOT analysis ...................................................................... 185
Croatia’s SWOT analysis ............................................................................. 191
Greece’s SWOT analysis ............................................................................. 197
Italy’s SWOT analysis ................................................................................. 204
Portugal’s SWOT analysis ........................................................................... 211
Slovenia’s SWOT analysis ........................................................................... 217
Spain’s SWOT analysis ................................................................................ 221
Report of the final user survey for Croatia .................................................. 233
RESULTS DESCRIPTION FOR CROATIA ................................................................... 234
MAIN CONCLUSIONS FROM THE SURVEY IN CROATIA ......................................... 242
Report of the final user survey for Greece .................................................. 243
RESULTS DESCRIPTION FOR GREECE ..................................................................... 244
MAIN CONCLUSIONS FROM THE SURVEY IN GREECE ........................................... 247

6
This project has received funding from the European Union's Horizon 2020 research and innovation program under grant agreement No. 691763
Report of the final user survey for Italy ...................................................... 249
RESULTS DESCRIPTION FOR ITALY ......................................................................... 250
MAIN CONCLUSIONS FROM THE SURVEY IN ITALY ............................................... 253
Report of the final user survey for Portugal ................................................ 254
RESULTS DESCRIPTION FOR PORTUGAL ................................................................ 255
MAIN CONCLUSIONS FROM THE SURVEY IN PORTUGAL ...................................... 262
Report of the final user survey for Slovenia ................................................ 264
RESULTS DESCRIPTION FOR SLOVENIA .................................................................. 265
MAIN CONCLUSIONS FROM THE SURVEY IN SLOVENIA ........................................ 273
Report of the final user survey for Spain..................................................... 275
RESULTS DESCRIPTION FOR SPAIN ........................................................................ 276
MAIN CONCLUSIONS FROM THE SURVEY IN SPAIN .............................................. 289
Report of the final user survey for Turkey .................................................. 291
RESULTS DESCRIPTION FOR TURKIYE .................................................................... 292
MAIN CONCLUSIONS FROM THE SURVEY IN TURKIYE .......................................... 299

7
This project has received funding from the European Union's Horizon 2020 research and innovation program under grant agreement No. 691763
State of the art of the biomass market. Report of Croatia

8
This project has received funding from the European Union's Horizon 2020 research and innovation program under grant agreement No. 691763
INTRODUCTION
In Croatia biomass accounts for approximately 11% of the total primary energy supply, while the
majority of fuelwood is consumed in households for heating. The total capacity of industrial biomass
heating plants is estimated at 515 MW. [Source: Energy in Croatia, 2014, Ministry of Economy]
Exploitation of forest and wood biomass for energy has a long tradition in Croatia, especially fire wood
and wood residue. In 1960s almost 25% of energy needs was being covered by biomass. Since then,
the use of biomass has diminished. Households rather use natural gas and fuel oil, because they are
more convenient to use.
The Ministry of Economy registry (RERCPPP) has more than 70 registered projects that are in process
of construction on forest or wood biomass [Source: RERCPPP, 2016]. For the period from 2006 to 2015
an amount of wood mass foreseen for utilization for energy, is about 2,6 million m3 (from that
amount, 2 million m3 per year is supposed to be obtained from Croatian Forests Ltd., and from the
private forests owners 0,6 million m3).
More than 95% of the total pellets production was exported while little was placed on the domestic
market. Wooden briquettes capacity is estimated at some 60.000 t/y while its actual production is
highly dependent on the feedstock availability – waste from wood processing industry. Briquettes are
also mostly exported. [Source: EIHP]
MAIN COMMERCIALIZED SOLID BIOFUELS IN CROATIA
Less than half of the population (47%) use some type of biomass for space heating, cooking or water
heating in Croatia. This percentage is much higher in rural areas, where approximately three fourths of
the households (73%) reported to use biomass for their daily needs, while, on the other hand, the
percentage is significantly lower in urban areas (28%). [Population Census 2012] Regarding the type of
biomass, firewood is used by almost all of the households that reported biomass consumption. A very
small number of households (4%) use pellets and briquettes or some other type of biomass (mainly
tree prunings). People obtain firewood from biomass supply centers (Croatian Forests Ltd. and local
biomass suppliers) (46%), wood industries (17%) or use their own cuttings (34%). More than one third
of the households that reported biomass consumption use biomass for cooking (38%). Furthermore,
two thirds of them, apart from biomass, use also electricity, LPG or natural gas for cooking. Few (12%)
households use biomass for water heating, mostly in combination with electricity or natural gas.
[Source: Energy Community]

9
This project has received funding from the European Union's Horizon 2020 research and innovation program under grant agreement No. 691763
Figure 1 Firewood source for households
Relevant legal framework
The existing policy framework is generally well developed, with several regulations and financing
mechanisms for each sector. National policy landscape related to the biomass supply, logistic,
conversion, distribution and end use is illustrated in following diagrams. [Source: S2Biom report]
Figure 2 Current policy: Forest [Source: S2Biom report]
45%
33%
16%
6%
Firewood sources for households
Biomass supply centers
Forestry (own cuttings)
Processing infrastructure
Other

10
This project has received funding from the European Union's Horizon 2020 research and innovation program under grant agreement No. 691763
Figure 3 Current policy: Agriculture and dedicated crops [Source: S2Biom report]
Technical rules and standards that apply to heating systems are given in the table:
Table 1 Technical rules and standards for heating systems
Technology Technical criteria
Biomass stoves used in households
Capacity between 5 and 50 kW, the fuel used can be
wood chips, pellets, briquettes and logs; boiler
efficiency ≥ 85%
District heating systems
Capacity of 150 to 5000 kW for heating households,
public buildings (schools, hospitals, administrative
centers) and office space; used fuel can be wood chips
and pellets, the boiler efficiency ≥ 80%
Industrial boilers
Capacity 500-10000 kW, the fuel used can be wood
waste in all forms that occur in operation wood-
processing industry (bark, occasional waste wood
chips, sawdust); boiler efficiency ≥ 80%
Stoves in agricultural and food
industry
Capacity of 100 to 5000 kW, the fuel used can be
agricultural biomass in all forms that occur in the
production process (straw, corn stalks, seeds, shells);
boiler efficiency ≥ 80%.
Use of biomass in small furnaces can be the cause of increased particles emissions and, therefore, the
solutions with the district systems having more efficient devices for the emission reduction is
stimulated. Consideration should be made due to the fact that it is not possible to exploit all the
available biomass resources. Namely, of the total biomass produced on agricultural fields, 40% must
be returned to the soil, 30% is used for fodder and on farms and the remaining 30% may be used to

11
This project has received funding from the European Union's Horizon 2020 research and innovation program under grant agreement No. 691763
produce biofuels.
Energy Strategy guidelines regarding solid biofuels [Source: Energy Strategy of the Republic of Croatia,
2009]:
Stimulate development of the Croatian wood processing industry;
Develop forestry and facilitate all forest residues to be utilized;
Stimulate forest cultivation and energy forest cultivation;
Stimulate biomass fired cogeneration plants for heat and electricity generation;
Stimulate usage of biomass for heat production
The Strategy sets goals for year 2020 – to make use of 40% of overall biomass potential (excluding
energy crops), by increasing installed capacity to 140 MW, and for year 2030 – to make use of 72% of
overall biomass potential (from forests and agriculture), by increasing installed capacity to 420 MW.
Objectives of the energy Strategy through the optimal use of mature technologies of RES-E (2020 and
2030):
Table 2 Objectives of the energy Strategy (RES-E)
RES technology 2020 goal:
20% RES share (MW)
2030 goal:
30% RES share (MW)
Total capacity, end-
year 2015
Biomass 140 420 25 MWe (+90)
Waste 40 60 5 MWe
Wind 1200 2000 340 MWe (+400)
Big hydro (>10 MW) 300 reversible hydro
power plants N/A
Small hydro (<10 MW) 100 140 3 MWe (+5)
Geothermal 20 30 0 MWe (+5)
Solar 45 250 43 MWe (+12)

12
This project has received funding from the European Union's Horizon 2020 research and innovation program under grant agreement No. 691763
Figure 4 Projected RES share in total capacity [Source: Energy Strategy of the Republic of Croatia, 2009]
Projected RES shares in gross final energy consumption in 2020. (in percentages) are illustrated in the
following diagram:
Figure 5 Projected RES shares in gross final energy consumption [Source: Energy Strategy of the Republic of Croatia, 2009]
Objectives of the energy Strategy through the optimal use of mature technologies of RES-H (2020)
Total amount of renewable energy for heating and cooling in 2020 is expected to be around 605 ktoe.
Solid biomass (from forests and agriculture) will have a major role, with a share of 64.5%. Of the total
consumption of biomass for heating and cooling 50.7% will account for supply for general
consumption (households, services, agriculture, construction). Solar energy will have a share of 16.1%,
with national target for installation of 0,225 m2 of thermal collectors per capita. Heat pumps will have
a share of 15.8%. The share of geothermal energy in the total renewable energy in heating and cooling
is expected to account for 2.6% by 2020.
0
200
400
600
800
1000
1200
1400
1600
1800
2000
Biomass Waste Wind Big hydro Small hydro Geothermal Solar
Projected RES share in total capacity (MW)
2020 goal 2030 goal 2015
6%
12% 1%
28%
11%
32%
6%
1%
3%
RES share in energy consumption (2020)
Solar
Wind
Small hydro
Big hydro
Biofuels
Biomass
Other
Geothermal
Biogas

13
This project has received funding from the European Union's Horizon 2020 research and innovation program under grant agreement No. 691763
Figure 6 Objectives of the energy Strategy (RES-H) [Source: Energy Strategy of the Republic of Croatia, 2009]
Development of centralized renewable energy heating systems is expected in smaller urban areas
(<10,000 inhabitants), in areas rich with forest biomass and with geothermal potential. Most of these
areas don’t yet have the infrastructure required for local district heating systems, and the
development will have to start from the beginning. The assumption is that the new district heating
systems will be developed in 10 to 15 cities, with a 30 km of new heating pipe network by 2020.
The Strategy sets the goal of using around 84 PJ of RES in 2020:
Table 3 Objectives of the energy Strategy (RES by sector)
Sector Share of RES (%)
Electricity 9,2
Transport 2,2
Heating and cooling 8,6
Energy supply and available resources
Primary energy production and total primary energy supply by sources in Croatia in 2014.
65%
16%
16%
3%
RES for heating and cooling (2020 objective)
Biomass
Solar
Heat pumps
Geotheramal

14
This project has received funding from the European Union's Horizon 2020 research and innovation program under grant agreement No. 691763
Figure 7 Primary energy production [Source: Energy in Croatia, 2014]
Figure 8 Primary energy supply [Source: Energy in Croatia, 2014]
In 2014, the total final energy consumption decreased by 5 percent compared to the previous year. In
2014, the consumption of other renewables increased by 32.5 percent, while the consumption of all
other energy forms decreased. The biggest reduction, expressed as percentage, was recorded in the
consumption of fuel wood and other biomass, amounting to 11.5 percent. Final energy consumption in
households was 93,45 PJ in 2014. Compared to 2013, a decrease in energy consumption in households
amounted to 10.5%.
24%
10%
25%
37%
0%
4%
Primary energy production, 2014 Total 243,77 PJ
Biomass
Crude Oil
Natural Gas
Hydro Power
Heat
Renewables
11%
8%
31% 21%
22%
4%
3%
Total primary energy supply, 2014 Total 402,22 PJ
Biomass
Coal and Coke
Liquid Fuels
Natural Gas
Hydro Power
Electricity
Renewables

15
This project has received funding from the European Union's Horizon 2020 research and innovation program under grant agreement No. 691763
Figure 9 Final energy consumption [Source: Energy in Croatia, 2014]
Installed capacities for heat and electricity generation from renewable energy sources in Croatia for
2014 are shown in the following table.
Table 4 Installed capacities for heat and electricity generation
RES Installed heat capacity
(MW) Installed power capacity (MW)
Solar 113,2* 33,5**
Wind 0 339,3
Biomass 515* 27,3
Small hydro power plants 0 34,2
Geothermal 52,79/124,65 0
[Source: EIHP, HEP, University of Zagreb, Faculty of Forestry – Department of Wood Processing, INA
industrija nafte d.d. – geothermal energy, WGC 2015 – Croatia Country Update 2015 and On – Kolbah
& others]
*estimation
**systems connected to the grid
Installed capacities growth trend for RES-H and RES-E is shown on figures below.
17%
0%
3%
40%
12%
21%
7%
Final energy consumption, 2014 Total 260,54 PJ
Biomass
Other renewables
Coal and Coke
Liquid Fuels
Gaseous Fuels
Electricity
Heat

16
This project has received funding from the European Union's Horizon 2020 research and innovation program under grant agreement No. 691763
Figure 10 Growth trend for RES-H [Source: Energy in Croatia, 2014]
Figure 11 Growth trend for RES-E [Source: Energy in Croatia, 2014]

17
This project has received funding from the European Union's Horizon 2020 research and innovation program under grant agreement No. 691763
Biomass resources: forests and agriculture
Data on forests in Croatia are presented below [Croatian Forests Ltd.]:
Table 5 Forests in Croatia
Forest area 2.688.687 ha 47% of total land area
Forest ownership 2.106.917 ha state forests 78% is state owned
581.770 ha private forests 22% is privately owned
The forests in Croatia cover an area of 47% of land, and the country boasts a well-established wood
industry. In relation to the population, Croatia with 0.56 ha of forest per capita belongs to the top of
European countries by forests. Organization Chart of Forestry in Croatia Forest structure from the
sylvicultural aspect are: high forests (63.9 %), coppices (15.8 %), brushwood, maquis, garigues (19.3 %)
and plantations (1 %). Forests in Croatia are broadleaved (84 %) and coniferous (16 %). Broadleaved
forests consist of the following species of trees (expressed in percentage): beech 36.5 %, pedunculate
oak 13.9 %, sessile oak 10 %, hornbeam 8.2 %, ash 3.3 %, other hard broadleaved 9.9 %, soft
broadleaves 3.8 %, fir 9.3 % and other conifers 5.1 %. [Source: Pentek and Poršinsky, 2010]. Growing
stock amounts to about 400.000.000 m3, annual increment is up to 10.500.000 m3 and the allowable
cut (etat) is around 6.600.000 m3. [Source: Croatian Forests Ltd.]
There are approximately 600 thousand private forest owners in Croatia and privately owned forests
are often linked with a lack of professional knowledge in forest management. Additionally, there are
no strong private forest associations, through which the forest owners would exchange knowledge and
experience, and coordinate forestry interventions. This blocks participation on the market. Parts of
private forests are degraded and require high investments for rehabilitation.
Wood-based fuels used in Croatia are listed below:
Pellets – most widespread modern wood fuel formed by pressing or crushing of sawdust coarse wood
waste or wood chips. A dozen Croatian pellet manufacturers export up to 95% of their products,
around 250.000 tons per year.
Briquettes – preceded the popular pellets and it was used by eco-conscious customers, because of
small difference in price compared to traditional wood fuel.
Firewood – traditional commercial measures for firewood in Croatia is a cubic meter, and it consists of
logs, one meter in length and eight to fifteen centimeters in diameter. Best raw materials for fire wood
is considered hornbeam, followed by beech and other hardwoods.
Wood chips – used for fuel in large industrial heating or production electricity, with a higher
percentage of moisture required in a specially constructed boiler. At the end of 2015. Croatian Forests
Ltd. had contract for 1,2 mil. m3 of wood chips (calorific value of 2,5 MWh/m3), enough to supply
cogeneration plants of total electric power of 60 MW (CHP-E) and heat power of 230 MW (CHP-H).
Of non-wood based biomass used in Croatia, the biggest role has corn residue. Calorific value of
agricultural residues (crop, orchard and wine productions) in the region of Slavonia and Baranja are
illustrated in the following diagram [Source: Ivanović and Glavaš, 2013]:

18
This project has received funding from the European Union's Horizon 2020 research and innovation program under grant agreement No. 691763
Figure 12 Calorific value of agricultural residues [Source: Ivanović and Glavaš, 2013]
Directly derived energy wood from forests, e.g. firewood and wood chips, is directly used for energy
purposes.
Following graphs illustrate the annual quantities of solid biofuels produced and utilized in Croatia. Data
on their main qualities (domestic or industrial) in not available. The production is calculated from
5.302.200 m3 of firewood, density of 445 kg/m3 [Source: Energy in Croatia, 2014]. There is no known
use of olive oil industry residues (olive stones and exhausted olive cake) or nut hulling industry
residues.
Figure 13 Solid biofuels production [Source: Energy in Croatia, 2014]
Solid biofuels utilized are calculated as production minus export plus imports. For the imports and
exports firewood is assumed 15% dry and woodchips 30% dry. Wooden briquettes capacity is
estimated to 64 890 t/yr while its actual production is usually done periodically depending on the
feedstock availability – waste from wood processing industry. Around 62% of the total briquettes
production was exported during 2014. It is assumed that the 38% of pellets produced were utilized
domestically. Total installed capacity for the pellet production is 350.400 t/yr, out of which 55% is
utilized during 2014. Around 72% of the total pellets production was exported while little was placed
on the domestic market. It is assumed that the 28% of pellets produced (table a.3.) were utilized
domestically. [Source: Energy in Croatia, 2014]
0
100
200
300
400
500
Net calorific value of agricultural residues (x1000 toe)
Corn Cereal Soybean Sunflower Orchard Vineyard Tobacco
2.005.557
354.356
43.266 192.275
0
500.000
1.000.000
1.500.000
2.000.000
2.500.000
Solid biofuels production in 2014 (t DM/y)
Firewood Wood chips Wood briquettes Wood pellets

19
This project has received funding from the European Union's Horizon 2020 research and innovation program under grant agreement No. 691763
Figure 14 Solid biofuels utilized [Source: Energy in Croatia, 2014]
Following table indicates solid biofuels use by sector in 2014 [Source: Energy in Croatia 2014, Ministry
of Economy].
Table 6 Solid biofuels use by sector
Sector Total
amount t/y Main type of biofuel used
Comments
Biomass power plants (only electricity)
55,838,8 Wood chips Assumed NCV 12,1 MJ/dm3, density 328 kg/m3, not only
DM
CHP and CHPC plants industrial
sector 2,837,3 Wood chips
Assumed NCV 12,1 MJ/dm3, density 328 kg/m3, not only
DM, additional 1085,6 ktoe for heating and other use in
industry
Residential not CHP
2,104,711,3 Firewood
Assumed density NCV 9 MJ/dm3, 445 kg/m3,
households 1012,9 ktoe, services 3,8 ktoe, not only DM
1.366.445
95.509 16.441
192.275
0
200.000
400.000
600.000
800.000
1.000.000
1.200.000
1.400.000
1.600.000
Solid biofuels utilized in 2014 (t DM/y)
Firewood Wood chips Wood briquettes Wood pellets

20
This project has received funding from the European Union's Horizon 2020 research and innovation program under grant agreement No. 691763
Commercial timber production in 2014 and 2015 [Source: Croatian Bureau of Statistics, 2015]:
Table 7 Commercial timber production
Commercial timber production Manufactured quantities, ‘000 m3
2014 2015
Round wood (total) 4.997 5.179
Coniferous 877 838
Non-coniferous 4.120 4.341
Fuel wood, including wood for charcoal
1.653 1.769
Industrial roundwood (wood in the rough)
3.344 3.410
Sawlogs and veneer logs 2.415 2.451
Pulpwood 918 949
Other industrial roundwood 11 10
An estimation of wood structure of commercial timber sales by assortments is as follows: logs 51.3 %,
thin round wood 0.9%, pulpwood 17.1 % and fuelwood 30.7 %. A large majority of wood products is
sold under pre-set contract/retail arrangements – 90.5 %, by public biddings for domestic market – 4.9
% and by international public biddings (export) – 4.6 % of wood products [Source: Pentek and
Poršinsky, 2010].
Figure 15 Estimation of commercial timber sales by assortments [Source: Pentek and Poršinsky, 2010]
Value and prices of forestry products sold [Source: Croatian Bureau of Statistics, 2015]:
Table 8 Value and prices of forestry products sold
Average price, kuna/m3
Total sale value 315,25
Fuel wood 164,42
Industrial wood 436,72
51%
1%
17%
31%
Estimation of commercial timber sales by assortments
Logs
Thin roundwood
Pulpwood
Fuelwood

21
This project has received funding from the European Union's Horizon 2020 research and innovation program under grant agreement No. 691763
Coniferous logs 368,64
Non-coniferous logs 533,62
The table below indicates the average price for customers of the main solid biofuels – commercial
customers and domestic customers – in 2016. Typical costs are given in EUR per ton, VAT excluded.
Table 9 average price for customers of the main solid biofuels in 2016
Biofuel Commercial
customers €/t Domestic
customers €/t Source Comments
Meter of wood
N/A 90 Njuskalo.hr 25% VAT, delivery included
Bag of pellets (15kg)
N/A 193 Njuskalo.hr 25% VAT
Wood chips 40 N/A Croatian
Forest Ltd. 25% VAT
Wood bricket 110 170 Piljak.hr
Njuskalo.hr 25% VAT
BIOMASSES WITH POTENTIAL INTEREST IN CROATIA
Sustainable forest potential (primary forestry production, field residues and secondary agricultural
residues) can reach up to 3.8m dry tones/year. Sustainable agriculture potential (primary field residues
and tree pruning) can reach up to 2m dry tones/year. Estimated sustainable potential of bio-waste and
post-consumer wood can reach up to 0.6m dry tones/year, and potential of dedicated crops can reach
up to 70.000 dry tones/year [Source: Croatian Forests Ltd.].
Figure 16 Total estimated sustainable potential of solid bio-fuels [Source: Croatian Forests Ltd.]
Research done under S2Biom FP7 project indicates the biomass resources potential form forests in
Croatia – conifers and broadleaves [Source: S2Biom, 2012].
0
500.000
1.000.000
1.500.000
2.000.000
2.500.000
3.000.000
3.500.000
4.000.000
Total estimated sustainable potential (dry tones/year)
Forest Agriculture Bio waste and post consumer wood Dedicated crops

22
This project has received funding from the European Union's Horizon 2020 research and innovation program under grant agreement No. 691763
Figure 17 Forest potential [Source: S2Biom, 2012]
Biomass potential from agriculture is illustrated in the following figures from the available data (olive
plantations, orchard plantations, vineyards – 2014; cereal straw, sunflower stalks, soybean straw and
corn – 2013, based on the assumption that 30% of residues is available for energy use) [Source: Faculty
of Agriculture, University of Zagreb].
Figure 18 Agriculture potential [Source: Faculty of Agriculture, 2013-2014]
3.627 hectares of agriculture area in Croatia is irrigated, while utilized surface of agricultural area was
1.508.885 hectares in 2014 [Source: Croatian Bureau of Statistics].
The following graphs illustrate the annual quantities of biomass resources potential of Croatia that can
be obtained in agro-industry.
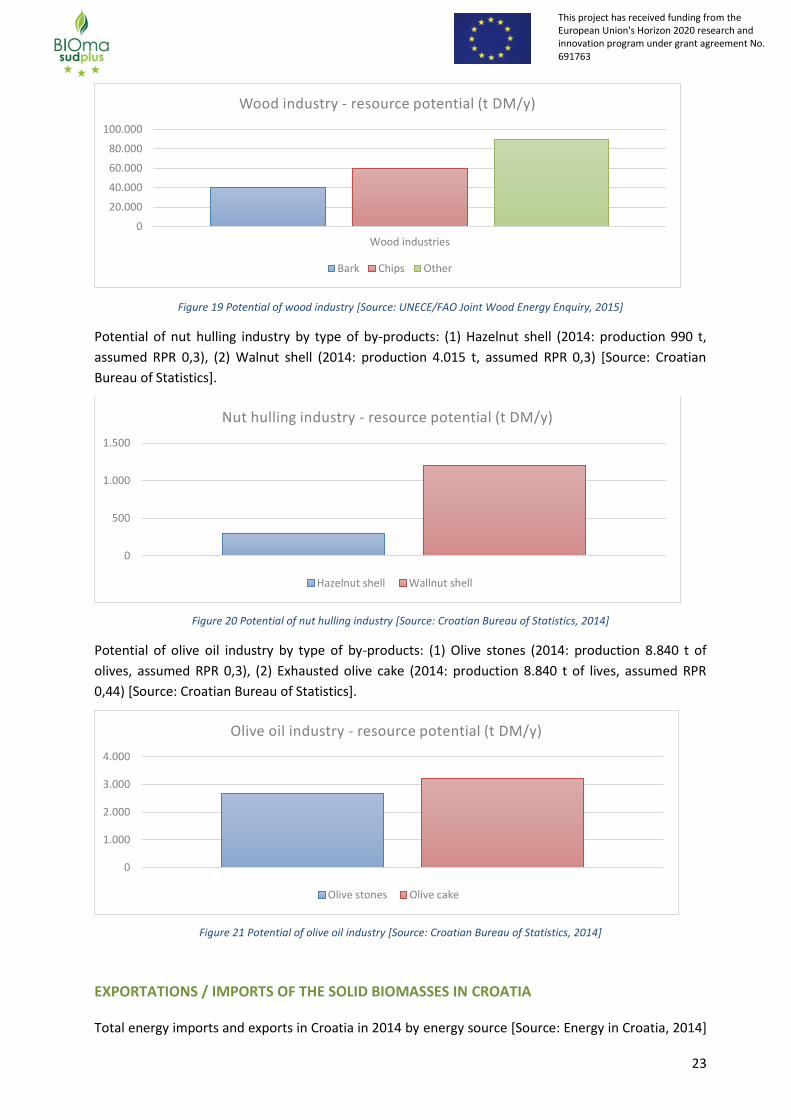
Potential of wood industry by type of by-products: (1) Bark (2013: 131.000 m3, assumption density
180 kg/m3, humidity 15%), (2) Clean wood by-products – chips (2013: 400.000 m3, assumption density
328 kg/m3, humidity 30%), (3) Other – wood residues (2013: 530,000 m3, assumption density 160
kg/m3, humidity 15%). [Source: UNECE/FAO Joint Wood Energy Enquiry, 2015]
0
500.000
1.000.000
1.500.000
2.000.000
2.500.000
3.000.000
3.500.000
Forests
Forest potential (t DM/y)
Conifers Broadleaves
0
100.000
200.000
300.000
400.000
500.000
600.000
Agriculture
Agriculture potential (t DM/y)
Olive plantations Orchard plantations Vineyards Cereal straw
Sunflower stalks Soybean straw Corn
23
This project has received funding from the European Union's Horizon 2020 research and innovation program under grant agreement No. 691763
Figure 19 Potential of wood industry [Source: UNECE/FAO Joint Wood Energy Enquiry, 2015]
Potential of nut hulling industry by type of by-products: (1) Hazelnut shell (2014: production 990 t,
assumed RPR 0,3), (2) Walnut shell (2014: production 4.015 t, assumed RPR 0,3) [Source: Croatian
Bureau of Statistics].
Figure 20 Potential of nut hulling industry [Source: Croatian Bureau of Statistics, 2014]
Potential of olive oil industry by type of by-products: (1) Olive stones (2014: production 8.840 t of
olives, assumed RPR 0,3), (2) Exhausted olive cake (2014: production 8.840 t of lives, assumed RPR
0,44) [Source: Croatian Bureau of Statistics].
Figure 21 Potential of olive oil industry [Source: Croatian Bureau of Statistics, 2014]
EXPORTATIONS / IMPORTS OF THE SOLID BIOMASSES IN CROATIA
Total energy imports and exports in Croatia in 2014 by energy source [Source: Energy in Croatia, 2014]
0
20.000
40.000
60.000
80.000
100.000
Wood industries
Wood industry - resource potential (t DM/y)
Bark Chips Other
0
500
1.000
1.500
Nut hulling industry - resource potential (t DM/y)
Hazelnut shell Wallnut shell
0
1.000
2.000
3.000
4.000
Olive oil industry - resource potential (t DM/y)
Olive stones Olive cake

24
This project has received funding from the European Union's Horizon 2020 research and innovation program under grant agreement No. 691763
are illustrated in the following charts.
Figure 22 Energy import in 2014 [Source: Energy in Croatia, 2014]
Figure 23 Energy export in 2014 [Source: Energy in Croatia, 2014]
At the moment several biomass district heating plants for buildings in cities and municipalities are in
the planning phase. Wood chips are produced with mobile wood chippers at the forest or roadside and
are almost always exported to neighbor countries. Production of wood pellets started in 2006/07 as a
result of fossil fuels prices growth and increased demand for pellets in EU market. Approximately 95%
are exported to EU market mostly in Slovenia, Italy, Germany and Austria.
The Croatian state forests are Forest Stewardship Council (FSC) certified, which is important for the
exportation of wood to neighboring EU member states. The annual supply potential for the total wood
supply from certified forests is almost 6 million m3 per year. At present quality control and quality
assurance standards for processed firewood are not used. The only wood fuel where standards,
certification and quality labels are commonly used are wood pellets. This is due to the industrial
production process and the market demand for these in export markets, where approximately 95% of
the national production is exported. 14 Croatian producers have obtained quality labels (ENPlus)
addressing needs for constant assured quality by the EU customers. [Source: ENplus pellets]
Solid biofuels imported and exported in 2014, by biomass source, are illustrated below [Source:
Croatian Chamber of Economy].
12%
32%
15%
10% 0%
31%
Energy import (total 254 PJ)
Coal and Coke
Petroleum Products
Natural Gas
Electricity
Biomass
Crude Oil
1%
63% 14%
10%
12%
Energy export (total 104 PJ)
Coal and Coke
Petroleum Products
Natural Gas
Electricity
Biomass

25
This project has received funding from the European Union's Horizon 2020 research and innovation program under grant agreement No. 691763
Figure 24 Solid biofuels imported and exported in 2014 [Source: Croatian Chamber of Economy]
(1) Firewood: Main Export in Italy, Slovenia, Hungary, Austria. Main Import from BIH, Slovenia. (2)
Wood chips: Main Export in Hungary, Slovenia, Austria. Main Import from Slovenia. (3) Wood pellets:
Main Export in Italy, Slovenia, Austria. Main Import from BIH. (4) Wood waste: Main Export in
Slovenia, Italy, Germany. Main Import from BIH.
Import prices of fossil fuels and biomass EUR/MWh from 2003 to 2014 are illustrated in the figure
bellow [Source: EIHP].
Figure 25 Import prices of fossil fuels and biomass [Source: EIHP]
656.554
371.202
161.203
42.620 17.441 1.420 3.945 1.027 0
100.000
200.000
300.000
400.000
500.000
600.000
700.000
Firewood Wood chips Wood pellets Wood waste
Solid biofuels imported/exported in 2014 (t DM/y)
Export Import

26
This project has received funding from the European Union's Horizon 2020 research and innovation program under grant agreement No. 691763
MAIN SUPPORTS FOR THE USE OF BIOMASS IN CROATIA
National energy plan recognizes the exploitation of biomass as one of the most important parameters
in the sustainable development of rural areas, waste management, agriculture and forestry.
Croatian rural development program (2014 – 2020) has at its disposal 120.000.000 EUR for specific
forestry measures, such as conversion of degraded stands. Over 7.000 ha of devastated stands could
be transformed into high forests, both in private and state owned areas.
The Environmental Protection and Energy Efficiency Fund (EPEEF) is the central point for collecting and
investing extra budgetary resources in the programs and projects of environmental and nature
protection, energy efficiency and use of renewable energy sources. The Fund grants financial
resources to legal and natural persons for the purpose of financing the activities set out in the Act on
the EPEEF through loans, subsidies, financial assistance and donations.
Planned funds for the implementation of the national energy programs in 2015 were 6.000.000 EUR,
and 98% was realized.
Figure 26 Implementation of the national energy programs [Source: EPEEF, 2015]
27.408.257
39.978.227
44.565.479
0
5.000.000
10.000.000
15.000.000
20.000.000
25.000.000
30.000.000
35.000.000
40.000.000
45.000.000
50.000.000
HR
K
Implementation of the national energy programs
2013 2014 2015

27
This project has received funding from the European Union's Horizon 2020 research and innovation program under grant agreement No. 691763
MAIN PROBLAMATIC OF THE USE OF BIOMASS IN CROATIA
The development of a woody biomass market for energy purposes is still in the early stages. The main
barriers [Source: BioRES, Biomass EuVET] for further development are listed below:
Lack of financial incentives for investing in wood pellets heating and biomass district heating;
Lack of medium and large scale applications of bioenergy production such as district heating, combined heating and power (CHP) utilities;
Insufficient organizational setting of private forest associations and difficult socio-economic situation of forest owners;
Lack of knowledge and technologies for domestic market uptake;
Lack of environmental awareness at all levels (policy makers, businesses, customers, etc.)

28
This project has received funding from the European Union's Horizon 2020 research and innovation program under grant agreement No. 691763
CONCLUSIONS
According to performed interviews of key stakeholders to identify promising biomass market segments
in Croatia (in the frame of Bioenergy4Business project), the biggest potential is in the substitution of
fossil fuels with biomass energy in Food industry and District heating plants [Source: EIHP, 2014].
Biomass accounts for only around 11% of the total primary energy supply in Croatia, and 95% of
produced biomass quantities is exported. Further development of domestic market of solid biofuels,
especially from wood industry, is necessary.
Even though Croatia is approaching national energy targets for 2020 and is following EU regulations,
import of primary energy (especially crude oil, petroleum products and natural gas) and electricity is
high compared to the vast renewable potential that can be unlocked – Croatian coast has on average
from 2,400 to 2,800 sunny hours per year and high wind potential, and close to half of land area of
Croatia is covered by forests.

29
This project has received funding from the European Union's Horizon 2020 research and innovation program under grant agreement No. 691763
REFERENCES
[1] Energy in Croatia, Ministry of Economy, 2014, available at:
http://www.mingo.hr/public/energetika/EuHR_2014_finalna.pdf
[2] Fact Sheet (2016): Woody energy market in Croatia, BioRES, 2016, available at:
http://bioresproject.eu/
[3] Croatian Forests Ltd., available at: http://portal.hrsume.hr/index.php/hr/ume/opcenito/sumeuhrv
[4] Croatian Bureau of Statistics, available at: http://www.dzs.hr/
[5] Croatia’s promising market segments for heating with solid biomass, Energy Institute Hrvoje Požar,
2015, available at: http://www.eihp.hr/
[6] Outlook of lignocellulosic biomass and relevant policies, S2Biom Project, available at:
http://s2biom.alterra.wur.nl/
[7] Faculty of Forestry, available at: http://www.sumfak.unizg.hr/
[8] Faculty of Agriculture, available at: http://www.agr.unizg.hr/
[9] ENplus pellets, available at: http://www.enplus-pellets.eu/
[10] Croatian Wood Cluster, available at: http://www.drvniklaster.hr/
[11] Annual report 2014, Croatian Energy Regulatory Agency, 2014, available at: https://www.hera.hr/
[12] Energy Strategy of the Republic of Croatia, Ministry of Economy, Labour and Enterpreneurship,
2009, available at: http://www.mingo.hr/
[13] National Renewable Energy Action Plan 2020, Ministry of Economy, 2013, available at:
http://www.mingo.hr/

30
This project has received funding from the European Union's Horizon 2020 research and innovation program under grant agreement No. 691763
State of the art of the biomass market. Report of Greece

31
This project has received funding from the European Union's Horizon 2020 research and innovation program under grant agreement No. 691763
INTRODUCTION
Solid biofuels are the most important renewable energy source in Greece, accounting for 6.0% of the
final energy consumption and 69.3% of the final RES consumption in 2014 [1, 2].
Since 2011, the residential heating market in Greece has seen major changes which have also affected
the patterns of biomass consumption as well as its public image. Two main drivers can be identified.
The first was the lifting of a long ban on biomass combustion for central heating in the urban centres
of Greece, which created a favourable framework for the introduction of biomass heating systems [3].
The second is related to the impact of the financial crisis and the fiscal measures associated with the
increase of taxation in the heating oil1, which still remains the main fuel source for heating in Greece.
As a result, many households have sought alternatives to heating oil, including solid biofuels, and
altered their heat consumption patterns, e.g. by switching from central heating to room heating via
stoves. In a sense, biomass use for heating has stopped being a rural habit and reappeared in urban
areas. However, the extensive use of open fireplaces and low quality wood stoves, in combination with
inappropriate fuels such as chemically treated wood, were a major cause of increased PM emissions in
the city of Athens and other urban centres [4].
Additionally, the impact of the financial crisis has stimulated interest in the use of biomass in other
sectors (industrial, agricultural, services). Several industries, greenhouses, etc. have also switched to
biomass use as a means of reducing production costs.
Despite this new interest in biomass, there is still a significant potential of solid biofuels in Greece
which remain unexploited. Overall, the solid biomass consumption per capita is only 0.084 toe/inh
Compared to the EU28 average of 0.180 toe/inh [5].
The present report intends to present the current state of the art of the biomass market in Greece.
The first section is devoted to the main solid biofuels which are already utilized and commercialized in
Greece: firewood, wood pellets, exhausted olive cake and olive stones and other agro-industrial
residues. The next part discusses other types of biomasses, mostly coming from the forestry and
agricultural sectors, which represent a significant potential RES in Greece. The following part discusses
the situation regarding imports and exports of biomass in Greece, followed by a discussion on the
main types of instruments supporting the use of biomass in the country. Finally, the main issues
related to the use of biomass in Greece are discussed and the main conclusions of this study are
presented.
MAIN COMMERCIALIZED SOLID BIOFUELS IN GREECE
The main commercialized solid biofuels in Greece can be grouped in the following main categories:
Firewood
Wood pellets and briquettes
Exhausted olive cake and olive stones
1 The first increase tool place in the fall of 2012: from 60 € to 300 € tax per 1,000 liters. The cost of heating oil for the
residential sector thus increased by 40% compared to the previous year.

32
This project has received funding from the European Union's Horizon 2020 research and innovation program under grant agreement No. 691763
Other biomass types, mostly agro-industrial residues such as nut shells, peach kernels, etc.
Since 1/6/2016, the applicable VAT for solid biofuels in Greece is 24% [6].
Firewood
Firewood is by far the most important solid biofuel consumed in Greece, with the main consumption
being in the residential sector.
A survey performed by the Hellenic Statistical Authority for the heating period 2011 – 2012 reports
that the average thermal energy consumption of a Greek household was 10,244 kWh, while the total
number of households in Greece considered for the survey was 4,166,567 [7]. Firewood is by far the
most important biomass source for households, contributing to 23.8% of the total thermal energy
consumption (876.46 ktoe in total). Alternatively, firewood corresponds to 95.41% of the biomass
used for space heating in the residential sector.
Assuming a typical firewood LHV of 3.40 kWh/kg (corresponding to a moisture content of 30%) [8], the
amount of firewood consumed by households in Greece is estimated at 2,091 kt DM.
Figure 27: Thermal energy consumption of Greek households per fuel type, 2011 – 2012 (Source: Hellenic Statistical Authority)
In order to understand the origin of firewood consumed in Greece, different statistical sources have to
be compared. FAOSTAT [9] reports the following figures for fuelwood production from forests in
Greece for the year 2014:
Coniferous fuel wood: 97,000 m3 (solid volume, underbark). FAOSTAT suggests a solid density
of 625 kg/m3 for coniferous fuel wood.
Non-coniferous fuel wood: 968,000 m3 (solid volume, underbark). FAOSTAT suggests a solid
density of 750 kg/m3 for non-coniferous fuel wood.
In addition to the firewood removed from forests, the Hellenic Statistical Authority indicates that
33
This project has received funding from the European Union's Horizon 2020 research and innovation program under grant agreement No. 691763
464,203 t of firewood from agricultural holdings (e.g. large branches of olive trees, uprooted trees,
etc) were produced in 2010 [10]. This figure is in the same order of magnitude as those reported in
previous years. In all cases, a typical moisture content of 30% can be used to estimate the dry matter
content.
Firewood imports and exports are reported in Section 0 of this study.
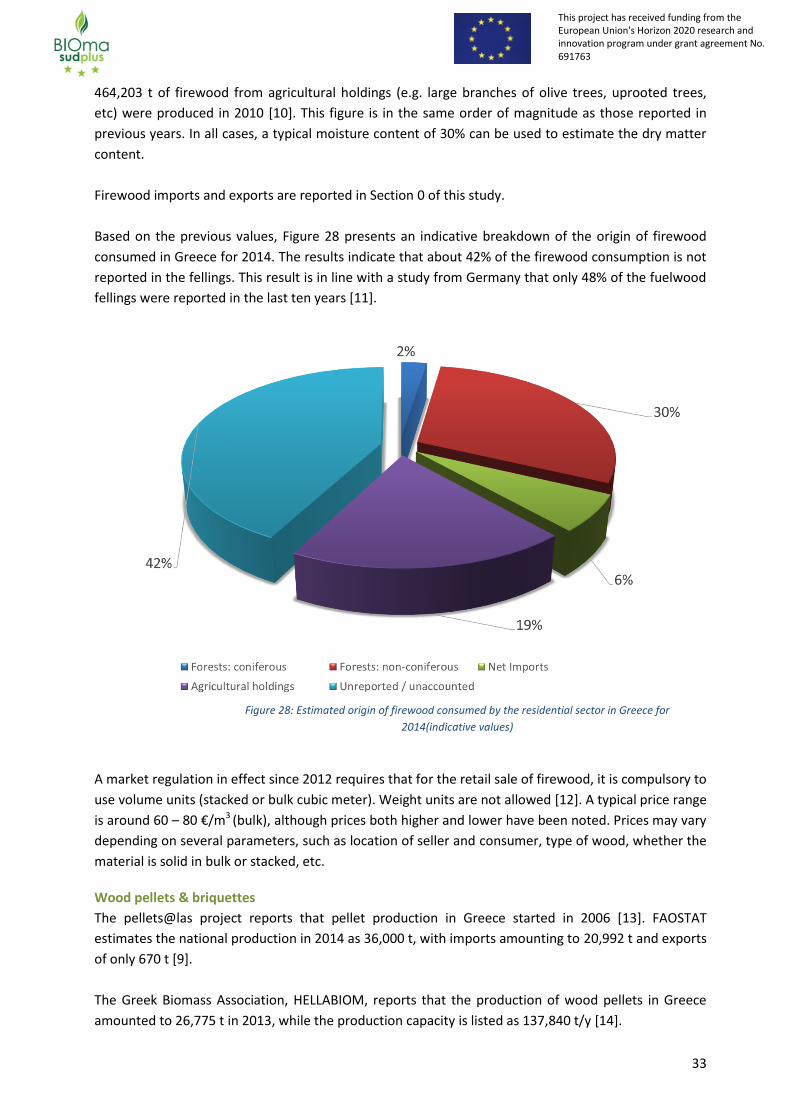
Based on the previous values, Figure 28 presents an indicative breakdown of the origin of firewood
consumed in Greece for 2014. The results indicate that about 42% of the firewood consumption is not
reported in the fellings. This result is in line with a study from Germany that only 48% of the fuelwood
fellings were reported in the last ten years [11].
Figure 28: Estimated origin of firewood consumed by the residential sector in Greece for
2014(indicative values)
A market regulation in effect since 2012 requires that for the retail sale of firewood, it is compulsory to
use volume units (stacked or bulk cubic meter). Weight units are not allowed [12]. A typical price range
is around 60 – 80 €/m3 (bulk), although prices both higher and lower have been noted. Prices may vary
depending on several parameters, such as location of seller and consumer, type of wood, whether the
material is solid in bulk or stacked, etc.
Wood pellets & briquettes
The pellets@las project reports that pellet production in Greece started in 2006 [13]. FAOSTAT
estimates the national production in 2014 as 36,000 t, with imports amounting to 20,992 t and exports
of only 670 t [9].
The Greek Biomass Association, HELLABIOM, reports that the production of wood pellets in Greece
amounted to 26,775 t in 2013, while the production capacity is listed as 137,840 t/y [14].
34
This project has received funding from the European Union's Horizon 2020 research and innovation program under grant agreement No. 691763
According to the Hellenic Statistical Authority, wood pellets correspond to 0.7% of the total thermal
energy consumed in the Greek residential sector or 3.39% of the biomass consumed for space heating
[7]. Assuming typical wood pellet properties (LHV 4.60 kWh/kg and moisture content of 10% [8]), the
wood pellet consumption in the residential sector amounted to 64,951 t for the heating period of 2011
– 2012.
Overall, it is estimated that the annual consumption of wood pellets in the residential sector of Greece
is in the range of 50,000 – 65,000 t from 2011 onwards. This is fairly low for European standards,
however pellet consumption in the residential market exhibits a general upwards trend.
No statistics regarding the wood pellet use in the industrial or other sectors are available. It is
expected that wood pellets consumed by such types of heating system would conform to lower quality
standards.
There is no concrete information about the number of pellets in the Greek market that conform to
quality certification systems such as ENplus or DINplus. It is interesting to note that one Greek
producer of wood pellets (Alfa Wood Nevrokopi AEBE, www.alfapellet.gr) has been awarded the
ENplus certification [15]. The company has a production capacity of 60,000 t/y.
Again, there is no observatory for the market price of wood pellets in Greece. In the heating period of
2016 – 2017, wood pellets marketed as of A1 quality have a typical price range of 290 – 320 €/t (VAT
included). A2 quality pellets are listed with lower prices, around 230 €/t.
Wood briquettes are not as popular as wood pellets; the Hellenic Statistical Authority indicates that
only 0.28% of the biomass consumed for space heating in the Greek residential sector is coming from
wood briquettes [7].
Exhausted olive cake and olive stones
Greece is the third largest producer of olive oil in the EU (after Spain and Italy) [16]; as a result, agro-
industrial biomass residues from the olive oil production process represent a significant potential of
renewable energy sources.
According to a mass balance from the BIOMASUD project [17], olive stones amount to 8.3% of the
weight of the olive, while the exhausted olive cake is 19.7% of the weight. Both quantities refer to dry
basis, since water is given separately in the mass balance. EUROSTAT listed the production of olives for
oil production in Greece as 1,570,930 t in 2014 [16]. Therefore, a preliminary assessment of the
technical potential of the major solid by-products from olive production is as follows:
Olive stones: 130 kt DM
Exhausted olive cake: 309 kt DM
It is worth noting that these numbers may exhibit significant variations from year to year, depending
on the actual production volume of olive oil; for example, in 2015 and 2016, the production of olive oil
was around 60% compared to the 2014 level [16] and the figures above are expected to be reduced
accordingly.
In practice, the separation of olive stones by the Greek olive mills is rare. The standard practice is that

35
This project has received funding from the European Union's Horizon 2020 research and innovation program under grant agreement No. 691763
the olive cake produced by the olive mills is transported to secondary (pomace) mills, where the
material is dried and the residual oil (pomace oil) is extracted using hexane and steam; both
operations require thermal energy which is typically provided by the combustion of the solid by-
product of the process. In most cases, all solid by-products end up in a single fraction, which is
marketed as “kernel wood” or “pirinoksilo”, as it is known in Greek.
The self consumption of kernel wood in the pomace mills is a major contributor to the biomass energy
consumption in the industrial sector. EUROSTAT reports that the final energy consumption of solid
biofuels in the industrial sector was 146.7 ktoe in 2014; of these 73.8% was due to biomass
consumption in the food and tobacco sector; this percentage is consistentely high in all years [2]. It is
expected that the major share of the biomass consumption in the food and tobacco sector is indeed
due to the “kernel wood” self consumption of pomace mills.
The actual level of the self consumption depends on the relative percentage of olive cake from two-
phase olive oil mills that is delivered to the pomace mills. The olive cake produced from two phase
olive mills has a higher water content compared to the three-phase system equivalent and thus
requires higher heat input for drying. The increased penetration of the two-phase olive oil production
process in Greece has therefore resulted in the reduction of available “kernel wood” for other uses.
The Association of Olive Kernel Oil Producers of Greece (SPEL) currently estimates that there is a 60/40
split between the two-phase and the three-phase systems currently. For a typical year in which olive
oil production reaches 250,000 t, the Association estimates that the kernel wood available for the
market is 70,000 and 65,000 t coming from two-phase and three-phase olive mills respectively [18].
(Exhausted) olive cake contributes to 2.34% of the biomass consumption for space heating in the
residential sector; its usage is taking place almost exclusively in rural and semi-rural areas [7]. In urban
centers, the odours associated with pirinoksilo make it a difficult fuel to use without complains.
In 2016, the market price for the exhausted olive cake was in the range of 70 €/t (VAT included); it’s
usually solid either bulk or packed in bags of 20 – 25 kg [18]. Olive stones can be solid for higher prices,
in the range of 150 €/t [19].
A specific requirement that legislation impostes to exhausted olive cake and relative fractions used for
non-industrial applications in Greece is that their oil content should not exceed 2% wt on a dry basis
[20].
Other biomass types
Other types of biomasses amount to the remaining 0.17% of biomass consumption for space heating
in the residential sector [7]. There are no published statistics about the exact types of these materials,
but it is estimated that most of them are agro-industrial residues.
Nut shells are probably the most important such residues for the domestic sector. From these, almond
shells are the most prevalent. In 2013, the production of almonds in Greece amounted to 20,250 t
[21]. Of these, almost the whole quantity was processed in crushing plants, where almond shells are
produced as a by-product. The shell is between 55 – 70% by weight of the whole nut [22], which
means that almond shell production in Greece is a in the range of 11,000 - 14,000 t.

36
This project has received funding from the European Union's Horizon 2020 research and innovation program under grant agreement No. 691763
Walnuts were also produced in significant quantities (21,880 t in 2013). The shell is around 55% of the
nut [22]. However, walnuts are mostly processed manually and there is minimal centralized production
of walnut shells. It is expected that walnut shells are either disposed or used in stoves and fireplaces.
Other types of nuts, such as pistachios and walnuts, exhibit lower production levels. Pistachio shells
are produced by a handful of companies in Greece, but with the current production volumes they are
not expected to exceed 500 t on an annual basis [22].
The market price for nut shells ranges from 65 – 120 €/t [22].
Peach kernels are produced by peach canneries and juice production plants. In 2014, the amount of
clingstone peaches processed by such plants 381,000 t [23]. Peach kernels are about 8% of the weight
of the incoming material, therefore the amount of solid biofuel is estimated to be 30,480 t [24]. Peach
kernels were mostly used by the domestic sector and greenhouses until fairly recently; currently they
are mostly self-consumed by the peach canneries in order to produce thermal energy. Any leftover
quantities that are available on the market are solid in price ranges of 60 – 80 €/t [24].
Cotton ginning residues and rice husk are other types of agro-industrial by-products that are used for
thermal energy production in Greece; however, they are mostly self-consumed at their production
sites and not available as fuels in the market.
BIOMASSES WITH POTENTIAL INTEREST IN GREECE
In this section, we focus on solid biofuels which represent a significant potential energy source in
Greece but which remain currently mostly unexploited. These are divided into the following
categories: a) solid biofuels from the forestry sector and b) solid biofuels from the agricultural sector.
Solid biofuels originating as agro-industrial residues are already being exploited to a significant degree,
as explained in the previous section or represent a potential that is not significant on a national basis
(however, it can be a significant resource on a local level).
For the estimation of biomass potential, the main reference is the biomass supply tool developed by
the S2Biom project [25]. The methodology used for the calculation of the biomass potential is outlined
in detail in a project report [26]. S2Biom considers three main types of potential:
The technical potential represents the absolute maximum amount of lignocellulosic biomass
than is potential available assuming the absolute minimum of technical constraints. These
include the recovery rate for forest residues and stumps
The base potential, which considers also environmental constraints. These take into account
the amount of residues needed to keep the soil organic carbon (SOC) content stable for
agricultural residues or constraints imposed by site productivity, soil and water protection,
biodiversity, etc. for forest biomass.
The user-defined potential which takes into account restraints imposed by current practices
and competing uses.
The S2Biom project provides projections for the year 2020 which come from different models related
to land use, crop yields, etc.
Forest Biomass

37
This project has received funding from the European Union's Horizon 2020 research and innovation program under grant agreement No. 691763
The forest and other wooded area in Greece accounts for 6,539 thousand ha; of these 55% relate to
areas available for wood supply. In contrast, the equivalent EU28 percentage is 73.9% [27]. Generally,
the productivity of Greek forests is considered low, in regards to both the standing volume and the
annual increment. Equally low is the contribution of the forestry sector to the Greek GDP [28].
The S2Biom project provides estimations about the biomass potential from the forest sector in Greece.
The types of biomass considered by the study include the following: a) stemwood from final fellings
and thinnings of non-conifer and conifer trees and b) logging residues from final felling and thinnings
of non-conifer and conifer trees. The methodology for the calculation is based on biomass resource
assessment handbook developed in the Biomass Energy Europe project [29]. Figure 29 and Figure 30
present the potential of stemwood and logging residues in Greece for the year 2020 [25].
Figure 29: Biomass potential from stemwood removal in Greece reported by S2Biom, 2020

38
This project has received funding from the European Union's Horizon 2020 research and innovation program under grant agreement No. 691763
Figure 30: Biomass potential from logging residues in Greece reported by S2Biom, 2020
The total used-defined potential of stemwood, as estimated by S2Biom as 991 and 467 kt DM for non-
conifers and conifer trees respectively. In comparison, it’s interesting to note that using data from
national sources [30] the average roundwood production for the years 2000 – 2010 is 983 and 295 kt
DM for non-conifers and conifers respectively. This indicates that potential for further expansion of
the forest biomass use is mostly related to the utilization of conifer wood. Logging residues can
contribute in total to another 206 kt DM of sustainable biomass potential available for energy
production.
Agricultural Biomass
Utilized Agricultural Land (UAA) in Greece corresponded to 4,856.8 thousand ha, or about 36.8% of the
total land area. From this area, 37.4% corresponds to arable land, mostly used for cereal production
and 19.1% to permanent crops [31].
In the following paragraphs, an estimation of the biomass potential from the agricultural sector is
presented for three main types of biomass: a) herbaceous biomass residues, b) prunings from
permanent plantations and c) energy crops.
Herbaceous biomass residues
Herbaceous biomass residues include straw from cereals, maize stover, sunflower straw and cotton
residues2. The S2Biom project provides estimates for the potential of all types of straw and maize
2 Cotton residues are actually stalks with a wooden texture, but for convenience they are studied along with the herbaceous
biomass residues.

39
This project has received funding from the European Union's Horizon 2020 research and innovation program under grant agreement No. 691763
stover [26]. The approach is based on the use of Residue to Product Ratios (RPRs) from the literature;
for the base potential, restrictions imposed by the need to maintain the soil organic carbon content
are applied, while for the user-defined potential competing uses of straw for animal feeding and
bedding are imposed.
For the calculation of cotton residues a RPR equal to 2 and a typical moisture content of 45% is
considered [32]. For the base potential, a sustainable extraction rate of 50% is considered, while no
competing uses for his material are reported. Cotton production for the year 2014 is taken from
EUROSTAT [16].
Figure 31: Biomass potential from straw and maize stover reported by S2Biom, 2020 and calculated for
cotton residues, 2014
Figure 31 summarizes the main results of the biomass potential for straw, maize stover and cotton
stalks. As can be seen, there is a big reduction of the biomass potential for these residues when
considering the need to maintain SOC content. Additional limitations are imposed in cereal straw
production from the competing uses.
Overall through, around 1.4 million tons DM of straw and maize stover can be sustainably mobilized,
while another 0.4 million tons DM of cotton stalks residues can be considered available for
bioenergy production.
Prunings from permanent crops
Prunings from permanent crops are a major potential source of woody biomass in Greece.
The S2Biom project calculates the technical potential of prunings using a Residue to Surface Ratio
(RSR) that was estimated from the EuroPruning project [33]. The RSR differs depending on the tree

40
This project has received funding from the European Union's Horizon 2020 research and innovation program under grant agreement No. 691763
type and whether irrigation is applied.
Another method to calculate the technical potential is the use of Residue to Product Ratios (RPR). In
order to compare the S2Biom results, RPRs values for several characteristics Greek tree types as
reported in the literature [32] are used along with the fruit yield for the year 2014, as provided by
EUROSTAT [16]. Figure 32 compares the results between the two approaches.
Figure 32: Technical potential from tree prunings in Greece reported by S2Biom, 2020 and calculated
using RPRs for 2014
As can be seen, the two methods are in good agreement for olive tree prunings, while the S2Biom
results are much lower for the other permanent crop types. In any case, prunings are a major
biomass resource for Greece, with estimations of their technical potential ranging from 1.5 to 2.5
million tons DM. This potential is currently mostly underutilized; only larger branches3, mostly from
olive trees, are used as firewood (see also Section 0 of this report). The standard practice for the rest is
either burning in open field fires or mulching and integration in the soil.
The Horizon 2020 uP_running project [34] intends to promote the sustainable use of prunings from
the agricultural sector in several EU countries, including Greece. More information about the potential
of prunings for energy production are expected to be generated within the project.
Energy crops
Unused land in Greece can be considered for the cultivation of energy crops for solid biofuels
production. The S2Biom project reports this potential taking into account the land available for energy
crops cultivation without antagonizing food and feed production as well as projects about the yields
3 Usually, branches with diameter larger than 6-7 cm are used as firewood.

41
This project has received funding from the European Union's Horizon 2020 research and innovation program under grant agreement No. 691763
that can be reached by such crops [26]. The calculation of the base and user-defined potential takes
into account several restrictions, such as the non-use of protected areas, areas with high biodiversity
value and high carbon stock, ban on irrigation water use, etc. Figure 33 presents the potential
estimations of the S2Biom project.
The S2Biom project considers that three herbaceous energy crops are appropriate for the Greek
conditions: miscanthus, switchgrass and giant reed. Overall, there is little difference between the base
and user-defined potential of energy crop. In total, the energy crop potential in Greece is in the range
of 1.1 million tons DM.
Figure 33: Biomass potential from energy crops in Greece reported by S2Biom, 2020
EXPORTS / IMPORTS OF THE SOLID BIOMASSES IN GREECE
The exports and imports of energy in Greece are dominated by petroleum products, which amount to
99.5% and 89.1% of the total amount respectively [1]. EUROSTAT reports imports of solid biofuels
from 2010 onwards [2], however according to FAOSTAT data imports of fuelwood to Greece are
recorded even before that year [9].
According to EUROSTAT, the imports of solid biofuels in Greece amounted to 62.1 ktoe in 2014 [2]. For
the same year, FAOSTAT [9] reported wood fuel imports of 219,643 m3 (solid volume, underbark).
Additionally, wood pellet imported amounted to 20,992 t, with the main import countries being
Austria, Romania, Bulgaria, Albania, Serbia and FYROM [14]. By converting the FAOSTAT values to

42
This project has received funding from the European Union's Horizon 2020 research and innovation program under grant agreement No. 691763
ktoe4, the calculated breakdown of solid biofuels imports per fuel type are presented in the following
figure. The percentage referring to other can be attributed to imports of wood briquettes or sunflower
husk pellets for use in industrial applications, greenhouses, etc.
Figure 34: Estimated breakdown of solid biofuels imports to Greece for 2014
The export of solid biofuels from Greece is much more reduced. EUROSTAT reports total exports
amounting to 1.1 ktoe in 2014 [2]. For the same year, FAOSTAT [9] reports the imports of 3,351 m3
(solid volume, underbark) wood fuel and only 670 t of wood pellets, which mostly go to three
neighboring countries: Italy, Bulgaria and Albania [14]. Exports of exhausted olive cake to biomass
power or CHP plants in other European countries are sporadically reported on the news, but no
comprehensive statistical data are available.
4 A solid density of 725 kg/m
3 (as suggested by FAOSTAT) can be applied in order to estimate the wood fuel import and
export quantities in tons. A value of 3.40 and 4.60 kWh/kg is assumed for the LHV of woodfuel and wood pellets respectively.

43
This project has received funding from the European Union's Horizon 2020 research and innovation program under grant agreement No. 691763
Figure 35: Estimated breakdown of solid biofuels exports from Greece for 2014
Overall, it can be concluded that Greece is a net importing country for solid biofuels.
MAIN SUPPORTS FOR THE USE OF BIOMASS IN GREECE
Support for thermal energy production from biomass
The Programme “Saving at Home” (“Eksoikonomo Kat’ Oikon”) is co-funded by the Greek State and the
European Union through the National Strategic Reference Framework 2007-2013 [35]. The Programme
intends to promote energy efficiency in the residential sector by providing incentives for the
implementation of energy saving measures.
Eligible homes were all houses, apartment buildings and individual apartments that exclusively satisfy
the following criteria:
They were located in areas with a price zone lower than or equal to 2,100 € / sq.m (as of
31.12.2009).
They were classified under the Energy Performance Certificate (EPC) in a category less than or
equal to D.
The target for savings achieved from program interventions was to increase the Class by at least one
category or to achieve primary energy savings of at least 30% of the energy consumption of the
reference building. The total eligible budget per application is 15,000 € (VAT included), including also
energy audits before and after the implementation of the energy efficiency measures and costs for
consultants.
Beneficiaries of the Programme received incentives for the implementation of the actions depending
on their income, as indicated in the following table.

44
This project has received funding from the European Union's Horizon 2020 research and innovation program under grant agreement No. 691763
Beneficiaries category A1 A2 B
Personal Income ≤ 12,000 € 12,000 € - 40,000 € 40,000 € - 60,000 €
Family Income ≤ 20,000 € 20,000 € - 60,000 € 60,000 € - 80,000 €
Incentive 70% Grant
30% Interest-free Loan
(interest rate subsidy
100% up to 31.12.2015)
35% Grant
65% Interest-free Loan
(interest rate subsidy
100% up to 31.12.2015)
15% Grant
85% Interest-free Loan
(interest rate subsidy
100% up to 31.12.2015)
Table 10: Incentives offered by the “Saving at Home” Programme
Eligible actions are grouped in three main categories:
1. Replacement of frames and installation of shading systems;
2. Installing thermal insulation in the building envelope, including roof and pilotis;
3. Upgrading of the heating and hot water production system(s).
Installing a new RES heating system, e.g. a biomass boiler, can be supported in the framework of the
third action, with a maximum eligible cost up to 15,000 €.
It is interesting to note that due to the provisions of the Regulation for the Energy Performance of
Buildings, the replacement of the heating system alone is usually not sufficient to meet the targets of
the Programme, so this intervention has to be combined with other eligible measures, e.g. installation
of a solar system for hot water production.
The Programme has currently used up all its allocated funds and is on hold; it is expected that it will
open again in the first months of 2017 and will target around 40,000 residences.
Other programmes included in the National Strategic Reference Framework may also include the
support of enterprises, public sector, etc. for the installation of biomass heating systems. For example,
the Operational Programme “Environment and Sustainable Development“ allocated a budget of 2 mil.
€ for the installation of biomass systems in municipal buildings [36].
Support for electricity production from biomass
Greece used a feed-in tariff (FiT) system for the financial support of different RESe technologies since
2006 [37]. Since that time, the law underwent several revisions, the most important implemented in
2010 [38], which updated the feed-in tariff system in line with the German EEG model.
Generally, the FiT system employed in Greece distinguished the level of the feed-in tariff received by a
RES producers based on several parameters, the most important being a) the type of technology and
installed capacity of the RES plant, b) whether electricity was supplied to the interconnected mainland
grid or to non-interconnected islands and c) whether the investment was supported by public funds or

45
This project has received funding from the European Union's Horizon 2020 research and innovation program under grant agreement No. 691763
not.
RES producers were paid the FiT through the RES Special Account, managed by the Electricity Market
Operator (LAGIE). Until the end of 2013, the RES special account reached a deficit surpassing 500 mil.
EUR which the Greek government attempted to reduce through several measures, including a revision
of the FiT for RES plants already in operation implemented in 2014 [39] (commonly referred to as the
“New Deal”).
The current support framework for RES electricity in Greece is formed by Law 4414/2016 [40] and is
based on a combination of feed-in premiums (FiPs) and tenders. The Law attempts to further control
fiscal expenses associated with RES support, while also being in line with European Commission’s
Energy and Environmental State Aid Guidelines for the period 2014-2020 (EEAG) and promoting the
national targets for RES production [41].
A major feature of the new support scheme is that RES producers will participate directly in the
wholesale electricity market, while their electricity production will be remunerated at the level of the
Reference Tariffs (RTs), which were calculated so that each RES investors is able to achieve a
reasonable IRR taking into account the levelised cost of electricity (based on typical CAPEX, OPEX,
capacity factors), weighted average cost of capital and accounting rules. The FiP is calculated as the
difference between the reference market price RMP and the RT for each technology and is guaranteed
for a period of 20 years for most RES types [41].
Table 11 compares the level of financial support enjoyed by electricity producers from different types
of biomasses in Greece under the two latest support schemes as well as the installed capacity of
biomass power plants [42].
Type of
installation Capacity
Law
4254/2014 Law 4414/2016 Installed capacity
(MWe) as of Nov.
2016 Feed-in tariff
(€/MWh)
Reference Tariff for
2016 (€/MWh) IRR
Gases released
from landfills
≤ 2 MW 131 129 9% 2.250
> 2 MW 108 106 9% 42.008
Biogas from
anaerobic
digestion
≤ 3 MW 230 225 10% 10.452
> 3 MW 209 204 9% ---
Biomass for
thermal processes
≤ 1 MW 198
184 (combustion or
pyrolysis)
193 (gasification)
9% 2.173
> 1 MW & ≤
5 MW 170 162 9% ---
> 5 MW 148 140 9% ---

46
This project has received funding from the European Union's Horizon 2020 research and innovation program under grant agreement No. 691763
Note: financial support levels indicated are without any type of public support for the investment
Table 11: Comparison of the feed-in and reference tariffs for electricity produced from various biomass types and installed capacity for biomass power plants.
MAIN PROBLEMS FOR THE USE OF BIOMASS IN GREECE
Despite the significant potential of biomass resources in Greece, the per capita consumption of solid
biofuels in one of the lowest in the EU-28 [5]. The benefits of the Mediterranean climate and the lower
thermal energy demands compared to Central Europe are only part of the reasons why this happens.
There are also significant issues associated with the use and mobilization of biomass for energy
production.
One issue that affects the use of biomass in Greece is related to public acceptance. Indeed, the use of
biomass for heating is often associated with the impact of the financial crisis, energy poverty and the
re-appearance of smog in the urban centres of Greece. It should be noted that emissions from biomass
use have indeed been a problem, but they are mostly associated with the combustion of inappropriate
types of biomasses, such as waste wood, in poorly designed heating systems, such as open fireplaces.
In any case, public attitude towards biomass combustion can sometimes be negative.
Market monitoring and certification mechanisms for solid biofuels and related combustion devices are
inadequately implemented. Although the most recent law related to biomass heating in Greece
requires that biomass central heating boilers should conform at least to the emission limits and
efficiency requirements of EN 303-5:2012 Class 3 standard [3], in practice there is no monitoring of the
types of combustion devices that are available on the market. Additionally, although national law
requires that solid biofuels marketed should conform to the quality requirements of the European
Standard EN 15234 [20], in practice many solid biofuels marketed for the domestic or other sectors are
not accompanied by product declaration forms.
Public policies have not succeeded in promoting the use of biomass in Greece; despite the feed-in
tariff regime, the installation of biomass power plants has not gone through and only small-scale
systems (< 1 MW) have been installed. One reason is that the policies in effect target the end-user of
the biomass and fail to take into account the complexities and issues associated with the organization
of biomass supply chains.
Another issue associated with the mobilization of currently unused agricultural biomass in Greece is
the low average size of holdings. Greece was one of the six member states to report an average
surface area per farm below 10 ha for 2013, when the EU-28 average was 16.1 ha [31]. This means
that the amount of biomass an individual farmer can mobilize is quite low, which in turn makes it more
difficult to set-up effective biomass supply chains.
For forest biomass, several issues are reported, such as the lack of investments, distribution of
responsibilities over many different public authorities, lack of funding for the forest service, low
productivity and problematic and inadequate management plants, etc. [28].
CONCLUSIONS
Despite the fact that biomass is the most important RES in terms of primary energy consumption in
Greece, the per capita consumption of solid biofuels is one of the lowest in the EU-28. The main solid

47
This project has received funding from the European Union's Horizon 2020 research and innovation program under grant agreement No. 691763
biofuel used is firewood for the residential sector. Wood pellets have started a quick growth since
2011 but still lag behind the consumption levels of other Mediterranean countries such as Spain and
Italy. Exhausted olive cake is another well-known biomass source especially in the areas associated
with olive oil production, while other biomass types such as nut shells have mostly local importance.
There are several bottlenecks in the growth of the biomass sector; for already utilized solid biofuels
there is a need to promote awareness regarding fuel quality specifications and best practices for their
utilization not only among the general public but also for fuel producers. Regarding the significant
potential in unutilized biomass resources, such as tree prunings, there is a need to promote concepts
for their effective utilization. The activities of the Biomasud Plus project can play a positive role in
mitigating all of these issues.
REFERENCES
1. Eurostat, Consumption of energy. Code: nrg_100a.
2. Eurostat, Renewable energy. Code: nrg_107a.
3. Ministerial Degree 189533 (of Environment, Energy and Climate Change) of 7/11/2011 on the
operation of stationary combustion sources for heating of buildings and water. Government
Gazette Issue Β΄ 2654/9-11-2011. In Greek.
4. Florou K. et al. (2016) The contribution of wood burning and other pollution sources to
wintertime organic aerosol levels in two Greek cities. Atmos. Chem. Phys. Discuss.,
doi:10.5194/acp-2016-721. Available online at: http://www.atmos-chem-phys-
discuss.net/acp-2016-721/acp-2016-721.pdf (Accessed: 19/1/2017).
5. EUROBSERV’ER (2015) Solid Biomass Barometer. Available online at: http://www.energies-
renouvelables.org/observ-er/stat_baro/observ/baro225_en.pdf (Accessed: 19/1/2017).
6. Ministry of Economics, ΠΟΛ.1061/24-5-2016. In Greek.
7. Hellenic Statistical Authority (2013). Development of detailed statistics on Energy
consumption in households-2011/2012: Quality report. Grant Agreement Eurostat n°
30304.2010.002-2010.373. Available online at:
https://ec.europa.eu/eurostat/cros/system/files/SECH_final_report_Greece.pdf
8. Francescato Valter et al. (2008) Woof Fuels Handbook: Production, Quality Requirements,
Trading. Project report of the Biomass Trade Centres project (EIE/07/054).
9. FAOSTAT, Forestry Production and Trade. http://www.fao.org/forestry/statistics/80572/en/
10. Hellenic Statistical Authority. Production of forest products. Years 2009 and 2010.
11. Jochem Dominic et al. (2015) Estimation of wood removals and fellings in Germany: a
calculation approach based on the amount of used roundwood. Eur J Forest Res 134:869–888.
doi 10.1007/s10342-015-0896-9.
12. Market Regulation No 4/28.11.2012. Government Gazette Issue Β΄ 3313/12-12-2012. In Greek.
13. Voulgaraki S. et al. (2009). Pellet market country report: GREECE. Project report of the
pellets@tlas project (EIE/06/020/SI2.448557). Available online at: https://pelletsatlas.info/wp-
content/uploads/2015/09/Greece_CR.pdf (Accessed: 19/1/2017).
14. Hellenic Biomass Association. National pellet production & import / export data for 2012-

48
This project has received funding from the European Union's Horizon 2020 research and innovation program under grant agreement No. 691763
2013.
15. ENPlus. List of certified producters. Available online at: http://www.enplus-
pellets.eu/production/certified-producers/ (Accessed: 19/1/2017).
16. EUROSTAT, Crop statistics (from 2000 onwards). Code: apro_acs_a.
17. Rodero, P., Esteban L., The olive oil industry: Main by-products and their characteristics as
fuels. Presentation from the Biomasud project (SOE2/P2/E414). Available online at:
http://biomasud.eu (Accessed: 19/1/2017).
18. The Association of Olive Kernel Oil Producers of Greece (SPEL), Biomasud Plus project
communication (July 2016).
19. Kanakis Olive Mill, Biomasud Plus project communication (July 2016).
20. Ministerial Decree 198/2013. Solid biofuels for non-industrial use: requirements and testing
methods. Government Gazette Issue Β΄2499/4-10-2013. In Greek.
21. Hellenic Statistical Authority (2016) “2013 ANNUAL AGRICULTURAL STATISTICAL SURVEY”.
Available online at: http://www.statistics.gr/documents/20181/3c4b9b69-c5a5-435a-8a6c-
e1913cb446d1 (Accessed: 19/1/2017).
22. Interviews with various nut processing companies. Biomasud Plus project communication (July
2016).
23. Ministry of Rural Development and Food (2016) Clingstone peach statistics. In Greek. Available
online at:
http://www.minagric.gr/images/stories/docs/agrotis/Oporokipeytika/rodakina/stoixeia_ektas
hs_sybyrino_rodakino241016.pdf (Accessed: 19/1/2017).
24. Greek Canneries Association (EKE), Biomasud Plus project communication (June 2016).
25. S2Biom website, biomass supply tool. Available online at:
http://s2biom.alterra.wur.nl/web/guest/biomass-supply (Accessed: 19/1/2017).
26. Dees Matthias et al. (2016) D1.6: A spatial data base on sustainable biomass costsupply of
lignocellulosic biomass in Europe - methods & data sources. Issue: 1.1. Project report of the
S2Biom project (Grant Agreement n°608622). Available online at:
http://s2biom.alterra.wur.nl/doc/S2Biom_D1_6__version_19_Jan_2017.pdf (Accessed:
19/1/2017).
27. EUROSTAT (2016) Agriculture, forestry and fishery statistics. Available online at:
http://ec.europa.eu/eurostat/documents/3217494/7777899/KS-FK-16-001-EN-
N.pdf/cae3c56f-53e2-404a-9e9e-fb5f57ab49e3 (Accessed: 19/1/2017).
28. Aravanopoulos F. (2014) Yields, management and protection of forest resources and
biodiversity: the nature of the problem and the problems of nature. In Greek. Available online
at: http://symposio-poiaellada.auth.gr/sites/default/files/sections/final-aravanopoulos.pdf
(Accessed: 19/1/2017).
29. Vis M.W., van den Berg D. et al (2010) Harmonization of biomass resource assessments
Volume I: Best Practices and Methods Handbook. Project report of the Biomass Energy Europe
project (FP7/213417).
30. Ministry of Environment, Energy & Climate Change. Special Secretariat for Forests (2014).
Annual report of forest services activities for the year 2011. In Greek. Available online at:

49
This project has received funding from the European Union's Horizon 2020 research and innovation program under grant agreement No. 691763
http://www.ypeka.gr/LinkClick.aspx?fileticket=WZehWVzrNTA%3D&tabid=588&language=el-
GR (Accessed: 19/1/2017).
31. EUROSTAT, Farm structure statistics. http://ec.europa.eu/eurostat/statistics-
explained/index.php/Farm_structure_statistics
32. Apostolakis, M, S. Kiritsis and C. Sooter (1987) The biomass potential from agricultural and
forest residues. ELKEPA, Athens, Greece. In Greek.
33. EuroPruning project (Grant Agreement no 312078). http://www.europruning.eu/
34. uP_running project (Grant Agreement no 691748). http://www.up-running.eu/
35. Saving at Home Programme website. http://exoikonomisi.ypeka.gr/
36. Operational Programme “Environment and Sustainable Development”. Call for submission of
proposals, 27-03-2012. In Greek. Available online at:
http://www.ypeka.gr/LinkClick.aspx?fileticket=csANTJr%2fWjY%3d&tabid=842&language=el-
GR (Accessed: 19/1/2017).
37. Law 3468/2006. Government Gazette Issue A΄ 129/27-6-2006. In Greek
38. Law 3851/2010. Government Gazette Issue A΄ 85/4-6-2010. In Greek
39. Law 4254/2014. Government Gazette Issue A΄ 85/7-4-2014. In Greek
40. Law 4414/2016. Government Gazette Issue A΄ 149/9-8-2016. In Greek
41. Norton Rose Fulbright (2016) Proposed new support scheme for renewable electricity in
Greece. Available online at:
http://www.nortonrosefulbright.com/knowledge/publications/137972/proposed-new-
support-scheme-for-renewable-electricity-in-greece (Accessed: 19/1/2017).
42. Hellenic Electricity Market Operator S.A. (2016) RES and High-efficiency cogeneration
Summary Report – November 2016. In Greek. Available online at:
http://www.lagie.gr/fileadmin/groups/EDRETH/RES/2016_11_RES.pdf Accessed: 19/1/2017).

50
This project has received funding from the European Union's Horizon 2020 research and innovation program under grant agreement No. 691763
State of the art of the biomass market. Report of Italy

51
This project has received funding from the European Union's Horizon 2020 research and innovation program under grant agreement No. 691763
INTRODUCTION
The Gross Final Energy Consumption in Italy is around 120 Mtoes [Figure 1]. The drop in consumption
that has occurred in the last year is related both to the mild winters and the efficiency improvements.
Figure 1: Gross Final Energy Consumption in Italy
In 2015, renewable heat counted more than 21 Mtons, 50% of which was used to produce thermal
energy. As shown in Figure 2, bioenergy is the main source to produce renewable thermal energy.
Figure 2: Bioenergy for heating consumption
The relevance of biomass in the Italian market is also shown in the figure below. Italy is the 4th bioheat
consumer by using biomass within the EU28 area, representing the 9% of the total consumption.
Figure 3: EU28 countries in bioheat consumption

52
This project has received funding from the European Union's Horizon 2020 research and innovation program under grant agreement No. 691763
As previously discussed thermal energy counts more than 50% of the Italian total energy consumption.
The table below goes deeper in details showing which are the main targets of bioenergy consumption
in the Italian market (GSE, 2015). In 2014 273.000 TJ were consumed, corresponding to 6,52 Mtep.
Figure 4: bioheat consumption in the Italian market (GSE, 2015)
2010 (TJ) 2011 (TJ) 2012 (TJ 2013 (TJ) 2014 (TJ)
Direct Consumes:
Residential
Industry
Commercial and services
Agriculture
Derived heat production:
From CHP plants
In 2014, 97% of solid biomass used for thermal energy purposes was delivered to residential users.
Italy is the EU most important residential market for the biomass sector. The main drivers are the
installed biomass stoves (more than 5 million) and new installations, that are revamping the current
market and increasing the share of biomass by replacing the fossil fuelled devices.
Figure 5: energy sources share within independent heating systems (REF-E, 2016)

53
This project has received funding from the European Union's Horizon 2020 research and innovation program under grant agreement No. 691763
MAIN COMMERCIALIZED SOLID BIOFUELS IN ITALY
Wood biomass represents most of solid biofuels commercialized in Italy, counting over 20.000.000
tones/year.
The most common one is wood logs, whose consumption reaches 18.000.000. One over five families
use it as a prevalent fuel to heat its house. Their mean consumption is 3,36 tons per year. Most of the
consumption is in the mountain areas near the Alps and Apennines, besides the north-east area
(Figure 6).
Another common wood biofuel is of course pellet, being Italy the biggest residential market in Europe.
Its annual consumption, related to temperatures and fossil fuels prices, goes from 2.700.000 to
3.200.000 tons per year. It is mainly used in flat regions and islands (Figure 7). Over 4% of Italian
families use wood pellets as main fuel to produce residential heat.
Figure 6: penetration rate of wood logs within Italian families (ISTAT, 2013)

54
This project has received funding from the European Union's Horizon 2020 research and innovation program under grant agreement No. 691763
Figure 7: penetration rate of wood pellets within Italian families (ISTAT, 2013)
Woodchips, whose total consumption does not reach 1 mln tones per year, are still not common in the
residential market.

55
This project has received funding from the European Union's Horizon 2020 research and innovation program under grant agreement No. 691763
BIOMASSES WITH POTENTIAL INTEREST IN ITALY
Biomasses have high potential interest for two main reasons:
as shown in the first paragraph, they give the main contribution to the RES rate in the heat sector
their primary energy price is lower than fossil fuels ones (Figure 8) and the national government is
giving interesting incentives to install new high performing biomass devices
Figure 8: Prices comparison between fossil fuels and biomass, Jan. 2017 (www.aiel.cia.it)
Besides wood logs and wood pellets, there are some agricultural biomasses that are rising interest in
the market. The most promising ones are: olive stones, nutshells, olive tree pruning and vineyard
prunings. It is still hard to estimate their current consumption. Most updated estimations are:
agricultural chips: 90.000 tDM /y
olive stones and exhausted olive cakes: 40.000 and 140.000 tDM /y
nutshells: 90.000 tDM /y
Figure 9: SWOT analysis of the biomasses with highest potential interest (AIEL)

56
This project has received funding from the European Union's Horizon 2020 research and innovation program under grant agreement No. 691763
EXPORTATIONS / IMPORTS OF THE SOLID BIOMASSES IN ITALY
In Italy, the total forest area is 10.600.000 ha. Since the forest removal is lower than the growth, the
BIOFUELS STRENGHTS sco
re WEAKNESSES sco
re OPPORTUNITIES sco
re THREATS sco
re
Presence of productive districts 3
Lack of biofuel standard and
certification scheme 5
Energy independence of farmers and
processing sites 3
Inability to use in the next future
(Ecodesign enters in force in 2020 and
2022) 3
The residue has to be processed
anymore 4
The standardisation is difficult for
small oil mill 4
Availability of solid biomass for
energy in agricultural areas 3
Lack of manufacturers’ interest for the
implementation of suitable stoves and
boilers 5
Logistic of harvesting,
treatments, and supply
consolidate 4
Poor presence of suitable stoves and
boilers (emissions) 3
Consolidate market of this biofuel
although uneven 4
High energy density of biofuel 4
Divergence between offer and
demand for meteorological reasons 4
Standard product, in the case of
industrial oil mill 4
Consolidate processing industry
across Italy 4
Total 23 16 10 8
High availability of forest wood
chips 4
Still very low number of plants
installed per years 5
A certification scheme for wood chips
already existing 5
Natural disasters make very high the
availability of logs and decreasing the
chips price 3
The forest wood chips chain is
mature, both for the biosuels as
well as for chip boilers 5
Increasly availability of chips class B
(thanks to meccanization and
development of forest
enterpreneurs), but still low number
of plants interested to buy this low-
quality wood chips 4
High government incentives for the
next 10 years 5 Social acceptability of pubblic plants 4
It is a virtuous "short-chain" with
important socio-economics
benefits and high added value
for local communities 5
Falling sales of small-medium size
chips plants, decreasing demand of
chips class A1 and A2 4
High market potential: areas still not
covered by natural gas grid, industrial
processes 5 High volatility of fossil fuels price 4
5
High costs of chips plants (expecially
the small-medium size ones) 4
Lowering of Heating Degree Days
(HDD) 4
Logistic of storing and transportation
expensive 4
Still poor information for the potential
market on the actual reliability of
wood chips (Biomass Logistic and
Trade Centres) 4Some areas are still not cover by the
network of professional chips
producers 3
Still low number of professional chips
producers (about 100 in Italy, the
majority is in the North) 4
Total 19 32 15 15
Presence of productive districts 3
Lack of biofuel standard and
certification scheme 5
Energy independence of farmers and
processing sites 3
Inability to use in the next future
(Ecodesign enters in force in 2020 and
2022) 3
Costant and planable production 4
Poor presence of suitable stoves and
boilers (emissions) 4
Availability of solid biomass for
energy in agricultural areas 3
Lack of manufacturers’ interest for the
implementation of suitable stoves and
boilers 5
The residue has to be processed
anymore 5
Consolidate market of this biofuel
although uneven 4 Social acceptability of pubblic plants 4
Logistic of harvesting,
treatments, and supply
consolidate 5
High energy density of biofuel 4
The quality of biofuels is already
quite well standardised 4
Consolidate processing industry
across Italy (i.e. Ferrero) 5
Total 30 9 10 12
High yearly availability 4 Ash content relative high 3
Energy independence of farmers and
processing sites 3
Inability to use in the next future
(Ecodesign enters in force in 2020 and
2022) 3
Presence of productive districts 5
Lack of biofuel standard and
certification scheme 5 Added income for farmers 2
Lack of manufacturers’ interest for the
implementation of suitable stoves and
boilers 5
Costant and planable production 4
Expensive logistic (harvesting,
treatments, supply of plants) 3
Self-consumption chains
environmental and energy friendly 4 Social acceptability of pubblic plants 4
The residue has to be processed
anymore 5
Poor presence of suitable stoves and
boilers (emissions) 3
The controlled combustion of prunings
(industrial plants) make better the air
quality of productive districts 5
The energetic valorisation avoids
the outdoor burning of prunings
(air quality) 5
Availability of solid biomass for
energy in agricultural areas 4
Total 23 14 18 12
High yearly availability, which is
increasing durings last years 4 Ash content very high 5
Energy independence of farmers and
processing sites 3
Inability to use in the next future
(Ecodesign enters in force in 2020 and
2022) 5
Presence of productive districts 4
Lack of biofuel standard and
certification scheme 5 Added income for farmers 3
Lack of manufacturers’ interest for the
implementation of suitable stoves and
boilers 5
Costant and planable production 5
Expensive logistic (harvesting,
treatments, supply of plants) 4
Self-consumption chains
environmental and energy friendly 4 Social acceptability of pubblic plants 4
The residue has to be processed
anymore 5
Lack of suitable stoves and small-
medium boilers, which permits to
burn this biofuels respecting the
emissions limits 5
The controlled combustion of prunings
(industrial plants) make better the air
quality of productive districts 5
The energetic valorisation avoids
the outdoor burning of prunings
(air quality) 5
Availability of solid biomass for
energy in agricultural areas 4
Total 23 19 19 14
Olive Stones
Vineyard prunings
Olive tree prunings
Nut shells
Wood Chips Low primary energy price (20-30
€/MWh) relative to fossil fuels (>
90 €/MWh), high
competitiveness

57
This project has received funding from the European Union's Horizon 2020 research and innovation program under grant agreement No. 691763
forest area is annually increasing at a rate of 0.6%.
Nevertheless, most of the forest biomass used for energy purposes comes from importations.
All the following figures about biomass availability are to be considered per year.
Starting from wood pellets, at least 80% of the national consumption comes from importations (Figure
10). Historically, the main Italian commercial partner is Austria. Then, the share within North America,
Balcans, Baltics and central Europe changes depending on: euro/dollar exchange rate, freight costs,
trucks availability and gasoline prices, stocks levels, etc.
Figure 10: Pellet suppliers’ countries (EUROSTAT)
Big quantities of wood logs are imported as well. Anyway, it comes hard to make a similar analysis
since traceability of importations is still a big issue in our market. Buy the way, about 20% of our
consumption comes from Balkans and eastern countries, that are our main suppliers. Another issue is
the self-consumption of wood logs, which can represent 30-50% of the total consumption.
We don’t have precise data on agricultural biomass, except for olive cakes: at least 100.000 tones are
imported every year. Currently, Spain is one of the main partners.
MAIN SUPPORTS FOR THE USE OF BIOMASS IN ITALY
Italy is probably the EU Country with the major support schemes for biomass, giving to the sector great
opportunities to keep growing.
The Italian legal framework on ThE can be subdivided in two main group of laws and technical
regulations and procedures:
I. White certificates (or “Energy Efficiency Certificates”, EEC)
II. Renewable Energy for Heating & Cooling Support Scheme (or "Thermal Account")
58
This project has received funding from the European Union's Horizon 2020 research and innovation program under grant agreement No. 691763
As concerns the White Certificates (or “Energy Efficiency Certificates” - EEC), these are tradable
instruments giving proof of the achievement of end-use energy savings through energy efficiency
improvement initiatives and projects.
The White Certificates scheme was introduced into the Italian legislation by the Ministerial Decrees of
20 July 2004, as subsequently amended and supplemented. Under the scheme, EE and natural-gas
distributors are required to achieve yearly quantitative primary-energy saving targets, expressed in
Tonnes of Oil Equivalent (TOE) saved.
Each certificate is worth 1 TOE saved. EE and gas distributors may fulfill their obligation by
implementing energy efficiency projects entitling to White Certificates or by buying White Certificates
from other parties in the Energy Efficiency Certificates Market that is organized by GME.
High-Efficiency Cogeneration (HEC) units may access the White Certificate scheme under the terms,
conditions and procedures established by the Ministerial Decree of 5 September 2011. This Decree
enacted by the Minister of Economic Development of 5 September 2011 established criteria and
procedures for supporting high-efficiency combined heat & power (or cogeneration) plants through
the issuing of White Certificates of type II (TEE II-HEC) by GSE S.p.A. This point deserves further
examination. Combined heat & power generation (CHP) or co-generation provides significant energy
savings compared to separate generation. The criteria for qualifying generating units as high-efficiency
CHP (HEC) are set out in the Ministerial Decree of 4 August 2011, effective from 1 Jan. 2011. This
decree completed the transposition of Directive 2004/8/EC, started with Legislative Decree no. 20 of
2007, into the Italian legislation. CHPu qualified as high-efficiency CHP (HEC) have access to the Energy
Efficiency Certificates (EEC, in Italian “TEE” or White Certificates) scheme, on the terms and conditions
and under the procedures specified in the Ministerial Decree of 5th September 2011. In the context of
the Ministerial Decree of 5th September 2011, GSE carries out the following activities:
Qualifying HEC plants
Determining the number of White Certificates to be issued to HEC qualified units whose
owners have applied for this form of support
Buying back White Certificates in response to a request made by a producer - at a price equal
to the one applicable on the date of commissioning of the unit (or on the date of entry into
force of the Ministerial Decree of 5th Sept. 2011 in the case of units already in operation);
Carrying out activities of verification and monitoring of the supported plants and notifying the
Ministry of Economic Development and the producer of their outcome;
Issuing the Guarantee of Origin of EE from HEC in compliance with Legislative Decree no. 20 of
2007.
This applicable legislative/regulatory framework was recently changed by the Ministerial Decree 28th
December 2012 (the so called "White Certificates" decree, which sets national quantitative energy-
saving targets - incremental over time - for EE and gas distributors for the years 2013-2016.
The measures introduced by the "White Certificates" decree aim at strengthening the overall
effectiveness of the White Certificates scheme, confirming the priority that the national energy
strategy assigns to energy efficiency. Energy efficiency is a vehicle to attain all the targets of
cost/competitiveness, security, growth and environmental quality, as well as the EU target of
reduction of primary energy consumption by 2020. First of all, the decree sets national quantitative
energy-saving targets to be pursued - under the White Certificates scheme - by EE and gas distributors
in the above mentioned four year period (2013-2016). The Ministerial Decree also lays down criteria,
terms, conditions and procedures for implementing end-use energy efficiency initiatives or projects to
be supported through the issuing of White Certificates. Moreover, the Ministerial Decree approves 18

59
This project has received funding from the European Union's Horizon 2020 research and innovation program under grant agreement No. 691763
new technical datasheets to quantify primary energy savings. The datasheets have been prepared by
Italian ENEA - National Agency for New Technologies, Energy and Sustainable Economic Development.
These datasheets may be used to submit standardized and analytical requests for verification and
certification. Additionally, ENEA and Energy SystemRSE Research - RSE may - at the request of GSE -
develop additional datasheets for measuring, verifying and quantifying energy savings from projects in
the following sectors: IT/ICT and telecommunications, heat recovery, solar thermal Concentrated solar
power (CSP), water purification and EE distribution systems.
The Premiums, expressed in terms of multiplicative factors of the White Certificates issued, are also
envisaged to support large-scale projects (infrastructure, industry, transport) capable of yielding
significant volumes of energy savings.
The role of the GSE in this complex legislative framework consists mainly in managing, evaluating and
certificating the savings associated with energy efficiency projects under the White Certificates
scheme. This task has been transferred from AAEGSI - Authority for Electric Energy, Gas and Water
System to GSE on February 3rd 2013. In carrying out this activity, GSE relies on support from ENEA and
RSE, each within the scope of its expertise. Furthermore, with the support of ENEA, GSE also verifies
the technical and administrative aspects of the implementation of projects that have obtained White
Certificates. To do so, GSE randomly checks whether the implemented project complies with the
approved project and conducts site inspections during the implementation or useful lifetime of the
project.
GSE will assess the project proposals (PPPM) and the requests for verification and certification (RVC)
that eligible parties will submit after February 4th 2013 through the "Energy Efficiency" application.
AEEGSI will complete the assessment of the project proposals and metering programs (PPPM) filed by
eligible parties and processed by AEEG until January 3rd 2013. Moreover, AEEGSI will retain
responsibility for assessing and certifying the requests for verification and certification (RVC)
submitted before February 2nd 2013.
On February 2nd 2013, the information system for the management of the scheme was transferred to
GSE. Consequently, GSE will use this system to issue White Certificates in respect of the RVC approved
by AEEG after 1 Feb. 2013.
As regards the eligible parties, these can be classified as follows:
• “Obliged parties” are subject to the obligation of achieving yearly national quantitative energy
efficiency improvement targets. Obliged parties may fulfil their obligations by implementing energy
efficiency projects - and receiving White Certificates - or by buying White Certificates from other
parties.
A. EE distributors with over 50,000 final customers connected to their distribution grids as of 31st
December of two years preceding each year of obligation;
B. Natural-gas distributors with 50,000 final customers connected to their distribution network as
of 31st December of two years preceding each year of obligation
• "Voluntary parties” are eligible for the White Certificates scheme and may submit energy
efficiency projects:
Energy service companies (ESCos)
Companies subject to the obligation of appointing an energy manager
Companies controlled by obliged distributors
EE or gas distributors not subject to the obligation
Companies operating in the industry, services, agriculture, transport and public-service
sectors, including government bodies, provided that they have appointed a person in charge
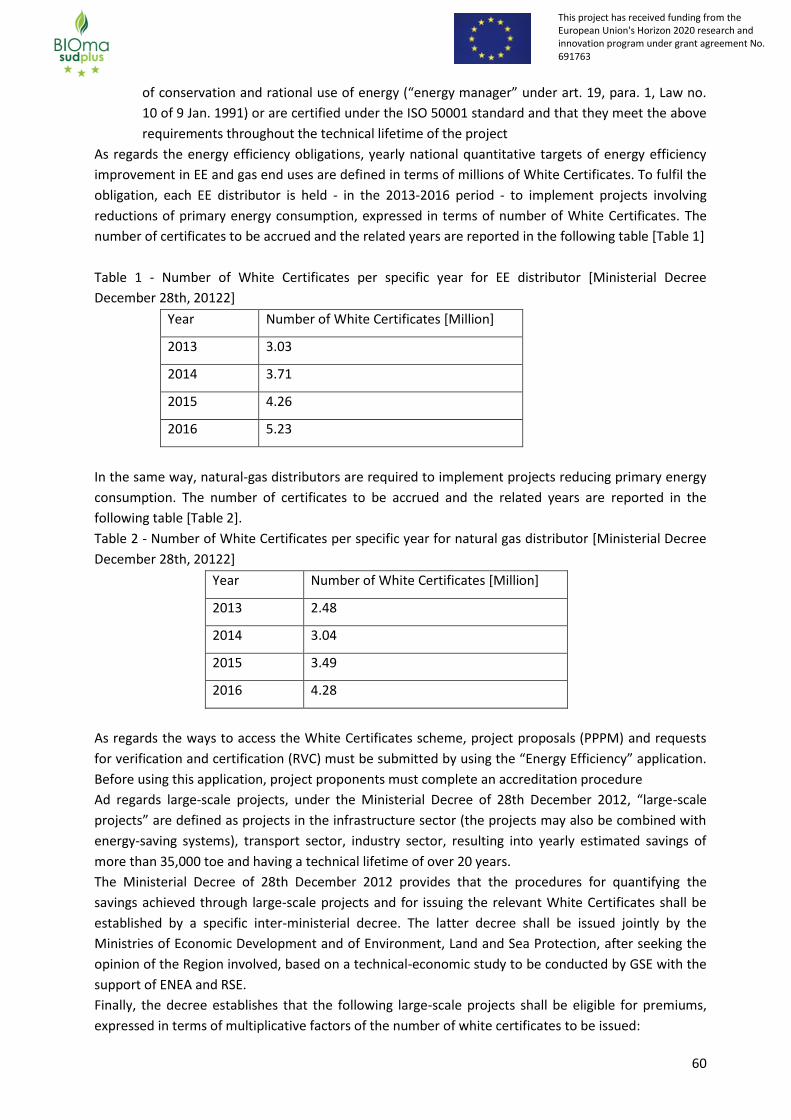
60
This project has received funding from the European Union's Horizon 2020 research and innovation program under grant agreement No. 691763
of conservation and rational use of energy (“energy manager” under art. 19, para. 1, Law no.
10 of 9 Jan. 1991) or are certified under the ISO 50001 standard and that they meet the above
requirements throughout the technical lifetime of the project
As regards the energy efficiency obligations, yearly national quantitative targets of energy efficiency
improvement in EE and gas end uses are defined in terms of millions of White Certificates. To fulfil the
obligation, each EE distributor is held - in the 2013-2016 period - to implement projects involving
reductions of primary energy consumption, expressed in terms of number of White Certificates. The
number of certificates to be accrued and the related years are reported in the following table [Table 1]
Table 1 - Number of White Certificates per specific year for EE distributor [Ministerial Decree
December 28th, 20122]
Year Number of White Certificates [Million]
2013 3.03
2014 3.71
2015 4.26
2016 5.23
In the same way, natural-gas distributors are required to implement projects reducing primary energy
consumption. The number of certificates to be accrued and the related years are reported in the
following table [Table 2].
Table 2 - Number of White Certificates per specific year for natural gas distributor [Ministerial Decree
December 28th, 20122]
Year Number of White Certificates [Million]
2013 2.48
2014 3.04
2015 3.49
2016 4.28
As regards the ways to access the White Certificates scheme, project proposals (PPPM) and requests
for verification and certification (RVC) must be submitted by using the “Energy Efficiency” application.
Before using this application, project proponents must complete an accreditation procedure
Ad regards large-scale projects, under the Ministerial Decree of 28th December 2012, “large-scale
projects” are defined as projects in the infrastructure sector (the projects may also be combined with
energy-saving systems), transport sector, industry sector, resulting into yearly estimated savings of
more than 35,000 toe and having a technical lifetime of over 20 years.
The Ministerial Decree of 28th December 2012 provides that the procedures for quantifying the
savings achieved through large-scale projects and for issuing the relevant White Certificates shall be
established by a specific inter-ministerial decree. The latter decree shall be issued jointly by the
Ministries of Economic Development and of Environment, Land and Sea Protection, after seeking the
opinion of the Region involved, based on a technical-economic study to be conducted by GSE with the
support of ENEA and RSE.
Finally, the decree establishes that the following large-scale projects shall be eligible for premiums,
expressed in terms of multiplicative factors of the number of white certificates to be issued:

61
This project has received funding from the European Union's Horizon 2020 research and innovation program under grant agreement No. 691763
Projects involving significant technological innovations and sizeable reductions of emissions
into the atmosphere (premium of up to 30% of the value of the project);
Projects implemented in metropolitan areas and yielding yearly energy savings of 35,000-
70,000 toe (premium of up to 40% of the value of the project);
Projects implemented in metropolitan areas and yielding yearly energy savings of more than
70,000 toe (premium of up to 50% of the value of the project).
As regards the cumulability with other forms of support, White Certificates issued in respect of
projects filed after the 3rd of January .2013 cannot be cumulated with other forms of support (of
whatever name) concerning EE and gas tariffs and with other government incentives, except for
guarantee funds, revolving funds, loans, exemption from company tax for the purchase of machinery
and equipment.
Update information is always available at the website http://www.gse.it/it/CertificatiBianchi/
As concern the Renewable Energy for Heating & Cooling Support Scheme (or "Thermal Account"), the
Ministerial Decree of 28th December 2012 (the so-called “Renewable Energy for Heating & Cooling
Support Scheme”) implemented Legislative Decree no. 28 of 3rd March 2011 on a scheme of support
for small-scale projects of energy efficiency improvement and production of thermal energy from
renewables.
The GSE is the body in charge of implementing and managing the scheme, as well as of awarding
financial incentives.
Eligible projects concern:
energy efficiency improvements in existing building envelopes (thermal insulation of walls,
roofs and floors, replacement of doors, windows and shutters, installation of solar screens);
replacement of existing systems for winter heating with more efficient ones (condensing
boilers);
replacement and, in some cases, construction of, new renewable-energy systems (heat
pumps, biomass boilers, heaters and fireplaces, solar thermal systems, including those based
on the solar cooling technology).
The new Ministerial Decree of 28th December 2012 also introduces - subject to specific requirements -
incentives for energy auditing and energy certification associated with the above projects.
The support is granted on the basis of the type of project and on the improvement of the energy
performance of the building which may be achieved and/or on the energy which may be produced by
renewable-energy systems.
The incentive (contribution to the costs incurred for the project) will be paid in yearly instalments over
a variable support period (1 to 5 years), depending on the projects.
The decree allocates funds for a maximum yearly cumulative disbursement of € 200 million for
projects implemented or to be implemented by public administrations and a yearly cumulative
disbursement of € 700 million for projects implemented by private parties. 60 days after reaching the
above limits, no new applications for support will be accepted. Public administrations may “book”
incentives for their projects under a special procedure. The yearly cumulative disbursement allocated
for public administrations opting for this procedure will not exceed € 100 million (50% of the € 200
million allocation for public administrations). The incentives will be subject to periodical revision
pursuant to Legislative Decree 28/2011.
Two types of parties are eligible for this support scheme:
I. Public administrations

62
This project has received funding from the European Union's Horizon 2020 research and innovation program under grant agreement No. 691763
II. Private parties: individuals, apartment block owners and parties with business or agricultural
income
The recipient of the support is defined as “Responsible Party”, i.e. the party who/which incurs/has
incurred the costs for implementing the projects. The responsible party may also authorize another
party to submit the application for the incentive and to handle contractual relations with GSE.
Two categories of projects are eligible for the incentives introduced by the Ministerial Decree of 28th
December 2012:
Energy efficiency improvement projects (public administrations may apply for incentives for
this category of projects)
Small-scale projects concerning systems for production of ThE from renewables and high-
efficiency systems (public administrations as well as private parties may apply for incentives for this
category of projects).
The incentive will be limited to the portion of the project exceeding the one required for complying
with the obligation of integrating renewables into new buildings and existing buildings subject to
major renovations (as per Legislative Decree 28/2011) and for obtaining the building license.
In order to apply for support, according to the Legislative Decree 28/2011, the incentive is paid by GSE.
To this end, GSE has developed a dedicated Internet portal, through which interested parties may
apply for the incentive and upload the required documents.
In particular, the responsible party will have to complete an application form specifying the data of the
building where the project is to be implemented and the features of the project. These data will
enable GSE to check whether the responsible party meets the technical requirements indicated in the
decree and to calculate the incentive.
For projects replacing existing winter heating systems with systems equipped with heat pumps or
biomass heaters having an overall nominal thermal capacity of more than 500 kWth and of up to 2
MWth, the responsible party must file an application with GSE in order to be enrolled into the
appropriate electronic registries.
As regards the cumulability with other forms of support, the incentives may be granted only for
projects which do not benefit from other forms of government support, except for guarantee funds,
revolving funds and loans. For publicly-owned buildings for public use, the incentives introduced by
the Ministerial Decree of 28th December 2012 may be cumulated with grants, in accordance with
national and EU legislation. The incentives may be awarded for projects benefiting from other non-
government incentives which may be cumulated, in accordance with the applicable national and EU
legislation.
Update information is always available at the website http://www.gse.it/it/ContoTermico/Conto
Termico 2.0
Other opportunities are given thanks to tax credits, that can be obtained in case of energy efficiency
requalification of the building. Tax credits can be up to 50% or 65% of the total investment. They are
provided in a 10 years time, depending on the investor’s fiscal capacity declared through the Income
tax return. Tax credits are handled by the Tax Revenue Agency and subjected to annual revisions.
A complete overview of the national support schemes for biomass can be found in
http://www.energiadallegno.it/incentivi/
MAIN PROBLEMATIC OF THE USE OF BIOMASS IN ITALY

63
This project has received funding from the European Union's Horizon 2020 research and innovation program under grant agreement No. 691763
Current main problems related to biomass use in Italy are:
a. Air quality and local bans
Especially in the Po Valley regions, air pollution and the impact of heating systems has become a big
issue. The impact of biomass systems to air quality is mainly related to the heating system age and
performances, its installation and maintenance, the quality of the biomass that is used in it.
Some studies carried in Lombardy and Veneto regions show how the improvement of these factors
can have a relevant impact to the environment:
- The emissions of PM10 coming from the biomass combustion have been reduced in Italy of almost 6%
in the last 15 years (AIEL 2016). It has been particular significant in these two regions: -30% in 5 years
in Lombardy and -20% in 8 years in Veneto (ARPAL and ARPAV 2016)
- The use of certified pellet (i.e. ENplus) reduces PM10 emissions of 2-4 times (Politecnico di Milano,
Caserini et al., 2014)
- In areas where was promoted and supported the replacement of outdated stoves with new generation
heating appliances has been measured a reduction of PM2.5 up to 27% (AIEL 2015)
- The replacement of traditional firewood stoves with advanced pellet stoves may lead to a reduction of
PM2.5 between 14-50% in winter (AIEL 2015).
b. Public opinion and fossil fuels lobbies:
Public opinion is of course a strategic factor, with high influence on the market and to politics actions.
Especially in the last years, when biomass use has become even more relevant, fossil fuels lobbies had
increased their efforts to negatively influence the public opinion.
To cope with this threat, it is important to respond to their arguments by supporting a sustainable use
of biomass, increasing the quality of the installations, heating systems and biofuels, showing the
positive socio-economic impacts of the biomass sectors.
As a consequence, the role of national associations and quality schemes are becoming even more
relevant.
CONCLUSIONS
This report clearly shows the relevance of the biomass use in our country, especially where addressed
to the residential market. Expectations say that in the coming 5 years biomass will keep being the
most relevant source to maintain the quota of RES for heat production (GSE 2016).
Main drivers will keep being the cost advantage of biomass fuels prices compared to fossil ones and
the extension of the support scheme Conto Termico.
A driver that has to be enhanced and valued is quality, that has to be applied along all the supply chain
(from fuels to appliances) in order to be effective.
These are the basis of the development of the pellet and wood logs markets in Italy. The same
principle should be valuable to support the development of the Mediterranean agricultural fuels
supply-chain as well. Anyway, since these are still emerging markets, further studies on quality and
market potentials should be carried on.

64
This project has received funding from the European Union's Horizon 2020 research and innovation program under grant agreement No. 691763
State of the art of the biomass market. Report of Portugal

65
This project has received funding from the European Union's Horizon 2020 research and innovation program under grant agreement No. 691763
INTRODUCTION
Renewable energy has made strong progress in Portugal over the past decade and the country has
become one of Europe’s leaders in terms of use of renewable energy sources (RES) such as wind and
micro-generation.
Renewable energy accounted for 25.4% of Portugal’s total primary energy supply (TPES) in 2014. This
share is made up of biofuels and waste (12.6%), hydro (6.4%), wind (4.9%), geothermal (0.8%) and
solar (0.6%).
The renewable energy as a percentage of TPES, 1973-2014 is presented in the figure below. [1]
Renewable energy as a percentage of total primary energy supply, 1973-2014 Figure 1 -
Almost 27% of biofuels and waste go into electricity and heat production with the remainder used in
industry (36.7%), households and businesses (15%) and transport (10.9%). Electricity from renewable
sources amounted to 31.9 terawatt-hours (TWh) in 2014, or 61.3% of total generation. The share of
biofuels and waste in electricity generation was 6.4% of RES electricity.
With regard to energy consumption in households (excluding fuels used in vehicles), according to the
2010 Survey on Energy Consumption in Households (ICESD 2010), Portugal witnessed a change in
habits in the last decades. Electricity emerged as the main source of energy consumed in households,
representing 42.6% of the total energy consumption. Firewood was the second main consumed
energy source in Portuguese households, with a weight of 24,2% in total energy consumption in
homes, stress being laid on its loss of importance in the past few years (60,3% in 1989 and 41,9% in
1996). [2] [3]

66
This project has received funding from the European Union's Horizon 2020 research and innovation program under grant agreement No. 691763
Distribution of energy consumption in households by source type -Portugal, 1989, Figure 2 -
1996 and 2010 [4] [2]
According to the ICESD 2010, the main sources of energy used for space heating were, in descending
order of importance (in terms of consumption in toe), biomass, heating oil, electricity and LPG.
Biomass, mainly firewood, is the most common fuel, which represents about 68% of total energy
consumption for space heating.
A breakdown of the distribution of energy consumption in households for space heating by source
type is given in the following picture. [2]
Energy consumption in households for space heating by source type [2] Figure 3 -
Focusing now on the main source of this biomass, according preliminary results of the 6th Nacional
Forest Inventory [4], in Portugal Continental the forest occupies about 3,15 million hectares,
representing 35,4.8% of the mainland, being the dominant use of soil. This percentage of forest use
puts Portugal in the middle of the 27 countries of the European Union (37,6%, SOEF, 2011 [5]).
The bushes and pastures represents the 2nd soil class use (32%), it stands out the bushes areas, that
represents about 1,5 millions of hectares.
Soil use distribution in Continental Portugal [6] Figure 4 -
Electricity 13,90%
Charcoal 0,04%
Solar thermal 0,30%
Biomass 67,60%
LPG 2,56%
Natural gas 1,50%
Heating oil 14,10%
Forest 35%
Bushes and Pastures
32%
Agriculture 24%
Inland water 2%
Urban 5%
Unproductive 2%

67
This project has received funding from the European Union's Horizon 2020 research and innovation program under grant agreement No. 691763
Concerning the national forest cover, the most representative forest species are eucalyptus
(Eucalyptus globulus), with 812 thousand hectares, the cork oak, with 737 thousand hectares, and the
maritime pine (Pinus pinaster), with 714 thousand hectares, which together represent 72% of the total
forest area.
Other species with significant expression are holm oak (Quercus ilex), with 331 thousand hectares, and
stone pine (Pinus pinea), with 176 thousand hectares.
Forest area by specie/species group [6] Figure 5 -
Maritime pine 24%
Stone pine 6%
Other conifers 2%
Eucaliptus 27%
Cork oak 23%
Holm oak 11%
Chestnut 1%
Other broadleaves
6%

68
This project has received funding from the European Union's Horizon 2020 research and innovation program under grant agreement No. 691763
MAIN COMMERCIALIZED SOLID BIOFUELS IN PORTUGAL
Wood (firewood, wood chips, pellets and briquetes) is the most important solid biofuel source in
Portugal. It is traditionally used for heating. According to the data available on solid biofuels produced
in the country, wood represents about 94% of the total production.
The following figure indicates the annual quantities of wood utilised in the country and their main
destination: domestic-residential or industry and farms.
Annual quantities of wood utilised Figure 6 -
Firewood is the most common and known solid biofuel fuel in Portugal. According to the data, the
annual production of firewood in Portugal amounts to 1.620.000 tons/year (INE, 2015). The largest
consumers of firewood are the residential and service sectors with a total consumption of 1.056.240
tons/year, which represents 65% of the total consumption of this solid biofuel.
However, a significant part of the firewood trade is still in the parallel market and is not quantified.
In recent years, the production and use of pellets had a great development in the country. Presently,
according to the Portuguese Pellet Association (ANPEB), Portugal has about 26 pellets plants, and the
estimated production capacity is 1.400.000 ton/year, being the effective production of about
1.034.000 ton/year. Only about 20% of the production is destined for domestic consumption, the
remaining 80% is exported to several markets such as Spain, the United Kingdom and Benelux,
representing a business volume of around 116 million euros. [7]
1.056.240
563.760
1.620.000
594.000
440.000
1.034.000
0 0
732.000
Domestic quality Industrial quality Total production
Firewood Wood pellets Wood chips

69
This project has received funding from the European Union's Horizon 2020 research and innovation program under grant agreement No. 691763
BIOMASSES WITH POTENTIAL INTEREST IN PORTUGAL
The following figure indicates the annual quantities of solid biofuels produced in the country.
Annual quantities of solid biofuels produced in the country Figure 7 -
As already mentioned before, wood (firewood, wood chips, pellets and briquettes) represents about
94% of the total solid biofuels produced in the country, according to the available statistical data.
The olive stones and olive cake, once the excess moisture is removed, are used directly as fuel in
certain industries for a long time ago. Additionally, the demand for olive stones on the residential and
services market is increasing. For example, the use of olive stones in small and medium capacity
biomass appliances is replacing wood pellets in some cases. Consequently, the consumption of olive
stones with controlled quality has a significant potential in Portugal in this sectors.
Concerning the different types of nut shells, according to the “BIOMASS INVENTORY ON THE SUDOE
SPACE”, realized in the previous BIOMASud project [8], in Portugal the quantity of nut shells available
from this agro-industry is low compared with the total production of almond, pinion, walnut and
hazelnut. Effectively, most of these fruits are exported to other markets without being processed (i.e.
with shells). Nut shells available are typically consumed by the crushers, for self-consume in their
boilers, or sold in a restrict area. Therefore, a significant potential of this solid biofuel is not being used
actually in Portugal.
Concerning woody agricultural residues, the vineyard and olive tree are the main biomass producers,
although the orchards of oranges, apple and pear also present a significant potential in Portugal. These
sub products, namely olive tree pruning’s, are being object of several studies related to their energy
recovery, and there is relevant technical information in for their conversion into advanced biofuels. [9]
FirewoodWoodchips
Woodpellets
Olivestones
Exhaustedolive cake
Nut shells
t (DM/y) 1.620.000 732.000 1.034.000 59.746 94.597 78.626
% 44,8% 20,2% 28,6% 1,7% 2,6% 2,2%
0
200.000
400.000
600.000
800.000
1.000.000
1.200.000
1.400.000
1.600.000
1.800.000

70
This project has received funding from the European Union's Horizon 2020 research and innovation program under grant agreement No. 691763
EXPORTATIONS / IMPORTS OF THE SOLID BIOMASSES IN PORTUGAL
It is difficult to find consistent statistics data of exports / imports of solid biomasses in Portugal.
The most available and reliable information is in the sub sector of pellets. According to the Portuguese
Pellet Association (ANPEB) the production of pellets in 2014 was about 1.100.000 tonnes. Only about
20% of the production was for domestic consumption, the remaining 80% were exported to several
markets such as Spain, the United Kingdom and Benelux.
The needs of the Portuguese pellet market are almost exclusively granted by the national production,
being the imports almost inexistent.
MAIN SUPPORTS FOR THE USE OF BIOMASS IN PORTUGAL
Renewable electricity [1]
In Portugal, the principal instrument for promoting renewable electricity is the special production
regime, whereby electricity produced from renewable energy benefits from a feed-in tariff (FITs).
Feed-in tariff for electricity produced from renewable sources was until recently treated under the
Special Production Regime, established by Decree-Law 312/2001 of 10 December. Until 2012,
producers were remunerated on the basis of a formula established by means of separate legislation
(Decree-Law 189/88 of 27 May, and updated by Decree-Law 225/2007 of 31 May). The FIT were
updated at suitable intervals, for the purpose of reflecting the latest investment and operational costs
of each technology, as well as inflation and energy prices.
More recently, a new regulatory (Decree-Law 215- A/2012 and Decree-Law 215-B/2012, of 8 October),
allowed anyone producing electricity from renewable sources to sell it in the open market.
For existing and still valid tender procedures (forest biomass, wind, hydro and PV) the previous FIT
remains valid until the completion and fulfillment of the established preconditions, i.e., for electricity
produced from forest biomass, there is an indicative average of EUR 119 per MWh for a period of 25
years (Decree-Law 5/2011, of 10 January revised by the Decree-Law 179/2012 of 3 August, and by
Decree-Law 166/2015 of 21 August).
Micro-generation and mini-generation [1]
Micro-generation Law (Decree-Law 363/2007, of 2 November, revised by the Decree-Law 118-A/2010
of 8 October and by the Decree-Law 25/2013 of 8 March) regulates small-scale production of
renewable electricity (up to 5.75 kW). The micro-generation law defines two regimes:
The general regime is applicable to any type of micro-generation up to a limit of 5.75 kW (25
amperes single-phase).
The special regime is applicable to renewable electricity production up to a limit of 3.68 kW
(16 amperes single-phase) where a reference FIT is established and applied to each technology
according to a different percentage: 100% for solar, 80% for wind, 40% for hydro, 70% for
biomass CHP and 40% for non-renewable CHP. The reference FIT for new producers reduces
each year and, once defined, is valid for 15 years divided into two periods , one of eight years
and another for the remaining seven years with different values for each. In 2014, the
reference FIT was EUR 66/145 per MWh for PV and EUR 218/115 per MWh for other
technologies
Mini-generation Law (Decree-Law 34/2011 of 8 March, revised by the Decree-Law 25/2013 of 19

71
This project has received funding from the European Union's Horizon 2020 research and innovation program under grant agreement No. 691763
February) regulates the small-scale renewable energy generation (from 5.75 kW to 250 kW). It also
provides for the same simplified licensing procedures for local gridconnected, low- or medium-voltage,
small/commercial/industrial energy producers.
The mini-generation law defines two regimes:
The general regime is applicable to any type of renewable energy generation technology up to
250 kW.
The special regime is applicable to any type of renewable energy generation technology up to
3.68 kW (16 A single-phase). A reference FIT which is established and applied to each RES
according to a different percentage: 100% for solar, 80% for wind, 50% for hydro, 60% for
biomass and 60% for biogas. The reference FIT for new producers are reduced each year and,
once defined, is valid for 15 years. In 2014, the reference FIT was EUR 105.7 per MWh for PV
and EU 158.6 per MWh for other technologies.
The new regulatory framework (Decree-Law 153/2014 of 20 October) is applicable to small-scale RES
generation with grid injection and with a FIT (up to 250 kW) and to generation based on any kind of
source for own consumption (no capacity limit). It provides for the same simplified licensing
procedures as the previous programmes of micro- and mini-generation for local grid-connected energy
producers or off-grid using self-consumption, allowing the two regimes:
The small generation is applicable to any type up to a limit of 250 kW, where a reference FIT is
established and applied to each RES according to a different percentage: 100% for solar, 90%
for biomass and biogas, 70% for wind and 60% for hydro. The reference FIT for new producers
in 2015 is valid for 15 years, and has a value of EUR 95 per MWh, to which EUR 5.0 per MWh
are added if there is 2 m2 of solar thermal panels in the consumer’s installation or of EUR 10
per MWh if there is an electric vehicle charging power outlet connected to the mobility grid in
the consumer facility.
Self-consumption is applicable to any kind of source since it does not benefit from a FIT, and
has the possibility of injecting the surplus into the grid, which if paid by the last-resort supplier
at 90% of the average monthly market price. Optionally, renewable energy generators in self-
consumption (either grid connected or off-grid) can also trade the electricity surplus or the
generated electricity by green certificates.
Heating
Concerning the production of thermal energy in the residential and services buildings the existing
legislation boils down to the System for Energy Certification of Buildings (SCE). The Decree-Law No.
118/2013 of 20 August, that approves SCE, integrates the Regulation on the Energy Performance of
Residential Buildings (REH) and the Regulation on the Energy Performance of Services Buildings (RECS).
The System constitutes a transposition of the Directive 2010/31/EU of the European Parliament and of
the Council of 19 May 2010, Energy Performance of Buildings Directive (EPBD), into national law. [10]
This Decree-law is supported through the publication of 6 ordinances and 12 orders that includes the
specific calculation methodology, renewable energy account, energy performance certificates (EPC)
lay-out, climate data, primary energy conversion factors and others. [4]
SCE establishes the obligation to use solar thermal panels or alternative systems that use renewable
energy, such as biomass systems, for space heating and water heating purposes. Boilers and stoves
that use biomass as solid fuel must meet the minimum efficiency requirements defined in ordinance

72
This project has received funding from the European Union's Horizon 2020 research and innovation program under grant agreement No. 691763
No. 349-B / 2013 of November 29th (REH solutions requirements for residential buildings), as shown in
the following table:
Table 12: Minimum energy efficiency applicable to biomass boilers and stoves [11]
Appliances Energy Efficiency (%) Applicable standards
Boilers fired by solid
fuel
Wood ≥ 0.75 EN 128095
Pellets ≥ 0.85
Stoves fired by solid fuel ≥ 0.75
EN 128096
EN 128097
EN 128098
MAIN PROBLAMATIC OF THE USE OF BIOMASS IN PORTUGAL]
To overcome the main barriers to increase the use of biomass and to achieve a sustainable market on
biomass for energy, some actions are needed; namely: [12]:
Increase the forest biomass production. Can be achieved by increasing forest areas and their
productivity, become profitable the abandoned forest areas, promoting forest certification and
reducing management costs.
Ensure the supply of biomass: Creating local biomass markets organized such as “Biomass
Logistic and Trade Centres”. These infrastructures intend to develop and organise the local
biomass supply.
Ensure the quality of the existing biomass on the market: Becoming mandatory the
certification of products such as wood pellets for non-industrial use. Fuel standardization will
support consumer confidence.
Ensure that new projects use modern and high efficient technologies. Supporting projects
whose equipment meets stringent emissions and quality standards is crucial for market
transformation. Biomass heating systems must offer high performances similar to oil and gas
systems.
Guarantee the quality of the installers of small-scale RES installations. Develop and mutually
recognize accreditation and certification schemes for installers of small-scale renewable
energy installations.
Facilitate financing and investments. Promoting energy contracting model, through ESCOs,
companies capable of carrying out the design, installation, commissioning, operation,
maintenance of facilities and supply biomass. With this model, the consumer pays only the
energy it consumes and does not have to make any initial investment.
5 EN 12809:2001 - Residential independent boilers fired by solid fuel - Nominal heat output up to 50 kW -Requirements and
test methods 6 EN 13229:2001 - Inset appliances including open fires fired by solid fuels - Requirements and test methods
7 EN 13240:2001 - Room heaters fired by solid fuel – Requirements and test methods
8 EN 14785:2006 - Residential space heating appliances fired by wood pellets –Requirements and test methods

73
This project has received funding from the European Union's Horizon 2020 research and innovation program under grant agreement No. 691763
Promote modern biomass solutions. Promote the integration of biomass with solar thermal
system. Information campaigns and awareness are essential to kick-start markets. Information
and awareness is needed for different market stakeholders (biomass producers and
distributors, equipment producers and distributers, heating companies, installers) and
potential customers (homeowners, housing developers, owners and operators of larger
services buildings).
CONCLUSIONS
Nowadays, one of the main challenges is the evolution to a clean and sustainable worldwide economy.
The overall objective of the BIOMASUD PLUS project is to develop integrated solutions to promote the
sustainable market for Mediterranean solid biofuels for residential heating.
This solid biofuels market, based on controlled biomass and modern and efficient systems, has a great
potential of development in Portugal. However, Portugal still has much to do to reach a state of
maturity in this market.
The development of this market creates new jobs, avoids greenhouse gas emissions (GHG) and
improves the security of the supply of energy.
The further development of the biomass market should comprise some key aspects: i) sustainability,
ii) high conversion efficiency, iii) information and awareness.

74
This project has received funding from the European Union's Horizon 2020 research and innovation program under grant agreement No. 691763
REFERENCES
[1] International Energy Agency (IEA), “Energy Policies of IEA Countries - Portugal - 2016 Review,” OECD/IEA, 2016. Paris, [Online]. Available: https://www.iea.org/publications/freepublications/publication/Energy_Policies_of_IEA_Countries_Portugal_2016_Review.pdf.
[2] DGEG (Directorate-General for Energy); INE (Statistics Portugal), Inquérito ao consumo de energia no sector doméstico 2010, Lisboa. Portugal, October 2011.
[3] INE (Intituto Nacional de Estatística), [Online]. Available: http://www.ine.pt. [Acedido em July 2016].
[4] ADENE (Energy Agency), “Energy Efficiency trends and policies in Portugal,” Lisbon, October 2015.
[5] UNECE and FAO, “State of Europe's Forests 2011,” 2011. [Online]. Available:
http://www.unece.org/forests/fr/outputs/soef2011.html.
[6] ICNF (Instituto da Conservação da Natureza e das Florestas, I.P.), “IFN6 - Áreas dos usos do solo e das espécies florestais em Portugal Continental em 1995, 2005 e 2010. Resultados preliminares,” Lisboa , 2013.
[7] ANPEB (Associação Nacional de Pellets Energéticas de Biomassa), “ANPEB e o setor nacional de pellets,” Renováveis Magazine 26, pp. 30-33, 2.º trimestre de 2016.
[8] T. Almeida e C. Sousa, “TASK 2.3.1. STUDY 1.A - BIOMASS INVENTORY ON THE SUDOE SPACE,” BIOMASUD PROJECT SOE/P2/E414, 2011.
[9] T. Silva-Fernandes, L. C. Duarte, F. Carvalheiro, S. Marques, M. C. Loureiro-Dias, C. Fonseca e F. M. Gírio, “Biorefining strategy for maximal monosaccharide recovery from three different feedstocks: Eucalyptus residues, wheat straw and olive tree pruning.” Bioresour Technol 183:203-212 doi: 10.1016/j.biortech.2015.01.136, 2015.
[10] Decree-Law No. 118/2013 of 20 August, “Sytem for Energy Certification of Building (SCE)”.
[11] Ordenance No. 349-B/2013 of 29 November. Portuguese Republic Diary., “REH solutions requirements for residential buildings,” 2013.
[12] CBE (Biomass Centre for Energy), Proforbiomed. WP5: Renewable energy as an opportunity for local and regional economies - Evaluation of economic impact: Strategic report on renewable Energy as an opportunity for MED regions setting strategic orientations to implement policies. Portugal., 2013.
[13] [Online]. Available: http://www.dgeg.pt. [Acedido em July 2016].

75
This project has received funding from the European Union's Horizon 2020 research and innovation program under grant agreement No. 691763
State of the art of the biomass market. Report of Slovenia
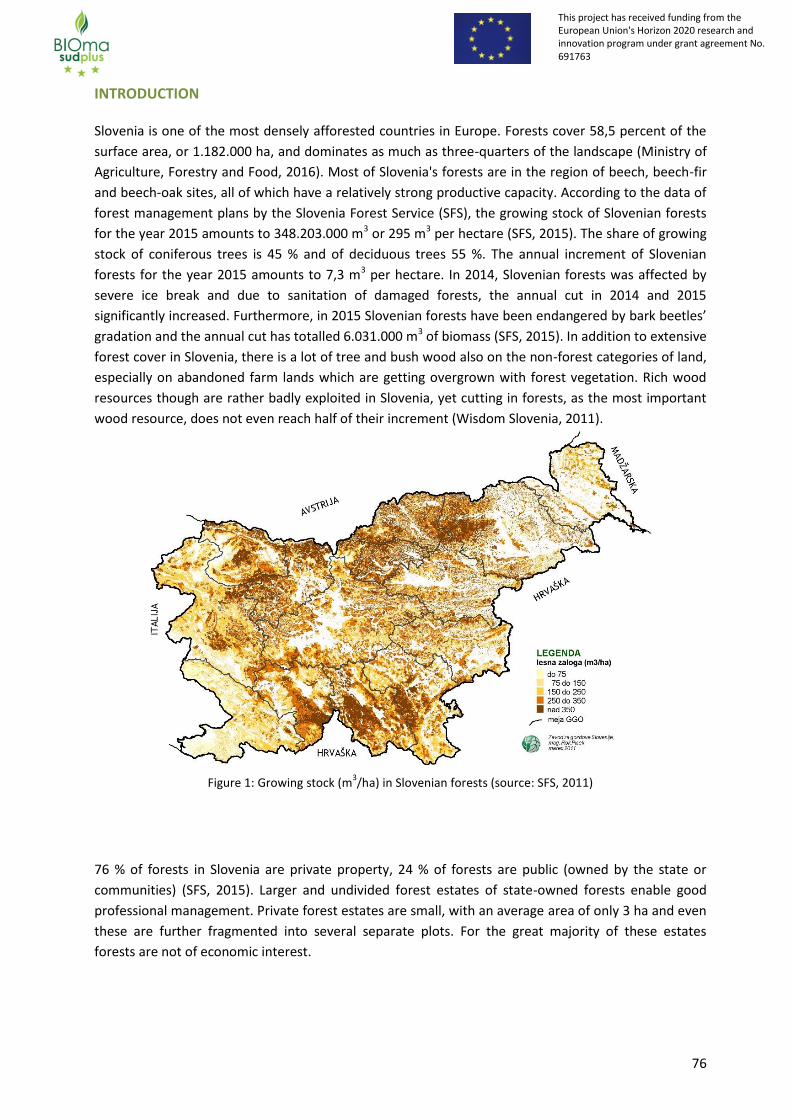
76
This project has received funding from the European Union's Horizon 2020 research and innovation program under grant agreement No. 691763
INTRODUCTION
Slovenia is one of the most densely afforested countries in Europe. Forests cover 58,5 percent of the
surface area, or 1.182.000 ha, and dominates as much as three-quarters of the landscape (Ministry of
Agriculture, Forestry and Food, 2016). Most of Slovenia's forests are in the region of beech, beech-fir
and beech-oak sites, all of which have a relatively strong productive capacity. According to the data of
forest management plans by the Slovenia Forest Service (SFS), the growing stock of Slovenian forests
for the year 2015 amounts to 348.203.000 m3 or 295 m3 per hectare (SFS, 2015). The share of growing
stock of coniferous trees is 45 % and of deciduous trees 55 %. The annual increment of Slovenian
forests for the year 2015 amounts to 7,3 m3 per hectare. In 2014, Slovenian forests was affected by
severe ice break and due to sanitation of damaged forests, the annual cut in 2014 and 2015
significantly increased. Furthermore, in 2015 Slovenian forests have been endangered by bark beetles’
gradation and the annual cut has totalled 6.031.000 m3 of biomass (SFS, 2015). In addition to extensive
forest cover in Slovenia, there is a lot of tree and bush wood also on the non-forest categories of land,
especially on abandoned farm lands which are getting overgrown with forest vegetation. Rich wood
resources though are rather badly exploited in Slovenia, yet cutting in forests, as the most important
wood resource, does not even reach half of their increment (Wisdom Slovenia, 2011).
Figure 1: Growing stock (m3/ha) in Slovenian forests (source: SFS, 2011)
76 % of forests in Slovenia are private property, 24 % of forests are public (owned by the state or
communities) (SFS, 2015). Larger and undivided forest estates of state-owned forests enable good
professional management. Private forest estates are small, with an average area of only 3 ha and even
these are further fragmented into several separate plots. For the great majority of these estates
forests are not of economic interest.

77
This project has received funding from the European Union's Horizon 2020 research and innovation program under grant agreement No. 691763
Figure 2: Structure of the forest property by size classes (ha) in Slovenia (source: SFS, 2011)
Most of the wood consumed for heating comes from forests, while up to 20 % of the total energy
consumption of roundwood is from short rotation forestry, wood residues, wood wastes etc. (Čebul et
al., 2011). It appears that there are two independent wood fuel circuits: one household circuit that
uses mainly fuel wood from forests and farmlands and one industrial circuit that uses mainly residues
from wood and pulp and paper industries. Not only the forests but also sawmills and furniture making
industries are important sources of woody biomass potentially useful (or already used) for energy
production. The plantations of fast-growing trees in our country are not very important, because we
have a lot of wood suitable for production of wood biomass in our forests, as well as we do not have
enough suitable land for the establishment of these plantations. In Slovenia there are two plantations
of fast-growing trees, both founded in 2009, with a total area of 6 ha (Čebul et al., 2012).
Most of forest wood assortments (roundwood) is intended for further processing in the wood-
processing industry while approximately a quarter of roundwood from forests are used for energy
purposes, mostly for heating (Krajnc and Čebul, 2012). At present, the majority of fuel wood in
Slovenia is used by household for heating purposes, for which this fuel provides about one third of the
national energy demand (Pezdevšek Malovrh et al., 2012).
The information on wood industry primary production and residues production is not directly
available. However, several studies and data sources can be used or consulted in order to estimate
and map the woody biomass resources of potentially available from this sector (Wisdom Slovenia,
2011). In 2004 the study was done by Slovenian forestry Institute and the results showed, that the
quantities of wood residues usable for energy purposes in Slovenia are approximately 1.360.000 tons
per year.

78
This project has received funding from the European Union's Horizon 2020 research and innovation program under grant agreement No. 691763
Figure 3: Estimated quantities of wood residues of wood-processing plants (t) at the level of administrative units
in Slovenia (source: SFI, 2005)
One of the sources of wood biomass is also wood from shrubs, orchards and vineyards, renovations
and maintenance of parks and green areas, cleaning of pastures and other agricultural or urban land.
Potential of wood biomass from areas outside the forest is needed to be evaluated and determine
their actual potential use. According to the study done by Slovenia Forest Service (SFS, 2004), the
potential of wood biomass usable for energy purposes outside the forest is approximately 300.000 m3
per year.
Figure 4: The potential of biomass (m3/ha) in non-forest land in Slovenia (source: SFS 2005)

79
This project has received funding from the European Union's Horizon 2020 research and innovation program under grant agreement No. 691763
MAIN COMMERCIALIZED SOLID BIOFUELS IN SLOVENIA
Wood is the most important renewable energy source in Slovenia; wood biomass can be divided in
three categories: firewood, wood chips and pellets, and wood briquettes. Biomass is mainly used (95
%) for the production of heat, especially in households.
Figure 5: Solid biofuels production (domestic and industrial quality) by biofuel type (in tDM /y)
*data for wood briquettes are not gathered
Figure 6: Solid biofuels use (domestic and industrial quality) by biofuel type (in tDM /y)
Firewood is the most common and known form of wood fuel in Slovenia. It is traditionally used for
heating, but in recent years also use of wood chips and pellets has grown. According to the data, the
annual production of firewood in Slovenia amounts to 1.331.000 net m3 (SORS, 2015). The largest
consumer of firewood are households with a total consumption of 1.212.000 tons which represents 78
% of the total consumption of wood fuels in households (SORS, 2015).
In autumn 2015 study about state of the art of wood chips production was performed (SFI, 2015). The
study included 186 wood chippers all around Slovenia (which represents more than 85 % of all wood
chips producers in Slovenia in October 2015), where small size chippers prevail (capacity up to 30 loose
70%
20%
10%
Firewood Wood chips Wood pellets
78%
13%
0,3%
9%
Firewood Wood chips Wood briquettes Wood pellets

80
This project has received funding from the European Union's Horizon 2020 research and innovation program under grant agreement No. 691763
m3/hour). There are 34 wood chippers (18 %) in Slovenia that can achieve a production capacity of at
least 100 loose m3/hour. Wood chips manufacturers are technologically well equipped; the total
production was estimated to more than 1.500.000 loose m3 of wood chips in 2014. It is estimated that
in Slovenia the number of wood chippers is even higher, but their production is negligible and they are
mainly used for production of wood fuel for domestic use.
Figure 7: Locations of chippers by statistical regions of Slovenia (source: SFI, 2015)
In Slovenia, the domestic production of pellets is increasing; in 2015 the trend of increasing domestic
demand is continuing (+ 6 %) as well (Market statement…, 2016). The main consumers of wood pellets
are households, followed by larger public buildings and other users. Last year, the production of
pellets recorded a 10 % increase to 110.000 tons (Market statement…, 2016). Among Slovenian pellet
manufacturers, smaller manufacturers with a yearly production of under 10.000 tons hold the greatest
share. In 2014 Slovenian forestry Institute developed system for assurance of quality wood fuel, called
S4Q. S4Q support system is designed for micro and small-scale biomass producers which produce
pellets only for domestic market. By the end of 2016, 7 of the total 20 Slovenian pellet manufacturers
got right to use a trademark S4Q.
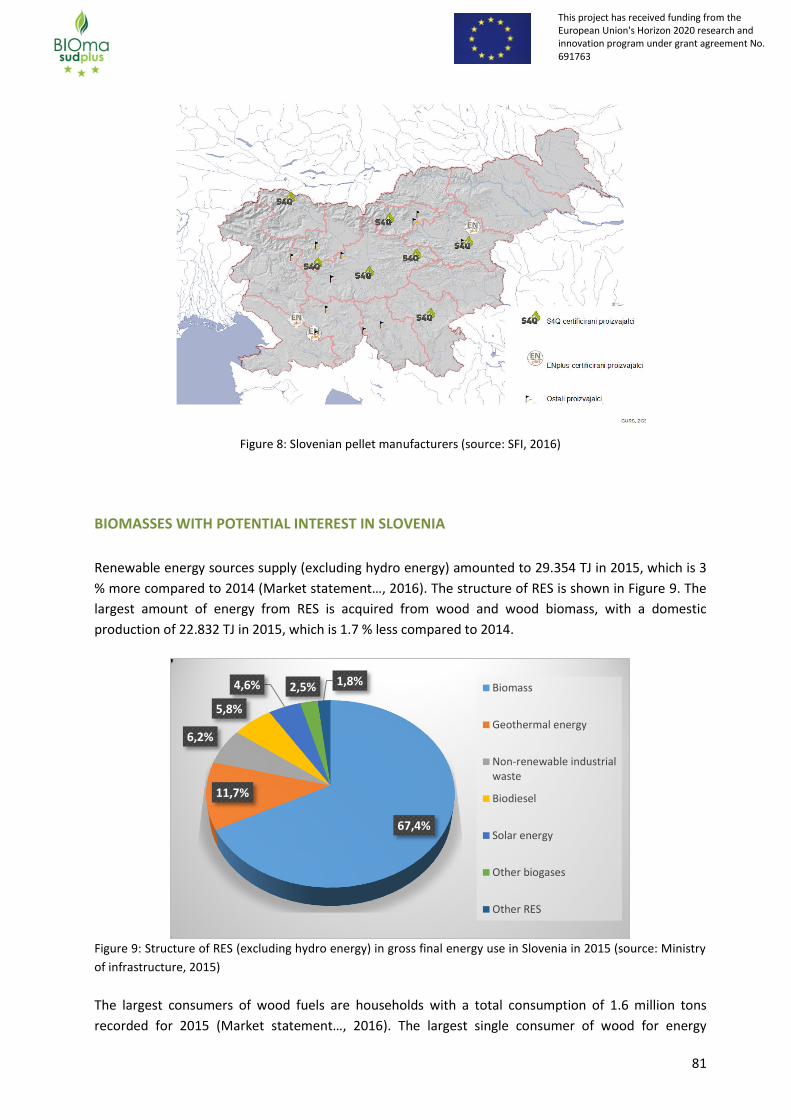
81
This project has received funding from the European Union's Horizon 2020 research and innovation program under grant agreement No. 691763
Figure 8: Slovenian pellet manufacturers (source: SFI, 2016)
BIOMASSES WITH POTENTIAL INTEREST IN SLOVENIA
Renewable energy sources supply (excluding hydro energy) amounted to 29.354 TJ in 2015, which is 3
% more compared to 2014 (Market statement…, 2016). The structure of RES is shown in Figure 9. The
largest amount of energy from RES is acquired from wood and wood biomass, with a domestic
production of 22.832 TJ in 2015, which is 1.7 % less compared to 2014.
Figure 9: Structure of RES (excluding hydro energy) in gross final energy use in Slovenia in 2015 (source: Ministry
of infrastructure, 2015)
The largest consumers of wood fuels are households with a total consumption of 1.6 million tons
recorded for 2015 (Market statement…, 2016). The largest single consumer of wood for energy
67,4%
11,7%
6,2%
5,8%
4,6% 2,5% 1,8% Biomass
Geothermal energy
Non-renewable industrialwaste
Biodiesel
Solar energy
Other biogases
Other RES

82
This project has received funding from the European Union's Horizon 2020 research and innovation program under grant agreement No. 691763
purposes is the district heating system in a capital city Ljubljana with an installed capacity of 152 MW.
The thermal power plant and the district heating plant recorded a 21 % increase in their consumption
of wood fuels (chips) in 2015. Other energy production systems and CHP plants recorded a 27 %
increase last year (Market statement…, 2016).
Figure 10: The proportion of dwellings (%) where the wood is the only or the main source of heating (source:
SORS, 2002)
At the country level, the overall assessment of the potential of forest biomass by municipalities was
made (Figure 11). This estimate covers demographic and economic indicators for each municipality,
which affect the wood production. In the process, it was considered as many as nine different factors.
From a perspective of assessing the potential and the use of wood biomass from forests, the higher
ratings was given to municipalities with lower population density (the more rural parts of Slovenia)
and the highest proportion of forests, municipalities with higher average private property, greater
proportion of deciduous trees of lower quality and lower realization of annual available cut and
municipalities with a greater proportion of dwellings, where the wood is already used as an energy
source for heating.

83
This project has received funding from the European Union's Horizon 2020 research and innovation program under grant agreement No. 691763
Figure 11: Overall assessment of the potential of forest biomass by municipalities in 5 stages of suitability:
rank 1 - the municipalities are less suitable for the use of biomass; rank 5 - the municipalities are highly suitable
for the use of biomass (ZGS, 2016)
EXPORT / IMPORT OF THE SOLID BIOMASSES IN SLOVENIA
The statistics on the import and export of timber assortments are monitored by the Statistical Office of
Republic of Slovenia but the data on trade inside the EU are collected and reported by companies and
the data on trade outside the borders of the EU, reporting is based on customs declarations. Import
and export in the EU countries is covered by Intrastat system and the data on imports and exports
from non-EU countries is covered by Extrastat system (Krajnc and Piškur, 2006).
In the last ten years, there is an increasing interest in the production and use of various wood fuels.
Consequently, by increasing the consumption of wood fuels also the supply increases. Export is
considered as it is seen mainly as a threat from the national point of view and as an opportunity from
producers’ side. The most wood fuels are exported to Italy. Import is considered in terms of raw
material import, especially in wood pellets production (Pezdevšek Malovrh et al., 2012). The main
import markets for wood fuels are Romania, Bosnia and Herzegovina and Croatia.
Firewood has an important role in the biofuel branch in Slovenia, although the market is of somewhat
spontaneous nature. Most of the produced firewood is intended for domestic use and sales on the
local market. The majority firewood trade, however, still means uncontrolled buy and sell from
individuals (mostly farmers) (Pezdevšek Malovrh et al., 2012). Despite all the facts, some quantities of
firewood are also imported and exported; the main import is from Bosnia and Herzegovina and Croatia
and the main export market is Italy.

84
This project has received funding from the European Union's Horizon 2020 research and innovation program under grant agreement No. 691763
Figure 12: Export and import of fuel wood (firewood, twigs, billets, faggots and similar forms - code 4401 10 00
by nomenclature of the EU) in Slovenia (in m3) (source: SORS, 2015)
Slovenia is a net exporter of conifer wood chips and a net importer of deciduous wood chips. In wood
chips import, deciduous wood chips prevail (a share of 80 – 90 %), and in export, conifer wood chips
hold the greatest share (70 – 80 %). Wood chips are mainly imported from Croatia and exported to
Austria and Italy (Market statement…, 2016).
Figure 13: Export and import of wood chips (t) in Slovenia (source: SORS, 2016)
The Country Market Statement 2016 reports that the trend of increasing domestic demand of pellets is
continuing, which led to increased export, but the import dropped for 4 % compared with the previous
year. Despite an increase in the domestic production of pellets, Slovenia remains a net importer of
pellets. Romania is the dominant importer of pellets (47 %) and the main export market is Italy
(Market statement…, 2016).
0
50.000
100.000
150.000
200.000
250.000
300.000
350.000
400.000
450.000
2010 2011 2012 2013 2014 2015
Export Import
0
50.000
100.000
150.000
200.000
250.000
2010 2011 2012 2013 2014 2015
Export Import

85
This project has received funding from the European Union's Horizon 2020 research and innovation program under grant agreement No. 691763
Figure 14: Export and import of wood pellets (t) in Slovenia (source: SORS, 2016)
POLICY SUPPORT FOR THE USE OF BIOMASS IN SLOVENIA
The market for all wood fuels in Slovenia is developing rapidly. This is largely supported by the state
with co-financing of investment in modern machinery for the production of wood fuels and boilers for
central heating and with the support of promotional projects (Krajnc and Čebul, 2012).
The financial instruments for investments in projects regarding the use of renewable energy sources as
well as effective use of RES in energy are:
Energy Efficiency Action Plan 2008-2016 provide the public funds for the implementation of
the promotion of efficient energy use (eg. replacement old heat generation systems with new systems
using wood biomass, energy information network for citizens, and green public procurement).
National Renewable Energy Action Plan 2010-2020 provide adequate support environment for energy
rehabilitation of existing buildings, use of renewable energy sources for electricity, increasing the use
of RES for energy purposes and introducing biofuels and other renewable energy sources in transport
and farming.
Eco Fund subsidies have had a positive effect on tax revenues, diminishing of grey economy, new
green jobs, sustainable development of the construction planning and business, as well as the
development of the use of strategic resources, such as wood. The Eco Fund continually implements
the following financial programmes (Market statement…, 2016):
- loans to legal entities and sole traders for investments in environmental infrastructure,
environmentally sound technologies and products, energy efficiency, energy saving investments, and
use of renewable energy sources;
- loans to individuals for conversion from fossil fuels to renewable energy sources, energy saving
investments, investments in water consumption reduction, connections to sewage system, small
waste water treatment plants, replacement of asbestos roofs;
- grants to individuals for investments in electric cars and for investments in residential buildings
(energy efficiency and use of renewable energy sources);
0
20.000
40.000
60.000
80.000
100.000
120.000
140.000
160.000
2010 2011 2012 2013 2014 2015
Export Import

86
This project has received funding from the European Union's Horizon 2020 research and innovation program under grant agreement No. 691763
- grants to legal entities for investments in electric cars and buses for public transport on compressed
natural gas or biogas;
- grants to municipalities for investments in buildings where public education takes place, newly
constructed as low energy and passive buildings or renovated in passive standard.
The public tender for co-financing of district heating using renewable energy sources for the period
2016 – 2020, adopted in 2016 by Ministry of infrastructure. The state aid will support the construction
of various types of district heating systems on renewable energy sources and the extension of the
remote network to an existing district heating system on RES.
The Rural Development Programme of the Republic of Slovenia 2014 – 2020 is expected to contribute
with its priorities and measures to promote the use of renewable energy. In the view of promoting the
use of wood biomass, sub-measure M6.4 provides support for investment as follows: M6.4 - Support
for investment in the creation and development of non-agricultural activities among others acquisition
of electricity and heat from renewable energy sources such as wood biomass, biomass, manure and
slurry, water, wind, sun (Rural Development Programme 2014 – 2020).
Operational Programme for Competitiveness and Cohesion 2014 -2020 foresee providing subsidies for
investments in biomass heating plants.
Regulation on supports for the electricity generated from renewable energy sources; this financial
assistance expired by the end of November 2016.
Feed-in tariff system grants 15 years support in electricity production from combined heat and
power on woody biomass with high efficient cogeneration adopted in 2009. This state aid expired by
the end of November 2016.
MAIN BARRIERS FOR USE OF BIOMASS IN SLOVENIA
The further development of production and use of wood biomass in Slovenia is affected by different
constraints (e.g. Rogelja and Krajnc, 2014; Čebul et al., 2011):
I. Administrative and institutional constraints:
environmental requirements are vaguely addressed; the absence of regulations, standards and
technical regulations with the aim of utilization of wood biomass;
complex administrative procedures for obtaining various permits and for getting construction
documentation to establish biomass plants;
cross-sectoral coordination in promoting the use of wood biomass is poor. There is a lack of
cooperation between different sectors (energy, environment, agriculture, and forestry).
II. Economic constraints:
investment costs per unit of produced energy compared to fossil fuels are higher;
uncertain long-term market price of wood biomass and the relationship to other energy products;
low level of availability of own funds: bad financial status of municipalities and local businesses;
grants are uncertain; investors are counting on the grants as a reliable hard financial source. Long-
term financial mechanisms are not stable to support projects for the utilisation of woody biomass.
III. Technical and market constraints:

87
This project has received funding from the European Union's Horizon 2020 research and innovation program under grant agreement No. 691763
principles of sustainability, close-to-nature and multipurpose forest management in Slovenia;
low average private forest holding and very fragmented possession; highly fragmented forest areas
(most households have possession of less than 1 ha) and the number of forest owners makes the
professional work and optimum use of wood in private forests very difficult. According to study done
by Slovenian forestry Institute the majority of small forest owners use wood only to cover their own
need for wood biomass (for heating) and don't have any interest to enter the wood market;
poor equipment and technological skills of private owners of forests;
low realization of maximum allowable cut especially in private forests; in Slovenia the annual allowable
cut is quite conservative, as it represents around 70 % of the estimated annual increment (SFS, 2015).
Moreover, the annual actual felling never reach the quantities of the annual allowable cut; except of
some years when severe natural disturbances occurred. It is justified to believe that the potential
supply of wood fuels could increase today’s extracted volumes without limiting the timber industry or
affecting the growing stock;
production of wood chips from forest residues is not a common practice, the main barrier for using
forest residues are economics and harvesting technology;
construction of skid trails in recent years has reached the planned goals, while the construction of
forest roads significantly stalled. This is noticeable especially in private forests, where the owners do
not have sufficient funds for the construction;
exports of wood biomass are large. There is an inequality in conditions on the market in neighbouring
countries and Slovenia.
IV. Sociological constraints:
lack of knowledge on efficient use of biomass as fuel;
lack of training and information of local communities to promote the development of local bioenergy
markets;
lack of confidence in the sustained supply of quality;
lack of skilled and experienced professionals with relevant knowledge in the field of technologies for
wood biomass preparation, production and use.

88
This project has received funding from the European Union's Horizon 2020 research and innovation program under grant agreement No. 691763
CONCLUSIONS
Wood biomass is the most important renewable energy source in Slovenia. It has been and remains an
important energy source for covering the heat demand in households, for the production of process
heat in industry and for electricity production.
The increase of the use of renewable energy sources is stimulated with different policy instruments
and by different institutes. Investments in new devices are encouraged with subsidies and favourable
loans. Nevertheless, it is constantly need for investing the energy and knowledge in the promotion of
modern technologies for exploitation of wood biomass and especially uses of biomass. In the future, it
will be necessary to consider alternative sources of wood biomass such as forest residues and non-
forest plantations of fast-growing trees and shrub species.
An important issue is also the further integration of forest owners and farmers in the energy market
(for example energy performance contracting) and the promotion of the whole chain from the forest
to the final consumer, whether it be an individual, the wood industry or energy plant.
Wood biomass is in Slovenia an important economic, socio-economic and environmental factor.
Impacts on the socio-economic position of the country are mainly reflected in the creation of new
jobs, increased revenues of the local economy, additional activities on farms, reduction of
unemployment, increased energy self-supply and reducing energy dependency.

89
This project has received funding from the European Union's Horizon 2020 research and innovation program under grant agreement No. 691763
REFERENCES
Čebul, T., Krajnc, N., Piškur, M. 2011. Biomass Trade Centre II: Regional report on promotion of new
investments in wood biomass production for Slovenia. Ljubljana, Slovenian forestry Institute, p. 12.
Čebul, T., Krajnc, N., Piškur, M. 2012. Lesna biomasa iz zunajgozdnih nasadov hitrorastočih vrst.
Zbornik gozdarstva in lesarstva, 97, 19 – 29.
Government of the Republic of Slovenia, 2010: Akcijski načrt za obnovljive vire energije za obdobje
2010-2020 [National renewable energy action plan 2010-2020]
Krajnc, N., Piškur, M. 2006. Tokovi okroglega lesa in lesnih ostankov v Sloveniji. Zbornik gozdarstva in
lesarstva, 80, 31 – 54.
Krajnc, N., Čebul, T. 2012. Katalog proizvajalcev polen in sekancev v Sloveniji. Ljubljana, Slovenian
forestry Institute, p. 59.
Market statement…, 2016. SLOVENIA Country Market Statement 2016.
Ministry of Agriculture and Forestry and Food, 2016. MAFF/ Areas of Work.
http://www.mkgp.gov.si/en/areas_of_work/
Ministry of infrastructure, 2015. Energetska bilanca Republike Slovenije za leto 2015.
Pezdevšek Malovrh, Š., Leban, V., Krč, J., Zadnik Stirn, L. 2012. COOL – Competing Uses Of Forest Land,
Country report for Slovenia. Ljubljana, Biotechnical faculty, p. 34.
Rogelja, T., Krajnc, N. 2014. Legislative and Institutional Framework for Wood Biomass Production and
Use in Slovenia. Slovenian forestry Institute, p.18.
Rural development programme 2014-2020.
http://www.program-podezelja.si/sl/prp-2014-2020/ukrepi-in-podukrepi-prp-2014-2020/m6-razvoj-
kmetij-in-podjetij/m-6-4-podpora-za-nalozbe-v-vzpostavitev-in-razvoj-nekmetijskih-dejavnosti
Wisdom Slovenia, 2011. Drigo, R. 2011. Upgraded Wisdom Slovenia as supporting tool for bioenergy
initiatives in Slovenia.
SFS, 2015. Poročilo Zavoda za gozdove Slovenije o gozdovih za leto 2015. Ljubljana.
SORS, 2015. Končna poraba energije po vrsti energetskega vira v gospodinjstvih, Slovenija.

90
This project has received funding from the European Union's Horizon 2020 research and innovation program under grant agreement No. 691763
State of the art of the biomass market. Report of Spain

91
This project has received funding from the European Union's Horizon 2020 research and innovation program under grant agreement No. 691763
INTRODUCTION
Spain has an enormous potential of biomass resources in both main sources forest and agricultural.
Forest is being growing very quickly since last 20 – 30 years because of the movement of population to
the cities causing less local use of firewood and also wood industries are decreasing so the result is
that less and less wood is being used and there were big plantations since 50-60 of the last century.
The annual growth of the stock of wood is 46 million of m3 per year. The official inventory of forest
shows the stock of wood has doubled in 13 years. In the IFN2 (National Forestry Inventory 2) made in
1996 there was 594 million of m3 and in the IFN3 made in 2009 there was 921 million of m3 which
means a 64% increase.
According to CEDER-CIEMAT own data there is a potential of 10.548.261 t DM/y. of forest biomass
(forests, scrubs, etc.). From this potential, an available quantity has been estimated of 4.772.650 t
DM/y
Regarding field agricultural biomass (Olive trees, irrigated…), there is in Spain a total potential of
26.220.486 t DM/y that removing the unavailable quantities remains in 12.841.774 t DM/y
To this potential we shoul dadd the agro-industry biomass resources with a total of 4.202.899 t DM/y
which is composed mainly of:
Clean wood by-products (chips etc) 2.695.962 (t DM/y)
Olive stones: 430.000 (t DM/y)
Olive cake: 800.000 (t DM/y)
Also, AVEBIOM has been collecting data into a database called National Observatory of Biomass
Boilers (ONCB) since 2009. Collecting information for this Observatory has not been an easy task.
Patience and a high degree of cooperation with manufacturers, equipment and biofuels distributors,
installers, public and private institutions and final users have been needed. In spite of that, there are
still missing biomass installations in the database, as getting all the data from all the distributors and
retailers is not possible.
However, there is enough quantity of data to allow making estimations.
During these 6 years of work in the ONCB’s database, AVEBIOM has collected a sample of 48,650
references and 3,875 MW of installed capacity in Spain. Thanks to these references, we were able to
estimate that the number of appliances installed in Spain in total is 160,000 until the end of 2015
which corresponds to an installed capacity of 7,275 MW.
Comparing these figures with the previous year, the number of appliances has grown about 25% and
around 20% in power.
Although the increases are very satisfactory, distribution companies and installers have the feeling
that it could have been a much better season. The demand of biofuels and the installation of new
appliances have been less than the expected because the last winters have been very warm and the
price of the fossil fuels has been very low, which has delayed the decision of purchasing and installing
biomass devices.
Since 2014, there has been a significant growth in the number of installed MW in some Spanish
regions (Autonomous Communities). The progress in the regions where the installation of biomass
devices is supported with public money is remarkable.

92
This project has received funding from the European Union's Horizon 2020 research and innovation program under grant agreement No. 691763
Figure 36: Installed biomass power (MW) in the 10 Regions with the highest values. Source: AVEBIOM
EVOLUTION BY TYPE OF USER
All significant groups which are biomass user grew in number of installations.
The high number of public facilities that have been put into operation in 2015 can be remarked (Table
). The evolution of district heatings and the future prospects for this kind of facility are outstanding
(Figure 37). There has also been a great response of residences for the elderly and remarkable
increases in the number of installations that supply energy from biomass to sports facilities and
swimming pools.
Table 1: Evolution of the number of installations and power by user group for the commercial sector, expressed in accumulated values. Source: AVEBIOM
Commercial Sector
Installations registered
2013
Power (kW) 2013
Installations registered
2014
Power (kW) 2014
Installations registered
2015
Power (kW) 2015
Schools 361 53,695 417 64,380 475 71,295
District Heatings 77 67,464 117 139,274 188 200,400
Public buildings 491 45,486 627 50,228 744 57,804
Sport facilities/ swimming pools
188 47,750 258 54,770 306 68,317
Residences for the elderly
142 35,646 187 42,538 235 58,108
0 200 400 600 800 1.000 1.200 1.400 1.600 1.800
VALENCIA
CLM
ARA
NAVARRA
GAL
P.VASCO
EX
CAT
CyL
ANDA
2.015
2.014

93
This project has received funding from the European Union's Horizon 2020 research and innovation program under grant agreement No. 691763
Figure 37: Evolution of the number of district heatings in Spain and its power. Predictions from 2016 to 2020. Source: AVEBIOM
Regarding the use of biomass in the industrial sector, it remains at very high levels in the Agro- farmer
sector and in the food industry. In leisure business, including restaurants and hotels, biomass also has
an important role.
Table 2: Evolution of the number of installations and power by user group for the industrial sector,
expressed in accumulated values. Source: AVEBIOM
Industrial sector
Installations Registered
2013
Power (Kw) 2013
Installations Registered
2014
Power (Kw) 2014
Installations Registered
2015
Power (Kw) 2015
Agro / Farmer 509 327,016 623 362,356 738 417,680
Alimentary 1,230 1,065,955 1,444 1,238,716 1,703 1,461,563
Wood / Furniture
170 510,398 209 562,312 234 615,760
Leisure 431 46,752 625 62,939 851 84,874
Servicies 209 16,198 289 21,648 364 26,122
EVOLUTION IN THE NUMBER OF DISTRIBUTORS AND INSTALLERS
Considering the data recorded in the ONCB it can be verified that the number of equipment
distribution and installation companies has increased. There are already 245 different manufacturers
that have devices installed in Spain from a total of 28 countries. Likewise, nearly 1,100 installers have
recorded at least one data in the DB application, which means an increase of more than 20% over last
year.
There is also a notable activity of the biomass ESCOs (Energy Services Co). Some of the most important
exceed 50 MWt installed.
33.351 44.683 64.023 67.464
139.274
200.400
232.675
392.600
497.350
721.404
860.430
34 41 60 77 117
188
227
302
406
522
667
0
100
200
300
400
500
600
700
800
900
1000
0
100.000
200.000
300.000
400.000
500.000
600.000
700.000
800.000
900.000
1.000.000
2.010 2.011 2.012 2.013 2.014 2.015 2.016 2.017 2.018 2.019 2.020
Nu
mb
er o
f D
istr
ict
Hea
tin
gs
kW
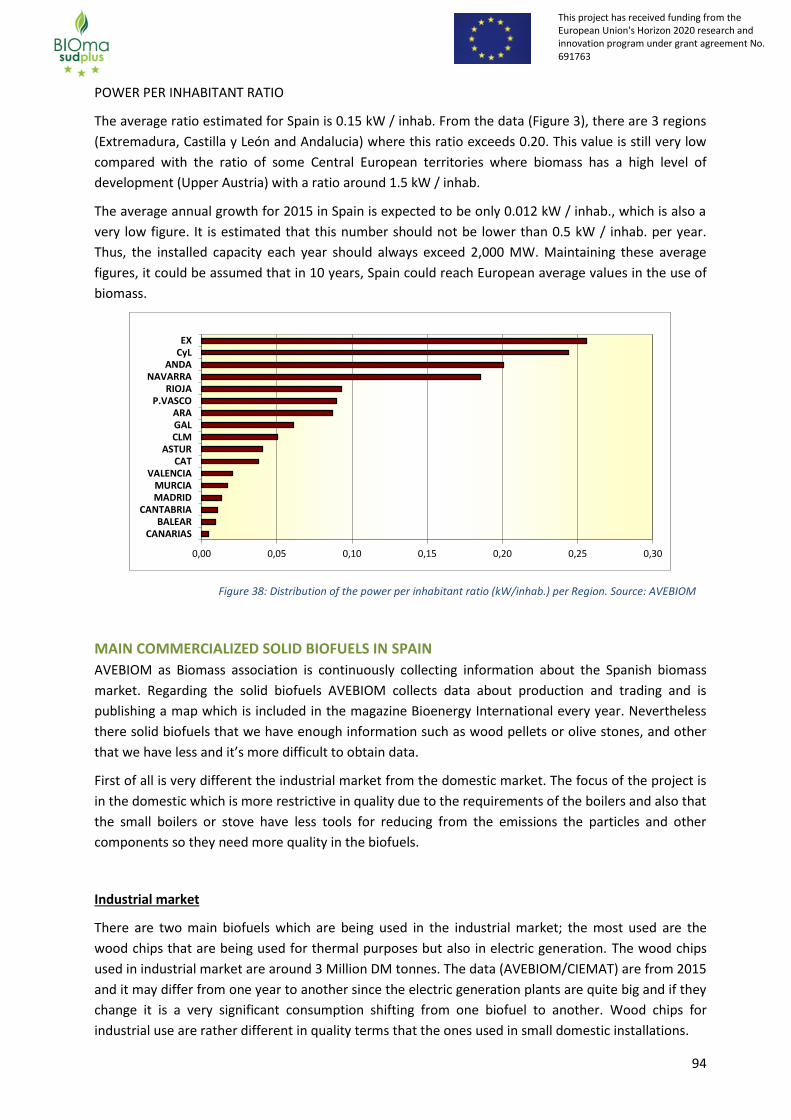
94
This project has received funding from the European Union's Horizon 2020 research and innovation program under grant agreement No. 691763
POWER PER INHABITANT RATIO
The average ratio estimated for Spain is 0.15 kW / inhab. From the data (Figure 3), there are 3 regions
(Extremadura, Castilla y León and Andalucia) where this ratio exceeds 0.20. This value is still very low
compared with the ratio of some Central European territories where biomass has a high level of
development (Upper Austria) with a ratio around 1.5 kW / inhab.
The average annual growth for 2015 in Spain is expected to be only 0.012 kW / inhab., which is also a
very low figure. It is estimated that this number should not be lower than 0.5 kW / inhab. per year.
Thus, the installed capacity each year should always exceed 2,000 MW. Maintaining these average
figures, it could be assumed that in 10 years, Spain could reach European average values in the use of
biomass.
Figure 38: Distribution of the power per inhabitant ratio (kW/inhab.) per Region. Source: AVEBIOM
MAIN COMMERCIALIZED SOLID BIOFUELS IN SPAIN
AVEBIOM as Biomass association is continuously collecting information about the Spanish biomass
market. Regarding the solid biofuels AVEBIOM collects data about production and trading and is
publishing a map which is included in the magazine Bioenergy International every year. Nevertheless
there solid biofuels that we have enough information such as wood pellets or olive stones, and other
that we have less and it’s more difficult to obtain data.
First of all is very different the industrial market from the domestic market. The focus of the project is
in the domestic which is more restrictive in quality due to the requirements of the boilers and also that
the small boilers or stove have less tools for reducing from the emissions the particles and other
components so they need more quality in the biofuels.
Industrial market
There are two main biofuels which are being used in the industrial market; the most used are the
wood chips that are being used for thermal purposes but also in electric generation. The wood chips
used in industrial market are around 3 Million DM tonnes. The data (AVEBIOM/CIEMAT) are from 2015
and it may differ from one year to another since the electric generation plants are quite big and if they
change it is a very significant consumption shifting from one biofuel to another. Wood chips for
industrial use are rather different in quality terms that the ones used in small domestic installations.
0,00 0,05 0,10 0,15 0,20 0,25 0,30
CANARIASBALEAR
CANTABRIAMADRIDMURCIA
VALENCIACAT
ASTURCLMGALARA
P.VASCORIOJA
NAVARRAANDA
CyLEX

95
This project has received funding from the European Union's Horizon 2020 research and innovation program under grant agreement No. 691763
The second biofuel most used in industrial is olive cake, a by-product of the olive oil extraction with
around 800.000 tDM/year potential.
There are also other kinds of wood chips coming from olive trees (prunings) or vineyards that may go
to industrial use but in smaller quantities, the potential of these biomasses is huge and much more
quantities could be destined to energy.
In addition, biomasses such as olive stones, almond shells are being used in the industrial sector
without any valorisation (high moisture, no screened) what it’s a pity because the quality of these
biofuels is quite good and if it would be valorised could be sold with a bigger added value and in form
of a biofuel with much more quality which results in less emissions and better performance. Anyway is
understandable that they are used like this since the cost of drying and screening is not low, the
industrial market cannot pay so much and the domestic market is not so big.
There is a certain production of industrial wood pellets (around 38.000 tons/year) but most of it is
destined for exportation to big utilities in Europe.
Other solid biofuels found on the market are: almond shells, pinion nut shells, Chopped pine cones and
hazelnut shells.
Table 3: Quantities of industrial solid biofuels present in the market (2015)
BIOFUEL INDUSTRIALBIOFUELS
(tDM /y)
Source
Wood chips 3.000.000 AVEBIOM’s data / Biomasud Project
Other chips (e.g.
pruning)
51.553 CIEMAT’s data / La biomasa en Andalucía,
2015
Wood pellets 37.383 AVEBIOM’s data
Other pellets (e.g.
pruning)
4.673 AVEBIOM’s data / CIEMAT’s data
Olive stones 300.000 La biomasa en Andalucía, 2015 / AVEBIOM’s data /
CIEMAT’s data
Exhausted olive cake 800.000 La biomasa en Andalucía, 2015 / AVEBIOM’s data /
CIEMAT’s data
Almond Shell 140.000 AVEBIOM’s data
Chopped pine cone 38.250 AVEBIOM’s data
Pine nut shells 6.588 AVEBIOM’s data
TOTAL 4.378.447
Domestic market
Regarding the domestic sector, the most used biomass is still the firewood with 1.500.000 tonnes/year
as per official figures from MAGRAMA although actual quantities in the market are believed to be
significantly bigger.
Wood pellets are the second biofuel most used for domestic. Nowadays are being consumed 443.925

96
This project has received funding from the European Union's Horizon 2020 research and innovation program under grant agreement No. 691763
tDM /year from which 406.542 are for domestic use (data from AVEBIOM for 2016). The use of this
fuel is increasing very quickly and it has more than double in the last 3 -4 years. The number of
producers has increased accordingly. Below there are a table and a graph showing the evolution of the
marked for the wood pellets (please note that figures are in metric tonnes and not in dry tonnes, i.e.
443.925 tDM are equivalent to 475.000 metric tonnes which including a 7% of water content).
Detailed information (annual production, location,…) about the wood pellet plants and other domestic
solid biofuels producers can be found in solid biofuel map that is published together with the Spanish
edition of Bionergy International magazine (http://bioenergyinternational.es/). In the next page we
can found the last edition available (2016) –figure 4.


This project has received funding from the European Union's Horizon 2020 research and innovation program under grant agreement No. 691763
This project has received funding from the European Union's Horizon 2020 research and innovation program under grant agreement No. 691763
Table 4: Evolution of the wood pellet market. Source: AVEBIOM
Wood pellet market evolution (Tm/year)
In the next graph, in blue we can see the installed capacity of wood pellet production (real data until
2016 and estimation for 2020); in red the actual production of wood pellets (real data until 2016 and
estimation for 2020); in green the consumption of wood pellets in Spain (real data until 2016 and
estimation for 2020).
Figure 5: Evolution of the wood pellet market. Source: AVEBIOM
The average production plant has a producing capacity of 17.500 Tm/year so they are clearly oriented
to domestic market. The actual average production is 8.200 Tm/year what for the global pellet market
is very small and most likely they have scale difference with Portugal producers what is causing
difficulties for competing with them. On the other hand the quality of the production is very good as
85% of the production is certified with ENplus® A1.
The market has been depressed for the last 3 years until last winter (season end 2016- beginning 2017)
because the conjunction of 3 causes: three last winters were rather mild so the consumption was low,
price of fossil fuels was very low causing delays in the change of the heating devices and also the big
number of plants that has been installed in Spain (between 15-20 in a year and a half 2015 and mid
2016). This situation has caused very low prices and closures of pellet plants just one year after its
inauguration.
After wood pellets, the most used biomass for domestic is wood chips (240.000 tDM /year) which are

This project has received funding from the European Union's Horizon 2020 research and innovation program under grant agreement No. 691763
This project has received funding from the European Union's Horizon 2020 research and innovation program under grant agreement No. 691763
mainly used in mid-size installations (50 – 500 kW). Also the use of this biofuel has been growing in the
last years (in Spain there was 5 logistic centres in 2011 and around 16 in 2014). The prices has been
more stable and reasonable since the mid-size installations are less affected by the mild winters and
being much cheaper it is not so affected by the low price of fossil fuels.
In the case of Olive Stones, about 130.000 tDM /year are used every year in the domestic sector but as
previously mentioned there are another 300.000 tDM /year that are now destined to the industrial
sector but that could be destined to the domestic if they would be valorised (dried and screened). The
quantities mentioned are average because the olive trees don’t produce every year the same making
cycle of 4 around years. Of course production is also depending on the weather.
Wood briquettes market is about 50.000 tDM /year and its tendency to remain stable since is not
growing as the ones from the other solid biofuels.
Other solid biofuels found on the market on less quantities are: almond shells, pinion nut shells,
Chopped pine cones and hazelnut shells that are being used mainly in the industrial sector but their
quality is very good and could be used perfectly in domestic devices with a minimum valorisation
(drying and screening them).
Table 5: Quantities of domestic solid biofuels present in the market (2015)
BIOFUEL DOMESTIC BIOFUELS
(tDM /y)
Source
Firewood 1.500.000 Statistical yearbook 2014 MAGRAMA
Wood chips 240.000 AVEBIOM’s data / Biomasud Project
Other chips (e.g.
pruning)
323.021 CIEMAT’s data / La biomasa en Andalucía, 2015
Wood briquettes 50.000 AVEBIOM’s data
Wood pellets 406.542 AVEBIOM’s data
Olive stones 130.000 La biomasa en Andalucía, 2015 / AVEBIOM’s data / CIEMAT’s data
Almond Shell 10.000 AVEBIOM’s data
TOTAL 2.706.292
BIOMASSES WITH POTENTIAL INTEREST IN SPAIN
Studying the potential of the forestry derived solid biofuels it’s obvious that there is still a big room for
increasing the utilisation of these biofuels. Nowadays, as per the IFN (National Forestry Inventory) the
wood stock has increased from 594 million of m3 in 1996 to 921 million of m3 in 2009 in the Spanish
forests. This is due to several reasons (economic crisis, abandon of rural areas, etc.) but the fact is that

This project has received funding from the European Union's Horizon 2020 research and innovation program under grant agreement No. 691763
This project has received funding from the European Union's Horizon 2020 research and innovation program under grant agreement No. 691763
in Spain it’s being cut around 16 million of m3 every year which means a 35% of the annual growth
when the European average is 61%. To confirm this data, with the application BIORAISE
(http://bioraise.ciemat.es/bioraise/) it has been calculated that there is an available potential of more
than 4.700.000 t DM /y of forestry biomass. Special mention has to be done to woody biomass coming
from scrubs with a lot of potential (2 million tDM/y from which 937.000 would be available as per the
BIORAISE). There is a Life+ project with CIEMAT and AVEBIOM among others entities involved to see
how some difficulties in the recollection, use, etc. can be solved (http://enerbioscrub.ciemat.es/).
Regarding agricultural biomasses, Spain as big producer has a lot of potential of agricultural by-
products. As per BIORAISE there is a total potential of 26 million tDM/y but applying different
restrictions, the available potential would of more than 12 million tDM/y. From these sources, the
most interesting biomasses that nowadays are not very used in biomass are olive tree prunnings and
vineyards prunnings. Actually they are used for energy uses (industrial, electric generation,…) but in
both most of the available quantities (90-95%) remains in the fields and are burned open air in order
to eliminate them9. Quantities available of these two biomasses are huge (1.455.168 tDM/y potential
available for olive trees and 675.000 tDM/y for vineyards as per BIORAISE and estimations from BTCII
project are even bigger). Although there are other agricultural biomasses feedstock with interesting
quantities usually are not giving enough quality, about all for domestic use or present some other
problems that complicates its utilisation or, as it also may happen, have an alternative use where they
have a bigger economic value and therefore is not viable its use for energy (i.e. livestock alimentation,
food use, etc.).
Another biomass that has potential as solid biofuel would be pistachio shells. Although there is small
quantities of this plant in Spain yet, the amount of ha with this feedstock are growing quickly and soon
would
EXPORTATIONS / IMPORTS OF THE SOLID BIOMASSES IN SPAIN
Spain is not a country with big exportations or importations of biomass. The most traded solid biofuels
out or inside our country are the wood pellets and the wood chips.
In the case of the wood pellets, the imports/exports are somehow balanced for the domestic market;
Spain is exporting to France and Italy mainly about 80.000 dTM/year, in these countries, prices of the
product are higher and consumption was not so depressed (although the 3 mild winters situation with
lower consumption was for the whole Europe). There are also exportations of industrial wood pellet
with electric generation as destiny, the quantities exported are 37.383 dTM/year. In the case of
industrial exportations the countries of destination change and are mainly England and Belgium.
Imports of wood pellets are coming from Portugal where the pellet plants are bigger, salaries lower
and consequently prices are lower. The quantity imported is approximately 80.000 dTM/year.
Regarding there are exportations of around 150.000 dTM/year of Wood Chips to Italy to be used in
power plants.
Another solid biofuel frequently exported is the olive stones, usually with Italy as destiny, of which, as
per the data available the quantities exported were 30.000 dTM/year. This is happening because there
was an surplus of this biofuel in Spain due to a good season, but it may happen that the case is the
9 Technical backgrounds for advanced techniques and technologies in biomass production for workshops and trainings.
Biomass Trade Centre II project. Francescato, Valter; Negrin Massimo; Rodero, Pablo

This project has received funding from the European Union's Horizon 2020 research and innovation program under grant agreement No. 691763
This project has received funding from the European Union's Horizon 2020 research and innovation program under grant agreement No. 691763
opposite, a lack of olive stone may trigger some imports of olive stones from North Africa (Tunisia,
Morocco,..)
In all cases of exportations, being big volumes that usually are done by few operators and sold to very
few clients, a change of fuel in the power plant, in the country regulations or change of supplier may
change the whole panorama from one year to the following. This is the case of the Olive Cake, an
industrial solid biofuel of which some years ago there was a lot of exportations for co-firing but in the
last years the trend is no exportations as the plants are not co-firing anymore and they prefer wood
pellets.
Table 6: Exports / Imports of solid biofuels (2015)
BIOFUEL EXPORTS
(t /y)
IMPORTS
(t /y)
MAIN IMPORT-EXPORT COUNTRIES/ FINAL USE
Source
Wood chips 150.000 0 Italy / Electric generation
AVEBIOM’s data
Wood pellets 86.542 (Domestic)
37.383 (Industrial)
80.000 Imports from Portugal
Exports to: France, Italy // Domestic - thermal purposes
Exports to England, Belgium // Electric
generation
Olive stones 30.000 0 Italy, AVEBIOM’s data
TOTAL 303.925 80.000
MAIN SUPPORTS FOR THE USE OF BIOMASS IN SPAIN
At National level there are economic support measures for installing biomass heating facilities in Spain,
which are implemented by IDAE (Institute for Energy Diversification and Saving, organism
depending on the Ministry of Industry, Energy and Tourism) and there is also a programme called
“Proyectos Clima”, which buys verified CO2 emissions reductions, managed by the Ministry of
Agriculture, Food and Environment.
Table 7: Subsidy programmes for the installation of biomass facilities at National level in Spain. Source: AVEBIOM

This project has received funding from the European Union's Horizon 2020 research and innovation program under grant agreement No. 691763
This project has received funding from the European Union's Horizon 2020 research and innovation program under grant agreement No. 691763
At regional level there are some Autonomous Communities with economic support measures, but they
are often more limited in time. In Table subsidies in several Regions are shown.
Table 8: Subsidy programmes for the installation of biomass facilities in several Regions of Spain. Source: AVEBIOM
Programme Description Budget for 2016
More information
PAREER-CRECE Support programme for energy refurbishing of existing buildings. Loans and direct subsidy. For biomass 25% subsidy and 65% loan
174,426,000 € (for all the categories)
http://www.idae.es/index.php/id.858/relmenu.409/mod.pags/mem.detalle
BIOMCASA II Programme for the implementation of projects of thermal biomass in buildings. Loans for the installation of biomass heating devices in buildings
848,000 € http://www.idae.es/index.php/idpag.722/relmenu.407/mod.pags/mem.detalle
GIT Financing to authorised firms of Large Thermal Installations running on renewable energies in the building sector. Loan. The launching of this financing programme responds to the need of boosting the implementation of large installations to produce thermal energy in building from the exploitation of renewable energies such as biomass. The maximum financing limit per project will amount to 80% of the value of the eligible investment (the one devoted to thermal generation), with a maximum absolute financing limit per individual project of €3,000,000.
7,873,000 € http://www.idae.es/index.php/idpag.638/relcategoria.1160/relmenu.385/mod.pags/mem.detalle
Proyectos Clima Programme of the Ministry of Agriculture, Food and Environment for buying CO2 emissions reduction (when changing from a fossil fuel boiler to a biomass boiler, for example). These emissions have to be verified by inspection bodies. In 2016 the price for the CO2 tonne avoided was 9,70 €/tm
20,000,000 € (for all the categories)
http://www.magrama.gob.es/es/cambio-climatico/temas/proyectos-clima/convocatorias-proyectos-seleccionados/Convocatoria_2016.aspx
Programme Description More information Subsidies for Renewable Energies in Murcia
Provides subsidies, according to the Operational Programme ERDF (European Regional Development Fund) Murcia 2014/2020, for companies established in the Region of Murcia, for the execution of investments for the following purposes: energy audits, renewal of equipment and energy consuming installations, improving energy efficiency in production processes, energy generation facilities at the consumption point
http://bit.ly/1RvIzhR
Cantabria subsidies for forest biomass
Subsidies for small companies and forest owners to support silvicultural activities
http://dgmontes.org/web/aten
cion-a-la-ciudadania/detalle/-
/journal_content/56_INSTA

This project has received funding from the European Union's Horizon 2020 research and innovation program under grant agreement No. 691763
This project has received funding from the European Union's Horizon 2020 research and innovation program under grant agreement No. 691763
MAIN PROBLAMATIC OF THE USE OF BIOMASS IN SPAIN
There are several barriers that can be classified in different categories
Sociological / training barriers:
Lack of knowledge on the use of biomass as fuel; In a survey made in 2014, 70% of the people
cannot explain what "biomass” is and do not know or mix up the meaning of “energy
efficiency”
There are doubts about certain topics of the biomass:
o Assurance of the supply. Although in the last years the distribution network has been
developed significantly about all for wood pellet, for certain biofuels is possible to find
some lacks in the chain of supply.
o Stability of the price in long term. Sometimes within the final users there are doubts
saying that when many people start consuming biomass the prices will rise up. This is
quite unlikely since there are lots of potential and it’s a global market not depending
only from the local sources. Also, in Austria, they have an index price since 2006 and
the prices had no significant difference since then.
o Emissions. Some fossil fuels operators are giving a bad image of the biomass because
of its competence with biomass by exaggerating the emissions of the biomass.
Although modern boilers fulfil legislation the bad image is arriving at the final users /
administrations in some cases.
extraction NCE_DETALLE/16401/367
4520 Basque Country Biomass Subsidies
Eligible Biomass activities: - Biomass facilities with boilers for thermal energy production by producing hot water, superheated water or steam. - Boilers for producing hot air, although the nominal power must exceed 70 kW. - New connections to existing district heating facilities.
http://www.eve.eus/Progra
mas-de-ayuda/Biomasa-
2016.aspx
Subsidies for Renewable Energies in Castilla la Mancha
Subsidies financed by the European Regional Development Fund, for the use of renewable energy in Castilla la Mancha. These Subsidies are related to the measures that support the clean energy production and ensure a reduction in CO2 emissions. They are also an instrument to promote the use of clean energies favouring a fully sustainable energy development model.
http://docm.castillalamanc
ha.es/portaldocm/descarga
rArchivo.do?ruta=2016/01
/07/pdf/2015_15522.pdf&t
ipo=rutaDocm
Galicia Biomass Subsidies
Subsidies for thermal biomass Projects to be carried out in Galicia for individuals and groups. Maximum subsidy: 50% or 50,000€ (120,000 € for groups).
http://www.inega.es/subvenci
ons/subvencions/Energiasren
ovables/2016/ficha_renovabl
es2016_0002.html

This project has received funding from the European Union's Horizon 2020 research and innovation program under grant agreement No. 691763
This project has received funding from the European Union's Horizon 2020 research and innovation program under grant agreement No. 691763
o There is a lack of skilled and experienced professionals in the field of technologies for
biomass production and boiler / stoves installations.
Economic barriers:
The investment needed for a biomass installation, although they have decreased in the last
years, are still higher than other fossil fuels installation. In the long term it’s profitable due to
the lower price of the biofuels.
Competition against fossil fuels. The barrel price has been very low for the last 2-3 years and
consequently the prices of the competitors fossil fuels were in some occasion very similar. Also
the companies installing natural gas or other competitors have bigger economic resources for
marketing, financing installations, etc.
Most of the companies dealing with biomass are very small and have financial difficulties
about all when there are some special conditions in the market (weather, low price of fossil
fuels, etc.)
In the last year there are few financial incentives or grants to change to biomass or install a
biomass device.
In the electric sector, the legislation changed some years ago and nowadays is not affordable
to install new power plants. The legislation changed making some projects that were already
being built unprofitable so this is causing a legislation insecurity for the investments that will
last for years
Administrative barriers:
Complex administrative procedures for obtaining various permits for construction of biomass
plants;
There is a lack of cooperation between different sectors (ministries of energy, industry,
environment, agriculture).
Burocratic burden for cut permits
Technical barriers:
Highly fragmented forest areas that make unprofitable some forests.
High transport cost that could be solved changing the limitation of tonnage transported in the
trucks
CONCLUSIONS
Spain has a huge potential of biomass and there is still a big margin to keep on growing in the use of
local biomass. Although there has been a big development in the last years in terms of production,
consumption and distribution of solid biofuels still there is margin to improve and grow since there are
big potentials available about all in forestry sources but also in some agricultural biomasses like olive
tree prunnings or vineyards that nowadays are underused. The solid biofuels which grew more were

This project has received funding from the European Union's Horizon 2020 research and innovation program under grant agreement No. 691763
This project has received funding from the European Union's Horizon 2020 research and innovation program under grant agreement No. 691763
wood pellets and wood chips (but wood chips mostly in industrial) but there Spain is only using a 35%
of the annual growth of the trees as per the IFN (National Forestry Inventory) when the average in
Europe is a 61%. This underuse of the wood has caused that wood stock has doubled in the last years.
The growth in the use of solid biofuels has been important but some external factor have affected to
the market making the development slower than foreseen. The low price of the petrol barrel for the
last two years have turned some fossil fuel more competitive towards biomass provoking mostly a
delay in the replacement of old installations. Also, for 3 heating seasons in a row the temperatures
were quite mild and the consumption went down, fortunately for biomass sector, the last season was
normal and markets recovered a little.
In the case of wood pellets the growth has been quite important doubling the production from 2012 to
2016 (passing from 250.000 to 550.000 TM/y) and almost tripling the consumption (175.000 Tm in
2012 to 475.000 in 2016) but this fast implementation of production facilities brought some problems
to the market making the prices go down as the demand didn’t grow accordingly or at least the usage
due to mild temperatures in the last 3 winters were smaller than expected.
There is still margin to grow or improve in some solid biofuels like for example olive stones, nut shells
(almond, pine nut,…) which are used mostly without valorising them (not drying or screening) in
industrial applications
There are other biomasses with a big potential such as Olive tree prunings and vineyard prunings
because the quality is fair enough, not for a small boiler or stove but enough for farms or mid-size
installations such district heatings and the quantities available in Mediterranean countries and
specially in Spain are huge.
Spain is not a country very important in exportations or importations. Only some not very significant
quantities of wood pellets, wood chips and olive stones are traded from/to abroad.
Since 2012, the legislation for electric generation from biomass changed and the feed in tariff were
derogated and since then is not financially viable to develop a power plant with biomass. Many project
went down even with terrains and construction started because of this legislation change and brought
an legislation insecurity that will last for years.
Regarding heating purposes there has been more stability in the support for biomass. There are some
national schemes promoted by IDAE but there are many from the different Autonomous Communities
although they are more variable in the time. Also there is a program buying verified CO2 tonnes saved
managed by FES CO2 (MAGRAMA)
REFERENCES
IDAE. Support programs, Information in general. www.idae.es
BIORASE. Ciemat. http://bioraise.ciemat.es/bioraise/
ENERBIOSCRUB Project. http://enerbioscrub.ciemat.es/
Observatorio de Biomasa. Promoted by AVEBIOM. http://www.observatoriobiomasa.es/

This project has received funding from the European Union's Horizon 2020 research and innovation program under grant agreement No. 691763
This project has received funding from the European Union's Horizon 2020 research and innovation program under grant agreement No. 691763
Bioenergy International. http://bioenergyinternational.es/
Technical backgrounds for advanced techniques and technologies in biomass production for
workshops and trainings. Biomass Trade Centre II project. Francescato, Valter; Negrin
Massimo; Rodero, Pablo
National Forestry Inventory. MAGRAMA www.magrama.gob.es
Oficina Cambio Climático. Proyectos Clima. http://www.mapama.gob.es/es/cambio-
climatico/temas/organismos-e-instituciones-implicados-en-la-lucha-contra-el-cambio-
climatico-a-nivel-nacional/oficina-espanola-en-cambio-climatico/
La Biomasa en Andalucia (2015). Agencia Andaluza de la Energía
www.agenciaandaluzadelaenergia.es
Ente vasco de la Energia. www.eve.eus
Instituto Enerxético de Galicia. www.inega.es
Junta de Castilla la Mancha. http://www.castillalamancha.es/
Dirección General de Montes de Cantabria. http://dgmontes.org/web/gobierno/home

107
This project has received funding from the European Union's Horizon 2020 research and innovation program under grant agreement No. 691763
This project has received funding from the European Union's Horizon 2020 research and innovation program under grant agreement No. 691763
State of the art of the biomass market. Report of Turkey

108
This project has received funding from the European Union's Horizon 2020 research and innovation program under grant agreement No. 691763
This project has received funding from the European Union's Horizon 2020 research and innovation program under grant agreement No. 691763
INTRODUCTION
In the year of 2014, 100 million 734 thousand 472 tonne of oil equivalent (TOE) energy consumed in
industry and service sectors in Turkiye. The consumption quantity was 86 million 136 thousand 765
TOE in industry while 14 million 597 thousand 707 TOE in service sectors. Electricity production and
distribution, manufacturing, and transportation and storage sectors have the highest share sectors
with 42.4%, 38.4%, and 9.5%, respectively in total energy consumption. Natural gas was the most
consumed fuel with 32 million 498 thousand 888 TOE. According to annual consumptions on the fuel
basis, natural gas was mostly consumed fuel in 2014. The second consumed fuel was lignite with 16
million 416 thousand 93 TOE while third fuel was hard coal with 15 million 981 thousand 137 TOE.
Table 1. Breakdown of total energy consumption by fuel type, 2014[1].
MAIN COMMERCIALIZED SOLID BIOFUELS IN TURKIYE
Main commercialized solid biofuels in Turkiye are as follows:
Hazelnut shell
Wallnut shell
Pistachio shell
Wood pellet
Olive stone
Olive oil cake
BIOMASSES WITH POTENTIAL INTEREST IN TURKIYE
Biomass is one of the rising stars of the renewable energy sector. According to the definition in the
Renewable Energy Law (REL), biomass is a resource obtained from agricultural and forestry products
including vegetable oil waste, agricultural harvesting waste as well as from organic waste, and from
the by-products formed after their processing. Biomass sources include agriculture, forests, animals,
organic urban waste, etc.
Waste potential is around 8.6 million tons equivalent of petroleum (TEP), 6 million TEP is used for
heating.

109
This project has received funding from the European Union's Horizon 2020 research and innovation program under grant agreement No. 691763
This project has received funding from the European Union's Horizon 2020 research and innovation program under grant agreement No. 691763
Installed Power Capacity in Turkey (2013): 241MWe
Total Amount of Waste from Forests is 4,800,000 Tons (1.5 MTEP) (600 MW)
From Agriculture 15,000,000 Tons (300 PJ)
Potential map of biomass energy (BEPA) is prepared by GDRE [2].
Table 1. Global country agro-industry biomass resources [3].
SECTOR OF
ACTIVITY
TYPE OF BY-
PRODUCTS
POTENTIAL
(t DM/y)
Wood
industries
Bark 600,000
Clean wood by-
products (wood
based panel)
6,500,000
Other wood by-
products
(specify)
-
Nut hulling
industry
Almond Shell 40,000
Chopped pine
cone
-
Pistachio shells 72,000
Hazelnut shell 323,000
Other(Almond
shell)
40,000
Olive oil
industry
Olive stones 1,750
Exhausted olive
cake
850,000
TOTAL AGROINDUSTRY 8,426,750
EXPORTATIONS / IMPORTS OF THE SOLID BIOMASSES IN TURKEY
Turkey has tremendous ecosystem richness due to its geographical location. For this reason, olive
wastes, hazelnut wastes, pistachio wastes, grape wastes, walnut wastes and more biomass varieties
are combined in Turkey.
According to the information from the shell traders, there is an incredible trade in the nut /fruit shell
market. Because of the high quality energy and low ash from shells. But, the market is dominated by
local bargainers. Bakeries and some people of small towns use nut shells for heating and cooking. But,

110
This project has received funding from the European Union's Horizon 2020 research and innovation program under grant agreement No. 691763
This project has received funding from the European Union's Horizon 2020 research and innovation program under grant agreement No. 691763
there are no exact statistics about biomass trade except for wood chips.
Turkey’s imports of wood chips and scrap (HS 4401) increased significantly due to a surge in demand
from local MDF and chipboard producers. Total imports increased from 48,000 MT in 2005 to 544,000
MT in 2006 eventually reaching 974,000 MT in 2008 and 1.6 million MT in 2009. The US is the leading
supplier in this category, providing some 500,000 MT, followed by Brazil with 323,000 MT. The Ukraine
and Bulgaria were other leading suppliers of wood chip and scrap to Turkey in 2009 with 387,000 MT
and 55,000 MT respectively. Canada and Venezuela are also among the leading suppliers of wood
chips to Turkey. Due to the way in which imports in this category are recorded, it is virtually impossible
to distinguish what percentage of these imports was hardwood or softwood.[4]
MAIN SUPPORTS FOR THE USE OF BIOMASS IN TURKEY
National legislation on biomass heating systems for the domestic sector
According to the Ministerial Decree [5], boilers using solid biofuels in Turkey should meet at least the
requirements for emissions of TS EN 303-5-2013-04 standard, identified with the standard as
described in paragraph 5. Efficiency and emission limits are shown in Table 1, Table 2 and Table 3 [6].
There is no strict regulation about usage of biomass (wood pellets, hazelnut shell, apricot kernel,
peach shell, walnut shell, pistachio shell) in Turkey. However, according to legislation of Ministry of
Environment and Urbanization solid biofuel should meet the emission criteria.
Biomass use and heating systems in the domestic heating sector
Energy demand of Turkey is increasing year by year depending on increase of population. From 1985s
up to now, while natural gas usage increased remarkably, the use of petroleum liquid products almost
depleted. Although the use of coal in industry has been increased, it has been greatly diminished in
domestic. Share of renewable energy in residential sector has been increasing from almost 0% to 5%
since 2005. Due to lack of its own sufficient natural gas sources, Turkey pays 34.76-23.45 billion $
(2014-2015) for importation of natural gas [7]. There are new studies to abate this energy deficit.
Turkey continues to gain new energy perspectives with EU close relationships. Coal has been replaced
with biofuels in domestic use. The initiation of governmental support for purchase of biomass heating
systems might promote solid biofuel use in Turkiye.
Turkiye has a huge biomass potential. Due to the unawareness of market of biomass in Turkey, there is
no support for use of biomass products. However, biomass potential is high enough to build a biomass
market system. Subsequently, BIOMASUDPLUS project results may lead certified products and then
create a market that supported by legislations by government.
MAIN PROBLEMATIC OF THE USE OF BIOMASS IN TURKEY
-Sustainable biomass products
-Sustainable biomass quality
-No support for use of biomass
-Biomass stove and products are expensive than traditional stoves.
CONCLUSIONS
At present, energy plays a vital role in sustainable social-economical development and raising living
quality.Turkey has an abundance of renewable energy sources but has not evaluated them sufficiently
for technical and economical reasons. Moreover, meeting energy demand is essential for being able to
continue sustainable development in the economy and improving the living conditions of humankind.
Furthermore, Turkey can provide all energy demand from renewable energy sources, especially
111
This project has received funding from the European Union's Horizon 2020 research and innovation program under grant agreement No. 691763
This project has received funding from the European Union's Horizon 2020 research and innovation program under grant agreement No. 691763
biomass. If native energy sources like biomass are evaluated sufficiently and efficiently,
energydependence on foreign countries will decline dramatically. The appearance of energy
importation into country will also vanish. Biomass can be used to meet a variety of energy needs,
including generating electricity, heating homes, fueling vehicles and providing process heat for
industrial facilities. Turkey is a developing country with rich biomass potential. Limited sources of
petroleum-based fuel made the subject of producing quality energy and productive usage of itan
important point for Turkey. Among the renewable energy sources, fuelwood seems to be the most
interesting because its share of the total energy production of Turkey is high, and the techniques for
converting it to useful energy are not necessarily sophisticated.
Due to some technological and economical consequences, renewable energy resources have wide
applications neither in the world nor in Turkey at present . Biomass can be used to meet a variety of
energy needs, including generating electricity, heating homes, fueling vehicles and providing process
heat for industrial facilities.
REFERENCES
1. Sectoral Energy Consumption Statistics, 2014, Turkstat.
2. Flanders Investment and Trade Market Survey, Renewable Energy in Turkey, December 2014
Ezgi Çeri Fidan, Trade Consultant, Flanders Investment & Trade, Istanbul office Edited
by
Raphael Pauwels, Trade Commissioner.
3. http://www.tuik.gov.tr/PreTablo.do?alt_id=1001, 2015.
4. Virginia Economic Development Partnership,January-2014
5. Isınmadan Kaynaklanan Hava Kirliliğinin Kontrolü Yönetmeliği, Resmi Gazete Tarihi: 13.01.2005,
Resmi Gazete Sayısı: 25699.
6. EN 303-5 Standard: Heating boilers - Part 5: Heating boilers for solid fuels, manually and
automatically stoked, nominal heat output of up to 500 kW - Terminology, requirements, testing and
marking, 2013.
7. TÜİK, Sektörel Enerji Tüketim İstatistikleri,2005. Available online at:
www.tuik.gov.tr/PreTablo.do?alt_id=1029 [Accessed September 2016].

112
This project has received funding from the European Union's Horizon 2020 research and innovation program under grant agreement No. 691763
This project has received funding from the European Union's Horizon 2020 research and innovation program under grant agreement No. 691763
Market data for Croatia
Biomass availability, quality, costs and use
a. Which are the biomass resources available and how much annually?
Table a.1.- Global country field biomass resources potential and consumption.
FORESTS Source Comments
POTENTIAL
(t DM/y)
Conifers 97,000 Research done under S2Biom FP7
project
Year 2012, http://www.s2biom.eu/en/
Broadleaves 3,328,000 Research done under S2Biom FP7
project
Year 2012, http://www.s2biom.eu/en/
Mixed forests N/A N/A -
Shrubs N/A N/A -
Other (specify) N/A N/A -
TOTAL FORESTS 3,425,000
AGRICULTURE
POTENTIAL
(t DM/y)
Rain-fed crops N/A N/A 3,627 hectares of area is irrigated, while utilized surface of
agricultural area is 1,508,885 hectares in 2014, Croatian
Bureau of Statistics
Irrigated crops N/A N/A 3,627 hectares of area is irrigated, while utilized surface of
agricultural area is 1,508,885 hectares in 2014, Croatian
Bureau of Statistics
Rice crops N/A N/A -
Olive plantations
43,993 Faculty of Agriculture,
University of Zagreb
Year 2014
Orchard plantations
63,116 Faculty of Agriculture,
University of Zagreb
Year 2014

113
This project has received funding from the European Union's Horizon 2020 research and innovation program under grant agreement No. 691763
This project has received funding from the European Union's Horizon 2020 research and innovation program under grant agreement No. 691763
Vineyards 90,954 Faculty of Agriculture,
University of Zagreb
Year 2014
Cereal straw 274,815 – 296,800 Faculty of Agriculture,
University of Zagreb
Year 2013, based on the assumption that 30% of residues is available for energy use
Sunflowers stalks
38,011 – 63,099 Faculty of Agriculture,
University of Zagreb
Year 2013, based on the assumption that 30% of residues is available for energy use
Soybean straw 30,659 – 42,309 Faculty of Agriculture,
University of Zagreb
Year 2013, based on the assumption that 30% of residues is available for energy use
Corn stover 410,602 – 529,677 Faculty of Agriculture,
University of Zagreb
Year 2013, based on the assumption that 30% of residues is available for energy use
TOTAL AGRICULTURE
952,150 - 1,129,948

114
This project has received funding from the European Union's Horizon 2020 research and innovation program under grant agreement No. 691763
This project has received funding from the European Union's Horizon 2020 research and innovation program under grant agreement No. 691763
Table a.2.- Global country agro-industry biomass resources
SECTOR OF ACTIVITY
TYPE OF BY-PRODUCTS
POTENTIAL
(t DM/y)
Source Comments
Wood industries Bark 20,043 UNECE/FAO
Joint Wood
Energy Enquiry
(JWEE) 2015.
United Nations,
Geneva.
Year 2013, 131,000 m3,
assumption density 180
kg/m3, humidity 15%
Clean wood by-
products (chips etc) 91,840 UNECE/FAO
Joint Wood
Energy Enquiry
(JWEE) 2015.
United Nations,
Geneva.
Year 2013, 400,000 m3,
assumption density 328
kg/m3, humidity 30%
Other wood by-
products - wood
residues
72,080 UNECE/FAO
Joint Wood
Energy Enquiry
(JWEE) 2015.
United Nations,
Geneva.
Year 2013, 530,000 m3,
assumption density 160
kg/m3, humidity 15%
Nut hulling industry Almond Shell N/A N/A -
Chopped pine cone N/A N/A -
Pine nut shells N/A N/A -
Hazelnut shell 297 Production
2014: 990 t
(Croatian
Bureau of
statistics)
Assumed RPR 0,3
Wallnuts shell 1,205 Production
2014: 4,015 t
(Croatian
Bureau of
statistics)
Assumed RPR 0,3
Other(specify) N/A N/A N/A
Olive oil industry Olive stones 2,652 Production
2014: 8,840 t
olives (Croatian
Bureau of
statistics)
Assumed RPR 0,3
http://www.fao.org/doc
rep/003/X6545E/X6545E
01.htm
Exhausted olive cake 3,228 Production
2014: 8,840 t
olives (Croatian
Bureau of
statistics)
Assumed RPR 0,44
(H=17%)
http://www.fao.org/doc
rep/003/X6545E/X6545E
01.htm
TOTAL AGROINDUSTRY 191,345

115
This project has received funding from the European Union's Horizon 2020 research and innovation program under grant agreement No. 691763
This project has received funding from the European Union's Horizon 2020 research and innovation program under grant agreement No. 691763
Table a.3.- Solid biofuels production
BIOFUEL DOMESTIC QUALITY
(tDM /y)
INDUSTRIAL QUALITY
(tDM /y)
TOTAL
(tDM /y)
Source Comments
Firewood N/A N/A 2,005,557
Energy in Croatia 2014
Potential is calculated from 5,302,200 m3 firewood, and density of 445 kg/m3, and humidity %
Wood chips N/A N/A 354,356 Energy in Croatia 2014
-
Other chips (e.g.
pruning) N/A N/A N/A N/A -
Wood briquettes N/A N/A 43,266 Energy in Croatia 2014
-
Wood pellets N/A N/A 192,275 Energy in Croatia 2014
-
Other pellets (e.g.
pruning) N/A N/A N/A
N/A -
Olive stones N/A N/A N/A
N/A No known use residues, potential as written in Table a.2.
Exhausted olive cake
N/A N/A N/A
N/A No known use residues, potential as written in Table a.2.
Nut shells N/A N/A N/A
N/A No known use of shells, potential as written in Table a.2.
Almond Shell N/A N/A N/A N/A -
Chopped pine cone N/A N/A N/A N/A -
Pine nut shells N/A N/A N/A N/A -
Hazelnut shell N/A N/A N/A N/A -
Other(specify) N/A N/A N/A N/A -
Other(specify) N/A N/A N/A N/A -
TOTAL 2,595,454
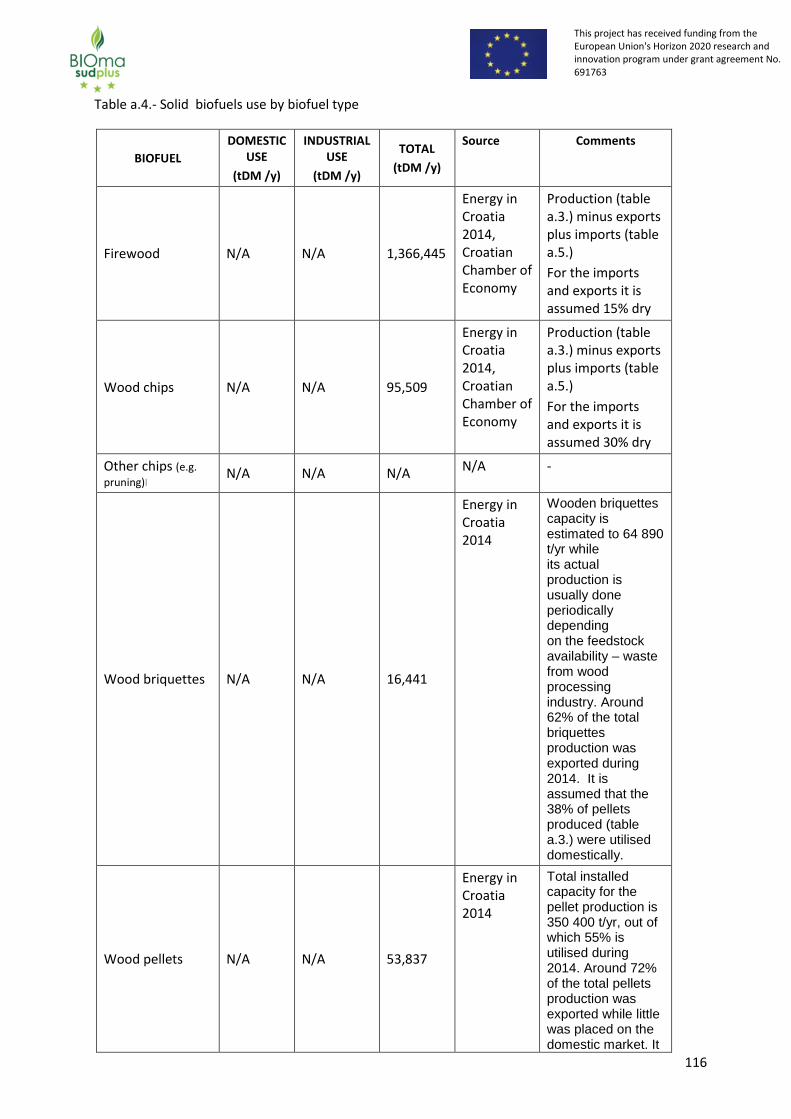
116
This project has received funding from the European Union's Horizon 2020 research and innovation program under grant agreement No. 691763
This project has received funding from the European Union's Horizon 2020 research and innovation program under grant agreement No. 691763
Table a.4.- Solid biofuels use by biofuel type
BIOFUEL DOMESTIC
USE
(tDM /y)
INDUSTRIAL USE
(tDM /y)
TOTAL
(tDM /y)
Source Comments
Firewood N/A N/A 1,366,445
Energy in Croatia 2014, Croatian Chamber of Economy
Production (table a.3.) minus exports plus imports (table a.5.)
For the imports and exports it is assumed 15% dry
Wood chips N/A N/A 95,509
Energy in Croatia 2014, Croatian Chamber of Economy
Production (table a.3.) minus exports plus imports (table a.5.)
For the imports and exports it is assumed 30% dry
Other chips (e.g.
pruning)l N/A N/A N/A
N/A -
Wood briquettes N/A N/A 16,441
Energy in Croatia 2014
Wooden briquettes capacity is estimated to 64 890 t/yr while its actual production is usually done periodically depending on the feedstock availability – waste from wood processing industry. Around 62% of the total briquettes production was exported during 2014. It is assumed that the 38% of pellets produced (table a.3.) were utilised domestically.
Wood pellets N/A N/A 53,837
Energy in Croatia 2014
Total installed capacity for the pellet production is 350 400 t/yr, out of which 55% is utilised during 2014. Around 72% of the total pellets production was exported while little was placed on the domestic market. It

117
This project has received funding from the European Union's Horizon 2020 research and innovation program under grant agreement No. 691763
This project has received funding from the European Union's Horizon 2020 research and innovation program under grant agreement No. 691763
is assumed that the 28% of pellets produced (table a.3.) were utilised domestically.
Other pellets (e.g.
pruning) N/A N/A N/A
N/A -
Olive stones N/A N/A N/A N/A -
Exhausted olive cake
N/A N/A N/A N/A -
Nut shells N/A N/A N/A
N/A No known use of shells, potential as written in Table a.2.
Almond Shell N/A N/A N/A N/A -
Chopped pine cone N/A N/A N/A N/A -
Pine nut shells N/A N/A N/A N/A -
Hazelnut shell N/A N/A N/A N/A -
Other(specify) N/A N/A N/A N/A -
Other(specify) N/A N/A N/A N/A -
TOTAL N/A N/A 1,532,232 N/A -

118
This project has received funding from the European Union's Horizon 2020 research and innovation program under grant agreement No. 691763
This project has received funding from the European Union's Horizon 2020 research and innovation program under grant agreement No. 691763
b. How much is imported and/or exported annually?
Table b.1.- Solid biofuels imports/exports
BIOFUEL EXPORTS
(t /y)
IMPORTS
(t /y)
MAIN IMPORT-EXPORT
COUNTRIES/ FINAL USE
Source Comments
Firewood
656,554 17,441 Main Export in
Italy, Slovenia,
Hungary, Austria
Main Import from
BIH, Slovenia
Croatian
Chamber of
Economy
Year:
2014
Wood chips
371,202 1,420 Main Export in
Hungary,
Slovenia, Austria
Main Import from
Slovenia
Croatian
Chamber of
Economy
Year:
2014
Other chips (e.g.
pruning) N/A N/A N/A N/A -
Wood briquettes N/A N/A N/A N/A -
Wood pellets
161,203 3,945 Main Export in
Italy, Slovenia,
Austria
Main Import from
BIH
Croatian
Chamber of
Economy
Year:
2014
Other pellets (e.g.
pruning) N/A N/A N/A N/A -
Sawdust and wood waste
42,620 1,027 Main Export in
Slovenia, Italy,
Germany
Main Import from
BIH
Croatian
Chamber of
Economy
Year:
2014
Olive stones N/A N/A N/A N/A -
Exhausted olive cake
N/A N/A N/A N/A -
Nut shells N/A N/A N/A N/A -
Almond Shell N/A N/A N/A N/A -
Chopped pine cone
N/A N/A N/A N/A -
Pine nut shells N/A N/A N/A N/A -
Hazelnut shell N/A N/A N/A N/A -
Other(specify) N/A N/A N/A N/A -
Other(specify) N/A N/A N/A N/A -

119
This project has received funding from the European Union's Horizon 2020 research and innovation program under grant agreement No. 691763
This project has received funding from the European Union's Horizon 2020 research and innovation program under grant agreement No. 691763
TOTAL 1,231,579 23,833 N/A N/A -

120
This project has received funding from the European Union's Horizon 2020 research and innovation program under grant agreement No. 691763
This project has received funding from the European Union's Horizon 2020 research and innovation program under grant agreement No. 691763
c. What are the typical costs of the biofuels for commercial and private customers?
Table c.1.- Solid biofuels prices
Biofuel Commercial customers typical cost
€/t
Domestic customers typical cost
€/t
Source Comments
Meter of wood N/A 90 Njuskalo.hr 25% VAT, delivery included
Bag of pellets (15kg)
N/A 193 Njuskalo.hr 25% VAT
Wood chips 40 N/A Croatian Forest Ltd.
25% VAT
Wood bricket 110 170 Piljak.hr
Njuskalo.hr
25% VAT

121
This project has received funding from the European Union's Horizon 2020 research and innovation program under grant agreement No. 691763
This project has received funding from the European Union's Horizon 2020 research and innovation program under grant agreement No. 691763
d. Where are the biofuels used
This question is to complement the information in table a3.
Table d.1.- Solid biofuels use by sector
Sector Total
Ammount
t/y
Main type of
biofuel used
Reference Comments
Agricultural-farm
sector
N/A N/A Energy in Croatia
2014, Ministry of
Economy
-
Biomass power
plants (only
electricity)
55,838,8 Wood chips Energy in Croatia
2014, Ministry of
Economy
Assumed NCV 12,1
MJ/dm3, density 328
kg/m3, not
only DM
Co-firing power
plants(only
electricity)
N/A N/A Energy in Croatia
2014, Ministry of
Economy
-
CHP and CHPC
plants residential
sector
N/A N/A Energy in Croatia
2014, Ministry of
Economy
-
CHP and CHPC
plants industrial
sector
2,837,3 Wood chips Energy in Croatia
2014, Ministry of
Economy
Assumed NCV 12,1
MJ/dm3, density 328
kg/m3, not only DM,
additional 1085,6
ktoe for heating and
other use in indutry
Residential not
CHP
2,104,711,3 Firewood Energy in Croatia
2014, Ministry of
Economy
Assumed density NCV
9 MJ/dm3, 445
kg/m3, households
1012,9 ktoe, services
3,8 ktoe, not only DM
e. Are being used certified solid biofuels in the market? Please specify types, certification standards
and annual quantities.
Table e.1.- Solid biofuels imports/exports
Biofuel Certification
standard
Annual
amount
Source Comments

122
This project has received funding from the European Union's Horizon 2020 research and innovation program under grant agreement No. 691763
This project has received funding from the European Union's Horizon 2020 research and innovation program under grant agreement No. 691763
t/y
Wood Pellet EN plus A1 7 200 www.pilana-
mrkopalj.hr
The producer is Pilana Mrkopalj,
with current production of
1t/hour per year (300 working
days).
Wood Pellet EN plus
A1/A2
N/A www.pellets.h
r
The producer is Energy Pellets,
and has a production capacity of
30.000 t/y, the actual annual
amount is not disclosed.
Wood Pellet EN plus A1 12 000 www.velpel.hr The producer is Velpel Ltd.
Wood Pellet EN plus A2 N/A www.spacva.h
r
The producer is Spacva Ltd and
has a max.production capacity of
50 000 t/y, the actual annual
amount is not disclosed. Source:
Catalogue of forestry companies
and wood fuel producers
(2012/2013),
http://www.biomasstradecentre
2.eu/wood-biomass-
production/catalogues/
Wood Pellet EN plus A2 N/A www.sisarka.c
om
The producer is Sisarka Ltd. and
has a max. production capacity
of 50 000 t/y, the actual annual
amount is not disclosed. Source:
Catalogue of forestry companies
and wood fuel producers
(2012/2013),
http://www.biomasstradecentre
2.eu/wood-biomass-
production/catalogues/
Wood Pellet EN plus A1 N/A www.mundus-
viridis.hr
The producer is Mundus Viridis
Ldt. and has a max.production
capacity of 10 000 t/y. The
actual annual amount is not
disclosed. Source: Catalogue of
forestry companies and wood
fuel producers (2012/2013),
http://www.biomasstradecentre
2.eu/wood-biomass-
production/catalogues/
Wood Pellet EN plus A1 N/A www.drvenjac
a.hr
The producer is Drvenjaca and
has a max.production capacity of
7 200 t/y. The actual annual
amount is not disclosed. Source:

123
This project has received funding from the European Union's Horizon 2020 research and innovation program under grant agreement No. 691763
This project has received funding from the European Union's Horizon 2020 research and innovation program under grant agreement No. 691763
Catalogue of forestry companies
and wood fuel producers
(2012/2013),
http://www.biomasstradecentre
2.eu/wood-biomass-
production/catalogues/
Wood Pellet EN plus A2 N/A www.pelet-
gamauf.com
The producer is Gamauf and has
a max.production capacity of 21
600 t/y. The actual annual
amount is not disclosed. Source:
Catalogue of forestry companies
and wood fuel producers
(2012/2013),
http://www.biomasstradecentre
2.eu/wood-biomass-
production/catalogues/
In Croatia, there are 14 ENplus
certified producers
(http://www.enplus-
pellets.eu/production/certified-
producers/). For a few certified
producers there are no available
information about annual
amount or max. production
capacity.

124
This project has received funding from the European Union's Horizon 2020 research and innovation program under grant agreement No. 691763
This project has received funding from the European Union's Horizon 2020 research and innovation program under grant agreement No. 691763
Market data for Greece
Biomass availability, quality, costs and use
a. Which are the biomass resources available and how much annually?
Table a.1.- Global country field biomass resources potential and consumption.
FORESTS Source Comments
POTENTIAL
(t DM/y)
Conifers 1,347,191
FOREST EUROPE, UNECE and FAO 2011,
other literature & calculation
Broadleaves 2,413,254
FOREST EUROPE, UNECE and FAO 2011,
other literature & calculation
Mixed forests N/A
Shrubs N/A
TOTAL FORESTS 3,760,445
AGRICULTURE
Herbaceous crops
4,764,101 EUROSTAT (2014) &
calculation
Sum of potential from herbaceous species listed
below.
Soft wheat straw
614,565 -//-
Durum wheat straw
1,049,678 -//-
Rye straw 52,774 -//-
Oat straw 87,905 -//-
Barley straw 442,851 -//-
Maize residues 1,117,665 -//-
a. Rice
straw 237,363 -//-
b. Sunflow
er straw 282,958 -//-
c. Rapese
ed straw 1,477
d. Cotton
stalks 876,865
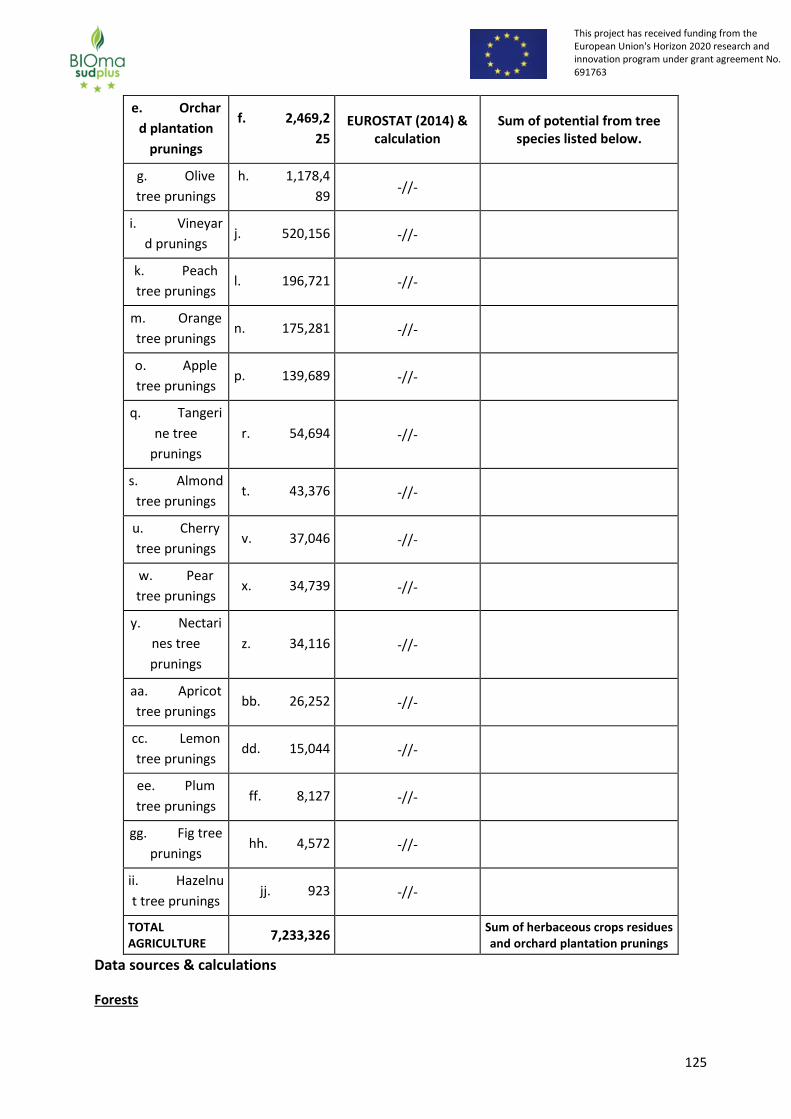
125
This project has received funding from the European Union's Horizon 2020 research and innovation program under grant agreement No. 691763
This project has received funding from the European Union's Horizon 2020 research and innovation program under grant agreement No. 691763
e. Orchar
d plantation
prunings
f. 2,469,2
25 EUROSTAT (2014) &
calculation Sum of potential from tree
species listed below.
g. Olive
tree prunings
h. 1,178,4
89 -//-
i. Vineyar
d prunings j. 520,156 -//-
k. Peach
tree prunings l. 196,721 -//-
m. Orange
tree prunings n. 175,281 -//-
o. Apple
tree prunings p. 139,689 -//-
q. Tangeri
ne tree
prunings
r. 54,694 -//-
s. Almond
tree prunings t. 43,376 -//-
u. Cherry
tree prunings v. 37,046 -//-
w. Pear
tree prunings x. 34,739 -//-
y. Nectari
nes tree
prunings
z. 34,116 -//-
aa. Apricot
tree prunings bb. 26,252 -//-
cc. Lemon
tree prunings dd. 15,044 -//-
ee. Plum
tree prunings ff. 8,127 -//-
gg. Fig tree
prunings hh. 4,572 -//-
ii. Hazelnu
t tree prunings jj. 923 -//-
TOTAL AGRICULTURE
7,233,326 Sum of herbaceous crops residues
and orchard plantation prunings
Data sources & calculations
Forests

126
This project has received funding from the European Union's Horizon 2020 research and innovation program under grant agreement No. 691763
This project has received funding from the European Union's Horizon 2020 research and innovation program under grant agreement No. 691763
In 2010, the forest area in Greece was 3,903,000 ha, of which 3,595,000 ha (92%) were available for
wood production (Source: FOREST EUROPE, UNECE and FAO 2011: State of Europe’s Forests 2011.
Status and Trends in Sustainable Forest Management in Europe). The growing stock was given as 47
m3/ha.
The same source indicated that the Net Annual Increment (NAI) in Greece was 3,813,000 m3 (overbark)
or 1.3 m3/ha. Data for the NAI of broadleaves and conifers were not presented in this report or other
statistical sources, e.g. FAO.
In a presentation of the Secretary of the Special Secretariat of Forests (Source: G. Amorgianiotis,
Economy and Forestry. Presentation at workshop ”Greek Forestry: A big advantage for the Greek
economy”, 16th May 2001, in Greek), the following information is presented regarding the distribution
and NAI of the Greek forests:
22.2% of the forests are coniferous, with a NAI of 2.82 m3/ha.
29.4% of the forests are broadleaves, with a NAI of 2.12 m3/ha.
48.4% of the forests are evergreen broadleaves, with a NAI of 0.45 m3/ha
For the conversion of cubic meters overbark to dry matter, Biomass Conversion and Expansion Factors
(BCEF) are used. A BCEF of 0.8 for broadleaves and 0.6 for conifers is considered, based on the IPCC
Guidelines for the Mediterranean / dry tropical / subtropical climate zones with a stocking of between
41-80 m3/ha.
The equation giving the forest potential for each main forest species is the following
( ) ( ) ( ) ( )
The calculated results are given in Table a.1. The potential presented can be used as industrial wood,
firewood, etc.
Agriculture: Herbaceous crop residues For the herbaceous crop residues in Greece, the following formula is applied:
( ) ( ) ( )
The main reference for the Residue to Product Ratios (RPRs) and typical moisture contents is the
following paper: Scarlat, N., M. Martinov, and J.-F. Dallemand, Assessment of the availability of
agricultural crop residues in the European Union: Potential and limitations for bioenergy use. Waste
Management, 2010. 30(10): p. 1889–1897. For cotton, the reference is Apostolakis, M. Kyritsis, S.,
Souter, Ch., The energetic potential of biomass from agricultural and forestry by-products (a study in
Greek territory). 1987, ELKEPA, Athens (in Greek).
Crop RPR Moisture content (W)
Soft and durum wheat ( ) 15%
Rye ( ) 15%

127
This project has received funding from the European Union's Horizon 2020 research and innovation program under grant agreement No. 691763
This project has received funding from the European Union's Horizon 2020 research and innovation program under grant agreement No. 691763
Oat ( ) 15%
Barley ( ) 15%
Maize ( ) 30%
Rice ( ) 25%
Sunflower ( ) 40%
Rapeseed ( ) 40%
Cotton 2.00 45%
YLD refers to the yield (expressed in t/ha) of the main agricultural product of the crop.
For crop production, the main source is EUROSTAT, Crop statistics data (code: apro_acs_a) for the year
2014.
Orchard plantations For the orchard plantation prunings in Greece, the following formula is applied:
( ) ( ) ( )
For fruit production, the main source is EUROSTAT, Crop statistics data (code: apro_acs_a) for the year
2014.
Residue to Product Ratios (RPRs) and typical moisture contents have been taken from the following
publications:
For most tree types: EUBIONET, Biomass survey in Europe / Country Report of Greece (2003).
Available online at: http://www.afbnet.vtt.fi/greece_biosurvey.pdf. Note: this publication uses
values from an older Greek source (Apostolakis, 1987). The values quoted are product / ratio,
therefore the inverse value was used for the calculations.
For plum, fig and hazelnut trees: H. Unal, K. Alibas, Agricultural Residues as Biomass Energy.
Energy Sources, Part B, 2:123–140, 2007. Note: this publication quotes values from Turkey. The typical moisture content of all prunings was taken as 40% wt, with the exception of olive tree
prunings where the value of 35% wt was applied.

128
This project has received funding from the European Union's Horizon 2020 research and innovation program under grant agreement No. 691763
This project has received funding from the European Union's Horizon 2020 research and innovation program under grant agreement No. 691763
Table a.2.- Global country agro-industry biomass resources
SECTOR OF ACTIVITY
TYPE OF BY-PRODUCTS
POTENTIAL
(t DM/y)
Source Comments
Wood industries
Bark N/A ----
Clean wood by-products (chips etc)
N/A ----
Other wood by-products (specify)
N/A ----
Nut hulling industry
Almond Shell 10,328 EUROSTAT (2014) &
calculation
Chopped pine cone ---- ---- The production is non-existent or negligible
Pine nut shells ---- ---- The production is non-existent or negligible
Hazelnut shell < 365 EUROSTAT (2014) &
calculation
Walnut shell < 10,229 -//-
Shells may be produced manually
and hence not easily collected.
Pistachio shell 332 - 498 -//-
Only a small percentage (10 – 15%)of the yearly
production is treated by crushing plants.
Other(specify)
Olive oil industry
Olive stones 130,387 EUROSTAT (2014) &
calculation
Exhausted olive cake
309,473 EUROSTAT (2014) &
calculation
Rice industry Rice husk 41,278 EUROSTAT (2014) &
calculation
Mostly used as fuel by the rice processing
industry.
Cotton industry Cotton ginning
residues 69,352
EUROSTAT (2014) &
calculation
Used as fuel in cotton ginning plants for steam production (drying of cotton,
wetting of lint, treatment of cotton
seeds)
Fruit canneries and juice
production plants Apricot stones 924
EUROSTAT (2014) & company
estimations

129
This project has received funding from the European Union's Horizon 2020 research and innovation program under grant agreement No. 691763
This project has received funding from the European Union's Horizon 2020 research and innovation program under grant agreement No. 691763
Peach kernel 24,384
EUROSTAT (2014) & company
estimations
kk. TOTAL AGROINDUSTRY < 597,218 ll. mm.
Data sources & calculations
Nut hulling industry
For the calculation of the nut shells produced in Greece, the following formula is applied:
( ) ( ) ( ) ( ) ( )
The following table summarizes the calculations and data sources for those main quantities for the
main types of nuts produced in Greece. In all cases, a typical moisture content of 15% is considered.
Nut type Nut production (t)
[1]
%
shell*
[2]
% nut processed [2] Nut shells (tDM)
Almond 20,250 60 100 10,328
Walnut 21,880 55 100 10,229
Pistachio 7,100 55 10 - 15 332 - 498
Hazelnut** 810 53 100 365
[1] For almond, walnut and hazelnuts, the quantities in 2014 are taken from EUROSTAT data (Code:
apro_acs_a)
For pistachio, the 2013 production data are used taken from the following publication: Hellenic
Statistical Authority, “2013 ANNUAL AGRICULTURAL STATISTICAL SURVEY”, Piraeus, 10 June 2016.
Available online at: http://www.statistics.gr/documents/20181/3c4b9b69-c5a5-435a-8a6c-
e1913cb446d1
[2] Estimations based on communications with nut processing companies.
Almonds: the shell ranges from 55 – 70% of the nut. A typical value of 60% is used. Almost the whole
of the production is processed by almond crushing plants.
Walnuts: the shell is about 55% of the nut. It is assumed that most of the nuts are opened before they
are put in the market. However, walnut processing plants are rare and in many cases, the work is done
manually.
Pistachios: the shell is about 55% of the nut. Processing plants treat only the «closed» nuts, which are
about 10 – 15% of the yearly production.
Hazelnuts: no data from processing companies are available. A value of 53% for the percentage of the
shell was taken from the following publication: H. Unal, K. Alibas, Agricultural Residues as Biomass

130
This project has received funding from the European Union's Horizon 2020 research and innovation program under grant agreement No. 691763
This project has received funding from the European Union's Horizon 2020 research and innovation program under grant agreement No. 691763
Energy. Energy Sources, Part B, 2:123–140, 2007. It is also assumed that 100% of the nut is processed.
Olive oil industry calculations
The production of olives that are processed for olive oil production was 1,570,930 t in 2014 Source:
EUROSTAT, Crops statistics, code: apro_acs_a).
According to a mass balance from the BIOMASUD project (Rodero, P., Esteban L., The olive oil industry:
Main by-products and their characteristics as fuels), olive stones amount to 8.3% of the weight of the
olive, while the exhausted olive cake is 19.7% of the weight. Both quantities refer to dry basis, since
water is given separately in the mass balance. Therefore:
( )
( )
Actual production volumes depend on the production systems employed. In Greece, the separation of
olive stones is rare; the stones typically end up in the exhausted olive cake produced by the secondary
(pomace) mills. It is also noted that a large percentage of exhausted olive cake is self-consumed by the
pomace mills for drying the wet olive cake and producing steam for extraction of residual oil.
Rice industry calculations
The annual rice production for 2014 was 229,320 t (Source: EUROSTAT, Crops statistics, code:
apro_acs_a). Rice husk is about 20% of the rice and has a typical moisture content of around 10%.
Based on these, the following calculation regarding production of rice husk in 2014 can be made:
( ) ( )
It is noted that rice husk is typically as fuel by rice processing plants for the cooking of rice.
Cotton industry
The annual cotton seed production for 2014 was 797,150 t (Source: EUROSTAT, Crops statistics, code:
apro_acs_a). Cotton ginning residues are around 10% of the processed cotton and have a typical
moisture content of around 13% (Source: http://biomass.com.gr/gr/examples/ex6). Based on the
above, the cotton ginning residues production in 2014 is as follows:
( ) ( )
131
This project has received funding from the European Union's Horizon 2020 research and innovation program under grant agreement No. 691763
This project has received funding from the European Union's Horizon 2020 research and innovation program under grant agreement No. 691763
These residues are used as fuel in the cotton ginning plants for steam production for various internal
uses (drying of cotton, wetting of lint, treatment of cotton seeds, etc). Recently, a 1 MWel CHP plant
burning cotton ginning residues was built in Greece.
Fruit canneries and juice production plants
Apricot Shell According to data obtained from EUROSTAT, the total production of apricots was 125,010 t in 2014.
The percentage of apricots led to fruit canneries and juice production plants (from which the stones
are taken out) is estimated at about 20% of the total production. The stone to flesh percentage varies
depending on the fruit variety; the average of the extreme measurements (5.8%) from a literature
source is used [Source: T. Milošević, N. Milošević, I. Glišić, I.S. Glišić, Determination of size and shape
properties of apricots using multivariate analysis, Acta Sci. Pol., Hortorum Cultus 13(5) 2014, 77-90.
Available online at: http://wydawnictwo.up.lublin.pl/acta/hortorum_cultus/2014/5/07.pdf], therefore
the quantity of stones produced are estimated to be around 1,450 t.
Apricot stones have a high resale value; one company in Greece claims to buy around 90% of the total
production. In its premises, the stones are crushed and the bitter kernel (around 25%) is sold as a nut
(mostly exported). This percentage falls within the reported kernel to stone percentage from the
literature [see Milošević et al., 2014]. The remaining 75% of the stone is sold as a fuel; a typical
moisture content would be around 15%. Therefore, the quantity of apricot stones produced as a fuel is
estimated to be around 924 tDM. The company claims that historical production data have never
exceeded 1,500 t in any case.
Peach kernel The clingstone production in Greece amounted to 425,000 t in 2014, of which 381,000 t were
processed in canneries and juice production plants (Source: Ministry of Rural Development and Food,
http://www.minagric.gr/images/stories/docs/agrotis/Oporokipeytika/rodakina/stoixeia_ektashs_syby
rino_rodakino241016.pdf).
The Greek Canneries Association (EKE) estimated that peach kernels are about 8% of the incoming
material (Source: project communication, 2016). Assuming a typical moisture content of around 20%,
the following calculation can be made for peach kernel production in 2014:
( ) ( )

132
This project has received funding from the European Union's Horizon 2020 research and innovation program under grant agreement No. 691763
This project has received funding from the European Union's Horizon 2020 research and innovation program under grant agreement No. 691763
Table a.3.- Solid biofuels production
BIOFUEL
DOMESTIC
QUALITY
(tDM /y)
INDUSTRIAL
QUALITY
(tDM /y)
TOTAL
(tDM /y)
Source Comments
Firewood N/A N/A 550,638 FAOSTAT (2014) &
calculation
ELSTAT indicates that 464,203 t of firewood from agricultural
holdings were produced in 2010.
Wood chips N/A N/A N/A
Other chips (e.g. pruning)
Please, ad new files for each additional biofuel
N/A N/A N/A
Wood briquettes N/A N/A N/A
Wood pellets N/A N/A 26,775 HELLABIOM (2013)
The annual production capacity is listed as 137.840 t/y. Mostly
targeting the domestic heating market.
Other pellets (e.g. pruning)
Please, ad new files for each additional biofuel
N/A N/A N/A
Olive stones N/A N/A 5,000 –
7,000 CERTH estimation
Exhausted olive cake
N/A N/A 358,268
EUROSTAT (2014) & calculation based on
data from Associaton of Olive
Kernel Oil Producers
The usual Greek term is ” pyrinoksylo” (translated as kernel
wood). About 60% of the production is self-consumed by the secondary olive mills during
the production process.
Nut shells N/A N/A 21,254 -
21,420 EUROSTAT (2014) &
calculation Same as listed in Table a.2.
Rice husk N/A N/A 41,278 EUROSTAT (2014) &
calculation Same as listed in Table a.2.
Peach kernels N/A N/A 24,384 EUROSTAT (2014) &
calculation Same as listed in Table a.2.
Cotton ginning residues
N/A N/A 69,352 EUROSTAT (2014) &
calculation Same as listed in Table a.2.
TOTAL N/A N/A
Data sources & calculations
Firewood

133
This project has received funding from the European Union's Horizon 2020 research and innovation program under grant agreement No. 691763
This project has received funding from the European Union's Horizon 2020 research and innovation program under grant agreement No. 691763
FAOSTAT reports the following figures for wood fuel production from forests in Greece for the year
2014:
Coniferous fuel wood: 97,000 m3 (solid volume, underbark). FAOSTAT suggests a solid density
of 625 kg/m3 for coniferous fuel wood.
Non-coniferous fuel wood: 968,000 m3 (solid volume, underbark). FAOSTAT suggests a solid
density of 750 kg/m3 for non-coniferous fuel wood.
A typical moisture content of 30% is used to estimate the dry matter content.
In addition to the firewood removed from forests, the Hellenic Statistical Authority (ELSTAT) indicates
that 464,203 t of firewood from agricultural holdings were produced in 2010. This figure is in the same
order of magnitude as those reported in previous years.
Olive stones
Only a limited number of companies in Greece perform the separation of olive stones from the olive
cake. Based on some initial discussions with such producers, CERTH estimates that the volume of
production in Greece is around 5,000 – 7,000 t.
Exhausted olive cake
The starting point for the calculation is the production of olives that are processed for olive oil
production, same as in Table a.2.
Through project communication (June 2016), the Association of Olive Kernel Oil Producers of Greece
(SPEL) mentioned that the production of exhausted olive cake (refered in Greece as ”kernel wood” or
”pyrinoksylo” depends on several factors, such as the olive oil production and percentage of olive oil
produced in three-phase or two-phase olive mills. The Association estimates that there is a 60/40 split
between the two-phase and the three-phase systems currently. The olive cake produced by two-phase
systems is around 80% of the olives, with a typical moisture around 68%, while the three-phase system
produce an olive cake which is 50% of the weight of the incoming olives and with a a lower moisture
content of 52%.
Following treatment of the olive cake at the secondary (pomace) mills and extraction of the residual
oil, it is estimated that the amount of ”pyrinoksilo” produced is around 358,268 tDM.
Of this quantity, around 60% is self-consumed by the pomace mills in order to dry the incoming olive
cake and to produce steam required for the pomace oil extraction process. The rest is used by the
domestic and industrial sectors.

134
This project has received funding from the European Union's Horizon 2020 research and innovation program under grant agreement No. 691763
This project has received funding from the European Union's Horizon 2020 research and innovation program under grant agreement No. 691763
Table a.4.- Solid biofuels use by biofuel type
BIOFUEL
DOMESTIC USE
(tDM /y)
INDUSTRIAL USE
(tDM /y)
TOTAL
(tDM /y)
Source Comments
Firewood 2,031,678 N/A N/A Hellenic Statistical
Authority & calculation
Wood chips N/A N/A N/A
Other chips (e.g. pruning) N/A N/A N/A
Wood briquettes N/A N/A N/A
Wood pellets 58,456 N/A N/A Hellenic Statistical
Authority & calculation
Other pellets (e.g.
pruning) N/A N/A N/A
Olive stones N/A N/A N/A
Exhausted olive cake 35,656 N/A N/A Hellenic Statistical
Authority & calculation
Nut shells N/A N/A N/A
nn. Almond Shell N/A N/A N/A
oo. Chopped pine
cone N/A N/A N/A
pp. Pine nut shells N/A N/A N/A
qq. Hazelnut shell N/A N/A N/A
rr. Other(specify) N/A N/A N/A
TOTAL 2,185,546 458,814
Domestic: Hellenic Statistical Authority &
calculation
Industrial: EUROSTAT (2012) & calculation
Data sources & calculations
Domestic use
The main source for the statistical data of Table a.4 is a survey conducted by the Hellenic Statistical
Authority10 regarding the energy consumption of households reported that for the heating period of
2011 – 2012. According to the survey, the average thermal energy consumption of a Greek household
was 10,244 kWh, while the total number of households in Greece considered for the survey was
4,166,567.
Only three types of biomass fuels are listed in the survey as contribution to the thermal energy
consumption of households: firewood 23.8%, wood pellets 0.7% and olive cake 0.4%.
10
Hellenic Statistical Authority, “Survey on energy consumption in households, 2011-2012”, Piraeus, October 2013. Available online at: http://www.statistics.gr/documents/20181/985219/Energy+consumption+in+households/

135
This project has received funding from the European Union's Horizon 2020 research and innovation program under grant agreement No. 691763
This project has received funding from the European Union's Horizon 2020 research and innovation program under grant agreement No. 691763
The table presents the calculated fuel consumptions for the domestic sector based on the results of
the surveys and using the following typical fuel properties:
Wood pellets, LHV: 4.60 kWh/kg, moisture 10% (Source: Wood fuels handbook)
Firewood, LHV: 3.40 kWh/kg, average moisture 30% (Source: Wood fuels handbook)
Olive cake, LHV: 4.07 kWh/kg, average moisture 15% (CERTH estimation)
The overall domestic consumption of biomass based on this survey amounts to 913.83 ktoe. This
figure is in very good agreement with the residential consumption of solid biofuels for the residential
sector in Greece provided by EUROSTAT, which is 908.9 ktoe (Code: nrg_107a).
Industrial use No similar national survey regarding the biomass consumption of the industrial sector can be found.
EUROSTAT (Code: nrg_107a) reports that the industrial consumption of solid biofuels (excluding
charcoal) in the industrial sector was 188.9 ktoe in 2012. Of this, 85.4% was due to consumpion in the
category ”food and tobacco” sector. It is expected that a significant percentage of the industrial
consumption of biomass corresponds to the self-consumption of exhausted olive cake by the
secondary olive mills.
Therefore, using the same typical fuel properties for olive cake (LHV: 4.07 kWh/kg, moisture 15%) as in
the previous case, a rough estimation of the biomass consumption in the industrial sector is calculated.
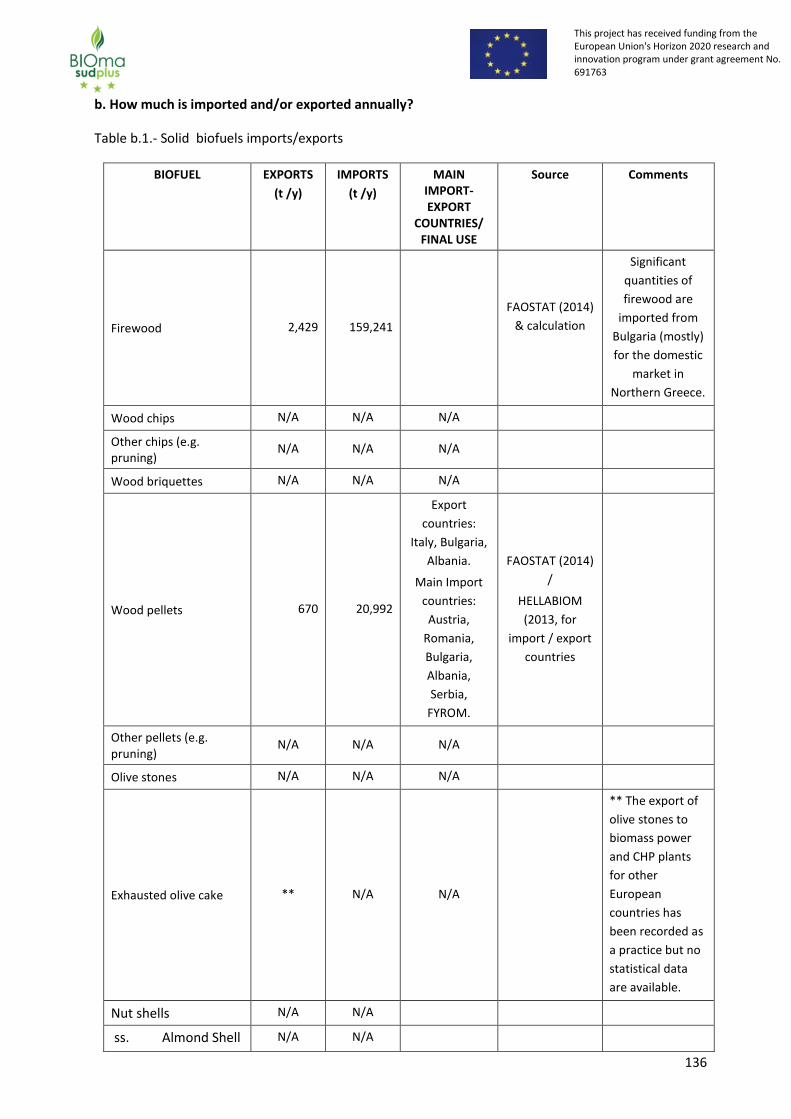
136
This project has received funding from the European Union's Horizon 2020 research and innovation program under grant agreement No. 691763
This project has received funding from the European Union's Horizon 2020 research and innovation program under grant agreement No. 691763
b. How much is imported and/or exported annually?
Table b.1.- Solid biofuels imports/exports
BIOFUEL EXPORTS
(t /y)
IMPORTS
(t /y)
MAIN IMPORT-EXPORT
COUNTRIES/ FINAL USE
Source Comments
Firewood 2,429 159,241
FAOSTAT (2014)
& calculation
Significant
quantities of
firewood are
imported from
Bulgaria (mostly)
for the domestic
market in
Northern Greece.
Wood chips N/A N/A N/A
Other chips (e.g. pruning)
N/A N/A N/A
Wood briquettes N/A N/A N/A
Wood pellets 670 20,992
Export
countries:
Italy, Bulgaria,
Albania.
Main Import
countries:
Austria,
Romania,
Bulgaria,
Albania,
Serbia,
FYROM.
FAOSTAT (2014)
/
HELLABIOM
(2013, for
import / export
countries
Other pellets (e.g. pruning)
N/A N/A N/A
Olive stones N/A N/A N/A
Exhausted olive cake ** N/A N/A
** The export of
olive stones to
biomass power
and CHP plants
for other
European
countries has
been recorded as
a practice but no
statistical data
are available.
Nut shells N/A N/A
ss. Almond Shell N/A N/A

137
This project has received funding from the European Union's Horizon 2020 research and innovation program under grant agreement No. 691763
This project has received funding from the European Union's Horizon 2020 research and innovation program under grant agreement No. 691763
tt. Chopped pine
cone
N/A N/A
uu. Pine nut
shells
N/A N/A
vv. Hazelnut shell N/A N/A
ww. Other(specify) N/A N/A
TOTAL 3,099 180,233
Data sources & calculations
FAOSTAT reports the following figures for wood fuel imports / exports in Greece for the year 2014:
Imports: 219,643 m3 (solid volume, underbark)
Exports: 3,351 m3 (solid volume, underbark)
A solid density of 725 kg/m3 (as suggested by FAOSTAT) was used to estimate import and export
quantities in tons.
Assuming typical fuel LHVs for wood fuel (3.4 kWh/kg for moisture of 30%) and wood pellets (4.6
kWh/kg for moisture of 10%), the energetic value of imports is calculated as 61.0 ktoe, while exports
are 1.3 ktoe. These figures correspond very well to the values quoted by EUROSTAT, e.g. 62.1 ktoe and
1.1 ktoe for imports and exports respectively.

138
This project has received funding from the European Union's Horizon 2020 research and innovation program under grant agreement No. 691763
This project has received funding from the European Union's Horizon 2020 research and innovation program under grant agreement No. 691763
c. What are the typical costs of the biofuels for commercial and private customers?
Table c.1.- Solid biofuels prices
Biofuel Commercial customers typical cost
€/t
Domestic customers typical cost
€/t
Source Comments
Wood pellets Enplus A1 (imported
N/A 241.95 www.karadinos.gr
(6/11/2016) Quoted price for 1000
kg
Wood pellets Enplus A1 (Greek
producer) N/A 225.81
www.praktiker.gr (6/11/2016)
Quoted price for 15 kg bag
Wood pellets Enplus A2 (Greek
producer) N/A 185.48
www.praktiker.gr (6/11/2016)
Quoted price for 15 kg bag
Wood pellets A1 (Greek producer)
N/A 232.14 www.pelletaki.gr
(6/11/2016) Quoted price for 990 kg
Wood pellets A1 (Greek producer)
N/A 219.90 www.pelletaki.gr
(6/11/2016) Quoted price for 990 kg
Olive stones N/A 150
Project communication with
producer Bagged, 25 kg
Exhausted olive cake
55 55
Chatzelis Group (Facebook
announcement, 11/4/2016)
Bulk, purchase from production plant
Olive cake pellets (industrial
use) 186.54 N/A
www.pelletaki.gr (6/11/2016)
Transport cost not included, quoted price
for 990 kg
Firewood N/A
64.52 €/m3 (beech, pine)
72.58 €/m3, oak
80.65 €/m3 (olive)
(All prices in bulk m3)
http://www.xylopigi.gr/ (6/11/2016)
Listed seller delivers free of charge within
Attica (Athens region).
Large variations are recorded depending on the seller and time of
year.
Peach kernel 60 - 80 60 - 80 Greek Canneries
Association (project communication, 2016)
Nut shells 65 - 120 65 - 120 Various producing companies (project
communication, 2016)
No price index for solid biofuels is available in Greece. Reported prices come from various
sources, e.g. internet search, company announcements, project communications, etc.
The applicable VAT for solid biofuels in Greece is 24% (since 1/6/2016, ΠΟΛ 1061/2016)
According to Market Regulation No 4/28.11.2012, for the retail sale of firewood, it is
compulsory to use volume units, either cubic meter, stacked or cubic meter, bulk (weight units
are not allowed).

139
This project has received funding from the European Union's Horizon 2020 research and innovation program under grant agreement No. 691763
This project has received funding from the European Union's Horizon 2020 research and innovation program under grant agreement No. 691763
d. Where are the biofuels used
This question is to complement the information in table a3.
Table d.1.- Solid biofuels use by sector
Sector Total
Amount
t/y
Main type of
biofuel used
Reference Comments
Agricultural-
farm sector *
Firewood,
wood pellets,
olive cake,
others
*According to EUROSTAT, the
agricultural / forest sector consumed
24.7 ktoe of solid biofuels in 2014.
Biomass power
plants (only
electricity) 0 N/A
EUROSTAT
(2014)
The use of solid biofuels for electricity
production is minimal. Recently, a 1
MWe ORC plant firing cotton ginning
residues was built in Greece.
Co-firing power
plants(only
electricity) 0*
Cardoon,
maize residues
and exhausted
olive cake
CERTH, FP7
project
DEBCO
*Co-firing of biomass in lignite-fired
power plants has been performed as
demonstration in the framework of EU
and nationally-funded research
projects in the past. To this day, there
is no permanent application.
CHP and CHPC
plants
residential
sector
0 N/A EUROSTAT
(2014)
CHP and CHPC
plants
industrial
sector
0 N/A EUROSTAT
(2014)
Residential not
CHP **
Firewood,
wood pellets,
olive cake,
others
*According to EUROSTAT, the
residential sector consumed 750 ktoe
of solid biofuels in 2014.

140
This project has received funding from the European Union's Horizon 2020 research and innovation program under grant agreement No. 691763
This project has received funding from the European Union's Horizon 2020 research and innovation program under grant agreement No. 691763
e. Are being used certified solid biofuels in the market? Please specify types, certification standards
and annual quantities.
Table e.1.- Solid biofuels imports/exports
Biofuel Certification
standard
Annual
amount
t/y
Source Comments
Wood
Pellets
ENplus A1 /
A2
Not
disclosed
ENplus list of certified
producers (http://www.enplus-
pellets.eu/production/certified-
producers/), TUV-Nord press
release (http://www.tuv-
nord.com/gr/el/press-releases-
580-1326.htm)
Only one Greek producer
of wood pellets (Alfa
Wood Nevrokopi AEBE,
www.alfapellet.gr) has
been awarded the ENplus
certification. The
company has a
production capacity of
60,000 t/y, the actual
produced quantity is not
disclosed.
Imported wood pellets
are often of ENplus A1
quality, no statistics are
available though.

141
This project has received funding from the European Union's Horizon 2020 research and innovation program under grant agreement No. 691763
This project has received funding from the European Union's Horizon 2020 research and innovation program under grant agreement No. 691763
Market data for Italy Biomass availability, quality, costs and use a. Which are the biomass resources available and how much annually? Table a.1.- Global country field biomass resources potential and consumption.
FORESTS Source Comments
POTENTIAL
(t DM/y)
Conifers 126.346 ENEA 2009
Broadleaves 1.833.972 ENEA 2009
Mixed forests
Shrubs 220.264 ENEA 2009
Other (specify)
Other (specify
TOTAL FORESTS
AGRICULTURE
POTENTIAL
(t DM/y)
Rain-fed crops Not relevant
Irrigated crops 40.000 7.000 ha
Rice crops N.A. ENEA 2009
Olive plantations
Orchard plantations (Vineyards and olive plantations included) 4.906.405
ENEA 2009
Vineyards ENEA 2009
Agricultural residuals 22.403.610
ENEA 2009
Other (specify)
TOTAL AGRICULTURE 29.530.597

142
This project has received funding from the European Union's Horizon 2020 research and innovation program under grant agreement No. 691763
This project has received funding from the European Union's Horizon 2020 research and innovation program under grant agreement No. 691763
Table a.2.- Global country agro-industry biomass resources
SECTOR OF ACTIVITY
TYPE OF BY-PRODUCTS
POTENTIAL (t DM/y)
Source Comments
Wood industries
Bark 544.000 FEDERLEGNO, elab. AIEL
Clean wood by-products (chips etc)
34.000.000 FEDERLEGNO, elab. AIEL
The potential depends on the quantity of wood that is meant to be used for energy purposes
Other wood by-products (specify)
Nut hulling industry
Almond Shell Not relevant
Chopped pine cone
Not relevant
Pine nut shells Not relevant
Hazelnut shell 116.557 ENEA 2009, University of Neaples
Other(specify)
Olive oil industry
Olive stones N.A.
Exhausted olive cake
690.000 ENEA 2009, AIEL
Chips. from pruning 4.900.000 ENEA 2009
TOTAL AGROINDUSTRY
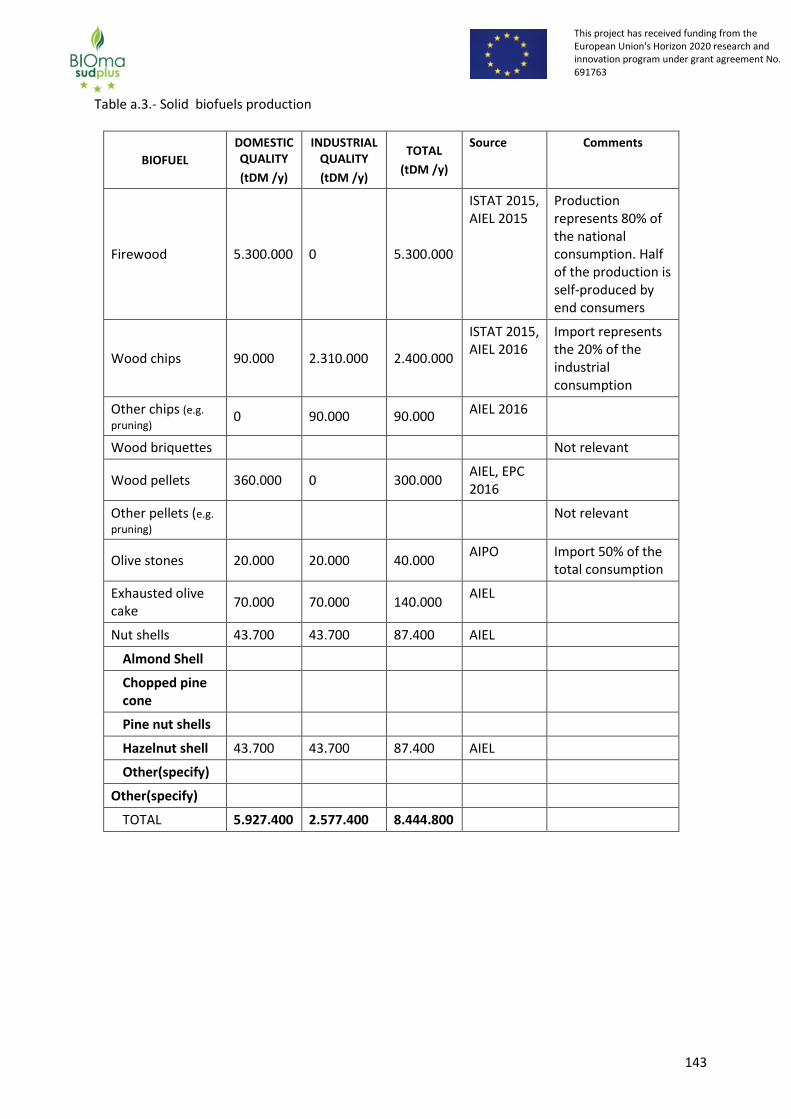
143
This project has received funding from the European Union's Horizon 2020 research and innovation program under grant agreement No. 691763
This project has received funding from the European Union's Horizon 2020 research and innovation program under grant agreement No. 691763
Table a.3.- Solid biofuels production
BIOFUEL
DOMESTIC QUALITY
(tDM /y)
INDUSTRIAL QUALITY
(tDM /y)
TOTAL
(tDM /y)
Source Comments
Firewood 5.300.000 0 5.300.000
ISTAT 2015, AIEL 2015
Production represents 80% of the national consumption. Half of the production is self-produced by end consumers
Wood chips 90.000 2.310.000 2.400.000
ISTAT 2015, AIEL 2016
Import represents the 20% of the industrial consumption
Other chips (e.g.
pruning) 0 90.000 90.000
AIEL 2016
Wood briquettes Not relevant
Wood pellets 360.000 0 300.000 AIEL, EPC 2016
Other pellets (e.g.
pruning) Not relevant
Olive stones 20.000 20.000 40.000 AIPO Import 50% of the
total consumption
Exhausted olive cake
70.000 70.000 140.000 AIEL
Nut shells 43.700 43.700 87.400 AIEL
Almond Shell
Chopped pine cone
Pine nut shells
Hazelnut shell 43.700 43.700 87.400 AIEL
Other(specify)
Other(specify)
TOTAL 5.927.400 2.577.400 8.444.800

144
This project has received funding from the European Union's Horizon 2020 research and innovation program under grant agreement No. 691763
This project has received funding from the European Union's Horizon 2020 research and innovation program under grant agreement No. 691763
Table a.4.- Solid biofuels use by biofuel type
BIOFUEL
DOMESTIC USE
(tDM /y)
INDUSTRIAL USE
(tDM /y)
TOTAL
(tDM /y)
Source Comments
Firewood 10.620.000 0 10.620.000 ISTAT 2015, AIEL 2016
0,01% ISO 17225-5
Wood chips 90.000 2.910.000 3.000.000 INEA 2015, AIEL 2016
10% ISO 17225-4
Other chips (e.g.
pruning) 0 90.000 90.000
AIEL 0% ISO 17225-4
Wood briquettes
Wood pellets 2.430.000 270.000 2.700.000 ISTAT 2015, AIEL 2016
65% ISO 17225-2 (Enplus)
Other pellets (e.g.
pruning)
Olive stones 42.500 42.500 85.000 AIPO
Exhausted olive cake
70.967 70.967 141.933 AIEL
Nut shells 43.709 43.709 87.418 AIEL
Almond Shell
Chopped pine cone
Pine nut shells
Hazelnut shell 43.709 43.709 87.418 AIEL
Other(specify)
Other(specify)
TOTAL 13.297.176 3.427.176 16.724.351

145
This project has received funding from the European Union's Horizon 2020 research and innovation program under grant agreement No. 691763
This project has received funding from the European Union's Horizon 2020 research and innovation program under grant agreement No. 691763
b. How much is imported and/or exported annually? Table b.1.- Solid biofuels imports/exports
BIOFUEL EXPORTS
(t /y)
IMPORTS
(t /y)
MAIN IMPORT-EXPORT
COUNTRIES/ FINAL USE
Source Comments
Firewood 20.000 5.300.000 East Europe ISTAT 2015,
AIEL 2016
Wood chips 0 600.000 East Europe EUROSTAT
2015
Other chips (e.g.
pruning)
Wood briquettes
Wood pellets 0 2.400.000 Austria,
Canada, USA, East Europe
EPC 2016
Other pellets (e.g.
pruning)
e.g . in Spain.
UK, Poland, Belgium/power and thermal plants
Olive stones 45.000 Spain
Exhausted olive cake
Nut shells
Almond Shell
Chopped pine cone
Pine nut shells
Hazelnut shell
Other(specify)
Other(specify)
TOTAL 20.000 8.345.000

146
This project has received funding from the European Union's Horizon 2020 research and innovation program under grant agreement No. 691763
This project has received funding from the European Union's Horizon 2020 research and innovation program under grant agreement No. 691763
c. What are the typical prices of the biofuels for commercial and private customers? Table c.1.- Solid biofuels prices (October 2016)
Biofuel Commercial customers
typical price
€/t
Domestic customers
typical price
€/t
Source Comments
Wood logs M25 110 140 AIEL’s members 2016
Wood pellets ENplus A1
206 238 AIEL’s members 2016
Wood pellets ENPlus A2
180 215 AIEL’s members 2016
Wood chips M25
115 AIEL’s members 2016
Agricultural wood chips M25
100 AIEL’s members 2016
Vineyard, olive and orchard potatures,
Agricultural briquettes
160 AIEL’s members 2016
Agricultural pellets
215 AIEL’s members 2016

147
This project has received funding from the European Union's Horizon 2020 research and innovation program under grant agreement No. 691763
This project has received funding from the European Union's Horizon 2020 research and innovation program under grant agreement No. 691763
d. Where are the biofuels used This question is to complement the information in table a3. Table d.1.- Solid biofuels use by sector Data is available in Mtep. It is not possible to convert to tons considering that it refers to a biomass mix
Sector Total Ammount
t/y
Main type of biofuel used
Reference Comments
Agricultural-farm sector
75.000 Wood chips, pellet, agricultural residuals
GSE 2015
Biomass power plants (only electricity)
1.440.000 Wood chips BASIS 2015, GSE 2014, AIEL 2015
Co-firing power plants(only electricity)
0
CHP and CHPC plants residential sector
500.000 Wood chips BASIS 2015, GSE 2014, AIEL 2015
CHP and CHPC plants industrial sector
3.300.000 Wood chips BASIS 2015, GSE 2014, AIEL 2015
Residential not CHP
35.900.000 Wood logs, wood pellets, Mediterrean biofuels,
BASIS 2015, GSE 2014, AIEL 2015
Commercial, Industrial not CHP
715.300 Wood chips, wood pellets
BASIS 2015, GSE 2014, AIEL 2015
District heating included
e. Are being used certified solid biofuels in the market? Please specify types, certification standards and annual quantities. Table e.1.- Solid biofuels imports/exports
Biofuel Certification standard
Annual amount
t/y
Source Comments
Wood pellet ENplus 1.500.000 Aiel, EPC 2016
Wood pellet DINplus N.A. Statistics not available

148
This project has received funding from the European Union's Horizon 2020 research and innovation program under grant agreement No. 691763
This project has received funding from the European Union's Horizon 2020 research and innovation program under grant agreement No. 691763
Market data for Portugal Biomass availability, quality, costs and use a. Which are the biomass resources available and how much annually? Table a.1.- Global country field biomass resources potential and consumption.
FORESTS Source Comments
POTENTIAL
(t DM/y)
Conifers
1.348798 IFN6, 2013 preliminary results
Total potential calculated with Biorreg-Florestas methodoly (2007) through preliminary results of the last national forest inventory
Broadleaves
2.398.508 IFN6, 2013 preliminary results
Total potential calculated with Biorreg-Florestas methodoly (2007) through preliminary results of the last national forest inventory
Mixed forests
Shrubs 2.573.292 Biorreg-Florestas (2007)
Potential production of the forest understorey shrubs
Other (specify)
Other (specify
TOTAL FORESTS 6.320.598
AGRICULTURE
POTENTIAL
(t DM/y)
Rain-fed crops
Irrigated crops
Rice crops
Olive plantations 96.403
INE, 2015. Instituto Nacional de Estatística, Estatísticas Agrícolas 2014
Total olive prunings production in 2014
Orchard plantations
Vineyards 212.993
INE, 2015. Instituto Nacional de Estatística, Estatísticas Agrícolas 2014
Total vineyards prunings production in
2014
Other (specify)
Other (specify)
TOTAL AGRICULTURE
309.396

149
This project has received funding from the European Union's Horizon 2020 research and innovation program under grant agreement No. 691763
This project has received funding from the European Union's Horizon 2020 research and innovation program under grant agreement No. 691763
Table a.2.- Global country agro-industry biomass resources
SECTOR OF ACTIVITY
TYPE OF BY-PRODUCTS
POTENTIAL (t DM/y)
Source Comments
Wood industries
Bark
Clean wood by-products (wood chips)
732.000
INE, 2015. Instituto Nacional de Estatística, Estatísticas Agrícolas 2014
Total production in 2013
High quantity utilised in industry like feedstock
Other wood by-products (specify)
Nut hulling industry
Almond Shell 6.378
INE, 2015. Instituto Nacional de Estatística, Estatísticas Agrícolas 2014
This data refer the year 2014
Chopped pine cone 54.847
UNAC, 2010. União das Organizações de Agricultores para o Desenvolvimento da Charneca
This data refer the year 2010
Total production
Pine nut shells
16.317
UNAC, 2010. União das Organizações de Agricultores para o Desenvolvimento da Charneca
This data refer the year 2011
Hazelnut shell 86
INE, 2015. Instituto Nacional de Estatística, Estatísticas Agrícolas 2014
This data refer the year 2014 - Total production
Other(Walnut) 998
INE, 2015. Instituto Nacional de Estatística, Estatísticas Agrícolas 2014
This data refer the year 2014 - Total production
Olive oil industry
Olive stones
59.746
GPP, 2016. Gabinete de Planeamento, Políticas e Administração Geral. SIAZ - Sistema de Informação sobre o Azeite e a Azeitona de Mesa
campaign 2015-2016
Total production
Exhausted olive cake
94.597
GPP, 2016. Gabinete de Planeamento, Políticas e Administração Geral. SIAZ - Sistema de Informação sobre o Azeite e a Azeitona de Mesa
campaign 2015-2016
Total production
TOTAL AGROINDUSTRY 964.969
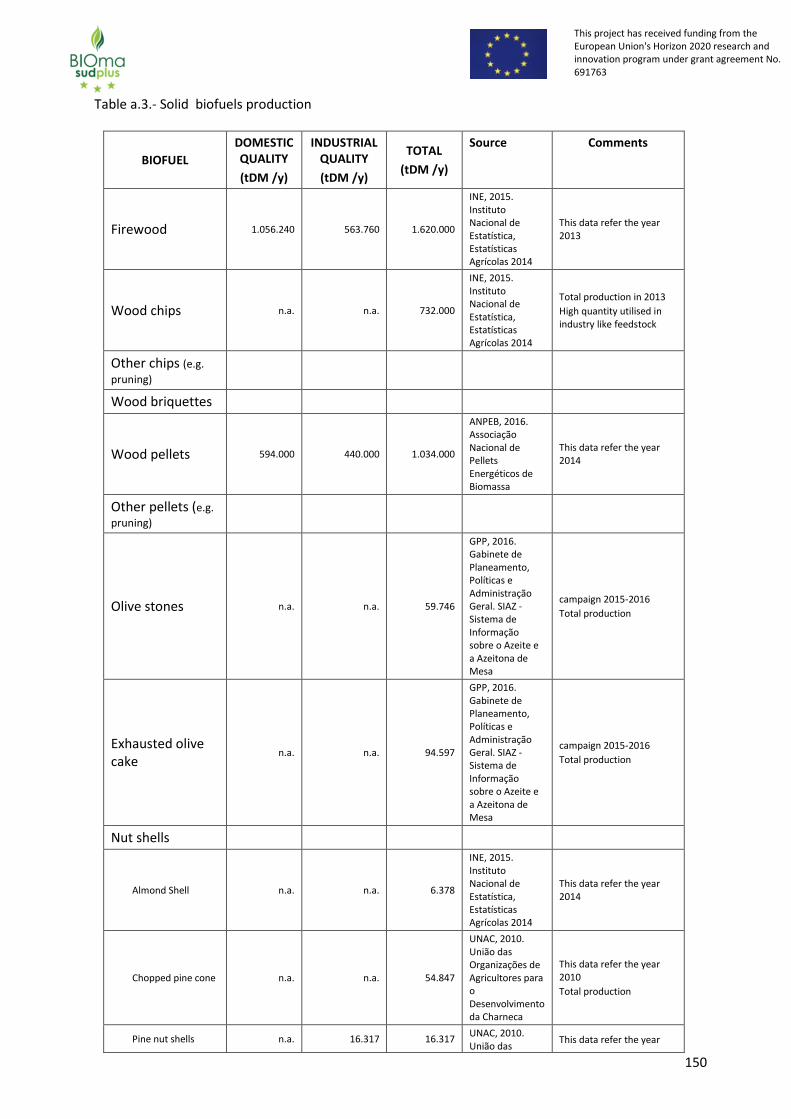
150
This project has received funding from the European Union's Horizon 2020 research and innovation program under grant agreement No. 691763
This project has received funding from the European Union's Horizon 2020 research and innovation program under grant agreement No. 691763
Table a.3.- Solid biofuels production
BIOFUEL
DOMESTIC QUALITY
(tDM /y)
INDUSTRIAL QUALITY
(tDM /y)
TOTAL
(tDM /y)
Source Comments
Firewood 1.056.240 563.760 1.620.000
INE, 2015. Instituto Nacional de Estatística, Estatísticas Agrícolas 2014
This data refer the year 2013
Wood chips n.a. n.a. 732.000
INE, 2015. Instituto Nacional de Estatística, Estatísticas Agrícolas 2014
Total production in 2013
High quantity utilised in industry like feedstock
Other chips (e.g.
pruning)
Wood briquettes
Wood pellets 594.000 440.000 1.034.000
ANPEB, 2016. Associação Nacional de Pellets Energéticos de Biomassa
This data refer the year 2014
Other pellets (e.g.
pruning)
Olive stones n.a. n.a. 59.746
GPP, 2016. Gabinete de Planeamento, Políticas e Administração Geral. SIAZ - Sistema de Informação sobre o Azeite e a Azeitona de Mesa
campaign 2015-2016
Total production
Exhausted olive cake
n.a. n.a. 94.597
GPP, 2016. Gabinete de Planeamento, Políticas e Administração Geral. SIAZ - Sistema de Informação sobre o Azeite e a Azeitona de Mesa
campaign 2015-2016
Total production
Nut shells
Almond Shell n.a. n.a. 6.378
INE, 2015. Instituto Nacional de Estatística, Estatísticas Agrícolas 2014
This data refer the year 2014
Chopped pine cone n.a. n.a. 54.847
UNAC, 2010. União das Organizações de Agricultores para o Desenvolvimento da Charneca
This data refer the year 2010
Total production
Pine nut shells n.a. 16.317 16.317 UNAC, 2010. União das
This data refer the year

151
This project has received funding from the European Union's Horizon 2020 research and innovation program under grant agreement No. 691763
This project has received funding from the European Union's Horizon 2020 research and innovation program under grant agreement No. 691763
Organizações de Agricultores para o Desenvolvimento da Charneca
2011
Hazelnut shell n.a. n.a. 86
INE, 2015. Instituto Nacional de Estatística, Estatísticas Agrícolas 2014
This data refer the year 2014 - Total production
Pistachio shell - - - - -
Other (Walnut) n.a. n.a. 998
INE, 2015. Instituto Nacional de Estatística, Estatísticas Agrícolas 2014
This data refer the year 2014 - Total production
Other(specify)
Please, ad new files for each additional biofuel
TOTAL 1.650.240 1.020.077 3.618.969
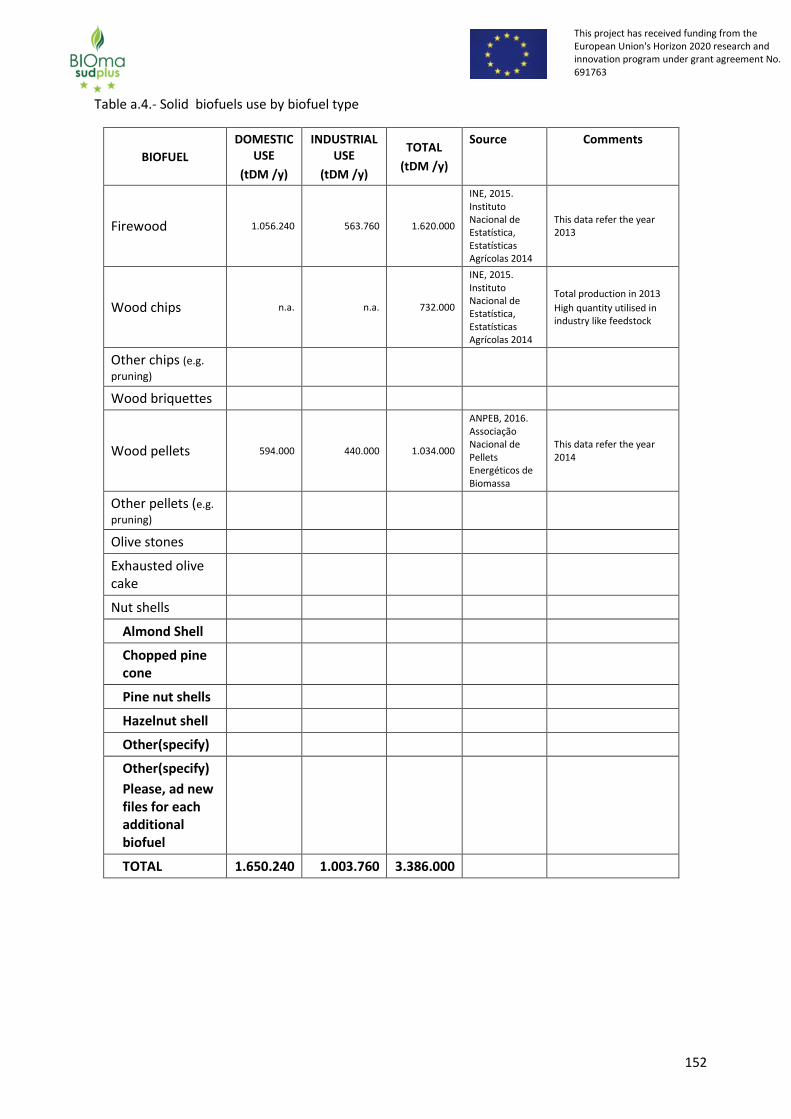
152
This project has received funding from the European Union's Horizon 2020 research and innovation program under grant agreement No. 691763
This project has received funding from the European Union's Horizon 2020 research and innovation program under grant agreement No. 691763
Table a.4.- Solid biofuels use by biofuel type
BIOFUEL
DOMESTIC USE
(tDM /y)
INDUSTRIAL USE
(tDM /y)
TOTAL
(tDM /y)
Source Comments
Firewood 1.056.240 563.760 1.620.000
INE, 2015. Instituto Nacional de Estatística, Estatísticas Agrícolas 2014
This data refer the year 2013
Wood chips n.a. n.a. 732.000
INE, 2015. Instituto Nacional de Estatística, Estatísticas Agrícolas 2014
Total production in 2013
High quantity utilised in industry like feedstock
Other chips (e.g.
pruning)
Wood briquettes
Wood pellets 594.000 440.000 1.034.000
ANPEB, 2016. Associação Nacional de Pellets Energéticos de Biomassa
This data refer the year 2014
Other pellets (e.g.
pruning)
Olive stones
Exhausted olive cake
Nut shells
Almond Shell
Chopped pine cone
Pine nut shells
Hazelnut shell
Other(specify)
Other(specify)
Please, ad new files for each additional biofuel
TOTAL 1.650.240 1.003.760 3.386.000

153
This project has received funding from the European Union's Horizon 2020 research and innovation program under grant agreement No. 691763
This project has received funding from the European Union's Horizon 2020 research and innovation program under grant agreement No. 691763
b. How much is imported and/or exported annually? Table b.1.- Solid biofuels imports/exports
BIOFUEL EXPORTS
(t /y)
IMPORTS
(t /y)
MAIN IMPORT-EXPORT
COUNTRIES/ FINAL USE
Source Comments
Firewood
Wood chips
Other chips (e.g.
pruning)
Wood briquettes
Wood pellets 792.000 - Spain, United Kingdom and Benelux
ANPEB, 2016. Associação Nacional de Pellets Energéticos de Biomassa
This data refer the year 2014
Other pellets (e.g.
pruning)
e.g . in Spain.
UK, Poland, Belgium/power and thermal plants
Olive stones
Exhausted olive cake
Nut shells
Almond Shell
Chopped pine cone
Pine nut shells
Hazelnut shell
Other(specify)
Other(specify)
Please, ad new files for each additional biofuel
TOTAL 792.000

154
This project has received funding from the European Union's Horizon 2020 research and innovation program under grant agreement No. 691763
This project has received funding from the European Union's Horizon 2020 research and innovation program under grant agreement No. 691763
c. What are the typical costs of the biofuels for commercial and private customers? Table c.1.- Solid biofuels prices
Biofuel Commercial customers typical cost
€/t
Domestic customers typical cost
€/t
Source Comments
Wood chips 70 CBE, 2016 23% of VAT
Firewood 60 CBE, 2016 6% of VAT
Wood pellets (bag)
214 CBE, 2016 23% of VAT
Wood pellets (Pallet with 77 bags)
184 CBE, 2016 23% of VAT
Olive stones 120 CBE, 2016 6% of VAT

155
This project has received funding from the European Union's Horizon 2020 research and innovation program under grant agreement No. 691763
This project has received funding from the European Union's Horizon 2020 research and innovation program under grant agreement No. 691763
d. Where are the biofuels used This question is to complement the information in table a3. Table d.1.- Solid biofuels use by sector
Sector Total Ammount
t/y
Main type of biofuel used
Reference Comments
Agricultural-farm sector
Biomass power plants (only electricity)
Co-firing power plants(only electricity)
CHP and CHPC plants residential sector
CHP and CHPC plants industrial sector
Residential not CHP
e. Are being used certified solid biofuels in the market? Please specify types, certification standards and annual quantities. Table e.1.- Solid biofuels imports/exports
Biofuel Certification standard
Annual amount
t/y
Source Comments

156
This project has received funding from the European Union's Horizon 2020 research and innovation program under grant agreement No. 691763
This project has received funding from the European Union's Horizon 2020 research and innovation program under grant agreement No. 691763
Market data for Slovenia
Biomass availability, quality, costs and use a. Which are the biomass resources available and how much annually? Table a.1.- Global country field biomass resources potential and consumption.
FORESTS Source Comments
POTENTIAL
(t DM/y)
Conifers 1.656.000
SFS, Report on Forests for 2014
The allowable cut of assortments of low quality. Broadleaves
Mixed forests No data
Shrubs No data
Residues in the forest
404.000 SFS, Report on Forests
for 2014 Forest residues at the realization
of allowable cut.
Bark of timber 52.000
SFS, Report on Forests for 2014
The quantity of bark of timber at the realization of allowable cut.
TOTAL FORESTS 2.112.000
SFS, Report on Forests for 2014
AGRICULTURE
POTENTIAL
(t DM/y)
Rain-fed crops No data
Irrigated crops /
Rice crops /
Olive plantations 2.534
Agricultural Institute of Slovenia, SORS (2003-
2008)
Orchard plantations 6.485
Agricultural Institute of Slovenia, SORS (2003-
2008)
Vineyards 48.702
Agricultural Institute of Slovenia; SORS (2003-
2008) Wet biomass
TOTAL AGRICULTURE
197.000 + 151.000
SFS, Report on Forests for 2014
Wood and non-wood residues from agricultural areas usable for
energy + evaluated allowable sustained cut of trees in non-
forest land use.

157
This project has received funding from the European Union's Horizon 2020 research and innovation program under grant agreement No. 691763
This project has received funding from the European Union's Horizon 2020 research and innovation program under grant agreement No. 691763
Table a.2.- Global country agro-industry biomass resources
SECTOR OF ACTIVITY
TYPE OF BY-PRODUCTS
POTENTIAL (t DM/y)
Source Comments
Wood industries Bark No data
Clean wood by-products (chips etc)
461.000 SFS, Report
on Forests for 2014
The quantity of wood waste in the
production of sawn timber at the the
realization of allowable cut.
Other wood by-products (specify)
Nut hulling industry
Almond Shell /
Chopped pine cone /
Pine nut shells /
Hazelnut shell /
Other(specify)
Olive oil industry Olive stones 830
Project m.o.r.e.
Olive residues in 2007.
Exhausted olive cake
No data
TOTAL AGROINDUSTRY 462.000

158
This project has received funding from the European Union's Horizon 2020 research and innovation program under grant agreement No. 691763
This project has received funding from the European Union's Horizon 2020 research and innovation program under grant agreement No. 691763
Table a.3.- Solid biofuels production
BIOFUEL
DOMESTIC QUALITY
(tDM /y)
INDUSTRIAL QUALITY
(tDM /y)
TOTAL
(tDM /y)
Source Comments
Firewood
1.331.000 m3 or
approx. 771.980
tDM
1.331.000 m3 or
approx. 771.980
tDM
SORS, 2015
Wood chips
1.500.000 loose m3
or approx. 215.000
tDM
Varbiom, 2016.
Ogrevanje z lesnimi
gorivi, lesni sekanci.
Other chips (e.g.
pruning)
Wood briquettes No data
Data are not gathered
separately for briquettes.
Wood pellets 110.000 110.000
Market statement
for Slovenia,
2016.
Data for year 2015.
Other pellets (e.g.
pruning)
Olive stones 280 Project: m.o.r.e.
Data for year 2007.
Exhausted olive cake
1.100 Project: m.o.r.e.
Data for year 2007.
Nut shells /
Almond Shell /
Chopped pine cone
/
Pine nut shells /
Hazelnut shell /
Other(specify) /
Other(specify)
TOTAL

159
This project has received funding from the European Union's Horizon 2020 research and innovation program under grant agreement No. 691763
This project has received funding from the European Union's Horizon 2020 research and innovation program under grant agreement No. 691763
Table a.4.- Solid biofuels use by biofuel type
BIOFUEL
DOMESTIC USE
(tDM /y)
INDUSTRIAL USE
(tDM /y)
TOTAL
(tDM /y)
Source Comments
Firewood 1.211.805 / 1.211.805 SORS, 2015 Logs are used in households and not in industry.
Wood chips 200.000
Data gathered with questioner in 2016
by Slovenian forestry institute.
It is difficult to divide total use
of wood chips to domestic or
industrial use. Wood chips for
energy production are utilized mainly for residential heating (e.g.
district heating plants). For
industrial use mostly wood residues are
utilized but also wood chips. Data
for year 2015.
Other chips (e.g.
pruning) No data
Wood briquettes 5.000 SFI estimate
Data are not gathered
separately for briquettes.
Wood pellets 140.000 140.000 Market statement for Slovenia, 2016.
Data for year 2015.
Other pellets (e.g.
pruning)
Olive stones Project: m.o.r.e.
In Slovenia olive residue is treated as waste and not
as secondary product. We
don’t use olive
residue for energy most of
them are thrown away or use like fertilizer in olive
fields.
Exhausted olive cake
Project: m.o.r.e. The end users of olive residues are
160
This project has received funding from the European Union's Horizon 2020 research and innovation program under grant agreement No. 691763
This project has received funding from the European Union's Horizon 2020 research and innovation program under grant agreement No. 691763
now mainly olive millers which use olive residues for composting. Two of them use olive residues for their
private energy purposes
(heating). Both of them have
around 60 tons of residues per
year. If they would use all of
residues, it would be enough
energy for heating at least 5
more households. In
Slovenia pit separators,
which separate olive pits from
olive pomace are not used. There
are also no drying facilities
and refineries to dry wet pomace in order to make
them more appropriate for
burning.
Nut shells /
Almond Shell /
Chopped pine cone
/
Pine nut shells /
Hazelnut shell /
Other(specify) /
Other(specify)
TOTAL

161
This project has received funding from the European Union's Horizon 2020 research and innovation program under grant agreement No. 691763
This project has received funding from the European Union's Horizon 2020 research and innovation program under grant agreement No. 691763
b. How much is imported and/or exported annually? Table b.1.- Solid biofuels imports/exports
BIOFUEL EXPORTS
(t /y)
IMPORTS
(t /y)
MAIN IMPORT-EXPORT
COUNTRIES/ FINAL USE
Source Comments
Firewood 379.500 151.600
Main import from Bosnia
and Herzegovina and Croatia.
Main export market is
Italy.
SORS, 2015. Data are
measured in m3.
Wood chips 237.000 135.000
Main import from Croatia.
Main export market is
Austria and Italy.
Market statement for Slovenia, 2016.
Data for year 2015.
Other chips (e.g.
pruning)
Wood briquettes No data No data
Wood pellets 122.000 152.000
Main import from
Romania and Bosnia and
Herzegovina.
Main export market is
Italy.
Market statement for Slovenia, 2016.
Data for year 2015.
Other pellets (e.g.
pruning)
e.g . in Spain.
UK, Poland, Belgium/power
and thermal plants
Olive stones /
Exhausted olive cake
/
Nut shells /
Almond Shell /
Chopped pine cone
/
Pine nut shells /
Hazelnut shell /
Other(specify) /
Other(specify)

162
This project has received funding from the European Union's Horizon 2020 research and innovation program under grant agreement No. 691763
This project has received funding from the European Union's Horizon 2020 research and innovation program under grant agreement No. 691763
TOTAL

163
This project has received funding from the European Union's Horizon 2020 research and innovation program under grant agreement No. 691763
This project has received funding from the European Union's Horizon 2020 research and innovation program under grant agreement No. 691763
c. What are the typical costs of the biofuels for commercial and private customers? Table c.1.- Solid biofuels prices
Biofuel Commercial customers typical cost
€/t
Domestic customers typical cost
€/t
Source Comments
Firewood
No data available
116
Price trends of wood fuels in
Slovenia between 2011 and 2016. 2016. Gozdarski
vestnik 74, št.7-8.
Firewood with a moisture content of 20 % and a length of
25-50 cm.
Data are valid for the period before the
heating season 2015/2016.
Wood chips
No data available
52
Price trends of wood fuels in
Slovenia between 2011 and 2016. 2016. Gozdarski
vestnik 74, št.7-8.
Wood chips with a moisture content of
approx. 30 % and particle size of
approx. 36 mm.
Data are valid for the period in the heating season 2015/2016.
Wood briquettes
(10 kg bag) No data available
171
Price trends of wood fuels in
Slovenia between 2011 and 2016. 2016. Gozdarski
vestnik 74, št.7-8.
Wood briquettes with a moisture content of
12-15 %.
Data are valid for the period before the
heating season 2015/2016.
Wood pellets
(loose) No data available
190 www.s4q.si
The price of pellets obtained in the
second half of the year 2015.
Wood pellets (Big-Bag) No data
available 193 www.s4q.si
The price of pellets obtained in the
second half of the year 2015.
Wood pellets (15 kg bag)
No data available
204 www.s4q.si
The price of pellets obtained in the
second half of the year 2015.
The greatest demand is for pellets packed
in 15 kg PVC bags and stacked on the pallet
Comment: VAT in Slovenia estimate 22 %.

164
This project has received funding from the European Union's Horizon 2020 research and innovation program under grant agreement No. 691763
This project has received funding from the European Union's Horizon 2020 research and innovation program under grant agreement No. 691763
d. Where are the biofuels used This question is to complement the information in table a3. Table d.1.- Solid biofuels use by sector
Sector Total Ammount
t/y
Main type of biofuel used
Reference Comments
Agricultural-farm sector
No data
Biomass power plants (only electricity)
105.000 Only wood and wood
waste. SORS, 2016 Data for year 2015.
Co-firing power plants(only electricity)
/
CHP and CHPC plants residential sector
/
CHP and CHPC plants industrial sector
67.000 Only wood and wood
waste. SORS, 2016 Data for year 2015.
Residential not CHP
1.616.000 Only wood and wood
waste. SORS, 2016
The final consumption of wood and wood
waste in the households.
Data for year 2015.
e. Are being used certified solid biofuels in the market? Please specify types, certification standards and annual quantities. Table e.1.- Solid biofuels imports/exports
Biofuel Certification standard
Annual amount
t/y
Source Comments
Pellets EN-plus approx. 86.000
Pellet producers in
Slovenia – data gathered
with questioner in
2016. Slovenian forestry institute.
Production in year 2015.
Pellets S4Q approx. 22.000
Pellet producers in
Slovenia – data gathered
with
Production in year 2015.

165
This project has received funding from the European Union's Horizon 2020 research and innovation program under grant agreement No. 691763
This project has received funding from the European Union's Horizon 2020 research and innovation program under grant agreement No. 691763
questioner in 2016.
Slovenian forestry institute.
Comment : In 2014 Slovenian forestry Institute developed system for assurance of quality wood fuel, called S4Q. S4Q system is designed for micro and small-scale biomass producers which produce pellets only for domestic market.

166
This project has received funding from the European Union's Horizon 2020 research and innovation program under grant agreement No. 691763
This project has received funding from the European Union's Horizon 2020 research and innovation program under grant agreement No. 691763
Market data for Spain Biomass availability, quality, costs and use a. Which are the biomass resources available and how much annually? Table a.1.- Global country field biomass resources potential and consumption.
FORESTS Source Comments
POTENTIAL
(t DM/y) AVAILABLE
(t DM/y)
Conifers 3.031.382 1.438.717 CIEMAT: Bioraise “Available” is the potential after
applying several restrictions (Slope,…)
Broadleaves 3.601.615 1.594.704 CIEMAT: Bioraise “Available” is the potential after
applying several restrictions (Slope,…)
Mixed forests 893.080 549.137 CIEMAT: Bioraise “Available” is the potential after
applying several restrictions (Slope,…)
Shrubs 2.080.482 937.845 CIEMAT: Bioraise “Available” is the potential after
applying several restrictions (Slope,…)
Wooded pasture
941.701 252.248 CIEMAT: Bioraise “Available” is the potential after
applying several restrictions (Slope,…)
Other (specify)
TOTAL FORESTS
10.548.261 4.772.650
AGRICULTURE
POTENTIAL
(t DM/y) AVAILABLE
(t DM/y)
Rain-fed crops 16.944.193 5.420.661 CIEMAT: Bioraise Potential available after applying
several restrictions (Slope,…)
Irrigated crops 4.682.592 3.746.230 CIEMAT: Bioraise Potential available after applying
several restrictions (Slope,…)
Rice crops 394.983 316.204 CIEMAT: Bioraise Potential available after applying
several restrictions (Slope,…)
Olive plantations
1.819.981 1.455.168 CIEMAT: Bioraise Potential available after applying
several restrictions (Slope,…)
Orchard plantations
1.411.563 1.129.094 CIEMAT: Bioraise Potential available after applying
several restrictions (Slope,…)
Vineyards 843.949 675.000 CIEMAT: Bioraise Potential available after applying
several restrictions (Slope,…)
Crop mixtures 123.225 99.416 CIEMAT: Bioraise Potential available after applying
several restrictions (Slope,…)
Other (specify)
TOTAL AGRICULTURE
26.220.486 12.841.774

167
This project has received funding from the European Union's Horizon 2020 research and innovation program under grant agreement No. 691763
This project has received funding from the European Union's Horizon 2020 research and innovation program under grant agreement No. 691763
Table a.2.- Global country agro-industry biomass resources
SECTOR OF ACTIVITY
TYPE OF BY-PRODUCTS
POTENTIAL (t DM/y)
Source Comments
Wood industries
Bark 232.099 CIEMAT, BIOMASUD PLUS Study task 2.3
Clean wood by-products (chips etc)
2.695.962 CIEMAT, BIOMASUD PLUS Study task 2.3
Other wood by-products (specify)
Nut hulling industry
Almond Shell 150.00 AVEBIOM’s data
Chopped pine cone
38.250 AVEBIOM’s data
Pine nut shells 6.588 AVEBIOM’s data
Hazelnut shell
Other(specify)
Olive oil industry
Olive stones 430.000 La biomasa en Andalucía, 2015 / AVEBIOM’s data / CIEMAT’s data
Average. All years have different figures
Exhausted olive cake
800.000 La biomasa en Andalucía, 2015 / AVEBIOM’s data / CIEMAT’s data
Average. All years have different figures
TOTAL AGROINDUSTRY 4.202.899

168
This project has received funding from the European Union's Horizon 2020 research and innovation program under grant agreement No. 691763
This project has received funding from the European Union's Horizon 2020 research and innovation program under grant agreement No. 691763
Table a.3.- Solid biofuels production
BIOFUEL
DOMESTIC QUALITY
(tDM /y)
INDUSTRIAL QUALITY
(tDM /y)
TOTAL
(tDM /y)
Source Comments
Firewood 1.500.000 1.500.000
Statistical yearbook 2014 MAGRAMA
Wood chips 240.000 3.000.000 3.240.000
AVEBIOM’s data / Biomasud Project
Other chips (e.g.
pruning) 323.021 51.553 374.574
CIEMAT’s data / La biomasa en Andalucía, 2015
Wood briquettes 50.000 AVEBIOM’s data
Wood pellets 406.542 37.383 443.925 AVEBIOM’s data
2015
Other pellets (e.g.
pruning) 4.673 4.673
AVEBIOM’s data / CIEMAT’s data
Olive stones 130.000 300.000 430.000
La biomasa en Andalucía, 2015 / AVEBIOM’s data / CIEMAT’s data
Exhausted olive cake
800.000 800.000
La biomasa en Andalucía, 2015 / AVEBIOM’s data / CIEMAT’s data
Nut shells
Almond Shell 10.000 140.000 150.000 AVEBIOM’s data
Chopped pine cone
38.250
38.250 AVEBIOM’s data
Pine nut shells 6.588 6.588 AVEBIOM’s

169
This project has received funding from the European Union's Horizon 2020 research and innovation program under grant agreement No. 691763
This project has received funding from the European Union's Horizon 2020 research and innovation program under grant agreement No. 691763
data
Hazelnut shell
Other(specify)
Other(specify)
TOTAL 2.706.292 4.378.447 7.084.739

170
This project has received funding from the European Union's Horizon 2020 research and innovation program under grant agreement No. 691763
This project has received funding from the European Union's Horizon 2020 research and innovation program under grant agreement No. 691763
Table a.4.- Solid biofuels use by biofuel type
BIOFUEL
DOMESTIC USE
(tDM /y)
INDUSTRIAL USE
(tDM /y)
TOTAL
(tDM /y)
Source Comments
Firewood 1.500.000 1.500.000
Statistical yearbook
2014 MAGRAMA
Wood chips 240.000 2.850.000 3.090.000
AVEBIOM’s data /
Biomasud Project
Other chips (e.g.
pruning) 323.021 51.553 374.574
Wood briquettes 50.000 50.000 AVEBIOM’s
data
Wood pellets 400.000 400.000 AVEBIOM’s
data 2015
Other pellets (e.g.
pruning) 4.673 4.673
AVEBIOM’s data /
CIEMAT’s data
Olive stones 115.000 285.000 400.000
La biomasa en
Andalucía, 2015 /
AVEBIOM’s data /
CIEMAT’s data
Exhausted olive cake
800.000 800.000
La biomasa en
Andalucía, 2015 /
AVEBIOM’s data /
CIEMAT’s data
Nut shells
Almond Shell 10.000 140.000 150.000 AVEBIOM’s
data
Chopped pine cone
38.250 38.250 AVEBIOM’s
data
Pine nut shells 6.588 6.588 AVEBIOM’s
data
Hazelnut shell
Other(specify)
Other(specify)

171
This project has received funding from the European Union's Horizon 2020 research and innovation program under grant agreement No. 691763
This project has received funding from the European Union's Horizon 2020 research and innovation program under grant agreement No. 691763
TOTAL 2.638.021 4.176.064 6.814.085

172
This project has received funding from the European Union's Horizon 2020 research and innovation program under grant agreement No. 691763
This project has received funding from the European Union's Horizon 2020 research and innovation program under grant agreement No. 691763
b. How much is imported and/or exported annually? Table b.1.- Solid biofuels imports/exports
BIOFUEL EXPORTS
(t /y)
IMPORTS
(t /y)
MAIN IMPORT-EXPORT
COUNTRIES/ FINAL USE
Source Comments
Firewood 0 0 AVEBIOM’s
data
Wood chips 150.000 0 Italy /
Electric generation
AVEBIOM’s data
Other chips (e.g.
pruning) 0 0
AVEBIOM’s data
Wood briquettes 0 0 AVEBIOM’s
data
Wood pellets
86.542 (Domestic)
37.383 (Industrial)
80.000
Imports from Portugal
Exports to: France, Italy // Domestic -
thermal purposes
Exports to England,
Belgium // Electric
generation
Other pellets (e.g.
pruning)
0 0
AVEBIOM’s data
Olive stones 30.000 0 Italy, AVEBIOM’s
data
Exhausted olive cake
0 0
Some years ago there was a lot of exportations for co-firing but in the last years the trend is no exportations as the plants are
not cofiring anymore and they prefer
wood pellets
Nut shells
Almond Shell 0 0 AVEBIOM’s

173
This project has received funding from the European Union's Horizon 2020 research and innovation program under grant agreement No. 691763
This project has received funding from the European Union's Horizon 2020 research and innovation program under grant agreement No. 691763
data
Chopped pine cone
0 0 AVEBIOM’s
data
Pine nut shells 0 0 AVEBIOM’s
data
Hazelnut shell
Other(specify)
Other(specify)l
TOTAL 303.925 80.000

174
This project has received funding from the European Union's Horizon 2020 research and innovation program under grant agreement No. 691763
This project has received funding from the European Union's Horizon 2020 research and innovation program under grant agreement No. 691763
c. What are the typical costs of the biofuels for commercial and private customers? Table c.1.- Solid biofuels prices
Biofuel Commercial customers typical cost
€/t
Domestic customers typical cost
€/t
Source Comments
Wood pellet (A1/A2) in 15 kgs. bags
216,53 AVEBIOM’s price index http://www.avebiom.org/es/ind-precios-biomasa
Average prices for 2016. VAT 21%
Wood pellet (A1/A2) in bags 1 pallet.
210,69 AVEBIOM’s price index http://www.avebiom.org/es/ind-precios-biomasa
Average prices for 2016. VAT 21%
Wood pellet (A1/A2) in bulk full’s cargo (pneumatic transport)
193,87 AVEBIOM’s price index http://www.avebiom.org/es/ind-precios-biomasa
Average prices for 2016. VAT 21% Transport calculated 200 km.
Wood pellet (A1/A2) in bulk full’s cargo (non- pneumatic transport)
186,76 AVEBIOM’s price index http://www.avebiom.org/es/ind-precios-biomasa
Average prices for 2016. VAT 21% Transport calculated 200 km.
Wood chips (A1/A2) in bulk. Domestic quality (dried <35% P31,5 – P45
91,14 AVEBIOM’s price index http://www.avebiom.org/es/ind-precios-biomasa
Average prices for 2016. VAT 21% Transport calculated 100 km.
Olive Stones (A1/A2) In bags
155,01 AVEBIOM’s price index http://www.avebiom.org/es/ind-precios-biomasa
Average prices for 2016. VAT 21%
Olive Stones (A1/A2) in bags 1 pallet
153,49 AVEBIOM’s price index http://www.avebiom.org/es/ind-precios-biomasa
Average prices for 2016. VAT 21%
Olive Stones (A1/A2) ) in bulk full’s cargo (pneumatic transport)
130,94 AVEBIOM’s price index http://www.avebiom.org/es/ind-precios-biomasa
Average prices for 2016. VAT 21% Transport calculated 200 km.
Olive Stones (A1/A2) ) in bulk full’s cargo (non-pneumatic transport)
126,31 AVEBIOM’s price index http://www.avebiom.org/es/ind-precios-biomasa
Average prices for 2016. VAT 21% Transport calculated 200 km.

175
This project has received funding from the European Union's Horizon 2020 research and innovation program under grant agreement No. 691763
This project has received funding from the European Union's Horizon 2020 research and innovation program under grant agreement No. 691763
Classes of biofuels as per the following standards: ISO 17225-2 Wood Pellets ISO 17225-4 Wood Chips UNE 164003 Olive Stones

176
This project has received funding from the European Union's Horizon 2020 research and innovation program under grant agreement No. 691763
This project has received funding from the European Union's Horizon 2020 research and innovation program under grant agreement No. 691763
d. Where are the biofuels used This question is to complement the information in table a3. Table d.1.- Solid biofuels use by sector
Sector Total Ammount
t/y
Main type of biofuel used
Reference Comments
Agricultural-farm sector
No data
Biomass power plants (only electricity)
4.000.000 Wood chips, Olive Cake, other agriculture
AVEBIOM’s data
Co-firing power plants(only electricity)
0 0 AVEBIOM’s data
CHP and CHPC plants residential sector
0 0 AVEBIOM’s data
CHP and CHPC plants industrial sector
Residential not CHP
Total: 2.155.000
240.000 Pellets;
240.000 wood chips;
115.000 Olive Stones;
10.000
Shells; 50.000
Briquettes;
1.500.000 firewood
AVEBIOM’s data

177
This project has received funding from the European Union's Horizon 2020 research and innovation program under grant agreement No. 691763
This project has received funding from the European Union's Horizon 2020 research and innovation program under grant agreement No. 691763
e. Are being used certified solid biofuels in the market? Please specify types, certification standards and annual quantities. Table e.1.- Solid biofuels imports/exports
Biofuel Certification standard
Annual amount
t/y
Source Comments
Wood pellet ENplus 403.000 AVEBIOM 85% of the total production of wood pellet. Estimation for 2016
Wood pellet Din+ 154.000 AVEBIOM 32% Estimation for 2016
Olive Stones BIOmasud 2.400 AVEBIOM Estimation for 2016

178
This project has received funding from the European Union's Horizon 2020 research and innovation program under grant agreement No. 691763
This project has received funding from the European Union's Horizon 2020 research and innovation program under grant agreement No. 691763
Market data for Turkey Biomass availability, quality, costs and use a. Which are the biomass resources available and how much annually? Table a.1.- Global country field biomass resources potential and consumption.
FORESTS Source Comments
POTENTIAL
(t DM/y)
Conifers 2,727,316 www.ogm.gov.tr, 2015 (380 kg/m3)&(humidity=50%)(2015)
Broadleaves 1,005,344 www.ogm.gov.tr,2015 (380 kg/m3)&(humidity=50%)(2015)
Mixed forests 1,199,514 www.ogm.gov.tr, 2015 (380 kg/m3)&(humidity=50%)(2015)
Shrubs -
Other (specify) -
Other (specify) -
TOTAL FORESTS 4,932,174
AGRICULTURE
POTENTIAL
(t DM/y)
Rain-fed crops - -
Irrigated crops - -
Rice crops 249,000
2014,Turkstat It is not calculated, given data directly.
Olive plantations 850,000
2015-2016,Turkstat It is not calculated, given data directly.
Orchard plantations
It is not calculated, given data directly.
Vineyards 212,000
2015, TurkStat It is not calculated, given data directly.
Rape and turnip rape 110,000
2014, TurkStat It is not calculated, given data directly.
Sunflower 685,000
2014,TurkStat It is not calculated, given data directly.
Soya 150,000
2014,Turkstat It is not calculated, given data directly.
TOTAL AGRICULTURE 2,256,000
Table a.2.- Global country agro-industry biomass resources
SECTOR OF ACTIVITY
TYPE OF BY-PRODUCTS
POTENTIAL (t DM/y)
Source Comments
Wood industries
Bark 600,000 Hayat Energy 8-12% of total potential (6,500,000*0,09(average)=600,000 t/year)

179
This project has received funding from the European Union's Horizon 2020 research and innovation program under grant agreement No. 691763
This project has received funding from the European Union's Horizon 2020 research and innovation program under grant agreement No. 691763
Clean wood by-products (wood based panel)
6,500,000 Hayat Energy 9,200,000m3*0,7 t/m3=6,500,000 ton
Other wood by-products (specify)
-
Nut hulling industry
Almond Shell 40,000 2015, http://www.tuik.gov.tr/PreTablo.do?alt_id=1001
50% of the fruit potential equals to the shell.
Chopped pine cone
-
Pistachio shells 72,000 2015, http://www.tuik.gov.tr/PreTablo.do?alt_id=1001
50% of the fruit potential equals to the shell.
Hazelnut shell 323,000 2015, http://www.tuik.gov.tr/PreTablo.do?alt_id=1001
50% of the fruit potential equals to the shell.
Other(Almond shell)
40,000 2015, http://www.tuik.gov.tr/PreTablo.do?alt_id=1001
50% of the fruit potential equals to the shell.
Olive oil industry
Olive stones 1,750 Marmarabirlik Marzey, 2015
It is not calculated, given data directly.
Exhausted olive cake
850,000 2015, http://www.tuik.gov.tr/PreTablo.do?alt_id=1001
It is not calculated, given data directly.
TOTAL AGROINDUSTRY 8,426,750

180
This project has received funding from the European Union's Horizon 2020 research and innovation program under grant agreement No. 691763
This project has received funding from the European Union's Horizon 2020 research and innovation program under grant agreement No. 691763
Table a.3.- Solid biofuels production
BIOFUEL
DOMESTIC QUALITY
(tDM /y)
INDUSTRIAL QUALITY
(tDM /y)
TOTAL
(tDM /y)
Source Comments
Firewood 3,900,000 www.ogm.gov.tr
Wood chips 3,250,000 www.ogm.gov.tr
Other chips (e.g. pruning)
- - -
Wood briquettes
- - -
Wood pellets 430,000 http://www.buyuktorbali.com/dogalgazin-pabucunu-dama-atan-yakit-pelet
Other pellets (e.g. pruning)
- - -
Olive stones 1,750 Marmarabirlik Marzey, 2015
Exhausted olive cake
850,000 2015, http://www.tuik.gov.tr/PreTablo.do?alt_id=1001
Nut shells
Almond Shell
40,000 2015, http://www.tuik.gov.tr/PreTablo.do?alt_id=1001
Chopped pine cone
-
Pine nut shells
-
Hazelnut shell
323,000 2015, http://www.tuik.gov.tr/PreTablo.do?alt_id=1001
Pistachio shell
72,200 2015, http://www.tuik.gov.tr/PreTablo.do?alt_id=1001
Walnut shell
85,000 2015, http://www.tuik.gov.tr/PreTablo.do?alt_id=1001
Other(Almond shell)
40,000 2015, http://www.tuik.gov.tr/PreTablo.do?alt_id=1001

181
This project has received funding from the European Union's Horizon 2020 research and innovation program under grant agreement No. 691763
This project has received funding from the European Union's Horizon 2020 research and innovation program under grant agreement No. 691763
Table a.4.- Solid biofuels use by biofuel type
BIOFUEL
DOMESTIC USE
(tDM /y)
INDUSTRIAL USE
(tDM /y)
TOTAL
(tDM /y)
Source Comments
Firewood
Wood chips
Other chips (e.g.
pruning)
Wood briquettes
Wood pellets
Other pellets (e.g. pruning)
Olive stones
Exhausted olive cake
Nut shells
Almond Shell
Chopped pine cone
Pine nut shells
Hazelnut shell
Pistachio shell
Walnut shell
Other(specify)
Please, ad new files for each additional biofuel
Sunflower
TOTAL

182
This project has received funding from the European Union's Horizon 2020 research and innovation program under grant agreement No. 691763
This project has received funding from the European Union's Horizon 2020 research and innovation program under grant agreement No. 691763
b. How much is imported and/or exported annually? Table b.1.- Solid biofuels imports/exports
BIOFUEL EXPORTS
(t /y)
IMPORTS
(t /y)
MAIN IMPORT-EXPORT
COUNTRIES/ FINAL USE
Source Comments
Firewood
Wood chips
Other chips (e.g.
pruning)
Wood briquettes
Wood pellets
Other pellets (e.g.
pruning)
Olive stones
Exhausted olive cake
Nut shells
Almond Shell
Chopped pine cone
Pine nut shells
Hazelnut shell
Other(specify)
Other(specify)
Please, ad new files for each additional biofuel
TOTAL
Data of biomass trade was not found for Turkey

183
This project has received funding from the European Union's Horizon 2020 research and innovation program under grant agreement No. 691763
This project has received funding from the European Union's Horizon 2020 research and innovation program under grant agreement No. 691763
c. What are the typical costs of the biofuels for commercial and private customers? Table c.1.- Solid biofuels prices
Biofuel Commercial customers typical cost
€/t
Domestic customers typical cost
€/t
Source Comments
Hazelnut shell 97 97 https://cevizkabugusatisi.wordpress.com/2015/03/22/ceviz-kabugu-fiyatlari/
Wallnut shell 97 97 https://cevizkabugusatisi.wordpress.com/2015/03/22/ceviz-kabugu-fiyatlari/
Pistachio shell 87 87 https://cevizkabugusatisi.wordpress.com/2015/03/22/ceviz-kabugu-fiyatlari/
Almond shell 97 97 https://cevizkabugusatisi.wordpress.com/2015/03/22/ceviz-kabugu-fiyatlari/
d. Where are the biofuels used This question is to complement the information in table a3. Table d.1.- Solid biofuels use by sector
Sector Total Amount
t/y
Main type of biofuel used
Reference Comments
Agricultural-farm sector
Biomass power plants (only electricity)
Co-firing power plants(only electricity)
CHP and CHPC plants residential sector
CHP and CHPC plants industrial sector
Residential not CHP
Data of biomass consumption by sectors was not found for Turkey e. Are being used certified solid biofuels in the market? Please specify types, certification standards

184
This project has received funding from the European Union's Horizon 2020 research and innovation program under grant agreement No. 691763
This project has received funding from the European Union's Horizon 2020 research and innovation program under grant agreement No. 691763
and annual quantities. Table e.1.- Solid biofuels imports/exports
Biofuel Certification standard
Annual amount
t/y
Source Comments
Data of biomass certification was not found for Turkey

185
This project has received funding from the European Union's Horizon 2020 research and innovation program under grant agreement No. 691763
This project has received funding from the European Union's Horizon 2020 research and innovation program under grant agreement No. 691763
Consolidated SWOT analysis

186
This project has received funding from the European Union's Horizon 2020 research and innovation program under grant agreement No. 691763
This project has received funding from the European Union's Horizon 2020 research and innovation program under grant agreement No. 691763
Swot analysis for [Olive Stones] in [All]
Please fill at least 3 elements in each category and evaluate the importance of each element from 1 to
5 being 5 the maximum.
Strengths
Good quality fuel. High net calorific value, high density and low ash content
Feasibility of direct use for energy in small scale combustion may increase acceptance among the users
Large availability some countries
(Spain, Greece, Italy, Portugal)
Low price compared with other
biomasses, namely wood pellets
Agroindustry by-product. Low GHG
emissions
Weaknesses
Variations in the availability annually
because of the characteristics of the
olive tree and weather conditions
Low quality of the olive stone in the
market relative to its potential
The adoption of Standard /
certification schemes for these fuels
is not widespread
More emissions compared to Pellets
due to poor devices and more NO
content
Opportunities
Olive mills interested in producing
olive stones as a means to increase
and diversify income
Renewable targets and legislation
promoting renewable energies could
benefit biofuels
Potential market due to substitution
of fossil fuels devices
Alternative to pellets easy to use if
standardised
Threats
Lack of manufacturers’ interest for
the implementation of suitable
stoves and boilers
Presence of not standardised / bad
quality olive stones in the market
Competition with other fuels /
biofuels
Lack of Professionals qualified to
install biomass heating systems

187
This project has received funding from the European Union's Horizon 2020 research and innovation program under grant agreement No. 691763
This project has received funding from the European Union's Horizon 2020 research and innovation program under grant agreement No. 691763
Swot analysis for [Wood chips] in [All]
Please fill at least 3 elements in each category and evaluate the importance of each element from 1 to
5 being 5 the maximum.
Strengths
Very good fuel properties (for forest
wood chips), especially ash content,
comparable with wood pellets
Low fuel cost, very cheap alternative
to fossil fuels
Employment opportunities for local
community in the supply chain
logistics of biomass
Developed supply side. Infrastructure
and technologies for harvest are well
established for wood chips
Useful also for larger Systems (micro
and district heating systems
Weaknesses
Logistic of storing and
transportation expensive
Greater variability in fuel properties
which may affect combustion system
performance
Expensive technologies for
production and use
Low energy content per volume /
large storage room
Still very low number of plants
installed per year
Opportunities
Contribute to rural development
(create employment)
Large potential in use of wood chips
in big users buildings
High market potential: areas still not
covered by natural gas grid, industrial
processes
Standard product with high
acceptance
Renewable targets and legislation
promoting renewable energies could
benefit biofuels
Threats
Competition with other Fossil fuel
low prices
High cost of installation for
households
Small producers
Good availability
Competition for the raw material by
other biofuels such as wood fire or
wood industries

188
This project has received funding from the European Union's Horizon 2020 research and innovation program under grant agreement No. 691763
This project has received funding from the European Union's Horizon 2020 research and innovation program under grant agreement No. 691763
Swot analysis for [Nuts] in [All]
Please fill at least 3 elements in each category and evaluate the importance of each element from 1 to
5 being 5 the maximum.
Strengths
Good quality, low ash content, low
moisture suitable for combustion in
domestic heating appliances
No need to process too much
Agricultural by-product that diversify
incomes for industries and have low
carbon footprint
Easy storage
Low price compared with wood
pellets.
Weaknesses
Small volumes of production, mostly
of interest for local consumption
Seasonal biomass availability which is
a problem for storage (big quantities
in few time) and therefore can be
stored open air and getting poor
quality (moisture)
High oil content, possible impact on
combustion devices
Poor presence of suitable stoves and
boilers (emissions)
Opportunities
Renewable targets and legislation
promoting renewable energies could
benefit biofuels
Agricultural by-product that diversify
incomes for industries and reduce its
energy dependence
There is a consolidated market and in
some regions new crops are being
implementing that can increase
availability
Opportunity to valorize a agro-industrial by-product
Threats
The availability of these biofuels depends on the annual production of fruits (very variable)
Market size and organization. Small production volumes means that there is limited interest in further upgrading this resource, e.g. through fuel certification
Lack of manufacturers’ interest for
the implementation of suitable
stoves and boilers
Competition with other biofuels or
fossil fuels

189
This project has received funding from the European Union's Horizon 2020 research and innovation program under grant agreement No. 691763
This project has received funding from the European Union's Horizon 2020 research and innovation program under grant agreement No. 691763
Swot analysis for [Olive tree prunings] in [All]
Please fill at least 3 elements in each category and evaluate the importance of each element from 1 to
5 being 5 the maximum.
Strengths
Huge availability in Mediterranean
regions.
Big potential unused nowadays is
burned or chipped and reverted to
the soil.
Quality similar to woodchips if
recollection is properly done
The energetic valorisation avoids the
outdoor burning of prunings (air
quality)
Employment opportunities for local community in the supply chain logistics of biomass
Weaknesses
Difficult to collect prunings in a
proper way for not taking sand and
degrading the quality. Need for
specialised machinery
Seasonal biomass availability
Higher ash content compared to
forest wood biomass, hence higher
expected dust emissions
Lack of biofuel standard and
certification scheme
Poor presence of suitable stoves and
boilers (emissions)
Logistics (harvesting, pre-treatment,
supply) can be expensive
Opportunities
Legislation trend is to forbid the elimination by fire
Farmers interested in cost reduction or diversifying their sources of income
Availability of solid biomass for energy in agricultural areas
Availability is in rural areas where there can be programs that can finance machinery
Renewable targets and legislation promoting renewable energies could benefit biofuels
Threats
Appliances adapted to the type of biofuel
Professionals qualified to install biomass heating systems
Competition with other biofuels or with mulching
Lack of manufacturers’ interest for the implementation of suitable stoves and boilers

190
This project has received funding from the European Union's Horizon 2020 research and innovation program under grant agreement No. 691763
This project has received funding from the European Union's Horizon 2020 research and innovation program under grant agreement No. 691763
Swot analysis for [vineyard prunings] in [All]
Please fill at least 3 elements in each category and evaluate the importance of each element from 1 to
5 being 5 the maximum.
Strengths
New/additional source of income for wine producers / farmers
High availability in most of the countries of the project and lots of unused potential of vineyard prunings.
Quite high production per hectare
The energetic valorisation avoids the outdoor burning of prunings (air quality)
Renewable targets and legislation promoting renewable energies could benefit biofuels
Weaknesses
Seasonal biomass availability
Lack of biofuel standard and certification scheme
Logistics (harvesting, pre-treatment, supply) can be expensive
Higher ash content compared to forest wood biomass, hence higher expected dust emissions
Lack of suitable stoves and small-medium boilers, which permits to burn this biofuels respecting the emissions limits
Opportunities
Legislation trend is to forbid the elimination by fire
Farmers interested in cost reduction or diversifying their sources of income
Contribute to rural development by absorbing and valorising substantial volumes of agricultural waste as feedstock
The controlled combustion of prunings (industrial plants) make better the air quality of productive districts
Renewable targets and legislation
promoting renewable energies could
benefit biofuels
Threats
No quality standards for vineyards punning’s
Uncertain market conditions for placing vineyard pruning as biofuel.
Lack of manufacturers’ interest for the implementation of suitable stoves and boilers
Competition with other bifouels / fossil fuels
Competition use of the prunings mulching

191
This project has received funding from the European Union's Horizon 2020 research and innovation program under grant agreement No. 691763
This project has received funding from the European Union's Horizon 2020 research and innovation program under grant agreement No. 691763
Croatia’s SWOT analysis

192
This project has received funding from the European Union's Horizon 2020 research and innovation program under grant agreement No. 691763
This project has received funding from the European Union's Horizon 2020 research and innovation program under grant agreement No. 691763
Swot analysis for [Olive stones] in [Croatia]
Please fill at least 3 elements in each category and evaluate the importance of each element from 1 to
5 being 5 the maximum.
Strengths
Low ash content (5)
In combination with wood pellets
very good quality as biofuels (4)
Low emission (5)
Weaknesses
Seasonal availability, there is no
continuous stream (5)
Use for self-consumption (4)
Opportunities
Possibility of joining large
numbers of producers in order to
improve competitiveness
regarding biofuel production (5)
Threats
No market conditions for placing olive stones as biofuel. Olive stones competitiveness is very weak compared to current industry trends (wood pellets, firewood) (5)
Expensive machine for separation
olive stones from olive pomace
(4)
Still treated as a waste

193
This project has received funding from the European Union's Horizon 2020 research and innovation program under grant agreement No. 691763
This project has received funding from the European Union's Horizon 2020 research and innovation program under grant agreement No. 691763
Swot analysis for [Wood chips] in [Croatia]
Please fill at least 3 elements in each category and evaluate the importance of each element from 1 to
5 being 5 the maximum.
Strengths
Available biofuels with low cost
(4)
Low percentage of small parts,
low ash content (5)
Low emissions (5)
Weaknesses
Low energy density (4)
Due to bulk storage, this biofuel
requests twice as much space as
the wood logs (5)
Content of water should be less than 30%, otherwise could cause congestion of the system and creation of the carbon soot (5)
Opportunities
Larger exploitation of wood waste
(5)
High availability of sources (5)
Higher awareness of consumers for
benefits of using this biofuels (4)
Threats
High cost of installation for
households (5)
Wood chips competitiveness is
very weak compared firewood (5)
Higher price in the
future/undefined price of wood
chips (4)
Availability of the annual amount
prescribed by the government law
(5)

194
This project has received funding from the European Union's Horizon 2020 research and innovation program under grant agreement No. 691763
This project has received funding from the European Union's Horizon 2020 research and innovation program under grant agreement No. 691763
Swot analysis for [Nut shells] in [Croatia]
Please fill at least 3 elements in each category and evaluate the importance of each element from 1 to
5 being 5 the maximum.
Strengths
Low ash content (5)
No need for additional drying process,
biofuel with low humidity (5)
Easy manipulation and storage (5)
Low emission (5)
Weaknesses
Crops depends on the weather
conditions, different yield every
year (5)
Small yield per hector, mostly used
for personal consumption (4)
Limited offer and high price of
cleaning machines (4)
High oil content, can cause damage
on combustion devices (5)
Opportunities
Increased breeding of nuts shells
in last couple of years (5)
Higher awareness of consumers for benefits of using this biofuels (4)
Threats
Lower nut shells production
volume in comparison with
more popular biofuels (wood
chips, wood pellets) (4)
Using only for self-consumption (5)
Uncertain market conditions for
placing nut shells as biofuels (5)

195
This project has received funding from the European Union's Horizon 2020 research and innovation program under grant agreement No. 691763
This project has received funding from the European Union's Horizon 2020 research and innovation program under grant agreement No. 691763
Swot analysis for [Olive tree prunings] in [Croatia]
Please fill at least 3 elements in each category and evaluate the importance of each element from 1 to
5 being 5 the maximum.
Strength
High availability of olive tree
prunings (5)
Good heating value (5)
Weaknesses
Most of olive plantations are on
the islands so there is higher cost
of transportation (4)
Use for self-consumption (4)
Poor management of collecting
the prunings (5)
Seasonal availability, there is no
continuous stream (5)
Opportunities
Increasing trends for olive tree
growing (4)
Possibility of joining large
numbers of producers in order to
improve competitiveness
regarding biofuel production
(reduction of expenses) (5)
Threats
No market conditions for placing olive tree prunings as biofuel (5)
Olive tree prunings competitiveness is very weak compared to current industry trends (wood pellets, firewood, wood chips) (5)
Still treated as a waste (5)

196
This project has received funding from the European Union's Horizon 2020 research and innovation program under grant agreement No. 691763
This project has received funding from the European Union's Horizon 2020 research and innovation program under grant agreement No. 691763
Swot analysis for [Vineyard prunings] in [Croatia]
Please fill at least 3 elements in each category and evaluate the importance of each element from 1 to
5 being 5 the maximum.
Strengths
Large areas in Croatia covered in
vineyard tree (5)
Vineyard tree has a huge
potential for local use since it can
be grown from across the entire
country (production not
centralized (5)
High pruning income in vineyards
with intense production (5)
Weaknesses
Although large area in Croatia is
covered in vineyard, sizes of
individual vineyards are only up to
1 ha (too small for biofuel
production) (4)
Trend of reducing production and
vineyards size in the last 10 years
(4)
Production seasonality (5)
Opportunities
Ability to be used in the entire
country without the additional
transport expenses (can be
produced and used locally) (4)
Possible combination of biofuel
production and wine pomace in
order to reduce waste in wine
production process (4)
Possibility of joining large
numbers of producers in order to
improve competitiveness
regarding biofuel production
(reduction of expenses) (5)
Threats
Uncertain market conditions for
placing vineyard pruning as
biofuel. Vineyard pruning
competitiveness is very weak
compared to current industry
trends (wood pellets, fire wood,
wood chips) (5)
Due to the lack of information and
research about quality of vineyard
pruning as a fuel, people would
likely be more hesitant to use it
than to use other fuels (4)
Setting of a biomass supply chain
could present additional expense
for farmers and producers (4)

197
This project has received funding from the European Union's Horizon 2020 research and innovation program under grant agreement No. 691763
This project has received funding from the European Union's Horizon 2020 research and innovation program under grant agreement No. 691763
Greece’s SWOT analysis

198
This project has received funding from the European Union's Horizon 2020 research and innovation program under grant agreement No. 691763
This project has received funding from the European Union's Horizon 2020 research and innovation program under grant agreement No. 691763
Swot analysis for [Olive stones] in [Greece]
Please fill at least 3 elements in each category and evaluate the importance of each element from 1 to
5 being 5 the maximum.
Strengths
Low ash content, suitable for
combustion in domestic heating
appliances (5)
Low cost compared to “standard”
wood pellets (5)
Lower emissions compared to
exhausted olive cake (3)
No odour, contrary to exhausted
olive cake (4)
Good country availability based
on the annual olive oil production
Weaknesses
Small particle size distribution,
can be an issue for the feeding
systems of some combustion devices
(3)
Variations in annual production
due to changes in the volume of olive
oil production from weather
conditions (3)
Higher nitrogen content
compared to wood pellets, can be a
cause of NOx emissions (2)
Opportunities
Olive mills interested in
producing olive stones as a
means to increase and diversify
income (4)
Revision of legislation in favour of
cleaner fuels can indirectly help
wood chips adoption (3)
Separation of olive stones from
exhausted olive cake can also
provide opportunities for olive
mills to increase income (4)
Threats
Consumers – and in some cases
people involved in the olive value
chain – are often unaware of the
differences between this fuel and
exhausted olive cake (4)
Pomace mill operators are often
against the separation of the olives
stones at the level of the primary
olive mills, since it affects the quality
of the incoming material for their
facilities (5)
Availability of olive stones mostly
in southern Greece, in areas with
lower heat demand and thus reduced
annual fuel consumption (3)
Very low cost of exhausted olive
cake, which combines stone and flesh
fractions (4)

199
This project has received funding from the European Union's Horizon 2020 research and innovation program under grant agreement No. 691763
This project has received funding from the European Union's Horizon 2020 research and innovation program under grant agreement No. 691763
Swot analysis for [Wood chips] in [Greece]
Please fill at least 3 elements in each category and evaluate the importance of each element from 1 to
5 being 5 the maximum.
Strengths
Very good fuel properties (for
forest wood chips), especially ash
content, comparable with wood
pellets (4)
Low fuel cost, very cheap
alternative to fossil fuels (5)
Low emissions (3)
Weaknesses
Low energy density, issues with
transport and storage. The latter can
be a major issue in domestic use in
urban areas (5)
Existing feeding systems for small-
scale biomass boilers are unable to
handle wood chips (5)
Greater variability in fuel
properties which may affect
combustion system performance (3)
Uncertainties regarding potential
of the forest sector to produce wood
chips (3)
Opportunities
Households interested in
identifying low cost fuels (3)
Revision of legislation in favour of
cleaner fuels can indirectly help
wood chips adoption (3)
Communities located near forest
areas often have good incentives
(e.g. higher heat demand, good
availability of resources) to develop
wood chips value chains (3)
Threats
Very big market for firewood,
which limits the material available
for wood chip production (4)
The expanding biomass market is
targeting mostly pellets and
firewood: only niche markets for
wood chips (5)
Consumers unaware of this type
of fuel and producers / traders are
unwilling to invest (5)
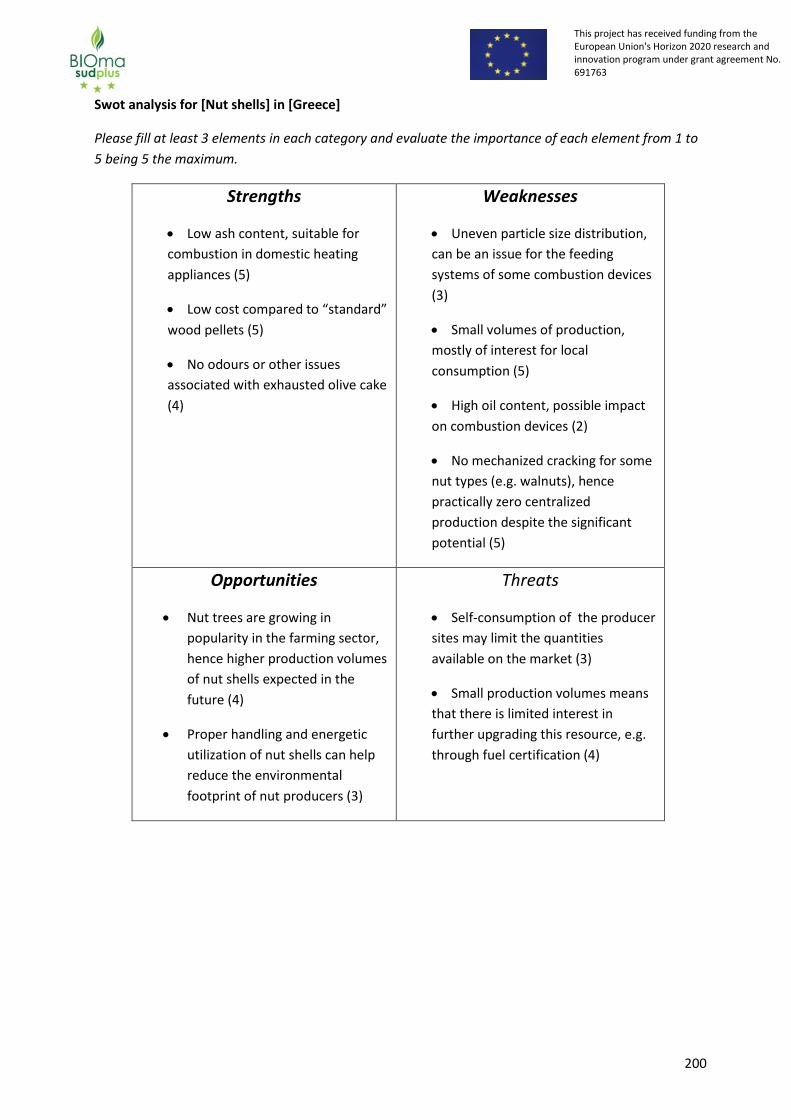
200
This project has received funding from the European Union's Horizon 2020 research and innovation program under grant agreement No. 691763
This project has received funding from the European Union's Horizon 2020 research and innovation program under grant agreement No. 691763
Swot analysis for [Nut shells] in [Greece]
Please fill at least 3 elements in each category and evaluate the importance of each element from 1 to
5 being 5 the maximum.
Strengths
Low ash content, suitable for
combustion in domestic heating
appliances (5)
Low cost compared to “standard”
wood pellets (5)
No odours or other issues
associated with exhausted olive cake
(4)
Weaknesses
Uneven particle size distribution,
can be an issue for the feeding
systems of some combustion devices
(3)
Small volumes of production,
mostly of interest for local
consumption (5)
High oil content, possible impact
on combustion devices (2)
No mechanized cracking for some
nut types (e.g. walnuts), hence
practically zero centralized
production despite the significant
potential (5)
Opportunities
Nut trees are growing in
popularity in the farming sector,
hence higher production volumes
of nut shells expected in the
future (4)
Proper handling and energetic
utilization of nut shells can help
reduce the environmental
footprint of nut producers (3)
Threats
Self-consumption of the producer
sites may limit the quantities
available on the market (3)
Small production volumes means
that there is limited interest in
further upgrading this resource, e.g.
through fuel certification (4)

201
This project has received funding from the European Union's Horizon 2020 research and innovation program under grant agreement No. 691763
This project has received funding from the European Union's Horizon 2020 research and innovation program under grant agreement No. 691763
Swot analysis for [Olive tree prunings] in [Greece]
Please fill at least 3 elements in each category and evaluate the importance of each element from 1 to
5 being 5 the maximum.
Strengths
High availability of olive tree
prunings in Greece (especially
Southern Greece) and quite high
production per hectare (4)
Heating value comparable to
forest wood biomass (4)
Disposal of olive tree prunings
represents a cost to farmers;
therefore, energetic utilization can be
a cost saver or potential source of
income (4)
Weaknesses
Area distributed biomass
resource. Collection costs and
logistics operations can increase the
value of the fuel sold to consumers
(5)
Due to the generally small size of
agricultural holdings, difficult to
mobilize sufficient number of
farmers to set-up quite large value
chains (4)
Appropriate handling of olive
tree leaves requires more complex
operations from farmers / operators
(3)
Higher ash content compared to
forest wood biomass, hence higher
expected dust emissions (3)
Opportunities
Farmers interested in cost
reduction or diversifying their sources
of income (4)
General interest in biomass and
low cost heating solutions (4)
Entrepreneurs interested in
investing the potential of this biomass
resource (4)
Prohibition or further limits in the
open-fire burning of this resource can
open up its utilization for energetic
purposes (4)
Olive tree wood known for its
good fuel properties (2)
Actors that can be involved in
olive tree pruning value chains are
Threats
Higher availability of olive tree
prunings mostly in southern Greece,
in areas with lower heat demand
and thus reduced annual fuel
consumption (4)
In the same areas, competition
with the low cost exhausted olive
cake or the higher quality olive
stones can be a barrier to the
acceptance of this fuel (4)
The spreading of the practice of
mulching as a cost effective way to
handle olive tree prunings limits the
resources available. Mulching may
not generate direct profit for the
farmers, but it also does not require
the setting up of a biomass supply
chain (4)

202
This project has received funding from the European Union's Horizon 2020 research and innovation program under grant agreement No. 691763
This project has received funding from the European Union's Horizon 2020 research and innovation program under grant agreement No. 691763
the same as those involved in the
handling of biomass from olives, e.g.
olive stones and exhausted olive
cake. Hence, synergies can be
established (3)
Setting up an olive tree pruning
value chain in the current economic
environment is riskier and more
difficult than investing in other
alternatives (4)

203
This project has received funding from the European Union's Horizon 2020 research and innovation program under grant agreement No. 691763
This project has received funding from the European Union's Horizon 2020 research and innovation program under grant agreement No. 691763
Swot analysis for [Vineyard prunings] in [Greece]
Please fill at least 3 elements in each category and evaluate the importance of each element from 1 to
5 being 5 the maximum.
Strengths
High availability of vineyard
prunings in Greece and quite high
production per hectare (4)
Heating value comparable to
forest wood biomass (4)
Disposal of vineyard prunings
represents a cost to farmers;
therefore, energetic utilization can be
a cost saver or potential source of
income (4)
Weaknesses
Area distributed biomass
resource. Collection costs and
logistics operations can increase the
value of the fuel sold to consumers
(5)
Lower yield per hectare
compared to olive tree prunings
Due to the generally small size of
agricultural holdings, difficult to
mobilize sufficient number of
farmers to set-up quite large value
chains (4)
Higher ash content compared to
forest wood biomass, hence higher
expected dust emissions (3)
Opportunities
Farmers interested in cost
reduction or diversifying their sources
of income (4)
General interest in biomass and
low cost heating solutions (4)
Prohibition or further limits in the
open-fire burning of this resource can
open up its utilization for energetic
purposes (4)
Vineyard wood is known for its
good fuel properties, especially
regarding heating (2)
Threats
The spreading of the practice of
mulching as a cost effective way to
handle vineyard prunings limits the
resources available. Mulching may
not generate direct profit for the
farmers, but it also does not require
the setting up of a biomass supply
chain (4)
Some competition between
traditional uses of vineyard prunings
(e.g. barbeques, grilling, etc.) may
limit availability (4)
Setting up a vineyard pruning
value chain in the current economic
environment is quite risky (4)

204
This project has received funding from the European Union's Horizon 2020 research and innovation program under grant agreement No. 691763
This project has received funding from the European Union's Horizon 2020 research and innovation program under grant agreement No. 691763
Italy’s SWOT analysis

205
This project has received funding from the European Union's Horizon 2020 research and innovation program under grant agreement No. 691763
This project has received funding from the European Union's Horizon 2020 research and innovation program under grant agreement No. 691763
Swot analysis for [Olive Stones] in [Italy]
Please fill at least 3 elements in each category and evaluate the importance of each element from 1 to
5 being 5 the maximum.
Strengths
Presence of productive districts (3)
The residue has to be processed anymore (4)
Logistic of harvesting, treatments, and supply consolidate (4)
High energy density of biofuel (4)
Standard product, in the case of industrial oil mill (4)
Consolidate processing industry across Italy (4)
Weaknesses
Lack of biofuel standard and
certification scheme (5)
The standardisation is difficult for small oil mill (4)
Poor presence of suitable stoves and
boilers (emissions) (3)
Divergence between offer and
demand for meteorological reasons
(4)
Opportunities
Energy independence of farmers and
processing sites (3)
Availability of solid biomass for energy in agricultural areas (3)
Consolidate market of this biofuel
although uneven (4)
Threats
Inability to use in the next future
(Ecodesign enters in force in 2020
and 2022) (3)
Lack of manufacturers’ interest for the implementation of suitable stoves and boilers(5)

206
This project has received funding from the European Union's Horizon 2020 research and innovation program under grant agreement No. 691763
This project has received funding from the European Union's Horizon 2020 research and innovation program under grant agreement No. 691763
Swot analysis for [Wood Chips] in [Italy]
Please fill at least 3 elements in each category and evaluate the importance of each element from 1 to
5 being 5 the maximum.
Strengths
High availability of forest wood chips
(4)
The forest wood chips chain is mature, both for the biosuels as well as for chip boilers (5)
It is a virtuous "short-chain" with important socio-economics benefits and high added value for local communities (5)
Weaknesses
Still very low number of plants
installed per years (5)
Increasly availability of chips class B (thanks to meccanization and development of forest enterpreneurs), but still low number of plants interested to buy this low-quality wood chips (4)
Falling sales of small-medium size
chips plants, decreasing demand of
chips class A1 and A2 (4)
High costs of chips plants (expecially
the small-medium size ones) (4)
Logistic of storing and transportation
expensive (4)
Still poor information for the
potential market on the actual
reliability of wood chips (Biomass
Logistic and Trade Centres) (4)
Some areas are still not cover by the
network of professional chips
producers (3
Still low number of professional
chips producers (about 100 in Italy,
the majority is in the North) (4)

207
This project has received funding from the European Union's Horizon 2020 research and innovation program under grant agreement No. 691763
This project has received funding from the European Union's Horizon 2020 research and innovation program under grant agreement No. 691763
Opportunities
A certification scheme for wood chips
already existing (5)
High government incentives for the next 10 years (5)
High market potential: areas still not
covered by natural gas grid, industrial
processes
Threats
Natural disasters make very high the
availability of logs and decreasing
the chips price (3)
Social acceptability of pubblic plants (4)
High volatility of fossil fuels price (4)
Lowering of Heating Degree Days
(HDD) (4)
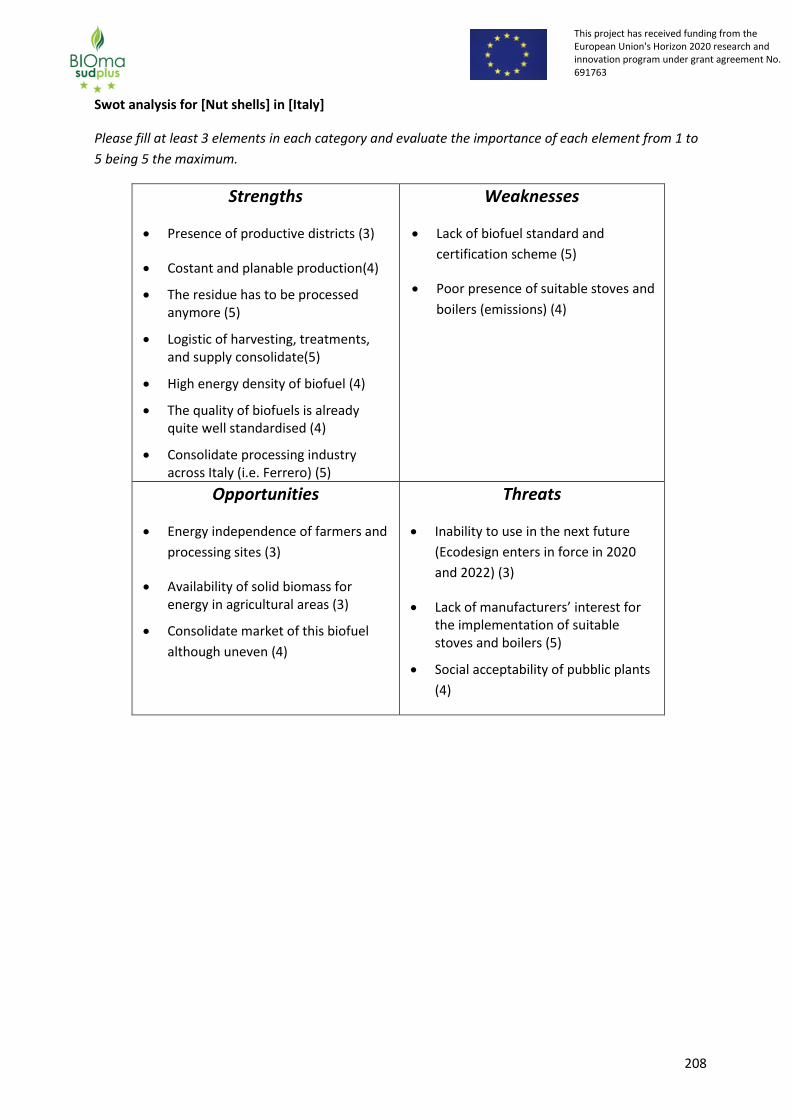
208
This project has received funding from the European Union's Horizon 2020 research and innovation program under grant agreement No. 691763
This project has received funding from the European Union's Horizon 2020 research and innovation program under grant agreement No. 691763
Swot analysis for [Nut shells] in [Italy]
Please fill at least 3 elements in each category and evaluate the importance of each element from 1 to
5 being 5 the maximum.
Strengths
Presence of productive districts (3)
Costant and planable production(4)
The residue has to be processed anymore (5)
Logistic of harvesting, treatments, and supply consolidate(5)
High energy density of biofuel (4)
The quality of biofuels is already quite well standardised (4)
Consolidate processing industry across Italy (i.e. Ferrero) (5)
Weaknesses
Lack of biofuel standard and
certification scheme (5)
Poor presence of suitable stoves and
boilers (emissions) (4)
Opportunities
Energy independence of farmers and
processing sites (3)
Availability of solid biomass for energy in agricultural areas (3)
Consolidate market of this biofuel
although uneven (4)
Threats
Inability to use in the next future
(Ecodesign enters in force in 2020
and 2022) (3)
Lack of manufacturers’ interest for the implementation of suitable stoves and boilers (5)
Social acceptability of pubblic plants
(4)
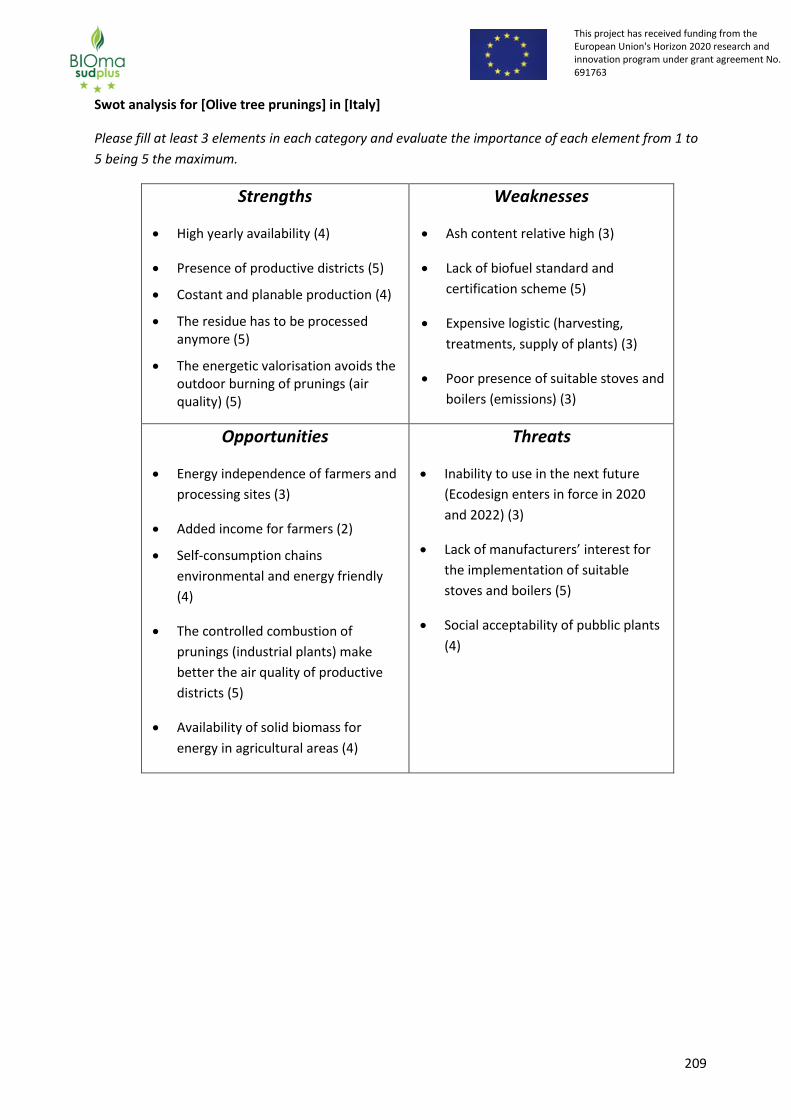
209
This project has received funding from the European Union's Horizon 2020 research and innovation program under grant agreement No. 691763
This project has received funding from the European Union's Horizon 2020 research and innovation program under grant agreement No. 691763
Swot analysis for [Olive tree prunings] in [Italy]
Please fill at least 3 elements in each category and evaluate the importance of each element from 1 to
5 being 5 the maximum.
Strengths
High yearly availability (4)
Presence of productive districts (5)
Costant and planable production (4)
The residue has to be processed anymore (5)
The energetic valorisation avoids the outdoor burning of prunings (air quality) (5)
Weaknesses
Ash content relative high (3)
Lack of biofuel standard and
certification scheme (5)
Expensive logistic (harvesting,
treatments, supply of plants) (3)
Poor presence of suitable stoves and
boilers (emissions) (3)
Opportunities
Energy independence of farmers and
processing sites (3)
Added income for farmers (2)
Self-consumption chains
environmental and energy friendly
(4)
The controlled combustion of
prunings (industrial plants) make
better the air quality of productive
districts (5)
Availability of solid biomass for
energy in agricultural areas (4)
Threats
Inability to use in the next future
(Ecodesign enters in force in 2020
and 2022) (3)
Lack of manufacturers’ interest for
the implementation of suitable
stoves and boilers (5)
Social acceptability of pubblic plants
(4)

210
This project has received funding from the European Union's Horizon 2020 research and innovation program under grant agreement No. 691763
This project has received funding from the European Union's Horizon 2020 research and innovation program under grant agreement No. 691763
Swot analysis for [Vineyard prunings] in [Italy]
Please fill at least 3 elements in each category and evaluate the importance of each element from 1 to
5 being 5 the maximum.
Strengths
High yearly availability, which is
increasing durings last years (4)
Presence of productive districts (4)
Costant and planable production (5)
The residue has to be processed anymore (5)
The energetic valorisation avoids the outdoor burning of prunings (air quality) (5)
Weaknesses
Ash content very high (5)
Lack of biofuel standard and
certification scheme (5)
Expensive logistic (harvesting,
treatments, supply of plants) (4)
Lack of suitable stoves and small-
medium boilers, which permits to
burn this biofuels respecting the
emissions limits (5)
Opportunities
Energy independence of farmers and
processing sites (3)
Added income for farmers (3)
Self-consumption chains environmental and energy friendly (4)
The controlled combustion of
prunings (industrial plants) make
better the air quality of productive
districts (5)
Availability of solid biomass for
energy in agricultural areas (4)
Threats
Inability to use in the next future
(Ecodesign enters in force in 2020
and 2022) (5)
Lack of manufacturers’ interest for the implementation of suitable stoves and boilers (5)
Social acceptability of pubblic plants
(4)
211
This project has received funding from the European Union's Horizon 2020 research and innovation program under grant agreement No. 691763
This project has received funding from the European Union's Horizon 2020 research and innovation program under grant agreement No. 691763
Portugal’s SWOT analysis

212
This project has received funding from the European Union's Horizon 2020 research and innovation program under grant agreement No. 691763
This project has received funding from the European Union's Horizon 2020 research and innovation program under grant agreement No. 691763
Swot analysis for Olive Stones in Portugal
Please fill at least 3 elements in each category and evaluate the importance of each element from 1 to
5 being 5 the maximum.
Strengths
Biomass with high net calorific value, high density and low ash content
Dry biomass which is easy to store
Feasibility of direct use for energy in small scale combustion may increase acceptance among the users
Low price compared with other biomasses, namely wood pellets
Agroindustry by-product
Increased independency of society from fossil resources
Non-food crop no direct competition for use as food
Large agro-industrial sector that produces significant amounts of residues
Weaknesses
Seasonal biomass availability
Low quality and quantity production rate relative to its potential
The quality of the olive stones depends of the treatment process given to the by-products of olive oil extraction (no standard)
Domestic wood heating is traditional use and this tradition is hard to change
Transport over large distances is expensive
Opportunities
Large increasing of olive grove area
If it is standardized, it is easy to use, stored and feed the process
Standard product with high acceptance
Can be an alternative to pellets
Opportunity to valorize a agro-industrial by-product
Income opportunity for agroindustry
Lower transport costs due to higher density
Enlarge biomass supply and easing pressure on forests
Integration of biomass heating system with solar thermal system
Threats
Market size and organisation
Quantity and quality availability
Lower acceptance for a non-standard product
Appliances adapted to the type of biofuel
Professionals qualified to install biomass heating systems
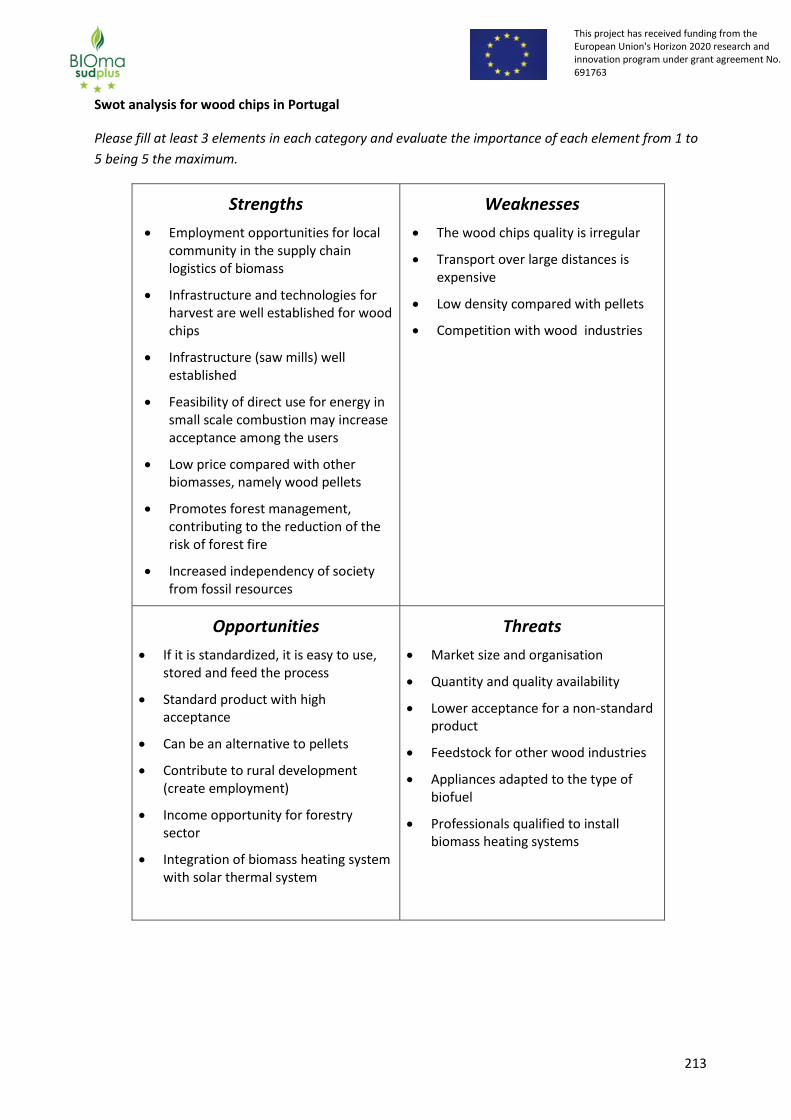
213
This project has received funding from the European Union's Horizon 2020 research and innovation program under grant agreement No. 691763
This project has received funding from the European Union's Horizon 2020 research and innovation program under grant agreement No. 691763
Swot analysis for wood chips in Portugal
Please fill at least 3 elements in each category and evaluate the importance of each element from 1 to
5 being 5 the maximum.
Strengths
Employment opportunities for local community in the supply chain logistics of biomass
Infrastructure and technologies for harvest are well established for wood chips
Infrastructure (saw mills) well established
Feasibility of direct use for energy in small scale combustion may increase acceptance among the users
Low price compared with other biomasses, namely wood pellets
Promotes forest management, contributing to the reduction of the risk of forest fire
Increased independency of society from fossil resources
Weaknesses
The wood chips quality is irregular
Transport over large distances is expensive
Low density compared with pellets
Competition with wood industries
Opportunities
If it is standardized, it is easy to use, stored and feed the process
Standard product with high acceptance
Can be an alternative to pellets
Contribute to rural development (create employment)
Income opportunity for forestry sector
Integration of biomass heating system with solar thermal system
Threats
Market size and organisation
Quantity and quality availability
Lower acceptance for a non-standard product
Feedstock for other wood industries
Appliances adapted to the type of biofuel
Professionals qualified to install biomass heating systems

214
This project has received funding from the European Union's Horizon 2020 research and innovation program under grant agreement No. 691763
This project has received funding from the European Union's Horizon 2020 research and innovation program under grant agreement No. 691763
Swot analysis for Nut shells in Portugal
Please fill at least 3 elements in each category and evaluate the importance of each element from 1 to
5 being 5 the maximum.
Strengths
Agroindustry by-product
No further processing required
Dry biomass which is easy to store
Low price compared with other biomasses, namely wood pellets
Alternate use of the residue which generates income for the agro-industries
Non-food crop no direct competition for use as food
Increased independency of society from fossil resources
Weaknesses
Seasonal biomass availability
Quantity of nut shells available from agro-industry is low compared with the total production of almond, pinion, walnut and hazelnut
Nut shells available are typically consumed by the crushers, for self-consume in their boilers, or sold in a restrict area
Low feasibility of energy equipment for small-scale combustion
High ash content compared to wood biofuels
Domestic wood heating is traditional use and this tradition is hard to change
Transport over large distances is expensive
Opportunities
A significant potential of this solid biofuel is not being used actually in Portugal
It is easy to use, stored and feed the process adapted to these biofuels
Can be an alternative to other biofuels or fossil fuels
Opportunity to valorize a agro-industrial by-product
Income opportunity for agroindustry
Enlarge biomass supply and easing pressure on forests
Threats
The availability of these biofuels depends on the annual production of fruits (very variable)
Market size and organization
Appliances adapted to the type of biofuel
Professionals qualified to install biomass heating systems

215
This project has received funding from the European Union's Horizon 2020 research and innovation program under grant agreement No. 691763
This project has received funding from the European Union's Horizon 2020 research and innovation program under grant agreement No. 691763
Swot analysis for Olive tree prunings in Portugal
Please fill at least 3 elements in each category and evaluate the importance of each element from 1 to
5 being 5 the maximum.
Strengths
Traditional use for domestic heating
Large agricultural sector that produces significant amounts of residues
Income opportunity for farmers
Agricultural by-product
Employment opportunities for local community in the supply chain logistics of biomass
Technologies for harvest are well established
Possibility of being processed into chips or pellets
Feasibility of use for energy
Increased independency of society from fossil resources
Weaknesses
Seasonal biomass availability
Transport over large distances is expensive
Opportunities
Large increasing of olive grove area
Could be converted into chips or pellets
Pelletised prunnings could be used as alternative
o Lower transport costs due to higher density
o Easier feeding to process (higher standardisation)
Opportunity to valorize an agricultural by-product
Enlarge biomass supply and easing pressure on forests
Contribute to rural development by absorbing and valorising substantial volumes of agricultural waste as feedstock
Threats
Appliances adapted to the type of biofuel
Professionals qualified to install biomass heating systems
Parallel market

216
This project has received funding from the European Union's Horizon 2020 research and innovation program under grant agreement No. 691763
This project has received funding from the European Union's Horizon 2020 research and innovation program under grant agreement No. 691763
Swot analysis for Vineyard prunings in Portugal
Please fill at least 3 elements in each category and evaluate the importance of each element from 1 to
5 being 5 the maximum.
Strengths
Large agricultural sector that produces significant amounts of residues
Agricultural by-product
Employment opportunities for local community in the supply chain logistics of biomass
Possibility of being processed into pellets
Increased independency of society from fossil resources
Weaknesses
Seasonal biomass availability
High collecting, processing and transporting costs
Usually disposed and burned in piles on the field
Low density, further processing is required, namely baling
High ash content
Opportunities
Large increasing of vineyard area
Pelletised vineyard prunings could be used as alternative
o Lower transport costs due to higher density
o Easier feeding to process (higher standardisation)
Opportunity to valorize an agricultural by-product, i. e., income opportunity for farmers
Contribute to rural development by absorbing and valorising substantial volumes of agricultural waste as feedstock
Enlarge biomass supply and easing pressure on forests
Threats
Market size and organisation
Quantity and quality availability
Lower acceptance for a non-standard product
Appliances adapted to the type of biofuel
Professionals qualified to install biomass heating systems

217
This project has received funding from the European Union's Horizon 2020 research and innovation program under grant agreement No. 691763
This project has received funding from the European Union's Horizon 2020 research and innovation program under grant agreement No. 691763
Slovenia’s SWOT analysis

218
This project has received funding from the European Union's Horizon 2020 research and innovation program under grant agreement No. 691763
This project has received funding from the European Union's Horizon 2020 research and innovation program under grant agreement No. 691763
Swot analysis for [Wood Chips] in [Slovenia]
Please fill at least 3 elements in each category and evaluate the importance of each element from 1 to
5 being 5 the maximum.
Strengths
(4) The cheapest wood fuel
(comparing €/MW)
(5) Use of low quality wood
(5) Developed supply side
(2) Useful also for larger systems
(micro and district heating systems)
Weaknesses
(5) Expensive technologies for
production and use
(3) Low energy content per volume /
large storage room
(2) Problems with dust
(4) System of pricing is not known or
transparent (buying/selling
according to volume, weight,
energy)
Opportunities
(5) System of subsides for modern
boilers
(5) Rural development program –
support for buying machinery (wood
chippers
(4) Large potential in use of wood
chips in public buildings
Threats
(5) High number of small producers
(2) No system for QA/QC
(4) More stringent legislation about
emissions and ash disposal
(1) No system for trace of origin of
row material

219
This project has received funding from the European Union's Horizon 2020 research and innovation program under grant agreement No. 691763
This project has received funding from the European Union's Horizon 2020 research and innovation program under grant agreement No. 691763
Swot analysis for [Olive tree prunings] in [Slovenia]
Please fill at least 3 elements in each category and evaluate the importance of each element from 1 to
5 being 5 the maximum.
Strengths
(5) Use of residues from olive
plantations
(4) Low price of row material
(3) New/additional source of income
for olive oil producers
Weaknesses
(4) Technology for collecting of
punning’s not available
(5) Small concentration of olive tree
prunning’s – higher costs of
collecting
(3) possibilities of use of punning’s
are not known well among possible
producers and also users
(4) Alternative use of olive tree
prunning’s – for soil fertiliser in olive
tree plantations
Opportunities
(4) New source of energy available in
rural areas particularly suitable for
heating individual olive mills and
private households
(5) Rural development program –
support for buying machinery
(machinery for processing)
(3) Development of local market with
wood chips (including chips produced
from prunning’s)
Threats
(5) High number of small olive oil
producers - potential of punning’s is
limited and fragmented
(4) No market for chips from olive
tree punning’s
(2) More stringent legislation about
emissions and ash disposal

220
This project has received funding from the European Union's Horizon 2020 research and innovation program under grant agreement No. 691763
This project has received funding from the European Union's Horizon 2020 research and innovation program under grant agreement No. 691763
Swot analysis for [Vineyard prunings] in [Slovenia]
Please fill at least 3 elements in each category and evaluate the importance of each element from 1 to
5 being 5 the maximum.
Strengths
(5) Use of residues from vineyards
(4) Low price of row material
(3) New/additional source of income
for wine producers
Weaknesses
(4) Expensive technologies for
collecting of punning’s
(4) Technology for collecting of
punning’s not available in majority
or regions
(2) Problems with processing of
punning’s
(5) possibilities of use of punning’s
are not known well among possible
producers and also users
(4) Alternative use of vineyard
prunning’s – for soil fertiliser in
vineyards
Opportunities
(4) New source of energy available in
rural areas
(5) Rural development program –
support for buying machinery
(machinery for processing)
(2) Large potential in use of punning’s
in local areas
Threats
(5) High number of small wine
producers - potential of punning’s is
limited and fragmented
(2) No quality standards for
vineyards punning’s
(4) No market for pellets from
vineyard punning’s

221
This project has received funding from the European Union's Horizon 2020 research and innovation program under grant agreement No. 691763
This project has received funding from the European Union's Horizon 2020 research and innovation program under grant agreement No. 691763
Spain’s SWOT analysis

222
This project has received funding from the European Union's Horizon 2020 research and innovation program under grant agreement No. 691763
This project has received funding from the European Union's Horizon 2020 research and innovation program under grant agreement No. 691763
Swot analysis for [Olive Stones] in [Spain]
Please fill at least 3 elements in each category and evaluate the importance of each element from 1 to
5 being 5 the maximum.
Strengths
Good quality, similar to wood pellets
(5)
Lower price than wood pellets (5)
Good availability in Spain (3)
Low GHG as is a “by-product” (3)
Easy adaptation of devices designed
for pellets (4)
Weaknesses
Variations in the availability annually
because of the characteristics of the
olive tree and weather conditions (3)
Bad reputation due to bad quality
olive stones sold by some companies
(5)
Unawareness to consumers (4)
Opportunities
Big percentage of the production
used as industrial biofuel that could
be valorised and give it more added
value (4)
Renewable targets and legislation
promoting renewable energies could
benefit biofuels (3)
A big market is there, changing old
fossil fuels boilers / stoves.(4)
Threats
Pellet or other biofuels competition
(4)
Low fossil prices (4)
Consumers changing to other biofuel
/ fuel because of bad experience with
bad quality olive stones (5)

223
This project has received funding from the European Union's Horizon 2020 research and innovation program under grant agreement No. 691763
This project has received funding from the European Union's Horizon 2020 research and innovation program under grant agreement No. 691763
Swot analysis for [Wood Chips] in [Spain]
Please fill at least 3 elements in each category and evaluate the importance of each element from 1 to
5 being 5 the maximum.
Strengths
Good quality (4)
Low price compared with other
biofuels and about all fossil fuels. (5)
Big Availability in Spain (4)
Weaknesses
Expensive logistic (5)
Need for a big storage (4)
Devices more expensive (3)
High moisture content when trees
are collected. Need to dry (3)
Opportunities
Renewable targets and legislation
promoting renewable energies could
benefit biofuels (3)
A big market available for cheap fuels
(4)
Present in rural areas that need to be
developed. (3)
Threats
Fossil fuel low prices (4)
Competition with other low cost
bifouels (3)
Electric generation legislation in
Spain is not promoting new projects.
(4)

224
This project has received funding from the European Union's Horizon 2020 research and innovation program under grant agreement No. 691763
This project has received funding from the European Union's Horizon 2020 research and innovation program under grant agreement No. 691763
Swot analysis for [Nut shells] in [Spain]
Please fill at least 3 elements in each category and evaluate the importance of each element from 1 to
5 being 5 the maximum.
Strengths
Good quality. Pretty similar to wood
pellets (4)
Lower price than wood pellets (4)
Residue of an industrial process. Low
GHG (3)
Weaknesses
Need for more expensive boilers /
adaptations(5)
Very seasonal products. Need for big
storages (4)
Poorer quality if stored outdoors (4)
No such big volumes of production,
mostly of interest for local
consumption (3)
Opportunities
Renewable targets and legislation
promoting renewable energies could
benefit biofuels (3)
A big market available for cheap fuels
(4)
Threats
Fossil fuel low prices (4)
Competition with other bifouels (4)

225
This project has received funding from the European Union's Horizon 2020 research and innovation program under grant agreement No. 691763
This project has received funding from the European Union's Horizon 2020 research and innovation program under grant agreement No. 691763
Swot analysis for [Olive tree prunnnings] in [Spain]
Please fill at least 3 elements in each category and evaluate the importance of each element from 1 to
5 being 5 the maximum.
Strengths
Huge availability in the south of Spain
(mainly Andalusia) (5)
Quality could almost as wood chips if
collected properly (3)
Diversification of incomes for farmers
(4)
Nowadays, elimination of the
prunnings is a expense (4)
Weaknesses
No standardisation of the biofuel (4)
Difficult to collect prunings in a
proper way for not taking sand and
degrading the quality. Need for
specialised machinery (5)
Poorer quality compared to wood
chips about all if it’s not collected
properly (3)
Opportunities
Legislation trend is to forbid the
elimination by fire (5)
Renewable targets and legislation
promoting renewable energies could
benefit biofuels (3)
A big market available for cheap fuels
(4)
Threats
Fossil fuel low prices (4)
Competition with other low cost
bifouels (3)
Electric generation legislation in
Spain is not promoting new projects.
(4)
Competition use of the prunnings
mulching (2)

226
This project has received funding from the European Union's Horizon 2020 research and innovation program under grant agreement No. 691763
This project has received funding from the European Union's Horizon 2020 research and innovation program under grant agreement No. 691763
Swot analysis for [Vineyards prunnings] in [Spain]
Please fill at least 3 elements in each category and evaluate the importance of each element from 1 to
5 being 5 the maximum.
Strengths
Huge availability of the prunnings (4)
Better quality than other biomasses
like olive cake (4)
Nowadays, elimination of the
prunnings is a expense (5)
Weaknesses
No standardisation of the biofuel (4)
Expensive logistic (4)
Difficult to collect prunings in a
proper way for not taking sand and
degrading the quality. Need for
specialised machinery (5)
Poorer quality compared to wood
chips about all if it’s not collected
properly (3)
Opportunities
Legislation trend is to forbid the
elimination by fire (5)
Renewable targets and legislation
promoting renewable energies could
benefit biofuels (3)
A big market available for cheap fuels
(4)
Threats
Fossil fuel low prices (4)
Competition with other low cost
bifouels (3)
Electric generation legislation in
Spain is not promoting new projects.
(4)
Competition use of the prunnings
mulching (2)

227
This project has received funding from the European Union's Horizon 2020 research and innovation program under grant agreement No. 691763
This project has received funding from the European Union's Horizon 2020 research and innovation program under grant agreement No. 691763
Turkey’s SWOT analysis

228
This project has received funding from the European Union's Horizon 2020 research and innovation program under grant agreement No. 691763
This project has received funding from the European Union's Horizon 2020 research and innovation program under grant agreement No. 691763
Swot analysis for [Olive Stones] in [Turkey]
Please fill at least 3 elements in each category and evaluate the importance of each element from 1 to
5 being 5 the maximum.
Strengths
Clean fuel (cleaner than olive husk)
Automatic / autonomous operation
High calorific value
Weaknesses
Difficulty in separating olive stone
Only produced from sliced and
pickling olive industry
Opportunities
Decrease environmental
pollution by olive waste
Increase of the price of fossil
fuels
Threats
Expensive (115 £ / ton)
Lack of government support
Lack of connection in the biomass
sector

229
This project has received funding from the European Union's Horizon 2020 research and innovation program under grant agreement No. 691763
This project has received funding from the European Union's Horizon 2020 research and innovation program under grant agreement No. 691763
Swot analysis for [Wood chips] in [Turkey]
Please fill at least 3 elements in each category and evaluate the importance of each element from 1 to
5 being 5 the maximum.
Strengths
Cheaper than pellets
Useful also for larger Systems (micro
and district heating systems)
Supply chain management is
stronger than the other biomass
types
More efficient use of the regional
biomass resources
Weaknesses
Lack of manufacturers of biomass
systems in the region- most systems
imported from
Expensive production technology
Large storage area need
Lower energy content per volume
than pellets
EU standards are applied, the
standards should be adopted to
Turkey
No subsidies for modern boilers
Opportunities
Large potential in use of wood
chips in public buildings
Huge amount of biomass
potential
Threats
Confusion of authority (The
classification and disposal process
not carried out by municipalities)
The foreign approval companies are
so expensive and having difficulty in
the language
Unclear security of local fuel supply
e.g. logs

230
This project has received funding from the European Union's Horizon 2020 research and innovation program under grant agreement No. 691763
This project has received funding from the European Union's Horizon 2020 research and innovation program under grant agreement No. 691763
Swot analysis for [Nuts] in [Turkey]
Please fill at least 3 elements in each category and evaluate the importance of each element from 1 to
5 being 5 the maximum.
Strengths
Clean fuel
Automatic / autonomous operation
High calorific value
Weaknesses
Humidity is main problem
Easily decomposed
Opportunities
Decrease environmental
pollution by olive waste
Can be used with coal
Threats
Lack of government support
Bakeries use in BlackSea region

231
This project has received funding from the European Union's Horizon 2020 research and innovation program under grant agreement No. 691763
This project has received funding from the European Union's Horizon 2020 research and innovation program under grant agreement No. 691763
Swot analysis for [Olive prunnings] in [Turkey]
Please fill at least 3 elements in each category and evaluate the importance of each element from 1 to
5 being 5 the maximum.
Strengths
Clean fuel
Automatic / autonomous operation
High calorific value
Weaknesses
Humidity is main problem
Easily decomposed
Ash contents may create problems
Opportunities
Large potential in many regions
Can be used with coal
Easily marketable
Threats
Lack of government support
Lack of commercial
attractiveness
No subsidies for modern boilers

232
This project has received funding from the European Union's Horizon 2020 research and innovation program under grant agreement No. 691763
This project has received funding from the European Union's Horizon 2020 research and innovation program under grant agreement No. 691763
Swot analysis for [Vineyard prunnings] in [Turkey]
Please fill at least 3 elements in each category and evaluate the importance of each element from 1 to
5 being 5 the maximum.
Strengths
Useful also for larger Systems (micro
and district heating systems)
Easily accessible in Eagan and
Marmara region
More efficient use of the regional
biomass resources
Easily marketable
Weaknesses
Lower energy content per volume
than pellets
Easily decomposed
EU standards are applied, the
standards should be adopted to
Turkey
No subsidies for modern boilers
Lack of commercial attractiveness
Opportunities
Large potential in Eagean and
Marmara region
Population increase resulted in
energy demand increase
Can be used with coal
Threats
Confusion of authority (The
classification and disposal process
not carried out by municipalities)
Rapid decomposition from source of
biomass

233
This project has received funding from the European Union's Horizon 2020 research and innovation program under grant agreement No. 691763
This project has received funding from the European Union's Horizon 2020 research and innovation program under grant agreement No. 691763
Report of the final user survey
for Croatia

234
This project has received funding from the European Union's Horizon 2020 research and innovation program under grant agreement No. 691763
This project has received funding from the European Union's Horizon 2020 research and innovation program under grant agreement No. 691763
RESULTS DESCRIPTION FOR CROATIA
Please make a small graphic for the following informations an put some lines of interpretation:
NUMBER OF RESPONDENTS
122 is the number of people that took part in the final user survey.
RESPONDENTS GENDER (%)
Out of 122 total respondents, 63 were male and 59 were female, making 52% and 48% respectively.
RESPONDENTS AGE (%)
Out of 122 people that took the survey, 59 respondents were between the ages of 18 and 30, followed by 44
being between 31 and 45 and 17 between 46 and 65 years of age. Only 2 respondents were older than 65. This
ratio yielded 48%, 36%, 14% and 2% for the age groups from the youngest to oldest.
0,52
0,48
Gender %
Male Female
48,36
36,07
13,93
1,64
Age %
18-30 31-45 46-65 >65

235
This project has received funding from the European Union's Horizon 2020 research and innovation program under grant agreement No. 691763
This project has received funding from the European Union's Horizon 2020 research and innovation program under grant agreement No. 691763
% OF RESPONDENTS WHO KNOW ABOUT BIOMASS
89% of respondents were familiar with biomass which corresponds to 108 positive answers out of 122. Only 11%
or 14 respondents admitted they were not familiar with biomass.
% OF RESPONDENTS WHO USE BIOMASS FOR HEATING IN THEIR RESIDENCE
Out of 108 respondents which were familiar with biomass, only 35 of them use biomass for heating, which
corresponds to 32%. This accounts for only 29% of total survey respondents.
% OF RESPONDENTS willing to change to a biomass system
88,52
11,48
BIOMASS %
YES NO
32
68
BIOMASS USE %
YES NO

236
This project has received funding from the European Union's Horizon 2020 research and innovation program under grant agreement No. 691763
This project has received funding from the European Union's Horizon 2020 research and innovation program under grant agreement No. 691763
43 or 58.9% of 73 people that said they are not using biomass for heating declared they would be interested in
installing a biomass system in the future.
o MAIN REASON FOR YES
Respondents interested in installing a biomass system pointed out that high costs and spatial or building
restrictions were the main reasons why they have not done so already.
o MAIN REASONS FOR NO
Most of the people that would not install a biomass system explained their main motivation for this decision are
spatial or building restrictions, closely followed by a need for investment.
KIND OF PROPERTY OF BIOMASS USERS
o TYPE OF BUILDING
34 out of 35 total users of biomass systems declared they are using the system in their family house, while only
one person noted they are using the system in an apartment building.
o TYPE OF OWNERS
30 out of 35 biomass system users said they are the owners of the building in question, while the rest are
subtenants.
o SURFACE TO HEAT
58,9
41,1
INTERESTED IN INSTALLING BIOMASS HEATING %
YES NO

237
This project has received funding from the European Union's Horizon 2020 research and innovation program under grant agreement No. 691763
This project has received funding from the European Union's Horizon 2020 research and innovation program under grant agreement No. 691763
Most of the respondents (80%) stated the heated area is between 50 and 150 m2. Half of this percentage is in the
50 – 100 m2
range, while the other half is in the 101 – 150 m2 range. 17% is heating areas greater than 150 m
2,
while only 3% heated areas in the range from 21 to 50 m2. No respondents stated an area of 20 m
2 or less.
o TYPE OF HEATING SYSTEM
Stove was the most used type of a heating system, while it has to be noted some users chose multiple options,
indicating there is more than one type of system being used for heating purposes. In the category “Other”, solar
collectors and rocket stove heaters were mentioned as heating system options in use.
o AVERAGE PRICE BY DEVICE
0
3
40
40
17
AREA %
<20 m2 21-49 m2 50-100 m2 101-150m2 >151 m2
20
9
5
0
4
TYPE
Stove Boiler Fireplace Open-fireplace Other

238
This project has received funding from the European Union's Horizon 2020 research and innovation program under grant agreement No. 691763
This project has received funding from the European Union's Horizon 2020 research and innovation program under grant agreement No. 691763
o % DEVICE POWER BY CATEGORY AND DEVICE
o % TYPE AND QUANTITY OF BIOFUEL
2075
1433,5 2125
0
1875
AVERAGE PRICE €
Stove Boiler Fireplace Open-fireplace Other
0,020,040,060,080,0
100,0
POWER(STOVE)
POWER(BOILER)
POWER(FIREPLACE)
POWER(OTHER)
>50 kW 4,8 9,1 0 0
31-50 kW 14,3 27,3 33,3 0
13-30 kW 42,9 63,6 33,3 25
1-12 kW 38,1 0,0 33,3 75
POWER
1-12 kW 13-30 kW 31-50 kW >50 kW

239
This project has received funding from the European Union's Horizon 2020 research and innovation program under grant agreement No. 691763
This project has received funding from the European Union's Horizon 2020 research and innovation program under grant agreement No. 691763
Only three types of fuels were used, with over three quarters of respondents using firewood. “Other” was mainly
regarding the agricultural residues (mostly corn) and saw dust from local sawmills.
What is your feeling as consumer using biomass?
o AVERAGE OF GRADE OF GENERAL SATISFACTION
4.43 out of 5 was the average grade of satisfaction using biomass among 35 users in Croatia.
o AVERAGE OF GRADE OF SATISFACTION WITH YOUR INSTALLATION (EFFICIENCY,EMISSIONS, FREQUENCY OF CLEANING,
ETC)
4.03 out of 5 is the average grade of satisfaction with the installation.
o AVERAGE GRADE OF SATISFACTION WITH THE BIOMASS (QUALITY, PRICE, …)
3.97 out of 5 is the average satisfaction with the biomass among respondents.
75,7
16,2
8,1
TYPE %
FIREWOOD OTHER WOOD PELLETS
10,8
13,5
16,2
24,3
21,6
8,1 5,4
0
QUANTITY %
0-500 kg 500-1000 kg 1000-2000 kg 2000-5000 kg
5000-10000 kg 10000-25000 kg 25000-50000 kg >50000 kg

240
This project has received funding from the European Union's Horizon 2020 research and innovation program under grant agreement No. 691763
This project has received funding from the European Union's Horizon 2020 research and innovation program under grant agreement No. 691763
o AVERAGE OF GRADE OF SATISFACTION WITH THE DISTRIBUTION NETWORK
3.77 out of 5 was the result of overall satisfaction with the distribution network.
Your considerations when you are buying biomass .
o AVERAGE PRICE
4.06 out of 5.
o AVERAGE QUALITY
4.46 out of 5.
o AVERAGE CERTIFICATION
2.17 out of 5.
o AVERAGE LOCAL PRODUCT
4.03 out of 5.
o AVERAGE DELIVERY SERVICES
4.19 out of 5.
Do you know what a certified biofuel is? %
51, 43% of respondents know what is a certified biofuel, 48,57% don’t know what is the certified biofuel.
51,43 48,57
DO YOU KNOW WHAT A CERTIFIED BIOFUEL IS? %
YES NO

241
This project has received funding from the European Union's Horizon 2020 research and innovation program under grant agreement No. 691763
This project has received funding from the European Union's Horizon 2020 research and innovation program under grant agreement No. 691763
Once you understand what is a certified fuel, would you change your answer about your considerations when
you are buying biomass? %
64,71% of respondents would not change their answer about their considerations when they are buying biomass.
Considerations when you are buying biomass Now you know what implies a certified biofuel .
o AVERAGE PRICE
3.63 out of 5.
o AVERAGE QUALITY
4.13 out of 5.
o AVERAGE CERTIFICATION
3.43 out of 5.
o AVERAGE LOCAL PRODUCT
4.29 out of 5.
o AVERAGE DELIVERY SERVICES
4.57 out of 5.
35,29
64,71
WOULD YOU CHANGE YOUR ANSWER? %
YES NO

242
This project has received funding from the European Union's Horizon 2020 research and innovation program under grant agreement No. 691763
This project has received funding from the European Union's Horizon 2020 research and innovation program under grant agreement No. 691763
MAIN CONCLUSIONS FROM THE SURVEY IN CROATIA
Based on data collected form the survey in Croatia, we can conclude that there is a high
interest for using biomass, but mainly high costs and spatial/building restrictions are making it difficult
for people to realize their project ideas.
Overall, around one third of respondents are already using biomass systems and they have
reported reasonably high levels of satisfaction with their current installation and its use. This can be
seen from the average overall satisfaction grade of 4.43 out of 5.00, which users have reported.
Given that more than three quarters of biomass users seem to be using standard firewood, the
price of the biofuel and its local availability seem to be the primary drivers for consumer’s choices.
At first, the biomass system users rated the importance of biomass certification with an
average of mere 2.17 out of 5.00, which is a very low result. An increase to 3.43 after getting to know
more details about certification is very encouraging for the future of biomass market in Croatia, as it
indicates people would be willing to use a higher quality certified products if given a proper chance to
learn about their benefits.
However, it has to be noted that based on the small sample size and taking into account that
most of the respondents have a similar profile, general experiences and preferences regarding
biomass use in Croatia might differ significantly.

243
This project has received funding from the European Union's Horizon 2020 research and innovation program under grant agreement No. 691763
This project has received funding from the European Union's Horizon 2020 research and innovation program under grant agreement No. 691763
Report of the final user survey for Greece

244
This project has received funding from the European Union's Horizon 2020 research and innovation program under grant agreement No. 691763
This project has received funding from the European Union's Horizon 2020 research and innovation program under grant agreement No. 691763
RESULTS DESCRIPTION FOR GREECE
NUMBER OF RESPONDENTS
The final user survey was answered by 73 respondents.
RESPONDENTS GENDER (%)
43 of the respondents identified as “male”, 29 as female and 1 identified as “other / no reply”. The
corresponding percentages are 58.9%, 39.7% and 1.4%.
RESPONDENTS AGE (%)
14 respondents were between the ages of 18 and 30, 47 being between 31 and 45 and 12 between 46 and 65
years of age. None of the respondents were older than 65. The corresponding percentages were 19.2%, 64.4%,
16.4% and 0%.
% OF RESPONDENTS WHO KNOW ABOUT BIOMASS
84.9% of the respondents expressed familiarity with biomass (62 positive answers out of 73). The remaining
15.1% responded that they did not know what biomass is.
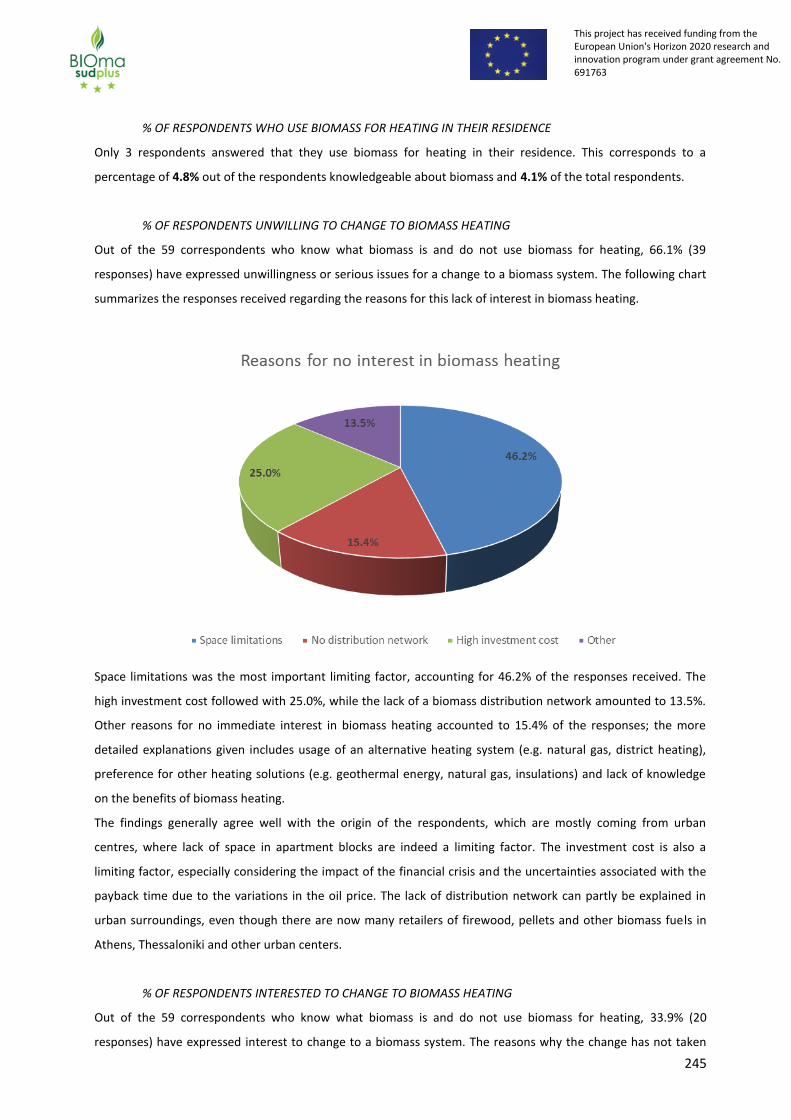
245
This project has received funding from the European Union's Horizon 2020 research and innovation program under grant agreement No. 691763
This project has received funding from the European Union's Horizon 2020 research and innovation program under grant agreement No. 691763
% OF RESPONDENTS WHO USE BIOMASS FOR HEATING IN THEIR RESIDENCE
Only 3 respondents answered that they use biomass for heating in their residence. This corresponds to a
percentage of 4.8% out of the respondents knowledgeable about biomass and 4.1% of the total respondents.
% OF RESPONDENTS UNWILLING TO CHANGE TO BIOMASS HEATING
Out of the 59 correspondents who know what biomass is and do not use biomass for heating, 66.1% (39
responses) have expressed unwillingness or serious issues for a change to a biomass system. The following chart
summarizes the responses received regarding the reasons for this lack of interest in biomass heating.
Space limitations was the most important limiting factor, accounting for 46.2% of the responses received. The
high investment cost followed with 25.0%, while the lack of a biomass distribution network amounted to 13.5%.
Other reasons for no immediate interest in biomass heating accounted to 15.4% of the responses; the more
detailed explanations given includes usage of an alternative heating system (e.g. natural gas, district heating),
preference for other heating solutions (e.g. geothermal energy, natural gas, insulations) and lack of knowledge
on the benefits of biomass heating.
The findings generally agree well with the origin of the respondents, which are mostly coming from urban
centres, where lack of space in apartment blocks are indeed a limiting factor. The investment cost is also a
limiting factor, especially considering the impact of the financial crisis and the uncertainties associated with the
payback time due to the variations in the oil price. The lack of distribution network can partly be explained in
urban surroundings, even though there are now many retailers of firewood, pellets and other biomass fuels in
Athens, Thessaloniki and other urban centers.
% OF RESPONDENTS INTERESTED TO CHANGE TO BIOMASS HEATING
Out of the 59 correspondents who know what biomass is and do not use biomass for heating, 33.9% (20
responses) have expressed interest to change to a biomass system. The reasons why the change has not taken

246
This project has received funding from the European Union's Horizon 2020 research and innovation program under grant agreement No. 691763
This project has received funding from the European Union's Horizon 2020 research and innovation program under grant agreement No. 691763
place yet were asked and the following chart summarizes the responses received.
Space limitations and lack of a distribution network in the area each amounted to 26.9% of responses received.
Lack of funds for the heating system change (or purchase of a new system) corresponded to 15.4% of the
questions. Finally, 30.8% of the responses related to other reasons; the most important of these seems to be the
lack of more precise information about costs and installation requirements. The requirement for a joint decision
of co-owners of an apartment block was also given, while a few respondents claimed that they would make the
transition as soon as possible.
The responses received indicate that even among the people interested in switching to biomass heating, there is
still uncertainties regarding the actual costs and installation requirements which would have to be overcome by
more extensive awareness raising and dissemination campaigns. Space limitations are again prevalent; it is an
obstacle that cannot be overcome as easily.
KIND OF PROPERTY OF BIOMASS USERS
As mentioned, only 3 respondents use biomass. The following table summarizes their responses:
Res. #1 Res. #2 Res. #3
Type of residence Apartment Apartment Detached house
Type of ownership Rented Rented Owner
Heated surface 101 – 150 m2 50 – 100 m2 50 – 100 m2
Type of heating system Stove Fireplace Boiler
Average price N/A N/A 2,000 €
Installed capacity 1 – 12 kW N/A N/A
Type and quantity of
biofuel used
Wood pellets, 1,000 –
2,000 kg
Firewood, 0 –
500 kg
Wood chips, 1,000 –
2,000 kg

247
This project has received funding from the European Union's Horizon 2020 research and innovation program under grant agreement No. 691763
This project has received funding from the European Union's Horizon 2020 research and innovation program under grant agreement No. 691763
SATISFACTION WITH BIOMASS INSTALLATION
The following table summarizes the responses of the users of biomass regarding satisfaction.
Satisfaction #1 #2 #3
General satisfaction 5 4 4
Satisfaction with installation (efficiency, emissions, etc.) 5 3 3
Satisfaction with biomass (quality, price) 5 4 4
Satisfaction with distribution network 5 4 4
CONSIDERATIONS DURING PURCHASE OF BIOMASS
The following table summarizes the responses of the users of biomass regarding satisfaction.
Res. #1 Res. #2 Res. #3
Knowledge of certification Yes No Yes No
Price 4 4 4 4
Quality 4 5 5 4
Certification 5 N/A 4 2
Local product 5 1 2 2
Delivery services 3 4 4 3
KNOWLEDGE AND IMPACT OF CERTIFICATION
Respondent #1 replied positively regarding knowledge of certification and had already awarded the highest
grade (5) in its considerations when purchasing biomass.
Respondent #2 replied negatively regarding knowledge of certification; after an explanation was offered, it
awarded a high priority (4) in certification; the other considerations where not affected other than a slight
increase regarding the purchase of local products.
Respondent #3 was not informed about biomass certification; after an explanation was offered, it did not
consider the option to re-evaluate its main considerations when purchasing biomass after being information
about certification.
MAIN CONCLUSIONS FROM THE SURVEY IN GREECE
The survey in Greece drew a limited number of responses and it is difficult to draw very general conclusions.
However, the following points can be made, considering also our expert opinion about the state of the biomass
sector in Greece:

248
This project has received funding from the European Union's Horizon 2020 research and innovation program under grant agreement No. 691763
This project has received funding from the European Union's Horizon 2020 research and innovation program under grant agreement No. 691763
It seems that the majority of Greeks claim knowledge of biomass; this can be expected considering the fact that –
after the financial crisis and increased taxation on heating oil – biomass has received wide publicity as a low-cost
heating solution.
Only 4.1% of the respondents of the survey claimed to use biomass. The figure is much lower than the reported
share of biomass in the thermal energy used by households in Greece. This may have to do with the origin of the
respondents, which seem to come mostly from the large urban areas of Athens and Thessaloniki. Biomass usage
is more widespread in smaller cities, closer to agricultural areas, and rural areas in general.
Space limitations appear to be the main reason for the limited adoption of biomass heating, especially in urban
environments. Indeed, apartment blocks were not designed with biomass heating in mind, lack the storage space
required for the fuel and, in cases of multiple ownerships, the decision process for a fuel switch is more
complicated. Unfortunately, this limiting factor is not easy to overcome.
Lack of awareness of different aspects related to biomass heating are another limiting factor. Potential end-users
might be unaware of distribution networks in the area (even though it is now easy to get biomass fuels in most
places of mainland Greece) or unsure of installation requirements, total costs, etc. This can be solved by
comprehensive awareness raising / dissemination campaigns.
Finally, regarding fuel certification and the benefits thereof, it is not possible to draw any concrete conclusions.
The general impression given by the survey is that there is still need to improve the awareness of the customers
in this issue, especially considering that other, more visible aspects, such as distribution networks, are still not
well known.

249
This project has received funding from the European Union's Horizon 2020 research and innovation program under grant agreement No. 691763
This project has received funding from the European Union's Horizon 2020 research and innovation program under grant agreement No. 691763
Report of the final user survey for Italy

250
This project has received funding from the European Union's Horizon 2020 research and innovation program under grant agreement No. 691763
This project has received funding from the European Union's Horizon 2020 research and innovation program under grant agreement No. 691763
RESULTS DESCRIPTION FOR ITALY
Gathering information about end user habits and use of biomass in the residential sector has not been easy since
there are not segmentation researches of end users. Probably, further studies should be carried on by covering
longer periods of time.
But this pilot study shows some useful information to address the Biomasudplus project and potential future
studies.
The questionnaire was mainly spread through AIEL’s FB page and contact persons. In about 20 days we reached
72 valuable responses. The following figures are useful to profile the respondents of the questionnaire.
Figure 1: Age of respondents
The large majority of them are men (80%) and aged between 31 to
45 years. Communication’s channels may have influenced the mean
age of respondents.
Figure 2: Biomass consumers and potential users
Almost all responders knew about biomass (95%) and about 60% of
them are residential biomass users.
About 2/3 of respondents that are aware about biomass but still
not using it, declared to be inclined to change to a biomass system.
The main reason for not having done it yet is a lack of space in their
house (55%). The other reasons are related to budget problems or
limited time to dedicate to this choice.
The main reason for not changing to biomass is related to the house characteristics: limited space (65% of non-
users), living in an apartment building or not being the owner. The second reason is the high investment cost of
biomass devices (10%).
Only to respondents report difficult to find suppliers in the nearby of their house. The most satisfying statistics is
that only one person refuses to use biomass because considering it pollutant.
The following graphs characterize the type of buildings and devices owned by the
interviewed biomass users.

251
This project has received funding from the European Union's Horizon 2020 research and innovation program under grant agreement No. 691763
This project has received funding from the European Union's Horizon 2020 research and innovation program under grant agreement No. 691763
Figure 3: Type of building Figure 4: Surface to heat
2/3 of the interviewed biomass users live in an
indipendent house. Proportionally, almost 80% result
to be the owner of the house, while the remaining 20%
are lessees.
Since most of the users live in independent houses,
the surface to heat tend to be higher than 100m2
(83%) even if in the 45% of the cases it is lower
than 150m2.
Figure 5: Type of heating system
The investigation says that the most common devices are
stoves and boilers (70%), followed by inserts and fireplaces
(30%). These rates actually look to be not very reliable knowing
that 70% of the Italian market is represented by stoves.
Anyway, an interesting evidence is that 45% of the users have
more than one biomass sysem. The main combinations are
boiler+stove and boiler+insert or fireplace.
The mean price payed for a boiler is €5.000 (min €2.500, max
€6.500).
The mean price payed for a boiler is €2.700 (min €500, max
€6.000).
Answers on stoves look not to be valuable, since the average
price result €2.400 (min €800, max €4.500).
Figure 6: boilers
power ranges
Figure 7: stoves power
ranges
Figure 8: inserts and
fireplaces power
ranges
Figure 9: open
fireplaces power ranges

252
This project has received funding from the European Union's Horizon 2020 research and innovation program under grant agreement No. 691763
This project has received funding from the European Union's Horizon 2020 research and innovation program under grant agreement No. 691763
Besides heating systems, the survey aims to gather more information on biofuels consume’s habits.
Figure 10: biofuels types
The results confirm that the most common biofuels in
Italy are wood pellet and wood logs. Nevertheless,
national statistics are more in favour of wood logs
rather than wood pellets. Other biofuels are confirmed
to be still a side market. Probably, further
investigations are needed to go deeper in
Mediterranean biofuels use.
Figure 11: quantity of biofuels used
Half of respondents
report to use within 1 to
5 tons of biomass per
year to heat their house.
The other 50% is split
within lower than 1 ton
and 5 to 50 tons per year.
General speaking, the feeling of consumers as users of biomass is good and rated 4,5 over 5. What makes them
satisfied users is mainly quality and what should be improved is price and the suppliers’ network.

253
This project has received funding from the European Union's Horizon 2020 research and innovation program under grant agreement No. 691763
This project has received funding from the European Union's Horizon 2020 research and innovation program under grant agreement No. 691763
Figure 12: grade of satisfaction
To conclude, the attitude of end consumers on quality is confirmed by the last question: “Do you know what a
certified biofuel is?”. 92% answered “yes”. This is probably the most positive result of the research.
MAIN CONCLUSIONS FROM THE SURVEY IN ITALY
The survey got a good picture of end users profiles, the way they use biomass and their grade of satisfaction.
One of the most relevant results - on an association point of view - is that where market is not covered it is
mainly due to the residential building characteristics, not for biomass biofuels or devices related reasons itself.
Even more important is the fact that aversion to biomass (i.e. due to pollution) still looks a marginal problem in
the market.
The investigation gave also useful information about which types of heating appliances are more common in
each kind of house. Detailed information was also gathered to better understand biomass products mix and their
installed power. This is precious information for heating systems manufacturers.
In our case, the investigation among biofuels use was not as successful as the previous part of the survey. This is
due to the market composition, which is strongly in favour on common fuels like pellets and wood logs and,
consequently, would require greater number of responders to detect statistics on Mediterranean biofuels. We
also should say that even ISTAT (National Statistics Institute) was not able to investigate on these fuels due to
inconsistent numbers. Probably, a dedicated research is needed.
In conclusion, what is significant to us is the feedback on customer experience on biofuels use. Results sound
great, and they underline the role of quality and certifications to grant future market share in the heating
market.

254
This project has received funding from the European Union's Horizon 2020 research and innovation program under grant agreement No. 691763
This project has received funding from the European Union's Horizon 2020 research and innovation program under grant agreement No. 691763
Report of the final user survey for Portugal
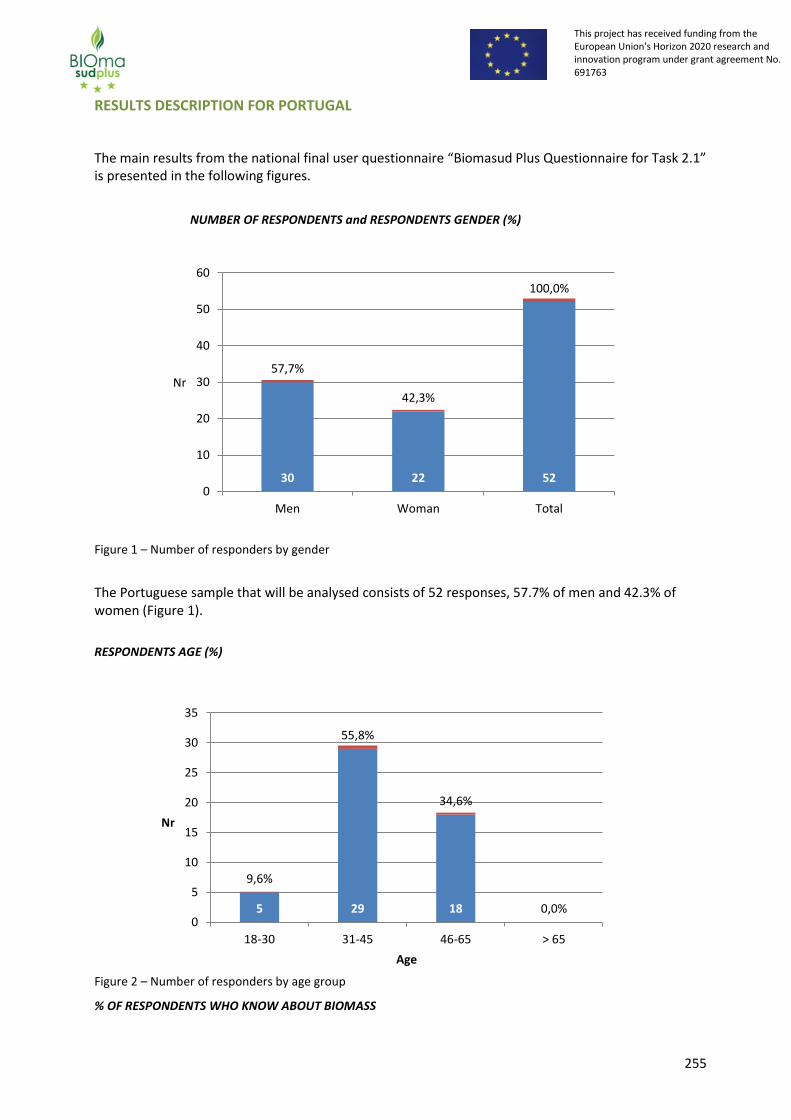
255
This project has received funding from the European Union's Horizon 2020 research and innovation program under grant agreement No. 691763
This project has received funding from the European Union's Horizon 2020 research and innovation program under grant agreement No. 691763
RESULTS DESCRIPTION FOR PORTUGAL
The main results from the national final user questionnaire “Biomasud Plus Questionnaire for Task 2.1” is presented in the following figures.
NUMBER OF RESPONDENTS and RESPONDENTS GENDER (%)
Figure 1 – Number of responders by gender
The Portuguese sample that will be analysed consists of 52 responses, 57.7% of men and 42.3% of women (Figure 1).
RESPONDENTS AGE (%)
Figure 2 – Number of responders by age group
% OF RESPONDENTS WHO KNOW ABOUT BIOMASS
30 22 52
57,7%
42,3%
100,0%
0
10
20
30
40
50
60
Men Woman Total
Nr
5 29 18 0
9,6%
55,8%
34,6%
0,0% 0
5
10
15
20
25
30
35
18-30 31-45 46-65 > 65
Nr
Age

256
This project has received funding from the European Union's Horizon 2020 research and innovation program under grant agreement No. 691763
This project has received funding from the European Union's Horizon 2020 research and innovation program under grant agreement No. 691763
Figure 3 – % of respondents who know about biomass
In the sample of 52 responses, only one respondent does not know about biomass, which corresponds
to 1.9% of the sample (Figure 2).
% OF RESPONDENTS WHO USE BIOMASS FOR HEATING IN THEIR RESIDENCE
Figure 4 – % of respondents who use biomass for heating in their residence
Considering only the 51 interviewed who knows what biomass is, 25 use biomass for heating in their
home, representing 49% of them (Figure 4).
% OF RESPONDENTS WILLING TO CHANGE TO A BIOMASS SYSTEM
26 respondents do not use biomass, but 10 (38% of them), willing to switch to a biomass system. The
1 51 1,9%
98,1%
0
10
20
30
40
50
60
No Yes
Nr
26 25
51,0% 49,0%
0
10
20
30
No Yes
Nr

257
This project has received funding from the European Union's Horizon 2020 research and innovation program under grant agreement No. 691763
This project has received funding from the European Union's Horizon 2020 research and innovation program under grant agreement No. 691763
following figure represents the main reasons why respondents have not yet changed.
Figure 5 – Number of respondents willing to switch to a biomass system and why they have not yet done
The main reasons why the respondents interested to change to biomass systems haven’t done it so far
are the investment needed and constructions limitations (Figure 5).
62% of the respondents don’t use biomass heating systems and don’t want to change. The following
figure represents the distribution of the main reasons why the respondents do not want to change.
Figure 6 –Distribution by reason why the respondents don’t want to change to a biomass heating system
Also here, the main reason for don’t want to change is lack of space, followed by investment needed.
KIND OF PROPERTY OF BIOMASS USERS
The huge majority of the biomass users live in a single family house and own it (Figures 7 and 8).
1 1
4 4
3,8% 3,8%
15,4% 15,4%
0
1
2
3
4
5
6
Next home lack of distributionin your area
Constructionlimitations
Investment needed
Nr
36%
32%
14%
11%
7% Lack of space /Constructionlimitations
Investment needed
Other
lack of distribution in your area
Cost of the biomass

258
This project has received funding from the European Union's Horizon 2020 research and innovation program under grant agreement No. 691763
This project has received funding from the European Union's Horizon 2020 research and innovation program under grant agreement No. 691763
Figure 7 –Type of building
Figure 8 –Type of owners
The interviewees had difficulty answering when we asked what is the surface to heat (Figure 9), and
even more when we asked the price of the device and its power, so we considered that the answers
obtained were not significant for this analyse.
76%
4%
20%
Single family house Semi-detached house Block of flats
8%
72%
20%
Rent Owner Other

259
This project has received funding from the European Union's Horizon 2020 research and innovation program under grant agreement No. 691763
This project has received funding from the European Union's Horizon 2020 research and innovation program under grant agreement No. 691763
Figure 9 –Surface to heat
Figure 10 –Type of heating system
The type of biomass heating system most used is fire place inserted (56%), followed by stove (28%),
open fire place (12%) and boiler (4%) (Figure 10).
8%
4%
12%
8%
8%
60%
< 20 m2 20 - 49 m2 50 - 100 m2
101 - 150 m2 > 151 m2 N.A.
4%
12%
56%
28%
Boiler Open fire place Fire place insert Stove

260
This project has received funding from the European Union's Horizon 2020 research and innovation program under grant agreement No. 691763
This project has received funding from the European Union's Horizon 2020 research and innovation program under grant agreement No. 691763
Figure 11 – % type and quantity of biofuel
The type of biomass used is mostly firewood, followed by wood pellets and wood briquetts. Only in
the class 1000-2000 kg/year pellets appeared as the type of biomass 100% used in this class. (This last
conclusion suggests that the sample is not representative) (Figure 11).
Figure 12 – Consumer feeling when using biomass
Concerning the consumer feeling when using biomass (Figure 12), in general most of them are very
0%
10%
20%
30%
40%
50%
60%
70%
80%
90%
100%
0 - 500 kg 500 - 1.000 kg 1.000 - 2.000 kg 2.000 -5.000 kg 5.000 - 10.000 kg 10.000 - 25.000 kg
Wood briquettes Wood pellets Firewood
0%
20%
40%
60%
80%
100%
General Installation Biomass Distribution
Completely satisfied Very satisfied Moderately satisfied Slightly satisfied Not at all satisfied
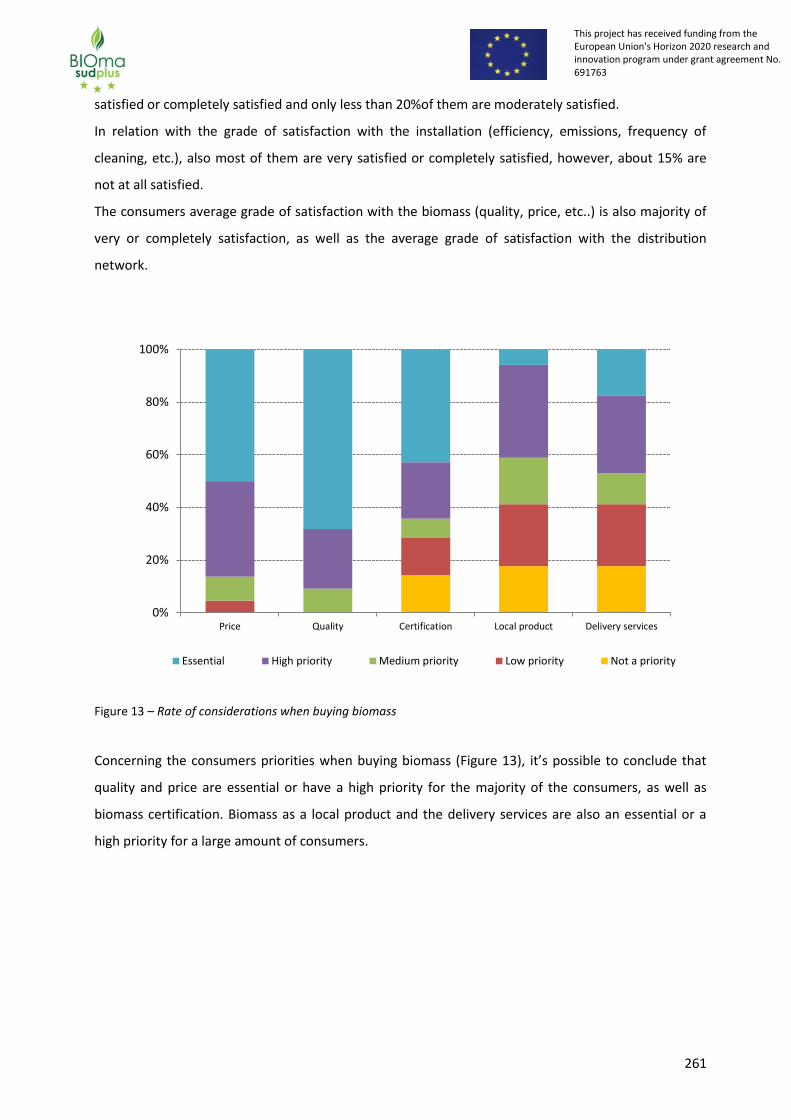
261
This project has received funding from the European Union's Horizon 2020 research and innovation program under grant agreement No. 691763
This project has received funding from the European Union's Horizon 2020 research and innovation program under grant agreement No. 691763
satisfied or completely satisfied and only less than 20%of them are moderately satisfied.
In relation with the grade of satisfaction with the installation (efficiency, emissions, frequency of
cleaning, etc.), also most of them are very satisfied or completely satisfied, however, about 15% are
not at all satisfied.
The consumers average grade of satisfaction with the biomass (quality, price, etc..) is also majority of
very or completely satisfaction, as well as the average grade of satisfaction with the distribution
network.
Figure 13 – Rate of considerations when buying biomass
Concerning the consumers priorities when buying biomass (Figure 13), it’s possible to conclude that
quality and price are essential or have a high priority for the majority of the consumers, as well as
biomass certification. Biomass as a local product and the delivery services are also an essential or a
high priority for a large amount of consumers.
0%
20%
40%
60%
80%
100%
Price Quality Certification Local product Delivery services
Essential High priority Medium priority Low priority Not a priority

262
This project has received funding from the European Union's Horizon 2020 research and innovation program under grant agreement No. 691763
This project has received funding from the European Union's Horizon 2020 research and innovation program under grant agreement No. 691763
Figure 14 – % of biomass users who know what a certified biofuel is
Figure 14 shows that the majority of biomass consumers (72%) know what a certified biofuel is.
The answers obtained when asked if “Once you understand what is a certified fuel, would you change
your answer about your considerations when you are buying biomass?” were only 3 and have no
statistical significance.
MAIN CONCLUSIONS FROM THE SURVEY IN PORTUGAL
First of all, it’s important to underline that this analysis was elaborated from a questionnaire where
only 52 answers were obtained (sample size) and it was verified that the majority of respondents live
in the same region of Portugal, so it is not representative of the whole country.
Nevertheless, the main conclusions obtained from this survey are:
Only 1.9% of respondents do not know about biomass.
49% of who knows what biomass is use biomass for heating in their home.
The main reasons why the respondents interested to change to biomass systems haven’t done it so far
are the investment needed and constructions limitation.
The main reason for don’t want to change is lack of space, followed by investment needed
The huge majority of the biomass users live in a single family house and own it.
The type of biomass heating system most used is fire place inserted (56%), followed by stove (28%),
open fire place (12%) and boiler (4%).
7 18
28,0%
72,0%
0
5
10
15
20
No Yes
Nr

263
This project has received funding from the European Union's Horizon 2020 research and innovation program under grant agreement No. 691763
This project has received funding from the European Union's Horizon 2020 research and innovation program under grant agreement No. 691763
The type of biomass used is mostly firewood, followed by wood pellets and wood briquettes.
In general most of the biomass consumers are very satisfied or completely satisfied and only less than
20% of them are moderately satisfied. In relation with the grade of satisfaction with the installation
(efficiency, emissions, frequency of cleaning, etc.), also most of them are very satisfied or completely
satisfied, however, about 15% are not at all satisfied. The consumers average grade of satisfaction with
the biomass (quality, price, etc..) is also majority of very or completely satisfaction, as well as the
average grade of satisfaction with the distribution network.
Concerning the consumers priorities when buying biomass it’s possible to conclude that quality and
price are essential or have a high priority for the majority of the consumers, as well as biomass
certification. Biomass as a local product and the delivery services are also an essential or a high priority
for a large amount of consumers.
72% of biomass consumers know what a certified biofuel is.

264
This project has received funding from the European Union's Horizon 2020 research and innovation program under grant agreement No. 691763
This project has received funding from the European Union's Horizon 2020 research and innovation program under grant agreement No. 691763
Report of the final user survey for Slovenia

265
This project has received funding from the European Union's Horizon 2020 research and innovation program under grant agreement No. 691763
This project has received funding from the European Union's Horizon 2020 research and innovation program under grant agreement No. 691763
RESULTS DESCRIPTION FOR SLOVENIA
NUMBER OF RESPONDENTS:
The total number of respondents is 138.
RESPONDENTS GENDER (%)
Male: 83 %
Female: 17 %
RESPONDENTS AGE (%)
Age class %
18 – 30 4
31 – 45 28
46 – 65 52
> 65 16
% OF RESPONDENTS WHO KNOW ABOUT BIOMASS
99 % of respondents know what is biomass.
% OF RESPONDENTS WHO USE BIOMASS FOR HEATING IN THEIR RESIDENCE
91 % of respondents use biomass for heating in their residence.

266
This project has received funding from the European Union's Horizon 2020 research and innovation program under grant agreement No. 691763
This project has received funding from the European Union's Horizon 2020 research and innovation program under grant agreement No. 691763
% OF RESPONDENTS willing to change to a biomass system
55 % of those respondents who don`t use biomass for heating their residence, would be willing to
replace the existing heating system with the biomass system.
o MAIN REASON FOR YES
- Lack of space / restrictions for construction
o MAIN REASONS FOR NO
- The investment is needed
- Lack of space / restrictions for construction
KIND OF PROPERTY OF BIOMASS USERS
o TYPE OF BUILDING
%
Single family house 27
Semi-detached house 2
Block of flats 2
Other 5
No answer 64
o TYPE OF OWNERS
%
I am the owner 29
I rent a building/flat 2
Other 2
No answer 67
o SURFACE TO HEAT

267
This project has received funding from the European Union's Horizon 2020 research and innovation program under grant agreement No. 691763
This project has received funding from the European Union's Horizon 2020 research and innovation program under grant agreement No. 691763
m2 %
20 – 49 1
50 – 100 6
101 – 150 14
> 151 15
No answer 64
o TYPE OF HEATING SYSTEM
% (multiple answers are possible)
Boiler for central heating 30
Oven (stove / furnace room) 7
Indoor fireplace 10
Open fireplace 1
Other 2
No answer 63
o AVERAGE PRICE BY DEVICE
€ (VAT is
included)
Comment
Boiler for central
heating
8.500 76 % answers about
price
Oven (stove / furnace
room)
2.600 56 % answers about
price
Indoor fireplace 2.700 69 % answers about
price
Open fireplace 1.000 100 % answers about
price
Other 1.800 50 % answers about
price
o % DEVICE POWER BY CATE¡GORY AND DEVICE
%
1 – 12 kW 13 – 30 kW 31 – 50 kW > 50 kW
Boiler for central heating 55 34 11
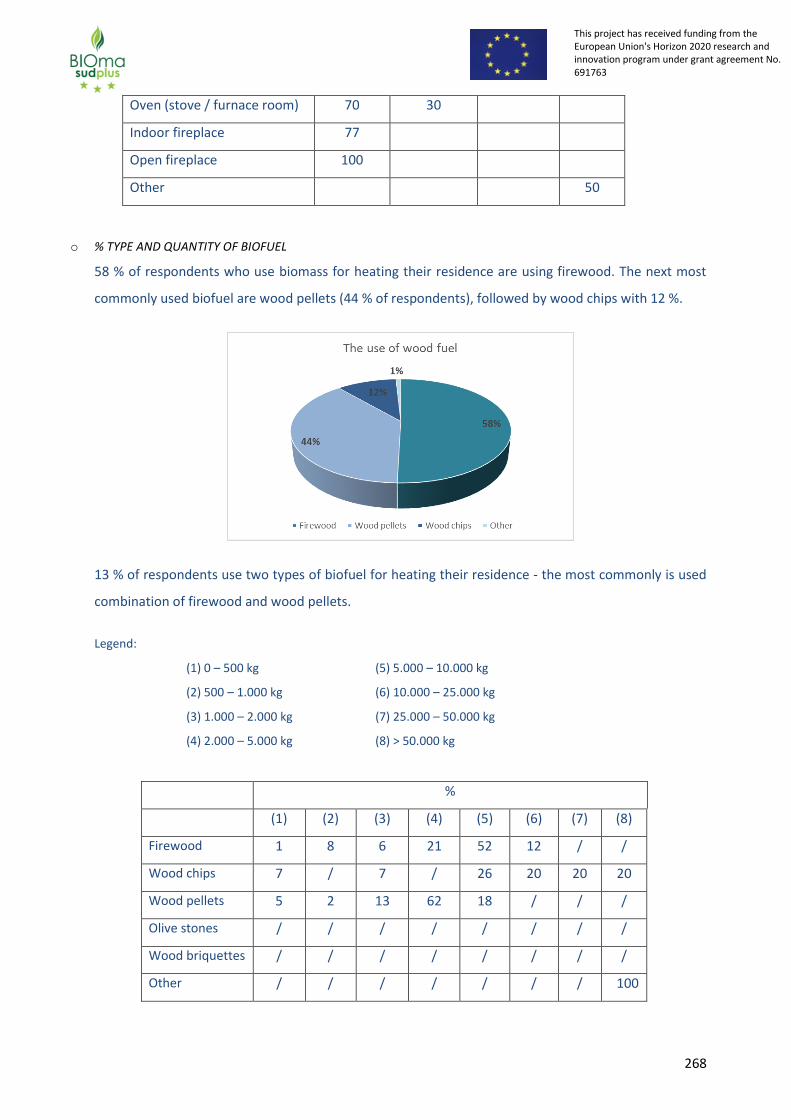
268
This project has received funding from the European Union's Horizon 2020 research and innovation program under grant agreement No. 691763
This project has received funding from the European Union's Horizon 2020 research and innovation program under grant agreement No. 691763
Oven (stove / furnace room) 70 30
Indoor fireplace 77
Open fireplace 100
Other 50
o % TYPE AND QUANTITY OF BIOFUEL
58 % of respondents who use biomass for heating their residence are using firewood. The next most
commonly used biofuel are wood pellets (44 % of respondents), followed by wood chips with 12 %.
13 % of respondents use two types of biofuel for heating their residence - the most commonly is used
combination of firewood and wood pellets.
Legend:
(1) 0 – 500 kg (5) 5.000 – 10.000 kg
(2) 500 – 1.000 kg (6) 10.000 – 25.000 kg
(3) 1.000 – 2.000 kg (7) 25.000 – 50.000 kg
(4) 2.000 – 5.000 kg (8) > 50.000 kg
%
(1) (2) (3) (4) (5) (6) (7) (8)
Firewood 1 8 6 21 52 12 / /
Wood chips 7 / 7 / 26 20 20 20
Wood pellets 5 2 13 62 18 / / /
Olive stones / / / / / / / /
Wood briquettes / / / / / / / /
Other / / / / / / / 100

269
This project has received funding from the European Union's Horizon 2020 research and innovation program under grant agreement No. 691763
This project has received funding from the European Union's Horizon 2020 research and innovation program under grant agreement No. 691763
%
Firewood Wood
chips
Wood
pellets
Olive
stones
Wood
briquettes
Other
0 – 500
kg
20 20 60 / / /
500 –
1000 kg
83 / 17 / / /
1000 –
2000 kg
38 8 54 / / /
2000 –
5000 kg
29 / 71 / / /
5000 –
10.000
kg
73 8 19 / / /
10.000 –
25.000
kg
75 25 / / / /
25.000 –
50.000
kg
/ 100 / / / /
> 50.000
kg
/ 75 / / / 25
What is your feeling as consumer using biomass?
o AVERAGE OF GRADE OF GENERAL SATISFACTION
%
Completely satisfied (5) 52
Partly satisfied (4) 37
Average satisfied (3) 7
Less satisfied (2) 2
Unsatisfied (1) 0
No answer 2
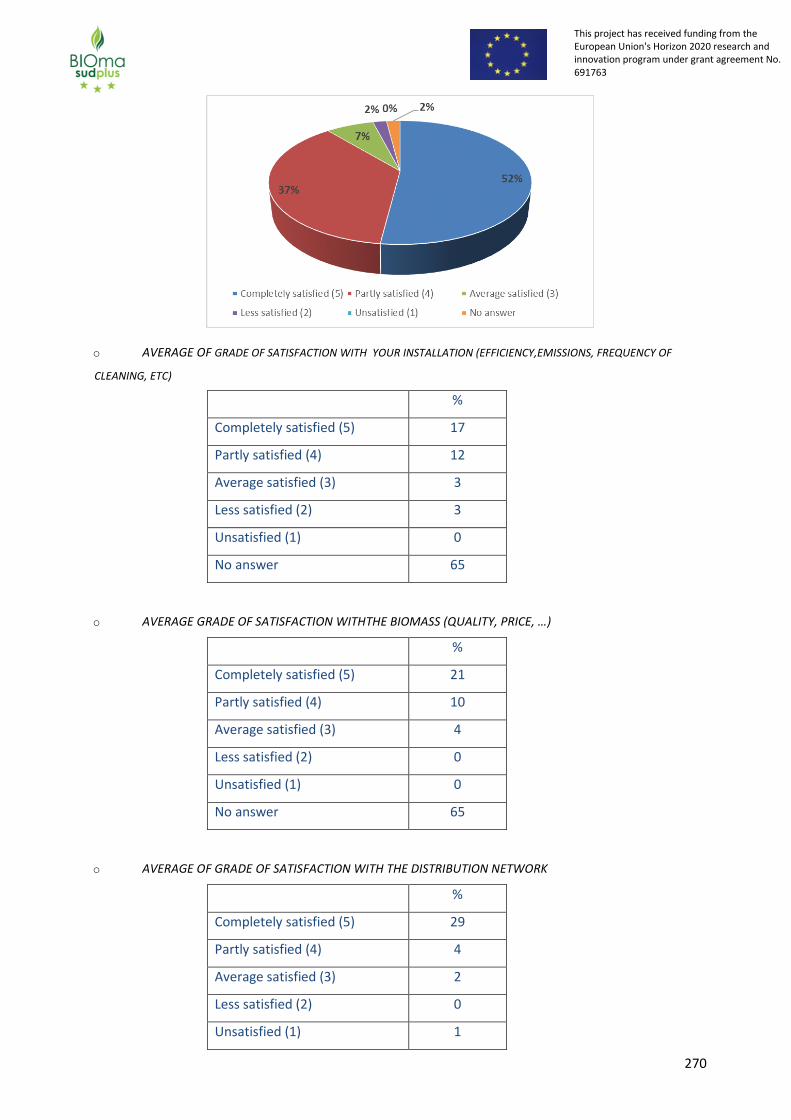
270
This project has received funding from the European Union's Horizon 2020 research and innovation program under grant agreement No. 691763
This project has received funding from the European Union's Horizon 2020 research and innovation program under grant agreement No. 691763
o AVERAGE OF GRADE OF SATISFACTION WITH YOUR INSTALLATION (EFFICIENCY,EMISSIONS, FREQUENCY OF
CLEANING, ETC)
%
Completely satisfied (5) 17
Partly satisfied (4) 12
Average satisfied (3) 3
Less satisfied (2) 3
Unsatisfied (1) 0
No answer 65
o AVERAGE GRADE OF SATISFACTION WITHTHE BIOMASS (QUALITY, PRICE, …)
%
Completely satisfied (5) 21
Partly satisfied (4) 10
Average satisfied (3) 4
Less satisfied (2) 0
Unsatisfied (1) 0
No answer 65
o AVERAGE OF GRADE OF SATISFACTION WITH THE DISTRIBUTION NETWORK
%
Completely satisfied (5) 29
Partly satisfied (4) 4
Average satisfied (3) 2
Less satisfied (2) 0
Unsatisfied (1) 1

271
This project has received funding from the European Union's Horizon 2020 research and innovation program under grant agreement No. 691763
This project has received funding from the European Union's Horizon 2020 research and innovation program under grant agreement No. 691763
No answer 64
Your considerations when you are buying biomass.
o AVERAGE PRICE
%
Most important (5) 35
Quite important (4) 6
Important (3) 10
Irrelevant (2) 1
Completely irrelevant (1) 2
No answer 46
o AVERAGE QUALITY
%
Most important (5) 44
Quite important (4) 14
Important (3) 2
Irrelevant (2) 0
Completely irrelevant (1) 0
No answer 40
o AVERAGE CERTIFICATION
%
Most important (5) 20
Quite important (4) 7
Important (3) 6
Irrelevant (2) 1
Completely irrelevant (1) 10
No answer 56
o AVERAGE LOCAL PRODUCT
%
Most important (5) 22

272
This project has received funding from the European Union's Horizon 2020 research and innovation program under grant agreement No. 691763
This project has received funding from the European Union's Horizon 2020 research and innovation program under grant agreement No. 691763
Quite important (4) 6
Important (3) 6
Irrelevant (2) 1
Completely irrelevant (1) 0
No answer 65
o AVERAGE DELIVERY SERVICES
%
Most important (5) 23
Quite important (4) 13
Important (3) 10
Irrelevant (2) 2
Completely irrelevant (1) 0
No answer 52
Do you know what a certified biofuel is?
%
YES 54
NO 46
Once you understand what is a certified fuel, would you change your answer about your considerations
when you are buying biomass?
%
YES 21

273
This project has received funding from the European Union's Horizon 2020 research and innovation program under grant agreement No. 691763
This project has received funding from the European Union's Horizon 2020 research and innovation program under grant agreement No. 691763
NO 79
Considerations when you are buying biomass Now you know what implies a certified biofuel.
We received very few answers to this question. The only result is that 33 % from those who would
change their answer about their considerations when they are buying biomass, would give 5 points to
certified biofuels instead of quality biofuels.
MAIN CONCLUSIONS FROM THE SURVEY IN SLOVENIA
The total number of respondents is 138, 83 % of which are male and 17 % female. According to the age
structure of the respondents, the age class which prevail is 46 – 65 years (52 %). With 28 % followed by
the age class 31 – 45 years, 16 % of respondents are older than 65 years and the lowest share of
respondents (4 %) is 18 – 30 years old.
99 % of respondents know what biomass is and 91 % of respondents use biomass for heating in their
residence. More than a half of the respondents (55 %) who don`t use biomass for heating their
residence, would be willing to replace the existing heating system with the biomass system.
The following set of questions was intended only for users of wood fuels; to questions like type of
building, type of owners, surface to heat, type of heating system we received less than 40 % of the
answers, and therefore it's difficult to make any conclusions. 30 % of respondents have a heating
system boiler for central heating of which average price is 8.500 € (VAT is included). 55 % of those
respondents who use boiler for central heating, have device power in class 13 – 30 kW, 34 % of
respondents have device power in class 31 – 50 kW and 11 % of respondents have device power more
than 50 kW.
58 % of respondents who use biomass for heating their residence are using firewood. The next most
commonly used biofuel are wood pellets (44 % of respondents), followed by wood chips with 12 %.
One part of the respondents (13 %) use two types of biofuel for heating their residence - the most

274
This project has received funding from the European Union's Horizon 2020 research and innovation program under grant agreement No. 691763
This project has received funding from the European Union's Horizon 2020 research and innovation program under grant agreement No. 691763
commonly is used combination of firewood and wood pellets.
52 % of respondents who use firewood for heating their residence, placed an average annual
consumption of this biofuel to class 5.000 – 10.000 kg. 62 % of respondents who use wood pellets for
heating their residence, placed an average annual consumption of this biofuel to class 2.000 – 5.000
kg. Respondents who use wood chips for heating their residence, placed an average annual
consumption in the higher classes (from 5 (5.000 – 10.000 kg) to 8 (> 50.000 kg)).
To the question: “What is the overall assessment of the satisfaction with heating on wood fuels?”, 52
% of the respondents are completely satisfied, 37 % are partly satisfied, 7 % are on average satisfied, 2
% are less satisfied and 2 % of respondents didn`t answer to the question. To the following questions:
“What is the assessment of the satisfaction with installation?”, “What is the assessment of the
satisfaction with the wood fuels (quality, price)?”, “What is the assessment of the satisfaction with the
distribution network”, we received less than 40 % of the answers, and therefore it's difficult to make
any conclusions.
Furthermore, we asked Slovenian users of wood fuels what are their considerations when they are
buying biomass and we got the following results: the quality of wood fuels and their price are the most
important factors, following by delivery services, local product and last a certified product. Many
respondents didn`t answer to all these questions, the main reason for that is that a large part of users
of firewood make that fuel at home by themselves – and they don`t buy it on the market.
54 % of respondents who are users of wood fuels know what a certified biofuel is. An interesting result
is, that most of those who don`t know what certified biofuel is (79 %), would not change their opinion
about their considerations when they are buying biomass. However, 33 % from those who would
change their answer about their considerations when they are buying biomass, would give 5 points to
certified biofuels instead of quality biofuels.

275
This project has received funding from the European Union's Horizon 2020 research and innovation program under grant agreement No. 691763
This project has received funding from the European Union's Horizon 2020 research and innovation program under grant agreement No. 691763
Report of the final user survey for Spain

276
This project has received funding from the European Union's Horizon 2020 research and innovation program under grant agreement No. 691763
This project has received funding from the European Union's Horizon 2020 research and innovation program under grant agreement No. 691763
RESULTS DESCRIPTION FOR SPAIN
NUMBER OF RESPONDENTS
The Spanish final user survey was answered by 165 respondents.
RESPONDENTS GENDER (%)
93 respondents were identified as Male(56%) and the rest, 72 were Female (44%)
RESPONDENTS AGE (%)
18 of the respondents were between the ages of 18 and 30, 89 being between 31 and 45, 51 between 45 and 65
and only 7 were older than 65. The corresponding percentages were 11%, 54%, 31% and 4%.

277
This project has received funding from the European Union's Horizon 2020 research and innovation program under grant agreement No. 691763
This project has received funding from the European Union's Horizon 2020 research and innovation program under grant agreement No. 691763
% OF RESPONDENTS WHO KNOW ABOUT BIOMASS
89% of the respondents answered that they know what biomass is (147 positives answers out of 165). The
remaining 11% responded negatively.
% OF RESPONDENTS WHO USE BIOMASS FOR HEATING IN THEIR RESIDENCE
A 21% of the respondents answered that they are using already biomass (35 out of 165). 112 respondents out of
165 corresponding to a 68% answered that they aren’t using biomass nowadays. The remaining respondents left
the cell empty (18 which corresponds to 11%).
% OF RESPONDENTS willing to change to a biomass system
From the respondents that know what biomass is and don’t use biomass for heating, 50% were willing to change to a biomass system (65). The same percentage, 50% was unwilling to change to a biomass system for the heating (64).
MAIN REASON FOR YES
Among the reasons given to haven’t shift to biomass yet but they would be interested to change, 17% claim that they will change as soon as possible, 42% was the space limitation, 16% lack of enough budget, 9% No distribution network and 16% other reasons.
It was an important factor for some of the respondents that they were not the owners so they can’t choose.

278
This project has received funding from the European Union's Horizon 2020 research and innovation program under grant agreement No. 691763
This project has received funding from the European Union's Horizon 2020 research and innovation program under grant agreement No. 691763
MAIN REASONS FOR NO
Out of the 64 respondents who know what biomass is and do not use biomass for heating, the main reason for
being unwilling to change to biomass heating was the space limitation or constructive reasons (47%), also quite
notorious was the high inversion cost of the biomass installation (30%). The lack of distribution network seems
not to be a big issue in Spain with a 10%. The remaining percentage was other answers.
KIND OF PROPERTY OF BIOMASS USERS

279
This project has received funding from the European Union's Horizon 2020 research and innovation program under grant agreement No. 691763
This project has received funding from the European Union's Horizon 2020 research and innovation program under grant agreement No. 691763
Of the 35 biomass users that answer the survey, a 69% are living in a detached single family house and 14% in a
semi-detached house. Only a 17% is using biomass in a block of apartments. We must have in mind that in Spain
is not possible to put a fireplace / stove in an apartment except if there is a chimney going to the up roof, it’s not
possible to put a chimney through the façade. The best option for apartments is to put a boiler for the whole
building or a District Heating.
TYPE OF OWNERS
Most of the biomass users who answered the survey (77%) were the owner of the household. This matches to
some answers of non-biomass users that claimed that it was difficult to replace the heating system if they were
renting the house.

280
This project has received funding from the European Union's Horizon 2020 research and innovation program under grant agreement No. 691763
This project has received funding from the European Union's Horizon 2020 research and innovation program under grant agreement No. 691763
SURFACE TO HEAT
From the 35 biomass users who answered the survey a 37% was living in a household between 50-100 m2, 32% in
with a bigger surface than 151 m2, 17% from 101-150 m
2 and 14% from 20 to 49 m
2
TYPE OF HEATING SYSTEM
From the 35 biomass users who filled in the questionnaire we go the following results regarding the type of
installation (some users had several devices)
14%
37%
17%
32%
Surface heated
20 - 49 m2 50 - 100 m2 101 - 150 m2 > 151 m2

281
This project has received funding from the European Union's Horizon 2020 research and innovation program under grant agreement No. 691763
This project has received funding from the European Union's Horizon 2020 research and innovation program under grant agreement No. 691763
Type of heating
system
Number of
installations
Average price Device Power
Boiler 11 4.551 € 25,9 kW
Stove 20 1.734 € 10,3 kW
Insert / fireplace 7 2.333 € 9,75
Some of the respondents had 2 devices installed at home. Stoves are the most used device among the surveyed
TYPE AND QUANTITY OF BIOFUEL
Type of Fuel # users 0
– 500 kg
# users
500 –
1000 kg
# users
1000 –
2000 kg
# users
2000 -
5000 kg
# users
5000 –
10000 kg
# users
10000 –
25000
# users
25000 -
50000
Wood Pellets 5 4 5 3
Firewood 1 1 1 1
Wood
Briquettes
1
Wood chips 1
Olive Stones 1
Walnut
shells
1
Pine nut
shells
1
Other 1 1
Most used fuel were wood biofuels and about all wood pellet.
What is your feeling as consumer using biomass?
AVERAGE OF GRADE OF GENERAL SATISFACTION
From the 35 respondents that used biomass, 89% were completely satisfied or partly satisfied so in general users
had a good perception about using biomass. Average note was 4,35 over 5.
%
Completely satisfied (5) 43
Partly satisfied (4) 46
Average satisfied (3) 9
Less satisfied (2)

282
This project has received funding from the European Union's Horizon 2020 research and innovation program under grant agreement No. 691763
This project has received funding from the European Union's Horizon 2020 research and innovation program under grant agreement No. 691763
Unsatisfied (1)
No answer 3
AVERAGE OF GRADE OF SATISFACTION WITH YOUR INSTALLATION (EFFICIENCY,EMISSIONS, FREQUENCY OF CLEANING, ETC)
Cleaning and emissions the installation could be worst part of biomass from the point of view of the users but as
it can be deduced from the survey most of the users are satisfied with their devices. Average of the note was
3,91
%
Completely satisfied (5) 20
Partly satisfied (4) 49
Average satisfied (3) 23
Less satisfied (2) 3
Unsatisfied (1)
No answer 6
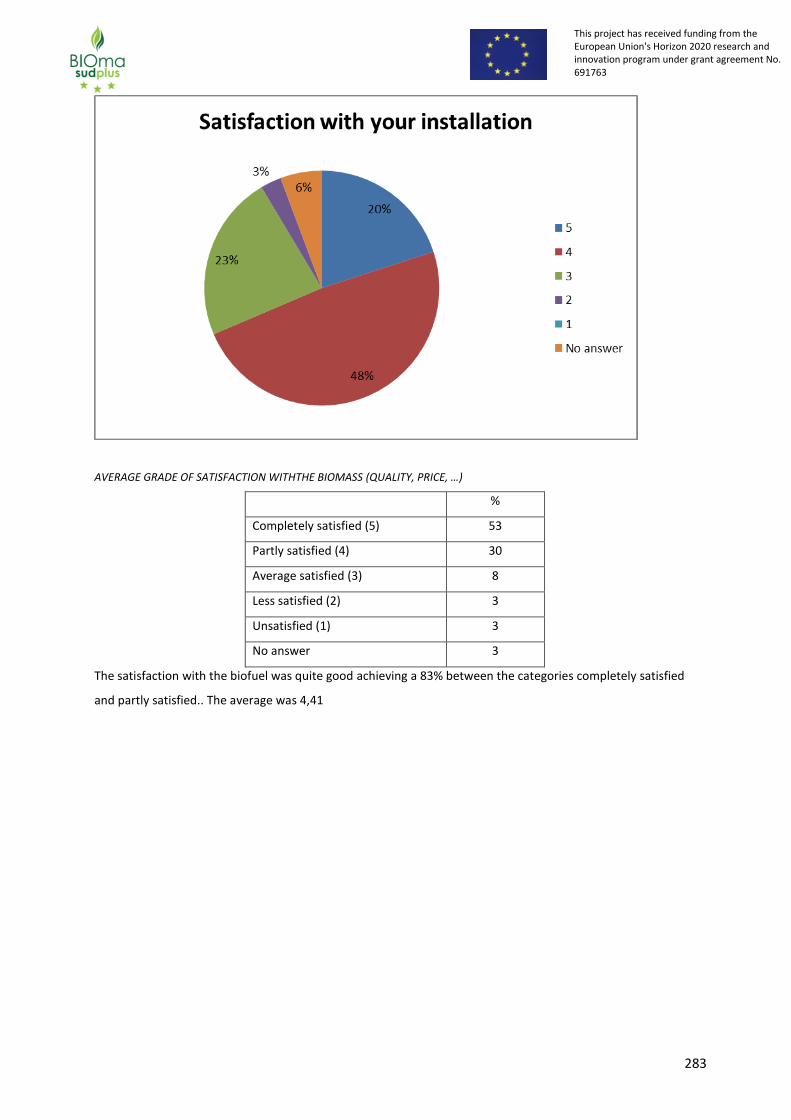
283
This project has received funding from the European Union's Horizon 2020 research and innovation program under grant agreement No. 691763
This project has received funding from the European Union's Horizon 2020 research and innovation program under grant agreement No. 691763
AVERAGE GRADE OF SATISFACTION WITHTHE BIOMASS (QUALITY, PRICE, …)
%
Completely satisfied (5) 53
Partly satisfied (4) 30
Average satisfied (3) 8
Less satisfied (2) 3
Unsatisfied (1) 3
No answer 3
The satisfaction with the biofuel was quite good achieving a 83% between the categories completely satisfied
and partly satisfied.. The average was 4,41

284
This project has received funding from the European Union's Horizon 2020 research and innovation program under grant agreement No. 691763
This project has received funding from the European Union's Horizon 2020 research and innovation program under grant agreement No. 691763
AVERAGE OF GRADE OF SATISFACTION WITH THE DISTRIBUTION NETWORK
%
Completely satisfied (5) 29
Partly satisfied (4) 31
Average satisfied (3) 20
Less satisfied (2) 11
Unsatisfied (1) 6
No answer 3
The worst punctuation of the perception topics for the users was obtained for the distribution network that can
accord with the fact that it’s relatively a new market and still is not 100% developed. The average note was 3,68

285
This project has received funding from the European Union's Horizon 2020 research and innovation program under grant agreement No. 691763
This project has received funding from the European Union's Horizon 2020 research and innovation program under grant agreement No. 691763
Your considerations when you are buying biomass.
Considerations Average
Price 4,03
Quality 4,44
Certification 4,06
Local Product 4,03
Distribution
Services
4,13
When buying biofuels, the most important consideration among the respondents was the quality with the
highest note. After this consideration there were no important differences and the rest of considerations
(Quality, Certification, local product, Distribution services) obtained practically the same note.
PRICE
QUALITY
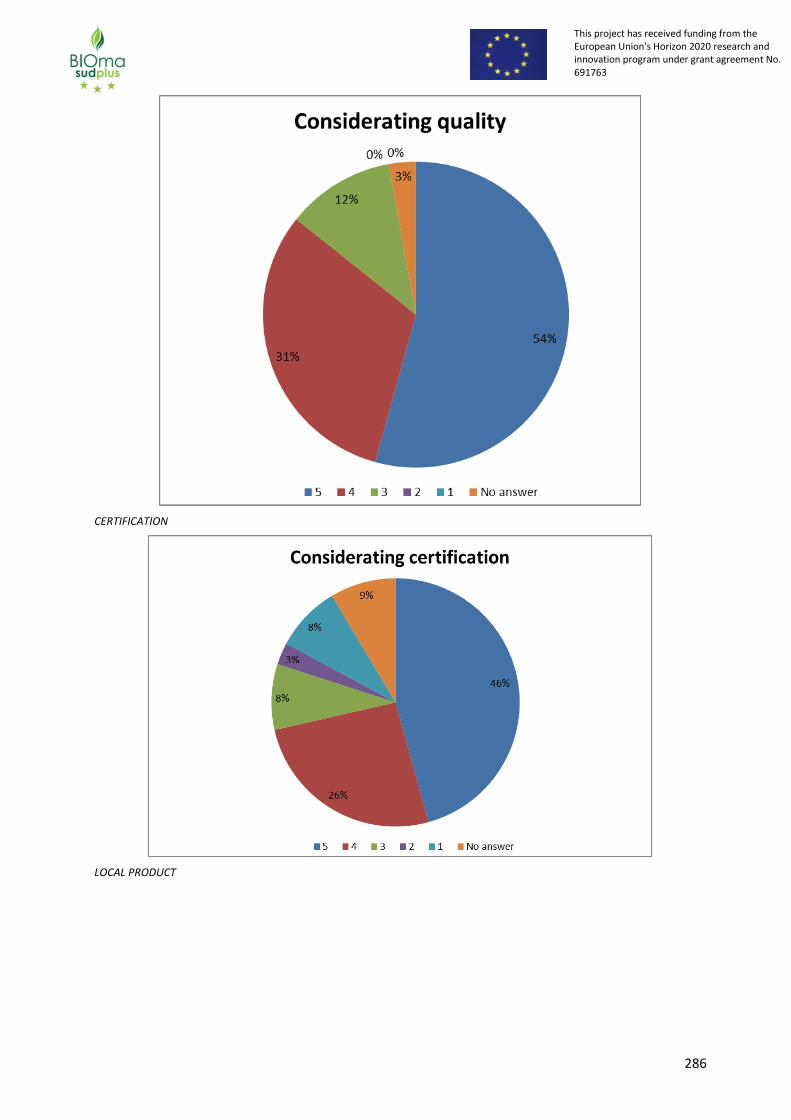
286
This project has received funding from the European Union's Horizon 2020 research and innovation program under grant agreement No. 691763
This project has received funding from the European Union's Horizon 2020 research and innovation program under grant agreement No. 691763
CERTIFICATION
LOCAL PRODUCT

287
This project has received funding from the European Union's Horizon 2020 research and innovation program under grant agreement No. 691763
This project has received funding from the European Union's Horizon 2020 research and innovation program under grant agreement No. 691763
DELIVERY SERVICES
Do you know what a certified biofuel is? %
Most of the respondents knew what a certified biofuel is (94%). Having a so high % about what a certification
implies was totally unexpected

288
This project has received funding from the European Union's Horizon 2020 research and innovation program under grant agreement No. 691763
This project has received funding from the European Union's Horizon 2020 research and innovation program under grant agreement No. 691763
Once you understand what a certified fuel is, would you change your answer about your considerations when
you are buying biomass? %
A majority of respondents wouldn’t change its answers in the considerations when buying biomass once they are
informed about what a biomass certification is
Considerations when you are buying biomass Now you know what implies a certified biofuel.

289
This project has received funding from the European Union's Horizon 2020 research and innovation program under grant agreement No. 691763
This project has received funding from the European Union's Horizon 2020 research and innovation program under grant agreement No. 691763
There were only 4 respondents that answered that they would change its view after knowing what implies a
certified fuel. Their answers before and after were as follows:
Res. # 1 Res. #2 Res. #3 Res. #4
Knowledge of
certification
No Yes No Yes No Yes No Yes
Price 2 3 2 3 4 3 5 5
Quality 5 5 3 4 4 4 5 1
Certification 5 1 4 3 1 4 5 5
Local 5 2 3 4 2 3 5 5
Delivery
services
5 4 4 3 3 3 5 5
There are not many conclusions that can be extracted with only 4 respondents but it seems that since in other
columns are lowering the priority the quality and certification remains high
MAIN CONCLUSIONS FROM THE SURVEY IN SPAIN
Although the respondents to the survey were limited certain conclusion can be extracted from it.
Most of the respondents were between 31 and 45 years (89) and 45-65 (51) what is logical having in account that
they are the categories where they are living alone and can decide and afford for a heating system change.
It was surprising that 89% of the respondents knew about biomass and 21% were already using it but it’s possible
since from a couple of years biomass is very present in supermarkets and fuel stations and with the crisis and
high fossil fuel prices, users has been looking for alternatives. 21% is a very high share for people using biomass.
Among the respondents also we could notice a lack of information because they express their concern about the
results of a biomass heating installation, about its cleanness, where to buy and also where it can be placed. For
example some answers claimed that they couldn’t put a biomass system because it was building with several
households and this is perfectly feasible. So one conclusion is that even if the respondents knew about biomass
there is still a lack of knowledge among the potential users.
There is still a big potential of growth since 50% percent of the respondents were willing to install biomass and
17% of them will do it as soon as possible and most of the reasons for not being interested was the space
limitations that might vary if they change of house or new smaller devices are sold.
The kind of property is very important to be able to install biomass. Many people are living in flats and only
devices for the whole building are possible and complicates things since it’s not a household decision but from
many, although is much more economical having one device, specially if its with biomass than having individual
devices for every flat. Also kind of ownership is decisive as rented users are logically more reluctant to make
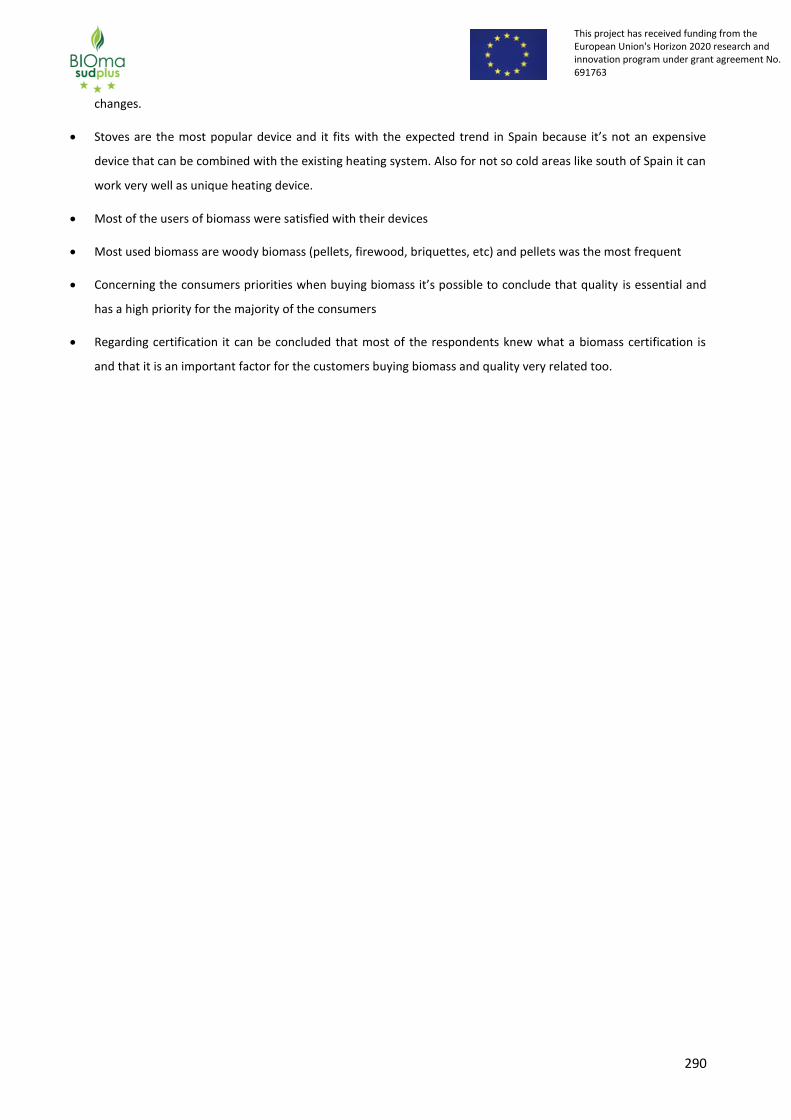
290
This project has received funding from the European Union's Horizon 2020 research and innovation program under grant agreement No. 691763
This project has received funding from the European Union's Horizon 2020 research and innovation program under grant agreement No. 691763
changes.
Stoves are the most popular device and it fits with the expected trend in Spain because it’s not an expensive
device that can be combined with the existing heating system. Also for not so cold areas like south of Spain it can
work very well as unique heating device.
Most of the users of biomass were satisfied with their devices
Most used biomass are woody biomass (pellets, firewood, briquettes, etc) and pellets was the most frequent
Concerning the consumers priorities when buying biomass it’s possible to conclude that quality is essential and
has a high priority for the majority of the consumers
Regarding certification it can be concluded that most of the respondents knew what a biomass certification is
and that it is an important factor for the customers buying biomass and quality very related too.

291
This project has received funding from the European Union's Horizon 2020 research and innovation program under grant agreement No. 691763
This project has received funding from the European Union's Horizon 2020 research and innovation program under grant agreement No. 691763
Report of the final user survey for Turkey

292
This project has received funding from the European Union's Horizon 2020 research and innovation program under grant agreement No. 691763
This project has received funding from the European Union's Horizon 2020 research and innovation program under grant agreement No. 691763
RESULTS DESCRIPTION FOR TURKIYE
Please make a small graphic for the following informations an put some lines of interpretation:
NUMBER OF RESPONDENTS: 35
GENDER
Male 20
Female 15
TOTAL 35
0
5
10
15
20
25
30
35
40
NU
MB
ER O
F R
ESPO
ND
ENTS
RESPONDENTS GENDER (%)
Male57%
Female43%
RESPONDENTS GENDER (%)
RESPONDENTS AGE (%)

293
This project has received funding from the European Union's Horizon 2020 research and innovation program under grant agreement No. 691763
This project has received funding from the European Union's Horizon 2020 research and innovation program under grant agreement No. 691763
18-3032%
31-4554%
46-6514%
RESPONDENTS AGE (%)
% OF RESPONDENTS WHO KNOW ABOUT BIOMASS
97%
3%
% OF RESPONDENTS WHO KNOW
ABOUT BIOMASS
YES NO
% OF RESPONDENTS WHO USE BIOMASS FOR HEATING IN THEIR RESIDENCE
YES9%
NO91%
% OF RESPONDENTS WHO USE BIOMASS FOR HEATING IN THEIR RESIDENCE
% OF RESPONDENTS willing to change to a biomass system

294
This project has received funding from the European Union's Horizon 2020 research and innovation program under grant agreement No. 691763
This project has received funding from the European Union's Horizon 2020 research and innovation program under grant agreement No. 691763
o MAIN REASON FOR YES: 43%
o MAIN REASONS FOR NO: 57%
KIND OF PROPERTY OF BIOMASS USERS
o TYPE OF BUILDING: All are apartment
o TYPE OF OWNERS:
o SURFACE TO HEAT
< 20 m2
20 - 49 m2
50 - 100 m2
101 - 150 m2
> 151 m2
No Response
0 10 20 30 40 50 60
SUR
FAC
E TO
HEA
T
RESPONDENTS , %
o TYPE OF HEATING SYSTEM
Owner 20%
Renter 20%
No Response 60%
TYPE OF OWNERS

295
This project has received funding from the European Union's Horizon 2020 research and innovation program under grant agreement No. 691763
This project has received funding from the European Union's Horizon 2020 research and innovation program under grant agreement No. 691763
o AVERAGE PRICE BY DEVICE
o % DEVICE POWER BY CATEGORY AND DEVICE
4 Respondents chose thermosiphon/Boiler and;
50% of them 13 - 30 kW
25% of them 31 - 50 kW
25% of them 1 - 12 kW
1 Respondent chose Heat Pump; 13-30 kW
1 Respondent chose Natural Gas Combi; 13-30 kW
o % TYPE AND QUANTITY OF BIOFUEL
1 Respondent chose wood and hazelnutshell (500-1000 kg)
0 10 20 30 40 50 60 70
Thermosiphon/Boiler
Heat Pump
Natural Gas Combi
Central Heating
No Response
RESPONDENTS , %
TYP
E O
F H
EATI
NG
SY
STEM
0 1000 2000 3000 4000 5000
1
Average Price, €
De
vice
Average Price by Device
Thermosiphon/Boiler
Natural Gas Combi
Heat Pump

296
This project has received funding from the European Union's Horizon 2020 research and innovation program under grant agreement No. 691763
This project has received funding from the European Union's Horizon 2020 research and innovation program under grant agreement No. 691763
1 Respondent chose peach shell (0-500 kg)
1 Respondent chose olive stone and hazelnutshell (0-500 kg)
What is your feeling as consumer using biomass?
o AVERAGE OF GRADE OF GENERAL SATISFACTION
7 Respondents answered:
29% of them 5 points
43% of them 4 points
14% of them 3 points
14% of them 2 points
o AVERAGE OF GRADE OF SATISFACTION WITH YOUR INSTALLATION (EFFICIENCY,EMISSIONS, FREQUENCY OF CLEANING, ETC)
3 Respondents answered:
33% of them 4 points
33% of them 3 points
33% of them 1 point
o AVERAGE GRADE OF SATISFACTION WITHTHE BIOMASS (QUALITY, PRICE, …)
3 Respondents answered:
66% of them 4 points
33% of them 1 point
o AVERAGE OF GRADE OF SATISFACTION WITH THE DISTRIBUTION NETWORK
3 Respondents answered:
33% of them 4 points
66% of them 1 point
Your considerations when you are buying biomass .
o AVERAGE PRICE
4 Respondents answered:
50% of them 3 points
25% of them 4 points
25% of them 5 points
o AVERAGE QUALITY
4 Respondents answered:
50% of them 3 points

297
This project has received funding from the European Union's Horizon 2020 research and innovation program under grant agreement No. 691763
This project has received funding from the European Union's Horizon 2020 research and innovation program under grant agreement No. 691763
25% of them 4 points
25% of them 5 points
o AVERAGE CERTIFICATION
4 Respondents answered:
50% of them 3 points
25% of them 4 points
25% of them 1 point
o AVERAGE LOCAL PRODUCT
4 Respondents answered:
50% of them 3 points
25% of them 4 points
25% of them 1 point
o AVERAGE DELIVERY SERVICES
4 Respondents answered:
50% of them 4points
25% of them 3 points
25% of them 5 points
Do you know what a certified biofuel is? %

298
This project has received funding from the European Union's Horizon 2020 research and innovation program under grant agreement No. 691763
This project has received funding from the European Union's Horizon 2020 research and innovation program under grant agreement No. 691763
29%
63%
8%
Do you know what a certified biofuel is? %
YES NO NO RESPONSE
Once you understand what a certified fuel is, would you change your answer about your considerations when
you are buying biomass? %
YES17%
NO20%NO RESPONSE
63%
Once you understand what a certified fuel is, would you change your answer about your
considerations when you are buying biomass? %
Considerations when you are buying biomass Now you know what implies a certified biofuel.
o AVERAGE PRICE
2 Respondents answered:
50% of them 5 points
50% of them 3 points
o AVERAGE QUALITY
2 Respondents answered:
50% of them 3 points
50% of them 4 points
o AVERAGE CERTIFICATION

299
This project has received funding from the European Union's Horizon 2020 research and innovation program under grant agreement No. 691763
This project has received funding from the European Union's Horizon 2020 research and innovation program under grant agreement No. 691763
2 Respondents answered:
50% of them 3 points
50% of them 4 points
o AVERAGE LOCAL PRODUCT
2 Respondents answered:
50% of them 3 points
50% of them 4 points
o AVERAGE DELIVERY SERVICES
2 Respondents answered:
50% of them 3 points
50% of them 5 points
MAIN CONCLUSIONS FROM THE SURVEY IN TURKIYE
35 people participated in the questionnaire. It is difficult to forward the questionnaire to the biomass users in
rural regions who do not have internet access.
97% of respondents know biomass, however 3% of them do not know.
Only 9% of respondents use biomass for heating purpose.
However, 43% of respondents are willing to change their system to a biomass system.
On the other hand, the biomass is expensive and the distribution network does not exist.
Generally, people don’t know the definition of certified solid biomass. Only 14% of respondents know the
definition of certified solid biomass.