residential customer water and wastewater sales analyses ... · residential customer water and...
TRANSCRIPT

Residential Customer Water and Wastewater Sales Analyses and Profiles
Authors: Jeff Hughes, Shadi Eskaf, Christine Boyle Environmental Finance Center at the University of North Carolina, Chapel Hill
September 29, 2008
Abstract Studying customer behavior has become an essential financial management and research component for most commercial enterprises. Should customer sales analyses play a role in shaping or preparing for water utility management decisions, such as changing pricing or providing a new customer program? In this paper, we investigate how individual customer sales information can be collected and analyzed, using billing data, in a way that supports water services management decisions. We conduct customer sales analyses for three large utilities in North Carolina, and by tracking each customer’s history and billing experience, we examine trends and relationships related to usage patterns and fluctuations, irrigation and capacity use, timeliness of payment and cutoff patterns, and geographic variation within communities. The variation in the results for each of the utility studied reinforces the necessity of customizing pricing and policy to local conditions. Customer level analysis also permits utilities to carry out targeted marketing so that they communicate messages directly to customers most likely to respond or need the message.

Residential Customer Water and Wastewater Sales Analysis and Profiles Hughes, Eskaf, Boyle September 2008 Environmental Finance Center
1. Introduction Studying customer behavior has become an essential financial management and research component for most commercial enterprises. Enterprises rely on these analyses to better market their products and services and to predict how customers will respond to changes in price, changes in products/services, and different marketing campaigns. The ability to better understand customer behavior has enormous financial repercussions – a small miscalculation can cost an enterprise millions in misspent marketing or lost sales.
It is hard to imagine a major corporation considering a significant policy or pricing change without conducting careful customer research. An airline considering an overhaul to their pricing structure is likely to carefully study sales records before implementing changes. A bottled beverage company crafting a new marketing campaign most certainly studies current and future customers to better target the message. Now imagine a water or wastewater utility that is considering radically changing their pricing or a utility considering a new major marketing strategy (e.g. conservation messaging). Should customer sales analyses play a role in shaping or preparing for these types of decisions? In order to address this question, the Environmental Finance Center collaborated with several of the Urban Water Consortium (UWC) utilities in North Carolina to investigate how customer sales information can be collected and analyzed in ways that supports water services management decisions.
Water utilities throughout the state are grappling with a number of specific policies that are clearly influenced by customer behavior. This research sought to address specific policies such as:
• Pricing: How are individual customers and groups of similar customers likely to react to changes in price and rate structure?
• Conservation Marketing: As with any marketing campaign, understanding who the target audience is and how they behave is essential. Can efforts designed to reduce or change usage patterns be made more efficient by incorporating customer sales analyses?
• Customer Assistance: How much effort should a utility devote to addressing problems low income customers may have in meeting their payment obligations? Can sales data provide insight on whether these programs are needed and how best to design and budget for these programs?
In this study, we begin with the customer’s billing experience, and work backwards through timeliness of payment, cutoff patterns, usage fluctuation, rate structures, and to begin to understand relationships among utilities’ customer characteristics, usage patterns, and rate structures.
Page 2

Residential Customer Water and Wastewater Sales Analysis and Profiles Hughes, Eskaf, Boyle September 2008 Environmental Finance Center
2. Methodology Last year, the utilities within the Urban Water Consortium provided water and/or wastewater services to approximately 2,400,000 people across North Carolina. The sales transactions for these services typically occur once a month or once every two months with the sales price based on the amount of metered water use during the proceeding billing cycle. This research involved compiling billing data in a form that permitted studying customer sales patterns for individual customers for 12 consecutive months between July 1, 2006 and June 30, 2007.
2.1. What is a “Customer”?
One of the key elements of this research is being able to track each customer’s consumption over time. The term “customer” carries multiple meanings in the water services business. From a regulatory compliance or customer satisfaction standpoint, each individual that depends on drinking water or another service can be considered a customer even if they personally never participate in a water sales transaction. However, when water service utilities use the term “customer” in the context of billing, they are normally referring to the accounts they have in their billing records. The typical utility will provide water services to a variety of different account classes including single family dwelling units, multi-family units sharing a meter/account such as an apartment complex, commercial entities such as retail stores, and in some cases large industrial accounts and/or other utilities that purchase bulk water. The indirect nature of water sales transactions and the difficulty in defining the customer poses a number of challenges to accurately compiling and analyzing customer data. Customer billing software and databases are designed primarily for accounting purposes and not as a source of marketing information. As a result, converting raw billing data into data that can be analyzed across time and comparatively for different utilities requires a significant amount of data transformation and cleaning.
How a customer is defined drives the data management efforts necessary to carry out the subsequent analyses since raw billing and consumption data must be aggregated at the customer level. After several iterations using slightly different definitions of a “customer,” we decided to analyze billing and consumption at the “premise” level – focusing on the account address rather than the household that lived at the address. In many cases, tracking the consumption patterns of a premise would lead to the same results of tracking consumption patterns for households, but not always. The main difference is that households move and premises don’t.
Utilities often track various meters that belong to the same house or lot under one premise number, but using several account numbers. For example, a household might have a different account number for their irrigation meter than their standard household meter. Similarly, if a separate water meter exists at the point of entry to a room above a garage that is rented out, a different customer account might be used to distinguish between the renter of the room and the tenants of the house. In these examples, the premise would include all three water meters, reflecting the ownership of the entire lot. Unique premise numbers are usually assigned by the utility when a new house is first constructed, and (unlike account numbers) usually never
Page 3

Residential Customer Water and Wastewater Sales Analysis and Profiles Hughes, Eskaf, Boyle September 2008 Environmental Finance Center
changes over time, improving the reliability of the billing and consumption data over multiple years. Premise-level analysis does not track the individuals that live in the homes, but essentially controls for household size since the size of the homes and lots do not change rapidly over time. In many cases, it is possible to track when a household moves in or out of a premise and this “turnover” information was incorporated into our datasets when it was available.
2.2. Data Collection and Cleaning
Having defined the customer as a premise, we requested billing records from select UWC utilities. Starting from the top of a list of the 11 utilities, arranged based on diversity of system size, type, location and service population socioeconomic characteristics, we contacted the utilities until we received the requested data from three utilities. We approached eight utilities in total – five of which either could not produce the data in the midst of software changes, or had recently completed an extensive rate study with similar analyses. The three participating utilities are Fayetteville Public Works Commission (PWC), Greenville Utilities Commission (GUC), and the City of High Point (HP).
Each of the utilities provided a database of every billing transaction record, along with premise identification numbers, from July 1, 2006 through June 30, 2007. Data were provided on, at least, the billing month, account and rate structure classifications, meter sizes and types, usage through each meter, billed amounts, penalties, cutoffs, and zip codes.
Figure 1 Due to the variation of billing software, the datasets produced were in different formats, using different units, and rounding at different levels. Extensive and customized data cleaning was necessary for each dataset, with the goal of producing a final dataset of accurate data that are consistent across the three utilities. Records were aggregated to produce a dataset with only one record per premise per month. Premises that received wastewater service only but not water service were identified and excluded. This was significant portion of PWC’s customers, as shown in Figure 1. Excluding sewer-only premises left datasets of only water-using premises.
Irrigation meter usage and standard meter usage were identified separately, and aggregated to produce a total premise usage in each month. Using account classifications, rate schedules applied, meter sizes and number of dwelling units per premise, the single family dwelling units (SFDU) were identified. These are residential premises that did not have standard meters that exceeded ¾” in size, and did not have more than one dwelling unit per premise. Hence, master-
Page 4

Residential Customer Water and Wastewater Sales Analysis and Profiles Hughes, Eskaf, Boyle September 2008 Environmental Finance Center
metered apartment complexes or multifamily housing units, commercial, industrial and wholesale customers are not recognized as SFDUs. The focus of this analysis is on consumption and billing of SFDU premises over time. Characteristics of the premises are summarized in Table 1, including the prevalence of irrigation meters and account turnover among SFDUs. PWC has twice the number of premises as HP and GUC. SFDUs accounted for the majority of customers for each of the three utilities, and substantial portions of their total water usage and billed amounts, as shown in Figure 2.
Table 1 Characteristics of Water‐Using Premises Across the Three Utilities Characteristic Fay PWC GUC HP Number of water-using premises 79,832 31,844 40,453 Percent of premises are SFDU 91% 84% 89% Percent of SFDU premises: with irrigation meters 7.3% 2.5% 2.3% with customer turnover 22.1% 13.7% 17.2% cutoff at least once in the year 18.5% 2.7% 9.3%
Figure 2
2.3. Data Analysis
Billing records for SFDUs were analyzed in three ways: 1) at the monthly bill level, where each record described a single premise-month interaction; 2) at the aggregated premise level, where each record described a summary of the behavior of one premise through the 12 months, and 3) at the zip code level, which summarized total activity within each zip code. Billing level analysis was used to calculate total and average SFDU water usage in different months, the distribution of usage and billed amounts over time, and cutoff patterns. Premise level analysis was used to
Page 5

Residential Customer Water and Wastewater Sales Analysis and Profiles Hughes, Eskaf, Boyle September 2008 Environmental Finance Center
calculate the distribution of usage among SFDUs, to identify high and low average users, and to identify how each premise changed their usage over a 12 month period. Zip code level analysis was used to establish geographic differences in SFDU consumption behavior and socioeconomic characteristics obtained from the U.S. Census Bureau. Census data from the 2006 American Community Survey were used to describe the differences between the three service areas at a city level.
To conduct our data cleaning and analysis, we used Stata, a statistical software program able to manage the millions of records in our datasets.
3. Results After the billing data were transformed into a format that could be analyzed, we carried out a detailed sales analysis for each utility. Analysis results were compiled into a standard template and provided to each utility (see Appendix 1). These reports included detailed analyses that showed customer usage patterns throughout the year. The reports also included summaries of billing practices and socioeconomic data likely to influence or characterize customer behavior in each utility. In addition to these standardized reports, we worked with representatives of each utility to identify supplementary analyses that addressed their individual concerns. The analyses were used to identify potential billing or coding errors that were subsequently investigated and if appropriate, corrected by the utility.
Comparing the analyses between utilities revealed some important similarities and differences in customer characteristics and customer behavior. The following section describes some of the key findings from this comparative analysis.
3.1. Pricing
Utilities rely on rates and rate structures to meet a number of key management objectives. First and foremost, rates are a means of generating revenue that allow the utility to provide services. Rates also play a major role in determining how much of the total revenue “pie” comes from different customers with different usage needs. Figure 3 shows how much customers that use different amounts of service were billed in the three utilities. PWC and GUC customers with 5,000 gallons of metered water use pay approximately $40 for water and wastewater services a month. High Point customers pay approximately $50 for the same amount of service. In reality, a relatively small percent of customers use exactly 5,000 gallons of service each month. Many customers never use more than 2,000 to 3,000 gallons each month and some customers never use less than 8,000 to 10,000. The figure below can be used to show the impact rate structures have on determining the financial contributions of customers with different consumption requirements. While medium volume users in GUC and PWC pay approximately the same amount for service, higher volume PWC customers pay significantly more than GUC customers. The trend is the opposite for low volume users.
Page 6

Residential Customer Water and Wastewater Sales Analysis and Profiles Hughes, Eskaf, Boyle September 2008 Environmental Finance Center
Figure 3
3.2. Billing Practices
Research has begun to show that billing practices, as well as the rates themselves, can influence customer behavior (Gaudin, 2006). For this reason, our analysis included a short description of billing practices among each of the utilities, shown in Table 2. Most of the utilities follow the same general practices, however they differ in the amount of historical usage information they provide to their customers. The level of understanding and interest related to bills and rates varies considerable among customers with some customers taking an avid interest and others barely paying attention before writing the check. Direct drafting, a procedure many utilities are currently promoting may serve to further distance some customers from the information on their bill as payment occurs whether they open their bill or not. Utility customers that pay little attention to the details of their bill other than the “bottom line” may not even understand exactly what services they are paying for and the relative cost of each of those services. This is particularly important for utilities that have non-water related services such as solid waste or electricity on their bill such as GUC. It is plausible that the lack of understanding of specific services severely limits the ability of the average customer to accurately assess the financial impact of using more or less of a particular service. In other words, the power of rates to send strong conservation messages may be diluted for many customers.
Page 7

Residential Customer Water and Wastewater Sales Analysis and Profiles Hughes, Eskaf, Boyle September 2008 Environmental Finance Center
Table 2 Billing Practices of the Three Utilities in FY2006‐07 Characteristic Fay PWC GUC HP Billing frequency Monthly Monthly Monthly
Rate structure Increasing Block Uniform Rates Decreasing Block with large 1st block
Block 1 ends at 6,000 GPM N/A 26,180 GPM Offer direct draft billing option Yes Yes Yes Shown on the customer bill: consumption amount Yes Yes Yes rates (unit or block price) No No No historical usage information Monthly use chart Daily average use None Cutoff policy Yes Yes Yes
Services on the bill Water, Sewer, Electric
Water, Sewer, Electric, Gas Water, Sewer
Services separated on the bill Yes Yes Yes
3.3. Socioeconomic and Housing Characteristics of Service Areas
The socioeconomic and housing characteristics of a utility’s customer base can be used to predict how customers are likely to respond to different initiatives. The three utilities studied for this project serve large populations, and are located in geographically disparate areas of the state. The main cities served by each of the utilities are all included in the U.S. Census Bureau’s American Community Survey in 2006. Socioeconomic and housing characteristics are estimated from statistically representative samples of the populations.
Figure 4 shows the household income distribution for the three utilities. GUC has a much higher percentage of low income households than the other utilities and a lower number of upper middle income families ($45,000 -$125,000) households. Utilities with a high percentage of low income households should pay more attention to the impact their pricing structure has on low volume users who are often also low income. A large number of low income households may also lead to more non-payment problems and social hardship situations thereby justifying the consideration of more significant low income customer billing assistance programs. There are limitations to using socioeconomic data for these types of analyses since many low income customers or renters may not pay their water bills directly if these services are included in rent.
Page 8

Residential Customer Water and Wastewater Sales Analysis and Profiles Hughes, Eskaf, Boyle September 2008 Environmental Finance Center
Figure 4
Figures 5 and 6 show the distribution of household size and rental properties for the three utilities. Forty percent of the housing structures in Greenville are occupied by 1 person compared to 25 percent in High Point. A utility with a very high number of small households should expect to have a high number of low volume bills. The revenues from these customers will be highly dependent on the relative size of the utility’s base charges. If the base charges are set low, these customers will contribute relatively little, in proportion to their numbers, in revenue.
Home ownership influences customer behavior in a variety of ways. Customers that do not own their home are probably less likely to invest in costly repairs or upgrades that would influence water usage. Additionally, oftentimes renters do not pay directly for their water and sewer services, when these bills are included in the rent. This removes the price incentive to conserve water. All other factors equal, these data would suggest a toilet rebate program in Greenville would be much less subscribed to than in the other cities.
Figure 5 Figure 6
Page 9

Residential Customer Water and Wastewater Sales Analysis and Profiles Hughes, Eskaf, Boyle September 2008 Environmental Finance Center
Smaller houses, smaller household sizes and newer houses (with the newer, more efficient plumbing fixtures) are expected to have lower average customer consumption than other houses. We see in Figures 7 and 8 that Greenville has, in general, proportionately more of the newer and smaller houses, and smaller household sizes, than the other two cities. Fayetteville has the largest proportions of large houses and household sizes, and the smallest proportion of houses built since 1990, close to when the new plumbing code became effective. The average SFDU monthly usage was higher for PWC (4,980 gallons) than for GUC (4,641 gallons).
Figure 7 Figure 8
3.4. Variation in Seasonal Averages
Figure 9 shows how average usage varied throughout the year. The average usage among the three utilities was very similar during the winter months but diverged significantly during the summer with PWC customers using on average much more water than GUC or HP customers.
Figure 9
Page 10

Residential Customer Water and Wastewater Sales Analysis and Profiles Hughes, Eskaf, Boyle September 2008 Environmental Finance Center
3.5. Variation in Volume Sales
Utilities often calculate and present customer charges at a specific consumption amount to demonstrate the impact their rate structures will have on customers or to compare their rates with another utility. For example, the price charged to a customer for 5,000 gallons a month under the old rates may be compared to the price charged for the same amount of water under new rates. Consumption amounts for these comparisons vary from utility to utility, but they typically use 5,000 to 7,000 gallons per month (GPM) as the reference point.
The following two figures illustrate the range of actual customer sales for PWC, GUC, and HP. Figure 10 shows the distribution of all of the monthly premise transactions for the entire year, and Figure 11 shows the variation in average customer use for each of the utilities. Both of these figures show that a relatively small percentage of premises actually use the 5,000 to 7,000 GPM amounts that is referred to in many rate comparisons. The overall shape of the distribution is very similar for all three utilities; however there are some important localized differences. PWC have slightly more customers with higher average usage. Somewhat surprisingly, the analysis showed that each of the utilities has a similar and relatively high number of premises with an average use of zero consumption over the year (2 to 3 percent). Although approximately one-third of these zero consumption premises were new premises that were only provided service for one or two months, about one-third were premises that used zero gallons in 12 consecutive months.
Figure 10
Page 11

Residential Customer Water and Wastewater Sales Analysis and Profiles Hughes, Eskaf, Boyle September 2008 Environmental Finance Center
Figure 11
The differences in average customer usage is more pronounced than Figure 11 suggests, particularly in regards to customers in the “tail” with high usage. Figure 12 shows the impact of the differences in high usage customers among the three utilities. High average usage PWC customers represent 8 percent of the utility’s SFDU premises and are responsible for a full 20 percent of the amount billed to all PWC SFDU premises. These large average users play a more minor role for GUC and HP representing 6 and 5 percent of the total number of SFDU premises and 14 and 12 percent of SFDU billed amounts, respectively.
Figure 12
Page 12

Residential Customer Water and Wastewater Sales Analysis and Profiles Hughes, Eskaf, Boyle September 2008 Environmental Finance Center
3.6. Customer Peaking Patterns
Utilities often use pricing and conservation marketing campaigns to try to reduce their customers’ peaking. Utilities design many of their facilities to meet their customers’ maximum usage during the year. Customers that use 20,000 GPM for three months and 5,000 GPM for the rest of the year have a much different impact than customers that use 7,000 GPM all year long. Figure 13 shows the distribution of peaking patterns among customers for each of the three utilities.
A utility with a fewer number of peakers may have already implemented successful policies to reduce peaking or they may simply have customers with “naturally” different irrigation and peaking habits. A utility with a percentage of customers with high peaking patterns have more of an incentive to engage in peak shaving efforts particularly if the utility has capacity limitations. Peak shaving plays a central role in pricing strategies used by energy utilities and some utilities use customer specific peaking data to determine customer specific rates that are designed to create strong incentives for reducing peak usage. This type of customized pricing has been implemented by some water utilities throughout the country, but we are not aware of its use for residential customers in North Carolina1. HP’s customer peaking distribution is noticeably different than GUC and PWC with far more customers that have lower peaking patterns over the year. For each utility, though, about 10 to 15 percent of SFDUs more than quadruple their baseline usage for a sustained period (at least three months) during the year.
Figure 13
1 The Town of Cary tracks usage for its commercial customers and creates customized price blocks that take into consideration each customer’s historic usage.
Page 13

Residential Customer Water and Wastewater Sales Analysis and Profiles Hughes, Eskaf, Boyle September 2008 Environmental Finance Center
3.7. Rate Setting Implications of Customer Usage Patterns
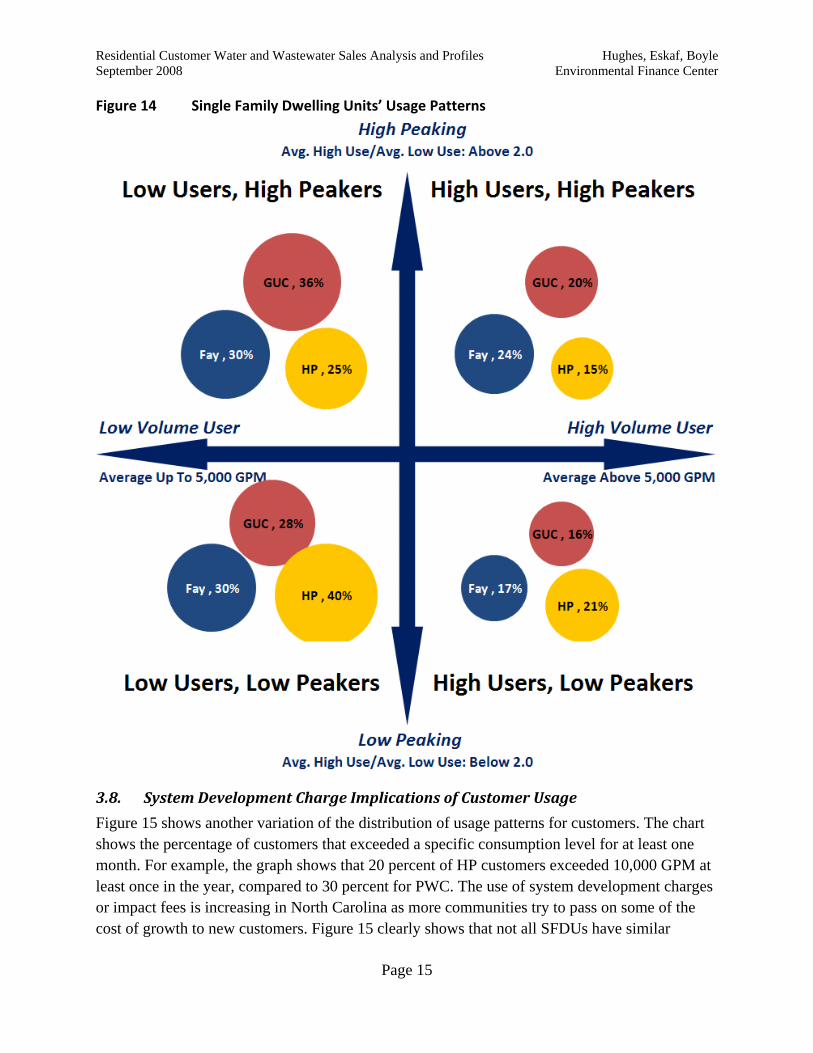
Over the last few years, there have been lively discussions among utilities, state regulators, and the media about the relative merits of different rate structures. Most of these debates have focused on the benefits of increasing block rate structures to send strong conservation messages and influence behavior. Customer analysis can and should inform these discussions for individual utilities. Without knowledge of current customer behavior, it is difficult to predict the impact rate structure changes, such as going from uniform to increasing block structure, are likely to have on customers. Figure 14 divides customers in each utility into four groups based on their average usage and peaking patterns. The upper right hand quadrant shows the relative percentage of customers that use a lot of water on average and also have a high peaking ratio throughout the year. These customers are typically the stated targeted population for increasing block rate structures, with the theory that their high usage and peaking causes a utility to design larger facilities than they might otherwise need and that their peaking is indicative of discretionary use that can be influenced and reduced through pricing incentives. PWC has significantly more of these customers than the other utilities (24 percent compared to 20 percent for GUC and 14 percent for High Point).
Some economists worry about the unintended impacts of increasing block rate structures on customers that have less discretionary use. For example, a household that has a large family may use a lot of water all year and have little discretionary use, but would still have to pay higher unit costs for their water. Many of these customers probably fit into the lower right hand quadrant of the figure showing customers that use a relatively high amount of water all year, but who are less inclined to peak. A utility with a large number of these types of customers that implements an increasing block rate structure will likely see less of a drop in water usage than a utility with more high use, high peaking customers. Figure 14 can guide rate setting in other ways, for example the relatively high number of low users that peak in GUC might suggest that if GUC did move to an increasing block rate structure, they should consider a rate structure in which increasing pricing tiers start at lower consumption points than in PWC or HP.
Figure 14 helps reinforce the point that customer bases differ among utilities across the state and rates can and should be customized to address individual situations.
Page 14
Residential Customer Water and Wastewater Sales Analysis and Profiles Hughes, Eskaf, Boyle September 2008 Environmental Finance Center
Figure 14 Single Family Dwelling Units’ Usage Patterns
3.8. System Development Charge Implications of Customer Usage
Figure 15 shows another variation of the distribution of usage patterns for customers. The chart shows the percentage of customers that exceeded a specific consumption level for at least one month. For example, the graph shows that 20 percent of HP customers exceeded 10,000 GPM at least once in the year, compared to 30 percent for PWC. The use of system development charges or impact fees is increasing in North Carolina as more communities try to pass on some of the cost of growth to new customers. Figure 15 clearly shows that not all SFDUs have similar
Page 15

Residential Customer Water and Wastewater Sales Analysis and Profiles Hughes, Eskaf, Boyle September 2008 Environmental Finance Center
capacity needs; in fact, the chart demonstrates significant variation in capacity needs. Using HP as an example, approximately 20 percent of their customers never exceeded 3,000 GPM and 10 percent used 14,000 GPM or more at least once during the year. Should all of these customers be asked to pay the same system development charge?
Figure 15
3.9. Irrigation Habits
For a single family home with a lawn, irrigation use usually exceeds the indoor household use during the summer months. Since distribution systems are designed to supply customers during peak loads, irrigation usage is a significant factor in the design and the capacity of the distribution (and treatment) systems, contributing directly to infrastructure cost. Thus, understanding the volumes required to supply irrigation use is important for any utility. To this extent, many utilities install separate irrigation meters to measure the usage, and even charge higher water rates for irrigation use than for indoor household use. In addition, legislation passed during last year now requires new residential irrigation systems to be metered separately.
As a percentage, irrigation meters have not been very common. Only 7 percent of PWC’s SFDUs had irrigation meters, compared to only 2 percent of GUC’s and HP’s SFDUs. Between 5 and 10 percent of premises with irrigation meters did not actually have any irrigation usage throughout the year.
The extent to which separately metered irrigation usage adds to the capacity requirements of a system is shown in Figure 16. During the winter months, irrigation usage drops to nearly zero in all three utilities. In the summer months, however, SFDUs with irrigation meters use 2 to 7 times as much irrigation water as they do indoor water. This ratio varies significantly among the three utilities. If the wintertime consumption is taken as the baseline demand, then PWC and HP’s systems provide these irrigation customers, on average, more than three or four times their
Page 16

Residential Customer Water and Wastewater Sales Analysis and Profiles Hughes, Eskaf, Boyle September 2008 Environmental Finance Center
baseline demand (during the summer), and GUC’s system provide at least eight times their baseline demand on average.
Figure 16
The question of how residential customers without irrigation meters change their usage in the summer can at least be partially answered by comparing the standard household meter usage of SFDUs with and without irrigation meters. If a SFDU does not have an irrigation meter, but the customer waters her/his lawn in the summer or uses water for other outdoor use, their increased summertime usage would be reflected in their standard household meter readings. In the case of a SFDU using an irrigation meter for all outdoor use, the standard household meter readings would remain relatively constant throughout the year. The difference between the average usage in the summertime and the average usage in the wintertime of SFDU standard household meters, for SFDUs with and without irrigation meters, is shown in Figure 17. In all cases, summertime use always exceeded wintertime use. For PWC and GUC, SFDUs without irrigation meters increased their standard household usage during the summer months more than the SFDUs with irrigation meters, on average. This is evidence that SFDUs without irrigation meters are compensating by using their standard meters to supply irrigation use. HP, on the other hand, does not show this effect.
Page 17

Residential Customer Water and Wastewater Sales Analysis and Profiles Hughes, Eskaf, Boyle September 2008 Environmental Finance Center
Figure 17
3.10. Nonpayment Cutoffs
When customers do not pay their utility bills, they receive penalties and/or get their service cut off for nonpayment. Reducing nonpayment cutoffs is an important goal for all water utilities for social and fiscal reasons. Cutting off and reconnecting customers is an additional expense, and it is fiscally responsible to encourage customers to pay their bills on time to maintain utility budgets. PWC has a relatively high rate of nonpayment cutoffs: 16 percent of their SFDU premises had at least one cutoff during the year due to nonpayment of bills. GUC and HP have lower rates of nonpayment cutoffs by comparison; 3 percent and 9 percent, respectively.
Understanding the reasons behind nonpayment cutoffs could help utilities in identifying the appropriate strategies to reduce cutoffs. When do customers get cutoff? Are nonpayment cutoffs more likely the result of general inability to pay the bills, or due a “bill shock” where one month’s bill far exceeds what the specific customer is accustomed to paying leading to unusual cash flow problems? Figure 18 shows how the cutoff bill amount compared to the average bill amount of the SFDU that got cutoff for nonpayment. For PWC and HP, 60 percent of cutoff bills were, in fact, equal to or less than the average bill for the cutoff customers, and less than 5 percent of the cutoff bills might have been the result of a bill shock. In GUC, bill shock might explain slightly more of the nonpayment cutoffs, but the majority of the cutoff bills were less than 150 percent of the average bill that SFDU was paying. Creating a customer assistance program to help in times of affordability difficulties might be helpful at least to the customers facing bill shocks.
Page 18

Residential Customer Water and Wastewater Sales Analysis and Profiles Hughes, Eskaf, Boyle September 2008 Environmental Finance Center
Figure 18
3.11. Geographic Analysis
Summarizing usage and billing at the zip code level provides an additional method of studying customer behavior patterns. Households in urbanized downtown areas are likely to consume water differently than households in the outskirts of town. Average usage, peaking, and usage varied significantly by zip code for each of the three utilities, as shown in Table 3 for HP. SFDUs in zip codes 27409 and 27260 averaged the lowest use, low peaking and less than 1 percent of the SFDUs had an irrigation meter. By comparison, SFDUs in 27235 and 27263 averaged much more usage and peaking. Identifying geographic trends can help the utility target specific efforts to certain areas, such as expanding irrigation meter usage or, when considering cutoff trends by zip code, customer assistance programs.
Table 3 High Point SFDU Usage Characteristics at the Zip Code Level
Zip Code
Average SFDU Monthly Usage
(GPM)
Average SFDU High/Low Usage Peaking Ratio
% Exceeding 10,000 GPM at Least Once
% with Irrigation Meters
27235 5,441 3.3 45% 1% 27260 3,928 2.5 18% 0% 27262 4,787 2.8 25% 4% 27263 4,629 5.0 18% 0% 27265 4,902 2.5 25% 3% 27282 5,288 2.3 29% 5% 27284 5,348 2.5 32% 1% 27409 2,956 2.1 6% 0%
Page 19

Residential Customer Water and Wastewater Sales Analysis and Profiles Hughes, Eskaf, Boyle September 2008 Environmental Finance Center
Page 20
Nonpayment cutoffs and penalties may also be a result of poor bill-paying habits of a select number of customers. Nearly half of the SFDUs in PWC and GUC had at least one late payment penalty during the year. In PWC, 51 percent of the SFDUs that were cutoff once for nonpayment were in fact cutoff at least twice during the year. In HP, 23 percent of the cutoff premises were cutoff more than once. In GUC, however, that proportion is only 4 percent, indicating that habitual cutoffs is not as large of a problem for GUC as it might be for PWC and HP.
4. Conclusion No two utilities are exactly alike. Despite some similarities in monthly usage across the three utilities, there are significant differences in customer consumption behavior between the three utilities we studied. Policies that might work for one utility might be ineffective in another utility where the customers behave differently. Analyzing and understanding the customer profile is a difficult but should be an essential part of any utility’s management decision-making framework. At the very least, customer level analysis provides a summary of usage patterns across the year, and can help utilities discover errors that can be easily corrected, such as using wrong rate structures classifications for specific customers. Customer level analysis can also provide a better understanding of customers by revealing trends in usage and bill paying practices over time, and customer specific practices such as peaking and irrigation usages. Producing profiles based on customer level usage history is a powerful tool in evaluating new utility-wide policy decisions affecting customers, and allows utilities to better target specific marketing campaigns. With sound customer level analysis, marketing efforts such as bill inserts and phone messages could be customized so that customers receive messages that pertain to their situation. For example, utilities that have profiled their customers could send out conservation notices first to customers that have shown high peaking and high usage in their history, instead of canvassing the entire service population.
Reference Gaudin, S. (2006). “Effect of Price Information on Residential Water Demand.” Applied Economics 38, p.383-393.