residential burglaries - universiteit twenteessay.utwente.nl/61668/1/msc_f_aantjes.pdf2 abstract...
TRANSCRIPT
Residential burglaries
A comparison between self-report studies of burglars and observational data from Enschede
Author: Feike Aantjes
Supervisors University of Twente: Mw. Prof. Dr. M. Junger
Mw. Dr. A.L. Montoya
Enschede, May 2012
2
Abstract
Residential burglary is a serious crime. In Twente the amount of residential burglaries increased
in the period of 2007 till 2011 every year by at least 8%. A burglary has a significant impact on
the victims, not only financially but emotionally as well. Once a burglary is committed, a repeat
of the crime is very likely.
Some theories try to explain how burglars operate and why. These theories are the rational
choice perspective, the routine activities approach, the opportunity theory, the crime pattern theory
and crime prevention through environmental design (CPTED).
This study compares the results of self report studies of burglars with observational data from Enschede,
a Dutch city with approximately 157.000 citizens. The self report studies are from Macintyre (2001). He
interviewed 50 burglars to obtain a list of seventeen cues, which play a role in assessing whether a
house is suitable to break in to or not. Some cues attract burglars, while others deter them. In Enschede
851 houses were observed in 2010, 430 of them were burglarized in 2008 and the other 421 were not
burglarized the past 5 years. Every house was observed using a checklist, which was used for
characteristics of the houses and the direct environment. Every cue of Macintyre is compared with the
data from Enschede, to find out whether the cues correspond or not.
The factors dog evidence and people in the street have in agreement with Macintyre a significant lower
chance of getting burglarized. Houses with bad window frames or bad maintenance or a corner house
are significantly more likely to get burglarized.
Houses with high fences, an alarm system or extra locks are more likely to get burglarized, in contrast
with what was expected. The other cues had no significant impact on the chance of getting burglarized.
Further research can take alarm systems and extra locks into account and investigate whether these are
effective measures, as well as dead-end streets and take the different types of dead-end streets into
account. Finally a replica of Macintyre’s study in a Dutch setting with information about the modus
operandi could generate more insight in the target selection and breaking and entering of burglars in
The Netherlands.
3
Residential burglaries
Burglary of dwellings is a serious crime, which confronts a lot of Dutch citizens. In 2009 nearly 74.000
burglaries were committed, an increase of 6% compared to 2008 (CBS, 2010). This increase continued in
2010, when the Dutch police registered 10% more burglaries (CBS, 2011). Several police regions
reported again an increase in burglaries in the first six months of 2011 (De Waard, 2011). Similarly, the
same tendency can be seen in Enschede, a Dutch city with more than 157.000 residents in the region
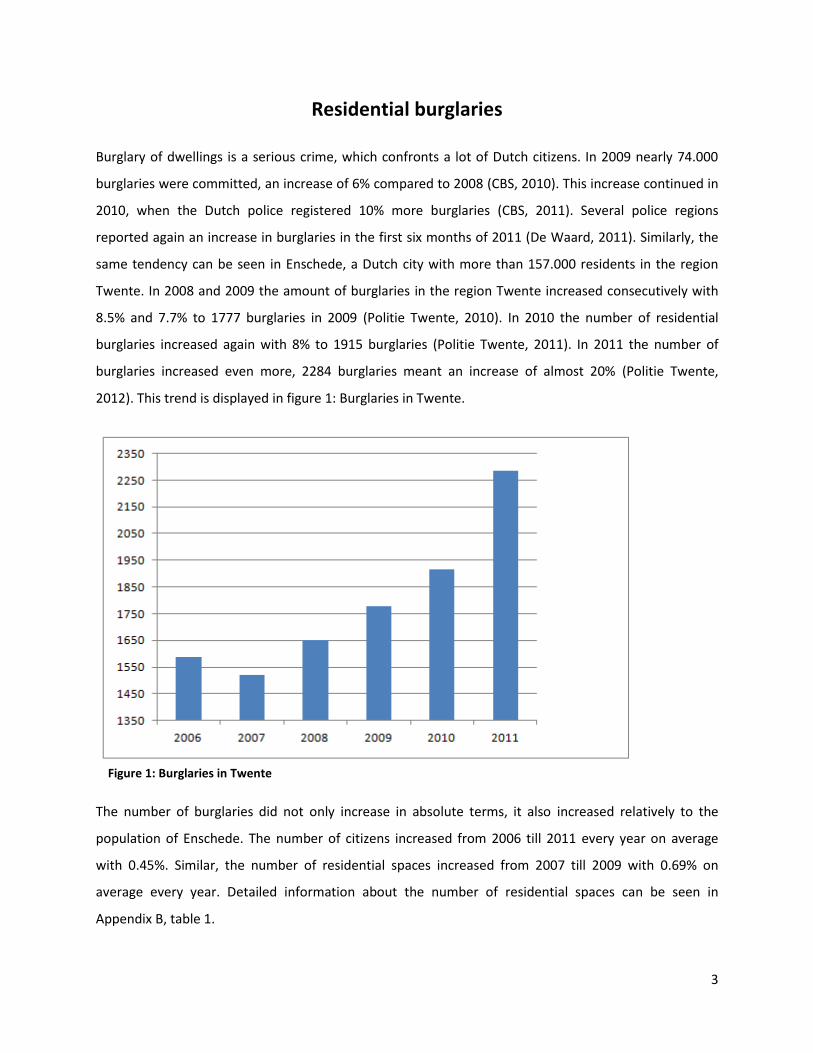
Twente. In 2008 and 2009 the amount of burglaries in the region Twente increased consecutively with
8.5% and 7.7% to 1777 burglaries in 2009 (Politie Twente, 2010). In 2010 the number of residential
burglaries increased again with 8% to 1915 burglaries (Politie Twente, 2011). In 2011 the number of
burglaries increased even more, 2284 burglaries meant an increase of almost 20% (Politie Twente,
2012). This trend is displayed in figure 1: Burglaries in Twente.
Figure 1: Burglaries in Twente
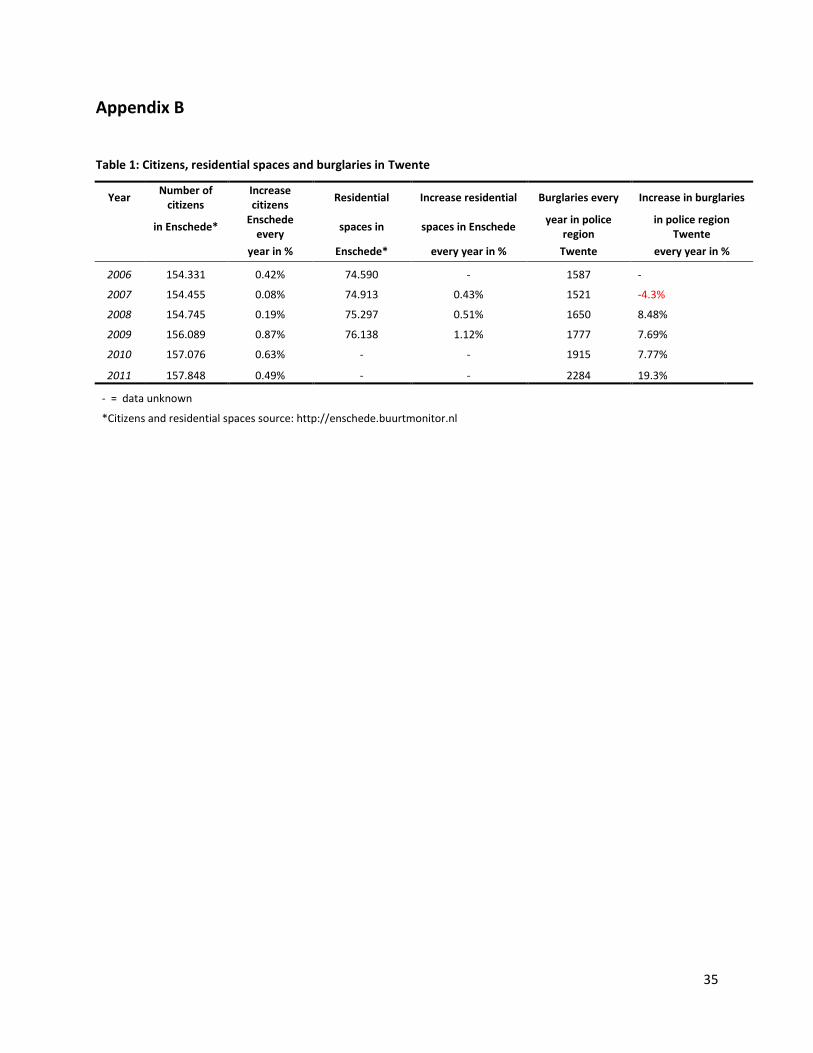
The number of burglaries did not only increase in absolute terms, it also increased relatively to the
population of Enschede. The number of citizens increased from 2006 till 2011 every year on average
with 0.45%. Similar, the number of residential spaces increased from 2007 till 2009 with 0.69% on
average every year. Detailed information about the number of residential spaces can be seen in
Appendix B, table 1.
4
A burglary has a significant impact on the victims and is therefore a crime feared among many citizens.
Besides financial damage there are large consequences for the victims, women in particular (Shover,
1991). Once a dwelling is burglarized, the chance of a repeat of the burglary is relatively higher (repeat
victimization). Houses in the nearby area are more at risk of getting burglarized or a burglary attempt
due to the fact that burglars are familiar with the area and the characteristics of the houses (Bernasco,
2008). Due to the large impact on victims and the annual increase of burglaries it is important to pay
attention to the prevention of burglaries. The social benefits of this research focus on the prevention of
burglaries by gaining more and better knowledge about burglaries in Twente.
Some approaches explain how burglars operate and why. In the next section the rational choice
perspective, the routine activities approach, opportunity, the crime pattern theory and crime prevention
through environmental design (CPTED) will be discussed.
1. Rational Choice Perspective
The rational choice perspective focuses on the decision-making process of the offender. This approach
assumes that an offence is a specific behavior and that the offender will benefit in some way. The word
‘rational’ in rational choice perspective means that an offender seeks for optimal utilization, just like an
economic model. Optimal means that the process differs for every offender. It therefore includes the
making of decisions and choices. Time, the cognitive attributes of an offender as well as the accessibility
of proper information are important aspects (Cornish & Clarke, 2008; Felson & Clarke, 1998). Burglars
consider the costs and benefits for every attempt to burglary. These cons consist not only of the trouble
they have to go through the process to commit a burglary, but also of the chances of getting caught. The
pros are often cash and/or assets, but it can also be the desire for psychological thrills (Ekblom, 1997;
Katz, 1988). These considerations are explained with the rational choice perspective and the opportunity
theory (Felson & Clarke, 1998).
The opportunity theory explains that the chance of committing a crime increases when the opportunity
is larger. This theory is connected to situational crime prevention. According to advocates of this theory,
every form of crime has something to do with opportunity. Even when an offender is motivated, without
opportunity there is no crime possible. This theory accounts for almost every type of crime. Felson and
Clark (1998) published ten principles of crime opportunity. They are briefly discussed below.

5
Crime opportunities are always specific, a single opportunity factor cannot account for every type of
crime. In case of a burglary a burglar might be looking for specific assets like cash and jewelry, while
another burglar might only be looking for expensive art. Opportunities are always concentrated in time
and space, there are enough places, people and properties that are not suitable for crime. On the
contrary, people that prevent criminal behavior like police officers, receptionists or security officers are
unable to be in place everywhere.
Another principle of the opportunity theory is that an offender easily gets involved in other crimes. An
example is a burglar who first steals certain goods and later sells the stolen goods or threatens the
residents during the burglary (Felson & Clarke, 1998).
Some products are more sensitive to crime than others. Burglars of dwellings often search for cash,
jewelry and electronic devices.
Social and technological changes lead to new crime opportunities. On the other hand, a lot of products
are no longer interesting for criminals, for example is a video recorder. Items like these will hardly be
stolen anymore, because they are no longer produced and barely used or because their resale value is
very low (Felson & Clarke, 1998).
Crime can be prevented when the opportunity is removed. Most people do this every day, for example
locking the door and putting away your money. Nevertheless, taking the opportunity away does not
automatically lead to displacement of crime.
Specific reduction of opportunity can reduce crime in space. An example is that the environment can
profit from certain safety measures. For example when a burglar alarm is installed in a dwelling, burglars
can evade dwellings in the direct neighborhood (Felson & Clarke, 1998). There is a diffusion of
prevention measures in the sense that the reduction covers a larger area than originally expected.
Another approach within Crime Science is the Routine Activities Approach. This approach originates
from the 70’s and states that when these three elements coincide the chances of a crime are significant:
A potential offender;
A suitable target;
6
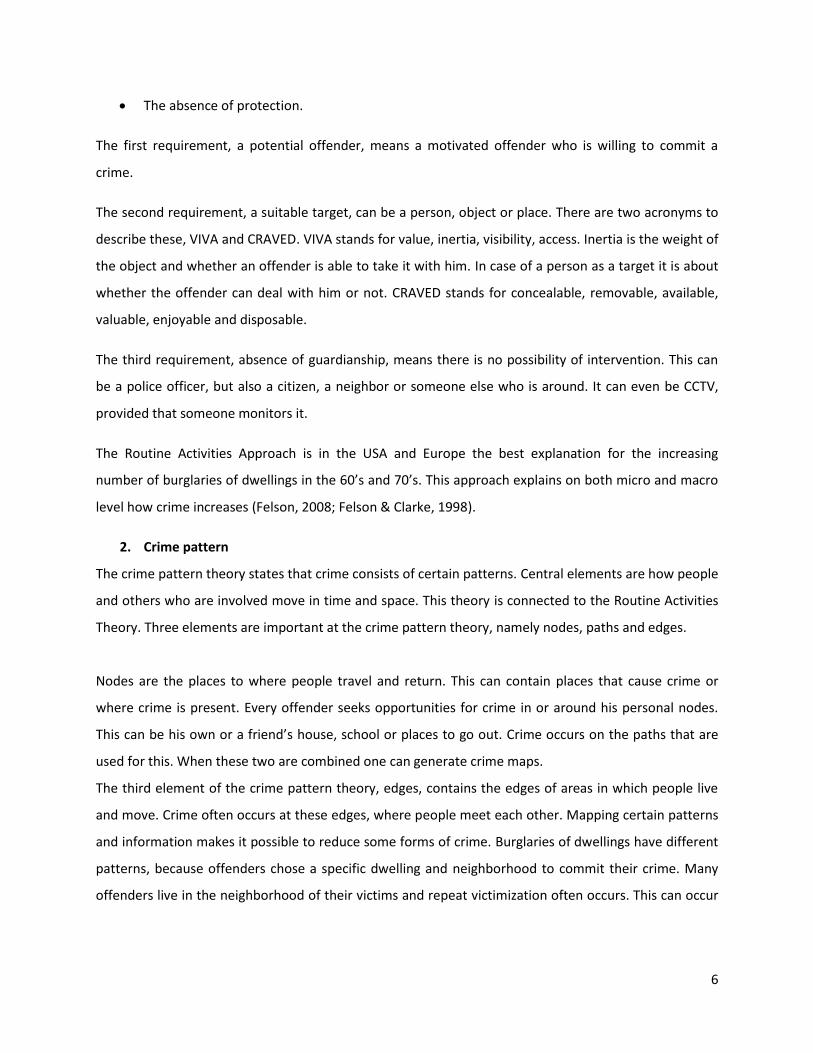
The absence of protection.
The first requirement, a potential offender, means a motivated offender who is willing to commit a
crime.
The second requirement, a suitable target, can be a person, object or place. There are two acronyms to
describe these, VIVA and CRAVED. VIVA stands for value, inertia, visibility, access. Inertia is the weight of
the object and whether an offender is able to take it with him. In case of a person as a target it is about
whether the offender can deal with him or not. CRAVED stands for concealable, removable, available,
valuable, enjoyable and disposable.
The third requirement, absence of guardianship, means there is no possibility of intervention. This can
be a police officer, but also a citizen, a neighbor or someone else who is around. It can even be CCTV,
provided that someone monitors it.
The Routine Activities Approach is in the USA and Europe the best explanation for the increasing
number of burglaries of dwellings in the 60’s and 70’s. This approach explains on both micro and macro
level how crime increases (Felson, 2008; Felson & Clarke, 1998).
2. Crime pattern
The crime pattern theory states that crime consists of certain patterns. Central elements are how people
and others who are involved move in time and space. This theory is connected to the Routine Activities
Theory. Three elements are important at the crime pattern theory, namely nodes, paths and edges.
Nodes are the places to where people travel and return. This can contain places that cause crime or
where crime is present. Every offender seeks opportunities for crime in or around his personal nodes.
This can be his own or a friend’s house, school or places to go out. Crime occurs on the paths that are
used for this. When these two are combined one can generate crime maps.
The third element of the crime pattern theory, edges, contains the edges of areas in which people live
and move. Crime often occurs at these edges, where people meet each other. Mapping certain patterns
and information makes it possible to reduce some forms of crime. Burglaries of dwellings have different
patterns, because offenders chose a specific dwelling and neighborhood to commit their crime. Many
offenders live in the neighborhood of their victims and repeat victimization often occurs. This can occur
7
to a house that is already burglarized, but also dwellings in the direct environment. Offenders already
know the area and layout of the dwelling (Felson & Clarke, 1998).
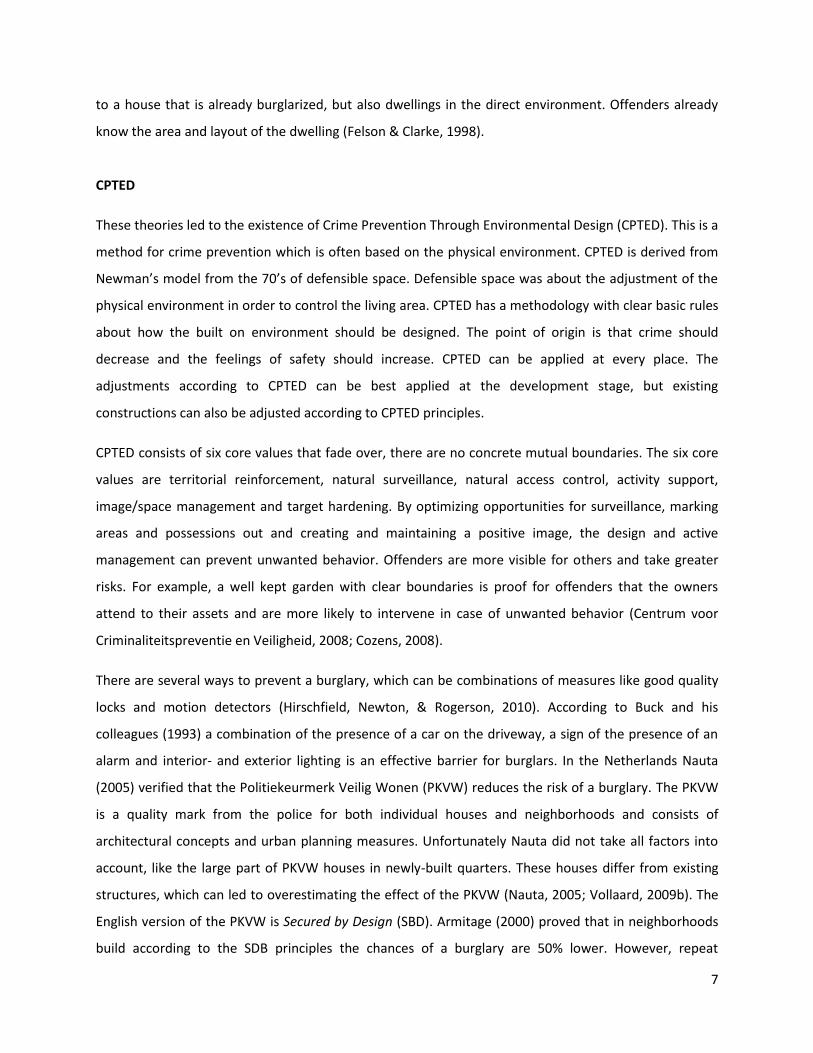
CPTED
These theories led to the existence of Crime Prevention Through Environmental Design (CPTED). This is a
method for crime prevention which is often based on the physical environment. CPTED is derived from
Newman’s model from the 70’s of defensible space. Defensible space was about the adjustment of the
physical environment in order to control the living area. CPTED has a methodology with clear basic rules
about how the built on environment should be designed. The point of origin is that crime should
decrease and the feelings of safety should increase. CPTED can be applied at every place. The
adjustments according to CPTED can be best applied at the development stage, but existing
constructions can also be adjusted according to CPTED principles.
CPTED consists of six core values that fade over, there are no concrete mutual boundaries. The six core
values are territorial reinforcement, natural surveillance, natural access control, activity support,
image/space management and target hardening. By optimizing opportunities for surveillance, marking
areas and possessions out and creating and maintaining a positive image, the design and active
management can prevent unwanted behavior. Offenders are more visible for others and take greater
risks. For example, a well kept garden with clear boundaries is proof for offenders that the owners
attend to their assets and are more likely to intervene in case of unwanted behavior (Centrum voor
Criminaliteitspreventie en Veiligheid, 2008; Cozens, 2008).
There are several ways to prevent a burglary, which can be combinations of measures like good quality
locks and motion detectors (Hirschfield, Newton, & Rogerson, 2010). According to Buck and his
colleagues (1993) a combination of the presence of a car on the driveway, a sign of the presence of an
alarm and interior- and exterior lighting is an effective barrier for burglars. In the Netherlands Nauta
(2005) verified that the Politiekeurmerk Veilig Wonen (PKVW) reduces the risk of a burglary. The PKVW
is a quality mark from the police for both individual houses and neighborhoods and consists of
architectural concepts and urban planning measures. Unfortunately Nauta did not take all factors into
account, like the large part of PKVW houses in newly-built quarters. These houses differ from existing
structures, which can led to overestimating the effect of the PKVW (Nauta, 2005; Vollaard, 2009b). The
English version of the PKVW is Secured by Design (SBD). Armitage (2000) proved that in neighborhoods
build according to the SDB principles the chances of a burglary are 50% lower. However, repeat
8
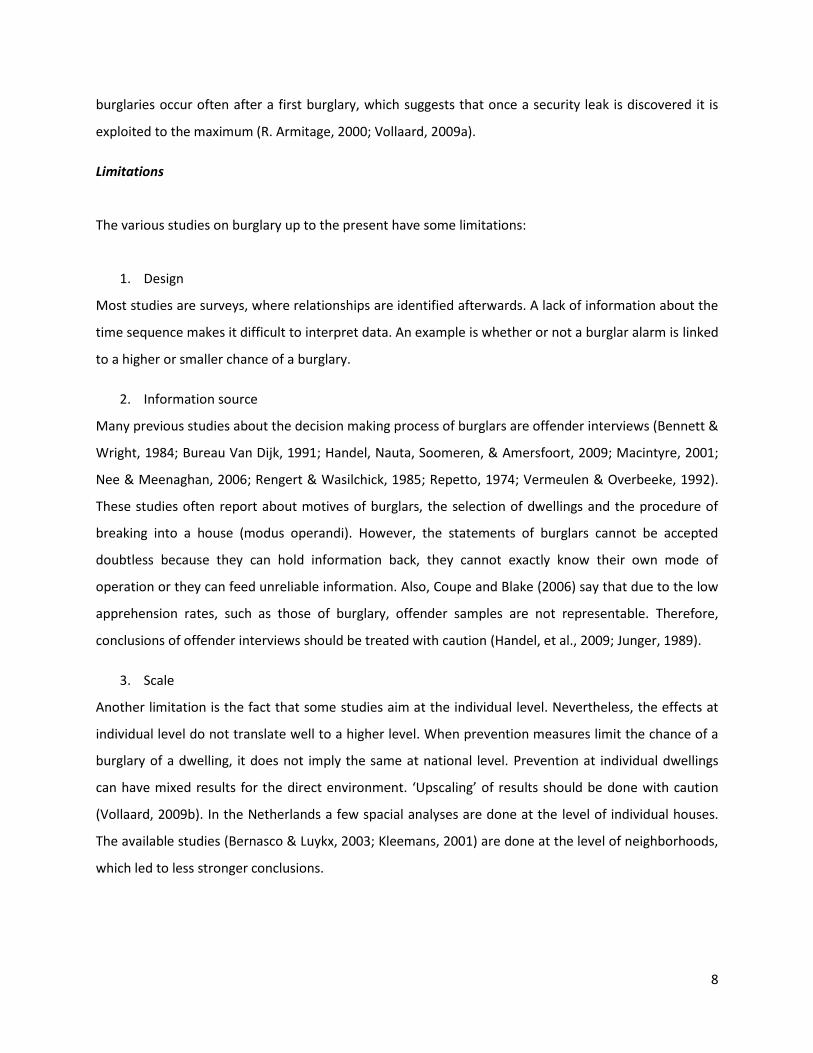
burglaries occur often after a first burglary, which suggests that once a security leak is discovered it is
exploited to the maximum (R. Armitage, 2000; Vollaard, 2009a).
Limitations
The various studies on burglary up to the present have some limitations:
1. Design
Most studies are surveys, where relationships are identified afterwards. A lack of information about the
time sequence makes it difficult to interpret data. An example is whether or not a burglar alarm is linked
to a higher or smaller chance of a burglary.
2. Information source
Many previous studies about the decision making process of burglars are offender interviews (Bennett &
Wright, 1984; Bureau Van Dijk, 1991; Handel, Nauta, Soomeren, & Amersfoort, 2009; Macintyre, 2001;
Nee & Meenaghan, 2006; Rengert & Wasilchick, 1985; Repetto, 1974; Vermeulen & Overbeeke, 1992).
These studies often report about motives of burglars, the selection of dwellings and the procedure of
breaking into a house (modus operandi). However, the statements of burglars cannot be accepted
doubtless because they can hold information back, they cannot exactly know their own mode of
operation or they can feed unreliable information. Also, Coupe and Blake (2006) say that due to the low
apprehension rates, such as those of burglary, offender samples are not representable. Therefore,
conclusions of offender interviews should be treated with caution (Handel, et al., 2009; Junger, 1989).
3. Scale
Another limitation is the fact that some studies aim at the individual level. Nevertheless, the effects at
individual level do not translate well to a higher level. When prevention measures limit the chance of a
burglary of a dwelling, it does not imply the same at national level. Prevention at individual dwellings
can have mixed results for the direct environment. ‘Upscaling’ of results should be done with caution
(Vollaard, 2009b). In the Netherlands a few spacial analyses are done at the level of individual houses.
The available studies (Bernasco & Luykx, 2003; Kleemans, 2001) are done at the level of neighborhoods,
which led to less stronger conclusions.
9
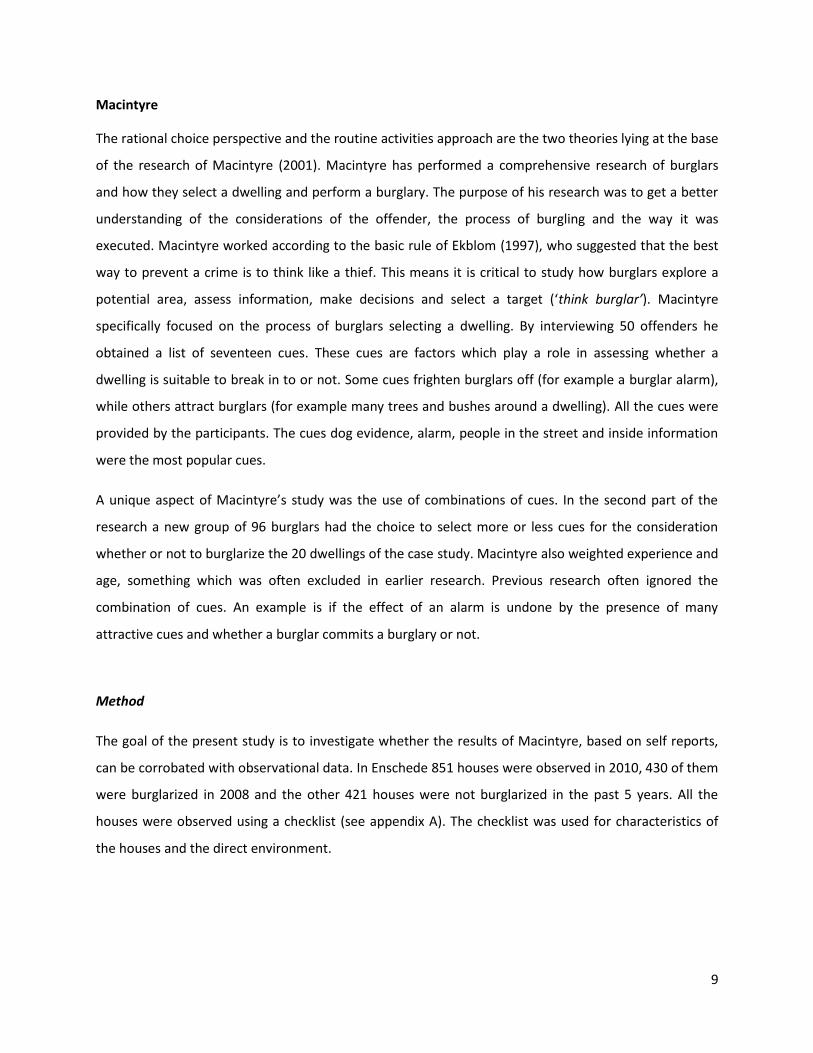
Macintyre
The rational choice perspective and the routine activities approach are the two theories lying at the base
of the research of Macintyre (2001). Macintyre has performed a comprehensive research of burglars
and how they select a dwelling and perform a burglary. The purpose of his research was to get a better
understanding of the considerations of the offender, the process of burgling and the way it was
executed. Macintyre worked according to the basic rule of Ekblom (1997), who suggested that the best
way to prevent a crime is to think like a thief. This means it is critical to study how burglars explore a
potential area, assess information, make decisions and select a target (‘think burglar’). Macintyre
specifically focused on the process of burglars selecting a dwelling. By interviewing 50 offenders he
obtained a list of seventeen cues. These cues are factors which play a role in assessing whether a
dwelling is suitable to break in to or not. Some cues frighten burglars off (for example a burglar alarm),
while others attract burglars (for example many trees and bushes around a dwelling). All the cues were
provided by the participants. The cues dog evidence, alarm, people in the street and inside information
were the most popular cues.
A unique aspect of Macintyre’s study was the use of combinations of cues. In the second part of the
research a new group of 96 burglars had the choice to select more or less cues for the consideration
whether or not to burglarize the 20 dwellings of the case study. Macintyre also weighted experience and
age, something which was often excluded in earlier research. Previous research often ignored the
combination of cues. An example is if the effect of an alarm is undone by the presence of many
attractive cues and whether a burglar commits a burglary or not.
Method
The goal of the present study is to investigate whether the results of Macintyre, based on self reports,
can be corrobated with observational data. In Enschede 851 houses were observed in 2010, 430 of them
were burglarized in 2008 and the other 421 houses were not burglarized in the past 5 years. All the
houses were observed using a checklist (see appendix A). The checklist was used for characteristics of
the houses and the direct environment.

10
Research questions
The study will make a comparison between the cues of Macintyre and the burglaries in Enschede and
has the following main research question:
Are factors that are presented by burglars as ‘attractive’ in self-report studies related to burglaries in
an observational study?
The main research question will be answered with the following specific research questions:
1. Are houses in Enschede with unattractive cues significantly less burglarized and houses in
Enschede with attractive cues significantly more burglarized?
2. Which combinations of cues are related to a higher or lower chance of a burglary in Enschede?
Cues
The next section shows the cues and the expectations for the observational data from Enschede.
Cue 1: Evidence of a dog
According to many burglars a dog is an important factor which decides whether a burglary will succeed
or fail. In Macintyre’s study a dog is one of the four most important deterrent factors. Many other
researchers agree with this finding (Bennett & Wright, 1984; Centrum voor Criminaliteitspreventie en
Veiligheid, 2008; Rebscher, 1990; Wright & Decker, 1994). Some studies found that a dog has little or no
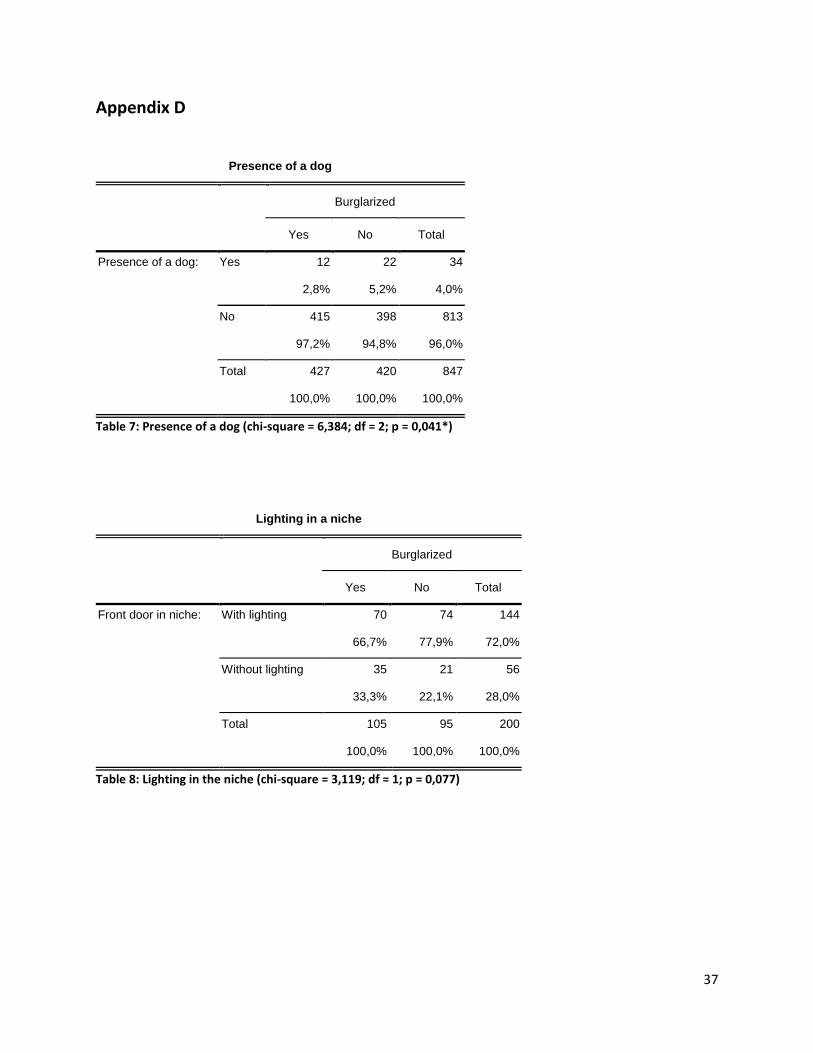
effect on burglars (Hakim & Buck, 1992; Hough, 1987). The expectation is that in Enschede houses with
evidence of a dog present are significantly less burglarized.
Cue 2: Lightning around the house
Lighting around a house should deter burglars, according to Macintyre. Poyner (1993) reviewed 122
evaluations of crime prevention project and found that there is some evidence that lighting prevents
residential burglaries. Street lighting is available at nearly every house in Enschede and too general to
test. In Enschede this cue is tested on houses with motion sensing lights. Lighting in a niche is also
tested. The expectation is that houses with motion sensing lights and lighting in a niche are less
burglarized.
11
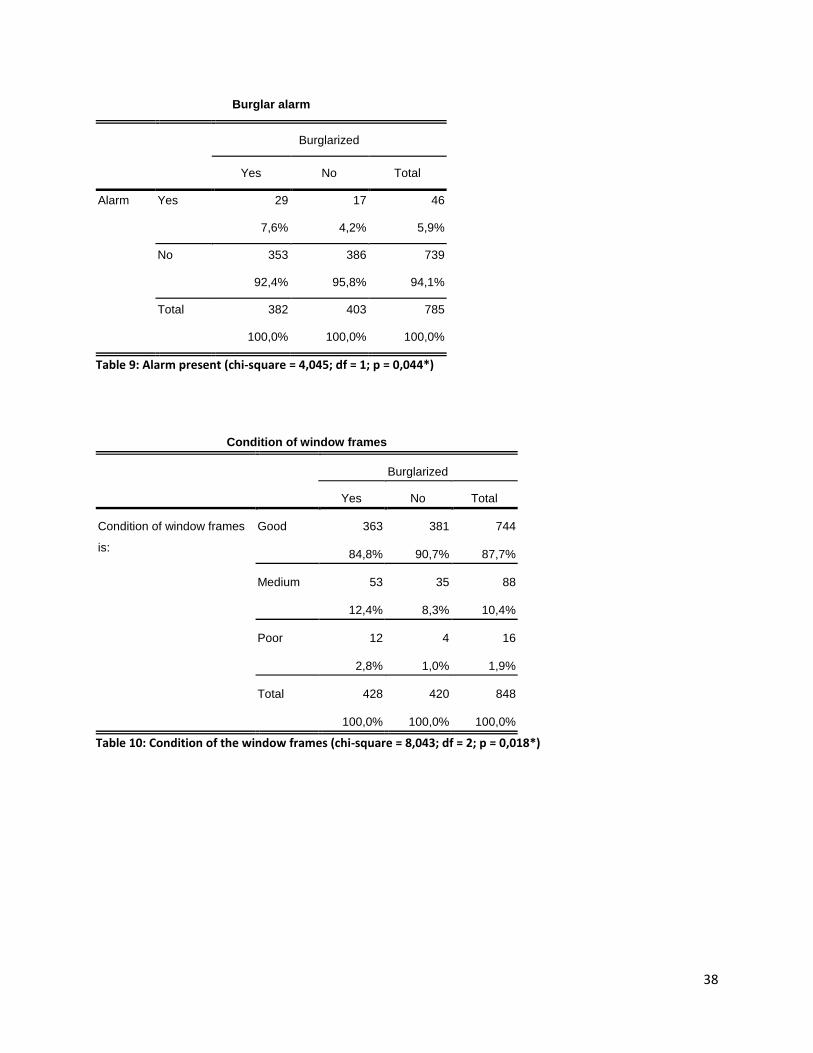
Cue 3: Signs of an alarm
A burglar alarm is one of the most relevant cues of Macintyre. Burglars indicate they usually avoid
houses with an alarm. Multiple studies confirm the preventive operation of a burglar alarm (Buck, et al.,
1993; Budd, 1999; Hakim, Shachmurove, & Fishman, 1998; Hearnden & Magill, 2004; Lee, 2008). The
expectation is that houses in Enschede with a burglar alarm are less burglarized.
Cue 4: Lighting, radio or TV turned on in house
The fourth cue of Macintyre is that the lights, radio or TV are turned on in the house, also called signs of
presence. Several studies endorse the opinion of the burglars and support that signs of presence are a
deterrent for burglars (Bennett & Wright, 1984; Hakim & Buck, 1992). Unfortunately the consequences
of signs of presence cannot be tested in this study, because these factors were not included in the
checklist.
Cue 5: Car at the driveway
A car in the driveway is often seen as a deterrent. For burglars it is a sign that someone is home (Bennett
& Wright, 1984; Hakim & Buck, 1992; Hough, 1987; Rebscher, 1990). This cue cannot be tested for this
study, because the houses in Enschede were only checked for having a driveway.
Cue 6: Luxury
The participants of Macintyre indicated that they weigh the degree of luxury in their decision making
process whether to burglarize a house or not. An expensive looking house is more often burglarized
than an average looking house. Usually it is not only about the house, but for example a well kept
garden is an indicator as well. Other studies support this cue, some conclude it is a very important cue
for the decision making process of burglars (Bennett & Wright, 1984; Hough, 1987; Rebscher, 1990;
Taylor & Nee, 1988; Wright & Decker, 1994). Wright, Logie and Decker (1995) found no significant
influence for this cue. The expectation is that in Enschede expensive houses and houses with a well kept
garden are more burglarized.
Cue 7: Doors and windows
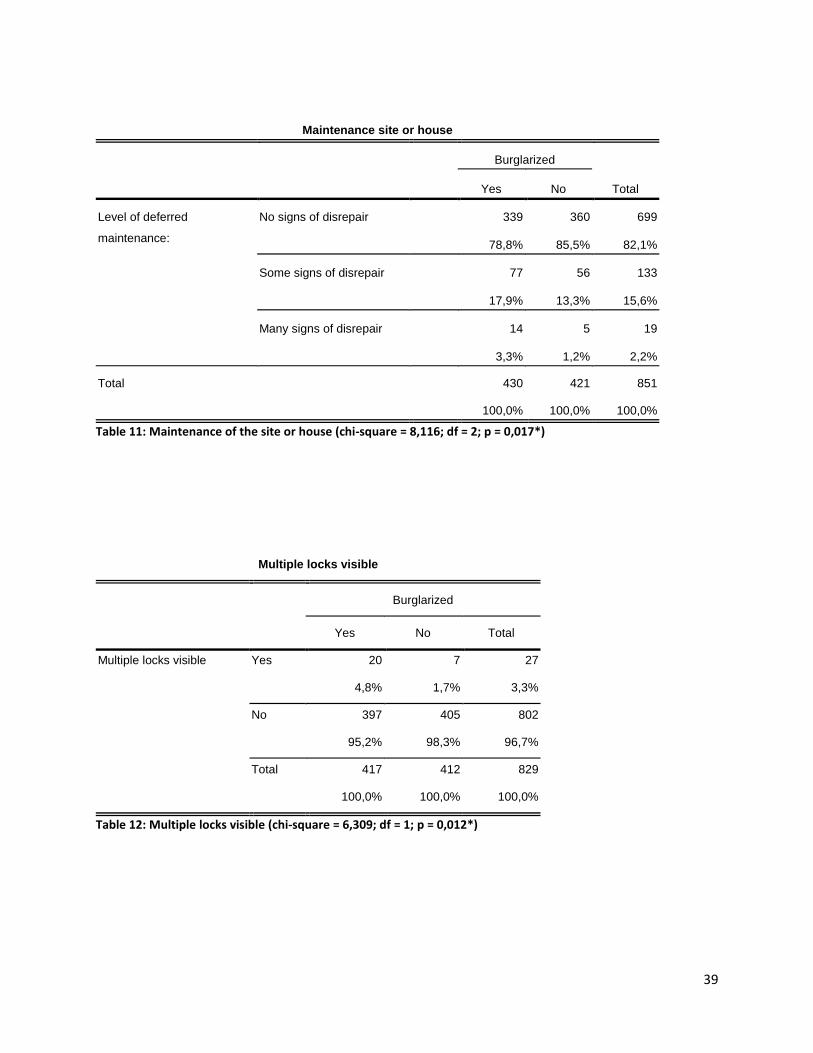
The seventh cue is the quality of doors and windows. The participants indicated that houses with bad
maintained doors and windows are more attractive to burglarize. It makes it easier to force a door or
12
window. This cue belongs to target hardening, one of the strategies of CPTED. Target hardening is the
stopping or reducing of access to a target. This is done with physical barriers as locks, gates and
surveillances (Cozens, 2008). In Enschede the expectation is that houses with one or many signs of
deferred maintenance are more burglarized than houses with well maintained doors and windows.
Cue 8: Locks
The eight cue concerns having good and multiple locks on doors and windows. Like cue seven this
belongs to target hardening. In the literature there is no consensus about the effect of locks. Some
studies show that locks have little effect (Bennett & Wright, 1984; Wright & Decker, 1994), while other
studies found evidence for certain locks (Hakim & Buck, 1992; Tilley & Webb, 1994). The expectation is
that houses in Enschede with multiple locks are significantly less burglarized than houses with fewer
locks.
Cue 9: Garage
The ninth cue concerns the quality of locks from garages. This cue is not often discussed in the
literature, because of the concentration on habitats of households and not individual households. The
participants of Macintyre indicated they often stole something from garages, when they were not
locked properly. A garage often contains assets that can be sold easily, like a scooter. When houses are
occupied the garage can be an alternative, but in addition a garage can also be used to gain access to a
house, provided there is a passage to the house. The participants stated that new looking garages with
proper locks are deterrent while old and poorly sealed garages are more attractive. During the study in
Enschede houses were only coded as having a garage, not what the quality of locks was. Therefore this
cue cannot be tested.
Cue 10: Fence
The tenth cue concerns the fence around a house and garden. The participants stated that they prefer
not to burglarize a house with a high and closed fence (1.80m). Breaking the fence or climbing over the
fence is too much effort in combination with the chance of getting caught. Burglars prefer houses with a
small fence (30 to 50 cm maximum). The expectation is that houses with a high and closed fence are less
burglarized than houses with a small fence or no fence at all.
Cue 11: Garden
13
Most participants stated they have a strong preference for a house with a garden surrounded by trees
and bushes. This makes them less visible for other people during the burglary. Studies from Bennet and
Wright (1984) and Rebscher (1990) share this view, while Taylor and Nee (1988) found no evidence for
this preference. The expectation is that in Enschede houses with a high border, consisting of stinging or
non-stinging bushes, are more burglarized than houses with a small border and without bushes.
Cue 12: Location house
This cue concerns the type of house. The participants of Macintyre’s study stated they prefer breaking
into a corner house than a terraced house. There are many clues in the literature about corner houses
being more vulnerable to a burglary (Hakim & Buck, 1992; Repetto, 1974; Taylor & Nee, 1988). The main
reason is that corner houses have more retrieval capabilities. The expectation is that in Enschede corner
houses suffer more burglaries than terraced houses.
Cue 13: People in the street
This cue concerns the physical attendance of people in the street. This can be groups of loitering people,
but also neighbors mowing the grass or just being present outside. In Macintyre’s study the presence of
people is a strong deterrent and the other way around absence is very conducive. Therefore the
expectation is that houses with people in the street are less burglarized than houses without people
present in the street.
Cue 14: Neighborhood watch
The fourteenth cue concerns houses in an area with neighborhood watch. In these neighborhoods
citizens invigilate in their own neighborhood, in order to prevent burglaries and other crimes. Not many
participants presented this cue, but it is seen as a deterrent. The expectation is that in Enschede in
neighborhood watch areas less burglaries are committed.
Cue 15: Weather
Little is known about the factor weather conditions in relation to burglaries in the literature.
Nevertheless some of Macintyre’s participants brought this cue to attention. They state they prefer a
burglary when it is windy weather, because the noise of a burglary is harder to hear. The expectation is
that in Enschede more burglaries are performed at windy weather than at normal weather conditions.
14
Cue 16: Inside information
Having ‘inside information’ is still a common used cue for burglaries. Besides the findings of Macintyre’s
participants, Wright and Decker (1994) reported that one fifth of the burglars break in to a house of
people they know. Another study found that 17% of the burglars occasionally knows the victims of their
burglaries and 34% knows them very well (Budd, 1999). Unfortunately this cue cannot be tested in this
study, because information of burglars was not used.
Cue 17: Street type
The last cue concerns the street type of houses. Bennet and Wright (1984) and Taylor and Nee (1988)
state that a house is more attractive when it has more retrieval capabilities. Macintyre’s participants
state they prefer not to break into houses in a cul-de-sac, this makes them too much visible during the
burglary. Some burglars indicated they perform a burglary when there is proper access to the back. This
can be a footpath or a bicycle path behind the house. Furthermore they prefer busy and medium streets
regarding traffic intensity, this makes them less visible when committing a burglary. The expectation is
that (a) houses in a dead end street are less burglarized than houses with another street type, (b) houses
with a bicycle- and/or footpath at the back are more burglarized than houses without a path at the back
and (c) houses in a medium or busy street are more burglarized than houses in a quiet street.
15
Methods
This section explains the used methods and techniques for the study and explains how validity is dealt
with.
Sample
The sample is drawn in Enschede, a Dutch city with approximately 131.500 citizens. 851 houses were
observed in 2010, 430 of them (the cases) were burglarized in 2008 and the other 421 houses (the
control group) were not burglarized in the last 5 years. The list of burglarized houses was obtained from
the police region Twente. The non burglarized houses were selected with a random, disproportionate
sample. This was also performed by the police region Twente. Only houses and apartments on the
ground floor are part of the study, all other buildings are excluded. The checklist was not suitable for
other buildings and apartments, which were hard to observe due to the physical design. Due to practical
reasons only houses in the city of Enschede were chosen, it was not feasible to involve surrounding
houses in the municipality Enschede in this study.
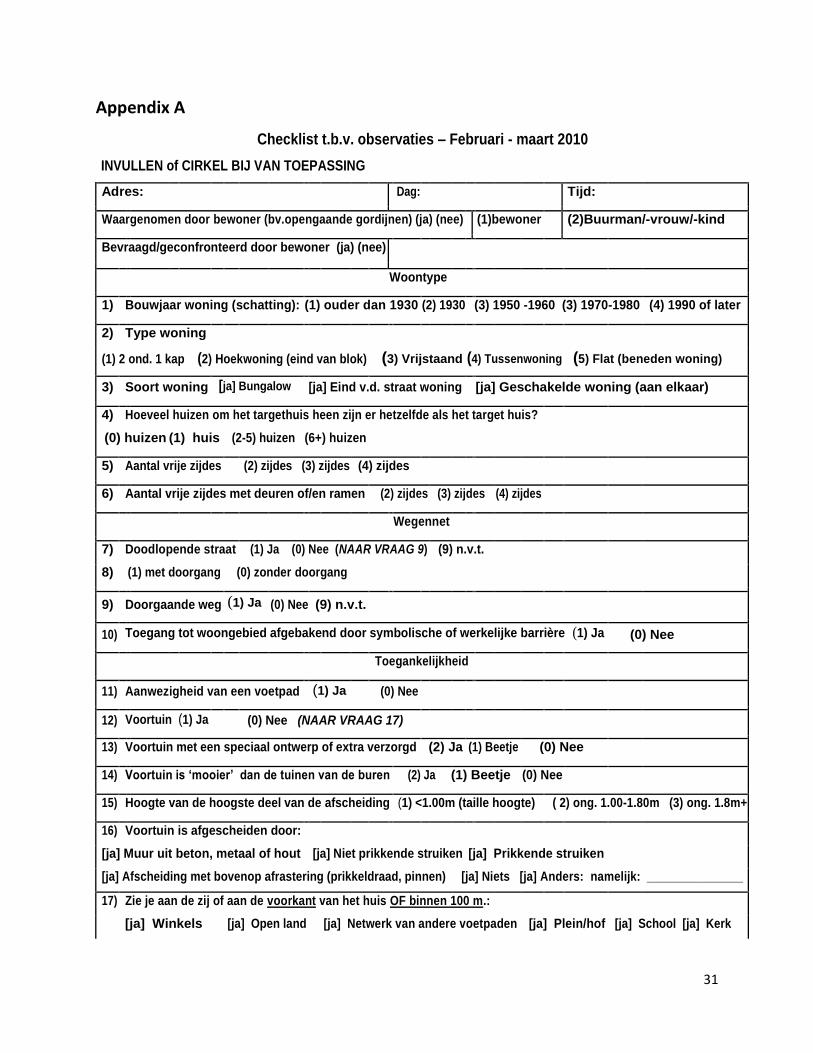
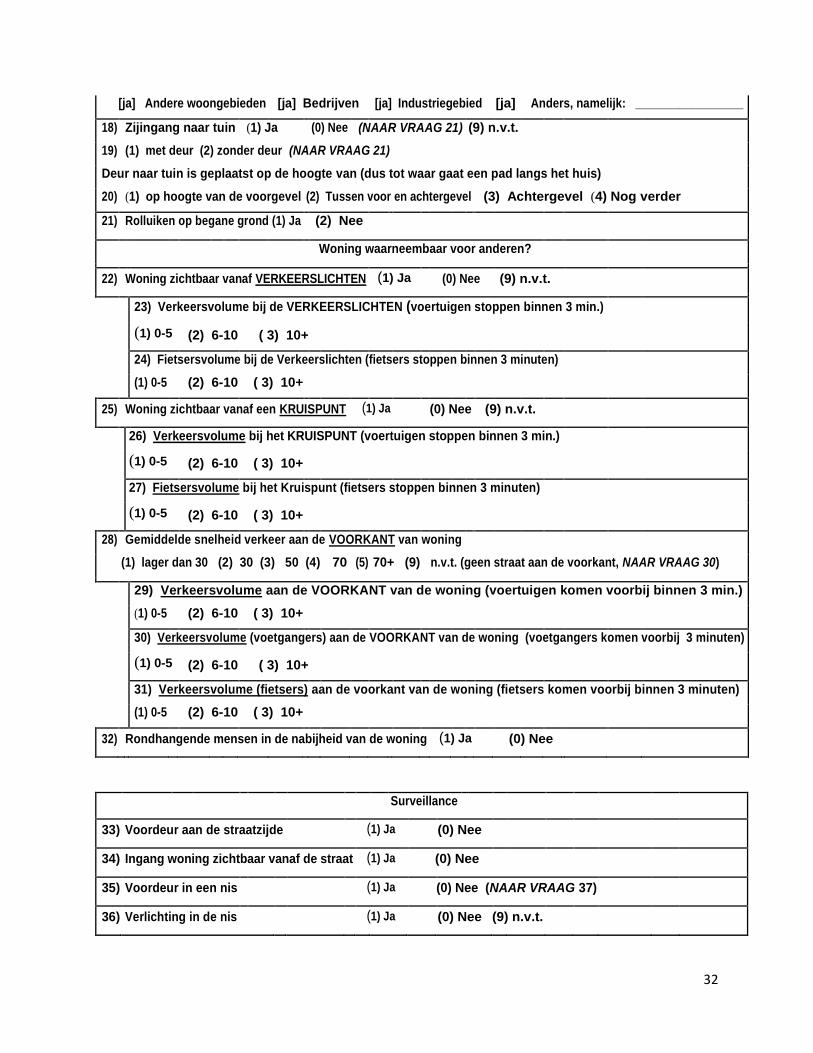
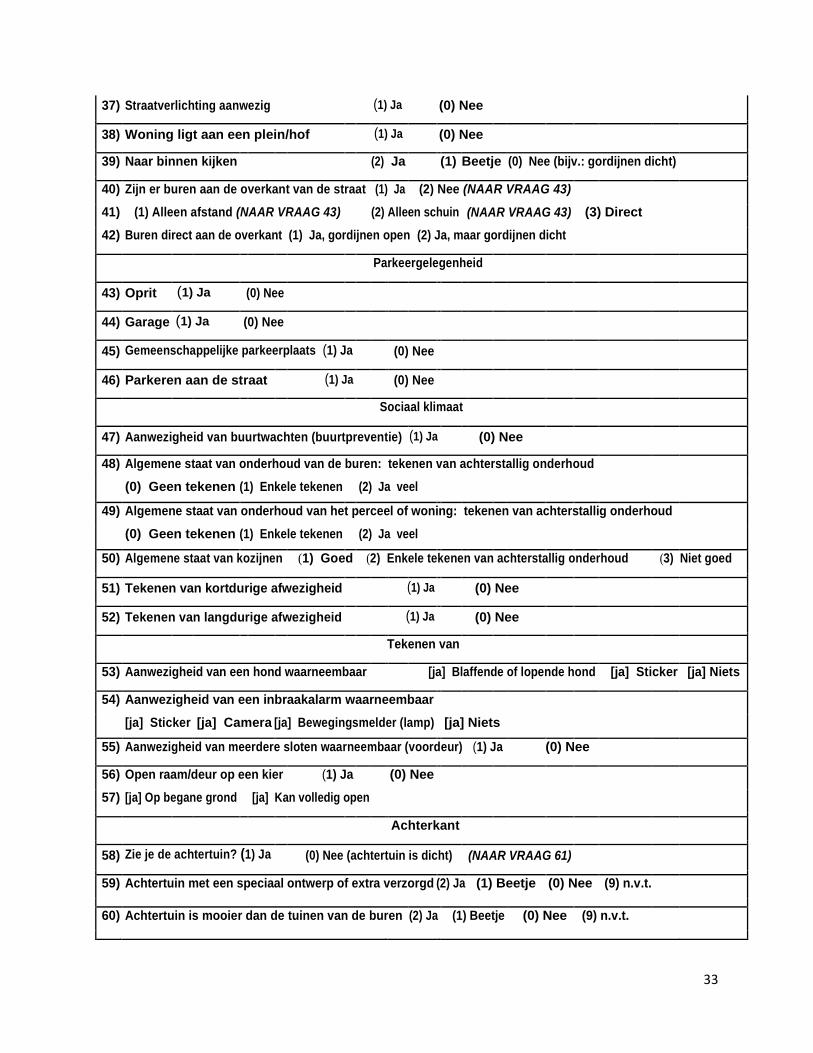
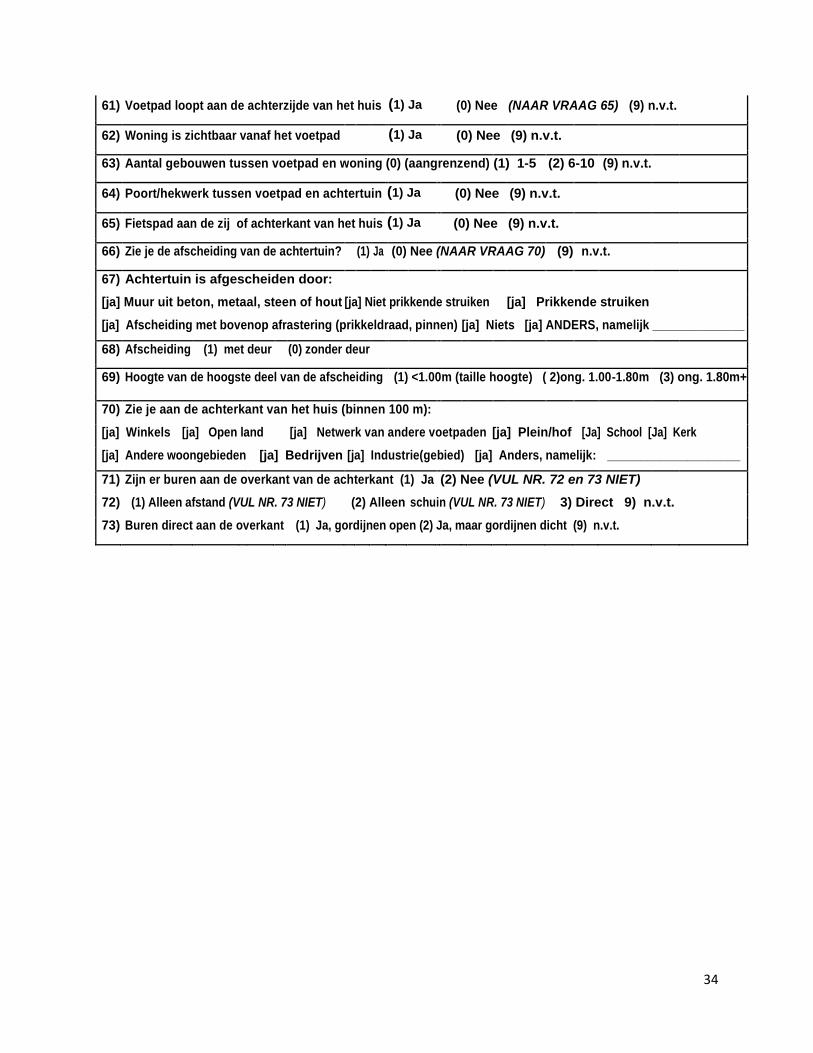
Data collection
All the houses are observed using a checklist, based on similar research in England. This checklist is
based on a list of the University of Huddersfield, developed by Rachel Armitage (2007). This checklist has
been adjusted to the Dutch situation and enlarged with extra characteristics (see appendix A). It was
used to check on characteristics of the houses and the direct environment. The checklist consists of nine
parts: housing type, network of the roads, accessibility, perception for others, parking area, surveillance,
social climate, signs of security measures and information about the rear side of the house.
The observing was done by a team of six students of the University of Twente. The observations were
done from the street and/or bicycle- and footpaths. All the observations took place from February till
May 2010. The observations were only performed on workdays from 10:00 AM till 3:00 PM, conforming
to the times and days of Armitage to increase the reliability.
Concepts
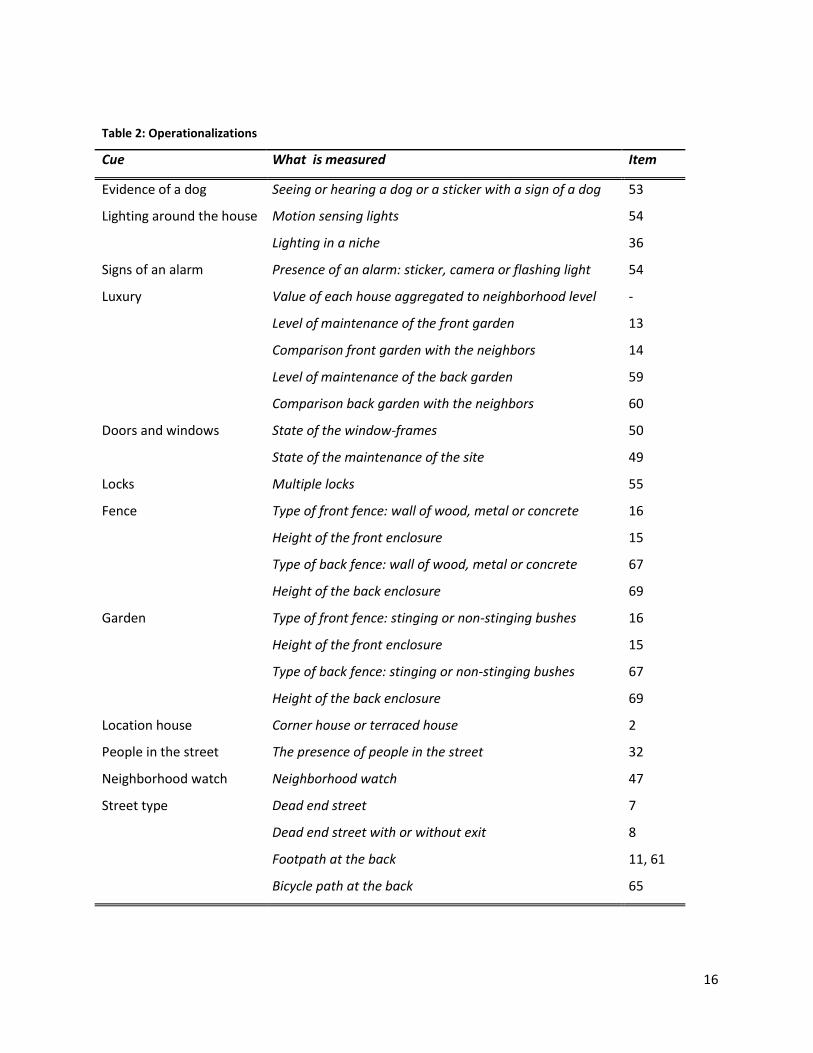
The cues from Macintyre were measured with several characteristics from the observational data from
Enschede. The table below (table 2: Operationalizations) displays how every cue is measured and coded.
References are made to the corresponding items of the checklist (see Appendix A).
16
Table 2: Operationalizations
Cue What is measured Item
Evidence of a dog Seeing or hearing a dog or a sticker with a sign of a dog 53
Lighting around the house Motion sensing lights 54
Lighting in a niche 36
Signs of an alarm Presence of an alarm: sticker, camera or flashing light 54
Luxury Value of each house aggregated to neighborhood level -
Level of maintenance of the front garden 13
Comparison front garden with the neighbors 14
Level of maintenance of the back garden 59
Comparison back garden with the neighbors 60
Doors and windows State of the window-frames 50
State of the maintenance of the site 49
Locks Multiple locks 55
Fence Type of front fence: wall of wood, metal or concrete 16
Height of the front enclosure 15
Type of back fence: wall of wood, metal or concrete 67
Height of the back enclosure 69
Garden Type of front fence: stinging or non-stinging bushes 16
Height of the front enclosure 15
Type of back fence: stinging or non-stinging bushes 67
Height of the back enclosure 69
Location house Corner house or terraced house 2
People in the street The presence of people in the street 32
Neighborhood watch Neighborhood watch 47
Street type Dead end street 7
Dead end street with or without exit 8
Footpath at the back 11, 61
Bicycle path at the back 65
17
The observational data did not provide information about the values of the houses. The website
Buurtmonitor Enschede1 provided the WOZ values of the houses at neighborhood level. The data did
neither include information about the weather conditions at the time of the burglaries. Brunninkhuis
(2010) performed a study2 in Enschede to investigate if burglaries are related to weather conditions.
This study will be used as a reference for this cue.
Before the observations took place, every student observed the same 20 random selected houses as
pilot. As the sample, half of these houses were burglarized. This was done to increase the reliability with
a reliability analysis: Cohen’s kappa coefficient.
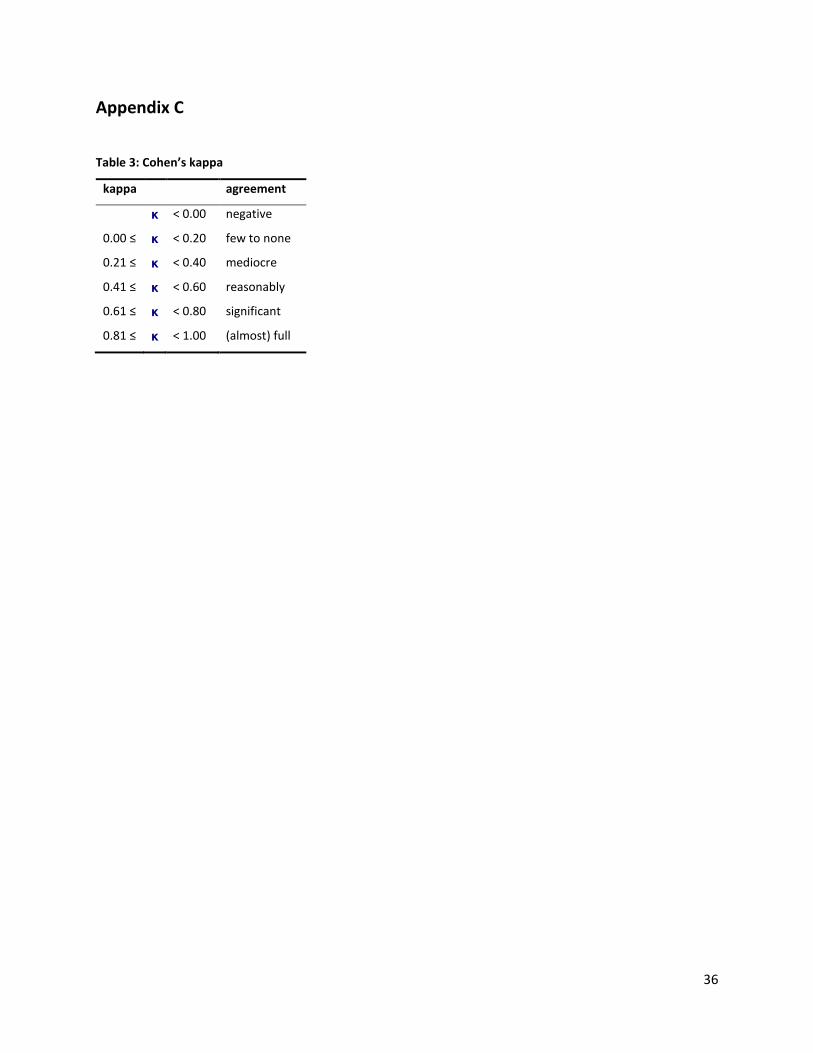
Cohen’s kappa is a statistical measure of inter-rater agreement. It can be used to measure the degree of
agreement between two observers (or more). The scores of kappa are corrected for being created at
random. A score of ‘0’ means no agreement, ‘1’ is almost complete agreement (Tseloni, Wittebrood,
Farrell, & Pease, 2004). See appendix C, table 3 for a commonly used distribution.
Some items of the checklist were subjective and/or time specific. They were not taken into account
when kappa was calculated. For example the traffic intensity is very time specific. 60% of the checklist
items were sufficient with a score of 0.20 or higher. 30% of the checklist items scored higher than 0.40.
These scores led to extra meetings to tighten and/or rephrase definitions.
Analysis
Most cues are dichotomous variables and therefore analyzed with cross tabular statistics and the
Pearson Chi Square. The values of houses are continuous variables and therefore an independent
sample t-test is used. A multiple logistic regression analyses is used for all the cues to predict the
probability of houses getting burglarized. A variance inflation factor (VIF) was calculated for every cue,
all values were below 10, which shows no collinearity in the data (Field, 2005).
1 http://www.enschede.buurtmonitor.nl
2 Brunninkhuis, K. (2010). Invloed van weersomstandigheden op het aantal woninginbraken in de periode 2004 t/m
2008 in de gemeente Enschede. Enschede, University of Twente.
18
Results
Table 4: Summary burglarized and non burglarized houses, in %, divided into the core values of CPTED
Observed Burglarized Not burglarized Consistent with
% (N total) % (N total) Macintyre?
Natural Surveillance People in the street* 11.9 (430) 17.4 (420) Yes
Neighborhood watch 3.0 (429) 2.9 (420) No
Car traffic volume (medium & high) 18.3 (415) 18.4 (402) No
Pedestrians (medium & high)a 5.7 (426) 3.8 (419) Yes
Bicycles (medium & high) 11.9 (427) 14.3 (419) No
Wind speed - - No
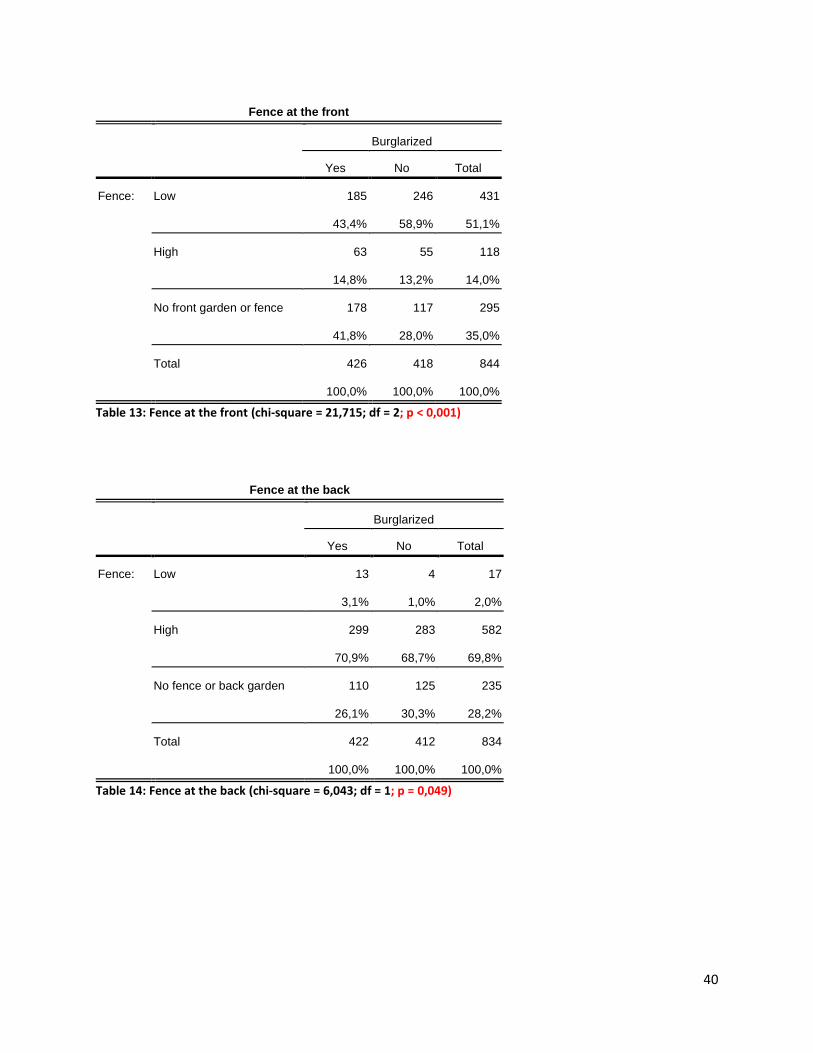
Natural Access Control High front fence* 14.8 (426) 13.2 (418) No
High back fence* 70.9 (422) 68.7 (412) No
High border garden with bushes 14.8 (425) 13.2 (418) Yes
Footpath at the rear 46.2 (426) 46.2 (420) No
Bicycle path at the rear 4.7 (422) 4.5 (418) Yes
Corner house*** 26.3 (430) 95.0 (420) Yes
Terraced house*** 30.2 (430) 36.9 (420) Yes
Dead-end street 14.7 (430) 13.6 (420) No
Dead-end street without exit 2.4 (421) 2.9 (419) No
Dead-end street with exit 10.5 (422) 10.5 (419) No
Image/space Management Special front garden 7.5 (429) 11.5 (419) No
Front garden nicer than neighbors 4.7 (429) 4.1 (419) Yes
Back garden nicer than neighbors 1.2 (429) 0.5 (421) Yes
Condition of window frames (deferred)* 15.2 (428) 9.3 (420) Yes
Maintenance site or house (bad)* 21.2 (430) 14.5 (421) Yes
Value houses (high) a - - No
Target Hardening Presence of a dog* 2.8 (427) 5.2 (420) Yes
Burglar alarm* 7.6 (382) 4.2 (403) No
Motion sensing light 8.4 (427) 10.5 (419) Yes
Lighting in the nichea 16.6 (422) 17.8 (415) Yes
Multiple locks visible* 4.8 (417) 1.7 (412) No
ap<.1
*p<.05 **p<.01 ***p<.001
19
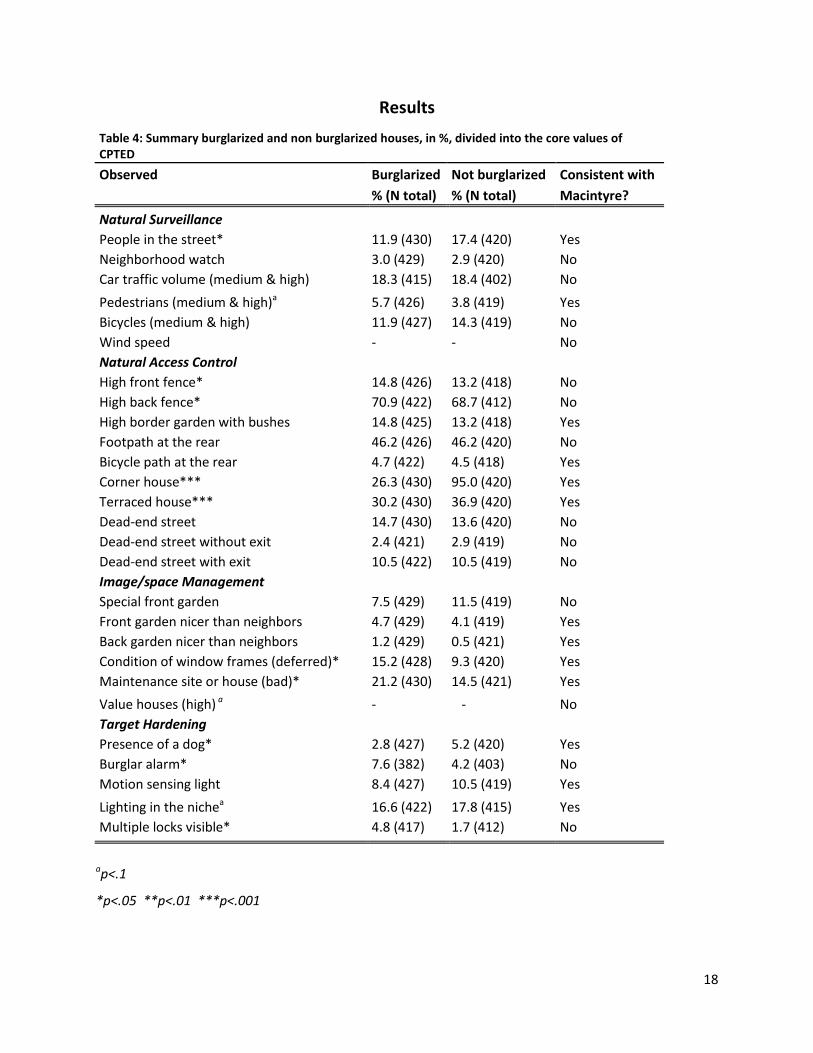
Table 4 summarizes the results of the performed analyses of the cues. The last column refers to whether
the results are consistent with Macintyre’s cues or not. All the cues are classified into four of the six
core values of CPTED. Territorial reinforcement and activity support are excluded; no cues could be
assigned to these values of CPTED.
Houses with evidence of a dog seem to have a lower risk at getting burglarized, as well as houses with
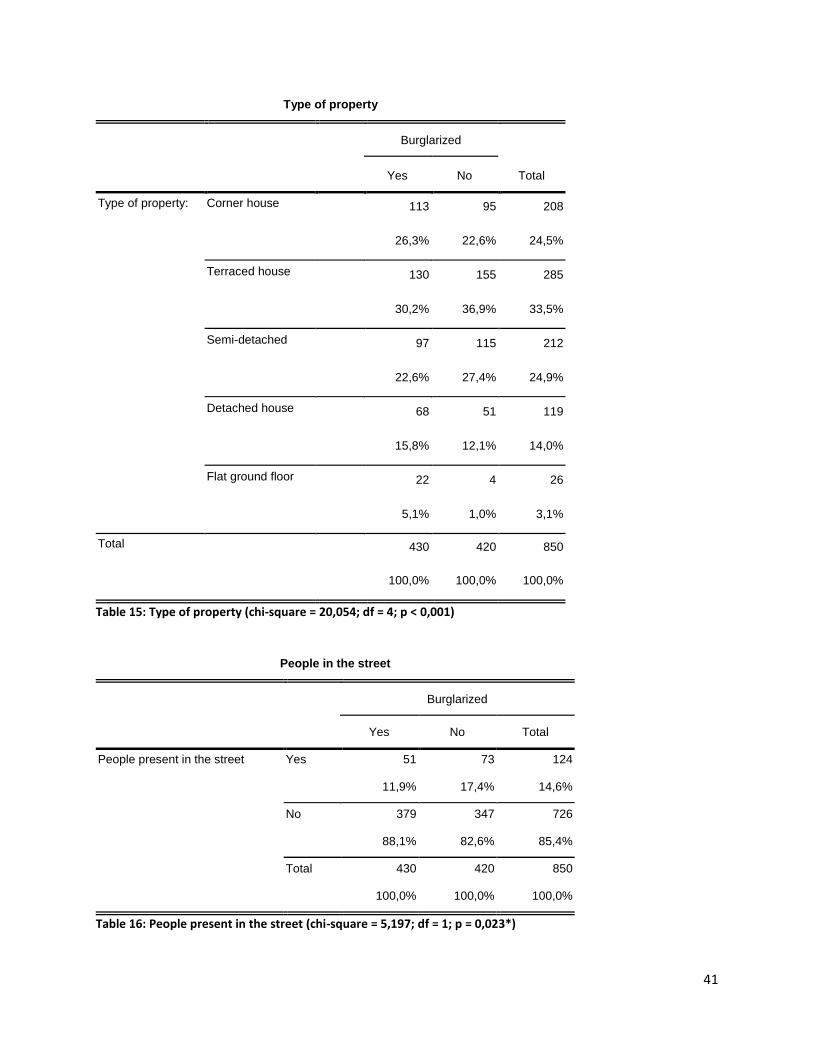
deficient window frames or deferred maintenance of the house or property in general. Corner houses
have a higher risk of getting burglarized than terraced houses. Houses with the presence of people in
the street seem to have a lower risk of getting burglarized. Houses with a high or normal number of
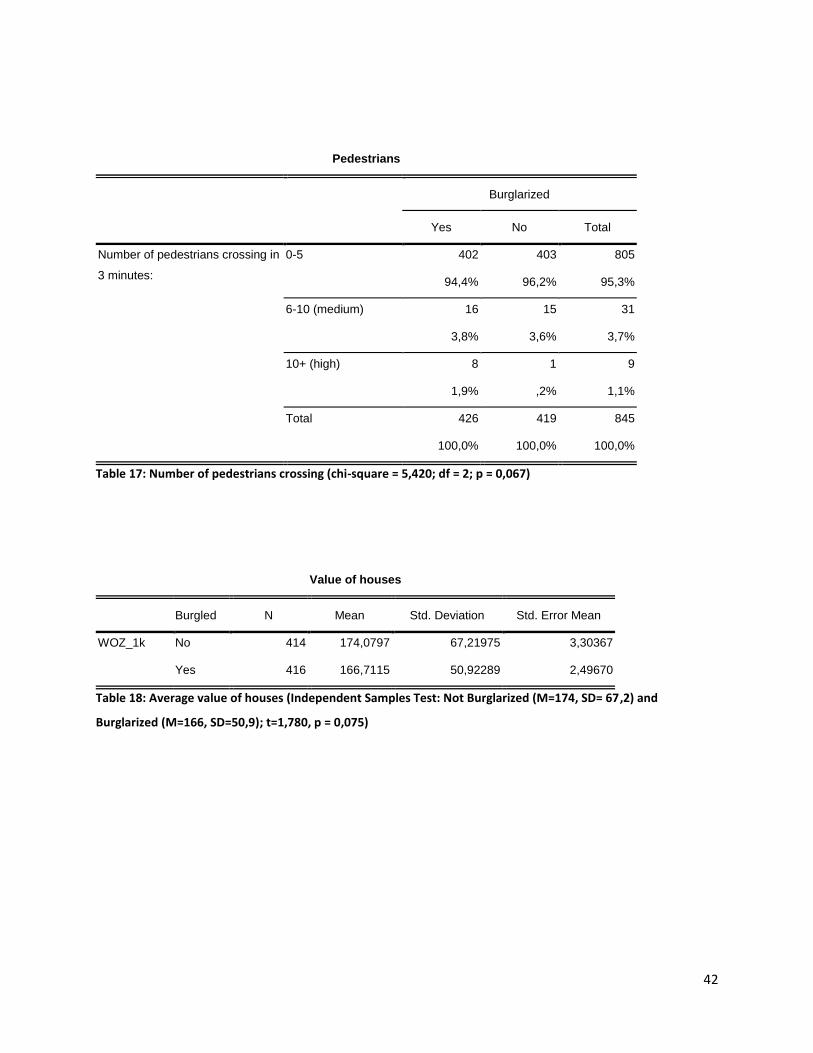
pedestrians seem to have a higher chance of getting burglarized. Houses with lighting in the niche have
a lower risk of getting burglarized. These findings all seem to agree with the statements of burglars.
On the contrary, houses with a burglar alarm and houses with multiple locks have a higher chance of
getting burglarized. Houses with a high fence at the front or the back have a higher risk of getting
burglarized. These cues do not agree with the statements of Macintyre’s burglars.
Motion sensing lights, having a special front garden or nicer garden than the neighbors, a high border
garden with bushes and a neighborhood watch seem not to differ in the risk of getting burglarized. A
dead-end street and a footpath or bicycle path at the rear seem unrelated to getting burglarized. No
evidence was found for a higher risk of burglaries with high or normal car traffic volume or bicycles.
These findings are not in accordance with the statements of Macintyre’s burglars.
Value houses
No evidence was found for expensive houses having a higher chance of getting burglarized (see
appendix D, table 17). This finding is not in agreement with the burglar’s statements.
Weather
Brunninkhuis (2010) performed a study for the municipality Enschede. Her study was done with burglary
and weather information from 2004 till 2008. She studied the influence of nine weather conditions,
including wind speed. From the nine weather conditions only air pressure and precipitation seemed
significant predictors for burglary. Wind speed was not associated with a higher chance for burglary.
This finding is not in agreement with the burglars.
20
Combinations
Besides the individual cues Macintyre tested the effect of combinations of cues. His main findings were
that a barking dog has more effect in a busy street that a quiet street, the deterring effect of a busy
street decreases when a potential house is accessible via a bicycle path or footpath at the rear and a
house in a busy street works as a deterrent when there is a neighborhood watch.
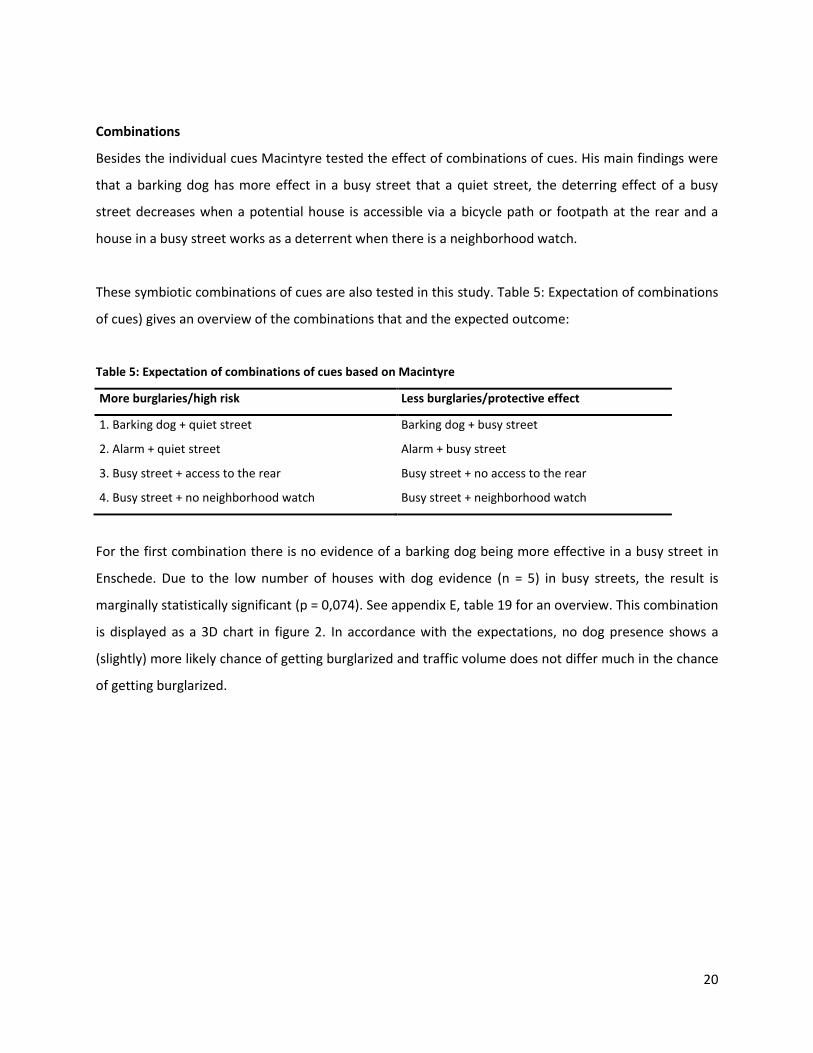
These symbiotic combinations of cues are also tested in this study. Table 5: Expectation of combinations
of cues) gives an overview of the combinations that and the expected outcome:
Table 5: Expectation of combinations of cues based on Macintyre
More burglaries/high risk Less burglaries/protective effect
1. Barking dog + quiet street Barking dog + busy street
2. Alarm + quiet street Alarm + busy street
3. Busy street + access to the rear Busy street + no access to the rear
4. Busy street + no neighborhood watch Busy street + neighborhood watch
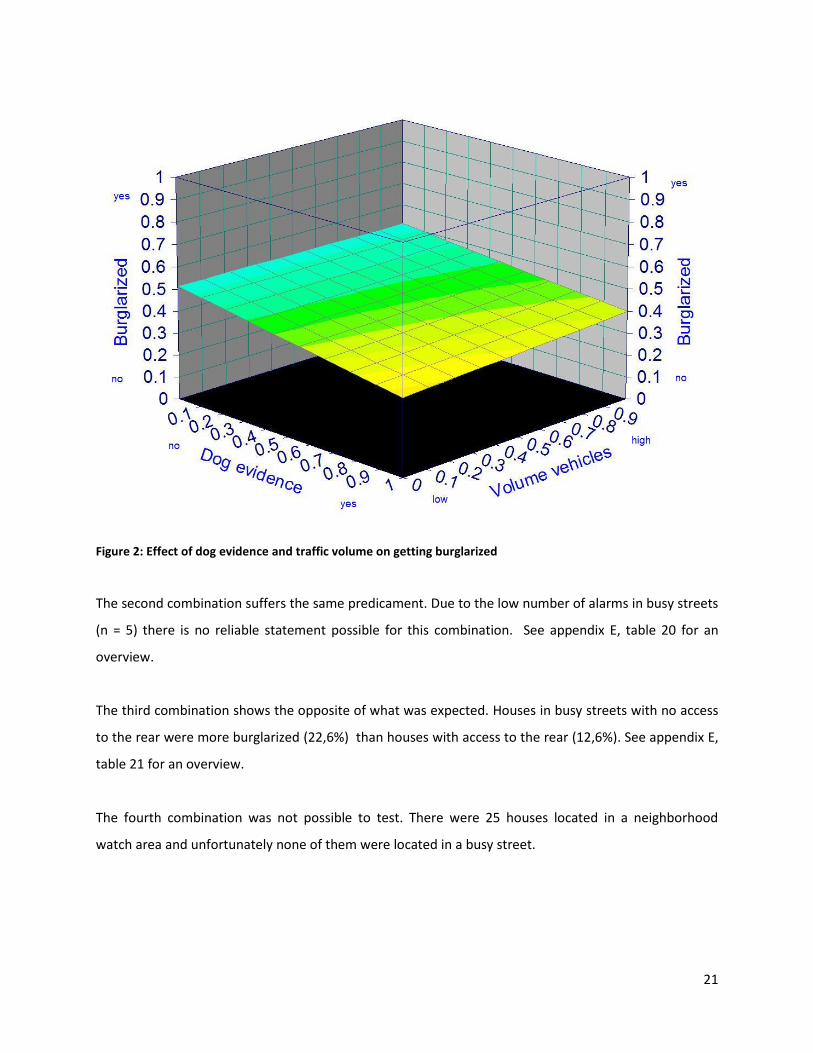
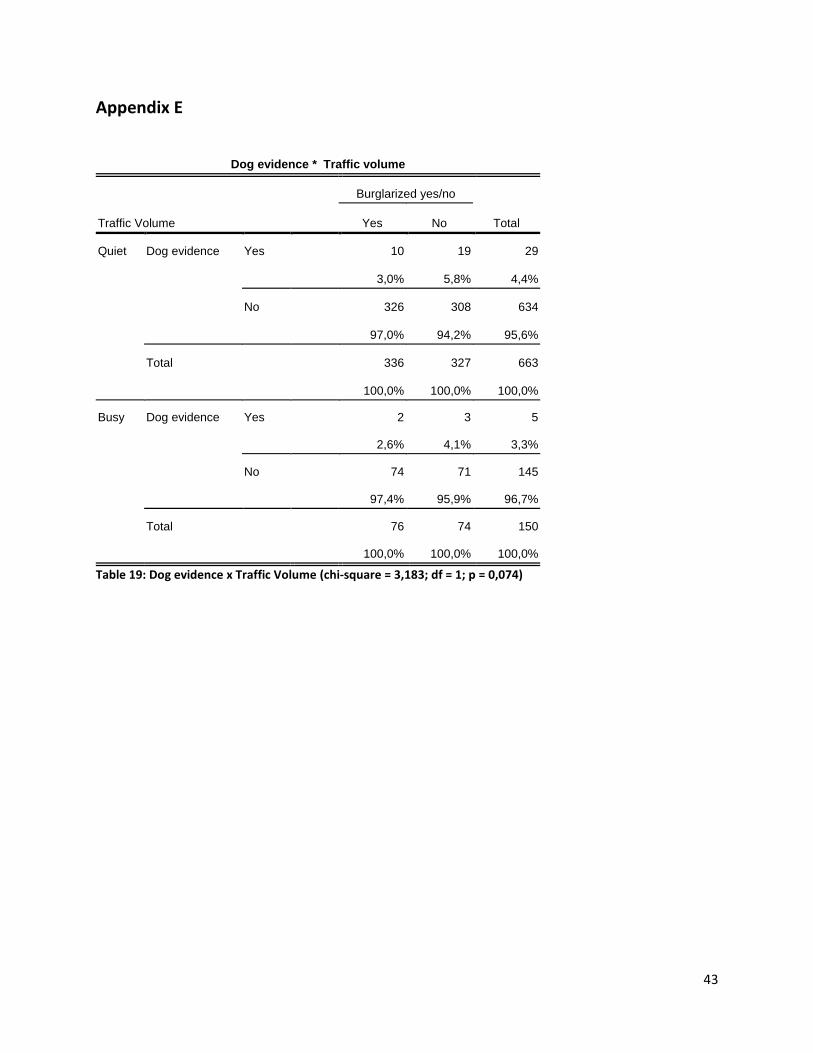
For the first combination there is no evidence of a barking dog being more effective in a busy street in
Enschede. Due to the low number of houses with dog evidence (n = 5) in busy streets, the result is
marginally statistically significant (p = 0,074). See appendix E, table 19 for an overview. This combination
is displayed as a 3D chart in figure 2. In accordance with the expectations, no dog presence shows a
(slightly) more likely chance of getting burglarized and traffic volume does not differ much in the chance
of getting burglarized.
21
Figure 2: Effect of dog evidence and traffic volume on getting burglarized
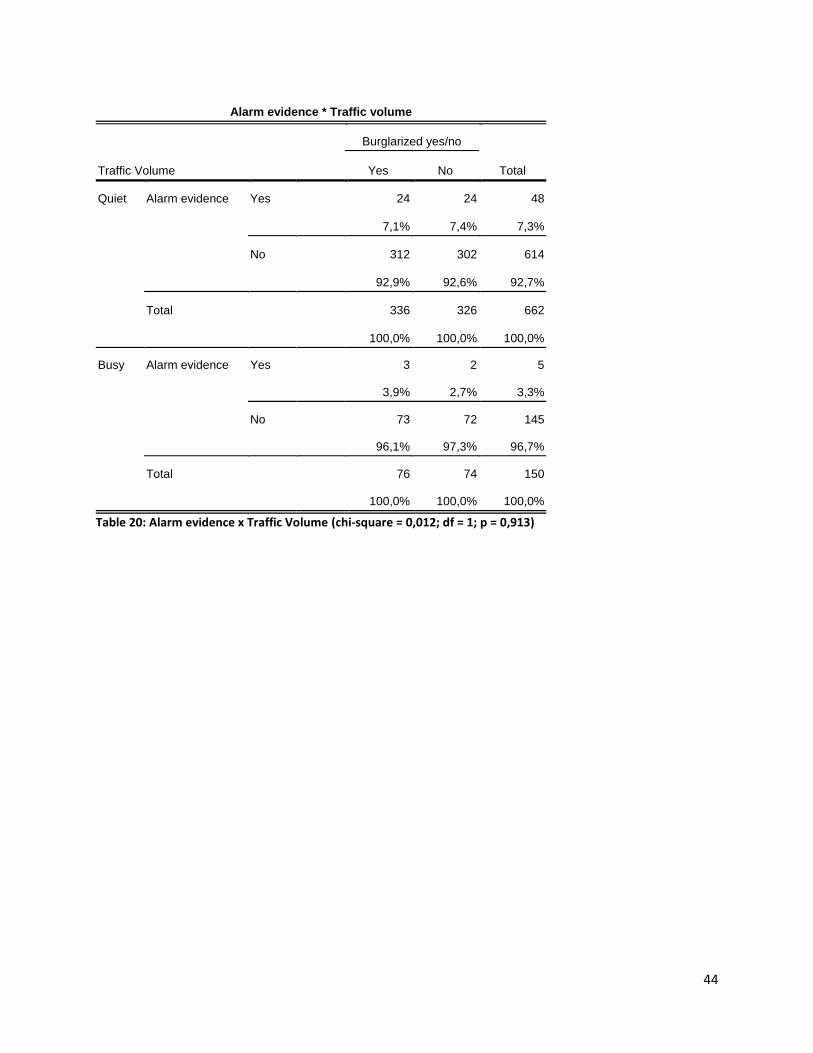
The second combination suffers the same predicament. Due to the low number of alarms in busy streets
(n = 5) there is no reliable statement possible for this combination. See appendix E, table 20 for an
overview.
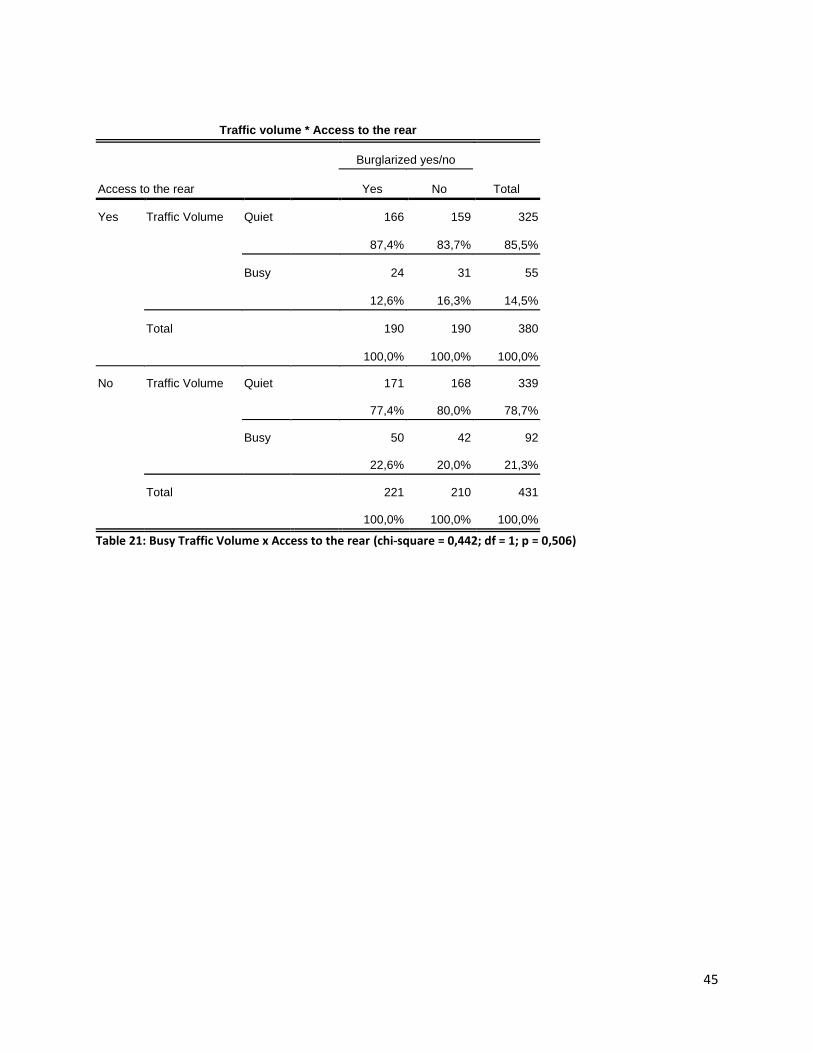
The third combination shows the opposite of what was expected. Houses in busy streets with no access
to the rear were more burglarized (22,6%) than houses with access to the rear (12,6%). See appendix E,
table 21 for an overview.
The fourth combination was not possible to test. There were 25 houses located in a neighborhood
watch area and unfortunately none of them were located in a busy street.
22
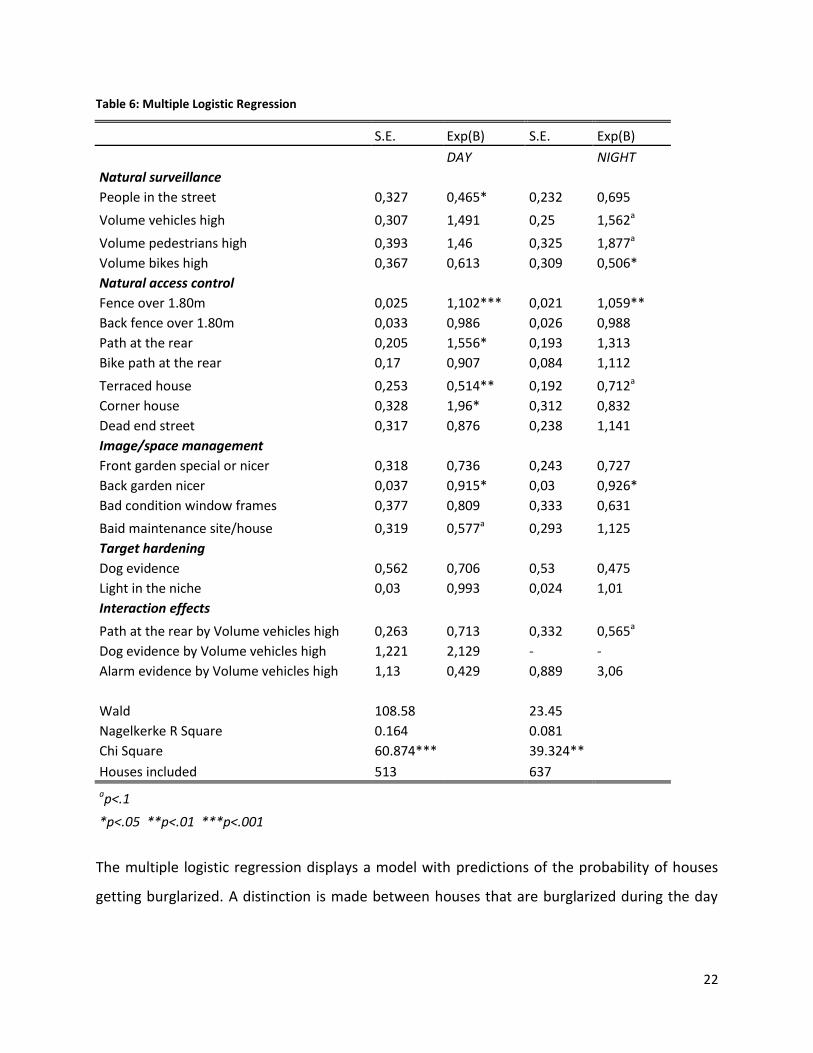
Table 6: Multiple Logistic Regression
S.E. Exp(B) S.E. Exp(B)
DAY
NIGHT
Natural surveillance People in the street 0,327 0,465* 0,232 0,695
Volume vehicles high 0,307 1,491 0,25 1,562a
Volume pedestrians high 0,393 1,46 0,325 1,877a
Volume bikes high 0,367 0,613 0,309 0,506*
Natural access control Fence over 1.80m 0,025 1,102*** 0,021 1,059**
Back fence over 1.80m 0,033 0,986 0,026 0,988
Path at the rear 0,205 1,556* 0,193 1,313
Bike path at the rear 0,17 0,907 0,084 1,112
Terraced house 0,253 0,514** 0,192 0,712a
Corner house 0,328 1,96* 0,312 0,832
Dead end street 0,317 0,876 0,238 1,141
Image/space management Front garden special or nicer 0,318 0,736 0,243 0,727
Back garden nicer 0,037 0,915* 0,03 0,926*
Bad condition window frames 0,377 0,809 0,333 0,631
Baid maintenance site/house 0,319 0,577a 0,293 1,125
Target hardening Dog evidence 0,562 0,706 0,53 0,475
Light in the niche 0,03 0,993 0,024 1,01
Interaction effects Path at the rear by Volume vehicles high 0,263 0,713 0,332 0,565a
Dog evidence by Volume vehicles high 1,221 2,129 - -
Alarm evidence by Volume vehicles high 1,13 0,429 0,889 3,06
Wald 108.58
23.45 Nagelkerke R Square 0.164
0.081
Chi Square 60.874***
39.324** Houses included 513
637
ap<.1
*p<.05 **p<.01 ***p<.001
The multiple logistic regression displays a model with predictions of the probability of houses
getting burglarized. A distinction is made between houses that are burglarized during the day

23
and during the night. This distinction is based on real sunrise/sunset data. Multiple locks and
burglar alarms are excluded from the model, because they both show a reversed association.
The daytime model can predict 74,6%, while the nighttime can only predict 63,8%. The odds
ratio for every cue are displayed, for example houses with a path at the rear are during the day
1,56 times more likely to be burglarized and during the night 1,3 times more likely to be
burglarized. Other interesting findings are that houses with a high volume of vehicles or
pedestrians are more likely to be burglarized during the night than during the day. Corner
houses are more vulnerable during the day (p<.05) than at night. Houses in a dead end street
have a higher chance of getting burglarized during the night than during the day. Houses with
bad maintenance are less likely to get burglarized during the day than the night.
Discussion
This study examined the level of similarities between statements of burglars and observational data
from Enschede. Several cues were compared and six factors were in complete agreement with
Macintyre and four factors were the opposite of what was expected. Another seven factors were in
agreement with Macintyre, but not significant and ten factors were not in agreement with Macintyre,
but not significant as well.
In agreement with Macintyre the chances of a burglary are lower at houses with evidence of a dog and
people in the street. The chances of a burglary are higher at houses with bad window frames or bad
maintenance of the house or property in general. As expected corner houses have a higher chance of
getting burglarized than terraced houses. These findings are all in accordance with other various studies
and confirm that these cues are related to burglary.
Some cues did not differ much in the risk of getting burglarized. The factors motion sensing lights, a
bicycle path at the rear, having a nicer garden than the neighbors, a high or medium number of
pedestrians crossing and a high border with bushes were in agreement with Macintyre, but not
significant.
24
Not in agreement with Macintyre but not significant were a dead-end street and a footpath at the rear,
high or medium car and bike traffic volume, having a special front garden, high wind speed and a
neighborhood watch.
Houses in a dead-end street were expected to be less burglarized than houses in other street types. In
Enschede no evidence was found for houses in a dead-end street being less vulnerable to burglary.
However, houses in a dead-end street without an exit are slightly less likely to be burglarized than
houses in a dead-end street with an exit, which is in accordance with Macintyre’s participants. The
result is however not significant and is not in line with other research (R. Armitage, 2007; Johnson &
Bowers, 2010).
Houses with a footpath or bicycle path at the rear were expected to have more burglaries, but no
evidence was found for both these factors. Houses with a bicycle path were slightly more burglarized,
but the result is not significant. A possible explanation can be that burglars in Enschede make less use of
escape routes.
Macintyre’s participants stated they prefer busy streets, which makes them less visible when
committing a burglary. Regarding traffic intensity, only houses with a high number of pedestrians were
more burglarized, the result is marginally significant.
Not in agreement with Macintyre but significant are the higher chances of a burglary at houses with an
alarm and houses with multiple locks, as well as houses with a high fence at the front or the back. The
value of burglarized houses was also not in agreement with Macintyre. The values of the burglarized
houses were slightly lower than the values of the non burglarized houses.
Like stated before, the number of burglaries at houses with an alarm showed an opposite association,
houses with an alarm were more burglarized than houses without an alarm. An explanation can be that
an alarm indicates that there are valuable goods inside or that victims or a burglary fit an alarm after
they are burglarized. This is called the ‘Paris Hilton effect’ according to Vollaard (2010). Without having
experienced a burglary, people often fail to implement security measures that prevent burglaries. After
they are burglarized they take a lot of measures, like multiple locks. This can explain why these houses
were more burglarized. Another possible explanation is the time effect. The data of the burglarized
25
houses is from 2008, the observations were performed in 2010. Over the years residents could have
moved somewhere else, reconstruct their dwelling or experience a burglary or another crime and take
measures. Macintyre’s participants stated they do not prefer high fences. Houses with a high fence at
the front or the back also showed an opposite association. A possible explanation is that burglars in
Enschede used a different point of entry for the houses or the fences were not closed (properly) and
easy to move past. According to Krainz (1988), burglars might also be attracted to a residence when a
high fences blocks the neighbors views.
Limitations
Offender interviews should be treated with caution. Nevertheless, offenders are a wide source of
information and with the right methodology and maximizing the validity a lot of information of
offenders can be learned. Maximizing validity for using information of offenders is the biggest challenge.
This can be done in various ways (Field, 2005). Macintyre took this into account by selecting the
offenders in a non threatening environment, where they were beyond the reach of the law. The first
group of 50 offenders came from a drug treatment center and had no connection the police or the court
of Justice. The second group of 96 offenders was selected via a private centre for released prisoners.
These offenders served their time in prison and had no connection to the law anymore. All offenders
were experienced burglars; some committed a few burglaries while others committed more than 100
burglaries. The burglars from the first study were still active or recently active as a burglar (Macintyre,
2001).
Some cues are time sensitive. For example, the cues people in the street and traffic volume of cars, bikes
and pedestrians can differ at any time. This study did not take the times in which the burglaries occurred
into account, which could influence the reliability of the results.
The study of Macintyre is performed in Australia, which can raise concern about the generalizability of
cues to the Netherlands, which is in another continent. Study one of Macintyre took place in Bisbane, a
city located in the east of Australia. This part of Australia has a subtropical climate and the climate can
have windstorms during the rainy season, which is from January till April. The generalizability of the cue
‘weather’ is therefore less, because in the Netherlands these windstorms are less likely to occur. This
can also be an explanation why no evidence was found for wind speed and burglary. Other research
26
discovered that variables about burglary can have a significant effect in the same direction in other
countries (Tseloni, et al., 2004).
The WOZ value was used to analyze whether expensive houses were more burglarized than less
expensive houses. This is the value the municipality assigns for taxes purposes to a property including
the parcel, with the garden and garage. A limitation of using this value for analyses is for example a
small apartment in an expensive neighborhood, which can potentially cost the same as a medium house
on a very large parcel. A burglar could see the difference between those houses by using other cues, but
the WOZ value would not reflect this difference. Using building values only could solve this issue. The
WOZ value was only available at neighborhood level and not at individual level. This makes this outcome
less reliable.
Suggestions for further research
Suggestions for further research could be a study of burglar alarms and other target hardening
measures. Further research can go into detail about alarm systems and whether they are installed
before or after a crime, which can gain useful information about the effect of alarm systems. This can
apply to other target hardening measures as well, like multiple locks. The effect of both measures is
unclear at this moment.
Another suggestion for further research is a study for houses in a dead-end street. This study made no
difference between the type of street, only whether there was an exit. A new study can take the types
of cul-de-sacs (linear in geometry and more sinuous) into account and analyze whether the risk of
burglary is higher in a certain type.
A final suggestion for further research would be a replica of Macintyre’s study in The Netherlands. This
requires a comprehensive research and should be combined with an investigation about the modus
operandi of a burglary. This can give new insights in the selection of a target in Dutch cities and the way
how breaking and entering is performed.
27
Literature
Armitage, R. (2000). An Evaluation of Secured by Design Housing within West Yorkshire. Home Office Briefing Note, 7(00), 1-4.
Armitage, R. (2007). Sustainability versus safety: confusion, conflict and contradiction in designing out
crime. Crime Prevention Studies, 21, 81-110. Bennett, T., & Wright, R. T. (1984). Burglars on burglary: Prevention and the offender. Hampshire, UK:
Gower. Bernasco, W. (2008). Them Again?: Same-Offender Involvement in Repeat and Near Repeat Burglaries.
European Journal of Criminology, 5(4), 411-431. doi: 10.1177/1477370808095124 Bernasco, W., & Luykx, F. (2003). Effects of attractiveness, opportunity and accessibility to burglars on
residential burglary rates of urban neighborhoods. Criminology, 41(3), 981-1002. doi: 10.1111/j.1745-9125.2003.tb01011.x
Brunninkhuis, K. (2010). Invloed van weersomstandigheden op het aantal woninginbraken in de periode
2004 t/m 2008 in de gemeente Enschede. University of Twente, Enschede. Buck, A. J., Hakim, S., & Rengert, G. F. (1993). Burglar alarms and the choice behavior of burglars: A
suburban phenomenon. Journal of Criminal Justice, 21(5), 497-507. doi: Doi: 10.1016/0047-2352(93)90034-k
Budd, T. (1999). Burglary of Domestic Dwellings. Findings from the British Crime Survey. London:
Information and Publications Group. Bureau Van Dijk, Van Soomeren en Partners Amsterdam,. (1991). Woninginbraak. Motieven en
werkwijzen vanuit daderperspectief. Den Haag: Landelijk Bureau Voorkoming Misdrijven. CBS. (2010). Geregistreerde criminaliteit blijft gelijk Retrieved 2011-03-01, from http://www.cbs.nl/nl-
NL/menu/themas/veiligheid-recht/publicaties/artikelen/archief/2010/2010-3161-wm.htm CBS. (2011). Politie registreerde 1,2 miljoen misdrijven in 2010 Retrieved 2011-12-01, from
http://www.cbs.nl/nl-nl/menu/themas/veiligheid-recht/publicaties/artikelen/archief/2011/2011-3462-wm.htm
Centrum voor Criminaliteitspreventie en Veiligheid. (2008). CPTED steeds vaker een begrip in veilig
ontwerpen Retrieved 2011-05-30, 2011, from http://www.hetccv.nl/dossiers/Politiekeurmerk+Veilig+Wonen/Landelijk+-+CPTED+steeds+vaker+een+begrip+in+veilig+ontwerpen
Cornish, D. B., & Clarke, R. (2008). The rational choice perspective Environmental Criminology and Crime
Analysis. Portland: Willan Publishing. Coupe, R. T., & Blake, L. (2006). Daylight and darkness targeting strategies and the risks of being seen at
residential burglaries. Criminology(44), 431-463.
28
Cozens, P. (2008). Crime Prevention Through Environmental Design. In R. Wortley & L. Mazerolle (Eds.), Environmental Criminology and Crime Analysis (pp. 153-177). Portland: Willan Publishing.
De Waard, J. (2011). Preventieve maatregelen woninginbraak zeer effectief. Secondant, 6, 8-13. Ekblom, P. (1997). Gearing Up Against Crime: a Dynamic Framework to Help Designers Keep up with the Adaptive Criminal in a Changing World. International Journal of Risk, Security and Crime Prevention, 2(4),
249-265. Felson, M. (2008). Routine Activity Approach. In R. Wortley & L. Mazerolle (Eds.), Environmental
Criminology and Crime Analysis (pp. 70-77). Portland: Willan Publishing. Felson, M., & Clarke, R. (1998). Opportunity Makes the Thief: Practical theory for crime prevention.
Police Research Series, 98. Field, A. (2005). Discovering statistics using SPSS (2nd ed). London: Sage. Hakim, S., & Buck, A. J. (1992). What makes a good burglary site? . Security Distributing and Marketing,
April, 68-69. Hakim, S., Shachmurove, Y., & Fishman, G. (1998). Do Burglars Calculate ROI? A Logistic Regression
Analysis Journal of Economic and Social Measurement, 24(1), 1-13. Handel, C. v. d., Nauta, O., Soomeren, P. v., & Amersfoort, P. v. (2009). Hoe doen ze het toch? Modus
Operandi Woninginbraak. Amsterdam: DSP-groep. Hearnden, I., & Magill, C. (2004). Decision-making by house burglars: offenders' perspectives (Vol. 249).
London: Home Office. Hirschfield, A., Newton, A., & Rogerson, M. (2010). Linking Burglary and Target Hardening at the
Property Level: New Insights Into Victimization and Burglary Protection. Criminal Justice Policy Review, 21(3), 319-337. doi: 10.1177/0887403409356965
Hough, M. (1987). 'Offenders' Choice of Target: Findings from Victim Survey's. Journal of Quantitative
Criminology, 3(4), 355-369. Johnson, S., & Bowers, K. (2010). Permeability and Burglary Risk: Are Cul-de-Sacs Safer? Journal of
Quantitative Criminology, 26(1), 89-111. doi: 10.1007/s10940-009-9084-8 Junger, M. (1989). Discrepancies between police and self-report data for Dutch racial minorities. British
Journal of Criminology, 29(3), 273-284. Katz, J. (1988). Seductions of crime. New York: Basic Books. Kleemans, E. (2001). Repeat Burglary Victimization: Results of Empirical Research in the Netherlands.
Crime Prevention Studies, 12, 53-68. Krainz, K. W. (1988). Prävention von Hauseinbrüchen: Ergebnisse einer Täterbefragung: Universität Graz.
29
Lee, S. (2008). The impact of home burglar alarm systems on residential burglaries. Ph. D, The State
University of New Jersy, New Jersey. Macintyre, S. D. (2001). Burglar Decision Making. Griffith University, Queensland. Nauta, O. (2005). Liever geen inbrekers? Het Politiekeurmerk wérkt. Secondant, 1, 30-34. Nee, C., & Meenaghan, A. (2006). Expert Decision Making in Burglars. British Journal of Criminology,
46(5), 935-949. doi: 10.1093/bjc/azl013 Politie Twente. (2010). Korpsjaarverslag 2009. Enschede: Politie Twente. Politie Twente. (2011). Korpsjaarverslag 2010. Enschede: Politie Twente. Politie Twente. (2012). Terugblik op veiligheid in Twente 2011 Retrieved 2012-03-06, from
http://www.politie.nl/twente/projecten/terugblikopveiligheidintwente2011.asp Poyner, B. (1993). What works in crime prevention: An overview of Evaluations. Crime Prevention
Studies, 1, 7-34. Rebscher, E. (1990). Crime Prevention In The Field of Burglary: Empirical Police Research in the Federal
Republic of Germany. Police Studies, 13(1), 10-13. Rengert, G., & Wasilchick, J. (1985). Suburban Burglary - A Time and a Place for Everything. Springfield,
IL: Charles C Thomas. Repetto, T. A. (1974). Residential Crime. Cambridge, MA: Ballinger Publishing Company. Shover, N. (1991). Burglary. Crime and Justice, 14, 73-113. Taylor, M., & Nee, C. (1988). The Role of Cues in Simulated Residential Burglary. The British Journal of
Criminology, 28(3), 396-403. Tilley, N., & Webb, J. (1994). Burglary Reduction: Findings From Safer Cities Schemes Crime Prevention
Unit (Vol. 51). London: Home Office. Tseloni, A., Wittebrood, K., Farrell, G., & Pease, K. (2004). Burglary Victimization in England and Wales,
the United States and the Netherlands. British Journal of Criminology, 44(1), 66-91. doi: 10.1093/bjc/44.1.66
Vermeulen, C., & Overbeeke, R. v. (1992). Inbraak in Nijmegen: een onderzoek naar inbraak in woningen
en in auto’s met behulp van processen-verbaal en daderinterviews. Amsterdam: DSP-groep. Vollaard, B. (2009a). The effect of built-in security on burglary. Evidence from a natural experiment.
Paper presented at the Workshop on Law and Economics, University of Paris Ouest, Nanterre, Paris.
30
Vollaard, B. (2009b). Het publieke belang bij private preventie. Politie & Wetenschap, 51. Vollaard, B. (2010). Diestal als nare verrassing-de gedragseconomie van diefstalpreventie. TPEdigitaal,
4(4), 49-60. Wright, R. T., & Decker, S. (1994). Burglars On The Job: Streetlife and Residential Break-ins. Saint Louis,
Missouri: Northwestern University Press. Wright, R. T., Logie, R. H., & Decker, S. (1995). Criminal Expertise and Offender Decision Making: An
Experimental Study of the Target Selection Process in Residential Burglary. Journal of Research in Crime and Delinquency, 32(1), 39-53.
31
Appendix A
Checklist t.b.v. observaties – Februari - maart 2010
INVULLEN of CIRKEL BIJ VAN TOEPASSING
Adres: Dag: Tijd:
Waargenomen door bewoner (bv.opengaande gordijnen) (ja) (nee) (1)bewoner (2)Buurman/-vrouw/-kind
Bevraagd/geconfronteerd door bewoner (ja) (nee)
Woontype
1) Bouwjaar woning (schatting): (1) ouder dan 1930 (2) 1930 (3) 1950 -1960 (3) 1970-1980 (4) 1990 of later
2) Type woning
(1) 2 ond. 1 kap (2) Hoekwoning (eind van blok) (3) Vrijstaand (4) Tussenwoning (5) Flat (beneden woning)
3) Soort woning [ja] Bungalow [ja] Eind v.d. straat woning [ja] Geschakelde woning (aan elkaar)
4) Hoeveel huizen om het targethuis heen zijn er hetzelfde als het target huis?
(0) huizen (1) huis (2-5) huizen (6+) huizen
5) Aantal vrije zijdes (2) zijdes (3) zijdes (4) zijdes
6) Aantal vrije zijdes met deuren of/en ramen (2) zijdes (3) zijdes (4) zijdes
Wegennet
7) Doodlopende straat (1) Ja (0) Nee (NAAR VRAAG 9) (9) n.v.t.
8) (1) met doorgang (0) zonder doorgang
9) Doorgaande weg (1) Ja (0) Nee (9) n.v.t.
10) Toegang tot woongebied afgebakend door symbolische of werkelijke barrière (1) Ja (0) Nee
Toegankelijkheid
11) Aanwezigheid van een voetpad (1) Ja (0) Nee
12) Voortuin (1) Ja (0) Nee (NAAR VRAAG 17)
13) Voortuin met een speciaal ontwerp of extra verzorgd (2) Ja (1) Beetje (0) Nee
14) Voortuin is ‘mooier’ dan de tuinen van de buren (2) Ja (1) Beetje (0) Nee
15) Hoogte van de hoogste deel van de afscheiding (1) <1.00m (taille hoogte) ( 2) ong. 1.00-1.80m (3) ong. 1.8m+
16) Voortuin is afgescheiden door:
[ja] Muur uit beton, metaal of hout [ja] Niet prikkende struiken [ja] Prikkende struiken
[ja] Afscheiding met bovenop afrastering (prikkeldraad, pinnen) [ja] Niets [ja] Anders: namelijk: _______________
17) Zie je aan de zij of aan de voorkant van het huis OF binnen 100 m.:
[ja] Winkels [ja] Open land [ja] Netwerk van andere voetpaden [ja] Plein/hof [ja] School [ja] Kerk
32
[ja] Andere woongebieden [ja] Bedrijven [ja] Industriegebied [ja] Anders, namelijk: _________________
18) Zijingang naar tuin (1) Ja (0) Nee (NAAR VRAAG 21) (9) n.v.t.
19) (1) met deur (2) zonder deur (NAAR VRAAG 21)
Deur naar tuin is geplaatst op de hoogte van (dus tot waar gaat een pad langs het huis)
20) (1) op hoogte van de voorgevel (2) Tussen voor en achtergevel (3) Achtergevel (4) Nog verder
21) Rolluiken op begane grond (1) Ja (2) Nee
Woning waarneembaar voor anderen?
22) Woning zichtbaar vanaf VERKEERSLICHTEN (1) Ja (0) Nee (9) n.v.t.
23) Verkeersvolume bij de VERKEERSLICHTEN (voertuigen stoppen binnen 3 min.)
(1) 0-5 (2) 6-10 ( 3) 10+
24) Fietsersvolume bij de Verkeerslichten (fietsers stoppen binnen 3 minuten)
(1) 0-5 (2) 6-10 ( 3) 10+
25) Woning zichtbaar vanaf een KRUISPUNT (1) Ja (0) Nee (9) n.v.t.
26) Verkeersvolume bij het KRUISPUNT (voertuigen stoppen binnen 3 min.)
(1) 0-5 (2) 6-10 ( 3) 10+
27) Fietsersvolume bij het Kruispunt (fietsers stoppen binnen 3 minuten)
(1) 0-5 (2) 6-10 ( 3) 10+
28) Gemiddelde snelheid verkeer aan de VOORKANT van woning
(1) lager dan 30 (2) 30 (3) 50 (4) 70 (5) 70+ (9) n.v.t. (geen straat aan de voorkant, NAAR VRAAG 30)
29) Verkeersvolume aan de VOORKANT van de woning (voertuigen komen voorbij binnen 3 min.)
(1) 0-5 (2) 6-10 ( 3) 10+
30) Verkeersvolume (voetgangers) aan de VOORKANT van de woning (voetgangers komen voorbij 3 minuten)
(1) 0-5 (2) 6-10 ( 3) 10+
31) Verkeersvolume (fietsers) aan de voorkant van de woning (fietsers komen voorbij binnen 3 minuten)
(1) 0-5 (2) 6-10 ( 3) 10+
32) Rondhangende mensen in de nabijheid van de woning (1) Ja (0) Nee
Surveillance
33) Voordeur aan de straatzijde (1) Ja (0) Nee
34) Ingang woning zichtbaar vanaf de straat (1) Ja (0) Nee
35) Voordeur in een nis (1) Ja (0) Nee (NAAR VRAAG 37)
36) Verlichting in de nis (1) Ja (0) Nee (9) n.v.t.
33
37) Straatverlichting aanwezig (1) Ja (0) Nee
38) Woning ligt aan een plein/hof (1) Ja (0) Nee
39) Naar binnen kijken (2) Ja (1) Beetje (0) Nee (bijv.: gordijnen dicht)
40) Zijn er buren aan de overkant van de straat (1) Ja (2) Nee (NAAR VRAAG 43)
41) (1) Alleen afstand (NAAR VRAAG 43) (2) Alleen schuin (NAAR VRAAG 43) (3) Direct
42) Buren direct aan de overkant (1) Ja, gordijnen open (2) Ja, maar gordijnen dicht
Parkeergelegenheid
43) Oprit (1) Ja (0) Nee
44) Garage (1) Ja (0) Nee
45) Gemeenschappelijke parkeerplaats (1) Ja (0) Nee
46) Parkeren aan de straat (1) Ja (0) Nee
Sociaal klimaat
47) Aanwezigheid van buurtwachten (buurtpreventie) (1) Ja (0) Nee
48) Algemene staat van onderhoud van de buren: tekenen van achterstallig onderhoud
(0) Geen tekenen (1) Enkele tekenen (2) Ja veel
49) Algemene staat van onderhoud van het perceel of woning: tekenen van achterstallig onderhoud
(0) Geen tekenen (1) Enkele tekenen (2) Ja veel
50) Algemene staat van kozijnen (1) Goed (2) Enkele tekenen van achterstallig onderhoud (3) Niet goed
51) Tekenen van kortdurige afwezigheid (1) Ja (0) Nee
52) Tekenen van langdurige afwezigheid (1) Ja (0) Nee
Tekenen van
53) Aanwezigheid van een hond waarneembaar [ja] Blaffende of lopende hond [ja] Sticker [ja] Niets
54) Aanwezigheid van een inbraakalarm waarneembaar
[ja] Sticker [ja] Camera [ja] Bewegingsmelder (lamp) [ja] Niets
55) Aanwezigheid van meerdere sloten waarneembaar (voordeur) (1) Ja (0) Nee
56) Open raam/deur op een kier (1) Ja (0) Nee
57) [ja] Op begane grond [ja] Kan volledig open
Achterkant
58) Zie je de achtertuin? (1) Ja (0) Nee (achtertuin is dicht) (NAAR VRAAG 61)
59) Achtertuin met een speciaal ontwerp of extra verzorgd (2) Ja (1) Beetje (0) Nee (9) n.v.t.
60) Achtertuin is mooier dan de tuinen van de buren (2) Ja (1) Beetje (0) Nee (9) n.v.t.
34
61) Voetpad loopt aan de achterzijde van het huis (1) Ja (0) Nee (NAAR VRAAG 65) (9) n.v.t.
62) Woning is zichtbaar vanaf het voetpad (1) Ja (0) Nee (9) n.v.t.
63) Aantal gebouwen tussen voetpad en woning (0) (aangrenzend) (1) 1-5 (2) 6-10 (9) n.v.t.
64) Poort/hekwerk tussen voetpad en achtertuin (1) Ja (0) Nee (9) n.v.t.
65) Fietspad aan de zij of achterkant van het huis (1) Ja (0) Nee (9) n.v.t.
66) Zie je de afscheiding van de achtertuin? (1) Ja (0) Nee (NAAR VRAAG 70) (9) n.v.t.
67) Achtertuin is afgescheiden door:
[ja] Muur uit beton, metaal, steen of hout [ja] Niet prikkende struiken [ja] Prikkende struiken
[ja] Afscheiding met bovenop afrastering (prikkeldraad, pinnen) [ja] Niets [ja] ANDERS, namelijk ______________
68) Afscheiding (1) met deur (0) zonder deur
69) Hoogte van de hoogste deel van de afscheiding (1) <1.00m (taille hoogte) ( 2)ong. 1.00-1.80m (3) ong. 1.80m+
70) Zie je aan de achterkant van het huis (binnen 100 m):
[ja] Winkels [ja] Open land [ja] Netwerk van andere voetpaden [ja] Plein/hof [Ja] School [Ja] Kerk
[ja] Andere woongebieden [ja] Bedrijven [ja] Industrie(gebied) [ja] Anders, namelijk: ____________________
71) Zijn er buren aan de overkant van de achterkant (1) Ja (2) Nee (VUL NR. 72 en 73 NIET)
72) (1) Alleen afstand (VUL NR. 73 NIET) (2) Alleen schuin (VUL NR. 73 NIET) 3) Direct 9) n.v.t.
73) Buren direct aan de overkant (1) Ja, gordijnen open (2) Ja, maar gordijnen dicht (9) n.v.t.
35
Appendix B
Table 1: Citizens, residential spaces and burglaries in Twente
Year Number of
citizens Increase citizens
Residential Increase residential Burglaries every Increase in burglaries
in Enschede*
Enschede every
spaces in spaces in Enschede year in police
region in police region
Twente
year in % Enschede* every year in % Twente every year in %
2006 154.331 0.42% 74.590 - 1587 - 2007 154.455 0.08% 74.913 0.43% 1521 -4.3% 2008 154.745 0.19% 75.297 0.51% 1650 8.48% 2009 156.089 0.87% 76.138 1.12% 1777 7.69% 2010 157.076 0.63% - - 1915 7.77%
2011 157.848 0.49% - - 2284 19.3%
- = data unknown
*Citizens and residential spaces source: http://enschede.buurtmonitor.nl
36
Appendix C
Table 3: Cohen’s kappa
kappa agreement
κ < 0.00 negative
0.00 ≤ κ < 0.20 few to none
0.21 ≤ κ < 0.40 mediocre
0.41 ≤ κ < 0.60 reasonably
0.61 ≤ κ < 0.80 significant
0.81 ≤ κ < 1.00 (almost) full
37
Appendix D
Presence of a dog
Burglarized
Yes No Total
Presence of a dog: Yes 12 22 34
2,8% 5,2% 4,0%
No 415 398 813
97,2% 94,8% 96,0%
Total 427 420 847
100,0% 100,0% 100,0%
Table 7: Presence of a dog (chi-square = 6,384; df = 2; p = 0,041*)
Lighting in a niche
Burglarized
Yes No Total
Front door in niche: With lighting 70 74 144
66,7% 77,9% 72,0%
Without lighting 35 21 56
33,3% 22,1% 28,0%
Total 105 95 200
100,0% 100,0% 100,0%
Table 8: Lighting in the niche (chi-square = 3,119; df = 1; p = 0,077)
38
Burglar alarm
Burglarized
Yes No Total
Alarm Yes 29 17 46
7,6% 4,2% 5,9%
No 353 386 739
92,4% 95,8% 94,1%
Total 382 403 785
100,0% 100,0% 100,0%
Table 9: Alarm present (chi-square = 4,045; df = 1; p = 0,044*)
Condition of window frames
Burglarized
Yes No Total
Condition of window frames
is:
Good 363 381 744
84,8% 90,7% 87,7%
Medium 53 35 88
12,4% 8,3% 10,4%
Poor 12 4 16
2,8% 1,0% 1,9%
Total 428 420 848
100,0% 100,0% 100,0%
Table 10: Condition of the window frames (chi-square = 8,043; df = 2; p = 0,018*)
39
Maintenance site or house
Burglarized
Total Yes No
Level of deferred
maintenance:
No signs of disrepair 339 360 699
78,8% 85,5% 82,1%
Some signs of disrepair 77 56 133
17,9% 13,3% 15,6%
Many signs of disrepair 14 5 19
3,3% 1,2% 2,2%
Total 430 421 851
100,0% 100,0% 100,0%
Table 11: Maintenance of the site or house (chi-square = 8,116; df = 2; p = 0,017*)
Multiple locks visible
Burglarized
Yes No Total
Multiple locks visible Yes 20 7 27
4,8% 1,7% 3,3%
No 397 405 802
95,2% 98,3% 96,7%
Total 417 412 829
100,0% 100,0% 100,0%
Table 12: Multiple locks visible (chi-square = 6,309; df = 1; p = 0,012*)
40
Fence at the front
Burglarized
Yes No Total
Fence: Low 185 246 431
43,4% 58,9% 51,1%
High 63 55 118
14,8% 13,2% 14,0%
No front garden or fence 178 117 295
41,8% 28,0% 35,0%
Total 426 418 844
100,0% 100,0% 100,0%
Table 13: Fence at the front (chi-square = 21,715; df = 2; p < 0,001)
Fence at the back
Burglarized
Yes No Total
Fence: Low 13 4 17
3,1% 1,0% 2,0%
High 299 283 582
70,9% 68,7% 69,8%
No fence or back garden 110 125 235
26,1% 30,3% 28,2%
Total 422 412 834
100,0% 100,0% 100,0%
Table 14: Fence at the back (chi-square = 6,043; df = 1; p = 0,049)
41
Type of property
Burglarized
Total Yes No
Type of property: Corner house 113 95 208
26,3% 22,6% 24,5%
Terraced house 130 155 285
30,2% 36,9% 33,5%
Semi-detached 97 115 212
22,6% 27,4% 24,9%
Detached house 68 51 119
15,8% 12,1% 14,0%
Flat ground floor 22 4 26
5,1% 1,0% 3,1%
Total 430 420 850
100,0% 100,0% 100,0%
Table 15: Type of property (chi-square = 20,054; df = 4; p < 0,001)
People in the street
Burglarized
Yes No Total
People present in the street Yes 51 73 124
11,9% 17,4% 14,6%
No 379 347 726
88,1% 82,6% 85,4%
Total 430 420 850
100,0% 100,0% 100,0%
Table 16: People present in the street (chi-square = 5,197; df = 1; p = 0,023*)
42
Pedestrians
Burglarized
Yes No Total
Number of pedestrians crossing in
3 minutes:
0-5 402 403 805
94,4% 96,2% 95,3%
6-10 (medium) 16 15 31
3,8% 3,6% 3,7%
10+ (high) 8 1 9
1,9% ,2% 1,1%
Total 426 419 845
100,0% 100,0% 100,0%
Table 17: Number of pedestrians crossing (chi-square = 5,420; df = 2; p = 0,067)
Value of houses
Burgled N Mean Std. Deviation Std. Error Mean
WOZ_1k No 414 174,0797 67,21975 3,30367
Yes 416 166,7115 50,92289 2,49670
Table 18: Average value of houses (Independent Samples Test: Not Burglarized (M=174, SD= 67,2) and
Burglarized (M=166, SD=50,9); t=1,780, p = 0,075)
43
Appendix E
Dog evidence * Traffic volume
Traffic Volume
Burglarized yes/no
Total Yes No
Quiet Dog evidence Yes 10 19 29
3,0% 5,8% 4,4%
No 326 308 634
97,0% 94,2% 95,6%
Total 336 327 663
100,0% 100,0% 100,0%
Busy Dog evidence Yes 2 3 5
2,6% 4,1% 3,3%
No 74 71 145
97,4% 95,9% 96,7%
Total 76 74 150
100,0% 100,0% 100,0%
Table 19: Dog evidence x Traffic Volume (chi-square = 3,183; df = 1; p = 0,074)
44
Alarm evidence * Traffic volume
Traffic Volume
Burglarized yes/no
Total Yes No
Quiet Alarm evidence Yes 24 24 48
7,1% 7,4% 7,3%
No 312 302 614
92,9% 92,6% 92,7%
Total 336 326 662
100,0% 100,0% 100,0%
Busy Alarm evidence Yes 3 2 5
3,9% 2,7% 3,3%
No 73 72 145
96,1% 97,3% 96,7%
Total 76 74 150
100,0% 100,0% 100,0%
Table 20: Alarm evidence x Traffic Volume (chi-square = 0,012; df = 1; p = 0,913)
45
Traffic volume * Access to the rear
Access to the rear
Burglarized yes/no
Total Yes No
Yes Traffic Volume Quiet 166 159 325
87,4% 83,7% 85,5%
Busy 24 31 55
12,6% 16,3% 14,5%
Total 190 190 380
100,0% 100,0% 100,0%
No Traffic Volume Quiet 171 168 339
77,4% 80,0% 78,7%
Busy 50 42 92
22,6% 20,0% 21,3%
Total 221 210 431
100,0% 100,0% 100,0%
Table 21: Busy Traffic Volume x Access to the rear (chi-square = 0,442; df = 1; p = 0,506)