residential building approval processes in metro vancouver · the residential building approval...
TRANSCRIPT
Residential BuildingApproval Processes In
Metro VancouverYear 1: Focus on Townhouses
Dec 2014 - 01
DRAF
T

Table of Contents356
89
1012
14161718202122232425262729313233
343537384041
Getting to Groundbreaking Purpose and Expected Outcomes Summary of Best PracticesMethodology Laying the Groundwork
Meeting Metro Vancouver’s need for homes“All the easy land is gone”Planning is the foundationWhere townhouses fit
Getting to GroundbreakingThe cost of fees and charges to home buildingHighest, lowest and average fees and charges per unitThe cost of processing time to home buildingTime in the application process and concurrent processingThe range in process timing among municipalitiesHousing partnership indexWhy do municipal and applicant estimates differ?Impacts and delays in home buildingDigging into delaysConcerns and strategiesTaking the time to create valueBest practices and innovationsPre-application meetings
ConclusionsAppendix A: Municipal fees and charges for Harmony Homes Townhouse ProjectAppendix B: Additional regulations that would apply and incentives availableCase Studies
Neighbourhood resistance to townhouses New zoning, policy and municipal-led rezoning for townhouse developmentTownhouse development adding gentle density and preserving heritage
GlossaryNotes and ReferencesAcknowledgements
DRAF
T
The purpose of Getting To Groundbreaking is to:
1. Examine the residential building approval process from the perspectives of municipalities and home builders.
2. Compare differences, document similarities, and identify best practices among municipalities and home builders in the approval process. This year our focus is: townhouses.
Getting to Groundbreaking (G2G) is a housing research project that investigates practices in the approval process, the piece of housing development that happens before groundbreaking and construction. G2G was proposed by the Greater Vancouver Home Builders Association (GVHBA), because of their membership’s interest in the most efficient regulatory process for home building. At the same time, G2G depends on the active participation of municipalities, to provide data and insight into how to address the results in real-world situations.
Municipalities and home builders seek the same outcome through the residential approval process – housing that is sufficient in quality, type, quantity and affordability to meet residents’ needs. Home builders seek this outcome through an understanding of market supply, demand and profit. Municipalities aim to meet housing demand while promoting the public good in terms of urban design, environmental protection, equity and other values. These differing motivations can lead to conflict at times. G2G seeks to bring focus to the common outcome sought by
both home builders and municipalities and identify best practices that can meet the needs of both.
Each municipality in Metro Vancouver approaches local governance differently, and each operates in a different framework of environmental conditions, growth stages and rates, as well as political contexts.
Who Should Read This Report?
This G2G report is the result of a partnership between members of the home building industry, including the GVHBA and the Urban Development Institute (UDI), municipalities, Metro Vancouver, and others. The research has been conducted by researchers at the Simon Fraser University Urban Studies Program. We present the results of 2014 research into processes, experiences, and policies in residential building approvals, with a focus on townhouses. It is intended for a wide audience of people with an interest in our region’s housing, including:
- Home builders- Mayors, councillors and municipal staff- Regional, provincial and federal government- GVHBA and UDI- Housing journalists- Housing researchers- Housing advocates and other interested groups
The Municipal Residential Approvals Process In Metro Vancouver Year 1: Focus on Townhouses
Expected Outcomes of Getting To
Groundbreaking
3
DRAF
T

Expected Outcomes of Getting To
Groundbreaking
1. Align understanding about good practice in building approval processes amongst municipalities and home builders, leading to better working relationships in the public interest.2. Identify ways to reduce unnecessary time and cost in residential development approvals without sacrificing quality outcomes.
4
DRAF
T

Summary Of Best PracticesThe following are Best Practices in development approval processes, identified through our research into needs from both the municipal and builder sides. You can find more information about each on the referenced page(s).
Accessible and Complete Information Online: This includes information about process, web-based application tracking and other open data technology applications, and a single point of reference for all fees and charges. (p.27, 29-30)
Pre-Application Meetings: Successful pre-application meetings feature good preparation, the “right” people in the room, and laying out a feasible set of expectations and timelines. (p.31-32)
Predictable Costs and Charges: Clarity about how fees and charges are calculated and applied add certainty to the development planning process. (p.16-17)
Complete Applications: Applicants must ensure professional attention to detail andcompleteness. For fairness and efficiency,
municipalities should use an application checklist and refuse to accept incomplete applications. (p.26-27)
Concurrent Processing: Review of different stages of the development application (e.g. rezoning and development permit), when planned for carefully, can add efficiencies. (p.20-22)
File Champions and Coordinated Teams: A single point of contact or file manager for both municipality and applicant team helps with accountability, due diligence, and flow of information. (p.26-27)
Better Public Engagement: Providing neighbours and interested groups with up-front and accessible information and opportunities for feedback on proposed development. (p.35)
Municipal Staff Empowerment: Delegation of authority to staff to interpret policy, find context-specific solutions, and manage the review process. (p.38)
Effective Partnership: All parties benefit from occasional development forums hosted by municipalities to educate applicants on unique processes and needs. Sharing practices enables a culture of collaboration and continuous improvement. (p.23, 28)
Policy Clarity: Providing Official Community Plan, zoning bylaw, housing development plans and housing policies that are unambiguous will assist builders to make applications that meet the desired objectives. (p.36-37)
5
DRAF
T
Methodology
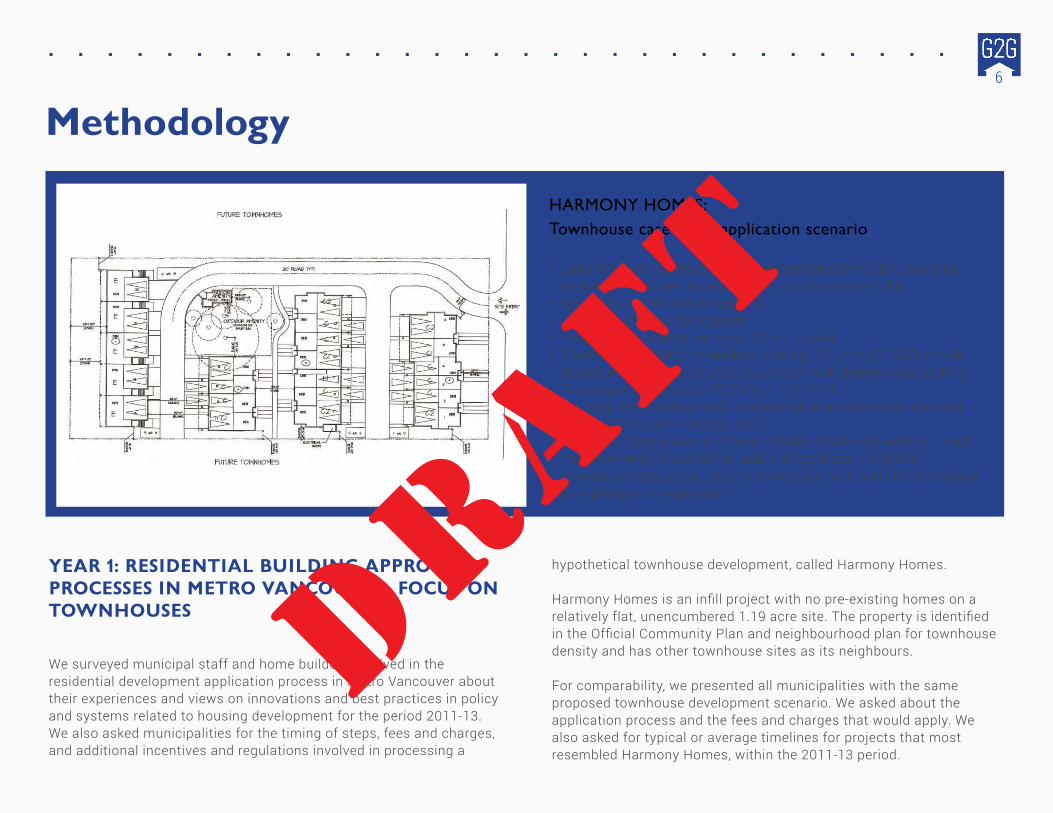
YEAR 1: RESIDENTIAL BUILDING APPROVAL PROCESSES IN METRO VANCOUVER. FOCUS ON TOWNHOUSES
We surveyed municipal staff and home builders involved in the residential development application process in Metro Vancouver about their experiences and views on innovations and best practices in policy and systems related to housing development for the period 2011-13. We also asked municipalities for the timing of steps, fees and charges, and additional incentives and regulations involved in processing a
hypothetical townhouse development, called Harmony Homes.
Harmony Homes is an infill project with no pre-existing homes on a relatively flat, unencumbered 1.19 acre site. The property is identified in the Official Community Plan and neighbourhood plan for townhouse density and has other townhouse sites as its neighbours.
For comparability, we presented all municipalities with the same proposed townhouse development scenario. We asked about the application process and the fees and charges that would apply. We also asked for typical or average timelines for projects that most resembled Harmony Homes, within the 2011-13 period.
HARMONY HOMES: Townhouse case study application scenario
• Land requires rezoning (RZ), development permit (DP), building permit (BP), as well as subdivision to consolidate 2 lot• Servicing agreement is required• 1.19-acre site, no dedications• Proposed 18.4 units per acre, 22 units yield• 7 units @ 1600 sf with tandem parking, 10 units @ 1600 sf with double wide parking, 5 units @ 2100 sf with double wide parking• Total square footage is 37,700 sf, 0.73 FSR• Building construction cost is assumed at an estimated regional average $113 psf = $4,260,100• Off-site infrastructure estimate includes boulevard and half road improvements, street lights, and 3 street trees = $78,000• On-site landscape cost estimate includes hard and soft landscape plus playground equipment
6
DRAF
T
Sample
Respondents to our survey include 14 Metro Vancouver municipalities and UBC [1]. Burnaby, New Westminster and City of Langley did not respond; Anmore, Belcarra, Bowen Island, Lion’s Bay, and Tsawwassen First Nation were excluded due to small size and limited housing development. Our sample of home builders drew from townhouse builders who are members of the GVHBA and the Urban Development Institute, the industry associations of home building professionals, as well as the BC Non-Profit Housing Association and BC Housing.
In total, we received 38 applicant responses that reflected 142 projects across all 18 major municipalities during 2011-13. The sample represents 56% of eligible townhouse builder members of the GVHBA, plus additional respondents. Small, medium and large home building companies were represented. Considering the sensitive nature of some of the questions we asked, and the “groundbreaking” quality of this initial survey, this sample size exceeded the expectations of G2G researchers.
Study Limitations
Study limitations include sparse applicant feedback in some municipalities where few townhouses were built in 2011-13. Each housing development process is different, and given the variety of municipalities and home builders, our sample may not represent the extent of variation in experiences. An additional consideration is that the density and configuration of Harmony Homes makes it an unlikely project in the most urban municipalities. Nonetheless, Harmony Homes was designed for a plausible fit region-wide and is a useful tool to assess typical process steps, timelines, fees and charges. Finally, non-response bias is difficult to estimate in this case. That is, it is unknown whether either those who did not respond have something in common that would represent a significant change to the study results.
Reliability and Review
To ensure data reliability, we conducted face-to-face interviews with respondents to verify survey responses and gather more contextual understanding. This report also underwent multiple rounds of review and revision by the G2G Advisory Committee, the Development Committee of the GVHBA, staff and members of UDI, and municipal participants in the Regional Planning Advisory Committee. Two university-based housing researchers from outside the region conducted arm’s length peer review.
Applicant-supplied data is reliable for Metro Vancouver as a whole, which is how it is usually presented. Home builder data is reliable for particular municipalities, especially Surrey, where 42% of the region’s new townhouses were built in the 2011-13 period, and where our sample is estimated to be 29%. In most cases, however, we have presented home builder-supplied data either aggregated to the region as a whole or combined with other data to add reliability.
Looking Ahead
In future reports, G2G research will focus on particular development scenarios, in a rotating cycle, based on the housing types below. We’ll reveal insights into best practices, as well as each municipality’s typical approval process timing, fees and charges related to specific housing types:
- Townhouses (2014)- Apartment buildings - Single family homes
Periodically, we’ll dig deeper into topical themes including: renovations, non-profit housing, district energy, green building, amenity policies, parks, as well as other topics that affect the housing supply.
7
DRAF
T

LA
YIN
G T
HE
GR
OU
ND
WO
RK
Meeting Metro Vancouver’s need for homes
5000
4000
3000
2000
1000
0
LANGLEY CITY
PITT MEADOWS
PORT COQUITLAM
PORT MOODY
WHITE ROCK
NORTH VANCOUVER
CITY
NORTH VANCOUVER
DISTRICT
WEST VANCOUVERUBC
DELTA
MAPLE RIDGE
NEW WESTMINSTER
LANGLEY TOWNSHIP
BURNABY
COQUITLAM
RICHMOND
SURREY
VANCOUVER
HO
US
ING
UN
ITS
2011-13 Net Housing Growth Annual Housing Demand Estimates
20,000
10,000
0
Net Housing Growth
2011 2012 2013
Metro Demand Estimates
Figure 1: Region-wide net housing growth and housing demand estimates [2]
Figure 1. Are we on pace to meet estimated housing demand? [2]
B y 2 0 4 1 , M e t ro Va n c o u v e r w i l l n e e d n e a r l y h a l f a m i l l i o n n e w h o m e s to h o u s e m o re t h a n o n e m i l l i o n n e w re s i d e n t s .
Our current regional population is growing at a rate of 3000 new residents per month [1]. We are responsible for accommodating this influx with homes that meet residents’
needs, in a way that preserves and enhances quality of life for all of us. Municipalities and home builders are key actors in this effort and need to work together to implement plans, identify best practices and encourage the best housing outcomes possible.
Figures 1 and 2 show that on average in the past 3 years, regional housing development
development has fallen short of meeting our current demand estimates. Three municipalities have kept pace with estimated demand over the past 3 years: Vancouver, the City of North Vancouver, and UBC. The past 3 years represents a time of recovery from the 2008 recession and home building may again be on an incline in the normal cyclical pattern of this industry.
8
DRAF
T

“All the easy land is gone”
Over and over again, home builders and municipalities told us this: “all the easy land is gone.” The “easy land” is greenfield land, with limited built or policy constraints from previous development. Infill development is harder because constraints exist: the land may not be in an ideal shape or size, so that planning and design processes need to be more creative. The land may have existing structures or infrastructures that need to be dealt with, sometimes remediated. It may have neighbours and neighbouring uses that need to be considered and consulted.
While pockets of our region, like the City of Vancouver’s urban core, are some of the densest in the region, Metro Vancouver as a whole is less densely populated than Toronto or Montreal [4]. And yet, with the North Shore mountains, the Strait of Georgia, the US border to the south, and
critical agricultural as well as industrial land protected throughout, space available for home building is extremely tight.
Figure 3 shows that only 9% of the region’s land is classified as “open and undeveloped” or greenfield land, while 15% of the region is classified as residential land, where infill development may take place. This represents a significant change from the 1970s, when regional planners predicted sufficient greenfield land to accommodate growth for 50 years [5]. Forty years later, Metro Vancouver now estimates that only 25% of new growth can occur on greenfield land. This means that 75% of the half million new homes we will build in the region by 2041 will be on infill land, in someone’s neighbourhood, someone’s backyard. And this means that, increasingly, housing will be developed at higher densities and in multi-unit forms [6].
ProtectedLand
(watershed, natural areas)
39%Ports
1%Residential
15%
Open andUndeveloped
9%
Institutional2%
Industrial6%
Commercial1%
Agricultural19%
Transportationand Roads
8%
Figure 2. Land use proportions in Metro Vancouver [3]
LA
YIN
G T
HE
GR
OU
ND
WO
RK
9
DRAF
T

In this region, a robust regulatory and planning framework contributes to our quality of life. Regional planning, official community planning, neighbourhood planning, and long-term policy processes to work to address increasing expectations and provide opportunities for municipalities and residents to engage in big picture, long term thinking. The residential building approval process fits within this larger structure.
Municipalities can’t achieve their planning goals working alone. They sometimes leverage new development to advance public objectives. Based on a broad understanding of local issues, municipal plans chart a course for long-term resilience and sustainability. G2G research found that municipalities use a variety of tools and approaches to guide development that addresses local objectives , particularly in the shift toward smart growth and sustainability. The most common incentive to meet sustainability goals is a density bonus. Results are summarized in Figure 3.
Housing built by private sector home building companies accommodates 95% of our region’s residents [8]. G2G asked home builders whether the housing they built in 2011-13 meets key goals identified in regional and municipal plans. As Figure 4 shows, a majority are on board with building more diverse kinds of housing and with making better use of existing infrastructure by increasing housing density near transit. Slightly less than half are building green and building for people with disabilities. Housing built specifically for rental remains a challenge for the majority.
Density bonus incentive
Streamside developmentpermit areas
Green buildingrequirement
District energyrequirement
Neighbourhood plansinclude transit-oriented
developement
0 2 4 6 8 10 12
Sustainability checklist
Number of Municipalities
SAMPLE OF SUSTAINABILITY INITIATIVES IN METRO VANCOUVER DEVELOPMENT PROCESSES
Figure 3. Sampling of Sustainability Requirements and Voluntary Initiatives in Metro Vancouver Development ProcessesFigure 3. Sampling of Sustainability Requirements and Voluntary Initiatives in Metro Vancouver Development Processes
Planning is the Foundation
LA
YIN
G T
HE
GR
OU
ND
WO
RK
Municipal Staff Empowerment: Delegation of authority to staff to interpret policy, find context-specific solutions, and manage the review process. (p.38)
Effective Partnership: All parties benefit from occasional development forums hosted by municipalities to educate applicants on unique processes and needs. Sharing practices enables a culture of collaboration and continuous improvement. (p.23, 28)
Policy Clarity: Providing Official Community Plan, zoning bylaw, housing development plans and housing policies that are unambiguous will assist builders to make applications that meet the desired objectives. (p.36-37)
10
DRAF
T

Figure 4. Home Builders’ Activities Meeting Key Planning Needs.
Green BuildingYES - 41.9% NO - 58.1%
YES - 54.8% NO - 45.2%
Diversity In Housing Stock
Increasing Density Near Transit
Purpose Built Rental
Housing For Persons With Disability (Visitable, Adaptable Or Accessible)
YES - 51.6% NO - 48.4%
YES - 9.7% NO - 90.3%
YES - 41.9% NO - 58.1%
IN 2011-13, DID YOUR COMPANY’S HOME BUILDING ACTIVITIES MEET THESE PLANNING GOALS?
11
DRAF
T

Townhouses, the focus of this year’s G2G report, are a form of medium density ground-oriented housing. Many municipalities support increased development of townhouses as a way to add gentle density to traditional housing. Townhouses are a desirable alternative housing form for families because they are ground-oriented.
The number of townhouses built has remained roughly the same in the region, despite a downward trend in the percentage of townhouses being built in the past 3 years: 2279 or 18% in 2011, 2879 or 17% in 2012, and down to 2211 or 12% in 2013 (Figure 5). The map in Figure 6 shows that townhouses account for up to 20% of housing in Richmond and Port Moody and a large proportion of housing completions in the eastern and southern municipalities for 2011-13. They are less prevalent in more urban municipalities, like Vancouver, that are building higher density (apartments) as well as more suburban municipalities, like Delta, that are building more single family and semi-detached (duplex) housing.
Figure 5. Change in Housing Type Mix and Housing Completions, Region-wide, 2011-13 [9]
20,000
HO
US
ING
UN
ITS
10,000
3%
18%
32%
47%
3%
17%
28%
52%
2%
12%
25%
61%
02011 2012 2013
Semi-detached housing completions Townhouse completions
Single detached housing completions Apartment housing completions
LA
YIN
G T
HE
GR
OU
ND
WO
RK
Where townhouses fit
12
DRAF
T

2%
15%3%
28% 54%
18%
HOUSING TYPE AS %OF ALL HOUSING BUILT
(3 yr avg. 2011-13)
TOWNHOUSES AS %OF ALL HOUSING STOCK
75%
80%
66%
65%2%
4%97%
1% 2%
64%10%
28%
54% 3%15%
28%
30% 38%
15%17%
6%8%
25%
30%
25%
45%
50% 3%22%
25%
58%
14%
82%22%
24%
2%
52%
9% 1%8%2%
26%
71%1%
10%
18%
32%
97%37% 33%
30%
31%
35%
47% 43%
10%
2%
3%
5%
28%
8%4%
5%
Apartment housing completions
Single detached housing completions
Row housing completions
Semi-detached housing completions
20%
15%
10%
5%
0%
Dist r i c t o fNor t h Vancouver
West Vancouver
C i t y o f Nor t h Vancouver
UBC
Vancouver
Burnaby
New Westminster
Surrey
C i t y o fLang ley Townsh ip o f
Lang ley
Maple R idge
Por tCoqu i t lam
Por t Moody
Coqu i t lam
Pi t t Meadows
Whi te Rock
Del ta
R ichmond
- Shown above: regional average proportions
Figure 6. Townhouses in the Housing Stock and as a % of New Housing Built, 2011-2013 [10]
13
DRAF
T

The Cost Of Fees And Charges To Home Building
The Metro Vancouver region has layers of permits, regulations, fees and charges that exist in order to ensure the safety, adequacy and quality of our communities as we grow. The amount and type of fees imposed on new development applications vary across the region’s 22 municipalities. This variation is necessary because of differences in governance, challenging terrain, environmental risks, pace of growth and future growth trajectories, and community visions and plans.
Development Cost Charges or Levys (DCCs or DCLs) are fees paid by developers to municipalities and the regional district to help pay the cost of new infrastructure (roads, water, wastewater, sewerage, parks). These fees are designed to ensure that development pays for the infrastructure new residents will need. In this way, existing residents are not burdened with all the costs of growth. Their rationale and method of application are dictated by Provincial legislation as a tool that municipalities can use to help finance the cost of infrastructure related to growth [11].
Generally, DCCs are lower in municipalities with an existing street network and urban infrastructure, and higher in newer municipalities. In built-out and densely populated City of North Vancouver, for example, DCCs are collected primarily for roads and park acquisition, whereas in the City of Surrey, where greenfield land remains, DCCs are required for both of these plus sewers, sanitary and stormwater systems. Fees also differ according to housing type, number of occupants, and sometimes by neighbourhood. As a general rule, as a municipality approaches build-out, DCCs often decline and Community Amenity Charges (CACs,
discussed next) increase. For Harmony Homes, respondents referred to charges applicable in a specific neighbourhood, shown in Appendix A along with the full table of fees. Figure 7 shows how the fees and charges break out for Harmony Homes in the different municipalities of the region. Definitions are provided in the Glossary.
Total value of fees is one factor to consider, but in terms of encouraging a fair, adequate and efficient application review process, predictability in fees and charges is key. CACs are defined are defined by the Province as “amenity contributions agreed to by the applicant/developer and local government as part of a rezoning process initiated by the applicant/developer” [12] which can be used to finance infrastructure that cannot be funded by other development charges. CACs have become a tool used by the majority of municipalities in our region to help ensure that “growth pays its way” and have resulted in infrastructure and amenities with local and wider benefits.
In Figure 7, from left to right, this creates three categories: 5 municipalities which do not charge CACs or for which Harmony Homes would be CAC-exempt; 6 municipalities that do charge CACs and could report their cost; and 6 municipalities whose amenity contributions are negotiable on a case-by-case basis. Overall, the range of values of CACs for Harmony Homes is from $0 to $104,429 or an average of $41,121 among those municipalities that charge CACs.
When CACs are not knowable at the outset, applicants cannot accurately calculate the value they should pay for the land, which adds uncertainty to project costs. A number of municipalities are moving toward greater predictability in amenities charges, as recommended in the 2013 Provincial CAC guide. The City of North Vancouver is working toward a CAC rate per square foot, and the City of Vancouver has established CAC targets for six areas of the city [13]. The City of Surrey has a Neighbourhood Concept Plan system which sets charge rates tailored for each neighbourhood in order to meet its planned land use needs.
14
DRAF
T

$0
$500,000
$900,000
NOTES:1. Burnaby, New Westminster, and City of Langley calculations were not reported by municipalities but were calculated based on documentation provided to research team (indicated by lighter shading).2. Surrey CAC includes a neighbourhood specific charge, and a public art fee of $10,650.3. Richmond CAC is the total of Public Art and Affordable Housing fees. These values are $29,029, and $75,400 respectively.4. Other fees include small charges for Tree By-laws and Pre-app Fees. Municipal specific fees include: Maple Ridge - Phased Strata Review, District North Van - Development Servicing Agreement, Township of Langley - Parkland Acquisition and Engineering Fees.5. GVS+DD DCCs and School Site Acquisition Charge rates are not controlled by municipalities.
Rezoning
Subdivision Permit
Offsite Servicing Monitoring
Landscaping Review
Other fees
School Site Acquisition Charge
GVS+DD DCC
Total DCCs
Building Permit
Development Permit
Stormwater Management
CACs
Figure 7.
Itemized Costs of Fees and Charges in Metro Vancouver Municipalities for Harmony Homes
?
?
?
?
?
?
?
CACs not collected Predictable CACs CACs not known
COQUITLAMDELTA
PORT COQUITLAM
VANCOUVER
RICHMOND
PITT MEADOWS
SURREY
MAPLE RIDGE
DISTRICT OF
NORTH VANCOUVER
LANGLEY TOWNSHIP
WEST VANCOUVER
CITY OF LANGLEY
CITY OF
NORTH VANCOUVER
NEW WESTMIN
STER
PORT MOODY
BURNABY
METRO AVERAGE
WHITE ROCK
15
DRAF
T

Per unit fees and charges vary region-wide from a low of $8,390 in White Rock to a high of $35,190 in Richmond. As a percent of the median sales price of a new townhouse in 2011-13, Surrey comes out the highest with fees equal to about 10% of the average sales price of a new townhouse in the city, and Port Moody comes out lowest, with fees equal to about 1.8% of the unit price. The average cost of fees and charges for a townhouse in Metro Vancouver is $17,231 per unit or about 4.0% of the median sales price for a new townhouse of $427,090.
The relationship of this cost increment to the sales price of a home is unclear and variable. The implications of these fees and charges on the affordability of the townhouse is complicated by the fact, also shown in Figure 8, that a median townhouse in Surrey sold for about $136,000 less than one in Port Moody, between 2011-2013.
The impact of these costs on home buyers depends on a whole host of factors including: demand for housing, housing supply, housing types and forms and mortgage rates. It also depends on what happens to property taxes over time as a result of the new infrastructure and services provided. Fees and charges may also affect the rate of development over the long term, depending on factors like: comparative fees and charges in nearby municipalities, the size of the company and its land holdings, and the price of land.
Figure 8. Municipal Fees and Charges in Dollars Per Unit and as % of Benchmark Selling Price of New Townhouse, With Median Selling Price of Townhouse [14]
10%
5%
$35,190/unit
SURREY(mdn price - $339,539)
METRO VANCOUVER(mdn price - $427,090)
PORT MOODY(mdn price - $475,577)
$17,231/unit
$8,390/unit
0
Highest, Lowest and Average Fees and Charges Per Unit
16
DRAF
T

The Cost Of Processing Time To Home Building
Figure 9. Schematic of Development Application Process for Townhouse Project
“
”
I’ve been a municipal development planner since 1994, and it has gotten so much more complicated. It used to be 3-4 referrals and now it’s up to 10. We do so many more steps along the way. It’s provincial requirements, federal requirements, it’s council’s vision, it’s public expectations. The level of legal documentation that we have to prepare for a simple rezoning application … used to be much simpler for both sides. – Municipal staff
The residential development approvals process involves many considerations, a range of demands for input and expertise from different groups within municipalities, including elected officials, as well as other experts and regulators, the development industry, and the public. While many specific steps vary amongst municipalities, Figure 9 presents an overview of the general steps involved in the residential development approval process for a typical townhouse project.
17
DRAF
T
“
”
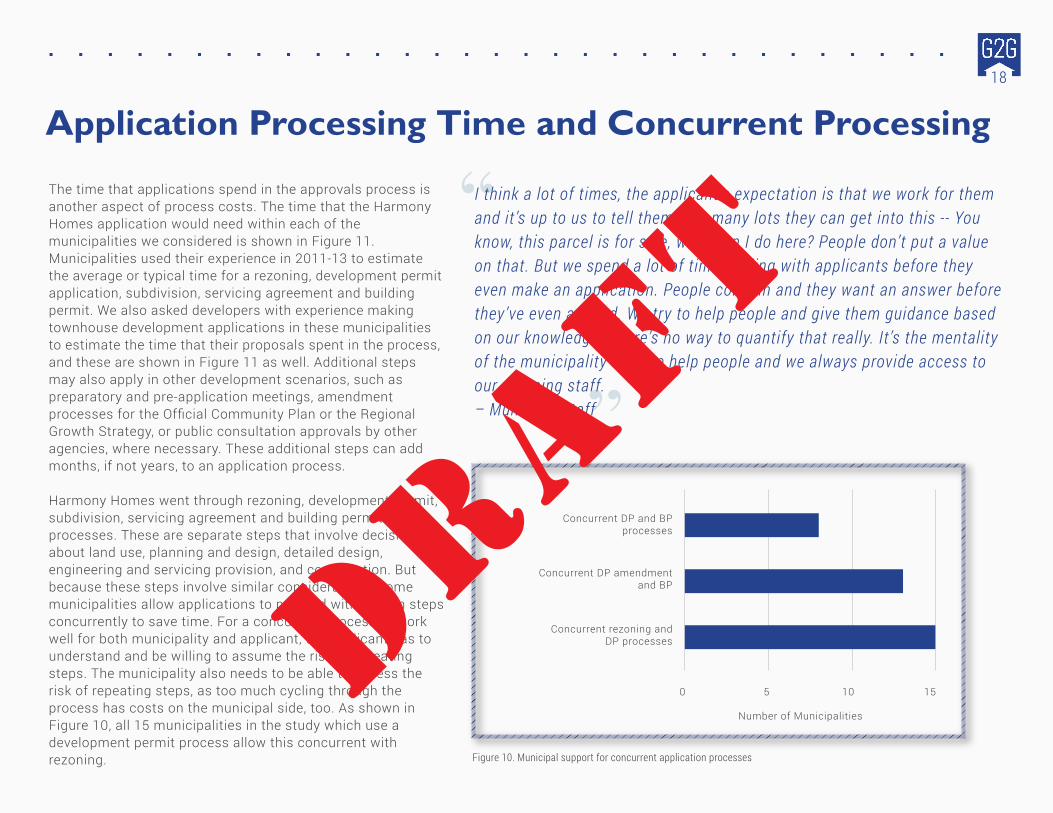
The time that applications spend in the approvals process is another aspect of process costs. The time that the Harmony Homes application would need within each of the municipalities we considered is shown in Figure 11. Municipalities used their experience in 2011-13 to estimate the average or typical time for a rezoning, development permit application, subdivision, servicing agreement and building permit. We also asked developers with experience making townhouse development applications in these municipalities to estimate the time that their proposals spent in the process, and these are shown in Figure 11 as well. Additional steps may also apply in other development scenarios, such as preparatory and pre-application meetings, amendment processes for the Official Community Plan or the Regional Growth Strategy, or public consultation approvals by other agencies, where necessary. These additional steps can add months, if not years, to an application process.
Harmony Homes went through rezoning, development permit, subdivision, servicing agreement and building permit processes. These are separate steps that involve decisions about land use, planning and design, detailed design, engineering and servicing provision, and construction. But because these steps involve similar considerations, some municipalities allow applications to proceed with certain steps concurrently to save time. For a concurrent process to work well for both municipality and applicant, the applicant has to understand and be willing to assume the risk of repeating steps. The municipality also needs to be able to assess the risk of repeating steps, as too much cycling through the process has costs on the municipal side, too. As shown in Figure 10, all 15 municipalities in the study which use a development permit process allow this concurrent with rezoning.
Concurrent DP and BPprocesses
Concurrent rezoning andDP processes
0 5 10 15
Concurrent DP amendmentand BP
Number of Municipalities
Figure 10. Municipal support for concurrent application processes
I think a lot of times, the applicant’s expectation is that we work for them and it’s up to us to tell them how many lots they can get into this -- You know, this parcel is for sale, what can I do here? People don’t put a value on that. But we spend a lot of time dealing with applicants before they even make an application. People come in and they want an answer before they’ve even applied. We try to help people and give them guidance based on our knowledge. There’s no way to quantify that really. It’s the mentality of the municipality that we help people and we always provide access to our planning staff.– Municipal staff
Application Processing Time and Concurrent Processing18
DRAF
T

Figure 11.
0
50
90
12
SURREY
COQUITLAM
8
DELTA
20
TOWNSHIP OF LANGLEY
29
VANCOUVER
25
WEST VANCOUVER
20
32
DISTRICT OF
NORTH VANCOUVERCITY OF
NORTH VANCOUVER
20
PORT COQUITLAM
17
MAPLE RIDGE
39
57
WHITE ROCK
12
30
RICHMOND
29
PORT MOODY
24
PITT MEADOWS
23
one year
Rezoning (RZ)
Development Permit (DP)
Subdivision and Servicing Agreements (SD.S)
Building Permit (BP)
Applicant Experience in Application Process Timing
3rd Reading
? Unclear Time Estimatebetween 3rd and 4th reading
NOTES• Results are reported by 14 municipalit ies and 26 applicant- supplied complete project estimates (averaged).• Municipalit ies responded regarding the average or typical results for townhome application processing in 2011-13. Applicants responded regarding actual results from their recent townhome development application experience. This difference in the nature of the question can account for some of the differences in results. • In smaller municipalit ies, with fewer townhome developments on which to report in 2011-13, data may be less accurate.• DP process not applicable for the area selected in City of North Vancouver.• Data not available for Burnaby, New Westminster, City of Langley.• “?” Indicates best t ime estimate for municipalit ies unable to estimate t ime between 3rd and 4th bylaw reading (see p. 23)
WEE
KS
Timing of Development Application Process for Harmony Homes
The Metro Vancouver region has layers of permits, regulations, fees and charges that exist in order to ensure the safety, adequacy and quality of our communities as we grow. The amount and type of fees imposed on new development applications vary across the region’s 22 municipalities. This variation is necessary because of differences in governance, challenging terrain, environmental risks, pace of growth and future growth trajectories, and community visions and plans.
Development Cost Charges or Levys (DCCs or DCLs) are fees paid by developers to municipalities and the regional district to help pay the cost of new infrastructure (roads, water, wastewater, sewerage, parks). These fees are designed to ensure that development pays for the infrastructure new residents will need. In this way, existing residents are not burdened with all the costs of growth. Their rationale and method of application are dictated by Provincial legislation as a tool that municipalities can use to help finance the cost of infrastructure related to growth [11].
Generally, DCCs are lower in municipalities with an existing street network and urban infrastructure, and higher in newer municipalities. In built-out and densely populated City of North Vancouver, for example, DCCs are collected primarily for roads and park acquisition, whereas in the City of Surrey, where greenfield land remains, DCCs are required for both of these plus sewers, sanitary and stormwater systems. Fees also differ according to housing type, number of occupants, and sometimes by neighbourhood. As a general rule, as a municipality approaches build-out, DCCs often decline and Community Amenity Charges (CACs,
19
DRAF
T
The results are more mixed for concurrent development permit and building permit applications, with 8 municipalities allowing concurrency (District of North Vancouver, Langley, Maple Ridge, Port Moody, Richmond, Surrey, UBC, Vancouver). Where an amendment is required after receiving a DP, an applicant can still go ahead with a BP application in all municipalities except Delta and White Rock. Some municipalities reported that although concurrent processes are possible, many applicants avoid making their DP application until the bulk of the rezoning work is complete. Some only allow concurrent processes if the applicant makes a persuasive case for the public value of their project. Still others actively encourage concurrent applications through a lower fee structure when multiple applications are made at one time.
Municipal estimates of processing timing ranged widely, from a low of 39 weeks in White Rock, to a high of 72 weeks in Maple Ridge. Applicant estimates across municipalities range from 47 to 92 weeks, or nearly 1 to nearly 2 years. As an example of the cost this represents to the land owner, an acre of serviced land in South Surrey has a value of about $1.5 million. With a 5% mortgage rate, the land owner would incur holding costs of over $1,500 per week for this land, or over $75,000 per year. These accumulating costs represent a strong motivation for land owners to increase process efficiency.
Municipalities have a vested interest in reducing unnecessary “churn” or back-and-forth review between the parties in the process. One good indication of a productive working environment for housing development is a match in the timing estimates between applicants and municipalities. While some estimates differ by 30 weeks or more, Delta, Surrey and the District of North Vancouver stand out for a relative match between municipal and applicant timing estimates [15].
“
”
We try and set rough timelines and say: here is this application, we need comments back but it’s a necessary part of application processing. You need to get input from traffic people, utilities, servicing, dikes, draining, planning. There’s always a sense that how come my application’s not moving ahead quickly. And then coordinating everybody’s input and making sure it’s not conflicting, that’s a necessary part of dealing with complex applications, particularly.– Municipal staff
The Range In Process Timing Among Municipalities
20
DRAF
T

What makes a municipality a great place for home building is not a simple formula of low fees and quick processing times. The top ten results of our Housing Partnership Index, shown here, demonstrate that results can come from a number of different efforts in different contexts. In Langley Township, a relative abundance of greenfield land and a large number of townhouse development applications in the past three years make the process more streamlined and efficient. Richmond fares well for an effective website and digital communications. Vancouver’s good results here are driven by the recognized professionalism and dedication of staff and a high level of specificity of regulations. Port Moody, with very little greenfield land, has lower fees and charges.
Our composite Housing Partnership Index factors in fees,charges and timing specific to the Harmony Homes scenario, and the regulatory process and contextual qualities considered important in the research interviews we conducted [16].
This is a 4-point composite index calculated based on normalized ranked scores for (1) total fees and charges, with attention to predictability; (2) overall processing time, with attention to concurrent application processing; (3) estimated score for municipal culture as per qualitative home builder survey response to the question “Describe the culture of the municipalities where you work”; and (4) estimated score for municipal survey response to the question “What factors make your municipality unique when it comes to the residential development approval process?”. All 4 variables equally weighted. It should be noted that half of the index score is specific to townhouse development and half is with respect to development in general.
HOUSING PARTNERSHIP INDEX
#1 - Langley Township
#2 - Richmond
#3 - Vancouver
#4 - Port Moody
#5 - Coquitlam
#6 - Surrey
#7 - Maple Ridge
#8 - White Rock
#9 - Port Coquitlam
#10 - City of North Vancouver
Housing Partnership Index
21
DRAF
T

Why Do Municipal And Applicant Estimates Di�er? While every development process carries some level of uncertainty, different stages of the approval process bear different levels of unknown timing, decision-making and practical challenges. In general, the level is higher at the initial stages and decreases toward the building permit stage. Municipalities and applicants respond to these uncertainties in different ways. G2G research revealed three points at which time estimates can expand.
1. Municipalities place different emphases on the role of staff or council early in the process. Getting an application in front of council for 1st bylaw reading can give applicants an early sense of the overall feasibility of their proposal. By contrast, other municipalities emphasize comprehensive staff review and early design feedback. A fast track to 1st reading can save time by reducing the volume of late stage revisions required in a development application. Other times, this practice can create unrealistic expectations about the level of certainty in the application, which can raise public concerns and draw out the process.
2. The period between bylaw 3rd reading and adoption or enactment (4th reading) is another stage at which timelines can diverge. At 3rd reading, the third time an application comes before council, the applicant typically receives the feedback that the project will be approved once a number of specific development conditions are met and legal agreements delivered. Coquitlam can get to this point in 8 weeks; in Maple Ridge, this happens at week 39. The period between 3rd reading and enactment is indicated in Figure 12 by a wavy line in instances where the municipality was unable to estimate the time that applicants require to move to final approval. Municipalities report that the “ball is in the applicant’s court” at this time, and that “many applicants do not wish to proceed quickly after 3rd reading. Applicants suggest, by contrast, that getting the attention of municipal departments during this time can be what holds up the process.
3. The time taken to receive a building permit is estimated as the time to obtain comments from the building permit plan checker. Comments provided at this time that require additional work by the applicant can mean that this piece of the process will take longer.
“
”
Even the rezoning application, it’s so variable. We have an application coming in, probably going to have 30 townhouses, and we know that the public is going to start screaming the second the sign goes up, because the previous application for the same thing failed. So that public consultation process is going to take a long time just to get it to a point where we have a proposal that’s been vetted, before we take it to council. In other cases, it may go much faster. This is assuming everything goes smoothly, no public or political issues, the applicant responds to all our questions, and staff availability.– Municipal staff
“”
It’s frustrating because at the Building Permit stage, the engineering department has seen the proposal for a year, but they still require changes at the end.– Builder
22
DRAF
T

Impacts and Delays in Home Building
“”
We’re building the most energy-efficient homes Vancouver has seen, but the extra layers of design and landscape review that come with this make it impossible for us to get [what] we need. Right now, we need about a building permit per month to keep the business running, and it’s taking 2-6 months. We’re going to have to lay off staff this summer as a result. And I’m not sure the City is getting a good return on its investment in this extra level of scrutiny, either.– Builder
How do these processing timelines, fees and charges ultimately affect the housing supply? Figure 12 demonstrates that over 30% of home builders responding to our survey feel pinched by the combined impact of (1) approval process timing and (2) fees and charges on their development applications. Approval processing time has a greater impact on home building activity than do fees and charges. These impacts on the home builder’s bottom line have carry-over impacts on land acquisition, the pace of building, location of development, and the type of housing that gets built. These factors may not have an immediate impact on home prices in our region, but over time, their effects show in land prices, housing prices, and housing supply. Figure 12 also shows that development incentives put in place by municipalities aren’t perceived as enough to offset the impacts of fees or time in the applications process.
In order to move housing development toward greater affordability, energy efficiency and sustainability, heritage preservation, and other local goals, some municipalities put regulations and incentives in place. These may require a level of energy performance, inclusion of affordable units, or unit accessibility, or may incentivize increases in the floor area built, may transfer density from one site to another, reduce fees per unit, expedite processing times, or take other forms. Figure 12 shows that few builders have found these incentives worthwhile. Regulations along these lines applicable to Harmony Homes, and incentives that could be available to the applicant in different municipalities, are shown in Appendix B.
In 2011-13, municipal approvals process timing or fees caused my company to:
Have lower profit margins
T I M I N G F E E S 21.7%/8.9%
Utilize a development incentive
0%/0.8%T
Increase project starts
1.5%/0.7%T F
Reduce home building activity
9.8%/2.3%T F
Acquire land but postpone development
10.3%/2.3%T F
Postpone land acquisition
11.3%/3.2%T F
Build homes in a different municipality
7.2%/1.0%T F
Change the type of housing built
12.1%/2.3%T F
Figure 12. Impact of Fees and Timing on Home Building Activity [16]
“”
Part of our job is to try and elevate; improve applications. 8 years ago we were hardly doing townhouse projects; we have worked hard to encourage that form in parts of the city. There is always a battle trying to introduce something new that a community hasn’t seen before.– Municipal staff
23
DRAF
T

Digging into delaysBoth municipalities and applicants can cause delays in application processing time. In Figure 13, both municipalities and applicants report circulation time for interdepartmental review as a major slow point. Municipalities also note incomplete applications, which is generally matched by applicants being unsure of all requirements from the outset, and dealing with conflicting requirements from different departments. The time needed to resolve differences in design philosophy between municipalities and applicants is another point at which delays occur. Other important factors include slow applicant and municipal response.
* % home builder responses, weighted by municipality, considering work in 13 municipalities
Applicants: What causes delays?
Satisfying conditions of approval25.3
Slow or no response from municipal staff19.52
Slow or no response from my team to suggested revisions5.64
Significance of changes or additional work required18.36
Scheduling and attending public meetings (where required)7.5
Scheduling and attending committee meetings0.73
Difference in design philosophy13.98
Conflicting requirements from different departments20.85
Circulation time between departments26.5
Municipality deeming the application complete6.8
* responses from 15 municipalities
Municipalities: What causes delays?
Insufficient staff at peak times2
Unavailability of qualified staff at peak times1
Volume of applications3
Public consultation scheduling3
External agency responses2
Difference in design philosophy between applicant and municipality10
Conflicting requirements from different departments and agencies3
Circulation time between different departments9
Figure 13. What causes delays, applicants and municipalities
24
DRAF
T

Figure 14 shows the predominance of the time taken up by engineering review for on-site servicing requirements, second to building section review. This is not surprising; it is at the building elements review stage that most referrals occur, including review for engineering, fire, plumbing, electrical engineering, and landscape. Some municipalities allow the use of developer-hired Certified Professionals (CPs). These are building professionals not employed by a municipality but independently certified as competent to review a building permit application. Seven of the municipalities surveyed (Surrey, Coquitlam, Port Coquitlam, Vancouver, Richmond, Delta, White Rock) permit applicants to contract with a CP. Third party lawyers can facilitate a speedier process of servicing and legal agreements; they are used by the majority of municipalities (11). Third party planners can sometimes fill a gap in staff capacity during a rush on applications; 4 municipalities (Surrey, Coquitlam, Port Moody, UBC) use them.
Table 3 summarizes the concerns expressed by applicants and municipalities regarding delays.
Table 3: Municipality and applicant concerns: Delays that do not create value
MUNICIPALITIES’ CONCERNS …
Some applicants don’t understand the bylaws and propose what does not fit policy or site context
Applicants don’t always engage well with neighbours; sites with neighbours can be contentious
Inexperienced applicants underestimate time and costs, have trouble coordinating various sets of drawings and reports
Unpreparedness and lack of responsiveness of applicants throughout; unwillingness to change design regardless of feedback; more accountability needed
Staff has an increasing volume of work and increased complexity of work, no increased capacity
Blockages in inter-departmental communications in the municipality, we don’t talk to one another well
Incomplete consultants’ reports, or improperly done
APPLICANT CONCERNS ...
Too many unspoken rules; guidelines are interpreted too literally or variably
No clear guidelines on what was required for public consultation
The process is too complicated, expensive and disjointed; takes a long time
Slow turnaround time, lack of urgency and understanding the importance of timely approvals for business model
Problem with staff turnover and insufficient staff resources
Inconsistent application of the rules for different parties
Council and staff not always on the same page; politics makes the process unpredictable
Building Elements Review (e.g. exterior buildingmaterial, green features)
Landscape Plan Review (e.g. landscape, pedestrian access)
On-site Servicing (e.g. grading, bicycle parking, recycling)
Off-site Servicing (e.g. easement and road widening)
Plan Review and Administration (e.g. labels, notes to be added)
Other features
600
Figure 14: Applicant responses, aspects that take the most time to resolve when the municipality reviews your plan [18]
Concerns and StrategiesMOST TIME-CONSUMING
25
DRAF
T

Delays that Do Create Value
These concerns all relate to factors crucial for effective working relationships: effective and clear communication, transparent and fair processes, diligence and professionalism. Not all delays are a waste of time, however. From a municipal perspective, the time that applications spend in the pipeline can improve the project design and outcomes. The value of this time is difficult to qualify, let alone quantify. However, we heard about the role that municipal staff play in providing advice that goes over and above what is required of them to meet the letter of policy and regulations. In so doing, they improved community outcomes beyond what might obviously be in keeping with current local practice and pre-empted a host of challenges that might have otherwise emerged on particular projects. We heard about the value of the institutional knowledge and memory of municipal staff. We heard in particular about the additional work required to meet the different needs of small and medium-sized home builders and to shepherd them through the process. How this affects development feasibility and the business model is difficult to assess.
Municipalities Under Pressure
The municipalities that participated in this research were nearly unanimous on this point: “we are feeling stressed and overwhelmed by the sheer number of files and amount of policy work.” For some, this was the sense across-the-board. For others, bottlenecks are seen to exist in particular departments, particularly engineering, followed by building inspections and planning. Maple Ridge, for instance, reported not having grown their staff complement in a decade, despite steady increases in volume of work, complexities of the work, and public expectations. Staff can be hard to find and retain and some municipalities face a high level of staff turnover. They are filling the gap as they can: Port Coquitlam has offered unlimited overtime in building inspection for 3 years running. Others point to increases in efficiency and online systems in particular as making it possible to keep pace with their work.
Most municipalities raise their fees and charges to reflect inflation, and the timing of processes varies with normal work and staffing cycles. In addition, however, the majority of municipalities told us that their processes are affected by other pressures. Introducing new incentive programs can be political and may result in lower fee revenues for the municipality. Some municipalities feel pressure from home builders who demand extra attention, “jump the queue,” or circumvent processes and “go straight to council.” Elsewhere, pressures come from “council-watchers,” residents who are generally vocal and opposed to developments of any kind.
“ ”It’s a real juggling act trying to make something happen and to make something that we can be proud of.– Municipal staff
“
”
Staff does play a role in adding value to developments. They do this by creating and maintaining the planning framework in which development occurs. With the OCP, community plans and neighbourhood plans, which are all needed for a development application to proceed, we are often challenged when we get down to the site scale.– Municipal staff
“
”
We’ve built a number of communities in that municipality over 10-15 years. After that amount of time, you’d expect that you’d have a relationship where you’re working together with the planning department and creating a project. Instead, what we’ve got there is us-versus-them, throw up as many hurdles as you can.– Builder
“
”
Certain individuals in the process can cost months of delay. Some of them are legendary and have been operating that way for years … This is as true for us as it is for the municipalities – there are builders that are notoriously sloppy and time consuming.– Builder
Taking the Time to Create Value26
DRAF
T

What constitutes best practice and innovation in residential development approvals? A summary of what were considered best practices by both municipalities and home builders is provided on p.5. In addition to the instrumental aspects of good process, best practices involve a willingness to learn, communicate, reflect on complexities, and attempt to account for some of the intangible values of productive and professional relationships.
Innovations: Digital Communications
One area in which many municipalities are innovating is electronic communications. Excellent communication is key to excellent process and a municipality’s website and internal file management software are the central nervous system. Good electronic communication systems reduce traffic to and from municipal halls, reduce opportunities for miscommunication, facilitate working in groups across distances, and provide an alternative to the “city hall shuffle” for applicants seeking feedback from different departments. We rated municipal websites based on a mix of independent criteria and applicant ratings (Figure 15).
Currently, only 5 municipalities (Surrey, Langley Township, City of North Vancouver, District of North Vancouver, West Vancouver) offer online access to detailed application status by department. File management systems, such as AMANDA, allow staff to set defaults to trigger interdepartmental reviews and referrals where needed, for multiple staff groups to work simultaneously on their pieces of the process and to provide automated feedback to applicants at key points.
A related, but different, innovation, is mobile field inspection technology, which allows building inspectors (in Surrey currently) to log information on-site for immediate upload to web-based file management systems, and gives the developer real-time feedback on inspections. Other municipalities (Vancouver, Delta, Richmond) are currently developing this capability. These systems represent investments on the order of hundreds of thousands of dollars. The investment is poised to pay off in reduced staff time, better integration, more openness and access to information.
Also notable is West Vancouver’s West VancouverITE, a system that facilitates public engagement for major projects or policies in West Vancouver. The Laneway Housing Program and the Park Royal Redevelopment are examples of projects that have been featured on this online system, allowing citizens to comment and staff to respond, summarize comments and report on outcomes. This tool also allows applicants to assess the level of community support as well as opposition.
“”
Our application form says 8 paper copies have to come in. So, do we need 8? Or can we get two, plus a pdf or digital, so that we can find new ways to move information around … Because you get an application that’s 3 trees’ worth of paper and it changes 5 times during the process.– Municipal staff
Best practices and innovations
27
DRAF
T

Screenshots of City of Surrey, Richmond, and West Vancouver official websites. Figure 15: Municipal Website Rating [19]
MUNICIPAL WEBSITE RATING
Better
North VancouverCoquitlam Vancouver
BurnabyWhite Rock
DeltaLangley Township
Port CoquitlamWest Vancouver
Langley CityPort Moody
North Vancouver DistrictNew Westminster
Pitt MeadowsMaple Ridge
SurreyRichmond
28
DRAF
T

Figure 16. Process rating results [20]
G2G asked home builders to rate municipalities on features of the development approvals process (Figure 16). From 53 responses received, the one process element that received relatively high marks from applicant survey respondents, that is also supported by municipalities, is the pre-application process. A pre-application meeting occurs prior to a formal development proposal submission. The applicant submits preliminary plans for departmental review and initial comments from staff at a meeting that allows the applicant, consultants, and cross-department municipal staff to convene. This meeting establishes expectations and rapport for a smooth process. Some municipalities and home builders expressed reservations about how pre-application processes work in practice in terms of efficient use of staff time, engagement of key staff, and adequate preparation of applicants. Currently, 3 municipalities (Coquitlam, District of North Vancouver, and Port Moody) implement a fee for pre-application processes. Others are considering a fee to account for the staff time required for this step.
Comprehensive comments from staff
Value of design review panel (where one exists)
Ability to arrange pre-application meeting
Streamlining different application types(eg. standard, complex, minor)
Effective communnication and coordinationbetween departments
Transparent and predictable process in applying charges
Clear policy on application requirements
Consistent interpretation of policy between departments
Fixed amenity and/or density bonusing charges
Consistent treatment of permit applications
Stipulated project approval schedule
0 0.5 1 1.5
0 = poor; 5 = excellent
2 2.5
HOME BUILDER RATING OF PROCESS EXPERIENCE
Pre-Application Meetings
29
DRAF
T

“”
[The Planning Department] leads the process when it is more complex, but we are integrated, we sit across from Engineering so we are in a unique situation that we know everyone and stay in touch to know where things stand. – Municipal staff
“
”
Getting all departments in the same room reviewing drawings with the applicant before a formal application can identify major issues as well as solve conflicting comments and goals between municipal departments. As a result, I can submit a better application which already takes into account major feedback from staff.– Builder
“”
The pre-application meeting is really important. The earlier on in the design process that you can have discussion, the more input you can have.– Municipal staff
“
”
We’ve really tried to move toward the single project manager for a file, whereas in the past the applicant has had to deal with technologist, planner, plan-checker, people from other departments. We have tried to communicate to staff that when you are the file manager, you play that coordinating role. It does provide better overall service.– Municipal staff
PRE-APPLICATION PROCESS KEYS TO SUCCESS
• Establish a single point of contact (such as a file coordinator) so that this person can guide the process• Set up staff accountability for a file and ability to track enquiries and check on requirements• Facilitate constructive staff input into design at an early stage, for project design that is site-specific and tailored• Reduce surprises late in the process by identifying issues up front• Establish expectations and a timeline, to take the guesswork out of the process• All parties should prepare adequately for the pre-application meeting, understanding regulations and practices, to ensure efficient use of time
30
DRAF
T

Metro Vancouver is a great place to live, with many newcomers attracted to our shores, albeit with an increasingly constrained land supply. Municipalities are under pressure with respect to the residential approval process. Some face record numbers of applications to process, all face increasing expectations during review, and they have limited tools and capacity to ensure that the housing residents need can be built in good time. Metro Vancouver also remains a desirable place for the home building industry to operate. The economic prospect of home building is nevertheless becoming riskier and more complicated.
Strong planning and regulation lay the foundation in which the complex approval process occurs. A strong home building sector with good housing outcomes benefits from clear policy and a collaborative and professional working environment with municipal staff.
With respect to the Harmony Homes scenario, analysis of survey results and interviews reveals variability in the costs and timing of municipal approvals amongst Metro Vancouver municipalities. Some of this variation can be explained by different municipal conditions, and the proportion of greenfield compared to infill development in particular. But the diversity of municipal conditions overall make it difficult to create fair and useful comparisons. More crucial than the absolute value of timelines, fees and charges is the predictability of all of these things at the outset of an application. We examine and discuss different approaches to (1) extracting value from new developments and (2) the timing of approvals.
Our Housing Partnership Index factors in timing, fees and charges, along with key aspects of the regulatory process and contextual qualities considered important for an overall assessment of the residential approval process. Initial top 10 results are presented on p.21 of the 2014 case of Harmony Homes.
Municipalities in our region embrace a wide range of valuable objectives; developing and maintaining new housing supply is only one. Fees and charges must be sufficient to pay for needed infrastructure and amenities, yet not so high that they pose an unfair burden on newcomers or create divides in the municipality. Processes should be as short as they reasonably can be, without sacrificing rigorous review and quality outcomes.
Both municipalities and home builders agree that delays in the residential approval process create undesirable inefficiencies. At the same time, longer processes are sometimes necessary to ensure quality outcomes. Process bottlenecks that create delays from the perspective of both home builders and municipalities are presented, as are some of the means municipalities use to reduce these delays.
Experiences in the residential approval process have impacts on home builders and on home building. These impacts are difficult to quantify but they may accumulate over time.
We present 10 best practices in residential approval processes on p.21. We detail the value in particular of a good pre-application meeting as well as, through case studies, the importance of better public engagement, municipal staff empowerment to solve site-specific challenges for innovative results, and policy clarity to support townhouse development.
Amongst the most promising areas of innovation profiled in this report are digital communication systems, including improvements to the municipal website for accessing complete and up-to-date information, to internal file management systems to improve the flow of the process, to digital feedback systems such as mobile field inspection technology. We present a rating of municipal websites on p.28.
In the residential approval process, municipal staff and home builders have valuable experience to share. By sharing best practices, we can build a culture of collaboration and transparency and emphasize innovation opportunities. We can find common lessons across municipalities, despite diverse contexts and visions.
Conclusions31
DRAF
T

Neighbourhood Area
NortheastCoquitlam
Townhouse & RT-2
N/A DCC Area 1 EdmondsTown Centre
MUNICIPALITY Coquitlam Delta PortCoquitlam Burnaby Metro
Average
Rezoning $ $ $ $3,222.36 3,400.00 5,500.00 $ 4,445.00
-
Subdivision Permit $ $ $ $500.00 425.00 750.00 - $ 585.00
-
Development Permit $ $ $ $4,150.00 600.00 2,300.00 $ 10,001.24 4,681.12
1,150.18
6,590.02
Building Permit $ $ $ $34,342.64 41,820.00 35,300.80 $ 42,425.64 33,857.66
Total DCCs $ $ $ $361,417.56 163,023.00 159,808.00 $ 145,098.00 254,641.39
GVS+DD DCC $ $ $ $33,330.00 31,815.00 33,330.00 $ 33,000.00 29,895.47
Other fees $ $ $ $767.00 300.00 325.00 $ 1,000.00 4,589.90-
School SizeAcquisition Charge $ $ $ $19,800.00 - 19,800.00
-
-
-
Total $ $ $461,819.56 274,443.00 257,263.80 $ 256,354.88 379,079.58-
CAC $ $ $ $
$
- - - Negotiated 41,120.63-
Site Servicing Review $ $ $ $4,290.00 - - - $ - 1,546.76-- --
Offsite Servicing Monitoring $ $ $ $- 3,060.00 150.00 - - $ - 372.35-- --
StormwaterManagement $ $ $
$
$
$
$
$
$
$
$
Oakridge
Vancouver
34,500.00
26,670.00
$ 209,981.00
17,540.00
111,215.00
18,172.00
$
1,884.00
$
$
$
$
$
$
$
$
$
$
$
DPA #9
PittMeadows
5,567.20
1,850.00
3,710.00
38,340.90
166,804.00
33,300.00
19,800.00
$
$ 26,400.00
295,722.10
$
$
$
GrandviewHeights
Surrey
$ 5,210.00
$ 1,518.00
$ 3,826.00
$ 33,655.00
$ 593,021.00
$ 33,330.00
$ 339.00
$ 19,800.00
$ 741,688.00
$ 47,654.00
$ 3,315.00
$
$ $- 30,000.00 - - - - $ - 4,558.82-
$
$
$
$
$
$
$
$
Broadmoor
Richmond
2,569.00
5,194.00
44,789.00
539,356.00
20,724.00
53.25
16,984.00
$ 774,098.25
$ 104,429.00
$
$
$ 40,000.00--
-
Everall
White Rock
$ 2,400.00
$ 750.00
$ 2,000.00
$ 36,089.35
$ 88,250.36
$ 33,000.00
$ 150.00
$
$ 184,639.71
Negotiated
$
$
$
22,000.00 $ 19,800.00 13,007.29
N/A
NewWestminster
$ 3,740.85
$ 1,300.00
$ 2,835.80
$ 34,506.81
$ 201,318.00
$ 33,330.00
$
$
$ 296,831.46
Negotiated
$
$
$
19,800.00
N/A Yorkson Ambleside
District ofNorth
Vancouver
Townshipof Langley
WestVancouver
$ $ $5,970.00 4,900.00 11,000.00$
$ $ $1,940.00 1,700.00 5,000.00$
$ $ $3,750.00 2,300.00 -$
$ $ $63,901.00 34,690.40 7,210.00$
$ $ $290,895.22 356,480.40 183,920.00$
$ $ $22,256.00 33,330.00 24,838.00$
$ $ $1,720.00 69,740.00 100.00 -$
-$ $ $
Albion
MapleRidge
4,708.00
1,085.00
2,442.00
11,000.00
347,820.00
33,330.00
550.00
22,000.00 - 6,360.00 -
$ $ $462,300.32 618,906.50 234,788.00 237,385.61$493,855.00
$ $ $71,868.10 92,655.22 Negotiated68,200.00
$ $ $- 9,250.00 2,720.00 -$ -2,720.00
$ $ $- - - -$ --
$ $ $- 7,500.00 - -$ --
DPA #3
Port Moody
$ 5,779.00
$
$ 5,100.00
$ 29,772.37
$ 80,520.00
$ 33,300.00
$ 1,000.00
$
$ 184,591.37
Negotiated
$ 4,000.00
$ 3,120.00
$
22,000.00
GardenApartments
DevelopmentArea
N/A
City ofNorth
Vancouver
4,769.00
34,820.00
$
N/A
$
172,958.61$
24,838.00$
$
$
Negotiated
$
$
$
$$
N/A
City ofLangley
4,350.00
2,150.00
4,700.00
35,375.83
366,998.50
33,000.00
100.00
459,654.33
Negotiated
12,980.00
$
$
$
$
$
$
$
$
$
$
$
$
Appendix A:Municipal Fees And Charges For Harmony Homes Townhouse Project
Completed Internally
* Burnaby has Preliminary Plan Approval (PPA) process rather than DP process. Other fees for Township of Langley include Parks Acquisition and Engineering Processing Fees. Metro Average for CACs calculated based on municipalities able to provide a figure. Data from G2G research 2014.
32
DRAF
T

Regulations
Inclusionary zoning for affordable housing
Adaptable design
LEED Gold; Neighbourhood energy system connectivity;Inclusionary Zoning for Affordable Housing
Inclusionary Zoning for Affordable Housing
Energy Performance Commitment equivalent to Energuide 80; Inclusionary Zoning for Affordable Housing
Inclusionary Zoning for Affordable Housing
REAP gold
BURNABY
CITY OF NORTH VANCOUVER
DELTA
SURREY
PORT COQUITLAM
VANCOUVER
LANGLEYTOWNSHIP
WEST VANCOUVER
DISTRICT OF NORTH VANCOUVER
RICHMOND
NEW WESTMINSTER
WHITE ROCK
Other Incentives
Grants to facilitate affordable housing; Fast Track approval
Density transfer; Fast Track approval
Expedited processing; Fast Track approval
Small unit sizes for some projects; Fast Track approval
Expedited processing and parking relaxations
Fast Track approval; Grants to facilitate Affordable Housing
Grants to facilitate affordable housing
Expedited process for >20 townhouse simple, compliant application; Fast Track approval
Fast Track approval
Fast Track approval
MAPLE RIDGE
PITT MEADOWS
UBC
Fee Rebates
DCC waiver
DCC waiver
For green building
DCL waiver;Building permit fee rebate for certified professionals
$150 building permit fee and cost of energy advisor rebated for Energuide 82
5% building permit fee discount for registered professionals
5% park dedication may be waived; DCC reductions for residential revitalization in 3 areas; Waive development permit fees
DCL waiver;Building permit fee rebate for certified professionals
DCC Waiver
DCC waiver
Density Bonus/Exclusion
For affordable housing
By negotiation during RZ (For variety of benefits)
For affordable housing
For green building
For green building
For heritage conservation in Steveston
For affordable housing
For $3100 contribution
For cash contribution
* Based on survey responses and our analysis, these additional regulations would apply to the scenario and incentives could be available if the project were amended to include: green building , affordable housing , heritage preservation , or other elements desirable in the municipality.
Appendix B:Additional Regulations that Would Apply, and Incentives Available to the Harmony Homes Townhouse Project [17]
33
DRAF
T

Background
Pitt Meadows is a small municipality with steady growth and a slow rate of property turnover. About 80% of the land base sits within the ALR and less than 1% is available for urban development. In fact, only about 4.6 acres is available and designated for residential use, and this land is currently under application for townhouse development.
The Development
Brogden Brown is a proposed infill development located along the major road corridor in Pitt Meadows. The OCP encourages higher density development in this area. Townhouses sit on three sides of the site, with single family homes across the street. The applicant proposed 63 housing units on the 0.97 acres lot and amenities that would include open space, permeable pavement, and design to limit traffic disruption during recycling and garbage collection. The design exceeds minimum parking requirements.
Outcome
Over several iterations of the application process, the applicants needed to reduce building heights to 2 storeys and reduce the number of units to 40 in order to gain community approval. Oak and ash trees will be used to disguise parking and maintain the neighbourhood look along with a pedestrian path to playground space. Fewer units raised the construction costs per unit and lowered revenue for the developer, so the price of the townhouses will likely increase.A spokesperson for the architect stated: “our goal was to bring affordability to Pitt Meadows,” implying that this goal had been compromised.
Lessons Learned
To municipal staff, the initial Brogden Brown application looked unproblematic. It was within the specified range for medium density development, in what appeared to be an ideal location, walkable to the town centre and transit. Resident opposition came as a surprise. The compromise reached has lasting implications for housing form and pattern, public-municipal interactions related to new residential development, and housing affordability in the Pitt Meadows core. Infill development that is acceptable to neighbourhood residents depends upon early consultation, protection of valuable community assets like trees and open space, and neighbourhood form and character.
ZONING REQUIREMENTS
• Permits up to 50 townhouses (30-100 units per acre)• Restricts lot coverage to 35%• Building height limited to 2 storeys
3D rendering by Pinnacle Decision Design Associates Ltd.
Case Study 1:Neighbourhood Resistance to Townhouses
BEST PRACTICE: BETTER PUBLIC ENGAGEMENT
ISSUE: COMMUNITY REACTION
The neighbours and some councillors felt that the development was “too dense” and would ruin the neighbourhood feel of Mitchell Road. Some community members also felt that the natural habitat would not be protected, particularly in the case of an old growth oak tree on the lot.
Image: Colleen Flanagan/The News - Maple Ridge News
Resources Council Minutes: 1. http://www.pittmeadows.bc.ca/assets/Council/Minutes/Council%20in%20Committee%20Minutes%20-%20May%2028,%202013.pdf 2. http://pittmeadows.ca.granicus.com/MetaViewer.php?meta_id=57835&view=&showpdf=1Rendering taken from: http://pinnacledecision.ca/portfolio/brogden-brown-townhomes-3d-renderings/Pitt Residents accept compromise: http://www.mapleridgenews.com/news/225418592.htmlImage: Colleen Flanagan/The News - Maple Ridge News - Used by permission.
34
DRAF
T
Case Study 2:New Zoning Policy and Municipal-Led
Rezoning for Townhouse Development
Background
As housing conditions and preferences change, municipalities need to change their regulatory framework. The municipalities of Coquitlam, Delta and Vancouver have recently designed or are currently designing new zones specifically to facilitate townhouse development. Delta is in the process of creating a new zone within its zoning bylaw to facilitate townhouse construction. Vancouver created a stacked townhouse zone in 2010, implemented in the Norquay Village Neighbourhood Plan as a prezone. In 2007, the City of Coquitlam created RTM-1, a “street-oriented townhouse zone” for the northeastern part of the city, in proximity to Victoria Park.
Advantages of Townhouse Zones
The townhouse can act as a tool to help municipalities increase density in traditional neighbourhoods without changing their ground-oriented character. Additionally, townhouses add diversity to the housing form that is more affordable than single family homes. However, one of the barriers to townhouse development in many municipalities is outdated zoning that carries expectations for form and design that no longer fit local context. When applicants want to build townhouses, municipalities often need to design a new comprehensive development zone for each new project. Applicant-led, site-specific rezoning is time-consuming and adds uncertainty to the process. In Delta, where the zoning bylaw is undergoing an 18 month redesign process, the expected result is clearer, better-suited and more streamlined zoning which limits the need for case-by-case revisions and band-aid solutions:
Prezoning land for townhouses can enable new developments to better meet planning objectives. Prezoning may also require a change to the fee structure so that the municipality can recoup fees through density bonusing that it would otherwise collect at rezoning.
Results
Coquitlam’s RTM-1 zone has brought significant townhouse development, with 131 townhouse units approved on 4 different projects, 24 of which will be offered with fee-simple tenure.
Vancouver’s RM-7 zone will encourage density while, according to Development Planning staff: “the typology overall keeps the fine-grained [street] rhythm that makes up an existing single family neighbourhood.” The zone takes its inspiration from a style of housing common in Quebecois cities. The design answers a concern about other approaches in Vancouver that hide front doors in the back or on the sides of a lot such that neighbours may not feel like they share the same space.
BEST PRACTICE: UP-TO-DATE AND CLEAR POLICY
“
”
For multi-family projects, often we are trying to work with the developer to create a zone that fits what they want to do, as opposed to a situation in which the developer makes the project fit our zoning criteria for the site. Our standard townhouse zones are rarely if ever applied to new projects. Recognizing this, as part of our Zoning Bylaw review, we intend to create one or more new, more workable townhouse zones that better reflect current housing forms and ways of thinking about densities around town centres and along transit routes.– Municipal staff
35
DRAF
T
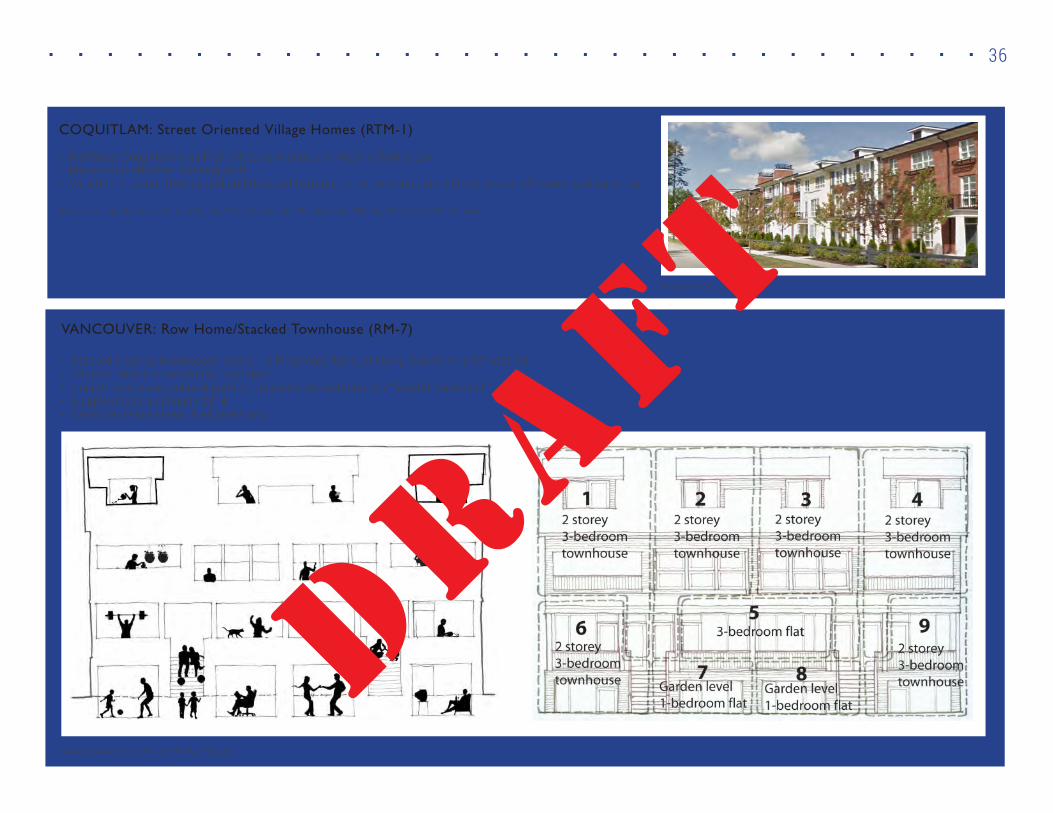
Image © Google maps
COQUITLAM: Street Oriented Village Homes (RTM-1)
• Northeast Coquitlam Area Plan (Victoria Avenue and Victoria Park area)• Maximum 8 attached dwelling units• Variation in colour themes and architectural features, street-oriented, distinct entrances, off-street parking at rear
http://www.coquitlam.ca/Libraries/Council_Agenda_Documents/RegularCouncilMeeting2007-07-30_751.sflb.ashx
VANCOUVER: Row Home/Stacked Townhouse (RM-7)
• Stacked 3 storey townhouses with a 1.2 Floor Area Ratio, allowing 3 units on a 33’ wide lot• All units have a street-facing front door• Height restrictions, relaxed parking requirements and room for “liveable basement” suites• 6 applications pending in 2014• Depiction below shows 4 adjacent lots
City of Vancouver, 2013. RM-7 and RM-7N Guidelines.
36
DRAF
T

Background
Strathcona is an older “street car” neighbourhood in the City of Vancouver, adjacent to historic Chinatown. Both neighbourhoods are considered to have good density without towers. Zoning in Strathcona is applied with some flexibility due to the neighbourhood’s historic character. The Schoolhouse project allowed new housing to be created that conformed to historical preservation requirements and responded to resident interests in maintaining neighbourhood character. The RT-3 zoning was designed to respect the 1920s style of the neighbourhood while creating allowances for some density increases, to increase housing options and affordability.
The Development
The Schoolhouse Project is unique because of the historic school building, built in 1940. By preserving 50% of the historic building in the retrofit, the developers were permitted to build to the pre-existing 1.45 FSR rather than the RT-3 density which would have been between 0.6-0.95 FSR. This solution avoided demolition as well as rezoning and created 5 units of housing.
Outcome
Historic building revitalized, Built Green Platinum rating, Aging in Place goals, gentle density
The Schoolhouse was occupied in 2010. The approval process for the development permit required 9 months, and the building permit process took place during the last 4 months. Including a municipal strike in the middle, the entire processing time was 10 months. This project was a win for the community and the applicant. The applicant reflected: “If the goals are aligned, then the process can go very smoothly.” As neighbourhood residents themselves, the applicants also benefitted from a strong letter of support from the Strathcona Residents Society.
Lessons Learned
Working with the city, the applicant negotiated:• An easement for sidewalk encroachment.• Meeting height restrictions while creating 3’ additional “liveable basement” space• Reduced parking requirements to 4 spaces, due to proximity to transit and bike lanes• Minimum 50% of the building structure retained• Maintain 1.45 FSR with no rezoning
ZONING REQUIREMENTS
• Interior space 8900 sf• Average unit size 1800 sf• 1.45 FSR (5 townhouses built)
Case Study 3: Townhouse Development Adding
Gentle Density and Preserving Heritage
BEST PRACTICE: COLLABORATION AND STAFF DISCRETION
Image courtesy of Take Root Properties
37
DRAF
T

Advisory Body – A group of citizens and/or professionals, usually external to the municipal organization but established with municipal support with a specified role to provide advice, in this case on a development application.
Building Permit – Permit required to erect, add to, alter, repair, or demolish any building or structure. This can also include other modifications outlined in the BC Building Code or municipal building bylaw.
Development cost charges – DCCs (or Development Cost Levys, DCLs) are fees paid by developers to municipalities and the regional district to help pay for new infrastructure (like roads, water, wastewater, sewerage, parks). These fees ensure that new development pays for the new infrastructure new residents will need, so that existing residents of the city as a whole do not pay for these through property taxes.
Development Permit - Permission granted by a municipality, and associated fees, for a particular form and character of a proposed new development. The protection of watercourse areas, or environmentally sensitive areas, watercourse areas, hazardous or environmentally, may also require a development permit.
Engineering fees – Many municipalities require fees to cover the costs of approval and supervision of infrastructure and engineering work. These fees are generally a fixed percentage of the cost of installing the infrastructure.
Greater Vancouver Sewerage and Drainage District Development Cost Charge (GVS&DD) – A DCC imposed by the regional government to assist in financing the cost of the regional sewerage system.
Infrastructure charges – Set of DCCs, lot levies, development levies, off-site service fees, and smaller fees and charges such as water and sewer connection fees, engineering fees, etc., intended to pay the cost of planning and building required infrastructure.
Official Community Plan Amendment – An OCP is a comprehensive land use plan for a municipality. An OCP amendment changes the substance of this plan in order to permit a non-conforming development proposal. The change may be related to urban structure, general land use designation, policies for the provision of infrastructure, transportation, environmental protection, parks and community services, economic development or sustainability. Municipal council must pass an amending bylaw to legally change an OCP.
Regional Growth Strategy Amendment – The RGS is the regional plan consented to by all municipalities in the Metro Vancouver region. A development proposal that does not conform to the RGS requires a decision of the regional board to legally change the Regional Context Statement of the municipality in which the proposed development will occur, which presents how the municipality conforms with the RGS.
Referral – Solicitation of advice or approval of an application by a body within or external to the municipal government, for example on matters related to engineering, fire, plumbing, electrical engineering, transportation, parks and landscape.
Rezoning – Permission granted by a municipality, and associated fees, to change the adopted zoning bylaw. Zoning bylaws provide detailed land use designations and development standards that address building siting, height, density, setbacks, parking and other requirements.
School Site Acquisition Charge – The SSAC is a charge per dwelling unit collected by local government and transferred to school boards. Charges are used to help pay for new school sites needed as a result of new residential development.
Glossary
38
DRAF
T
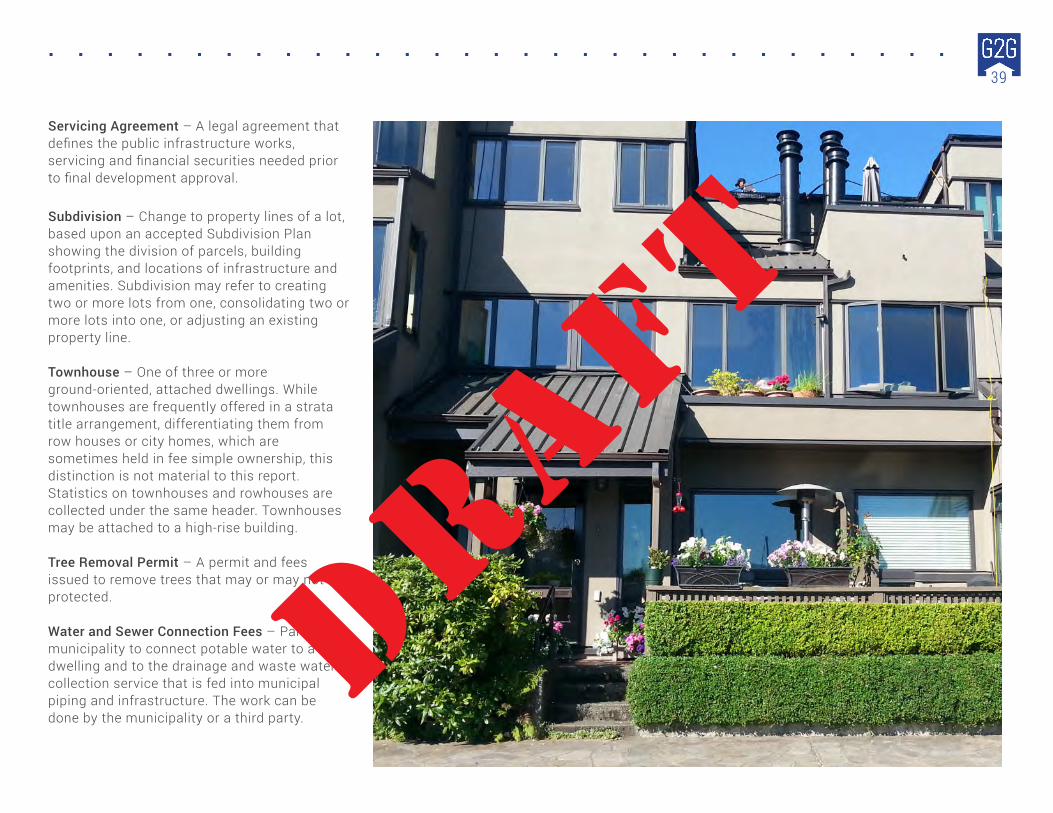
Servicing Agreement – A legal agreement that defines the public infrastructure works, servicing and financial securities needed prior to final development approval.
Subdivision – Change to property lines of a lot, based upon an accepted Subdivision Plan showing the division of parcels, building footprints, and locations of infrastructure and amenities. Subdivision may refer to creating two or more lots from one, consolidating two or more lots into one, or adjusting an existing property line.
Townhouse – One of three or more ground-oriented, attached dwellings. While townhouses are frequently offered in a strata title arrangement, differentiating them from row houses or city homes, which are sometimes held in fee simple ownership, this distinction is not material to this report. Statistics on townhouses and rowhouses are collected under the same header. Townhouses may be attached to a high-rise building.
Tree Removal Permit – A permit and fees issued to remove trees that may or may not be protected.
Water and Sewer Connection Fees – Paid to municipality to connect potable water to a new dwelling and to the drainage and waste water collection service that is fed into municipal piping and infrastructure. The work can be done by the municipality or a third party.
39
DRAF
T
Notes and References[1] UBC participated in the research for this report but ultimately was excluded from process timing and fees and charges comparison due to non-comparability of context. UBC is a different kind of entity compared to municipalities, as an unincorporated Electoral Area. UBC regulates development under the University Act and the Municipalities Enabling and Validating Act No 3. Results specific to UBC can be obtained directly from the Getting to Groundbreaking team.[2] Net housing growth is housing completions minus demolitions, from Metro Vancouver, June 2014 Housing Data Book (Table 2.5 and 2.8). Housing demand and population growth estimates from Metro Vancouver 2011 Regional Growth Strategy (Table A.4). Demand estimates are projections prepared for planning purposes, not intended to be used as targets. As such, a longer time horizon would provide more reliability. Also, given that most residential development today is multi-family, net completions can vary quite dramatically from year to year or even over several years due to the nature of the development process. Due to data limitations, does not include completions of purpose-built rentals.[3] Metro Vancouver 2006 Generalized Land Use by Municipality.[4] Statistics Canada 2014 Census of Population.[5] Greater Vancouver Regional District. 1975. The Livable Region 1976/1986. Proposals to Manage the Growth of Greater Vancouver. Burnaby.[6] This trend is not new. Reporting in 1974, Goldberg notes a significant shift in residential construction away from single family homes and toward row housing, garden apartments, and condominiums. Goldberg, M. 1974. Residential developer behavior: some empirical findings. Land Economics 50(1): 85-89. [7] Metro Housing Strategy Update Discussion Paper, 2014[8] Green building demonstrated by LEED or equivalency, Built Green or equivalency, Energuide, municipal-specific rating tool. Diversity in housing stock demonstrated by townhomes in single family area, apartments in ground-oriented area, mixed-use developments, variety of unit types. Increasing density near transit demonstrated by location in region-serving urban centre, municipal town centre, or frequent transit network. Visitable indicates space that is built to be visited by people with disabilities, adaptable refers to space that can be adapted to suit people with disabilities, and accessible indicates built for dwelling by people with disabilities. Number of respondents (N) = 38[9] Metro Vancouver, June 2014. Housing Data Book. Total housing units are lower than those that appear in Figure 4 because Figure 4 data account for demolitions while Figure 6 data do not.[10] CMHC Canadian Housing Observer and CMHC regional housing data.[11] BC Ministry of Community Services, 2000. Development Finance Choices Guide. http://www.cscd.gov.bc.ca/lgd/intergov_relations/library/development_finances_choices00_guide.pdf[12] BC Ministry of Community, Sport and Cultural Development. 2014. Community Amenity Contributions: Balancing community planning, public benefits and housing affordability. Victoria, p. 4.[13] The City of Vancouver’s CAC policy can be found at: http://vancouver.ca/home-property-development/community-amenity-contributions.aspx To date, the areas of Vancouver in which CAC targets have been established include: Arbutus Neighbourhood, Southeast False Creek, Norquay, Little Mountain Adjacent Sites, Cambie Corridor, and Marpole Community Plan.[14] Real Estate Board of Greater Vancouver 2014 Stats Centre.[15] No applicant feedback received for West Vancouver, Port Moody or White Rock. Data was not available for Burnaby, New Westminster or the City of Langley.[16] n= 54, Home Builder Survey; Average across 13 municipalities. No response received for: Port Coquitlam, West Vancouver, New Westminster, Port Moody, White Rock[17] G2G research and Metro Vancouver 2013 (Dec) Summary of municipal measures to address housing affordability and diversity. Update. Burnaby. http://www.metrovancouver.org/planning/development/housingdiversity/AffordableHousingStrategyDocs/MunicipalActionstoAddressHousingAffordability.pdf[18] Website rating based upon the following criteria: asthetics and ease of access, Google integrated search, contacts to relevant departments provided, interactive mapping capability, maps include watercourse locations, template availability, consistency of information about residential development applications within site, design guidelines available, approval tracking, subjective applicant rating.[19] n= 53; Average across 12 municipalities. No response received for: City of Langley, Port Coquitlam, District of West Vancouver, New Westminster, Port Moody, White Rock[20] No response received from home builders with respect to the process in: City of Langley, Port Coquitlam, District of West Vancouver, New Westminster, Port Moody, White Rock.
40
DRAF
T

We are happy to be presenting these results. At the same time, and inevitably, this report shows some of the limitations bound to mark an initial attempt to calculate and compare across diverse and unique contexts. There remain for us a number of important questions about strengthening data collection, analysis and”presentation for our future attention. Because G2G is a longitudinal project, with ongoing stewardship, the results will become more valuable and offer more detailed insights over time. We hope to be able to count on broader participation and constructive and informed dialogue into the future.
Getting to Groundbreaking was initiated by the Greater Vancouver Homebuilders Association (GVHBA). To ensure rigorous, unbiased and reliable research, GVHBA engaged the Simon Fraser University Urban Studies Program to lead G2G research. SFU researchers are guided by an advisory group that includes staff from the City of Surrey and City of Vancouver, home builders, Metro Vancouver, GVHBA, the Urban Development Institute (UDI), the BC Non-Profit Housing Association and Ryerson University. The project is funded by the federal government MITACS-Accelerate research internship program, with the GVHBA and UDI as private sector partners, and by the Real Estate Foundation of British Columbia and BC Housing.
This project has been designed and implemented as a partnership between the home building industry, the region’s municipalities, and other government and research interests. For more than 15 months, G2G researchers and advisors have worked through countless iterations of approaches, surveys, and interpretations with a view to making a timely, constructive contribution to the complex questions of providing housing in our region. We take it as a positive sign that so many participants are willing to enter into the debate about how to build the homes and communities that our growing region needs, and to seek new information and fresh perspectives in order to develop more creative solutions.
We thank all the municipalities and home builders who contributed to this effort. Your participation in this first year of reporting in particular was not just a draw on your time but also demanded significant trust that your information would be treated fairly and accurately. We hope this report does justice to your contributions and rewards your willingness to face the friction of debate around this piece of the housing puzzle.
G2G Report Writing and Editing: Meg Holden and Terry Sidhu, Simon Fraser University Urban Studies Program
Graphic Design: Eileen Lin
G2G Research Team 2013-14: Meg Holden, Terry Sidhu, Simon-Pierre Kuzar, Sebastien Froment, SFU Urban Studies
G2G Advisory Group Members 2013-2014: Eric Aderneck (Metro Vancouver Planning), Jill Atkey (BC Non-Profit Housing
Association), Margaret Eberle (Metro Vancouver Housing), Jeff Fisher (Urban Development Institute), John Greer (City of
Vancouver), Deana Grinnell (Conwest), Mitchell Kosny (Ryerson University), Jean Lamontagne (City of Surrey), Mark Sakai
(Greater Vancouver Home Builders Association), Kevin Shoemaker (Polygon Homes)
Acknowledgements 41
DRAF
T