researching educational access, transitions and equity
TRANSCRIPT

Consortium for Research on Educational Access, Transitions and Equity
Researching Educational Access, Transitions and Equity 2006-2011
VOLUME 1: REPORT
Professor Keith M Lewin

ii
The Consortium for Educational Access, Transitions and Equity (CREATE) is a Research Programme Consortium
supported by the UK Department for International Development (DFID). Its purpose is to undertake research designed to
improve access to basic education in developing countries. It seeks to achieve this through generating new knowledge and
encouraging its application through effective communication and dissemination to national and international development
agencies, national governments, education and development professionals, non-government organisations and other
interested stakeholders.
Access to basic education lies at the heart of development. Lack of educational access, and securely acquired knowledge
and skill, is both a part of the definition of poverty, and a means for its diminution. Sustained access to meaningful learning
that has value is critical to long term improvements in productivity, the reduction of inter-generational cycles of poverty,
demographic transition, preventive health care, the empowerment of women, and reductions in inequality.
The CREATE partners CREATE is developing its research collaboratively with partners in Sub-Saharan Africa and South Asia. The lead partner of
CREATE is the Centre for International Education at the University of Sussex. The partners are:
• The Centre for International Education, University of Sussex: Professor Keith M Lewin (Director)
• The Institute of Education and Development, BRAC University, Dhaka, Bangladesh: Dr Manzoor Ahmed
• The National University of Educational Planning and Administration, Delhi, India: Professor R Govinda
• The Education Policy Unit, University of the Witwatersrand, South Africa: Dr Shireen Motala
• The Universities of Winneba and Cape Coast, Ghana: Professors Jerome Djangmah and Joseph Ghartey Ampiah
• The Institute of Education, University of London: Professor Angela W Little
Disclaimer The research on which report was based was commissioned by the Consortium for Research on Educational Access,
Transitions and Equity (CREATE http://www.create-rpc.org). CREATE is funded by the UK Department for International
Development (DFID) for the benefit of developing countries and is coordinated from the Centre for International Education,
University of Sussex. The views expressed are those of the author(s) and not necessarily those of DFID, the University of
Sussex, or the CREATE Team. Authors are responsible for ensuring that any content cited is appropriately referenced and
acknowledged, and that copyright laws are respected. CREATE papers are peer reviewed and approved according to
academic conventions. Permission will be granted to reproduce research monographs on request to the Director of CREATE
providing there is no commercial benefit. Responsibility for the content of the final publication remains with authors and the
relevant Partner Institutions.
Copyright © CREATE 2011
ISBN: 0-901881-75-9
Address for correspondence:
CREATE,
Centre for International Education, Department of Education
School of Education & Social Work
Essex House, University of Sussex, Falmer BN1 9QQ
United Kingdom
Tel: + 44 (0) 1273 877984
Fax: + 44 (0) 1273 877534
Author email: [email protected]
Website: http://www.create-rpc.org
Email [email protected]
Please contact CREATE using the details above if you require a hard copy of this publication.

iii
Final Report 2011
Research Programme Consortium HD10
May 30th, 2011

iv

v
List of Contents
Foreword ................................................................................................................................................. ix Acknowledgements ................................................................................................................................... x 1. Background Information ..................................................................................................................... 1 2. Summary: Programme Purpose, Outputs and Activities .................................................................... 2
2.1 Purpose .......................................................................................................................................................... 2 2.2. Summary of Achievements ......................................................................................................................... 3 2.3 Programme Beneficiaries and Impact ........................................................................................................ 4
3. Highlights of the Research .................................................................................................................. 5 3.1 Overall Design ............................................................................................................................................... 5 3.2 Zones of Exclusion in Four Countries ........................................................................................................ 7 3.3 An Overview of Research Insights into Changing Patterns of Access .................................................... 9 3.4 General Research Findings ........................................................................................................................ 14 3.5 Illustrative Research Findings from the Community and School Case Studies ................................... 21
Bangladesh: Research Overview, BRAC-IED ............................................................................................................... 21 Ghana: Research Overview, University of Cape Coast .................................................................................................. 24 India: Research Overview, National University of Educational Planning and Administration, Delhi .......................... 26 South Africa: Research Overview, Education Policy Unit, University of the Witwatersrand ....................................... 28
3.6 Policy Analysis and the Political Economy of EFA ................................................................................. 31 3.7 CREATE Ten Point Plan ........................................................................................................................... 33
4. Achievements: Research Outputs and Purpose ................................................................................ 35 4.1 Overview and Progress 2010/11 ................................................................................................................ 35 4.2 What are the Research Outputs ................................................................................................................ 37 4.3 Who are the Beneficiaries? ........................................................................................................................ 38 4.4 Where are the Research Impacts and what are the Programme Achievements? ................................ 38 4.5 LogFrame of Outputs ................................................................................................................................. 39 4.6 What is, or is likely to be the programme’s impact on poverty? ........................................................... 41 4.7 What is, or is likely to be the programme’s impact on the wider environment ................................... 41 4.8 Effectiveness of the communication strategy ........................................................................................... 41 4.9 Purpose – LogFrame .................................................................................................................................. 42 4.10 Awareness amongst policy makers and stakeholders of research findings ......................................... 44 4.11 Research impact on the wider environments at national and international levels ............................. 44 4.12 Capacity Development ............................................................................................................................. 44
5. Lessons Learned ................................................................................................................................. 46 5.1 Working with Partners .............................................................................................................................. 46 5.2 Good Practice/Innovation .......................................................................................................................... 47 5.3 Project Management .................................................................................................................................. 47

vi
5.4 Communications ......................................................................................................................................... 48 6. Programme Management .................................................................................................................. 48
6.1 Definition of Researchable Problems and Themes .................................................................................. 48 6.2 Partner Engagement .................................................................................................................................. 49 6.3 Changes to the Programme ....................................................................................................................... 49 6.4 Monitoring ................................................................................................................................................... 49 6.5. Expenditure Flow during 2009/10 ............................................................................................................ 49 6.6 Multiplier Funding ..................................................................................................................................... 50
7. Long-term Sustainability of the Research ......................................................................................... 50 7.1 How will the research be promoted once research programme funding ends? ................................... 50 7.2 How will people access the research products once the research programme’s funding ends? ......... 50 7.3 Have any follow-on research projects been agreed, which build on the outputs from this research? ............................................................................................................................................................................ 50
8. CREATE Research Outputs Referenced in Text .............................................................................. 52
List of Figures Figure 1 CREATE Model of Zones of Exclusion ..................................................................................................... 6 Figure 2 Model of Meaningful and Equitable Access .............................................................................................. 6 Figure 3 Zones of Exclusion in Four Countries ........................................................................................................ 8 Figure 4 Enrolments over time; Sub Saharan Africa and India .............................................................................. 10 Figure 5 Simplified typology of enrolment patterns in school systems ................................................................. 11 Figure 6 Age and Enrolment ................................................................................................................................... 12 Figure 7 Age-in-grade distributions ........................................................................................................................ 13 List of Tables Table 1 LogFrame Outputs ..................................................................................................................................... 39 Table 2 Purpose - LogFrame .................................................................................................................................. 42

vii
List of Acronyms
ABL Activity Based Learning
ADEA Association for the Development of Education in Africa
AR Annual Report
AusAid Australian Government Overseas Aid Programme
BAFED Bangladesh Forum for Educational Development
BIMARU Bihar, Madhya Pradesh, Rajasthan, and Uttar Pradesh
BRAC Bangladesh Rural Advancement Committee
BREDA UNESCO Regional Bureau in Dakar for Education in Africa
BU-IED BRAC University Institute of Educational Development
CAG Consortium Advisory Group
CAR Country Analytic Review
CCEM Conference of Commonwealth Education Ministers
CEC Council for Education in the Commonwealth
CHOGM Commonwealth Heads of Government Meeting
CIE Centre for International Education, University of Sussex
CIES Comparative and International Education Society of North America
CNRS Cross National Reviews and Studies
ComSS Community and School Studies
CPA Changing Patterns of Access
CREATE Consortium for Research on Educational Access, Transitions and Equity
CRIBE Centre for Research in Basic Education, University of Education Winneba
CRIQPEG Centre for Research in Quality Primary Education in Ghana
CWIQ Core Welfare Indicator Questionnaire
DBSA Development Bank of Southern Africa
DFID Department for International Development
DHS Demographic and Health Surveys
DoE Department of Education
EdQual research programme consortium on implementing quality education in low income countries
EFA Education for All
EGS Education Guarantee School
EMIS Education Management Information Systems
EPU Education Policy Unit, University of the Witwatersrand
FCUBE Free and Compulsory Universal Basic Education
FET Further Education and Training
GDP Gross Domestic Product
GER Gross Enrolment Rate
GLSS Ghana Living Standards Survey
GMR Global Monitoring Report
GPI Gender Parity Index
GTZ Gesellschaft für Technische Zusammenarbeit (German Agency for Technical Co-operation)
ICDS Integrated Child Development Services
ICED International Consortium of Educational Development
IBE International Bureau of Education (UNESCO)
INEE International Network for Education in Emergencies
IOE Institute of Education. University of London
IR Inception Report
JHS Junior High School
KNU ST Kwame Nkrumah University of Science and Technology
LIDC London International Development Centre
LOLT Language of Learning and Teaching
LPC Learner Profile Card
MDGs Millennium Development Goals
ME Monitoring and Evaluation

viii
MoE Ministry of Education
MRHRD Ministry of Human Resource Development, Govt of India
MTR Mid Term Review
NER Net Enrolment Rate
NFHS National Family and Health Survey
NGO Non Governmental Organisation
NRG National Reference Group
NUEPA National University for Educational Planning and Administration
OBC Other Backward Castes
OECD Organisation of Economically Cooperation and Development
OOSC Out of School Children
OVCs Orphans and vulnerable children
PDA Policy Dialogue and Analysis
PEDP Primary Education Development Programme
PICs Partner Institution Convenors
PIs Partner Institutions
PTA Pathways to Access Research Monographs
PTR Pupil Teacher Ratio
QMR Quarterly Monitoring Report
RECOUP Research Consortium on Educational Outcomes and Poverty
RMSA Rastriya Madhyamik Shiksha Abhiyan (support to secondary education in India)
RPC Research Programme Consortium
RRAP Research Reviews and Action Plans
RS Regional Studies
RTE Act Right to Education Act
SACHES Southern African Comparative and Higher Education Society
SC Scheduled Caste
SDA Secondary Data Analysis Studies
SEIA Secondary Education in Africa, World Bank
SFAI School Fee Abolition Initiative
SSA Sub-Saharan Africa
SSA (I) Sarva Shiksha Abhiyan – India’s Universalisation of Basic Education Programme
SSS Senior Secondary School
ST Scheduled Tribe
TOR Terms of Reference
UCC University of Cape Coast
UEW University of Education, Winneba
UKFIET UK Forum for International Education and Training
UNESCO United Nations Educational, Scientific and Cultural Organisation
UNESCO
IIEP
UNESCO International Institute for Educational Planning
UNICEF United Nations Children’s Fund
UoS University of Sussex
UPE Universal Primary Education
VC Vice Chancellor

ix
Foreword This report encapsulates many of the findings and activities of the Consortium for Research on Educational Access, Transitions and Equity (CREATE) over the period 2006-2011. The Consortium has brought together core Partners from the U.K., Bangladesh, Ghana, India and South Africa along with associates in China, Kenya, Malawi, Pakistan, and Sri Lanka. Its work has focused on understanding the problems and possibilities that surround efforts to ensure that all children complete successfully a full cycle of basic education as mandated in the commitments to Education for All made in 2000 and the Millennium Development Goals. CREATE is a programme of research, not a project. It thus has a wide portfolio of activities and outputs that reflect core research questions and the thematic concerns of its Partners. CREATE germinated in meetings in 2005 when the Partners decided to bid for support from DFID and were successful. The six Partners have worked together collaboratively since then to generate unique insights into access to education through local level community and school case studies tracking large numbers of children, and at national and international level through policy studies, stakeholder interviews and analysis of large scale data sets. This volume identifies key findings and catalogues activities. The portfolio of research products is extensive. Over 150 books, refereed journal articles, monographs and other publications have been produced. These address a wide range of research questions and fall into twelve broad thematic areas. They link to policy briefs and networks of stakeholders in many different policy arenas. The growing impact of the research is evident in the accounts of events at www.create-rpc.org and the take up of CREATE models and key concepts in policy documents. CREATE has supported capacity building across its research programme and many new researchers have benefitted from association with the structures and intellectual energy of a large multi-national programme of research. The architecture of the research has generated a suite of research instruments, and a topography of enquiry that can be applied to new research locations. This is already happening with new cross country studies of out of school children. CREATE has been a memorable adventure for all those taking part. Its ideas will inform a new generation of strategies to achieve its expanded vision of universal access to basic education. Over the next decade insights from CREATE will continue to shape policy and practice. The programme was always a journey rather than a destination. CREATE’s alumni will continue travelling the pathways that lead to more equitable access to education, and the transitions in capability that underpin development. Keith M Lewin Director of CREATE Sussex, May 2011

x
Acknowledgements This research programme has depended on the engagement, insight and creativity of a large number of colleagues working in the Partner organisations. Over 100 researchers have contributed to the community and school based fieldwork, the analytic reviews, and the cross national exploration of data sets. Many have published in the Pathways to Access Research Monographs and more than 20 CREATE associates will obtain Doctorates from work related to the programme. The teams and contributors can be found on the CREATE website Out Partner Institution Convenors warrant a special vote of thanks. They have coordinated research within each country since 2006 and have adapted to the changing challenges of keeping fieldwork on track and maintaining the momentum of analytic work. Their goodwill and commitment have made it possible to consolidate a very extensive portfolio of research that will stand the test of time. This reflects the contributions of all the research team members in the different sites. CREATE has benefitted greatly from a cast of administrators and project coordinators at Sussex and in Partner Institutions who have facilitated the research, managed the day today activities and events, and tailored many of the research findings for dissemination. CREATE owes a great debt also to all those teachers, officials, NGO staff, parents and children working in the education systems where we have undertaken research. Many have given generously of their time and freely of their opinions and experiences to shape the messages that are entering policy dialogue.

xi

xii

1
Consortium for Research on Educational Access, Transitions and Equity Final Report 2011
1. Background Information The Consortium for Research on Educational Access, Transitions and Equity (CREATE) was commissioned by DFID in mid 2005 as a five year programme of research on educational access in low income countries. The consortium commenced work on January 1st 2006. The inception period for the programme lasted until June 30th 2006, and the Mid Term Review took place on 21st April, 2008. The programme’s end date was revised to July 31st 2011 with the final report due on May 30th. The programme has maintained a focus on equity and poverty related exclusion from educational access. It has now undertaken a wide range of research based on fieldwork at community and school level, secondary data analysis, case studies and reviews, and policy analysis. It has also coordinated an extensive programme of research capacity building, supported 22 doctoral students largely with additional funding, and maintained an infrastructure to project its research findings and maximise their likely impact. CREATE has worked within the framework provided by its different zones of educational exclusion, has achieved and exceeded the main outputs identified in its Logframe and the Terms of Reference (Invitation to Bid Para 23) and has developed an extensive portfolio of research products. Insights from the research have been widely disseminated and have helped shape DFID strategy on education, and that at country level. This report follows the structure laid out in the DFID document - M and E – A Guide to DFID Contracted Research Programmes, and specifically the instructions for the Final Report (page 43 et seq). This report uses the prescribed sub-headings and section breaks, Times Roman Font 11, and word length restrictions. It should be read in conjunction with previous Annual Reports and Framework Plans, associated Annexes, and the Mid Term Review documentation. Title of RPC: Consortium for Research on Educational Access, Transitions and Equity Reference Number: HD10 Period Covered by Report: 1st January 2006- May 30th, 2011 Name of Lead Institution: Centre for International Education, University of Sussex Director: Professor Keith M. Lewin Main Partners:
• The Institute of Educational Development, BRAC University, Dhaka, Bangladesh • The National University of Educational Planning and Administration (NUEPA), Delhi, India • The Education Policy Unit, University of the Witwatersrand, South Africa • The Centre for Research in Primary Education Quality (CRIPEQ) of the University of Cape Coast, and
the Centre for Research in Basic Education (CRIBE), University of Education at Winneba, Ghana • The Institute of Education, University of London • The Centre for International Education, School of Education, University of Sussex (Lead Partner)
Main Countries in which Research is Taking Place: Bangladesh, Ghana, India, South Africa Other countries on which small scale work has been commissioned include Kenya, Malawi, Sri Lanka, Nepal, Pakistan, Ethiopia, Mali, Tanzania and China Further detailed information on CREATE is at www.create-rpc.org

2
2. Summary: Programme Purpose, Outputs and Activities
2.1 Purpose The Consortium for Research on Educational Access, Transitions and Equity (CREATE) has developed a five year programme of research to analyse policy and practice designed to reduce educational exclusion and expand access to basic education for children between the ages of 5 and 15 years. The research is guided by DFID’s commitment to Education for All (EFA) and the Millennium Development Goals (MDGs). The main partner institutes (PIs) are in the UK, Bangladesh, India, South Africa and Ghana with associates in other countries. Over 60 million children of primary school age appear to be out of school. Many more fail to attend regularly or achieve basic skills and are seriously over age. If these children are counted then the numbers excluded from primary schooling are well over 250 million. In many of the poorest countries more than half of all children fail to access secondary school adding over a 100 million more to those below 15 years who are silently excluded. Access cannot be separated from educational quality (what children have access to) and educational outcomes (what competencies and capabilities are acquired). The research is increasing knowledge and understanding of the reasons why so many children fail to complete basic education successfully in poor countries. It is generating insights from empirical work and analysis of large scale data sets directly relevant to policy dialogue directed towards accelerating progress towards universalising access to basic education. The programme of research uses the concept of zones of exclusion to frame analysis of access issues. There are six main zones covering those who do not attend school at all, drop outs at primary and secondary level, and those in school attending irregularly and achieving little (see 3.1). It also employs an expanded vision of access to education that includes learning that has utility, and which is inclusive, equitable and sustainable. Access to education has to include judgements of educational quality and process (what children have access to); and of educational outcomes (what competencies and capabilities are acquired and how they are valued). CREATE’s expanded vision includes local access to safe schools with an appropriate environment for learning; admission and progression at an appropriate age; regular attendance; access to secondary education; learning outcomes that meet national norms; and socially equitable access to affordable educational services. CREATE’s architecture of key concepts includes zones of exclusion and the expanded vision of access. It also highlights a wide range of issues that include age-of-entry and age-in-grade progression; typologies of drop out; small schools and multi-grade pedagogies; transitions to post primary; private providers: silent exclusion of those enrolled but learning little; analysis of supply and demand side constraints, inequalities associated with improved access and exclusions related to poverty and costs; needs for better data on participation and for child tracking, and for indicators that capture poor distributions of service delivery; child friendly and child seeking schools; exclusions related to gender, disability and other forms of marginalisation. CREATE has five programme strands leading to research outputs. These are:
• ‘Pathways to Access’ Research Monographs (PTAs) on twelve themes including: Changing Patterns of Access; Health, Nutrition, Disability; Drop Out and Push Out; Migration, Seasonality and Nomads; Small Schools and Multi-grade; Transitions to Secondary; Educational Quality and School Processes; Equity, Poverty and Exclusion; Private and Non-State Providers; Governance; Aid Architecture and the Political Economy of Education for All. A table listing CREATE monographs and journal articles under these themes is in Annex 5.
• Country Analytic Reviews (CARs) - Bangladesh, Ghana, India and South Africa • Community and School Studies (ComSS) using evidence from household surveys, schools, teachers,
achievement tests, and tracking of children in school and drop outs • Changing patterns of access over time using large scale secondary data sets • Political economy of Education for All based on country case studies
CREATE has developed collaboratively a range of research questions. One set of questions have shaped the community and school level research. These include:

3
• What are current patterns of access and exclusion, who is currently excluded from basic education at different stages and why are they excluded?
• What strategies are most effective in meeting the basic educational needs of the excluded? • What options are available to improve enrolment, progression, completion and transition rates? How
can drop out be reduced and re-entry be encouraged? • What options exist to improve transition rates and participation in lower secondary education? • How have patterns of access been changing and has expanded access improved equity? What does
analysis of cross national data uncover about how to accelerate progress towards EFA? • What are the political, social and economic conditions which have facilitated universal access to
education? Where progress has faltered what are the reasons? These questions are complemented by a wide range of other research questions linked to enquiries that each PI has identified that are especially relevant to different national contexts, and to cross national analyses and policy dialogue. The research output is therefore much broader than that defined by questions related to the community and school level work, and includes many contributions focused on a range of policy relevant issues. These are grouped into the twelve themes listed in Annex 5. CREATE supports a large scale programme of capacity building (Annex 6) through its associates and 22 post graduate students, six of whom are Commonwealth scholars, and most of whom are funded outside CREATE. It provides technical support to its country based research teams. It has sustained an elaborate communication strategy (Annex 4) to project outputs from the research at local, national and international levels. Its website (www.create-rpc.org) includes a searchable data base on access with over 8,000 items and over 150 research products. The website has received 90,000 page views.
2.2. Summary of Achievements The Annual Reports (AR) and Mid Term Review (MTR) catalogue achievements over the lifetime of CREATE. The research publications are listed in Annex 5. During 2010/2011 an additional 40 Pathways to Access Research Monographs have been produced. On completion the final total will exceed 70 substantial volumes. Four major Country Analytic Reviews have been published along with four country research summaries. These are complemented by 25 Policy Briefs and by four Special Issues of Refereed Journals (Comparative Education, International Journal of Educational and Development, Journal of Educational Policy, Prospects) each containing 8 to 10 papers. Seven Books are in different stages of development and these include four volumes on access to education in India, Bangladesh, South Africa and Ghana. CREATE co-sponsored a book with CEC on sustaining UPE in Africa which has been published. Two further books are planned on changing patterns of access and the political economy of EFA. The research outputs will include 22 DPhils/PhDs based in the UK, and the publications that are produced from these theses. More publications will flow in 2011/12. CREATE has undertaken extensive programmes of data collection and analysis though it’s Community and School Studies. In India over 6,400 households were surveyed in two districts, and children and teachers in 30 schools were interviewed and tracked over four years. In Bangladesh 6,700 households were surveyed, and fieldwork was undertaken in 36 schools across six districts over three years. In Ghana 2,500 children in 29 schools in two different regions were identified and tracked and their households were surveyed between 2007 and 2010. In South Africa 14 schools in two provinces were selected and 1,400 children were profiled. A multi-method design was developed with a portfolio of 10 instruments close coupled to research questions, zones of exclusion and methods of data collection. The research outputs have been fed into the Research Monographs and Policy Briefs, and into CREATE associate’s Doctoral theses and publications. CREATE has been very active in supporting its research through technical workshops, in-country visits, visiting fellowships, analytic collaboration, joint authorship of papers, and participation in events organised by others. It has also systematically projected its work through key conferences and symposia where it has given invited plenaries as keynote contributions. These include the biennial UKFIET Oxford Conference (3), the North American Comparative and International Education Society (CIES) (3), the Commonwealth Ministers of Education and the Heads of Government meeting (CCEM) (3); DFID advisors’ retreats (4); International Working Group on EFA (2), African Development of Education Association (ADEA) (2); World Bank

4
Secondary Education in Africa Programme (SEIA) (4) and the DFID/World Bank/Government of India support for access to secondary schools (RMSA) (3); UNICEF Out of School Children Programme (2); UNESCO IIEP Conferences (2). CREATE has sponsored a series of high profile CREATE lectures in London with the Council for Education in the Commonwealth. Many other events have been organised by partners (See Annex 5). In 2007/2008 Country Analytic Reviews (CARs) were launched at national events hosted by PIs and attended by Ministers, Secretaries, Ministry officials, NGOs, and development partners. Members of National Reference Groups were also mobilised to project insights from the CARs. In each country these launches provided a forum for policy dialogue between CREATE PIs and Ministries and development partners. All PIs are part of national networks and CREATE’s work has been widely used to inform policy and shape sector reviews.
2.3 Programme Beneficiaries and Impact There are many beneficiaries of CREATE (see Annex 4). In Ghana the MOE published and distributed the CAR at its own expense and hosted the conference at which it was launched. It has subsequently hosted two more national events and a MoE retreat with CREATE. CREATE co-sponsored a lecture with CEC at Westminster celebrating 50 years of independence. The Government of Ghana paid for this to be repeated in Accra. The Ghana PI writes a weekly column in the Ghanaian Times using CREATE ideas and also presented CREATE to over 100 Parliamentarians in 2008. Researchers are frequent contributors to TV and Radio. The MoE has sponsored more than 20 post graduate students to work within the framework of CREATE. A CREATE story line was used in an award winning series of Makutano Junction, a mass market soap opera in East Africa. In India, the PI for CREATE is now VC of the National University and Acting Director of NCERT. He contributes to the national reviews of EFA and to the drafting of the key 2010 “Right to Education” Act. He also sits on the Board of the GMR. Four All India Joint Secretaries for education have attended and spoken at a series of CREATE events including the fieldwork dissemination conference in Madhya Pradesh in 2009. Most recently three joint secretaries attended the CREATE international conference in late 2010 and opened and closed the proceedings. In South Africa the Chief Director spoke at the launch of the CAR. Subsequently CREATE gave evidence to a Parliamentary Commission on Retention. UNICEF SA used PTA No 1 as a core document for its work on access in 2008. The Wits EPU has close relationships with present and past Ministers and contributes directly to national policy dialogue. In Bangladesh BRAC stands outside government as an NGO and partners five other NGOs in its work for CREATE, including the well known Campaign for Popular Education (CAMPE). Findings are therefore fed back directly to stakeholders. The PI frequently contributes to national debate about the sector programme, makes inputs to post PEDPII planning, contributes to UNESCO-BAFED and has chaired the annual “Education Watch” high profile stakeholder review. The Minister of Education attended throughout the national conference sponsored by CREATE in 2011. The CREATE model and concepts have been explicitly used by DFID in its Education Strategy Paper (2010); by ADEA in the Core Paper for the 2008 biennial; by the World Bank (SEIA) and in the 2010 World Bank Ghana Sector Review; in the annual MoE Sector Performance Reports; by the MHRD in India in its work with DFID and the World Bank on expanded secondary schooling; by UNICEF for the 23 Country OSC study; and by GTZ/IBE/UNESCO BREDA in the Basic Education Africa Programme. Most recently the Director has been invited to address the annual conference of African Examination Boards and to organise a symposium for AusAid. Statistics on overage students in each grade are now part of the UNESCO Institute of Statistics protocol for national data returns to the global database as a result of CREATE research. CREATE maintains a website with well over a million words of research output free to download. The impact strategy reaches out to policy makers and opinion leaders through publications, policy briefs, face-to-face interactions, launch events, conferences, graduate teaching programmes, media engagement, and high level networking through PIs. The LogFrame confirmed by the MTR identifies four outputs related to new knowledge to improve access, and an output related to communications. CREATE has produced substantially more research output than that identified in the LogFrame, and has projected products effectively to the audiences identified in the LogFrame. Its outputs include contributions in all the areas nominated in the Invitation to Tender, and has developed many additional outputs in response to demand from PIs. These reflect the breadth and depth of the contributions of over 100 researchers working within the CREATE programme. CREATE has also been highly commended by the DFID Education Advisors and by its Consultative Advisory Group, and by colleagues in the World Bank and other bi and multi-lateral agencies.

5
3. Highlights of the Research
3.1 Overall Design Access to education is at the heart of development and is central to the Millennium Development Goals. A lack of education is both a part of the definition of poverty and a means for its diminution. The achievement of universal basic education is essential to reduce poverty, increase equity and transform the developmental prospects of individuals and nation states. Sustained access to education which transfers knowledge, skills and attitudes to the next generation is critical to long term improvements in productivity, the reduction of inter-generational cycles of poverty, demographic transition, preventive health care, the empowerment of women, reductions in inequality, and many other developmentally desirable goals. CREATE has developed a model of zones of Exclusion from education which it has used to shape its research in communities and schools and as a tool for policy dialogue (Lewin 2007a). This model has been widely discussed and has been used by a range of development partners including DFID. The model represents access to education through a chart which identifies different groups of children of school age that fail to sustain access to basic education which in most countries is now up to Grade 9. Figure 1 presents the chart. Zone 1 contains those denied any access who never attend school. They include those who could attend existing schools, and those whose circumstances make it unlikely that they can attend normal schools who may have livelihoods incompatible with sedentary schooling, be excluded because of civil status, disability, social stigma or other vulnerabilities. Zone 2 includes the majority of children who are excluded after initial entry, and who drop out of school and fail to complete a full cycle. In an increasing number of countries these are the largest numbers of out of school children. Zone 3 includes those in school but at risk of drop out, most obviously as a result of low achievement and poor attendance. These children may be “silently excluded” in statistics since they are enrolled but may learn little, attend irregularly, and are often over age. Zone 4 contains those who fail to transit to secondary education as a result of failing to be selected, being unable to afford costs, located far from a secondary school, or otherwise excluded. Zone 5 includes those dropping out of secondary grades and Zone 6 contains those at risk of drop out from secondary mirroring the same categories at primary level. In each of the zones the patterns and causes of exclusion from education are likely to be different. They may also be different from community to community. The CREATE model did not initially include access to pre-school. This has now been included as Zone 0 since many countries are making pre-school part of a commitment to basic education. CREATE has generated an expanded vision of access to go beyond the narrow indicators of school enrolment which are often used by development partners and governments1 (Lewin (2011d). Access to education has to include judgements of educational quality and process (what children have access to); and of educational outcomes (what competencies and capabilities are acquired and how they are valued). An expanded vision has to be interpreted in relation to national and sub-national contexts. These determine starting points for improved access, identify the nature of excluded groups, the resources available, and the policy environment and possibilities for action. CREATE’s expanded vision of access includes: • Access to preschool at affordable costs • Local access to safe schools with appropriate levels of staffing, learning materials, and facilities
(including clean water and sanitation) which provide a positive learning environment • Admission and progression through primary school within a year of the nominal age-in-grade • Consistent attendance throughout the school year at least 90% of school time • Learning outcomes that have utility and relevance and achievement that meets national norms • Reasonable access to secondary education and training • Equitable access to affordable schools of adequate quality
1 e.g. Gross Enrolment Rates (GER) and Net Enrolment Rates (NER), survival rates to Grade 5 and completion rates for
primary

6
Figure 1 CREATE Model of Zones of Exclusion
CREATE’s architecture of key concepts includes zones of exclusion, the expanded vision of access, age in grade progression, small schools and multigrade issues, transitions to post primary, silent exclusion, analysis of supply and demand side constraints on access, the development of child seeking schools, and the use of distributional targets linked to poverty, equity, and effective learning of knowledge, skills and attitudes. Conceptually, exclusion has a range of causes that lie at different levels of analysis. These can be mapped schematically to include individual and household characteristics, community level attributes including livelihoods and social preferences and practices, school level features and aspects of local and national level educational administration and resource availability. These interact to shape meaningful and equitable access (Figure 2). Educational access is a problem on both the supply and demand sides of provision. Some Education for All programmes have concentrated on inputs where infrastructure is weak, buildings and classrooms inadequate or unavailable, learning material in short supply, and teacher qualification is low. These inputs are often greatly needed where enrolment growth is strong. However, access problems also arise from failing demand, especially amongst older children and in communities where the opportunity costs of school attendance are high, and where school quality is low and children’s achievement very poor. Where access is very unevenly provided, such that for example the poorest children may have less than a tenth the chance of the richest of completing secondary schooling, then equitable access is compromised. To be worthwhile and have utility, access must lead to transformations in capability that are linked to the knowledge and skills that can enhance the chances of mobility out of poverty.
Figure 2 Model of Meaningful and Equitable Access
0
10
20
30
40
50
60
70
80
90
100
1 2 3 4 5 6 7 8 9 10
% P
artic
ipat
ing
Should Enrol
Unlikelyto Enrol
Zone 3 At RiskOverage, Low Attenders and Achievers
Zone 4Primary Leavers
Zone 2Primary Drop Outs
Primary Grades
Zone 1Never Enrol
Lower Secondary Grades
Zone 5 Drop Outs
Zone 6 At Risk
Zone ONo
Pre-School
CREATE Zones of Exclusion
www.create-rpc.org
Access
NoAccess
NoAccess
NoAccess
At RiskSecure Enrolment, Attendance and Achievement
Demand Supply
Meaningful Equitable
Access
Equity Mobility TransitionsDistribution Poverty Reduction Growth
Profiling Exclusion
Individual characteristics
and agency
Household Characteristics
and Agency
School quality, process and outcomes
District educational governance
and resourcesCommunity
social, economic, and political

7
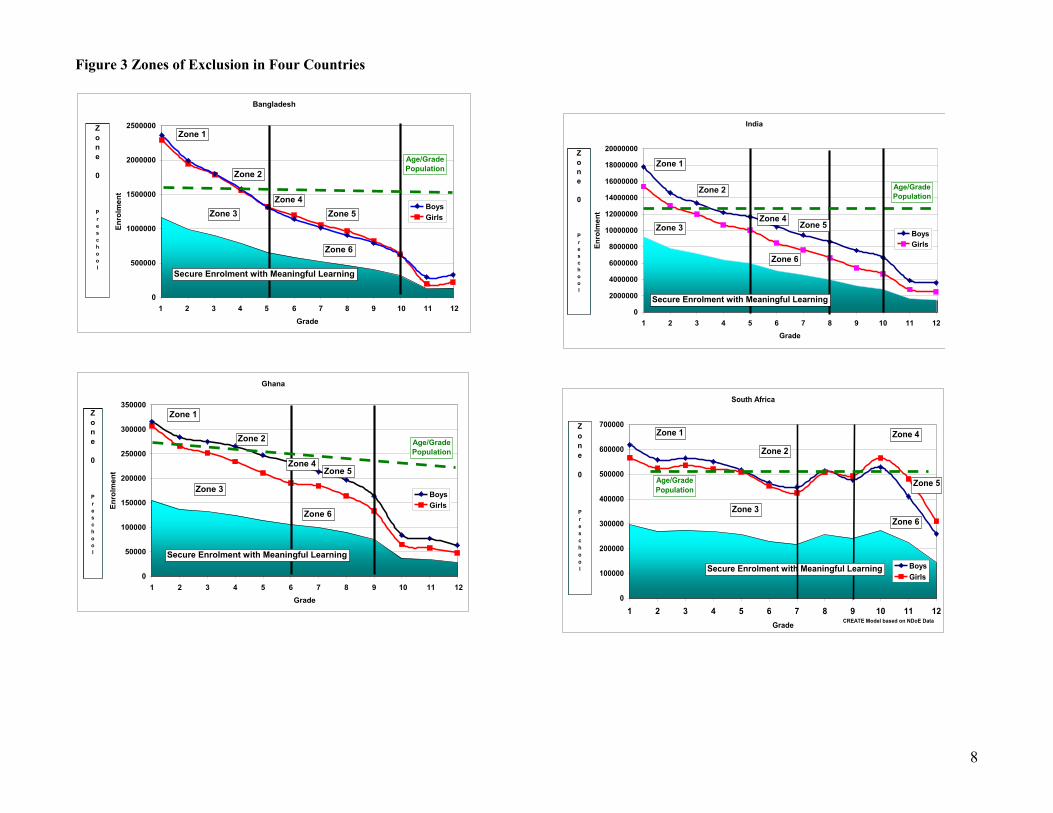
3.2 Zones of Exclusion in Four Countries The zones of exclusion model can be applied at national level. This gives an illustration of how it can be used to conceptualise starting points and key issues (Figure 3). In Bangladesh there are more children enrolled in Grades 1-3 than there are in the relevant age group. This is indicative of over age enrolment and some under age enrolment, and repetition of grades. Enrolment in Grade 1 is consistently about 30% more than it would have been had no child repeated. Above Grade 4 there are fewer children enrolled than in the age group. It is now the case that there are about the same number of girls as boys enrolled, unlike a decade ago when there was a significant gender gap. Bangladesh has a short primary system of only five grades. Its gross enrolment rate is above 100%. However, not many more than 50% of an age group succeed in entering secondary school in Grade 6 successfully and only 15% or so reach Grade 11 and 12 (Ahmed et al 2007). The zonal chart for India has a very high level of aggregation across all the states. The situation varies greatly, especially between the low enrolment BIMARU states and the more developed southern cone. At national level there are clearly issues that remain despite the gains achieved under India’s large scale EFA programme Sarva Shiksha Abhiyan (SSA(I)). Less than 60% of children complete Grade 5 on average and no more than 40% succeed in entering Grade 9. Above Grade 3 there are fewer enrolled than there are in the age cohort. There is a large difference in enrolments between boys and girls. The gap widens up to Grade 10 but above this girls drop out less than boys (Govinda et al, 2007). There are fewer girls than boys in the population. In some parts of some states various forms of gendered foeticide and gendered migration result in sex ratios as low as 800:1000. In Ghana in the first three grades there are more enrolled than in the age group as in the other countries. Though nearly equal numbers of boys and girls enter Grade 1, girls drop out faster until Grade 6. If they enter junior high school they drop out less than boys (Akyeampong et al, 2007). Above Grade 9 at entry to senior secondary school there is rapid attrition as costs rise and schools become very selective. By Grade 9 less than half the age group is enrolled. Moreover it remains the case that about 75% of all university entrants originate from only 20% of the secondary schools. Most have attended fee paying high cost private schools (Djangmah, 2011). Ghana has a distance to travel to achieve basic education for all. Access is inequitably distributed and quality varies widely (Boakye Yiadom, 2011). South Africa has almost full enrolment through to Grade 9 with as many or more enrolled as there are in the age group. Above Grade 6 there are more girls than boys enrolled which is also the case in several other southern African countries. Attrition accelerates above Grade 9 as students enter the further education and training (FET) level and study for national examinations. Many drop out before completing Grade 12. Below this level progression has been unhampered by selection examinations that block progression of low achievers. Though enrolment is high, achievement is often low (Taylor et al 2010, Motala et al 2011, Gilmour et al 2009) More information is available in the County Analytic Reviews and other research products. In all four countries there are very few children in zone 1 who never enrol. Most 5-15 year olds claim to be enrolled Those who are not enrolled include uncertain numbers of those excluded because of their civil status (e.g. illegal cross border/internal migrants) and those made invisible as a result of social exclusion (disability, HIV status, dalits, nomads). Those in zone 2 (drop outs) are the greatest number out of school. By Grade 9 more than half the children are no longer in school in three of the countries. Though many may be nominally in school below the age of 14 years, many are in grades below that expected for their age. In zone 3 children are enrolled in primary but judged to be at risk. This is signified by low attendance (less than 90% of the school time) over age (two years or more over age) and low achievement (two years or more below the standard for the grade). In South Africa though almost all below the age of 14 years claim to be enrolled it is probable that many do not attend regularly. It is also clearly the case that levels of achievement are often well below appropriate levels appropriate for particular grades, with more than half at least two years behind the norm by Grade 6 (Gilmour et al, 2009, Taylor et al. 2010). In India an average of 35% of students were not in school on the day of the visit by researchers (Bandyopadhyay, Das and Zeitlyn, 2011), Poor attendance and low achievement are also issues in the other countries and many children are over age in all countries. In low enrolment areas, especially in Ghana, it is often a majority who are over age by two years or more in rural areas (Rolleston et al, 2011). In Bangladesh in the rural primary schools surveyed, about half of all students in Grades 1-5 were two years or more overage (Zeitlyn and Hossain, 2011).
8
Figure 3 Zones of Exclusion in Four Countries
Bangladesh
0
500000
1000000
1500000
2000000
2500000
1 2 3 4 5 6 7 8 9 10 11 12
Grade
En
rolm
ent
BoysGirls
Zone 1
Zone 5
Zone 6
Zone 4
Zone 3
Secure Enrolment with Meaningful Learning
Age/Grade Population
Zone
0
Preschool
Zone 2
Ghana
0
50000
100000
150000
200000
250000
300000
350000
1 2 3 4 5 6 7 8 9 10 11 12
Grade
En
rolm
ent
BoysGirls
Zone 1
Zone 5
Zone 6
Zone 4
Zone 3
Zone 2
Secure Enrolment with Meaningful Learning
Age/Grade Population
Zone
0
Preschool
India
0
2000000
4000000
6000000
8000000
10000000
12000000
14000000
16000000
18000000
20000000
1 2 3 4 5 6 7 8 9 10 11 12
Grade
Enro
lmen
t
BoysGirls
Zone 1
Zone 4
Age/Grade Population
Secure Enrolment with Meaningful Learning
Zone
0
Preschool
Zone 2
Zone 5Zone 3
Zone 6
South Africa
0
100000
200000
300000
400000
500000
600000
700000
1 2 3 4 5 6 7 8 9 10 11 12Grade
BoysGirls
Zone
0
Preschool
Age/Grade Population
CREATE Model based on NDoE Data
Secure Enrolment with Meaningful Learning
Zone 1
Zone 2
Zone 3
Zone 4
Zone 5
Zone 6

9
Zone 4 contains children making the transition from primary to lower secondary2. Although nominal transition rates in all the countries are over 80% this does not mean that a majority of children enter secondary school. In all cases except South Africa, attrition has already taken place through the lower grades to the extent that no more than 50% enter secondary school. Transition to secondary school often involves travel and additional costs which are a disincentive to continue (Siddhu, 2010). Secondary schools are nominally tuition fee free in Ghana, and are tuition fee free for the third quintile of schools and below in South Africa. In India in most states and in Bangladesh, secondary schools charge fees. In all the countries truly private schools (i.e. unsubsidised) are only accessed by a small minority of households down to the second quintile of household income at primary level and only in the first quintile at secondary. Zone 5 includes those who drop out from secondary. At this level direct and indirect costs are higher than at primary, standards more difficult to achieve, and opportunity costs are greater where income earning opportunities exist. Over age students may be especially at risk of drop out both for employment and, in the case of girls, early marriage. Zone 6 covers those who are enrolled but at risk of drop out who are learning little and who may be silently excluded. Zone 6 is smaller than zone 3 both because there are fewer students as a result of drop out and selection, and because secondary schools are more likely to monitor progress and regulate the flow of students to maximise results in public examinations. CREATE had limited capacity to work in zone 0 which covers access to preschool. We note however that Ghana has committed itself to provide pre-school for two years to all children. South Africa has extended schooling downward by a year (Grade 0) and has a commitment to universalise access to pre-school. The Government of India launched the Integrated Child Development Services (ICDS) scheme in 1975 to provide health care facilities, nutritional support and to improve children’s communication and cognitive skills as a preparation for primary school. SSA (I) envisages providing preschool education building on the ICDS programme. However, enrolment in pre-primary facilities remains low (Bandyopadhyay and Behera, 2010). The Government of Bangladesh plans to introduce fee free pre-primary schools in all government and registered non-government primary schools (Hossain and Zeitlyn, 2010:15).
3.3 An Overview of Research Insights into Changing Patterns of Access Research on changing patterns of access took place on large scale cross national data sets to understand the evolution of participation, why universaling access has proved so elusive, and what lessons can be learned from the last thirty years (Lewin, 2011, 2009, 2007a, b, Somerset, 2007, Little 2010 a, b, c, Rolleston, 2009a, b, Lewin and Sabates, 2010, Oketch and Somerset, 2011, Chimombo 2009 and Akyeampong 2009). Enrolments by grade are a simple proxy for access to education. Several patterns emerge. Figure 4 illustrates these for a sample of cases3. In Uganda Universal Primary Education (UPE) was announced in 1997 and enrolments in Grade 1 more than doubled. These Grade 1 children did not arrive in Grade 7 seven years later. The system reached a new equilibrium with high drop out and much over age and some under age enrolment in Grade 1. The numbers reaching Grade 7 are only about half the number in an age cohort. This remained largely true a decade after UPE. Completion rates were well below those necessary for EFA to be achieved. Indeed the data shows that there was much “queuing” in Grade 6 as schools kept back children likely to fail the Grade 7 primary school leaving certificate (Lewin, 2007b). This is now happening in Bangladesh (Ahmed et al., 2011) as a result of the introduction of a national test. In Malawi the proportion of students graduating from Grade 8 has remained fairly similar despite a dramatic increase in total enrolments. Attrition remains alarmingly high (Chimombo, 2009). Tanzania has had two attempts at UPE and this is clearly visible in the chart. The last attempt appears more successful than the first when large enrolment gains were followed by a step fall off in participation in the 1980s (Sabates, et al., 2011b). In Ghana FCUBE did not have the same effect as other UPE programmes. Enrolment growth only took a small step upwards in the late 1980s. The gap in enrolments between Grade 1 and Grade 6 remained fairly constant over 20 years suggesting drop out and completion rates remained similar. Capitation and fee free schooling has had an impact since 2005 but it is not clear if the gains in Grade 1 will be sustained (Akyeampong 2011). Though enrolment rates have increased recently, especially in the North, attrition has yet to fall so drop out has remained high with less than half completing basic education successfully.
2 The zonal model for India places zone 4 at the boundary from primary to upper primary. In most states primary includes grades 1-5 and upper primary grades 6-8. In the other countries zone 4 is at the primary/secondary boundary. 3 See Lewin and Sabates 2011 for an analysis of 15 countries.

10
Figure 4 Enrolments over time; Sub Saharan Africa and India Uganda
Malawi
=============================== Madyha Pradesh
Uttar Pradesh
Tanzania
Ghana
================================= West Bengal
Karnataka
0
500,000
1,000,000
1,500,000
2,000,000
2,500,000
1985
1986
1987
1988
1989
1990
1991
1992
1993
1994
1995
1996
1997
1998
1999
2000
2001
2002
2003
2004
Grade 1Grade 2Grade 3Grade 4Grade 5Grade 6Grade 7
1997 Cohort Track
0
200000
400000
600000
800000
1000000
1200000
1990
1991
1992
1993
1994
1995
1996
1997
1998
1999
2000
2001
2002
2003
grade 1grade 2grade 3grade 4grade 5grade 6grade 7grade 8
1996 Cohort Track
0
500000
1000000
1500000
2000000
2500000
3000000
1 2 3 4 5 6 7 8
2002-032003-042004-052005-062006-07
0
1000000
2000000
3000000
4000000
5000000
6000000
7000000
1 2 3 4 5 6 7 8
2002-032003-042004-052005-062006-07
0
200000
400000
600000
800000
1000000
1200000
1400000
1600000
1800000
1970
1972
1974
1976
1978
1980
1982
1984
1986
1988
1990
1992
1994
1996
1998
2000
2002
2004
2006
2008
Grade 1Grade 2Grade 3Grade 4Grade 5Grade 6Grade 7
1978 Cohort Track
2002 Cohort Track
0
100000
200000
300000
400000
500000
600000
700000
800000
1980
1981
1982
1983
1984
1985
1986
1987
1988
1989
1990
1991
1992
1993
1994
1995
1996
1997
1998
1999
2000
2001
2002
2003
2004
2005
2006
2007
Grade 1Grade 2Grade 3Grade 4Grade 5Grade 6
0
500000
1000000
1500000
2000000
2500000
3000000
1 2 3 4 5 6 7 8
2002-032003-042004-052005-062006-07
0
200000
400000
600000
800000
1000000
1200000
1400000
1 2 3 4 5 6 7
2002-032003-042004-052006-07

11
The data on four India States is displayed in a different way showing enrolment by Grade over five years in the 2000s. In Madyha Pradesh, Uttar Pradesh and West Bengal there is a step down between Grade 5 and 6 where primary schooling ends and upper primary schooling begins. Many drop out before Grade 5 despite the efforts of SSA. In West Bengal there is high drop out from Grade 1 to 2. This is partly a result of underage enrolment and high repetition of Grade 1. In Karnataka there is no inflection in enrolments in Grade 5 indicating that virtually all who enrol progress on schedule. We can see that under SSA (I) what should have been happening is not happening very rapidly i.e. the curves should be evolving towards the shape in Karnataka. The gradient of the enrolment curves should be flattening as more and more children progress through to Grade 8. In fact rates of attrition seem to be remaining fairly constant and the gradient of attrition is remaining the same. Overall enrolments are growing a little faster than population growth. Those reaching Grade 8 in low enrolment states are less than half those in the relevant age group. This is a serious constraint on expanded access to secondary schooling (Lewin 2011b) which has become a priority under Rastriya Madhyamik Shiksha Abhiyan (RMSA). RMSA has developed using ideas from CREATE. Enrolment patterns by grade in education systems fall into several types. A simplified and typology is shown in Figure 5. In Type 1 the grade specific participation rate – the number enrolled over the number in the nominal age group for the grade - is a little over 100% in Grade 1 and falls slowly. Secondary level participation also has grade specific enrolment rates close to 100%. These countries mostly have virtually full enrolment with few over age children and drop outs and include South Africa, Namibia, Botswana and Mauritius. Thus where there are significant numbers of over age children in the system, grade specific enrolment rates can be around 100% for each primary grade but many remain out of school, at least at higher grade levels. In contrast, countries with enrolments like Type 2 have as many as twice the number of children enrolled in Grade 1 as there are in the population. Many are over age and a few are under age. Attrition is sharp and leads to the participation rate falling along a convex curve to around 50% by Grade 6 and continuing to fall in higher grades so secondary participation is low. Many countries with high growth in enrolments after the announcement of universal primary education (UPE) have experienced patterns of enrolment similar to Type 2 with very high grade specific enrolment rates in Grade 1. These countries include Malawi, and Uganda. The third group of countries – Type 3 – are similar except that the decline in enrolments through the primary grades follows a concave curve suggesting that retention in the early grades is high but that drop out becomes increasingly rapid in higher grades as in Kenya and Zambia. Type 4 countries have very low enrolment rates at all levels. In these countries many do not enter Grade 1 and most fail to reach Grade 6. Many of these countries are in francophone Africa. Patterns of enrolment in Indian states follow the same typology (Lewin, 2009). It is a reasonable assumption that the investments targeted at universal primary enrolment should result in Type 4 countries evolving through Types 3 and 2 to Type 1 systems. It is an empirical question as to whether that happens. The evidence is that this is not necessarily the case (Lewin, 2009; Lewin and Sabates, 2011). Figure 5 Simplified typology of enrolment patterns in school systems
0
50
100
150
200
250
300
1 2 3 4 5 6 7 8 9 10 11 12Grade
Inde
x of P
artic
patio
n
1.Hi GER1 Hi GER2
2.V.Hi GER1ConcaveV.Low GER2
3.V. Hi GER1Convex LowGER2
4.Low GER 1V.Low GER2
Primary Lower Secondary Upper Secondary
1
2
3
4

12
CREATE has explored how enrolment patterns change with age. Figure 8 shows how participation can change with age and is linked to the CREATE zones of exclusion. It indicates that in this system, which simulates Ghana, about 40% of six year olds are not in school and this falls to about 10% by age 11. Above this age those who have not enrolled are unlikely to ever enrol (zone 1). From age 7 and above some children drop out and the number gradually increases with age. These become the largest number of out of school children above about 11 year old and fall into zone 2 of the CREATE model. Children who enrol but are at risk of drop out and are characterised as low attending, over age and poor achieving fall into zone 3 and gradually become and increasing proportion of those still enrolled in primary grades above the age of 11 years. And from 12 years and above some make the transition into secondary school though if they fail to do this by the age of 15 or so it becomes less likely that they will complete lower secondary successfully. Figure 6 Age and Enrolment
Conventional measures of patterns of access conceal the way age in grade varies (Lewin, 2011d). The evolution of age in grade relationships is important for several reasons. First, children who enrol above the normal age of entry will miss learning experiences at a time when they are most receptive to learning basic skills and establishing secure foundations for subsequent cognitive development. Second, those who repeat Grade 1 or subsequent grades will become over age for their grade. The more over age a child is within a grade the more it is likely that they will underachieve (Taylor et al, 2010). Third, where older children are taught in class groups with younger children there may be psycho-social issues (e.g. of self esteem, bullying, sexual harassment), and problems of matching learning to cognitive capabilities (especially with monograde curricula where all pupils are taught the same things at the same time). Fourth, over age children will be late to arrive at the last grade of primary or junior secondary school. Where the age of initial entry is six or seven, primary school leavers in a six grade system will be 12 or 13. If they are two years over age, they will be 14 or 15. In many societies this approaches the ages of entry to the labour market and/or marriage. Children who are two or more years over age will be in their late teens before reaching the end of junior secondary school making it unlikely most will persist further in formal education. Data from Anglophone and Francophone countries, and from India is illustrative of some of the issues (Figure 9). Malawi has a pattern of over age enrolment where the spread of ages within a grade increases greatly from Grade 1 to Grade 8. At the same time there is considerable attrition with only a small minority surviving to Grade 8. Some children in Grade 8 are likely to be 15 or 16 and would thus not complete junior secondary until they are 19 or 20 years old. Zambia has a similar pattern with less attrition since it has higher grade specific enrolment rates in the higher grades. Children in Grade 7 appear to be between 11 and 17 years old. In Kenya a somewhat different pattern prevails with age in grade widening from Grade 4 and above. This may be the result of repetition and years lost with school transfers. By Grade 8 children are between the ages of 12 and 18 years old. The pattern in Tanzania shows a dramatic change in the lower grades, which is likely to be a result of the most recent drive for universal enrolment. In the low grades most children are now within a year of the nominal age for their grade. Above Grade 3 there is a wider dispersion of age in grade but this should diminish.
0%
10%
20%
30%
40%
50%
60%
70%
80%
90%
100%
6 7 8 9 10 11 12 13 14 15
Age
Par
tici
pat
ion
(%
)
Securely AttendingPrimary School
Attending PrimarySchool but At Riskof Leaving
Attended Primaryand Left beforeCompletion
Completed Primaryand Left
Never AttendedPrimary
Zone 1
Zone 2
Zone 3
Zone 4

13
Figure 7 Age-in-grade distributions Malawi
Zambia
Madagascar
Andhra Pradesh
Kenya
Tanzania
Niger
Madhya Pradesh
0
50000
100000
150000
200000
250000
300000
350000
5 6 7 8 9 10 11 12 13 14 15 16 17 18 19 20Age
P1P2P3P4P5P6P8
0
20000
40000
60000
80000
100000
120000
140000
160000
6 7 8 9 10 11 12 13 14 15 16 17 18 19Age
P1P2P3P4P5P6P7
Madagascar: enrolments by age and grade (2004)
0
50000
100000
150000
200000
250000
300000
350000
400000
450000
500000
4 5 6 7 8 9 10 11 12 13 14 15 16 17 18 19 20 21 22 23 24Age
Enro
lmen
ts
P1 P2 P3 P4 P5 S1
S2 S3 S4 S5 S6 S7
0
200000
400000
600000
800000
1000000
1200000
1400000
-5 6 8 10 12 14 16Age
Enro
lmen
t
Grade 1Grade 2Grade 3Grade 4Grade 5Grade 6Grade 7Grade 8
0
50000
100000
150000
200000
250000
300000
350000
400000
450000
5 6 7 8 9 10 11 12 13 14 15 16 17 18 19 20Age
P1P2P3P4P5P6P7P8
0
200000
400000
600000
800000
1000000
1200000
6 7 8 9 10 11 12 13 14 15 16 17 18 19 20Age
P1P2P3P4P5P6P7
Niger: enrolments by age and grade (2004)
0
20000
40000
60000
80000
100000
120000
140000
160000
4 5 6 7 8 9 10 11 12 13 14 15 16 17 18 19 20 21 22 23 24Age
Enro
lmen
ts
P1 P2 P3 P4 P5 P6 S1
S2 S3 S4 S5 S6 S7
-100000
0
100000
200000
300000
400000
500000
600000
700000
800000
900000
< 5 5 6 7 8 9 10 11 12 13 14 15 16 > 16
Age
Enrolments
Grade 1Grade 2Grade 3Grade 4Grade 5Grade 6Grade 7Grade 8

14
Madagascar has massive over enrolment in Grade 1 which includes many children over age with at least a five year spread. This dispersion persists and appears to widen up to Grade 6. At the same time enrolments within grades decline dramatically from Grade 1 to Grade 2 and then more slowly. Niger has less dispersion than the Anglophone countries but more attrition between grades (Lewin and Sabates, 2011). In Andhra Pradesh in India which has high enrolment rates it is clear that most children are within a year of the nominal age for their grade and progress on schedule. In contrast in Madhya Pradesh, which has low participation, there is wide age in grade dispersion that increases with grade. If age in grade remains wide it is inevitable that most will not complete primary and junior secondary. All countries which succeed in universalising enrolment and completion of primary and junior secondary have low dispersions of age in grade.
3.4 General Research Findings Important observations arising from the research include but are not limited to:
• Increased enrolment rates have often been accompanied by increased drop out and greater number of over age children who are more likely to be at risk of failing to complete basic education. In many school systems where there has been a concerted effort to increase enrolment rates rapidly short term gains have masked very uneven patterns of enrolment across different grades, persistently high drop out, and increasing proportions of over age children. This is clearly the case in a number of Sub-Saharan African countries (Lewin and Sabates, 2011; Lewin 2009, Somerset 2007). It appears also to be the case in some northern states in India (Lewin 2011b). In some countries gross over enrolment in Grade 1, high drop out from middle grades, and slow improvements in enrolments and completion rates at Grade 5 and above have persisted for more than a decade. Unbalanced systems have settled to new equilibria that enrol more children but may fail to generate commensurate gains in completion rates. Evolution through characteristic patterns of enrolment types (Lewin, 2007a) has failed to occur in several low enrolment countries.
• Most children out of school are drop outs, not those who never enrol. This is true in Bangladesh, India, and Ghana and in slightly different ways in South Africa (Ahmed et al 2007, Govinda et al 2007, Akyeampong et al 2007, Motala et al, 2007). It is also true in many other low income countries (Lewin and Sabates, 2011). Exclusion from education is therefore more often a result of drop out than of initial and permanent exclusion. Most children below the age of 15 who are currently out of school have attended school but have not completed basic education. A 5% annual drop out rate (which is common in many countries) results in less than 75% of those who enrol reaching Grade 6 and less than 65% reaching Grade 9. Drop out and lack of progression through to the end of the basic education cycle is the biggest challenge for universalising access to basic education in the countries in which CREATE has worked. Unless drop out is reduced there will always be generations of out of school children of school age replenished by new drop outs. Achieving the MDGs and EFA depends on much higher levels of retention, as well as efforts to include the minority who never enrol. Children who never enrol are in an important group since their right to access to education is completely compromised. In the north of Ghana more than 40% of children in some areas are not in school at the age of 8 and many enter school over age. In the south, it appears that less than 10% fail to enter school at all indicating the success of one aspect of EFA programmes (Rolleston, 2009). We have been able to identify never enrolled and non attending children in our research sites and we have insights into their characteristics from secondary data at national and regional level. For example, in the Northern Region, a fostered child has a chance of ever attending school 19% lower than a biological son or daughter, other things being equal (Rolleston, 2010). However, in many cases there is no reliable national data from any of our research sites that adequately captures many marginalised groups e.g. illegal internal and international migrants, children in socially excluded groups, some children with disability, illness, HIV and other socially exclusive conditions. These children can only be captured through community level enquiry, and commitment to identify and act to deliver rights to education. Often, but not always, those never attending are more likely to be children from poor households with larger numbers of young children, girls, children with disability, orphans, and are likely to be concentrated in some geographic areas. Children who never enrol are in households where either i) they could have enrolled but did not where the best solution is to extend the reach of the existing system and understand and act on the reasons for non enrolment or ii) they are located where normal enrolment is not feasible and the best solutions may require

15
novel approaches e.g. the School for Life in northern Ghana (Akyeampong, 2007, Arkoful, 2010). Within households, there may be considerable variation between children in terms of enrolment. Rolleston (2011b) found that non-fostered children living in households where some fostered children lived had the greatest chance of being enrolled and worked the least number of hours compared to other groups of children.
• “Silent exclusion” is important in all research sites. This refers to children nominally enrolled but learning little and at risk of drop out. Many learners are seriously over age (Lewin and Sabates, 2011, Rolleston, 2009, Ampiah, 2011, Motala, 2009, Govinda et al, 2011, Hossain, 2011) attend infrequently (Govinda and Bandyopadhyay, 2011, Rolleston et al, 2010), and score poorly on achievement tests (Taylor et al, 2010; Ampiah et al, 2011). Silent exclusion is also correlated strongly with poverty and poor health (Hossain and Zeitlyn, 2010). Increased physical access has resulted in large numbers failing to reach minimum learning goals and many being two or more years below norms expected levels of performance (Gilmour and Soudien, 2009, Taylor et al., 2010, Ampiah et al, 2011). A working definition of silent exclusion identifies children at risk as those who are attending less than 90% of timetabled time, are over age by two years of more, have repeated more than one year of school and who are performing two or more grades below the norm in language and mathematics. Using these indicators about 20% of primary school children in the Bangladesh sample were silently excluded (Hossain and Zeitlyn, 2010:7) and at risk of drop out. These children have physical access but not the epistemic access that allows them to learn.
• Over-age entry to primary school and delayed progression are substantial impediments to the achievement of EFA in Ghana, India and Bangladesh, and remain significant in South Africa despite the formal commitment to automatic promotion. If children do not enrol by the age of ten it is unlikely that they ever will (see Figure 8 above) (Lewin 2007a, Akyeampong et al 2007, Rolleston et al, 2011). Late entry arises from several factors including stunting, household labour, under valuing schooling, safety, lack of awareness of birthdates. The standard deviation of age in grade usually increases with grade (Lewin, 2009), except where there are strong selection effects at higher levels which result in over age children being excluded. Entering school late and being over-age increases the chances of drop out (Sabates et al, 2010:15). Girls appear particularly vulnerable to drop out if they are over-age in communities where early marriage is common (Sabates et al, 2010; Taylor et al, 2010). In much, but not all, of Sub-Saharan Africa the preponderance of boys at secondary level is due mostly to the differential persistence to older ages of boys. Where completion rates are lowest, over-age enrolment is greatest. There is some evidence that gains in enrolment rates have been achieved at the cost of greater proportions of over-age children enrolled. Thus improvement in the wealth gradient for being in school for the poorest children was accompanied by an increase in the likelihood of being over age in school, more so in Anglophone than in Francophone countries. In two Anglophone countries, Malawi and Nigeria, the probability of being over age in school by three or more years has increased over the last decade. In Tanzania the situation is different, since all children have a lower probability of being over age, but the richest children gained much more rapidly. In Kenya, Uganda and Zambia the situation remained almost unchanged. The wealth gradient for over age by three or more years has become steeper in Malawi, Nigeria and Tanzania and remained unchanged in Kenya, Uganda and Zambia. It should have fallen in all cases (Lewin and Sabates, 2011). If this were transient it might not be surprising. However in some countries it appears to be a persistent effect. No high enrolment and high completion rate system has wide age in grade dispersion.
• Poor attendance of children and teachers results in the loss of large amounts of learning time, and is often associated with low achievement and repetition leading to over age enrolment. Aggregate enrolment rate indicators conceal low levels of daily attendance, which can lead to poor achievement and drop out. In some systems, and in some schools in our case studies, child attendance may average less than 60% on a given day (Ampiah et al 2011; Bandyopadhyay, Das and Zeitlyn, 2011). When this is coupled with irregular teacher attendance this may result in the loss of more than half of all learning time. Irregular teacher attendance was a problem in many places (Bandyopadhyay, Umabati and Zeitlyn, 2011; Alhassan and Adzahlie-Mensah, 2010). In Sri Lanka where enrolment rates are high, poor attendance and low achievement are associated more strongly with school and community effects rather than households. Effects. Poor health is associated with low attendance. Household assets are associated with private tuition which is a predictor of achievement (Little, Indika, Rolleston, 2011). Indicators of attendance have to be included in measures of progress towards the MDGs and EFA. Reasons for poor attendance are varied and include sickness, caring for siblings and relatives, seasonality, local opportunity costs for cash income, costs, transport issues, school discipline, and low achievement (Govinda and Bandyopadhyay, 2010).

16
School feeding appears to increase attendance in some cases but can have substantial costs. Poor attendance may be a pre-cursor to drop out (Sabates et al, 2010) and happens in characteristic patterns which may be temporary or permanent and may be sporadic, linked to singular events, or long term and persistent, and may be associated with ambitions to drop in or to remain dropped out (Ananga, 2010). These different conditions have different causalities and link to different possible interventions.
• Poor health and nutrition are related to late enrolment, low attendance, repetition, low achievement, and subsequent drop out in complex ways. CREATE has developed a comprehensive state of the art review of evidence on the impact of health and nutrition on educational access, participation and achievement (Pridmore, 2007) and has extended this with insights from fieldwork which has included measuring Body Mass Indices in some sites, and through analysis of secondary data (e.g. Orkin 2011, Sabates and Hernandez, 2011, Buxton, 2011). Poor health and nutrition clearly contribute to educational exclusion across the zones of exclusion (Hossain and Zeitlyn, 2011). Health shocks from (and before) birth may have enduring consequences – stunting is irreversible, cognitive damage from nutritional deficiencies may not be recoverable (Sood, 2010). Orkin’s work (2011) is the result of collaboration with the “Young Lives” project funded by DFID. It shows how important it is to understand patterns of parental and child morbidity and how these interact with attendance and progression. Illness increases the likelihood that children become over age when schools require the repetition of a whole grade after a period of absence. The size of the illness effect on become over age was similar to the size of effect of being stunted in a large sample and has as much negative impact on access as being an orphan. Orkin (2011), Ananga (2011) and Ampiah and Adu Yeboah (2011) highlight the role of children in caring for sick relatives.
• Disability is linked to higher probabilities of exclusion. Croft (2010) has reviewed definitions and approaches, and identified key issues needed to achieve greater inclusion of disabled children and young people in learning and this work is complemented by Gifford-Lindsay’s study (2008). Pedagogical approaches suited to circumstance and disability are critical to effective practice and depend on assumptions that differ across cultures. Widely the identification of disability is uneven and imprecise resulting in uncertain but barriers to access to those with disability. Specialised provision for recognised disabilities – speech, hearing, sight, mobility – appear often to depend on support from non state providers and policy on inclusion and mainstreaming those with disability in normal schools can be inconsistent and contradictory.
• Drop Out is linked to direct and indirect costs, income shocks, opportunity costs, household and paid labour, migration, morbidity and household health events, orphanhood, marriage and pregnancy, disability, distance from school, safety, perceived lack of relevance, poor quality schooling, teacher absenteeism and poor learning environment. CREATE has identified many factors associated with drop out and push out (Hunt, 2008). The CREATE model predicts that drop out is likely to be more likely amongst those who enter school over age, who repeat grades, attend poorly, and are low achieving. Community and school data confirm these propositions (e.g. Sabates et al, 2010). Some school practices appear to be counter productive (Sinha and Reddy, 2010). Corporal punishment remains widely used in Ghana and South Africa and can be a disincentive to return to school when absenteeism is punished (Alhassan and Adzahlie-Mensah, 2010). Bullying is associated with problems of sustained access to school (Dunne et al 2010). Temporary absence followed by repetition of a whole grade increases the numbers over age (Orkin, 2011). Household welfare indicators are very strongly associated with enrolment in Ghana. A one unit increase in the log of household welfare is found to increase a child’s relative risk of being in zone 2, relative to zone 1 by 1.8 times. The same increase in welfare increases a child’s relative risk of being in zone 4 relative to zone 1 by 2.6 times and increases the relative risk of being in zone 5 by 3.1 times. With regard to completing junior secondary school, the relative risk was increased by 4.1 times. The effects of occupations of the household head were even more significant. The children of public sector employees had four times less chance of dropping out than those of those not working, and nine times less chance of being excluded from secondary school (Rolleston, 2009b). Similar effects are evident in other data sets (Sabates et al, 2010, Reddy, 2010). And more qualitative data yields insights from about the dynamics of drop out and the inter relationships with practices at the community level (Laugharn, 2007, Cameron, 2010, Ananga, 2010).

17
• Effective Small schools and Multi-grade Teaching and Learning are essential to reach those where school size is small. Over 80% of primary schools in rural India have three or less teachers, but cover enrolment across five grades (Blum and Diwan, 2007, Little, 2008, Little, Blum et al 2008). Unless multi-grade pedagogies are used, as in Activity Based Learning (ABL) in Tamilnadu (Kumar; CREATE Lecture, 2010), learning time will be lost. Small schools are common and necessary at primary level in low population density areas. Expanded access to lower secondary schooling creates an additional challenge for the design and operation of small day secondary schools at sustainable costs. Though boarding is an option it is not one that is likely to be cost efficient on a large scale, unless organised in the way it is in rural China (Lewin, 2011e). Multi-grade schools require investment in suitable core curriculum, appropriate learning materials, and the development and support of multi-grade pedagogies (Little, 2008b). There is no reason why they should be more expensive in operation than monograde once the start up costs have been covered.
• Expanding access to secondary schooling is critical to achieving universal access to primary schools. Access to secondary schooling is becoming a greater determinant of life chances than completion of primary schooling in most poor countries. Those who progress to post primary education are much more likely to come from richer households and be urban rather than rural. Unless transition rates to lower secondary are high, demand to complete primary schooling will soften. Participation at secondary level also needs to grow fast enough to ensure the supply of new primary teachers needed to support universal access to primary school. There are many other reasons to manage the expansion of secondary schooling, not least the critical importance to economic growth of ensuring that enough secondary educated graduates reach the labour market (Lewin, 2007b). Data from Kenya indicate how access to secondary schooling favours richer households and existing elites (Oketch and Somerset, 2010, Ohba, 2010). In Ghana 20% of secondary schools provide 75% of university entrants (Djangmah, 2011). In India costs remain a disincentive to enrol above Grade 8 (Siddhu, 2010, Lewin, 2011b). Expanded access requires curriculum reform to reflect the characteristics, aspirations and needs of new generations of students less selected than in the past. It will also need reforms in financing.
• Teacher supply and deployment can be insufficient, unbalanced, inequitable and inefficient. Circumstances differ widely between countries and regions and modalities for training new teachers are also greatly varied. Teacher’s salaries relative to local incomes cover a wide range of ratios and influence demand for initial training and subsequent motivation. As communication infrastructure has improved it appear to have become more common in some areas for teachers to live off site and commute to rural schools from small towns and urban areas. This may dilute relationships between teachers and communities, especially where teachers are drawn from different castes and classes than the children they teach (Bandyopadhyay, Umabati and Zeitlyn, 2011). Full time pre-career residential training of teachers is expensive. Case study sites provide evidence of uneven posting of teachers, teacher absenteeism, low time on task, and disinterested and unimaginative pedagogy (Govinda et al 2010; Bandyopadhyay, Umabati and Zeitlyn, 2011; Alhassan and Adzahlie-Mensah, 2010; Akyeampong, 2011). Pupil teacher ratios vary widely across and within case study districts from below 10:1 to over 100:1 with consequences for learning and teaching, and acute shortages of teachers persist in some areas, and coexist with surpluses in others. More efficient methods of training and deployment are needed to support EFA at sustainable costs (Bandyopadhyay, Umabati and Zeitlyn, 2011).
• Migration, seasonality and nomadic livelihoods generate major challenges for universalising access. Migration (cross border, internal, related to urbanisation and internal displacement) is common in sub-Saharan Africa and South Asia and is driven be a range of different motivations that include asylum seeking from oppression and exclusion, labour migration, and family affinity. Children may move to be fostered within households and fostered children migrate to earn money to secure a good marriage (Rolleston 2011b), they may be accompanied by parents or leave parents behind (Buckland, 2011; Shindler, 2010), and some children are left behind by migrating parents and may be cared for by relatives or placed in boarding schools (Lewin, 2011e). Information on migrants is very uneven and hampered by the illegal nature of some of it, and the risks of persecution associated with asylum seekers fleeing violence. Seasonality is often associated with temporary migration and this can disrupt schooling (Ananga, 2010, Hadley, 2010). Nomadic communities are especially challenged by conventional school systems predicated on sedentary livelihoods and a range of different strategies can be adopted to deliver basic education for them (Sharma, 2011). Hadley (2010) notes that agricultural seasonality is rarely linked to discussion of education policy in Sub-Saharan Africa. Yet it is clear that income poverty and labour demand vary with the agricultural

18
seasons and have implications for household income, child labour, gender inequalities, migration, malnutrition, anaemia and malaria. These in turn have implications in each of CREATE’s zones of Exclusion addressing initial enrolment, school attendance, dropout, repetition and cognitive development and learning. Poorly planned mass education policies can unintentionally damage rural livelihoods by forcing children and households to decide between education and work. Schools run by BRAC operate a seasonally-adjusted school calendar designed through consultation with parents and the wider community. State-led reforms of the school schedule or fee due-dates in Brazil, Colombia and the Gambia have proved successful in boosting enrolments and lowering drop-out rates.
• Non-State providers make contributions to educational access but remain much less important than public authorities (Rose, 2007a, b). At primary level in Ghana and South Africa NGO capacity is a small proportion of total provision. In South Africa non-state providers only account for about 5% of enrolments and most of these are in high cost private schools (Lewin and Sayed, 2005, Motala 2008). NGOs come in many forms. Non-profit varieties include faith based, philanthropic, community supported, and corporate forms (Rose, 2007b). BRAC is a very large scale not for profit provider with a unique pedagogic programme which provides access to education in rural Bangladesh, alongside a range other NGOs (Ahmed, 2007, Sabur et al 2009). 40% of children in Bangladesh go to schools managed by non-state education providers, although only 15% are in schools not funded by the state (Sabur and Ahmed, 2010:8). Key issues are whether different NGOs should be encouraged to deliver service or complement those provided by the state, and whether the state or NGOs should be the provider of last resort. Large-scale public subsidy of such NGOs is unlikely to be the strategy of choice.
• Private for profit schools have provided high cost, high quality schooling to a small minority of children. The limits to growth of such schools are determined by costs and household income. Unsubsidised private schools adopting standards and salaries similar to government primary schools are largely unaffordable in sub-Saharan Africa for households below the second quintile of income. At secondary level households below the first quintile are likely to be excluded (Lewin, 2007e). Empirical evidence from India shows conclusively that the poorest cannot access low price private schools in rural areas and that the development of such schools for richer parents has resulted in an almost complete separation of the schooling of the richer children from that of the poorest (Härmä, 2010, Siddhu, 2011). The poorest, remotest areas in need of more education facilities are often not served by private providers, while wealthier areas with already adequate state provision have most private providers (Govinda and Bandyopadhyay, 2010a). In Ghana low price private schools also do not generate access to the poorest (Akaguri, 2010). In both countries, private school teachers may be paid below minimum wage levels and a fraction of the salary of government teachers – as little as one twentieth in some part of India. The conclusion is that private providers (i.e. unsubsidised, for profit) will only contribute on the margin to achieving EFA and the MDGs. Private providers will not be the provider of last resort to the poor and will predominantly capture differentiated demand from failing public providers amongst households with relatively high income (Lewin, 2007e).
• Equity in access remains elusive. Access to education remains strongly associated with household wealth despite commitments to pro-poor policies and investment of resources. Inequity is manifested itself in terms of socio-economic indicators, regional disparities, urban – rural differences, gender discrimination and social exclusion. Evidence from 13 sub-Saharan African countries using national data from the 1990s and 2000s shows that though overall participation has increased, the chances of the poorest being enrolled relative to the richest have generally not improved substantially, and in some cases have deteriorated. Reductions in the number of children out of school have in many cases been accompanied by an increase in the proportion of children over age for the grade in which they are enrolled. Poorer children are more likely to be over age and unlikely to complete schooling especially if they are girls. Girls are more likely to be out of school than boys in most of the Francophone countries but not in most of the Anglophone countries. In all the Francophone countries in the sample rural children were more likely to be out of school, but this was only true in one Anglophone case. Rural children remain more likely to be overage (Lewin and Sabates, 2011). Data from Bangladesh show that inequalities have also persisted in access to education with the poorest being excluded in greater proportions in all the zones of exclusion (Hossain and Zeitlyn, 2010). While urban dwellers are regarded as better off, the lack of schools to service urban slums and inability of the urban poor to afford private providers means that they are often completely excluded (Cameron, 2010). In India, relatively poor access indicators for Muslims (Härmä, 2010), low castes, tribal groups (Sedwal and

19
Kamat, 2008) and girls (Bandyopadhyay and Subrahmanian, 2008) show the powerful effects of social exclusion. Regional disparities in India also mean that some states are doing well while other lag behind (Lewin, 2011b) and even within states, regions inhabited by minority groups may be poorly served by education infrastructure (Govinda and Bandyopadhyay, 2010a). The message is clear. Though there has been progress, it falls far short of the gains that were anticipated. In a small but worrying number of cases the gains have been small or negative. In others much more progress is needed to achieve universal access with equity and to close the gap between the poorest and other households.
• School quality and school processes4 are inseparable from educational access and outcomes and are embedded in CREATE’s extended vision of access. Access requires learning that has utility using pedagogies that are effective and fit for purpose which result in achievement commensurate with grade level. Several research outputs address quality and achievement issues. Govinda and Bandyopadhyay (2011) argue that what they call ‘the backward linkage between school quality and exclusion from schooling’ needs to be further examined, insisting, along with other CREATE researchers (e.g. Reddy and Sinha, 2010; Alhassan and Adzahlie-Mensah, 2010) that poor quality and unfriendly schools are putting children and families off and pushing them out of education. Alexander (2008) explores how educational quality in the classroom is conceived, indicated and measured and how it might be conceived, indicated and measured better in the future. This work offers insights into “silent exclusion” and provides provocative discussion of quality, and of quality indicators and quality measures in the domain of pedagogy, offers a rich and detailed framework for thinking about and planning for education of quality for all children, including those at risk currently of falling within the zone of silent exclusion. Pedagogy is often the missing ingredient in EFA discussions of quality which foreground indicators and outcomes, and largely ignore process. Indicators and measures are often confused though they are not the same things, and quality has to be judged in ways that are comprehensive, guard against evidential basis, have validity and reliability, give insight into impact, are manageable and apposite to level and context of use. This links to other critiques of indicators of EFA progress (Lewin 2011d) that invite careful consideration of who needs to know what to improve quality. Other research insights relevant to quality include an analysis of bullying and its consequences (Dunne et al, 2010), an exploration of school based support for vulnerable children (Williams, 2010); insights into language policy and practice in South Africa (Lafon, 2009), and problems with age in grade progression that relate in part to the quality of learning and teaching. Hossain, (2010), Taylor et al (2010), and Rolleston et al (2011) show how over age learners perform worse than those in the correct age for their grade and note that there is little or no pedagogic recognition of age grade slippage and needs for support for over age learners. Alhassan and Adzahlie-Mensah (2010) provide insights into some practices amongst teachers that seem likely to undermine quality learning and diminish access. These include absenteeism and corporal punishment as well as poor pedagogic practices that place most responsibility for poor performance on children.
• Physical access and supply side problems - insufficient schools, too few qualified teachers, poor quality learning space - remain a serious constraint on realising equitable access to basic education for all. Our case studies identify schools which have no clean water or sanitation, no electricity, poor physical conditions which compromise learning, too few classrooms, and over size classes sometimes with over 100 children to a room or taught outside (Govinda and Bandyopadhyay, 2011; Williams, 2010). There are also regions in where there are simply not enough schools within reach of populations (Siddhu, 2010, Govinda and Bandyopadhyay, 2011, Cameron, 2010). It is a fundamental criteria for meaningful access that physical facilities meet basic standards that should include at minimum clean water, sanitation, safe learning space with light and ventilation and no environmental hazards, location within reasonable travel distance, appropriate furniture and equipment, adequate supply of learning materials including books, blackboards and essential teaching aids, sufficient classrooms and teachers to organise classes with no more than 40 children, adequate local accommodation for teachers, and access to modern communication system. Thus, school building programmes linked to school mapping remains essential to ensure access to adequate school space in accessible locations. Investment is needed in learning materials and curriculum fit for purpose.
• Demand side problems – rising opportunity costs, lack of perceived relevance, early marriage - are
4 CREATE’s main focus was not on school quality, which was addressed by EdQual, or on outcomes, which was addressed by RECOUP

20
growing in importance as enrolment rates increase and basic education is extended to include Grades 9 or 10. CREATE research highlights drop out because of poverty (Sabates et al, 2010), opportunity costs in local labour markets (Ananga, 2011), lack of perceived benefits, and lack of relevance, poor school quality (Govinda and Bandyopadhyay, 2011). These are visible especially amongst older children and their parents who question the value of completing a full cycle of basic education for some children and who have greater pressures on them to marry or contribute to the household economy. EFA is unachievable without understanding these problems. Effective demand problems are evident in upper primary and lower secondary, and amongst older children (Ananga, 2011).
• Costs and financing of primary schools remains problematic and the non-tuition fee costs to households of primary schooling are becoming far more important for exclusion than tuition fees. Bangladesh (Hossain, 2011; Hossain and Zeitlyn (2010), India (Govinda, 2011) and Ghana (Akyeampong, 2011) have tuition fee free primary schooling, as does South Africa for schools in the poorest three quintiles. However it is clear that informal and additional fees are charged widely for services, and other contributions are invited or expected. Other costs to households can be high (transport, uniforms, learning materials, food) (Akaguri, 2010). Capitation has been introduced in some countries (e.g. Ghana) with the expectation that this income to schools will replace foregone fee income after tuition fees are abolished (Akyeampong, 2011). It is not clear that capitation has been sufficient. In the case of Ghana subsidies have been made available to all schools with the expectation of fee free schooling but this has in fact subsidised the relatively rich more than the relatively poor. Those from richer households participate more and longer.
• Secondary school financing remains central to problems of expanded access through to the end of lower secondary school. Mass secondary education in sub-Saharan Africa is unattainable at current levels of cost and teacher productivity for reasons of demography, income distribution, and teacher labour costs. No country with a public cost per student ratio of secondary to primary of more than 2:1 is likely to provide mass access to secondary schooling. No household much beyond the 20th percentile of household income will be able to afford unsubsidised private secondary schooling in much of sub-Saharan Africa. Nor will such households be able to afford public secondary schooling as currently configured with the costs that are incurred by households. In South Asia affordability tends to be greater because the labour markets contain more educated members willing and able to teach for lower relative wages. Nevertheless, wholly unsubsidised schooling is likely to be unaffordable below the third quintile of household income at primary and the second at secondary (Lewin, 2011b). Studies of access to secondary school (Siddhu, 2010, Ohba, 2009) indicate how costs constrain choice, exclude many, and condition expanded access.
• Some Indicators of access to education are not be fit for purpose. Average GERs and NERs are poor indicators insensitive to plausible changes in status over short periods and contradictory in how they change when system performance is improving. Gross and Net Enrolment Rates (GERs and NERs) over an educational cycle can increase or decrease when participation is improving depending on changes in the proportion of over age children within the cycle. They should be replaced by grade specific enrolment rates and completion rates. Gender Participation Indices (GPIs) may mislead if there are unequal numbers of girls and boys in the school age population. The Education Development Index (EDI) used by the Global Monitoring Report (GMR) is a composite indicator which is not sensitive enough to inform policy and it cannot therefore be used for targeting (Lewin, 2011d). Many grants and loans have inappropriate conditionalities and performance indicators (Hossain and Zeitlyn, 2010). More generally data on out of school children and drop outs is inadequate to inform evidence-based planning. More investment is needed to provide data to national and local decision makers. There are new possibilities that are worth piloting e.g. internet based school level daily returns of attendance of students and teachers linked to supportive advisory and inspection systems.
• The sustainability of EFA depends on effective long term planning that recognises demographic certainties, financial realities, lead times for expanded service delivery (teacher training and deployment, classroom construction), and forward liabilities, especially those related to expanded secondary schooling (Lewin, 2007d). It must also recognise that “big push” programmes rarely generate sustained gains unless they are accompanied by long-term planning and resource allocation. They risk degraded quality and greater levels of inequality. They may also be accompanied by failing demand related to falling quality and a flow of public costs that will becomes unsustainable without very high levels of external dependence. More balanced investment is needed between educational levels (primary, secondary,

21
higher etc) than normative benchmarks for investment in primary by the FTI and others suggest. EFA will not be achieved, and nor will gender equity at primary and secondary school, with 60% or more of resources allocated to the primary cycle (Lewin, 2007 a, d).
3.5 Illustrative Research Findings from the Community and School Case Studies The programmes of empirical research in communities and schools are summarised selectively below. These complement outputs from the other research strands within CREATE, and the work of postgraduate researchers. Each country thus has a portfolio of research outputs of which the ComSS reported below is only part. In Bangladesh, India, Ghana and South Africa, empirical work has been undertaken in selected communities and schools to explore and understand in more detail access to education. Nine generic instruments were developed which were modified for use at each fieldwork site (available through website). Country Analytic Reviews informed the research (Ahmed et al, 2007, Govinda et al, 2007, Akyeampong et al, 2007, and Motala et al, 2007). These substantial 100 page reports provide the context and detailed commentary that underpins the ComSS. Various fieldwork reports have been archived. Short summaries of some of the main issues and findings are encapsulated below. Country Research Summaries were presented at the CREATE joint conference in London in November 2010 and are available on the website and give more detail of findings.
Bangladesh: Research Overview, BRAC-IED In Bangladesh studies of communities and schools (ComSS) in six locations, one from each administrative division in Bangladesh, were conducted over a three year period with two rounds of data collected in 2007 and 2009 from households and schools in order to gain insights into the dynamics of participation and exclusion of children in schooling. The study covered 6,696 households with 9,045 children age 4-15 years from 18 school catchment areas (12 government primary schools and 6 registered non government primary schools). The survey was designed to explore access to basic education in these districts using CREATE’s conceptual model of ‘zones of exclusion’. A baseline survey was conducted in 2007 and after two years, in 2009, a follow up survey was done with the same households. The survey identified children who have been excluded from education in both 2007 and 2009 who are in ‘zone 1’ – never enrolled. We also identified children who dropped out from primary school (zone 2), and those who were enrolled in 2009 but not in 2007. Those enrolled but attending irregularly, being over age and learning little (zone 3) were also identified as were those not transitioning to lower secondary level after completing primary schooling (zone 4). Sampling was driven from all households from within each district, and children were tracked back into schools in the districts selected. It was not possible to follow children who attended schools outside the case study districts. Some Findings The ComSS confirms that non-enrolment of school-age children (exclusion zone 1) remains a significant problem. Official national statistics indicate a non-enrolment rate of around 10% within the primary age group. The data from the sites was consistent with this though there were difficulties in establishing non-enrolment rates definitively in specific communities – some apparently out of school children migrated, others were not declared by households, others were temporarily out of school etc. Children who did not enrol at all were more likely to be disabled and less likely to play normally than children in school and those who dropped out. These excluded children were from poorer families, both economically and educationally, than families of children who dropped out (Ahmed and Hossain, 2010). The ComSS highlights the extent to which dropout after enrolment (exclusion zone 2) is a critical problem both at primary and secondary level associated with poverty, reflected in the food-security status of families, parental education and how education is delivered (school-related factors). The capacity of poor households to support and guide their children through schooling is limited and linked to drop out. Schools serving children from poor households fail to compensate or remedy disadvantage associated with poverty and themselves have few resources to do so. Stipend income is directed to households rather than schools which have minimal non-salary budgets. Those who dropped out were on average older, came from lower income families, had parents with lower levels of education, had more household responsibilities, and received significantly less support from parents for their school work (Sabates et al, 2010).

22
Poverty, low levels of parental education, and unskilled parental occupations are factors related to late entry into education which increases the probability of drop out. Children who start school late are more at risk of dropping out than those enrolled at the appropriate age. Those who had repeated more school grades were at greater risk drop out, and the more over age children were, the more likely they were to drop out. Inadequate health and nutrition also played a role in drop out (Hossain, 2010). Around half of the children who dropped out were participating in rural-urban migration, as a livelihood strategy for families. Child migration on this scale has important implications for policy and strategy regarding access, continuation in school, completion of the primary stage and transition into secondary school (Ahmed and Hossain, 2010). The category of silent exclusion or zone 3 is difficult to quantify with precision. ComSS data indicate that this category, that includes over age, poor attenders and low achievers, at a minimum comprises a fifth of all primary students, and probably more than a quarter depending on the definition used. Silent exclusion is also associated with the poor who cannot afford school materials or pay for private tuition (Hossain and Zeitlyn, 2010, Ahmed and Hossain, 2010). About 24% of the children who completed Grade 5 in the sample did not enrol in Grade 6, the first year of the secondary stage. This number, however, underestimated the zone 4 (transition to secondary) problem. Drop out in Grade 5 before transition was about a quarter of all drop out from Grades 1 to 5 with substantial numbers leaving before completion This implies that the transition rate in the sample is even lower than it appears to be. Slightly more than half of all children successfully transit into secondary school (Ahmed and Hossain, 2010). About 60% of the not enrolled children were in the 6-8 years age group. Some may enrol later but their chances reduce rapidly as their age increases. The culture of enrolling children in school consistently at age six is not embedded in our case study communities. The absence of birth registration and birth records also encourages a casual approach to the age for starting school. The consequences of late enrolment are manifested in dropout in later years, and high opportunity costs for school attendance as older children are seen as ready for paid or unpaid work. For girls, there is also concern among parents about safety and security of older girls walking to school, and family and community pressure to marry (Hossain, 2010, Ahmed and Hossain, 2010). Across the board there were clear relationships between non-enrolment, dropout, non-transition and socio-economic status, represented by the food-security status of families, household income, and parent’s education, as might be expected. Two-thirds of the never-enrolled children were from families with “always in food deficit” (ultra-poor) and “sometimes in food deficit” (poor) status in respect of staple grains supply for family. In the case of dropouts, 55% of the children came from households with food-deficit, though 45% of the population were in this category (Hossain and Zeitlyn, 2010). A large proportion of school age children suffer from health problems (about a quarter of children of school age, in and out of schools, sampled were sick in the previous 30 days). When ill health or episodes of sickness are combined with other disadvantages of children prone to be in exclusion zones, their chances of effective participation in education are further diminished. Their quality of educational experience ultimately suffers as children with health problems often enrol in school late, have high rates of absenteeism, lower cognitive development and increased risk of drop out (Hossain and Zeitlyn, 2010, Ahmed and Hossain, 2010). Household perception of reasons for non enrolment and dropout suggested supply-side constraints: schools are located too far from homes, and school education is perceived as of little value to children. This varies by school and community and perceptions and preferences change. There is some evidence of a drift away from government schools to registered non-government schools and madrasas (Ahmed et al 2010). This may reflect dissatisfaction with standards and the quality of teaching. Some Policy Messages • Birth registration: Absence of birth registration leads to major uncertainties in statistics regarding
enrolment, completion and dropout necessary for proper planning and management of the system.

23
Measures should be taken through local government agencies to enforce birth registration policies. Retro-active birth registration of 5-6 year olds should be undertaken as part of the government plan to bring all 6-year old children into school by school-year 2011. All children should be located and encouraged to attend schools from the age of 6 years by local authorities who should be obliged to monitor and report on their actions and outcomes.
• Child migration: Child migration with or without other household members, has been identified as an important dimension of school dropout. Its nature and prevalence needs further research to understand the scale of the phenomenon, the reasons for migration, and the activities of migrants, and the access to school of migrant children. There is a very limited amount of research on child migration in Bangladesh (exceptions are Giani, 2007 and Heissler, 2008). Migration is likely to increase with urbanisation and currently there is no systematic policy on how to deliver educational services to migrant children.
• Supply side issues: The peaking of dropout in Grade 5 and reduced primary completion associated with the newly introduced public examinations which encourage some schools not to enter low achieving candidates need serious attention. The supply of books and school materials need to be improved so that all children have books, and essential school equipment, since lack of these is associated with drop out and poor performance.
• Silent exclusion: Silent exclusion, where children attend but learn little, is clearly a serious problem affecting a large proportion of children, probably more than a quarter of the students in primary schools identified in this study. Agreement is needed on minimum thresholds for silent exclusion e.g. less than 90% attendance, more than two years over age, achievement tow years or more below the norm for the grade. More research is needed to detail and sensitise schools and teachers to the extent to which children are failing to learn and the reasons why. More school based work is needed to further investigate the processes and practices of silent exclusion in different locations. Responses to address such exclusion have to be based on school and community-based actions informed by evidence on its prevalence and persistence. Upazila-based planning and management must be sensitised to the issues.
• Responding to poverty: Clear relationships have been found between exclusion from education and socio-economic variables, represented by the food-security status of families, household income, and parent’s education. Stipends to poor students (conditional cash transfer) in primary school was a government-funded activity linked to PEDP II and remains a government strategy to promote equity in educational access. The supply-side constraints perceived by parents, and poor targeting of stipends which mean that the poorest may not receive support, suggest that the funds spent for stipends could be better used in providing essential quality-enhancing inputs in schools, including school meals. This question needs to be examined rigorously, especially because of the major budget implications of choices made (Hossain and Zeitlyn, 2010).
• Urban poor children: The rapidly growing population of poor slum dwellers have been under-served by both governments and NGOs. There is a subset of households who are extremely poor (roughly, the poorest quintile) and for whom even low private education costs are prohibitive. Expanding services for the urban poor, including subsidies and other support is essential to maintain high primary enrolments and to reach the UPE goal (Cameron, 2010). Whilst urban people in general are better off than their rural counterparts in respect of educational services, the rapidly growing poor slum dwellers have been under-served by both governments and NGOs (Cameron, 2011). In areas of high urban migration which are often illegally settled public provision of schools is largely lacking. Expanding services for the urban poor, including subsidies and other support is essential to maintain high primary enrolments and to reach the UPE goal (Cameron, 2010).
• Harnessing NGO contribution: NGOs, given their record in providing complementary and alternative educational opportunities, should be supported to target educationally disadvantaged areas and groups, and to design and offer inclusive and responsive approaches to under-served populations within the framework of area-based and coordinated programmes.
• A major increase in public resources: Substantially greater public resources should be committed within the framework of the sixth five-year plan and the new education policy in order to assure minimum necessary levels of quality with equity. Bangladesh allocates a smaller proportion of GDP to education than most low income countries and thus constrains progress towards universal access.

24
Ghana: Research Overview, University of Cape Coast CREATE conducted a longitudinal survey of 36 schools and 1,049 households in two deprived districts in Ghana in order to examine issues of access and exclusion. Over 2,500 children were tracked and their attendance and achievement monitored. The Community and Schools Survey (ComSS) took place in Mfantesman and Savelugu-Nanton over four years. Alongside surveys and child tracking qualitative studies of the experiences of drop-outs and never-enrollers in the two districts were undertaken. The two districts chosen are typical of areas in the south and north of the country and allow for some comparisons. A number of complementary studies were conducted using secondary data, addressing issues of schooling, health and nutrition, costs and finance, national trends in exclusion and equity; and the character and development of private schooling. Data from national-level surveys (GLSS, CWIQ), administrative sources (EMIS), the ComSS study and CREATE qualitative studies are the principal sources of evidence employed in CREATE research. Some Findings Initial access to basic education in Ghana has expanded steadily since the 1980s though progress stalled for a period in the late 1990s and early 2000s. Recently the introduction of capitation and tuition free schooling has resulted in an accelerated growth in enrolments in Grade 1. However, as many as 10% of children remain excluded nationally. For them, the costs associated with schooling, poverty, livelihoods in farming, location in the north and in rural areas, and fosterage and migration are among the factors that inhibit access along with low perceived benefits and lack of relevance (Akaguri, 2010, Rolleston, 2009, Ananga, 2009, Rolleston et al. 2010, Rolleston, 2011). Over the last decade enrolment rates have increased but higher levels of participation appear to have been accompanied by increased numbers of over age students and little reduction in drop out. Completion rates have remained largely unchanged. The introduction of the Capitation Grant did have an impact on enrolments but this effect was one-off. Higher enrolment amongst the most marginalised groups almost certainly requires more targeted interventions to address specific exclusion issues directly. Those who remain excluded include those for whom school remains difficult to access physically due to distance or disability, those for whom indirect costs such as food, materials and transportation are prohibitive especially at JHS and above, and those whose labour remains essential for family livelihoods. In the north, less progress has been made in relation to rates of primary drop-out and completion than in the south. Progression to JHS also remains much lower in the north as a proportion of the age group. Drop-out is associated with poor attendance and performance, caregiver illiteracy, low income and high schooling costs, household composition and children’s work. It is associated with complex patterns of temporary periodic absence as well as permanent cessation of schooling (Ananga, 2011). Progression depends particularly strongly on household livelihoods and welfare beyond the basic phase, although the vast majority of those who reach primary completion do progress to JHS except in the north. In some parts of Ghana almost half of all children fail to make the transition to JHS and many more than half fail to complete JHS, the end of the basic education cycle. An important finding of CREATE is the very high prevalence of over age children, who in many poor rural areas constitute the majority of children in school. Absence from school is high amongst children from low income households and achievement is relatively low which leads to age in grade slippage More than 40% of children in Grade 1 are eight years old or more in a national sample. In the ComSS most children are over age. Late enrolment which is compounded by repetition and overage progression is thus very prevalent in Ghana. It is closely associated with silent exclusion indicated by poor attendance and low achievement. One important explanation of over-age entry of Grade 1 is growth stunting due to poor nutrition which can lead to late entry because children are judged to be “too small” especially if chronological age is underestimated. A low Body Mass Index is associated with over age entry and progression, low achievement and drop out. The research emphasises the importance of early interventions to obviate stunting (Rolleston et al., 2010, Buxton, 2011). Fieldwork indicated that many children were not aware of their birthday and were uncertain of their age. Schools record keeping was often incomplete and birthdates were not collected for every child, making it difficult to monitor age in grade.

25
The ComSS fieldwork also identified very low levels of achievement in some rural schools with performance three or more grades below the norm for the grade. Attendance in some of the schools is below 70% on a daily basis indicating that much learning time is being lost. There were also instances were lateness and absence were followed by corporal punishment, providing a disincentive for some to attend in the future. Patterns for drop out were clearly varied with some patterns signifying likely drop out in the future. None of the schools had systems that recognised these patterns and intervened to resolve the various issues that were likely to lead to drop out. Some Policy Messages
• The Capitation Grant has had an impact on initial enrolment but this effect may not be sustained. Introducing capitation grants can only result in the abolition of tuition fees once. If it is to encourage participation in the future the grant needs to represent a more significant proportion of unit cost per pupil so that it can be used to improve the quality and enhance the classroom environment and learning resources available (Akyeampong, 2011). Part of the capitation grant should be ring-fenced for learning improvement. It should also be tiered and linked to deprivation indices for districts so that the poorest school districts receive more.
• Future education policy needs to target marginalised groups more purposefully and further flat rate subsidies to all household should be avoided in favour of directing subsidy to the poorest. The current flat rate subsidies benefit richer areas and households especially at JHS and SSS level and there is a case for fees to continue to be charged to children from richer households in these schools and the income used to improve quality.
• There is a great need to increase investments into public basic schools in rural areas to improve their quality so as to give children from poor household’s access to a basic education that has real potential to improve their chances of accessing post-basic education. Over 70% of all university entrants come from less than 20% of secondary schools (Djangmah, 2011) and most are from private primary schools. This is both inequitable and inefficient.
• It is important that the indicators for measuring progress in educational access include distributional measures of improved participation and progression across the basic school cycle to establish whether equity has been improving. This should be used as a core measure of progress, not aggregate enrolment rates. Key indicators include giving special attention to monitoring the transition from Grade 1 to 2, and monitoring the transition from Grades 6 to 7 and 9 to 10, and to age in grade and completion rates. Participation by children from different household quintiles should be included in the indicator system.
• Investments into improving quality education in early primary schooling (and preschool) should be given priority. In public schools, more experienced and more effective teachers should be encouraged teach in the early grades and should be incentivised to achieve improved learning with high progression rates at the appropriate age through the primary school system.
• Every local authority and school should develop a database which links registration of births with expected year of school enrolment for children within different catchment areas. This will require collaboration between district health and education authorities. At the beginning of each academic year, this data can be used to help identify who has enrolled, not enrolled, or moved out of the catchment area of the school. This should be piloted in areas which have a history of poor enrolments, and then rolled out nationally.
• Birth registration should be linked to sensitisation campaigns to highlight the demerits of over-age enrolment especially in rural areas. The goal should be to eliminate over entry within the next three years and minimise repetition to below 5% of children, especially in grade1.
• The introduction of conditional cash transfers linked to timely enrolment and progression should be considered in areas with high incidence of poverty, and where livelihoods are fragile.
• Incentives should be developed to reward schools that meet efficiency and effectiveness criteria for progression, repetition, drop out and completion rates.
• Introduce systems that can monitor attendance effectively for both pupils and teachers. A first step is to ensure that schools have enrolment and attendance records that can be held electronically at district level. Where there is mobile phone coverage data can be returned digitally. Circuit supervisors on regular visits to schools should monitor and update these records. Regular inspection of school attendance, achievement and promotion records will help to identify children at risk of dropping out, or who have dropped out, so that the necessary action can be taken at school level to reduce this risk.

26
The CREATE studies have shown that there are a number of factors outside the education system that have an impact on access. These include fosterage, and livelihood patterns especially which involve seasonal migration and internal displacement. Some of the effects of these factors can be ameliorated with more effective and responsive educational administration. In the long term, investing in the development of deprived districts both in general and specifically educationally, should lead to improvements in the welfare of inhabitants and have a positive knock-on positive effect on household attitudes and participation in basic education. In some areas e.g parts of the north with low population density and seasonality, novel methods of service delivery drawing on the effectiveness of School for Life may need consideration. Universal enrolment and completion of basic education depends on improvements at the margin and in the most disadvantaged areas without which it will not be achieved in 2015 or indeed and any time in the future.
India: Research Overview, National University of Educational Planning and Administration, Delhi The CREATE community and school survey in India (CoMSS) covered 90 schools and 6,431 households from 36 villages selected from four blocks of three different districts namely Rajnandgaon district of Chhattisgarh and Rewa and Dindori districts of Madhya Pradesh. These villages were the focus of an earlier study in 1990 (Govinda and Varghese, IIEP-NUEPA, 1993). In all over 9,000 children were identified in the study areas who were enrolled in the case study schools. Basic school ‘roster data’ on children including their name, age, caste, grade, father’s name, residence, presence in school on the day of the visit, attendance in last month, and performance according to teacher’s perception was collected in three rounds (2007, 2008 and 2009). In addition, semi-structured interviews were conducted with cluster resource coordinators (who are recruited to provide academic support to teachers at school level) and also with community members and parents. The school survey also included competency tests with Grade 4 and 5 children in Hindi and mathematics for which test papers were developed at NUEPA. Around 2,000 children took these tests. Some Findings All the case study areas have shown considerable progress in educational access and enrolment rates are much greater than in 1990, especially in the most deprived areas. The number of primary schools has increased from 35 to 88. However, absenteeism is a serious problem. The proportion of children absent for four or more days in month (about 20% of learning time) varied from about 12% in the best district to 25% in the worst (ComSS 2009). The most frequent reason given for absence was illness, with domestic chores and work being given as the next most common reason. Many children thus miss school days, repeat grades and finally drop out from school in a vicious cycle of deprivation and disadvantage (Bandyopadhyay, Das and Zeitlyn, 2011). The incidence of repetition in all three research clusters is high. In two of them about one fifth children were found to have repeated their class at least once since they entered school. Repetition was much more common in government run formal or Education Guarantee Scheme (EGS) schools and very few were in private schools. The proportion of over age pupils in each of the three clusters was also striking. Those who are one year overage or more account for between 40% and 70% of all students in Grade 5. Those two years over age or more account for between 16% and 49% in the respective clusters. By Grade 8 between 25% and 50% are over age by at least two years. In Grade 1 between 30% and 40% are one year over age and 6% to 12% are two years over age (ComSS 2009). This suggests that the problem of over age is both due to late entry and to repetition in higher grades. Children who are over age are at risk of drop out and may not reach the end of elementary school until they are well over 16 years old. Making children repeat the same grade may de-motivate them, causing early dropout. It certainly increases problems associated with being over age in grade (Govinda and Bandyopadhyay, 2010b). The incidence of drop out appears to be between 5% and 10% a year across the clusters and was greater in 2010 than 2009. There was not much difference in dropout rates of boys and girls. Overall between 20% and 35% fail to complete Grade 5 in the case study clusters. About 11% of children in the CREATE household survey did not go to school. For some the reason was given was the unfavourable location and distance needed to travel to the nearest school. Children from poor households were more likely not to attend. The most frequent reasons given were household work (20%) working for income (11%), and the costs of going to school (5%) (Govinda and

27
Bandyopadhyay, 2010b). Other data indicated that the combination of inflexible unfriendly schools, disinterested, demoralised teachers and poor facilities pushes some students out of school, and that supply side factors are an important in determining dropout and absenteeism (Reddy and Sinha, 2010). Children from households with little or no previous educational experience are more likely to be excluded from schooling. Many first generation learners live in environments that do not encourage them to learn and continue their education. 38% of students were first generation learners in the case study villages (Govinda and Bandyopadhyay, 2010b). Girls from poor, SC, ST and Muslim communities tend to be more disadvantaged than their male counterparts, and a larger proportion of girls rather than boys from these groups were not attending school. Girls from disadvantaged groups are more likely to attend government and EGS schools, and more boys attended private schools which often provide have better infrastructure and are thought to provide higher quality education (Bandyopadhyay and Subramaniam, 2008; Bandyopadhyay, 2011). More than half of the parents of girls who never attend school were of the opinion that they do not need to send their girl children to school. The reality of girls’ exclusion is further complicated by caste, religion, ethnicity and age. Programmes have been instituted to help traditionally disadvantaged groups (SC, ST, OBC) to attend school. 88% of Scheduled Caste, 79% of Scheduled Tribe and 95% of Other Backward Class children are going to school in the case study areas. However, educational access and retention remains unsatisfactory. 43% of ST and 44% of OBC students are recorded to have dropped out before completion. In recent years Muslim children have been identified as having unusually low levels of access (Sedwal and Kamat, 2008; Govinda and Bandyopadhyay, 2010b). Amongst those who completed Grade 5 the transition rate into upper primary was between 89% and 62% across the three clusters (Govinda and Bandyopadhyay, 2010b). In Uttar Pradesh the increased cost of secondary schooling appears to be the most consistently significant factor affecting transition to secondary school, while distance also played a role (Siddhu, 2010).
The results of competency test conducted under CREATE to assess the learning level of children of 4th and 5th grades revealed that there were large numbers of children who did not have mastery over language and arithmetic. Only 12% of children passed the tests at qualifying level in the lowest scoring cluster. About a quarter of Grade 4 children failed to score any marks on the mathematics test in one of the clusters. The competency tests did show that the learning level of children in Grade 5 is higher than in Grade 4 and demonstrated that one additional year of attending school did make a difference in the average learning level of children. However overall there was clear evidence of generally low levels of achievement well below expectations for the grade. Another major concern is the subject mastery of teachers. Around one fourth of teachers find it difficult to teach any subject taught in school while one out of 12 teachers including a few with post graduate qualifications feel they are not competent enough to teach the subject that they have been assigned to teach. This is a disturbing situation in the context of the silent exclusion that is attributed to absenteeism, poor learning level, and the high repetition and drop out prevailing in these three clusters (Bandyopadhyay, Umabati and Zeitlyn, 2011). Teacher management is an important issue in those clusters where there is a wide range of Pupil Teacher Ratios (PTR) between schools. There are extreme variations. One of the case study schools has seven teachers though it has only 11 students. Other schools have only one or two teachers and PTRs of over 70:1. Many of the schools in the case study area are small with fewer than 100 children. The problems of small, single teacher schools with multi age and multi grade classes are accentuated by the shortages of qualified and trained teachers (Blum and Diwan, 2007; Blum, 2009). The largest numbers of the under-qualified and untrained teachers are found in the most rural districts. While small community based schools help enrolment, there is some concern that many small schools have low standards and limit the chance for meaningful learning (Govinda and Bandyopadhyay, 2010b).

28
Not a single government primary school in the tribal cluster of Dindori has a toilet. In the second cluster 60% of schools do not have toilets, and in the third 27%. Many also do not have clean drinking water available (Govinda and Bandyopadhyay, 2010b).
Some Policy Messages • Many young children are denied access to early childhood care and education (zone 0). Many of these
children suffer from malnutrition and undernutrition. Children in MP and Chhattisgarh are facing malnutrition and undernutrition as revealed the recent NFHS data (Sood, 2010). The states need to give more attention to improving the services provided by ICDS that run Anganwaris which are attended by the majority of poor and disadvantaged children, particularly girls (Bandyopadhyay and Behera, 2010).
• Following the recommendations of RTE Act, each school needs to draw up its plan and budget the activities for its further improvement involving local people and local government agencies. This needs to be prioritised and has to be part of policy of local governing bodies including Panchayati Raj Institutes (Govinda and Bandyopadhyay, 2010a, Bandyopadhyay and Dey, 2011).
• The analysis highlights the need for policy initiatives with respect to recruitment of teachers and upgrading their capacity. The analysis also identifies many single or two teacher schools, and these need multi-grade teaching approaches. The fieldwork indicates that many teachers, despite increasing levels of qualification, have difficulties dealing with multi-grade system classrooms and schools. The professional development of teachers needs more attention and they should also be encouraged to receive further education to improve their subject knowledge.
• There is a need for a database on the status of teachers at the school level to aid teacher deployment. Extreme values of PTR should be addressed and all schools staffed at similar levels of 30-35:1.
• The low motivation of teachers to serve in remote rural areas needs to be addressed so that more rational and equitable deployment of teachers can be achieved. Levels of teachers’ morale are central to attempts to improve learning – teachers need to be supported and encouraged to teach in poor rural areas.
• Remedial teaching needs to be developed and introduced especially where there is high absenteeism and repetition. It is very important that schools and communities take action within the school to encourage regular attendance of children and monitor their learning level.
• Provision of free nutritional meals and health care facilities in school protects children from poor nutrition and ill health which are associated with low attendance and poor learning levels.
• Policy makers need to pay attention to the availability of improved physical facilities along with provision for improving teacher supply and deployment, and teacher attendance, across the states.
• It is important to implement the ‘no detention’ policy and ensure progression at the right age for the grade. This needs links to continuous and comprehensive evaluation of learning with diagnostic characteristics. Too many children are over age for their grade and may not complete schooling.
• Better developed areas are served by private providers and government schools, whereas poorer underdeveloped areas have the worst facilities and teachers. As a result of this, despite being enrolled in school, children living in remote areas are denied ‘meaningful access’. Priority provision of quality schooling facilities by the government to poor areas may break the nexus between location, social inequality, gender and poverty that together cause exclusion of children from schooling. Private schools do not provide access to the poor (Härmä, 2010).
South Africa: Research Overview, Education Policy Unit, University of the Witwatersrand CREATE research in South Africa involved mixed methods and two rounds of data collection. Case studies were carried out in eight schools in the Ekurhuleni South district of Gauteng and six schools in the Dutywa district of the Eastern Cape, with a focus on learners in Grades 1, 3, 5 and 7 in 2007, and Grades 2, 4, 6 and 8 in 2008. Key baseline data was collected, including copies of registers, repetition data, new admissions, academic records, the Annual Schools Survey and school policy documents. Interviews were carried out with school principals, mathematics and English educators and district officials. A baseline secondary analysis provided district-level indicators on learners’ degrees of vulnerability, with regard to over-agedness, repetition and drop-out. 1,121 Learner Profile Cards (LPCs) were fully completed by Ekurhuleni South learners and 596 by Dutywa learners. In addition, 61 of the approximately 150 questionnaires administered to parents of Ekurhuleni South learners deemed vulnerable by teachers could be matched to the

29
LPCs, and 87 questionnaires were completed by parents of potentially vulnerable Dutywa learners. More information was gleaned through ‘Day in the Life’ activities, which involved shadowing one class in each grade through an entire day, and school and classroom observations were also undertaken. A sample of children were tested to establish their levels of achievement. Community fieldworkers were hired to search for out-of-school children between the ages of 7 and 15 as well as older youth who had not completed Grade 9. Some Findings Poverty is closely associated with educational exclusion in South Africa. One indicator of the extent of poverty is the fact that, in 2007, 64.5% of children aged 0-6 years received a child support grant, with 1.6% also receiving a care dependence grant and 0.2% a foster care grant. If receipt of the grant is recognised as an indicator of poverty then most children are in poor households. This of itself does not result in exclusion from the basic education phase since the majority of learners are enrolled up until the end of Grade 9. Nevertheless, poverty is associated with hunger, and hunger affects school attendance and academic performance. In 2003 children in 24% of households were always, often or sometimes hungry (DoE, 2006b:21). Poverty also highlights the indirect costs of education, from uniforms, books, stationery and examinations through opportunity costs for older children to transport costs (Motala et al, 2007: Sayed and Motala, 2009). Schools themselves play a big role in encouraging or discouraging access. The persistence of racism, sexism, bullying and xenophobia does not make some schools very inviting places, and this is compounded where there is poor quality of teaching and learning as in several case study schools. The poor state of school infrastructure, shortage of classrooms, lack of decent toilets and play-grounds detracts from a healthy learning environment. The absence of state services to support schools in terms of social and psychological issues places increased burdens on teachers who are already overloaded (Williams, 2010; Motala and Dieltens, 2010). Parents and guardians are not always able to provide the necessary background and knowledge of schooling to support their children, and many households are fractured. More educated parents are likely to encourage learning and to send their children to higher performing schools (Motala and Dieltens, 2010). With unemployment hovering around 25% (2009 figures), there appear to be few economic rewards for remaining in school, let alone completing Grade 9, unless access to higher education is probable. Prior to the introduction of no fee schools, the second most important reason (after fees) given by learners as to why they remain out of school is that it is useless or uninteresting: a survey in 2004 revealed that almost 10% of learners overall, and more boys than girls (13.5% as against 6.5%), hold this view of the value of education (OECD, 2007:50). Our case study data confirmed that many learners had doubts about the value of remaining at school if they were unlikely to pass matriculation. Over-agedness is a problem throughout the system, but especially in the higher grades. Over-age entry to schooling is being addressed by the age-grade norm policy. An unintended consequence is that many learners who would have repeated at lower grades are being allowed to progress, and some repetition is being deferred to higher levels of schooling (Motala, Dieltiens and Sayed, 2009; Taylor et al, 2010). The enrolment of under-age learners into Grade 1 despite policy continues to be a feature and is used as pre-school provision (Taylor et al. 2010). Age appropriateness has a distinct gender bias with more female learners being age appropriate than boys by Grade 9 (Motala, Dieltiens and Sayed, 2009). The direct costs of education are being addressed through ‘no fee’ schools, but the indirect costs – of transport and uniforms in particular – are still a huge burden for poor households. Moreover, the persistence of fee-charging government schools alongside ‘no fee’ schools helps to sustain a class-differentiated two tier education system (Motala, 2008). Private schools make little contribution to overall enrolments (less than 5%) and most are high cost. Levels of achievement are very low, amongst the lowest in the region. Children performed very poorly on CREATE attainment tests. Learners performed way below their expected levels in the tests, over-age and under-age learners were worse off in terms of their performance, prior learning for the majority of learners was poor i.e. they were not on the expected level for the grade (Gilmour et al 2009; Pereira, 2010; Taylor et al. 2010)

30
Distance from school as well as schools’ official language of learning and teaching limit school choice, forcing some learners to travel long distances to other schools. Inadequate mastery of the language of learning and teaching is also a major factor in the abysmally low levels of learner achievement; yet many parents prefer (with their children’s concurrence) for their children to be taught in the second language of English by teachers who are themselves second-language speakers of English (Motala and Dieltens, 2010; Lafon, 2009; Alexander, 2010). CREATE research found very little actual teaching and learning taking place in case study schools. Lessons often started late, much time is spent maintaining order, teachers do most of the talking and learners are passive and contribute little. The absence of writing and written work in classrooms was striking, rote learning and chorusing of lessons was common and coverage of the curriculum was very uneven (Letatsi, forthcoming). Corporal punishment is common and continues to be a feature of many schools and at different levels despite being formally proscribed. Figures from the Community Survey in 2007 indicate that they are about 386 000 children who are out of school (Shindler, 2010). The great majority of these learners have dropped out. Much smaller numbers are children who have never been to school. CREATE research highlights specific factors that are correlated with exclusion including disability, household structure, poverty and lack of access to social grants. All of these increase the vulnerability of children to exclusion. Some Policy Messages
• Schools in townships and rural areas need to be made more welcoming in terms of infrastructure and facilities, pedagogy, care and community service. Aside from encouraging more active civic participation in schools and ensuring that teachers and principals always treat parents with respect, more attention could be given to planting trees, building playgrounds, painting murals, fixing desks and chairs, involving Community Development Workers in after-school activities, or paying stipends to unemployed matriculants to read to learners after school and to coach sport
• Language policy provides for 11 languages to be used but in practice English tends to be chosen most often as the language of learning and teaching (LOLT), along with Afrikaans, despite a rhetoric of equality regarding the other official languages. School language policies impose limits on school choice and need clarifying and making more consistent with the government’s broader Language-in-Education Policy. Much learning takes place using languages that are not the LOLT, but this is often unplanned and not reflected in learning materials.
• The continued use of corporal punishment often appears counter productive since it can act as a disincentive to attend school and may be used inconsistently. Though it is proscribed it continues to be widely used. Steps should be taken to end this practice
• The quality of teaching needs to be improved, through training as well as financial, practical and moral support for teachers. Classroom practice, pedagogical knowledge and in-service training need to take account of the gaps in teacher’s knowledge and plan for this.
• Teacher accountability continues to be key. The rights of teachers to strike in support of better wages and working conditions is enshrined in law and in the constitution. Historical precedents have meant that school inspection can be infrequent. The low levels of numeracy and literacy scores in the basic education phase evidenced in both local and international benchmarking and the poor matriculation results (school leaving exam rate – 62% in 2009) indicates that teachers at the school level need to be made accountable for what they are delivering and what the outcomes are. CREATE research has illustrated that on too many occasions teacher contact time was limited, teachers were not present in the school during the school day or teachers were present at the school but in staff rooms or basking in the sun instead of teaching.
• Repetition as remediation must be used as part of a clear pedagogic strategy; formative assessment should be promoted to give diagnostic insight into learning needs; on schedule progression accompanied by achievement consistent with age grade norms should be the expectation for all learners (Taylor et al, 2010).
• The reality in South African classrooms is that there is often a wide range of ability within the same grade and that monograde teaching is the normal practice despite the fact that there are small schools

31
with too few teachers and classrooms for every child to be taught in a reasonably sized grade group. Multigrade teaching and learning should be made more widely available.
• There is a need to track learner’s migration, since it is common for children to travel long distances to school and to change schools. Migration can take many forms that include rural-urban, inter-urban and inter-school movement, as well as migration between provinces and from outside the country. Inter-school migration is likely to be affected by affordability, distance, access to transport and the perceived quality of education, as well as school language policies, ethos and reputation. It can contribute to age in grade slippage depending on how transitions are managed.
• Information at all levels is lacking that would allow accurate tracking of first registration, progression, repetition and drop-out, and of achievement. Child identity numbers have been introduced (e.g. in Western Cape) along with regular assessment using standardised instruments. This practice should be extended to all Provinces.
3.6 Policy Analysis and the Political Economy of EFA Three studies – of the policies, politics and progress of access to education (in Ghana, India and Sri Lanka) were conducted (Little 2010 a, b, c), using the same broad questions and method. The questions were (i) What progress has there been in access to basic education since independence (ii) What policies for access to basic education have been promoted? (iii) What role have political regimes played in the formulation of policies on access to basic education? (iv) What role has political will played in the process of policy formulation and implementation? (v) What have been the drivers and inhibitors of the implementation of recent major reforms? The methods used were (i) interviews and (ii) documentary analysis. Around fifteen policy-makers, policy implementers and researchers in each of Ghana, India and Sri Lanka were interviewed. Interviewees included current and retired senior civil servants and government officials, vice chancellors and university staff, trade union officials and, in the case of Ghana, former district directors of education. Most interviewees had played various roles in policy formulation and policy implementation at different levels over many years. Key informants were selected in consultation with CREATE PI staff and CAG members. Interviews were tape recorded and transcribed. Documentary sources included published histories of education, research reports, policy documents, commission and committee reports, memoirs of civil servants, evaluation studies, reports from ‘partner’ agencies such as World Bank and DFID and conference papers. The studies were informed by theoretical, conceptual and methodological insights Lall (2007) and Little, (2008a) from the international social science literature. The country studies were informed inter alia, by a working definition of political will as a sustained commitment of politicians and administrators to invest the necessary resources to achieve specific objectives and a willingness to make and implement policy despite opposition, by theoretical frameworks of policy formulation and implementation as stages and processes and by important methodological distinctions between policy texts and policy discourse. The conclusions from these studies, combined with those of policy studies from East Africa and Nigeria, and case studies of policy implementation from China and Zambia are as follows: • The formulation of policies to promote improvements in access to and the quality of basic education is
apparent in many countries long before independence, after independence and before Jomtien, and after Jomtien. Lessons can be learned from the long history.
• The formulation of policies to promote improvements in access to and the quality of basic education is apparent in democratic and non democratic political regimes, in regimes of the left and of the right and the military. While democratic regimes are more likely to generate pro-poor education polices, examples from Ghana in the 1980s and Nigeria in the 1970s attest to the convergence at times between the interests of military regimes and the poorest.
• In some contexts constitutional change and legal enactment is a necessary condition for change in pro-poor policies in education. Constitutional change in Sri Lanka in 1931 paved the way for an expansion of free education from kindergarten to university. More recently constitutional and legal changes that assert the rights of all to education in Ghana (in 1992) and India (2002, 2009), have been followed by major increases in financial expenditure committed by government.

32
• While increases in literacy rates are apparent over time in most countries it is clear that performance on a range of indicators usually falls far short of policy intentions. Our work in 17 Kenyan primary schools adds greatly to our understanding of the impact of national policies of free education on individual primary schools, on flows of students through those schools and their transitions to secondary schools (Somerset, 2010). This is a rare study of the impact over time of attempts to universalise access to primary education. Some schools limited their intake of new students to historic levels and did not expand significantly while others, in strong contrast, accepted large numbers of new entrants without complementary increases in the number of teachers, teaching resources, and space. The impact of rapid and uneven growth on reduced quality is clear, if unintended. While transition rates into secondary schools appear to have increased after the announcement of fee free schooling polarisation remains very strong, with access to the best secondary schools restricted to a small sub-set of primary schools. Moreover, chances of continuing beyond secondary to university are strongly stratified with those attending provincial secondary schools having less than a fifth of the chance of those in national schools and those in district schools less than one hundredth the chance. Though access to primary schooling may have improved, for many it is likely that the quality of what they have access to has deteriorated. And at higher levels improved access seems to have been accompanied by no reductions in the unequal chances of proceeding to higher levels. These findings are important and a reminder that CREATE’s expanded vision of access, which includes reduced variations in quality, fairer transition to secondary, and greater equity in progression to higher levels, needs highlighting in policy dialogue.
• Political will is a necessary but not sufficient ingredient for the implementation of educational reforms. But as we know no end of policies, constitutional changes, legal enactments, plans and declarations ensures education for all on the ground. Administrative, technical, financial and human resources are as essential and require sustained attention. The analyses from Ghana, India and Sri Lanka point to similarities and differences in the constellation of factors that promote and inhibit reform. All point to the importance of a range of non political technical factors – technically sound and detailed plans of action at multiple levels, adequate finance to translate plans into action, adequate human resources, involvement and sense of ownership by administrators near to the ground, regular monitoring and evaluation and sustained effort. Where any of these is lacking then progress is constrained. In the Indian case it was notable that the role of civil society and the non-government sector was mentioned time and again as a driver of education for all, in a way it was not in Ghana and Sri Lanka. And in all countries inhibiting factors included financial wastage (less politely, financial corruption) and the restraining role of trade unions, though it was in India that were cited most often as having a constraining effect.
• Political will is often understood to mean national will at the highest level of politics. However, our analysis from Ghana, India and Sri Lanka, combined with our case studies of particular aspects of reform in China and Zambia, suggests that the concept of will also needs to be understood at the level of implementation and at the level of multiple actors acting in their own, rather than collective interests. Some may term these wills as politicisation or political interference. During implementation a myriad of political wills of different stakeholders comes into play. Political wills in education reform are exerted by many – not only by high level Presidents and Prime Ministers, Ministers of Education, Ministers of Finance and political parties but also by myriad interests at the local level – those of citizens, local politicians, teachers, parents and officials in local and provincial government administrations. And not all political wills – high or low - are moving towards the same ends. And even if they are they are, myriad other factors that come into play in the translation of policy intent into policy in practice. We conclude that diverse political wills can often be enacted in contradictory ways. Political will can be a double-edged sword.
A final message is posed for development partners: In calling for ‘political will’ in relation to the EFA and MDG goals, development partners assume that national planners will translate global goals into national goals, national plans of actions, targets, indicators and actions. And while it is certainly the case in all three countries that there is a degree of interaction between the expectations of development partners and the national agenda and policy discourse how rooted is the political discourse of policy making, as distinct from plan making. The EFA declaration and framework of actions constructed at Jomtien and Dakar call for national action plans. But these plans are conceived of in largely technical terms and overlook the fact that, in the past at least, in-country plans for EFA (notably India’s Plan of Action of 1986) have derived from policy and the national and local politics that surround the determination of that policy. No simple dose of political will from the highest level can

33
substitute for the political to and fro, consultation and sense of ownership engendered by the politics of policy making. So in translating universal aspirations for EFA into partnerships that take root in and on the ground, judgements are needed about how much development partners need to understand about specific policy contexts, specific policy and practice histories and about the extent to which the interests of the poor coincide with the interests of political elites, in the present and the past.
3.7 CREATE Ten Point Plan CREATE’s research has identified many possible actions that could influence future access to education within an expanded vision of what meaningful access requires. It has within its research products the basis for different toolkits tailored to circumstance that could profile the kind of interventions that would make the difference between more uneven and insecure efforts to improve access and those interventions that could secure the right to education for all children. There is no one prescription as the CREATE PICs repeatedly remind development partners. Initial conditions vary widely, national and local priorities are different, capacity is constrained, and the locus of responsibility to act is shared between many different stakeholders at different levels. Strategic approaches to medium term planning of successful transformations to education systems have been outlined (Lewin, 2007b). This toolkit to plan, project, budget and mobilise resources is one basis on which to proceed. Other protocols can be developed on the basis of the CREATE research products. To help frame discussion of possible strategies to implement programmes that would make the CREATE expanded vision of access a reality a generic ten point plan is outlined below. Several things should be noted. First, initial conditions and baseline data have to be analysed and understood as a precursor to developing plans to improve access, whether proposed interventions are at national or local level. Insight into changing patterns of access over the last decade can give clear indications of the nature of the problems and the likely patterns of causality that continue to deny educational access to different groups of children. Where the data indicates that large external inputs in the past have failed to have the results the EFA envisaged, more resources may simply replicate history and expand inefficient and low quality systems with softening effective demand. Zonal maps can profile the topography of exclusion and how it has changed over time, and the analytic studies of CREATE can indicate critical inhibitors to universal and more equitable access. Policy developed without an understanding of the recent past risks the kinds of failure that have resulted in EFA still not being achieved 20 years after the Jomtien World Conference. Second, the political economy of EFA is such that unless there is sufficient local and national political will, willingness and ability to allocate adequate resources, and accountability that ensures efficient utilisation, attempts to achieve greater educational participation are likely to prove futile. A key difference between low income countries which have succeeded and countries which have failed to approach EFA goals lies in consistent political will, readiness to invest what is necessary, and the ability to use resources effectively. Third, approaches to improved access need to be holistic and recognise that children, and the households of which they are part, are part of a web of relationships which will determine what access they enjoy and how supply and demand for education interact to generate opportunities for learning that has utility for reducing poverty. But approaches must also be specific and targeted where there are barriers and disincentives to go to school and to learn, and where structures interact with agency to lead to premature exit from schooling. Households, communities, schools and local and national education authorities all play a role in shaping opportunities and removing inhibitors of universal access to education. The proposed ten point plan is not a blueprint but a framework which could serve as the basis for planned interventions at district level or above. It would have to be based on a bespoke diagnosis grounded in particular education systems. It would need to be fine tuned as it was developed making use of formative feedback. An overall statement of the goals of a ten point plan might be: All children in the target population should:
• enrol in the year in which they become six years old • progress over the next six years with no more than one repetition and remain within one year of the
nominal age for the grade

34
• attend for at least 90% of the teaching days available • transit to lower secondary school and complete nine years of schooling • learn in classes of no more than 40 in schools with clean water, sanitation, basic services, light, heat and
ventilation, and adequate learning materials • be taught by trained teachers who are present in class at least 95% of the teaching days available • achieve at levels within two years of the norm for their grade • have equitable access to affordable schools located within 60 minutes travel of households
An outline ten point programme for development with stakeholders would include: 1. Early Childhood Health
• Basic health checks regularly for all children organised at school or clinic including BMI and under and malnutrition; diagnosis of disability; monitoring of health status; primary health care
• Training of teachers to act as sentinels to recognise common health issues in children • School environment health audits and provision of clean water, sanitation etc • Develop circles of support around vulnerable children
2. Initial Enrolment at Age Six • Registration of all children with tracking cards to accompany child through school • Child seeking school and community activities to enrol every 6 year old child • Extension of pre-school at affordable cost to four and five year olds • Identification of vulnerable groups – e.g. those with disability, orphans, ultra-poor households,
malnourished or undernourished children, girls, immigrants, pastoralists, fisherfolk etc. Design of appropriate interventions to match circumstances
3. Drop out • Audit and track out of school children (drop outs/never attended); identify causal relationships;
mitigate push factors (e.g. costs, relevance, corporal punishment, gendered violence; distance); teachers visit the homes of drop out children to enquire after them.
• Incentives/actions to promote re-entry to schools in appropriate grade for age; child seeking schools • Alternative provision of basic education where return to school is not viable • Expand access to lower secondary school and a full cycle of basic education; improve transition rates
4. Silent Exclusion • Develop child tracking cards to monitor grade progression, age in grade, attendance, and learning
achievement; develop protocols to support children at risk of drop out. (e.g. below 90% attendance, 2+ years over age, 2 years below attainment norms)
• Adopt automatic promotion with support for learning of less capable to ensure smooth progression through early grades at appropriate ages; prioritise reading and number in early years
• Provide support for improved pedagogy and teacher competence through training, mentoring, and enhanced learning environment; monitor teacher attendance; provide incentives for effective practice
• Promote curricula relevance and the utility of learning; develop pedagogies that are effective and which make private tuition less attractive; link formative assessment to enrichment and remediation; develop multilevel learning goals linked to range of capabilities
5. School Size and Pedagogies • Map schools, class sizes, and pupil teacher ratios et al; locate additional capacity in relation to need • Identify where multi-grade pedagogies are needed (small schools, multi-age enrolment) and where
classes are oversize (urban slums, migrant schools); support curriculum development and training • Identify effective learning and teaching strategies through inventories of good practice, analysis of
EMIS and performance data, and action research. Promote better practice. • Design, develop, pilot, evaluate new pedagogies where these promise and deliver large learning gains
6. Buildings • Review building stock and demand for space/facilities; project forward and build capacity through
appropriate mix of additional classrooms and new schools with quality/cost control of procurement • Review services, clean water, sanitation, infrastructure and act to meet national standards on all sites • Develop protocols for maintenance/rehabilitation to ensure safe and congenial learning space

35
• Mobilise public and private sources of funding for construction and maintenance 7. Learning Materials
• Assess quality, availability, and costs of core books and learning materials for children and plan for a book per child per main subject or the equivalent;
• Identify enrichment materials and other learning and teaching aids and plan provision • Adopt effective and efficient procurement and distribution of books and learning materials • Develop affordable and effective strategies for information technology evaluated independently
8. Teachers • Assess the stock and deployment of teachers and project supply and demand. Audit distribution of
teachers and pupil teacher ratios and act to meet norms and reduce variance • Review the teacher education system and reform to prioritise skills and competences linked to more
effective learning; upgrade subject and pedagogic knowledge and skill; consider less emphasis on initial training and more on in-service support
• Identify lost teaching time including absenteeism, manage incentives to increase time on task • Provide incentives for difficult postings including housing, promotion, subsidies of training and
additional payments 9. Assessment and Monitoring
• Provide support for regular formative assessment in main subjects with feedback designed to identify learning problems and improve achievement; keep records of assessment for each child and review periodically; train teachers to diagnose misconceptions and learning difficulties
• Invest in enhanced data collection and monitoring of schools using improved EMIS and more useful indicators of performance
• Develop annual standardised monitoring assessments assist in managing performance improvement • Commission a rolling programme of analysis of aspects of system performance
10. Financing • Project costs of universal access in short to medium term for integration into MTEF; identify gaps in
financing and methods of filling any such gaps • Review sub sectoral allocations, unit costs, and other patterns of resource allocation with a view to
enhancing access and equity and affordability • Identify necessary cost saving and efficiency enhancing reforms • Determine modalities of external financing within a multi donor framework
4. Achievements: Research Outputs and Purpose
4.1 Overview and Progress 2010/11 The CREATE Annual Reports and Mid Term Review provide a comprehensive overview of achievements and progress in each year from 2006 to 2009. A brief up date of progress and developments in 2010/11 is as follows. CREATE has continued its collaborative programme of work across four main country sites, with smaller ad hoc programmes in other locations, and with analysis of cross national data sets that can speak to questions at the regional level. Since the 2009 Annual Report CREATE has focused on consolidating its research outputs following on from the 20+ presentations and research products launched at the UKFIET Forum at New College, Oxford in 2009. This has involved a sustained programme of data analysis, report writing, editing and peer review, and the physical production of a large volume of research reports ready for distribution. During 2009/10 many CREATE activities took place (see website). These included contributions to the DFID Education Strategy Conference: meetings with UNICEF to design the 23 Country OOSC studies; CREATE lectures in London by VJ Kumar the founder of Activitiy Basaed Learning in Tamilnadu, and Pai Obanya, Presidential Advisor, Nigeria; contribution to the DFID advisors retreat on the Private Sector; and to the Special Issue of the Lancet on the MDGs; meetings at the International Institute for Educational Planning and participation in the International Working Group on EFA, and CIES, Montreal. Much of the new research output was launched at the joint RPC Conference in November 2010 at the Institute of Education as detailed on the website. This included 40 new research monographs and 15 new Policy Briefs. A joint RPC conference was also held in Ghana in September 2010 to project key messages. A final event will

36
take place in Ghana in June focused specifically on the policy community. In India CREATE held its international conference with all PICs present and members of the CAG in February 2011. This event was attended by three All India Joint Secretaries. CREATE will present at the World Bank/DFID conference on RMSA in Delhi, and in Washington at the World Bank and the Brookings Institute. A national conference will take place in Dhaka and in South Africa to showcase outputs and promote policy dialogue. In Bangladesh BRAC IED fieldwork has been completed across six districts in two cycles. The second period of fieldwork was interrupted and delayed by more than a year by political instability and civil unrest. It was also delayed by a national dispute with the Teacher Unions about access to schools by NGOs which meant that work in government schools had to be suspended. Capacity constraints in Bangladesh have extended the period needed for data analysis and report writing. The lead field researcher was therefore invited to be in residence in Sussex for four months to receive technical support and progress the analysis and report writing. This has been successful, resulting in finalisation of four research products, and progressing several others. A doctoral completion is anticipated in 2011 which should produce a publishable product. The Bangladesh symposium took place in May 2011 with the Minister. This policy dialogue will feed into the discussions around PEDPIII through the engagement of our partner institution (BRAC). The event also included the launch of a book based on the research. The CREATE fieldwork programme in Ghana was moved from its original location at the University of Education at Winneba to the Centre for Research in Primary Education Quality (CRIPEQ) at the University of Cape Coast/UCC in 2007/8 for reasons of limited technical capacity in survey and data analysis work. Household surveys and school based research are now complete over two cycles in both Mfantesman and Savelugu Nanton and data sets have been cleaned and frozen. Consolidated fieldwork reports are being used to generate research monographs and a final research report. Substantial technical support has been provided in country during 2010 to overcome capacity constraints. A joint conference was held with the Ministry of Education and representatives from EdQual and RECOUP in the fourth quarter. This was followed up with a meeting between CREATE and the Junior Minister, following on from the previous meeting in April with all three Ministers. NUEPA’s programme of research in India has developed largely as planned though there have been delays related to operational difficulties, disruption related to state and national elections, and quality assurance. A third round of fieldwork has been completed and data entry has been accomplished. Data analysis has led to a synthetic report of the Community and School Studies. Ten Pathways to Access Research Monographs will be complete by mid 2011. We understand that NUEPA plans to continue cycles of data collection using its own resources beyond the lifetime of CREATE. A Commonwealth Scholar doctoral student should complete in early 2011 and provide further publishable products and a project book should be published in 2011. In South Africa data collection is complete and several research products are under development. A book will be produced in 2011 and will feed in to a dissemination event along with three Research Monographs, three policy briefs and two Case Studies. The partner institution has undergone reorganisation and changed staffing. The Principal Researcher has moved location but is contracted to complete the agreed research products. These dislocations have delayed progress and affected some research products which have now been reconfigured onto a manageable schedule. Contributions to the research programme and publications from Sussex and London have been extensive with minor delays resulting from capacity constraints in-country, and the other commitments researchers. Three more special editions of international peer refereed journals will be published in 2011/12. Small scale research has continued in other countries (Sri Lanka, Kenya, China) and should be completed by mid 2011. The Director of CREATE experienced periods of illness requiring surgery and this caused some delays. In 2007/8 the CREATE Research Fellow took maternity leave. In March 2010 she moved to new employment and has been replaced. The Project Co-ordinator left the project in mid 2009. These events generated significant induction and transaction costs which have delayed the production and quality assurance of research products. Both new appointments have proved excellent.

37
CREATE is continuing to project CREATE research findings to a range of audiences including development partners, government officials and key stakeholders. By mid 2011 over 65 research monographs will be available nested in the website. We also anticipate six books, four special issues of journals (one published, two in press), and many other outputs. The website houses an interactive data base of over 8,000 items on access issues. It also links to many cognate sources of information on access.
4.2 What are the Research Outputs The LogFrame confirmed by the MTR is reproduced below with an assessment of progress and comments. CREATE has produced substantially more research output than that agreed in the original LogFrame. The areas it has covered include all those nominated in the Invitation to Tender and many others. This reflects the breadth and depth of the contributions from a large number of researchers working within the CREATE programme. The outputs achieved include but are not limited to: 65 Research Monographs on themes that include: inter alia planning and financing; management related to Education for All; health and nutrition; non-state and private providers; teachers; small schools and multigrade; retention, dropout, and completion, repetition and over age enrolment; language; migration; seasonality; nomads, pastoralists and fisherfolk; transitions to secondary; gender; disability; orphans; and equity and social mobility 4 Country Analytic Reviews - Bangladesh, Ghana, India and South Africa 8 reports from the 4 Community and School Studies using evidence from household surveys, schools, teachers, achievement tests, and tracking of children in school and drop outs 9 Changing patterns of access monographs using large scale secondary data sets and indicators of progress and other sources 9 Political economy of Education for All monographs based on country case studies and other sources 4 Special Issues of Journals – Comparative Education; International Journal of Educational Development; Journal of Education Policy; Prospects including more than 30 refereed articles. 7 Books – 2 launched, 1 in draft and 4 planned for 2011/12 9 Core Research Instruments and associated framework matrices and advisory research memoranda 25 Policy Briefs at both international and national level 7 substantial CREATE Newsletters 22 D.Phils and Ph.Ds – 10 complete and others will follow in 2011/12 Capacity building for new and younger researchers through an extensive programme of technical support, workshops, and visiting fellowships – see Annex 6 Policy Dialogue Activities and Events at local, national and international level – see Annex 4 Podcasts, videos, and other media outputs are listed in Annex 5 CREATE is a programme of research rather than a single project. CREATE’s PICs insisted from the outset that it had to respond to the specificities of each country context. It was recognised that a common framework was both necessary and desirable, but it was also clear that the elaboration of the research would vary between sites as a result of practical realities and varying priorities that would determine relevance to policy dialogue. Thus different sampling procedures were used in the different case study sites and the range of research monographs commissioned varied, as did the extent to which secondary data was analysed. The Research Monographs now constitute a considerable portfolio of outputs. These include state of the art reviews of key themes, empirically based work arising from the various research projects within the overall programme, analyses of cross national and national data sets, studies from associates in countries outside the four main PIs, selected contributions from Doctoral CREATE Associates, and outputs linked to the changing patterns of access and political economy of EFA strands of research. Many of the PTAs cover more than one of the zones of exclusion, and more than one national context. The Country Analytic Reviews and the research reports and summaries link to the Community and School Studies and contain detailed insights into key access issues at national level and in the case study sites as noted in Section 3. All the CREATE publications are listed in Annex 5, and PTAs and journal articles are listed separately by theme in a table.

38
4.3 Who are the Beneficiaries? The Communications Strategy profiles intended beneficiaries (Annex 4). They include:
• Ministers and political level stakeholders Senior Ministry Officials • Partner institutions National Reference Group members • Community Level stakeholders Local officials • Teachers and community leaders Development partner staff • NGO staff CREATE Young Researchers • Graduate students Staff and students in Teacher Education
CREATE has used its PIC networks to engage many constituencies of interest through a rolling programme of public events and private discussions and contributions to policy dialogue. It has systematically projected its work and arranged sequences of events and meetings with the Ministry of Human Resource Development in India and the State Governments of Madhya Pradesh and Chhattisgarh; The Ministry of Education in Bangladesh; the Ministry of Education, Sports and Science and the Ghana Education Service; and the National Department of Education and Gauteng and Eastern Cape Education Departments. CREATE has also engaged directly at a lower level of intensity with the Ministries of Education in Kenya and Sri Lanka. CREATE has worked closely with development partners in Ghana and India, especially DFID and the World Bank. In all countries CREATE’s network includes Ministers and high level civil servants who have participated in CREATE events and who have benefited from CREATE events and from contributions invited by officials and Ministers. Thus CREATE has briefed Parliamentarians in Ghana at their request, welcomed the MOESS decision to print and distribute the Ghana Country Analytic Review in quantity; made extensive contributions to the Sector Performance Reports in several years and provided the CREATE model to the most recent World Bank sector paper. In India three joint secretaries attended the last CREATE conference and opened and closed it; CREATE’s work has been projected by NUEPA and resonates with the annual EFA Reviews and the Right to Education Act which NUEPA has influenced; the MHRD has used the CREATE model in developing forward plans for the national RMSA programme; at State level CREATE has fed back its findings to high level groups. In Bangladesh CREATE works with BRAC and its NGO partners to enhance access and provide inputs to policy dialogue through national events. In South Africa CREATE gave evidence to the Parliamentary Commission on Retention and has organised a series of events with the national and provincial departments. CREATE has presented in many multi-lateral arenas and shared its insights at high level meetings. These include a 40 minute plenary to the Commonwealth Ministers meeting in Cape Town; plenaries at the ADEA biennial in 2008 in Maputo; several inputs to the Regional Conferences of the Secondary Education in Africa Programme of the World Bank; to the School Fee Abolition Campaign, to the Global Campaign for Education; to UNICEF and the 23 country out of school studies (See Annex 5). Beneficiaries also include all the CREATE associates and researchers who number over 100 professionals, and the much larger numbers of students and trainees that pass through our affiliated institutions. The ComSS case study districts have also benefited directly from the research insights and the opportunities this has created for raising awareness and overcoming access problems. Previous ARs contain more information on other sets of beneficiaries.
4.4 Where are the Research Impacts and what are the Programme Achievements? CREATE was invited to: “seek persuasive evidence for effective ways of increasing and maintaining access to education. We are specifically interested in new knowledge that is able to identify the constraints/hurdles regarding access to education and how these might be overcome, and provide evidence based best practice for increasing enrolment, progression and completion”. The LogFrame identifies the purpose and DFID supergoal which is the “Production and uptake of technologies and policies that will contribute to poverty reduction and the achievement of the MDGs”. The purpose identified has been achieved and the TOR in the original Invitation to Tender have been met.

39
4.5 LogFrame of Outputs The programme has achieved the goals identified by the OVIs. These are summarised below. Table 1 LogFrame Outputs Outputs: Objectively Verifiable Indicators Progress Recommendations/Comments
1. New knowledge of methods to improve access to basic education from:
i) national and cross-national reviews and studies
ii) empirical studies at school/community level
iii) further analyses of access issues based on secondary data sets, and on policy analysis
(i) Knowledge products (Country Analytic Reviews, Pathways to Access Research Monographs, Policy Briefs) which identify current status, key research findings, better practice, and gaps in existing understanding published and disseminated (ii) Knowledge products (Community and School Study based reports and papers, and thematic studies) provide new insight into inclusion and exclusion in the sampled schools and communities (iii).Knowledge products (analyses of secondary data, cross regional analyses, policy analyses published and disseminated
(iv)Knowledge products disseminated widely and effectively as indicated in
i. Four Country Analytic Reviews completed and launched;
ii. 65 PTA Monographs published and 25 Policy Briefs published;
iii. Four special issues of peer refereed journals published including more than 25 papers;
iv. Three books published; three further books due in 2011/12
v. 22 DPhil and PhD theses will be produced (12 completed)
vi. Four country research summaries and analytic material included in PTA Monographs and country level Policy Briefs
vii. Field reports from Community and School studies based on work in several locations in each partner country.
viii. 10 Case Studies from four countries ix. PTAs on Changing Patterns of Access (9) and
Political Economy of EFA (9) completed based on primary and secondary cross national data sets, interviews and policy analysis
x. Other publications including Special Issues of J. Education Policy, International Journal of Educational Development, Comparative Education, and Prospects. Background papers on EFA in other countries in Nepal, Sri Lanka and Pakistan.
xi. National and international conferences hosted by CREATE, plenary and other presentations at national and regional EFA events, stakeholder disseminations at different levels, extensive web based publication, invitations to provide advice to Ministries and Development partners.
xii. Use of CREATE materials in six Universities to
1. Knowledge products include
over 150 items and more than two million words of research output are available on CD ROM, on the website, and in hard copy. Doctoral theses will be available through the British library This is a very substantial portfolio of work
2. The impact of CREATE’s research will continue for several years after the completion of the project. It is important to maintain the website and continue to project its messages
3. Impact will also depend on the extent to which DFID internalises messages from CREATE and uses its convening power to project them at national and international level
4. CREATE’s model is widely known and has been reproduced in at least four major international documents associated with bi-lateral and multi-lateral donors
5. CREATE’s outputs very

40
the Communications strategy support training of teachers and researchers and for use in in-service training and continuous professional development reaching several hundred early and mid career professionals each year.
influential in shaping the 2010 DFID Strategy Paper
6. Hard copy sets of products can only be distributed to about 100 sites. This is especially important where IT Services are unreliable and expensive.
7. More Policy Briefs could be produced with more time
2. Communication and dissemination strategies developed and implemented to shape research, adapt flows of information to different audiences, facilitate internal communication, disseminate research products, and inform policy and practice
(i) Communication and dissemination strategy based on inputs from the CAG, NRGs, and PICs developed (ii) PIs, CAG, NRGs make inputs into the research design and development process and project CREATE knowledge outputs though the communication strategy iii) Communications team adapt research products for different audiences, establish and use internal communication networks, and project CREATE messages to inform policy and practice through physical research products, event and activities and positional interaction with policy makers
i. Communication plans implemented by communication teams as per Annual Plans
ii. Over 175 CREATE communication and
dissemination events logged since 2006 and projected through the website, and seven comprehensive newsletters
iii. Policy dialogue meetings with key stakeholders,
opinion leaders, and Ministers and senior officials
iv. Technical workshops and symposia to shape research design, develop research instruments, analyse data, write reports and papers
v. CREATE products and messages produced in
different formats including DVD, CD ROM, and podcasts and PPTs for different audiences; Policy Briefs launched
vi. Website developed to include extended portfolio of
research products and gateway links and databases; email networks for internal communication; more than 90,000 page views on the website
vii. CREATE messages and products projected to policy
makers and practitioners through publications, launches, conferences, symposia, participation in EFA activities, and community level organisations
viii. Projection of CREATE hard copy research products
to over 100 libraries, resource centres, research institutes along with electronic distribution
1. The Communication Strategy has been very effective where it has built around national events supported by research outputs. Many of these have led to invitations to partners to engage directly in policy dialogue at a high level
2. National and institutional level communication strategies do not always match changing priorities in DFID and in the international agendas on EFA. Clarity is needed in targeting messages for different audiences
3. Informal networks and policy communities are central to projecting CREATE outputs.
4. CREATE output is used widely across PI postgraduate programmes and reaches hundreds of students each year
5. Capacity to sustain communication and dissemination will lapse at the conclusion of the project

41
CREATE has an extensive portfolio of new knowledge about how to improve access in terms of enrolment, progression and retention which is embedded in its research reports at local, national and international level. It also has close relationships with policy stakeholders in each of its main country contexts and its PICs are all key players able to access public and private policy arenas. CREATE messages have been projected into policy discussions in a wide variety of events, activities and networks and media. CREATE team members have drafted Ministers speeches, contributed to Sector Planning, and seen concepts from CREATE become visible at national and international level. The conceptual model and many of CREATE’s concepts have been used in various high level documents, and the ten point plan provides a basis for improving access that needs iteration in context.
4.6 What is, or is likely to be the programme’s impact on poverty? It is too early to determine the impact of CREATE on poverty in any simple way across four large countries with varying governance and very different political commitments and priorities. As a research project CREATE has identified many aspects of the relationships between education and asset/income poverty. It has reminded stakeholders that exclusion from education is part of the definition of poverty as well as a means for its alleviation. If CREATE’s advocacy resonates with national priorities, and if resources are made available, then much higher rates of access to education are possible. This will take time, considerable resources, sustained political will, and commitments to deliver on promises to include marginalised groups. If the excluded are included, poverty will be reduced by that fact alone since lack of access is part of the definition of poverty. If access is meaningful and has utility as the expanded vision of CREATE requires then knowledge and skill will be acquired by the poor and this will increase their chances of mobility out of poverty. The various correlations and regressions in research reports clearly associated access to education with reduced poverty. Those who are sceptical of the impact of education on poverty should be reminded that the counterfactuals do not ring true – there is no poverty alleviation strategy that assumes higher rates of illiteracy and innumeracy, lower rates of school completion, more gender differences in enrolment, less transition to secondary, and lower levels of attendance and achievement. If the impact of education is not evident in the short term it may be because over rapid expansion has undermined quality to the point where little is learnt. If so this suggests the need for more rather than less investment.
4.7 What is, or is likely to be the programme’s impact on the wider environment CREATE is optimistic that its research outputs will continue to have an impact on the wider environment. Its PICs and senior researchers are already major contributors to both national and international policy dialogue on EFA and take part in national and international planning and monitoring of EFA. The MDGs cannot be achieved without action on access to education across different zones of exclusion with an expanded vision of access. Such action has to recognise the analytic insights into the correlates of sustained access for different groups, and the need for complementary strategies on both the supply and demand sides of the problems. Team members are engaged with a wide variety of other access related projects and the website is widely known.
4.8 Effectiveness of the communication strategy The communication strategy is presented in Annex 4. In brief CREATE has had a communications strategy since its inception and has spent more than 10% of its budget on this as required. This strategy has developed with contributions from PICs. It has taken into account feedback from DFID, the MTR and the Consortium Advisory Group (CAG), and developments in the CREATE programme. The Annual Reports detail the evolution of the strategy. More emphasis has been placed on communications and dissemination in the last two years as research products have become available. The focus of communications and dissemination strategy has been the consolidation of a portfolio of accessible research products and the projection of messages from these products to CREATE’s primary audiences. CREATE has sought to project knowledge and insight arising from its programme of research to a range of national and international stakeholders engaged in Education For All (EFA) programmes and committed to the Millennium Development Goals (MDGs) related to education. It seeks to achieve this in ways which influence policy dialogue and the practice of education professionals at different levels.

42
4.9 Purpose – LogFrame Table 2 Purpose - LogFrame Narrative Summary OVIs Progress Recommendations/Comments Purpose (No need to complete) (No need to complete) (No need to complete) Purpose: Encourage the application of knowledge and insights from research to improve policy and practice on more equitable access to basic education in low income countries related to the MDGs
1.Policy makers, opinion leaders and education professionals recognise the value of knowledge and insights from CREATE research 2. Policy makers, opinion leaders and education professionals become aware of new knowledge from CREATE through research reports and other research outputs related to each “Zone of Exclusion” which contain feasible recommendations for policy and practice 3. Attribution to CREATE work judged at a reasonable level
1. Four national launches of Country Analytic Reviews attended by
Ministers, senior officials and development partners 2. Four national Research Outcomes Conferences attended by Ministers,
senior officials and development partners 3. Three UK Forum Symposia at New College; Oxford. 4. International CREATE Conference. Institute of Education, London 5. CREATE Model and research insights cited explicitly and included in
key documents including for example: • DFID Strategy Paper 2010 • DFID Retreat Chennai 2009 • UNICEF 23 Country OSC • International WG on EFA, Paris • World Bank SEIA (3 Conferences) • ADEA Biennial 2008 • UNESCO BREDA IBE 2009 • Commonwealth Ministers 2007+ 2009
6. Many national level events including high level meetings and inputs to national level EFA planning and process. This includes the Sector Review process in Ghana for several years
7. MOE Ghana has invited inputs from CREATE to the annual Sector Review process. It has also sponsored more than 20 officers at post graduate level to work on EFA and access issues. NUEPA uses the CREATE data set in its regular training programmes for educational planners across all States in India. CREATE concepts have informed NUEPAs inputs to national policy. The DoE in South Africa invited CREATE to give evidence to the parliamentary Commission on Retention; Provincial Departments in Gauteng and Eastern Cape have invited advice from the PI as has the National Department. BRAC IED projects CREATE insights throughout the NGO networks of which it is part and is directly involved in “Education Watch”.
8. Development of a Ten Point Plan to communicate key insights from CREATE
1.Sustained political commitment to EFA, stable government and local educational administration act to improve pro-poor access in relation to the MDGs 2.Domestic and development partner resources mobilised efficiently and effectively to support improved and more equitable educational access 3.Government willingness and ability to use independent research and analyses in policy dialogue and decision making 4.Detailed listings of what has been achieved are to be found in the Annual Reports

43
CREATE has therefore: • Engaged stakeholders in shaping research priorities and shaping research activity. • Communicated and disseminated a portfolio of evidence-based research outputs on access, equity
and transition to national and international audiences • Adapted flows of information and analytic insight to the needs of different audiences • Facilitated internal communication, reflection and learning • Sought to provide evidence based insights to policy makers and communities of practice
Throughout its lifetime CREATE has engaged directly with stakeholders at different levels. This has been achieved through the professional and official networks of its PICs who are all strategically located in national and international policy arenas. CREATE has maintained a central capacity and has coordinated communications at the international programme level. PICs have nominated staff with a special responsibility for communications and are expected to nominate 10% at least of the funds received for communications. Activity is monitored through quarterly reports and events and activities captured and placed on the website. Major events are accompanied by reports including photographs, power points and commentaries on proceedings and key issues.
The PICs and country level staff are in the best position to judge effective channels for communication and timely opportunities. The modus operandi has had several dimensions. These include:
• Presentations at major international events (Commonwealth Ministers Meetings, CHOGM, World Bank SEIA Regional Meetings; ADEA; DFID Retreats etc) and scheduled public events
• Technical workshops focused on strategic needs • Invited meetings with senior policy makers • In-country field work and feedback at local level • Internet based dissemination and CREATE newsletter communications • Appearances in mass media (radio, chat shows, TV, news papers etc) and inputs to TV soap operas • Contributions to academic journals and Special Issues of peer reviewed journals • Serendipitous meetings and opportunities to engage with other networks of influence
CREATE has made full use of its website to project messages. It has attracted around 90,000 page views and well over a thousand downloads. The coverage includes over 150 countries though most hits are from the UK, India, USA, South Africa, Ghana, Bangladesh, Canada, Kenya and Japan. The website has been refreshed and represented to be more accessible and engaging. It contains all print and media output and is free to visitors. The portfolio of research products is now extensive (Annex 5). In addition to the publications it incorporates communication products that include podcasts, videos, powerpoint presentations, radio transcripts, displays, policy briefs and many other items. The communications strategy makes extensive use of these products.
PIs are on-going institutions which vary from those with their own communications and publications systems to those which are small research and teaching groups. The shape and form of DFIDs communications strategy can map with different degrees of fit onto other institutions and their staffing. On occasion PIs may have reservations about projecting messages which can be seen as emanating from DFID, particularly when they are national institutions embedded in national policy making. Moreover content derived from research has to be locally owned and projected in relation to other messages that locate ideas and advocacy in ongoing policy dialogue which has history and is likely to be politically located. These issues require a flexible strategy. CREATE has supported many of its researchers to become more aware of needs to translate research findings into policy options and insight that can inform choice and help evaluate impact. For some this was a new experience which required capacity building.
Policy dialogue is often a public activity. But it is also often the subject of discussion behind closed doors and in a private environment. The two discourses intersect and overlap but are often quite different in content and in the means of resolving competing perspectives and priorities. It is therefore necessary to find ways of managing a presence in both public and private arenas. CREATE achieves this through its PICs networks and standing in their respective communities. Over rigid and prescriptive planning of communications can risk being untimely, or poorly judged in terms of windows of opportunity to influence events. Effective communication needs clear messages available in a timely way.

44
The CREATE communication strategy has been deployed flexibly and has followed the development of research messages embedded in Country Analytic Reviews, research reports and policy briefs. The research output has been available in volume in the last two years since it has taken time to accumulate analysis and insight, especially from large scale studies. The communication strategy could be usefully deployed for at least five years into the future to embed the messages securely within the countries in which CREATE has worked and in those where the same messages clearly have currency.
4.10 Awareness amongst policy makers and stakeholders of research findings CREATE is close to policy makers in the political and official cadres of the countries in which it works. In India the PIC is Vice Chancellor of the National University for Educational Planning, edits India’s Annual EFA Report, has been a contributor to the Right to Education Act, and sits on the board of the Global Monitoring Report. In Bangladesh the PIC is a former Senior Education Advisor and country Director for China, Ethiopia and Japan for UNICEF, a past convenor of Bangladesh Education Watch, and Associate Director of ICED, Connecticut. In Ghana the PIC has been a senior university Professor at Legon, Director of the Ghana Education Service, Chair of the West African Examinations Council and columnist to national newspapers. In South Africa the PIC has been Director of the Wits Education Policy Unit and has acted as advisor to past and present Ministers of Education. In the UK the two PICs hold Chairs in Education and Development in London and Sussex and were both invited presenters at Jomtien and Dakar conferences as well as well known authors and advisors to agencies and governments. The networks of the PICs are enhanced by the many researchers associated with CREATE and through their links to advisors in DFID, the World Bank, UNICEF, UNESCO, and other multi-lateral and bi-lateral agencies. Many events have attracted high level political and official participation. Research findings are evident in sector reviews, official reviews, education acts, and in adoption of concepts (see 2.3 and 4.4 above and Annex 4 for a fuller list).
4.11 Research impact on the wider environments at national and international levels Much of the medium term impact of large scale research programmes occurs following the consolidation of empirical work when clear messages can be projected into policy dialogue. This process has been gathering momentum in 2011. We note that CREATE has built a special relationship with the Ministry of Education in Ghana which has sponsored more than 20 senior officers on post graduate programmes related to access. In India NUEPA has initiated its own PhD programme with over 25 postgraduates in its first batch. Several are working on access. The CREATE data and methods are used on the programme. They are also used in All India and regional training programmes for educational planning. CREATE’s work has been used by UNICEF South Africa and in the Parliamentary Commission on retention. In Bangladesh there have been many inputs into policy dialogue. CREATE has also been high profile at many bi- and multi-lateral events and has been used to shape the DFID Education Strategy paper and many other key documents noted above.
4.12 Capacity Development CREATE has supported a very extensive range of capacity building which is outlines in Annex 6. There are several different strands to CREATE capacity development. These include:
• Field Support for Research Teams Supervision of Post Graduate Research Degrees • Publishing for Early Career Researchers Contributions to National/International Conference • The CREATE Research Associate Network Technical Workshops • Integration of CREATE Research outputs and data into graduate courses and research training • In Service support for education officers and teachers
CREATE has developed its programme of research through collaborative multi-country workshops that have discussed research questions, developed an extensive research design, produced a range of data collection instruments, and provided technical assistance for data analysis. These workshops have been used to support capacity building linked to the development of community and school based empirical work, country analytic reviews and complementary research projects. The process of research development has been iterative and interactive and this has ensured that different perspectives have been recognised. In workshops capacity is built with experienced and junior researchers working closely together. The approach is one of on-the-job learning related to specific tasks that need completing. When appropriate, technical assistance has been delivered directly to assist the research teams and build capacity. Thus more experienced researchers and those with specific skills (e.g. in data analysis) have been supported to work with research teams in-country. Junior researchers have been sponsored to spend time in

45
the UK. Partners have also organised their own technical workshops tailored to local needs, and focused on specific audiences. Capacity has also been built through extensive support for progression from data collection through analysis to final publication. CREATE has maintained a quality assurance and peer review system which itself shares messages about what is required for international publication. Capacity development for institutions linked to CREATE depends on their own priorities and staffing practices. In all cases CREATE complements the work programme of partner institutions and does not directly employ staff or manage their career development. Partners have been encouraged to use the opportunities generated by CREATE to build capacity in line with their own institutional plans. Some capacity building highlights include:
• CREATE has set up a research associate scheme and currently has more than 30 research associates across the research sites. The associates include post doctoral and more experienced researchers linked to CREATE. CREATE Research Associates benefit from direct access to CREATE resources and global library resources; receiving the CREATE Newsletter; opportunities to publish research papers in the Pathways to Access series and to undertake research work for CREATE; invitations to CREATE events including the lecture series in London and Sussex.
• There are 22 postgraduate students studying for DPhil and PhD degrees. Six of these students are supported by Commonwealth Scholarships, three by the Government of Ghana, and the others from a variety of grants from foundations and from private resources. CREATE has only supported 1.5 FTE scholarships directly, reserving the bulk of its funds to support the research directly. CREATE has also supported post doctoral fellowship from additional funds and has employed three UK based Research Fellows over the life of the programme.
• There are now over 70 CREATE publications authored by new researchers, including 14 policy briefs, and 15 refereed journal articles, as well as more than 10 chapters in books. More than 100 papers have been presented at conferences based on CREATE research.
• PIs have made different arrangements to support capacity building within their own staff development plans. These are detailed in QMRs and in the Annexes to Annual Reports.
• More than 25 technical national and international development workshops have taken place to design, develop and undertake the research which provided younger researchers with opportunities to acquire new skills. Most of the events have involved between 10 and 20 participants. We estimate that over 100 researchers have been involved in one or more of these skill based activities.
CREATE has developed a suite of research instruments that can be used to undertake research on access. The process through which these were developed involved considerable capacity building. These instruments have been carefully developed to reflect the CREATE zones of exclusion and to use multi methods data collection strategies. The suite of instruments includes:
• The Master Framework of Research Questions (RQ1 Zones Of Exclusion And Research Questions; RQ2 ` Explanatory Variables By Zones Of Exclusion; RQ3 Memo On Sources Of Evidence); ComSS Advisory 1 and 2 Portfolio Advisory Documents
• The Generic Nine Instrument Pack: *Household Roster for Primary Caregiver *Baseline School Data Collection *Head Teacher Questionnaire *Teacher Questionnaire *Child Questionnaire Out of school children *Child Questionnaire Drop outs *Children in school and at risk *Child Tracking Card *Basic Literacy Test
Subsequent capacity building activities sequentially focused on data collection, data analysis and report writing. CREATE provided technical support across all three of these activities. It has also offered specific technical assistance in relation to quantitative data analysis of large scale data sets. The support for report writing has been extensive in order to assure quality. A range of outputs have been extensively supported with review and editing assistance. A range of outputs have been co-authored. Further details are included in Annex 6. CREATE has built a capacity building programme which has benefited many junior and some senior researchers many who will occupy positions of influence in the future.

46
5. Lessons Learned 5.1 Working with Partners CREATE has continued to work collaboratively with its partners across the main research sites. Its profile of work has changed as it enters its final phase. Most of the effort has been directed towards supporting data analysis and the production of research outputs. Alongside technical workshops CREATE has provided in country support for data analysis and has hosted visiting fellows at Sussex and sponsored visits between research sites. This, and the increasing volume of research output, has generated a much higher workload centrally in coordinating progress on many different research products and maintaining a growing programme of CREATE events designed to project findings into different arena. Events outside the control of CREATE have been significant. Though most were anticipated in a general sense in the risk analysis, the specific incidence could not be predicted. Thus some deadlines have continued to slip as a result of unreliable communications infrastructure (power outages, poor internet connections, travel delays), elections (changes in government and key personnel in all countries), and political instability (Bangladesh). Staffing changes have occurred (PI India becomes Vice Chancellor, PI Bangladesh retires from Director IED, Principal Researcher Ghana becomes Head of Department as well as Director CRIPEQ, EPU South Africa restructured and PI moves to new job), DFID advisors change in Ghana, Bangladesh and India, and there is no DFID education portfolio in South Africa. In all sites junior research personnel have changed as young researchers move on to more secure employment and postgraduate students graduate. CREATE has responded to changing circumstances on a case by case basis. Working practices have developed to recognise and work around the constraints. Lessons learned are elaborated in previous ARs. Some key insights include:
• Quality assurance has sometimes required more time than anticipated as a result of the CREATE commitment to capacity building and the promotion of young researchers as authors. Thus normal iterations of drafts once or twice before finalisation have on occasion had to be enhanced with more work and close editorial assistance. CREATE has strived to encourage all products meet publication standards. Decisions have had to be made to cut losses on some pieces of work of poor quality.
• The CREATE house style was designed to be simple to use and readily accessible through common software. Formatting was deliberately kept to a minimum. Charts, tables and figures follow close to default forms. Nevertheless, many researchers produce drafts on a wide range of machines using many different style sheets etc. This generates unnecessary costs in reshaping and formatting. In future PICs need to be trained to adopt consistent forms and employ these with their research teams.
• Capability in quantitative analysis exceeded the capacity of some of the research teams. This became apparent during analysis and it was necessary to contract additional assistance to support teams in country and remotely from Sussex. The initial decision agreed with PICs was to undertake analysis in PIs rather than centrally so that ownership would remain with the research teams and that skills would be transferred. This required some initial investment in software licenses and training, and algorithmic advice and technical support through the programme. Quantitative data analysts are in short supply and are often at risk of being poached to other projects.
• Qualitative research appears easier to some because it does not have the same technical entry price. This is not the case since good qualitative work requires careful design, systematic development, and painstaking analysis and interpretation. With the benefit of hindsight more time should have been invested in research method training prior to field work as well as on the job. Difficulties arise especially where apparently qualified staff have not acquired a full complement of skills.
• Data entry was achieved manually using well known procedures. This was labour intensive and required careful data cleaning and consistency checking. In PIs which did not have a standing capacity to undertake this work teams had to be convened and trained each time a data set was collected. Though this shared capacity building across more young researchers, it also had high transaction costs. Subsequent programmes should consider making more use of the electronic real time data entry systems that are now available for household surveys etc.
• Buffers are needed in time lines for sub-projects in their last year of operation because of the risk that staff will move on to new jobs if they have no security of employment beyond the programme. This “planning blight” has affected CREATE and its teams and though it was anticipated there is not a great deal that can be done to reduce the transaction costs of replacing staff.
• Though in all PIs institutional contracts were drawn up that identified staff and staff inputs to sub-projects, practice clearly differed across the PIs in how staff time was allocated. In the absence of workload systems that are transparent it is difficult to track inputs. Moreover, none of the PICs were

47
full time, and each were in different positions in relation to line management and financial responsibilities in their organisations. Some aspects of time input were further complicated by the conflicting demands of capacity building and delivery of key products to quality.
• CREATE has shared ownership of research products and a protocol based on fact for the resolution of any disagreements. Authorship is attributed to papers depending on judgements of inputs.
5.2 Good Practice/Innovation CREATE’s sustained its good practice of commissioning research annually within framework plans generated by and discussed with partners. These are linked to fixed-price contracts paid in three tranches - on signature, on receipt of mid-term products and on receipt of final products. It was agreed that typically 40% would be paid up front to meet costs incurred in advance of the production of outputs, and the remainder in tranches linked to products. This system has generally proved effective. It has resulted in delays in payment when products are not finalised on due dates or fall short of quality standards. Some leeway has been necessary to recognise operational difficulties. CREATE has also maintained its central quality assurance and monitoring systems. The first quality assurance and monitoring responsibility lies with its PICs who are the managers and gatekeepers for research products. Depending on the products the CREATE secretariat then reviews outputs and decides what level of review and editorial assistance to activate. A layered approach to products has been used. Some outputs are placed in a ‘Work In Progress’ category that has less demanding editorial standards than the Research Monographs which aspire to international journal quality. This allows reports and other pieces of analysis to be captured that are not in a form suitable for academic publication, but which have intrinsic merit. Policy briefs provide another type of product which is intended to be accessible to a wider audience. In–country editing is encouraged but is not always easy to arrange. CREATE Technical Workshops are designed to respond to need. They also allowed cross partner learning to take place. The nine core instruments were developed jointly in such workshops promoting ownership and enhancing quality and relevance. Similarly data analysis and writing workshops have provided similar opportunities to cross fertilise and tune messages for different audiences. Though CREATE has adopted a common core design with a consistent set of concerns and range of data capture methods, it has also been permissive of adaptations designed to accommodate the differences that exist between national contexts, and the partners own priorities and capabilities. The strength of this approach is enhanced relevance; the weakness is that tightly controlled cross country comparisons may be elusive. CREATE has met at national, regional and whole programme level over the last two years. These events have sometimes been free standing, and sometimes timed to coincide with major international conferences. These activities and others listed on the website have allowed PIs and junior researchers opportunities to project their work and establish their reputations. They have also provided arenas in which project staff have interacted with policy makers. These activities have complemented a wide range of invitations to make submissions into the policy making process at national level though sector reviews, national legislation, and performance appraisals. CREATE’s communication strategy has thus mixed public events and activities, with face-to-face contacts and strategic interaction in closed environments with senior stakeholders. CREATE has also successfully sought complementary funding and collateral support.
5.3 Project Management Project management is concerned with managing specific day to day CREATE research activities at both central and PIC level. Day to day project management at institutional level is the responsibility of the PICs. CREATE agrees research products and quality assurance processes; establishes timelines that are challenging but realistic that reflect research capacity and constraints on team building and field access; monitors progress through quarterly reviews; and responds flexibly to events that have an impact on progress. In most sites the PIC works closely with a principal researcher and several junior researchers. Sub-contracting has been used for specific purposes, usually when in-house capacity is insufficient. Key issues that have arisen in different ways on different sites are:
• Assuring the stability and continuity of research teams with staff turnover • Managing sub-contracting; some has been successful and others led to disappointing results • Mobilising data analysis capacity for short periods which cannot be retained throughout the project • Tapping in to current policy agendas which can be transient whilst focussing on key questions • Liaising with key personnel in unstable bureaucracies with changing staff and policy

48
• Managing contracts and procedures across many different systems with different procedures; tracking payments and invoices internationally and through several bureaucracies
• Different rhythms and seasonalities across the sites which constrain joint activities. Partners are the main vector for national communications and have to judge opportunities as they arise, so a single centralised timetable is inappropriate except for major cross site events
• Strategic timing of activities is needed to coincide with windows of opportunity determined by the political, bureaucratic and administrative processes that shape policy
5.4 Communications Communications activities have been developed to project what is now a large portfolio of research products which includes a range of forms. This happens both at a central level and through the activities of PICs in each country. Communications allocations are included in annual partner contracts. Central funds support the core programme and all international activities and events. Capacity building for team members locally falls within the country programmes. Where cross national activity is involved it is financed centrally. Communications infrastructure is established and every partner has a country based communication coordinator. Quarterly reporting protocols are followed to capture communication activity, which reflect needs and opportunities. The CREATE on-line resources are now extensive (Annex 4 and 5). CREATE has supported national and local events in the case study areas. As research data and reports have become available events have been organised at district level to feed back the results of research and to stimulate the development of local initiatives to address major issues. PICs have to work within the constraints of their institutions and the priorities of their national and local governments. Issues emerging from the communications programme are identified in previous ARs. These include:
• Larger PIs have communications capacity in house; smaller PICs linked to research groups have little capacity for communications work and may prefer to devote limited resources to the research
• National institutions may or may not wish to foreground research outputs supported by externally financed programmes depending on the issues and the vectors of influence on policy.
• Some communications outputs can be seen to be politicised, especially if they are linked to issues that have a strong ideology. PICs have to judge where to place events and activities, especially where power changes hands and the political ownership of analytic insight becomes an issue
• Different cultures manage communications differently and use different channels and languages to share insight and ambitions. Generic CREATE products can only address certain audiences. PICs have to project messages and evidence through channels which reflect their nodal positioning in national and international networks
• DFID centrally determined policy priorities may or may not map onto national priorities and key issues. There are sensitivities around whether “to develop” should be regarded as transitive or intransitive. At the same time DFID supported research should uncover inconvenient truths if these lead to more effective national policy towards agreed ends
• None of the PICs have available dedicated communications facilities that allow for the frequent production and projection of press releases, TV and radio programmes, newspaper features etc. PICs have been very successful at capturing opportunities in national media and in briefing papers and contributions to international conferences on a scale commensurate with their resources
6. Programme Management The principles of programme management as a whole are described in the ARs for previous years.
6.1 Definition of Researchable Problems and Themes CREATE identified a core set of generic questions that informed much but not all of its empirical work. These have been listed in Section 2.1 above and are reflected in core instruments developed. A much broader set of research questions informed the themes that were used to shape the series of research monographs. These responded to the priorities of partners and thus covered topics that ran across the zones of exclusion and which offered analytic insight into a wide range of dimensions of access, equity and transitions. General groupings of the research outputs are listed in Annex 5. As CREATE developed its original design evolved in response to preliminary findings, changing priorities, and practical realities. Early on it became clear from analysis of secondary data that age in grade was a major under researched issue which had considerable implications for sustained access through to the end of

49
a basic education cycle. Secondly, analysis of changing patterns of access over time led to insights into what had and had not changed and why over the previous two decades. Thirdly, aspects of the political economy of EFA and governance began to appear of central importance to progress towards the MDGs. As a result these areas were given more prominence than was initially the case. Thus the CREATE thematic research monographs have evolved and shifted from review studies which identified research gaps, towards more contributions based on empirical work and focused on reaching policy relevant conclusions that could be fed into policy briefs. In the later stages of CREATE policy briefs and research summaries have grown rapidly in number and reflect the priorities of the PICs and their researchers.
6.2 Partner Engagement Partners engage with each other and with members of the CAG at meetings and bilateral events. Technical workshops provide opportunities for team members to collaborate on research design and data analysis. The quarterly monitoring process shares information about developments. The CREATE Newsletter provides a forum for team members as does the website. Quality assurance, including peer review, provides further opportunities for dialogue. Central decision making is informed by the CAG and PICs meeting and discussions in-country. Partners have autonomy in managing programmes within their annual framework plans and have opportunities to initiate and support thematic work consistent with CREATE concerns.
6.3 Changes to the Programme Changes to the programme have been flagged in each AR since 2006. These have been accommodated and consolidated. In brief some structural changes are:
• In Ghana CREATE moved its centre of gravity from the University of Education at Winneba to Cape Coast and CRIPEQ where there was sufficient capacity and better delivery. Discussions to involve staff in KNU in Kumasi fell away after some preliminary work.
• In India CREATE has remained located in the National University for Educational Planning and Administration (NUEPA), which was a parastatal institute when the programme was initiated. It has therefore grown in stature, the PI has become the Vice Chancellor, and it has developed its national and regional roles in providing graduate level training for educational planners.
• In South Africa CREATE was initially in partnership with a consortium of the national Educational Policy Units led from the University of the Witwatersrand. Over time the other EPUs failed and were closed. The Wits EPU has now been restructured and the PI has moved jobs.
• In Bangladesh CREATE continues to work with BRAC- Institute of Education and Development. Political instability in Bangladesh has disrupted the work and meant that only two rounds of data collection were possible, though an urban sample was added to complement the two rural ones.
There have been many changes in detail in each country which are captured in the annual framework plans. Sampling had to be changed to reflect the exigencies of fieldwork sites and capacity. Measurement of height and weight of children in the household samples was possible in some sites but not in others. Similarly achievement testing was adapted to different fieldwork locations and systems of child tracking. Small scale research was commissioned in Kenya, Sri Lanka, Malawi and China and offered novel insights into important topics. Full access was gained to DHS data and this was used for a series of cross national analyses. It was possible to link 22 students into the CREATE research projects with the assistance of the Commonwealth Scholarships, the Government of Ghana, and other funding from postgraduate researchers.
6.4 Monitoring CREATE partners provide quarterly reports. Quality assurance for research outputs is part of the monitoring system. Where progress is off-track steps are identified to bring the programme back on track. The risks to CREATE remain as indicated in Annex 8 and previous ARs. Though it has been possible to manage away some risks that have resulted in slippage of delivery dates, this has not always been possible.
6.5. Expenditure Flow during 2009/10 Various measures have been taken to keep expenditure on track. In particular target events have been organised to create public delivery points for outputs, additional technical support has been arranged in country and in Sussex, tranches have been released against deliver and not before, and more time has been invested in quality assurance support to bring products up to standard. As the balance has shifted away from data collection and analysis towards research product production and projection, so the pattern of expenditure has shifted. A no cost extension was granted to CREATE in May 2010 for five months until May 2011. CREATE subsequently requested a period until end October to complete all the activities and

50
was granted to the end of July. It will endeavour to meet this new deadline and complete all the products it can by this date, but some may miss this deadline. Undelivered products will not be reimbursed.
6.6 Multiplier Funding CREATE has multiplied its resources very successfully with funding and contributions from PIs. Six Sussex linked DPhil Commonwealth Fellowships have been awarded (Pauchari, India; Buckland, South Africa; Arkoful, Ghana; Sharma, India; Jha, India – worth about £300,000). The MoESS in Ghana is sponsoring three CREATE Sussex DPhil scholars (Akaguri, Ananga, Essuman) – worth about £200,000). The IOE has contributed a fully funded one year post-doctoral fellowship (Blum - £35,000). The IOE is also hosting six CREATE related PhD students including those funded by ESRC (Rolleston, Turrent), UNDP (Wang), AKU (Otienoh) and the IOE Centenary Scholarship (Mwanza). CREATE at Sussex supervises three other DPhil students who receive some support from CREATE (Cameron (Bangladesh), Siddhu (India), Ohba (Kenya) and sponsors two EdD post graduate from Bangladesh (Sabur, Hossain) (total value of over £500,000) In South Africa Wits has attracted an additional R380,000 for work on access (Fleisch – Focus Area Grant). NUEPA and BRAC IED support staff time on CREATE. The Ghana MoESS has co-financed CREATE national conferences and the production and distribution of the Ghana Country Analytic Review. CREATE has benefited from co-sponsorship of attendance at EFA related conferences from various sources including the World Bank, UNICEF, UNESCO, CEC, and national governments. The BUPA foundation has granted £75,000 to support a four country research project on educational access and health. CREATE has agreed with the DFID Young Lives programme to share data and has a joint publication.
7. Long-term Sustainability of the Research
7.1 How will the research be promoted once research programme funding ends? CREATE has an extensive community of interest and over 100 researchers associated with its programme. CREATE anticipates that many of its members will generate new projects on access and draw down on its portfolio of products. The PIs all have post graduate programmes which use CREATE material which reaches large numbers of postgraduates. The CREATE model has been used in several highly visible reports associated with development agencies including DFID and will continue to be influential, as will many of its research monographs. The impact of the research will be reduced by lack of continued funding.
7.2 How will people access the research products once the research programme’s funding ends? The research will continue to be available on line. All published content of CREATE is available through R4D. CREATE intends to maintain its website. We note that:
• CREATE research products are easier to locate through a normal Google search which often does not pick up the R4D version. Those who are unaware of R4D will not find the materials on the site.
• There is much material that is not suitable for R4D publication and is not in PTA or journal format • The CREATE website is a gateway portal to many other sites on access. The website contains a
searchable database of over 8,000 items which is unique. CREATE hopes that it will be able to update content and add new research products. It is not clear how to meet the costs involved in regular updating. It would like to use unspent balances for this purpose.
7.3 Have any follow-on research projects been agreed, which build on the outputs from this research? We are optimistic that CREATE’s model, core concepts, and key research reports will continue to be influential. The model has been taken up explicitly in one way or another in high level publications and events which include the DFID Strategy Paper 2010; DFID Retreat Chennai 2009; UNICEF 23 Country Out of School Children; International WG on EFA, Paris; World Bank Secondary Education in Africa; ADEA Biennial Plenary 2008; UNESCO BREDA IBE 2009; Commonwealth Ministers 2009/2007 Plenary; Government of Ghana Performance Report; Ghana Education Sector Report. In addition
• BUPA Foundation has granted Sabates/Lewin £75,000 for work on Health and Access • Discussions are taking place about a large scale programme funded by a charitable donor • NUEPA plans to continue cycles of data collection using its resources • CREATE graduate researchers may develop themes from their theses into projects • CREATE team members are being asked to bid for various access related research grants • The DFID/World Bank seminar in Delhi may generate opportunities for uptake of findings • AusAid will convene a CREATE symposium; the World Bank has invited a seminar • CREATE will give a plenary to the Annual Conference of African Examination Boards

51

52
8. CREATE Research Outputs Referenced in Text
1. Acedo, C., (2010) Expanding access to education with equity in South Asia, Prospects, Vol. 40, No. 3, ‘Universal primary education in South Asia: A right that remains elusive’ edited by R. Govinda and Manzoor
Ahmed
2. Ahmed, M. and Hossain, A., (2008) ‘Educational Access in Bangladesh’, Country Policy Brief, 2008.
Dhaka/Brighton: BU-IED/ University of Sussex
3. Ahmed, M. and Hossain, A., (2010) ‘Educational Access in Bangladesh’, Country research Summary.
Dhaka/Brighton: BU-IED/ University of Sussex.
4. Ahmed, M., (2011a) The Sector-wide Approach in Bangladesh Primary Education: A Critical View, CREATE
Pathways to Access Research Monograph No. 57. Dhaka: BRAC.
5. Ahmed, M., (2011b) Applying a Workable Education SWAP in Bangladesh, CREATE Bangladesh Policy Brief
No. 4, Dhaka, BU-IED
6. Ahmed, M., (2011c), Diverse Providers of Primary Education in Bangladesh, CREATE Bangladesh Policy Brief
No. 3, Dhaka, BU-IED
7. Ahmed, M., Ahmed, K. S., Khan, N. I. and Ahmed, R., (2007) Access to Education in Bangladesh: Country
Analytic Review of Primary and Secondary School. CREATE Country Analytic Review. Dhaka/Brighton: BU-
IED/ University of Sussex
8. Ahmed, M., and Govinda, R., (2010) Introduction, Universal primary education in South Asia: A right that remains elusive, Prospects, Vol. 40, No. 3, ‘Universal primary education in South Asia: A right that remains
elusive’ edited by R. Govinda and Manzoor Ahmed
9. Akaguri, L., (2010) Public and Private Schooling in Rural Ghana: Are the Poor Being Served?, CREATE Ghana
Policy Brief No. 3, Brighton, University of Sussex
10. Akyeampong, K., (2009) Revisiting Free Compulsory Universal Basic Education (FCUBE) in Ghana,
Comparative Education Special Issue (2009) Access to Education in Sub-Saharan Africa. Vol. 45 (2)
11. Akyeampong, K., (2010) 50 Years of Educational Progress and Challenge in Ghana. CREATE Pathways to
Access Research Monograph No. 33. Brighton: University of Sussex.
12. Akyeampong, K., Djangmah, J., Seidu, A., Oduro, A. and Hunt, F., (2007) Access to Basic Education in Ghana:
The Evidence and the Issues. CREATE Country Analytic Review. Winneba/ Brighton: The University of
Education at Winneba/ University of Sussex
13. Akyeampong, K., Djangmah, J., Seidu, A., Oduro, A. and Hunt, F., (2008) Educational Access in Ghana,
Country Policy Brief, 2008, Winneba/ Brighton: The University of Education at Winneba/ University of Sussex
14. Alexander, R., (2008) EFA, the Quality Imperative and the Problem of Pedagogy. CREATE Pathways to
Access Research Monograph No. 20. London: Institute of Education
15. Alhassan, S. and Adzahlie-Mensah, V., (2010) Teachers and Access to Schooling in Ghana. CREATE Pathways to Access Research Monograph No. 43. Winneba/Brighton: University of Education, Winneba/University of
Sussex
16. Al-Samarrai, S., (2007) Financing Basic Education in Bangladesh. CREATE Pathways to Access Research
Monograph No. 12. Brighton: University of Sussex
17. Ampiah, J. G. and Adu-Yeboah, C., (2009) Mapping the incidence of school dropouts: a case study of
communities in Northern Ghana, Comparative Education Special Issue (2009) Access to Education in Sub-
Saharan Africa. Vol. 45 (2)

53
18. Ampiah, J. G., and Adu Yeboah, C., (2011) Understanding the social and economic lives of never enrolled
children: a case study of communities in Northern and Southern Ghana, CREATE Pathways to Access Research
Monograph, Brighton and Cape Coast: University of Sussex and University of Cape Coast
19. Ananga, E. (2011a) Typology of School Dropout: the dimensions and dynamics of dropout in Ghana, Special
Edition of the International Journal and Educational Development (IJED) Access, Equity and Transitions in
Education in Low Income Countries Edited by Keith M. Lewin, Angela W. Little and Frances Hunt
20. Ananga, E. (2011b) Dropping Out of School in Southern Ghana: The Push-out and Pull-out Factors, CREATE
Pathways to Access Research Monograph No. 55. Brighton: University of Sussex
21. Ananga, E., (2010) Typologies of Drop Out in Southern Ghana, CREATE Ghana Policy Brief No. 1, Brighton,
University of Sussex
22. Arkoful, K., (2010) Complementary Education and Access to Primary Schooling in Northern Ghana, CREATE
Ghana Policy Brief No. 2, Brighton, University of Sussex
23. Aturupane, H., (2009) The Pearl of Great Price: achieving equitable access to primary and secondary education
and enhancing learning in Sri Lanka. CREATE Pathways to Access Research Monograph No. 29. London:
Institute of Education
24. Bandyopadhyay, M. and Subrahmanian, R., (2008) Gender Equity in Education: A Review of Trends and
Factors. CREATE Pathways to Access Research Monograph No. 18. Delhi/Brighton: NUEPA/University of
Sussex
25. Bandyopadhyay, M., and Behera, J., (2010) Pre Primary Education in India, CREATE India Policy Brief No. 1,
Delhi, NUEPA
26. Bandyopadhyay, M., and Dey, M., (2011) Effective School Management Committees, CREATE India Policy
Brief No. 4, Delhi, NUEPA
27. Bandyopadhyay, M., Das, D. and Zeitlyn, B., (2011) Absenteeism, Repetition and Silent Exclusion in India,
CREATE India Policy Brief No. 3, Delhi, NUEPA
28. Bandyopadhyay, M., Umabati, S., and Zeitlyn, B., (2011) Teachers and Teaching in India, CREATE India
Policy Brief No. 5, Delhi, NUEPA
29. Bermingham, D., (2011a) The Politics of Global Education Policy: the formation of the Education for All Fast
Track Initiative, Journal of Education Policy, Special Issue: Access to Basic Education in Sub Saharan Africa and South Asia Policies, Politics and Progress, edited by Angela W. Little and Keith M. Lewin
30. Bermingham, D., (2011b) EFA and the FTI in Rwanda and Ethiopia, CREATE Pathways To Access Research
Monograph, Consortium for Research on Educational Access, Transitions and Equity, Institute of Education,
London
31. Bloch, G., (2009) The Education Roadmap in South Africa, CREATE South Africa Policy Brief No. 2,
Johannesburg/Brighton: University of the Witwatersrand EPU/ University of Sussex
32. Blum, N., (2009) Small NGO schools in India: implications for access and innovation. Compare. Vol. 39 (2)
33. Blum, N. and Diwan, R., (2007) Small, Multigrade Schools and Increasing Access to Primary Education in
India: National Context and NGO Initiatives. CREATE Pathways to Access Research Monograph No. 17.
Delhi/London: NUEPA/ Institute of Education
34. Boakye Yiadom, L., (2011) Basic Education and Issues of Costs, Access, and Equity: Evidence from Ghana
(1991 – 2006) CREATE Pathways to Access Research Monograph No. 65. University of Sussex, Brighton
35. Buckland, S., (2011) From Policy to Practice: The challenges to Educational Access for non-Nationals in South
Africa, Special Edition of the International Journal and Educational Development (IJED) Access, Equity and

54
Transitions in Education in Low Income Countries Edited by Keith M. Lewin, Angela W. Little and Frances
Hunt
36. Buxton, C., (2011) The Relationship between malnutrition and educational achievement among school children
in Ghana, CREATE Pathways to Access Research Monograph, Brighton and Cape Coast: University of Sussex and University of Cape Coast
37. Cameron, S., (2010a) Access to and Exclusion from Primary Education in Slums of Dhaka, Bangladesh.
CREATE Pathways to Access Research Monograph No. 45. Brighton: University of Sussex
38. Cameron, S., (2010b), Education for the Urban Poor in Bangladesh, CREATE Bangladesh Policy Brief No. 1,
Brighton, University of Sussex
39. Cameron, S., (2011) Whether and where to enroll? Choosing a primary school in the slums of urban Dhaka,
Bangladesh, Special Edition of the International Journal and Educational Development (IJED) Access, Equity
and Transitions in Education in Low Income Countries Edited by Keith M. Lewin, Angela W. Little and Frances
Hunt
40. Chimombo, J., (2009) Changing patterns of access to basic education in Malawi: a story of a mixed bag?
Comparative Education Special Issue (2009) Access to Education in Sub-Saharan Africa. Vol. 45 (2)
41. Croft, A., (2010) Including Disabled Children in Learning: Challenges in Developing Countries. CREATE
Pathways to Access Research Monograph No. 36. Brighton: University of Sussex
42. Diwan, R., (2011) Exploring Small Schools in Multiple Contexts: A Review of Emerging Concerns in India,
CREATE Pathways to Access Research Monograph, Delhi/Brighton: NUEPA/University of Sussex
43. Djangmah, J. S., (2011) Inequitable Access to Basic education in Ghana: The Way Forward for FCUBE, CREATE Working paper No. 2. Brighton: University of Sussex
44. Dunne, M., Akyeampong, K. and Humphreys, S., (2007) School Processes, Local Governance and Community
Participation: Understanding Access. CREATE Pathways to Access Research Monograph No. 6. Brighton:
University of Sussex
45. Dunne, M., Bosumtwi, S., Sabates, R. and Owusu, A., (2010) Bullying and School Attendance: A Case Study of
Senior High School Students in Ghana. CREATE Pathways to Access Research Monograph No. 41. Brighton:
University of Sussex
46. Essuman, A. and Akyeampong, K., (2011) Decentralisation Policy in Practice in Ghana: the promise and reality
of community participation in education in two rural communities, Journal of Education Policy, Special Issue: Access to Basic Education in Sub Saharan Africa and South Asia Policies, Politics and Progress, edited by
Angela W. Little and Keith M. Lewin
47. Fleisch, B., Shindler, J and Perry, H., (2010) Who is out of school? Evidence from the Community Survey 2007,
South Africa, International Journal of Educational Development
48. Fleish, B. and Shindler, J., (2009a) School participation from ‘Birth-to-Twenty’: Patterns of schooling in an
urban child cohort study in South Africa. CREATE Pathways to Access Research Monograph No. 27.
Johannesburg/ Brighton: Wits EPU/ University of Sussex
49. Fleisch, B. and Shindler, J., (2009b) Gender repetition: school access, transitions and equity in the ‘Birth-to-Twenty’ cohort panel study in urban South Africa, Comparative Education Special Issue (2009) Access to
Education in Sub-Saharan Africa. Vol. 45 (2)
50. Giani, L., (2006) Migration and Education: Child Migrants in Bangladesh, Sussex Migration Working Paper no.
33, University of Sussex, Sussex Centre for Migration Research
51. Giffard-Lindsay, K., (2007) Inclusive Education in India: Interpretation, Implementation, and Issues. CREATE
Pathways to Access Research Monograph No. 15. Brighton: University of Sussex

55
52. Gilmour, D. and Soudien, C., (2009) Learning and equitable access in the Western Cape, South Africa,
Comparative Education Special Issue (2009) Access to Education in Sub-Saharan Africa. Vol. 45 (2)
53. Ginsburg, C., Richter, L. M., Fleisch, B. and Norris, S. A., (2010) An analysis of associations between
residential and school mobility and educational outcomes in South African urban children: The Birth to Twenty cohort
54. Govinda, R. and Bandyopadhyay, M., (2008) Access to Elementary Education in India: Country Analytical
Review. CREATE Country Analytic Review. Delhi/Brighton: NUEPA/ University of Sussex
55. Govinda, R. and Bandyopadhyay, M., (2009a) Changing Framework of Local Governance and Community
Participation in Elementary Education. CREATE Pathways to Access Research Monograph No. 35.
Delhi/Brighton: NUEPA/University of Sussex
56. Govinda, R. and Bandyopadhyay, M., (2009b) Educational Access in India, Country Policy Brief, 2008,
Delhi/Brighton: NUEPA/ University of Sussex
57. Govinda, R., and Bandyopadhyay, M., (2010a) Educational Access in India, Country Research Summary,
Delhi/Brighton: NUEPA/ University of Sussex
58. Govinda, R., and Bandyopadhyay, M., (2010b) Social exclusion and school participation in India: Expanding
access with equity, Prospects, Vol. 40, No. 3, ‘Universal primary education in South Asia: A right that remains
elusive’ edited by R. Govinda and Manzoor Ahmed
59. Govinda, R. and Bandyopadhyay, M., (2011) Overcoming Exclusion through School Quality, CREATE
Pathways to Access Research Monograph Delhi/Brighton: NUEPA/University of Sussex
60. Hadley, S., (2009) Seasonality and Access to Education: the case of primary education in sub-Saharan Africa. CREATE Pathways to Access Research Monograph No. 31. London: Institute of Education
61. Härmä, J., (2010) School choice for the poor? The limits of marketisation of primary education in rural India.
CREATE Pathways to Access Research Monograph No. 23. Brighton: University of Sussex
62. Härmä, J, (2011) Low Cost Private schooling in India: is it pro poor and equitable? Special Edition of the
International Journal and Educational Development (IJED) Access, Equity and Transitions in Education in
Low Income Countries Edited by Keith M. Lewin, Angela W. Little and Frances Hunt
63. Härmä, J., and Zeitlyn, B., (2011) The Limits of Marketisation of Primary Education in India, CREATE India
Policy Brief No. 2, Brighton, University of Sussex
64. Heissler, K., (2008) Children’s migration for work in Bangladesh: The extra- and intra-household factors that
shape ‘choice’ and ‘decision-making’, Childhoods Today, Vol. 2, Issue 1
65. Hoppers, W., (2011) The Politics of Diversifying Basic Education Delivery: a comparative analysis from East
Africa, Journal of Education Policy, Special Issue: Access to Basic Education in Sub Saharan Africa and South
Asia Policies, Politics and Progress, edited by Angela W. Little and Keith M. Lewin
66. Hossain, A., (2010) Age in Grade Congruence and Progression in Basic Education in Bangladesh. CREATE
Pathways to Access Research Monograph No. 48. Dhaka/Brighton: BRAC/University of Sussex
67. Hossain, A. and Zeitlyn, B., (2010), Poverty and Equity: Access to Education in Bangladesh, CREATE Pathways to Access Research Monograph No. 51. Dhaka/Brighton: BRAC/University of Sussex
68. Hunt, F., (2008) Dropping Out from School: A Cross Country Review of the Literature. CREATE Pathways to
Access Research Monograph No. 16. Brighton: University of Sussex
69. Hunt, F. and Lewin K. M., (2009) Dropping out from School, CREATE Policy Brief No 8, Brighton, University
of Sussex

56
70. Jaffer, K., (2010) School inspection and supervision in Pakistan: Approaches and issues, Prospects, Vol. 40, No.
3, ‘Universal primary education in South Asia: A right that remains elusive’ edited by R. Govinda and Manzoor
Ahmed
71. Juneja, N., (2010) Access to What? Access, Diversity & Participation in India’s schools. Pathways to Access Research Monograph No. 32. Delhi/Brighton: NUEPA/University of Sussex
72. Kumar, V. J., (2010) Access and Activity Based Learning - A Transition in Tamil Nadu, Date: 29 June 2010
Public lecture, LIDC, London, UK
73. Lafon, M., (2009) The Impact of Language Issues on Educational Access in South Africa. CREATE Pathways
to Access Research Monograph No. 24. Johannesburg/ Brighton: Wits EPU/ University of Sussex
74. Lall, M., (2007) A Review of Concepts from Policy Studies Relevant to the Analysis of EFA in Developing
Countries. CREATE Pathways to Access Research Monograph No. 11. London: Institute of Education
75. Laugharn, P., (2007) Negotiating Education for Many: Enrolment, Dropout and Persistence in the Community Schools of Kolondieba, Mali. CREATE Pathways to Access Research Monograph No. 14. London: Institute of
Education
76. Letatsi, S., (2011) Arriving at the Chalk Face: A Day in the Life in Ekurhuleni Schools’ in Motala, S., Dieltens,
V., and Sayed, Y., (eds.) (2011) Finding Place and Keeping Pace, Exploring Meaningful and Equitable Access in South African Schools, University of the Witwatersrand, Johannesburg
77. Lewin, K. M., (2007a) Improving Access, Equity and Transitions in Education: Creating a Research Agenda.
CREATE Pathways to Access Research Monograph No. 1. Brighton: University of Sussex
78. Lewin, K. M., (2007b) Expanding Access to Secondary Schooling in Sub-Saharan Africa: Key Planning and Finance Issues. CREATE Pathways to Access Research Monograph No. 8. Brighton: University of Sussex
79. Lewin, K. M., (2007c) Why some Education for All and millennium development goals will not be met:
Difficulties with goals and targets. Southern African Review of Education. Vol. 13 (2)
80. Lewin, K. M., (2007d) Long Term Planning for EFA and the MDGs: Modes and Mechanisms. CREATE
Pathways to Access Research Monograph No. 7. Brighton: University of Sussex
81. Lewin, K. M., (2007e) The Limits to Growth of Non-Government Private Schooling in Sub Saharan Africa.
CREATE Pathways to Access Research Monograph No. 5. Brighton: University of Sussex
82. Lewin, K. M., (2008a) Reconceptualising Access to Education, CREATE Policy Brief No 1, Brighton, University of Sussex
83. Lewin, K. M., (2008b) Policy Brief No 2: Access, Age and Grade, CREATE Policy Brief No 2, Brighton,
University of Sussex
84. Lewin, K. M., (2009) Access to education in sub-Saharan Africa: patterns, problems and possibilities
Comparative Education Special Issue (2009) Access to Education in Sub-Saharan Africa. Vol. 45 (2)
85. Lewin, K. M., (2011a) Target Setting and Target Getting in EFA Policy and in EFA Practice, Journal of Education Policy, Special Issue: Access to Basic Education in Sub Saharan Africa and South Asia Policies,
Politics and Progress, edited by Angela W. Little and Keith M. Lewin
86. Lewin, K. M., (2011b) Beyond Universal Access to Elementary Education in India: Is it Achievable at
Affordable Costs? CREATE Pathways to Access Research Monograph No. 53. Brighton: University of Sussex
87. Lewin, K. M., (2011c) Expanding Access to Secondary Education: Can India Catch Up? Special Edition of the
International Journal and Educational Development (IJED) Access, Equity and Transitions in Education in
Low Income Countries Edited by Keith M. Lewin, Angela W. Little and Frances Hunt

57
88. Lewin, K. M., (2011d) Taking Targets to Task Revisited: How Indicators of Progress on Access to Education
can Mislead, CREATE Pathways to Access Research Monograph No. 54. Brighton: University of Sussex
89. Lewin, K. M. and Akyeampong, K., (2009) Education in sub-Saharan Africa: researching access, transitions and
equity (editorial), Comparative Education Special Issue (2009) Access to Education in Sub-Saharan Africa. Vol. 45 (2)
90. Lewin, K. M. and Sabates, R., (2011) Changing Patterns of Access to Education in Anglophone and
Francophone Countries in Sub Saharan Africa: Is Education for All Pro-Poor? CREATE Pathways to Access
Research Monograph No. 52. Brighton: University of Sussex
91. Lewin, K. M. and Sayed, Y., (2005) Non-government Secondary Schooling in Sub-Saharan Africa: Exploring
the Evidence in South Africa and Malawi. Researching the Issues. London: DFID
92. Little, A. W., (2008a) EFA Politics, Policies and Progress. CREATE Pathways to Access Research Monograph
No. 13. London: Institute of Education
93. Little, A. W., (2008b) Size Matters for EFA. CREATE Pathways to Access Research Monograph No. 26.
London: Institute of Education
94. Little, A. W., (2010a) Access to Basic Education in Ghana: politics, policies and progress. CREATE Pathways
to Access Research Monograph No. 42. London: Institute of Education
95. Little, A. W., (2010b) Access to Elementary Education in India: Politics, Policies and Progress. CREATE
Pathways to Access Research Monograph No. 44. London: Institute of Education
96. Little, A. W., (2010c) The Politics, Policies and Progress of Basic Education in Sri Lanka. CREATE Pathways
to Access Research Monograph No. 38. London: Institute of Education
97. Little, A. W., (2011) Education Policy Reform in Sri Lanka: the double-edged sword of political will, Journal of Education Policy, Special Issue: Access to Basic Education in Sub Saharan Africa and South Asia Policies,
Politics and Progress, edited by Angela W. Little and Keith M. Lewin
98. Little, A. W. and Blum, N., (2008a) Increasing Access through Multigrade Teaching and Learning, CREATE
Policy Brief No 5, Brighton, University of Sussex
99. Little, A., W. and Blum, N. (2008b) Size Matters for EFA, CREATE Policy Brief No 4, Brighton, University of
Sussex
100. Little, A. W., Indika, U. and Rolleston, C., (2011) Access, Attendance and Achievement in rural schools in Sri Lanka, CREATE Pathways to Access Research Monograph, Consortium for Research on Educational Access,
Transitions and Equity, Institute of Education, London
101. Lohani, S., Balak Singh, R., and Lohani, J., (2010) Universal primary education in Nepal: Fulfilling the right to
education, Prospects, Vol. 40, No. 3, ‘Universal primary education in South Asia: A right that remains elusive’
edited by R. Govinda and Manzoor Ahmed
102. Motala, S., (2009) Privatising public schooling in post-apartheid South Africa – equity considerations. Compare.
Vol. 39 (2)
103. Motala, S. and Dieltens, V., (2008b) Educational Access in South Africa, Country Policy Brief, 2008, Johannesburg/Brighton: University of the Witwatersrand EPU/ University of Sussex
104. Motala, S. and Dieltens, V., (2010) Educational Access in South Africa, Country Research Summary,
Johannesburg/Brighton: University of the Witwatersrand EPU/ University of Sussex
105. Motala, S. and Dieltiens, V., (2008a) Caught in the ideological crossfire: private schooling in South Africa.
Southern African Review of Education. Vol. 14 (3)

58
106. Motala, S., and Sayed, Y., (2009) “No fee” schools in South Africa, CREATE South Africa Policy Brief No. 1,
Johannesburg/Brighton: University of the Witwatersrand EPU/ University of Sussex
107. Motala, S., Dieltiens, V. and Sayed, Y., (2009) Physical access to schooling in South Africa: mapping dropout,
repetition and age-grade progression in two districts, Comparative Education Special Issue (2009) Access to Education in Sub-Saharan Africa. Vol. 45 (2)
108. Motala, S., Dieltiens, V., Carrim, N., Kgobe, P., Moyo, G. and Rembe, S., (2007) Educational Access in South
Africa: Country Analytic Report. CREATE Country Analytic Review. Johannesburg/Brighton: University of the
Witwatersrand EPU/ University of Sussex
109. Mwanza, A., (2011) Re-entry to school after giving birth: an evaluation of the process used to design and implement policy in Zambia, CREATE Pathways To Access Research Monograph, Consortium for Research on
Educational Access, Transitions and Equity, Institute of Education, London
110. Obanya, P., (2011) Politics and the Dilemma of Meaningful Access to Education: The Nigerian Story, CREATE
Pathways to Access Research Monograph No. 55. Brighton: University of Sussex
111. Ohba, A., (2009) Does free secondary education enable the poor to gain access? A study from rural Kenya.
CREATE Pathways to Access Research Monograph No. 21. Brighton: University of Sussex
112. Ohba, A., (2011) The Abolition of Secondary School Fees in Kenya: Responses by the poor, Special Edition of
the International Journal and Educational Development (IJED) Access, Equity and Transitions in Education in
Low Income Countries Edited by Keith M. Lewin, Angela W. Little and Frances Hunt
113. Oketch, M. and Rolleston, C., (2007a) Policies on Free Primary and Secondary Education in East Africa.
CREATE Pathways to Access Research Monograph No. 10. London: Institute of Education
114. Oketch, M. and Rolleston, C., (2007b) Policies on Free Primary and Secondary Education in East Africa:
Retrospect and Prospect. Review of Research in Education. Vol. 31
115. Oketch, M. and Somerset, A., (2010) Free Primary Education and After in Kenya: Enrolment impact, quality
effects, and the transition to secondary school. CREATE Pathways to Access Research Monograph No. 37.
London: Institute of Education/University of Sussex
116. Pereira, C., (2010) Access to Learning - Mathematics Performance in Schools in Gauteng and Eastern Cape,
CREATE South Africa Policy Brief No. 3, Johannesburg/Brighton: University of the Witwatersrand EPU/
University of Sussex
117. Pridmore, P., (2007) The Impact of Health on Education Access and Achievement: A Cross-National Review of the Research Evidence. CREATE Pathways to Access Research Monograph No. 2. London: Institute of
Education
118. Pridmore, P., and Hunt, F., (2008) Impact of Health in Education Access and Achievement, CREATE Policy
Brief No 3, Brighton, University of Sussex
119. Reddy, A. and Sinha S., (2010) School Dropouts or Pushouts? Overcoming Barriers for the Right to Education.
Pathways to Access Research Monograph No. 40. Delhi/Brighton: NUEPA/ University of Sussex
120. Rolleston, C., (2009a) Human Capital, Poverty, Educational Access and Exclusion: The Case of Ghana 1991-
2006. CREATE Pathways to Access Research Monograph No. 22. London: Institute of Education
121. Rolleston, C., (2009b) The determination of exclusion: evidence from the Ghana Living Standards Surveys
1991–2006, Comparative Education Special Issue (2009) Access to Education in Sub-Saharan Africa. Vol. 45
(2)
122. Rolleston, C., (2010) Fosterage and Educational Access Among the Dagomba of Savelugu-Nanton, Ghana,
CREATE Ghana Policy Brief No. 5, London, Institute of Education

59
123. Rolleston, C., (2011) Educational Access and Poverty Reduction: The Case of Ghana 1991-2006, Special
Edition of the International Journal and Educational Development (IJED) Access, Equity and Transitions in
Education in Low Income Countries Edited by Keith M. Lewin, Angela W. Little and Frances Hunt
124. Rolleston, C., Akyeampong, K. and Ampiah, J. G., (2011) Access to Basic Education in Ghana, a Synthesis of CREATE Research, CREATE Pathways to Access Research Monograph, Brighton: University of Sussex
125. Rolleston, C. and Oketch, M., (2008) Educational Expansion in Ghana: Economic Assumptions and
Expectations. International Journal of Educational Development. Vol. 28
126. Rolleston, C., Akyeampong, K., Ampiah, J., G. and Lewin, K. M. (2010) Educational Access in Ghana, Country
Policy Brief, 2008, Cape Coast/ Brighton: The University of Cape Coast/ University of Sussex
127. Rose, P., (2007a) NGO Provision of Basic Education: Alternative or Complementary Service Delivery to
Support Access to the Excluded? CREATE Pathways to Access Research Monograph No. 3. Brighton:
University of Sussex
128. Rose, P., (2007b) Supporting Non-state Providers in Basic Education Service Delivery. CREATE Pathways to
Access Research Monograph No. 4. Brighton: University of Sussex
129. Sabates, R., Hossain, A. and Lewin, K. M., (2010) School Drop Out in Bangladesh: New Insights from
Longitudinal Evidence CREATE Pathways to Access Research Monograph No. 48. Dhaka/Brighton:
BRAC/University of Sussex
130. Sabates, R. Westbrook, J., and Hernandez, J., (2011a) The 1977 Universal Primary Education in Tanzania: A
historical base for quantitative enquiry, International Journal of Research & Method in Education
131. Sabates, R. and Hernandez, J., (2011) The role of maternal education during educational expansion for children in Sub-Saharan Africa, CREATE Pathways to Access Research Monograph, Brighton: University of Sussex
132. Sabates, R., Westbrook, J. and Hernandez, J., (2011b) The 1977 Universal Primary Education Reform in
Tanzania: A historical base for quantitative enquiry, CREATE Pathways to Access Research Monograph,
Brighton: University of Sussex
133. Sabur, Z. and Ahmed, M., (2010a) Debating Diversity in Provision of Universal Primary Education in
Bangladesh. CREATE Pathways to Access Research Monograph No. 34. Dhaka/Brighton: BRAC/University of
Sussex
134. Sabur, Z., and Ahmed, M., (2010b) Multiple providers and access to primary education: The case of
Bangladesh, Prospects, Vol. 40, No. 3, ‘Universal primary education in South Asia: A right that remains elusive’ edited by R. Govinda and Manzoor Ahmed
135. Sedwal, M. and Kamat, S., (2008) Education and Social Equity: With a Special Focus on Scheduled Castes and
Scheduled Tribes in Elementary Education. CREATE Pathways to Access Research Monograph No. 19.
Delhi/Brighton: NUEPA/University of Sussex
136. Sen, A., (2010) Primary schooling in West Bengal, Prospects, Vol. 40, No. 3, ‘Universal primary education in
South Asia: A right that remains elusive’ edited by R. Govinda and Manzoor Ahmed
137. Sharma, A., (2011) South Asian Nomads - A Literature Review, CREATE Pathways to Access Research
Monograph No. 58. Brighton: University of Sussex
138. Shindler, J., (2010) Characteristics of Out-of-School Children of Compulsory School Age in South Africa: What
the Community Survey 2007 shows, CREATE Working Paper 1, University of Sussex, Brighton
139. Siddhu, G., (2011) Who makes it to secondary school? Determinants of transition to secondary schools in rural
India, Special Edition of the International Journal and Educational Development (IJED) Access, Equity and
Transitions in Education in Low Income Countries Edited by Keith M. Lewin, Angela W. Little and Frances
Hunt

60
140. Siddhu, G., (2010) Can Families in Rural India Bear the Additional Burden of Secondary Education?
Investigating the Determinants of Transition, CREATE Pathways to Access Research Monograph No. 50.
Brighton: University of Sussex
141. Smita, (2008) Distress Seasonal Migration and its Impact on Children’s Education in India. CREATE Pathways to Access Research Monograph No. 28. Delhi/Brighton: NUEPA/ University of Sussex
142. Somerset, A., (2007) A Preliminary Note on Kenya Primary School Enrolment Trends over Four Decades.
CREATE Pathways to Access Research Monograph No. 9. Brighton: University of Sussex
143. Somerset, A., (2009) Universalising primary education in Kenya: the elusive goal, Comparative Education
Special Issue (2009) Access to Education in Sub-Saharan Africa. Vol. 45 (2)
144. Somerset, A., (2011) Access, Cost and Quality: tensions among three goals in the development of primary
education in Kenya, Journal of Education Policy, Special Issue: Access to Basic Education in Sub Saharan
Africa and South Asia Policies, Politics and Progress, edited by Angela W. Little and Keith M. Lewin
145. Sood, N., (2009) The Impact of Malnutrition on Cognition and the Education of Children in India: A Review of
Research Evidence. CREATE Pathways to Access Research Monograph No. 25. Delhi/Brighton:
NUEPA/University of Sussex
146. Taylor, N, Mabogoane, T, Shindler, J and Akoobhai, B., (2010) Seeds of Their Struggle: The Features of Under-
and Overage Enrolment Among Grade 4 Learners in South Africa. CREATE Pathways to Access Research
Monograph No. 47. Johannesburg/ Brighton: Wits EPU/ University of Sussex
147. Turrent, V., (2009) Expanding Support for Education in Fragile States: what role for Fast Track Initiative?
CREATE Pathways to Access Research Monograph No. 30. London: Institute of Education
148. Turrent, V., (2011) Financing Access and Participation in Primary Education: Is there a ‘Fast-Track’ for Fragile
States? Special Edition of the International Journal and Educational Development (IJED) Access, Equity and
Transitions in Education in Low Income Countries Edited by Keith M. Lewin, Angela W. Little and Frances
Hunt
149. Wang, X. G., (2010) Girls’ Access to Education in China: Actors, Cultures and the Windmill of Development
Management. CREATE Pathways to Access Research Monograph No. 39. London: Institute of Education
150. Ward, M., (2011) Aid to Education: the case of Sarva Shiksha Abhiyan in India and the role of development
partners, Journal of Education Policy, Special Issue: Access to Basic Education in Sub Saharan Africa and
South Asia Policies, Politics and Progress, edited by Angela W. Little and Keith M. Lewin
151. Williams, S. E., (2010) Exploring the Viability of School-Based Support for Vulnerable Children: A case study
of two township schools in Johannesburg. CREATE Pathways to Access Research Monograph No. 46.
Johannesburg/ Brighton: Wits EPU/ University of Sussex
152. Zeitlyn, B., (2010) Equity and Access to Education in Bangladesh, CREATE Bangladesh Policy Brief No. 2,
Brighton, University of Sussex
153. Zeitlyn, B., (2011) Preventing Dropout in Bangladesh, CREATE Bangladesh Policy Brief No. 6, Brighton,
University of Sussex
154. Zeitlyn, B. and Hossain, A., (2011) Access to Education and Age in Grade in Bangladesh, CREATE Bangladesh Policy Brief No. 5, Brighton, University of Sussex

61

Address for Correspondence: CREATE, Centre for International Education Department of Education, School of Education & Social Work Essex House, University of Sussex Falmer, BN1 9QQ, UK. Website: http://www.create-rpc.org Email: [email protected]