researcharticle … · reexaminingsamplesizerequirementsfor multivariate,abundance-basedcommunity...
TRANSCRIPT

RESEARCH ARTICLE
Reexamining Sample Size Requirements forMultivariate, Abundance-Based CommunityResearch: When Resources are Limited, theResearch Does Not Have to BeFrank L. Forcino1*, Lindsey R. Leighton2, Pamela Twerdy2, James F. Cahill3
1 Western Carolina University, Geosciences and Natural Resources Department, 331 Stillwell Building,Cullowhee, NC, United States of America, 28723, (828) 227–7367, fax: (828) 227–7647, 2 University ofAlberta, Earth & Atmospheric Sciences, 1–26 Earth Sciences Building, Edmonton, AB, Canada, T6G 2E3,3 University of Alberta, Department of Biological Sciences, CW 405, Biological Sciences Building,Edmonton, AB, Canada, T6G 2E9
AbstractCommunity ecologists commonly perform multivariate techniques (e.g., ordination, cluster
analysis) to assess patterns and gradients of taxonomic variation. A critical requirement for
a meaningful statistical analysis is accurate information on the taxa found within an ecologi-
cal sample. However, oversampling (too many individuals counted per sample) also comes
at a cost, particularly for ecological systems in which identification and quantification is sub-
stantially more resource consuming than the field expedition itself. In such systems, an in-
creasingly larger sample size will eventually result in diminishing returns in improving any
pattern or gradient revealed by the data, but will also lead to continually increasing costs.
Here, we examine 396 datasets: 44 previously published and 352 created datasets. Using
meta-analytic and simulation-based approaches, the research within the present paper
seeks (1) to determine minimal sample sizes required to produce robust multivariate statisti-
cal results when conducting abundance-based, community ecology research. Furthermore,
we seek (2) to determine the dataset parameters (i.e., evenness, number of taxa, number of
samples) that require larger sample sizes, regardless of resource availability. We found that
in the 44 previously published and the 220 created datasets with randomly chosen abun-
dances, a conservative estimate of a sample size of 58 produced the same multivariate re-
sults as all larger sample sizes. However, this minimal number varies as a function of
evenness, where increased evenness resulted in increased minimal sample sizes. Sample
sizes as small as 58 individuals are sufficient for a broad range of multivariate abundance-
based research. In cases when resource availability is the limiting factor for conducting a
project (e.g., small university, time to conduct the research project), statistically viable re-
sults can still be obtained with less of an investment.
PLOS ONE | DOI:10.1371/journal.pone.0128379 June 9, 2015 1 / 18
a11111
OPEN ACCESS
Citation: Forcino FL, Leighton LR, Twerdy P, CahillJF (2015) Reexamining Sample Size Requirementsfor Multivariate, Abundance-Based CommunityResearch: When Resources are Limited, theResearch Does Not Have to Be. PLoS ONE 10(6):e0128379. doi:10.1371/journal.pone.0128379
Academic Editor: Covadonga Orejas, InstitutoEspañol de Oceanografía, SPAIN
Received: January 2, 2015
Accepted: April 24, 2015
Published: June 9, 2015
Copyright: © 2015 Forcino et al. This is an openaccess article distributed under the terms of theCreative Commons Attribution License, which permitsunrestricted use, distribution, and reproduction in anymedium, provided the original author and source arecredited.
Data Availability Statement: Most relevant data arewithin the paper and its Supporting Information files.The previously published datasets are all availablefrom the references included within our paper.
Funding: NSF grant EAR-0746072 to Leightonfunded a portion of Forcino's PhD during part of thetime of this research. The remaining portion of theresearch was funded by internal funds from theUniversity of Alberta.
Competing Interests: The authors have declaredthat no competing interests exist.

IntroductionCommunity ecologists commonly perform multivariate techniques (e.g., ordination, clusteranalysis) to assess patterns and gradients of taxonomic variation [1–6]. Due to the enormousnumber of individuals in most ecological communities, ecologists typically rely on a collectedsample that is representative of the complete natural system as opposed to collecting everythingwithin a natural system [7–15]. This fundamental unit of sampling must contain a sufficientnumber of individuals; otherwise it may misrepresent the natural system leading to erroneousconclusions. For the purposes of this paper, the fundamental unit of sampling or the numberof individuals per sample will be called sample size—the total number of individual specimenscomprising one row of data in a taxon-sample matrix used for multivariate communityanalysis.
Determining a minimum representative sample size at which the results of a communityanalysis would be unchanged from those obtained with larger sample sizes has thus been amajor practical concern for ecologists [16–20]. Here, we determine the smallest required sam-ple size at which a statistically robust result can be achieved using multivariate statisticaltechniques.
Although researchers must collect a sample size that is large enough to be representative,once that sample size has been obtained, additional samples should not alter the outcome of amultivariate analysis, and such additional material can be considered a form of over-sampling.When the cost—in time, money, or other resources—of collecting or identifying individualswithin a sample is nominal, oversampling may not be an issue. However, there are many situa-tions in which oversampling results in significant increased costs, with little improvement inthe ability to answer specific ecological questions. Thus, it is important to provide ecologistswith guidelines regarding when smaller sample sizes can be used and still retain a statisticallyrobust analysis.
Three instances when it would be beneficial to know that a smaller sample size is as statisti-cally robust as larger sample sizes are (1) if the researcher is limited by funds. (2) Time may bea limiting factor in some research projects for a number of possible reasons. One commoncause for a limit on time is when conducting a research project with an undergraduate student[21,22]. In addition, professors in academic settings typically only have four to five months outof the year with no teaching requirements. Furthermore, there may be some types of data thatcan only be sampled during a short time span. (3) There are cases in which data have alreadybeen collected by previous researchers. Those data may previously have been discarded fromsubsequent meta-analyses because the sample size was believed to be too small. So, if we candemonstrate that smaller sample sizes are sufficient, it could open up the use of these legacydata for additional ecological analyses.
The present study is aimed at the situations in which the above-discussed factors are limitedand thus the project may benefit from knowing if smaller representative samples are as statisti-cally robust as larger sample sizes. Here, our goal is to determine the smallest sample size thatcan be collected and used in multivariate, abundance-based ecological research.
Previous research has determined appropriate sample sizes for many types of ecological re-search by examining the probability of acquiring species that comprise some proportion of asample with 95% confidence [23,16,24,17,18,25]. In other words, how likely is a sample to con-tain taxon Z if a sample size of Y individuals is collected? However, determining sample size inthis manner is most often used for the purpose of assessing and comparing diversity amongsamples. Although this is important, these approaches do not take into account ecological rela-tionships among sampling units or taxa. Other workers have compared multivariate results ofplots or samples collected at different sample sizes to determine which sample size perform
Sample Size for Multivariate, Community Research
PLOS ONE | DOI:10.1371/journal.pone.0128379 June 9, 2015 2 / 18

best using multivariate techniques [26,12,27,19], but no one has examined this on a large scale,using multiple types of ecological data and multiple published community datasets. Moreover,determining which sample size provides maximum information may not actually be relevantto the goal of a community ecology study. For many studies, the question of interest is how dif-ferent communities relate to each other and how or whether a given environmental variable in-fluences the communities. For such studies, an important question is how small can the samplesize can be and still produce robust multivariate statistical results?
Forcino (2012) conducted a meta-analysis of 30 fossil community datasets and found that amedian sample size of 50 individuals is sufficient for producing robust multivariate statisticalresults when conducting abundance-based research. Here, using methods similar to Forcino(2012), we examine 396 datasets, 44 previously published, modern datasets and 352 createddatasets. Using meta-analytic and simulation approaches, the present research seeks (1) to de-termine minimal sample sizes required to produce robust multivariate statistical results whenconducting abundance-based community ecology research. Furthermore, we seek (2) to deter-mine the dataset parameters (i.e., evenness, number of taxa, number of samples) that requirelarger sample sizes, regardless of resource availability. We recognize that these specific forms ofmultivariate analyses are not the only ones used; however, they are used commonly in commu-nity ecology, and thus using this novel approach can provide important insight for ecologists[7,8,4]. Evidence relevant to goal (1) will provide ecologists with a more accurate estimate ofthe minimum representative number of individuals for multivariate research, and lead to a bet-ter use of resources. Accomplishing goal (2) will inform ecologists when greater resources arenecessary to obtain a statistically robust sample of a community.
Materials and Methods
Previously published datasetsIn order to test if smaller samples sizes could produce the same results originally obtained fromprevious research, 44 real datasets were acquired from the ecological literature (Table 1). Thesedatasets comprise a range of numbers of taxa (3 to 421) and samples (4 to 445), were from dif-ferent taxonomic groups, different geographic locations, different environments, and publishedby different authors (Table 1). In addition, 18 datasets were gathered from one meta-analysis[28]. Twenty additional studies from other journals were also used in the analysis (Table 1).Working backward through time of publication, we selected and subsampled the first 44 data-sets that had median sample sizes of at least 20 individuals.
Created datasetsGradient Analysis. To determine if smaller sample sizes are sufficient for datasets with
properties outside the ranges of the 44 previously published datasets examined, we created 352datasets. Our goal was not to examine all possible datasets that could exist in nature, but tocomplement the 44 previously published, real datasets by creating datasets with parametersthat did not consistently exist among any the 44 real datasets (e.g., sample sizes larger than1000 individuals per sample). This allowed us to have a greater number of datasets with certainparameters (e.g., high evenness) to further gauge the required sample size for those datasets orsamples with those parameters. Similar to the real datasets, the created datasets contained arange of numbers of taxa and samples (Table 2). The number of datasets created balances thecomputer time needed to subsample each dataset with the new information gained from add-ing more datasets.
Two protocols were used for the constructions of the created datasets: 220 datasets were cre-ated using a simple random simulation, and 132 were created by keeping each sample at a
Sample Size for Multivariate, Community Research
PLOS ONE | DOI:10.1371/journal.pone.0128379 June 9, 2015 3 / 18

Table 1. A list of the 44 previously published datasets (some of the citations contain multiple datasets) including original characteristics of thecomplete dataset.
Citation MedianSample Size
Number ofSamples
Number ofTaxa
MeanEvenness
Environment PrimaryTaxonomicGroup
Geographic Location
Beehler 1983 [44] 97 8 31 0.72 Forest Birds and plants Papua New Guinea
Arthur et al. 1976 [45] 85 38 17 0.74 Lake Parasites Yukon, Canada
Cause et al. 2011 [46] 20 43 53 0.74 Subtidal marine Parasites Dumont d’Urville Sea(East Antarctica)
Wong et al. 2004 [47] 24812 12 13 0.46 Fresh waterstreams
Invertebrates Kent, Uk, andMississippi, USA
VanNimwegen et al.2008 [48]
75 4 7 0.69 Grasslands Prairie dogs Kansas, USA
Ieno and Bastido 1998[49]
853 7 13 0.75 Benthic marine Bivalves andploychaetes
Samborombon Bay,Argentina
Kinnunen and Tiainen1999 [50]
147 40 7 0.59 Farmland Beetles Finland
Nicolaidou et al. 2006[51]
890 18 48 0.64 Benthic lagoon Bivalves Ionian Sea, Greece
Arai and Mudry 1983[52]
114 17 53 0.83 River Fish and parasites British Columbia,Canada
Peres 1997 [53] 110 12 12 0.94 Forest Primates Brazil
Dahle et al. 1998 [54] 944 15 421 0.70 Benthic brackish Marineinvertebrates
Pechora Sea, Russia
Repecka andMileriene 1991 [55]
511 19 20 0.95 Marine Fish Kursia Bay, Lithuania
Hughes and Thomas1971 [56]
94 16 16 0.69 Benthic Estuary Bivalves Prince Edward Island,Canada
Hughes and Thomas1971 [56]
76 21 18 0.67 Benthic Estuary Bivalves Prince Edward Island,Canada
Hughes and Thomas1971[56]
235.5 14 14 0.51 Benthic Estuary Bivalves Prince Edward Island,Canada
Hughes and Thomas1971[56]
648 51 51 0.72 Benthic Estuary Bivalves Prince Edward Island,Canada
Ryu et al. 2011 [35] 4939 7 36 0.53 Benthic marine tobrackish
Benthic animals Incheon North Harbor,Korea
Skrodowski andPorowski 2000 [57]
210 25 22 0.73 Pine forest Beetles Poland
Snow and Snow 1971[58]
146 13 65 0.76 Neotropical forest Birds Trinadad
Snow and Snow 1988[59]
234 7 12 0.50 Mixed terrestrial Birds and plants England
Snow and Snow 1971[58]
1674 9 35 0.70 Neotropical forest Birds Trinadad
Ulrich and Zalewski2006 [60]
145 11 17 0.76 Lake Islands Beetles Multiple
Dechitar 1972 [61] 338 31 144 0.93 Lake Parasites Ontario, Canada
Anderson et al. 2011[62]
850.5 42 39 0.52 Northern mixedprairie
Grassland plants Montana, USA
Anderson et al. 2011[62]
9.5 10 6 0.80 Northern mixedprairie
Grassland plants Montana, USA
Anderson et al. 2011[62]
261 25 15 0.50 Northern mixedprairie
Grassland plants Montana, USA
Anderson et al. 2011[62]
52 29 14 0.50 Northern mixedprairie
Grassland plants Montana, USA
(Continued)
Sample Size for Multivariate, Community Research
PLOS ONE | DOI:10.1371/journal.pone.0128379 June 9, 2015 4 / 18

constant 200 individuals and systematically altering the abundance structure of each sample.We explain each of these two processes in detail below.
For the first 220 created datasets, we followed a simple random selection protocol to createthe datasets in order to obtain additional samples that were comparable to the previously pub-lished datasets. Datasets were simulated by first randomly creating a normal distribution ofabundances for each taxon across a hypothetical gradient (S1 Fig). Each normal distributionfor each taxon was created based on a randomly chosen mean, randomly chosen standard devi-ation, and randomly chosen maximum possible abundance. The resulting distribution repre-sents the range along an ecological or environmental gradient within which each simulatedtaxon is located. Each simulated taxon has a peak possible abundance, and areas along the gra-dient where the taxon is less likely to be found (the tails of the normal distribution with a lowerabundance). For example, if the hypothetical gradient represents water depth, the randomly
Table 1. (Continued)
Citation MedianSample Size
Number ofSamples
Number ofTaxa
MeanEvenness
Environment PrimaryTaxonomicGroup
Geographic Location
Anderson et al. 2011[62]
29 42 31 0.55 Northern mixedprairie
Grassland plants Montana, USA
Anderson et al. 2011[62]
35 39 17 0.44 Northern mixedprairie
Grassland plants Montana, USA
Anderson et al. 2011[62]
29 42 41 0.63 Northern mixedprairie
Grassland plants Montana, USA
Anderson et al. 2011[62]
118 37 46 0.50 Northern mixedprairie
Grassland plants Montana, USA
Anderson et al. 2011[62]
30 37 43 0.67 Northern mixedprairie
Grassland plants Montana, USA
Anderson et al. 2011[62]
248 41 46 0.60 Northern mixedprairie
Grassland plants Montana, USA
Anderson et al. 2011[62]
573 42 37 0.47 Northern mixedprairie
Grassland plants Montana, USA
Anderson et al. 2011[62]
53 41 27 0.71 Northern mixedprairie
Grassland plants Montana, USA
Anderson et al. 2011[62]
20 41 30 0.72 Northern mixedprairie
Grassland plants Montana, USA
Miller et al. 2011 [63] 6431 68 117 0.66 Marine Fish Pacific coast, USA
Petraitis et al. 2009[64]
301 60 3 0.67 Intertidal Bivalves andalgae
Maine, USA
Ramesh et al. 2010[65]
132 95 334 0.77 Tropical terrestrial Plants Karnataka, India
Stevens et al. 2011[66]
33 280 155 0.90 Grasslands Plants andbryophytes
Atlantic coast, Europe
Stevens et al. 2011[66]
51 40 100 0.93 Grasslands Plants andbryophytes
Atlantic coast, Europe
Stevens et al. 2011[66]
52 445 355 0.95 Grasslands Plants andbryophytes
Atlantic coast, Europe
Ulrich and Gotelli 2010[28]
248 6 25 0.77 River Fish British Columbia,Canada
Ulrich and Gotelli 2010[28]
495 8 99 0.88 Lake Islands Beetles Multiple
The environment refers to the broadest environment from which samples were collected. The primary taxonomic group is broadest category of the most
abundant groups in dataset. This list is meant to show the diversity of the types of data included in the analysis.
doi:10.1371/journal.pone.0128379.t001
Sample Size for Multivariate, Community Research
PLOS ONE | DOI:10.1371/journal.pone.0128379 June 9, 2015 5 / 18

selected mean of the normal distribution for Taxon A represents the optimal depth at whichTaxon A lives, and therefore, maximum peak of abundance. The tails of the normal distribu-tion represent the most extreme conditions (shallowest and deepest depths) in which Taxon Alives, with abundances declining from the peak to each tail.
Sample locations for each taxon were randomly selected along the environmental gradient(S1 Fig), simulating random sampling of a gradient in the field under circumstances wherecontinuous or interval sampling is not possible. For example, if the gradient was 100 units long(the total unit length is an arbitrary value representing the complete gradient length), a uniquenumber from 1 to 100 was randomly selected for each sample, which represents the samplinglocations along the gradient. This process was repeated for the number of taxa selected for thatparticular dataset (Table 2). At each of these sampled points, all of the taxonomic distributionsthat cross that point are included in that sample. Taxon abundances equal the height of thecurve of each taxon’s normal distribution at that point along the gradient (S1 Fig). This processwas repeated for each of the 220 datasets (Table 2).
Effects of evenness, samples, and taxa. Additionally, 132 datasets were created with theintention of deliberately generating more extreme differences among complete and subsampleddatasets. In each dataset, we selected the abundances (as opposed to randomly generating theabundances) for each taxon in each sample. The other differences among each dataset were thenumber of samples (i.e., the number of collected samples in a dataset that would equate to one
Table 2. A list of the 220 created datasets with simulated abundance structure along with the characteristics of the complete dataset prior tosubsampling.
Datasets Number of samples Number of taxa Gradient Size Median sample size
1–10 15 15 1000 8418
11–20 15 15 5000 41528
21–30 20 20 100 178
31–40 20 20 5000 58014
41–50 20 30 100 278
51–60 20 40 100 256
61–70 20 40 100 356
71–80 20 50 100 255
81–90 20 50 100 493
91–100 25 100 100 936
101–110 30 20 100 194
111–120 30 60 100 376
121–130 40 20 100 169
131–140 50 20 100 181
141–150 50 50 100 474
151–160 50 50 5000 151434
161–170 50 75 100 761
171–180 50 100 100 982
181–190 50 200 100 2037
191–200 75 50 100 484
201–210 100 50 100 468
211–220 200 50 100 462
This list is meant to show how the dataset were structured, and the differences among the datasets. The number of samples, number of taxa, and gradient
size were controlled for in the simulation. The median sample size was an output result of the randomized simulation, although it was influenced by the
controlled parameters.
doi:10.1371/journal.pone.0128379.t002
Sample Size for Multivariate, Community Research
PLOS ONE | DOI:10.1371/journal.pone.0128379 June 9, 2015 6 / 18

row in a taxon by sample matrix), numbers of taxa, and evenness. These three variables wereselected because they commonly vary from study to study, and two of them are among themost basic ecological measures (i.e., number of taxa and evenness).
This selected, systematic creation of datasets often led to datasets with rank abundance dis-tributions and absolute abundances that are rare in the literature, but which might facilitateidentification of the conditions under which larger sample sizes would be necessary to capturethe multivariate results of a dataset. We also systematically varied the number of samples, rich-ness, and evenness to examine these three variables as possible influences on the required sam-ple size for community research.
Each sample of each of these 132 datasets contained 200 individuals (For complete list ofthese datasets see S1 R Data). A sample size of 200 was chosen so that five subsample propor-tion sizes (100, 50, 20, 10, 5) could be produced that represent a range of smaller sample sizes,for comparison with the complete sample.
These 352 datasets were not meant to be all encompassing in terms of creating all possibledatasets a researcher might collect in the field. They were meant to add datasets that comple-ment the 44 previously published datasets by providing additional evidence if smaller samplesizes are sufficient for abundance-based ecological research and if there are any conditions(e.g., high evenness) when larger samples sizes are needed.
Statistical AnalysesIn order to replicate going into the field and collecting smaller sample sizes than used previous-ly in each study, using R 2.14 [29], each sample within each taxon-sample matrix (previouslypublished and created) was randomly subsampled without replacement to five proportionalsizes: 50%, 25%, 10%, 5%, and 2.5% of the total number of individuals in the original sample.For each of the subsampled proportions of each taxon-sample matrix, 1000 subsampled matri-ces were constructed for a total of 5000 subsampled matrices for each dataset. Each of the 5000subsampled matrices was statistically compared to the original 100% taxon-sample matrixusing two multivariate statistical methods.
(1) Using the vegan package in R 2.14 [30], Mantel Tests of correlation were performed be-tween the Bray-Curtis dissimilarity matrices (measures of the differences between each objectin a taxon-sample matrix) of subsamples and corresponding complete datasets. We conductedpilot trials with three datasets to determine if various dissimilarity measures affect the resultingcomparison goodness-of-fit statistics. Regardless of distance measure (Bray-Curtis, Euclidian,City-block, or Raup-Crick), results were the same.
The Mantel Test tests the similarity of two matrices of dissimilarity indices by permutingeach of the elements in the dissimilarity matrix 999 times, to derive a distribution of correlationvalues [31,5,32]. The resulting R-statistic is analogous to the Pearson’s Product Moment Corre-lation Coefficient (r); with increasingly similar data matrices, the Mantel R-statistic will ap-proach 1.
(2) For each of the datasets and subsamples, non-metric multidimensional scaling (NMDS)ordinations of the samples were performed using the Bray-Curtis dissimilarity index[33,2,3,34]. All ordinations were run examining the taxonomic distributions among sampleswith two dimensions with “autotransform = false” in the vegan package in R, specifically usingthe function “metaMDS()”.
Procrustean Randomization Tests (PROTEST) were performed comparing procrustestransformed ordinations of the subsampled and corresponding complete datasets [35,36].NMDS does not always assign the maximum explanation of variation in the ordination spaceto the first axis. Moreover, two different ordinations might not appear to be similar at first
Sample Size for Multivariate, Community Research
PLOS ONE | DOI:10.1371/journal.pone.0128379 June 9, 2015 7 / 18

because they are close reflections to each other in ordination space. To address these possibili-ties, the first step in PROTEST is to perform a Procrustes transformation, which minimizes thesum-of-squares deviations between the two ordination results through translation, reflection,rotation, and dilation. Thus, the two ordination results are reoriented such that they are alignedas closely as possible in ordination space, which permits a more accurate assessment of similar-ity. The residuals between the two ordinations post-transformation are calculated and producethe m2-value. The m2-value is similar to the r-value resulting from a Pearson’s Product Mo-ment Correlation; the closer m2 is to 1, the more similar the two ordinations. Subsequent to theProcrustes transformation, PROTEST randomly permutes the ordination scores for all samplesfor 999 iterations, and the m2-value is calculated for each iteration; a realized p-value, indicat-ing the significance of the m2-value, is then calculated by determining the percentage of itera-tions in which the m2-values from the randomized iterations are greater than the m2-value forthe actual dataset.
Results
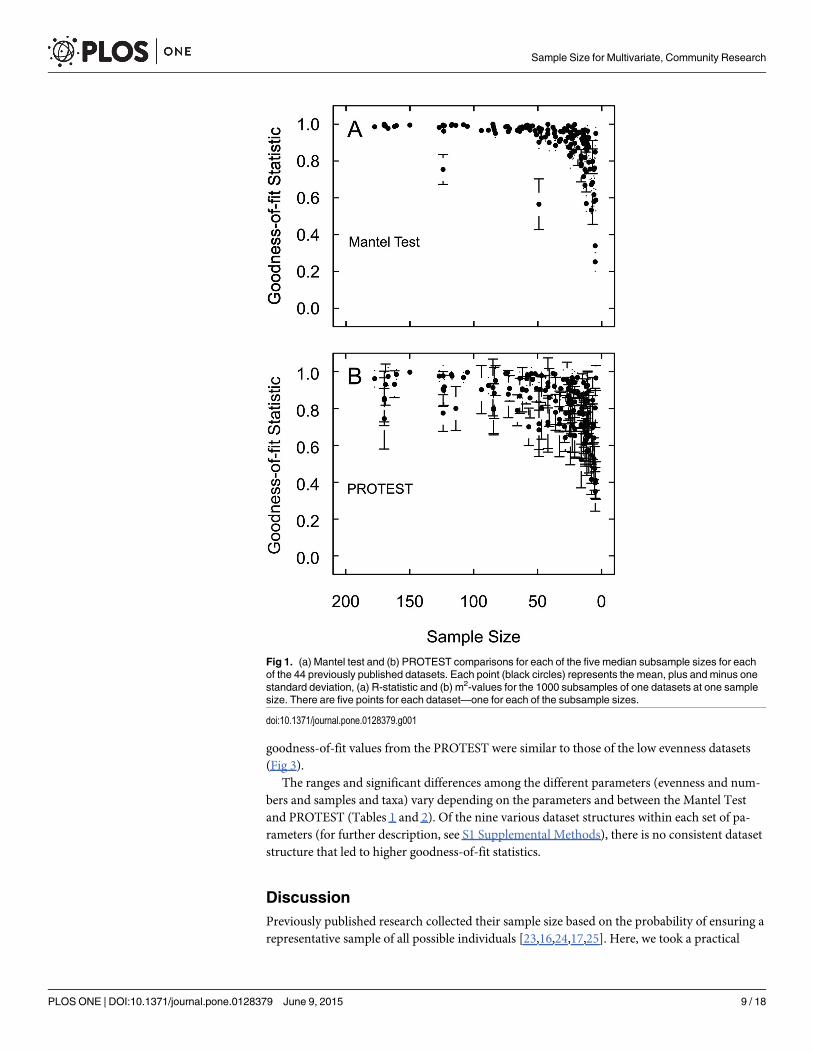
Previously published datasetsWith the exception of one dataset, the Mantel Test R-statistics were greater than R = 0.88 forall sample sizes greater than 28 individuals (Fig 1a). When the median sample size is less than28 individuals the R-statistics decrease rapidly. The one dataset that is below R = 0.88 was Ryuet al. (2011), which contained primarily ostracods with median sample size of 4939 [37]. TheProcrustean Randomization Test (PROTEST) m2-values were consistently above m2 = 0.76 atmedian sample sizes greater than 58 (Fig 1b); the m2-values decrease rapidly at smaller sam-ples. The threshold values (R = 0.88, m2 = 0.76) are based on shifts in values of the goodness-of-fit statistics between a plateau of similar values to a rapid decrease in values. These breakingpoints are assumed to distinguish those sample sizes sufficient to produce the same results,based on the constant, relatively high goodness-of-fit statistics, from those sample sizes that failto produce the same results as the complete data sets.
Created datasetsFor the 220 datasets with the simulated abundance structure, with the exception of three datapoints, the Mantel Test R-statistics are greater than R = 0.82 for all sample sizes greater than 48individuals (Fig 2a). When the median sample size is less than 54 individuals the R-statisticsrapidly decrease. The PROTEST m2-values are greater than the threshold of R = 0.79 for allsample sizes greater than 50 individuals (Fig 2b). At a median sample size less than 50 individ-uals the m2-values rapidly decrease. No pattern or separation in the goodness-of-fit statistics(both the Mantel Test R-statistics and the PROTEST m2-values) was associated with the vari-ables: numbers of taxa, numbers of samples, or initial median sample size (Table 3).
Among the 132 datasets with the selected abundance structure, there was greater variationin the goodness-of-fit statistics compared with the other two dataset types (Fig 3). There wasno clear plateau or rapid decrease of goodness-of-fit statistics. Eighty-eight of the datasets werespecifically constructed to have either low or high evenness. The 44 low evenness datasets hada mean evenness of 0.58 (Pielou’s J Evenness) [38], and the 44 high evenness datasets had amean of 0.79. Of these 88 datasets, the low evenness datasets consistently led to greater good-ness-of-fit statistic values (Table 4). The mixed evenness datasets, those in which the dataset in-cluded some high-evenness samples and some low-evenness samples, produced the highestgoodness-of-fit statistics out of these 132 datasets (Table 3; Fig 3). One difference between thePROTEST m2-values and the Mantel Test R-statistics was that the mixed evenness datasets’
Sample Size for Multivariate, Community Research
PLOS ONE | DOI:10.1371/journal.pone.0128379 June 9, 2015 8 / 18
goodness-of-fit values from the PROTEST were similar to those of the low evenness datasets(Fig 3).
The ranges and significant differences among the different parameters (evenness and num-bers and samples and taxa) vary depending on the parameters and between the Mantel Testand PROTEST (Tables 1 and 2). Of the nine various dataset structures within each set of pa-rameters (for further description, see S1 Supplemental Methods), there is no consistent datasetstructure that led to higher goodness-of-fit statistics.
DiscussionPreviously published research collected their sample size based on the probability of ensuring arepresentative sample of all possible individuals [23,16,24,17,25]. Here, we took a practical
Fig 1. (a) Mantel test and (b) PROTEST comparisons for each of the five median subsample sizes for eachof the 44 previously published datasets. Each point (black circles) represents the mean, plus and minus onestandard deviation, (a) R-statistic and (b) m2-values for the 1000 subsamples of one datasets at one samplesize. There are five points for each dataset—one for each of the subsample sizes.
doi:10.1371/journal.pone.0128379.g001
Sample Size for Multivariate, Community Research
PLOS ONE | DOI:10.1371/journal.pone.0128379 June 9, 2015 9 / 18

approach to determining if smaller sample sizes produce the same results as the originally col-lected sample size by subsampling 44 previously published and 352 created datasets to five dif-ferent percentages of the original sample size.
The 44 previously published datasets and 220 of the created datasets demonstrate thatsmaller sample sizes produce the same multivariate, abundance-based community results aslarger sample sizes, in the sense that the results are similar enough that they would be inter-preted the same (Figs 1 and 2). Although there were some outliers, the vast majority of the sub-sample results were above the thresholds when sample sizes were greater than 54 and 58 for theMantel Test and PROTEST, respectively. This suggests that all median sample sizes greaterthan these values produced the same results as larger sample sizes As these results are based onmedian sample sizes within the dataset, a minimum sample-size of 58 individuals per sample
Fig 2. (a) Mantel test and (b) PROTEST comparisons for each of the five median subsample sizes for eachof the 220 created datasets with randomly selected abundance structures. Each point (black circles)represents the mean, plus and minus one standard deviation, (a) R-statistic and (b) m2-values for the 1000subsamples of one datasets at one sample size. There are five points for each dataset—one for each of thesubsample sizes.
doi:10.1371/journal.pone.0128379.g002
Sample Size for Multivariate, Community Research
PLOS ONE | DOI:10.1371/journal.pone.0128379 June 9, 2015 10 / 18

would almost certainly be representative for use with these types of multivariate analyses, andas such, 58 individuals is a conservative recommendation for a minimum sample-size to be col-lected in the field.
This sample size estimate is substantially smaller than found by previous research that useddifferent methods (i.e., probability estimates) to determine that 300 individuals per communityare required for ecological research [23,16,24,17, 18,25]. However, the approach taken in thepresent study of comparing multivariate results is a more practical approach because mostcommunity research applies multivariate techniques. Although a smaller sample size may notcapture the exact diversity of a community, the smaller sample size would still maintain thegeneral position and order of samples in ordination space as well as the identification of relatedgroupings or gradients of communities when using other multivariate techniques.
Multivariate statistical methods, specifically ordination, may be statistically powerfulenough that the differences and similarities among samples are detected even at much smallersamples sizes [39,40]. At these smaller sample sizes, rare taxa may not be collected, and there-fore would not be included in the analyses [41]. However, unless the goal of the study is to ex-amine rarity, the results of the present study demonstrate that those rare taxa are not requiredfor interpretation of many ecological results uncovered using multivariate methods.
The median sample size of 58 individuals determined here is less than the combined mediansample sizes of the 44 previously published datasets, which was 146 individuals with a range of10 to 24,812. These 44 datasets are representative of the range of typical median sample sizescollected by ecologists (Table 1). This aids in demonstrating that community studies can collectfewer individuals per sample and still obtain the same meaningful results. This finding is im-portant for managing resources (e.g., time and money, decisions as to where to sample) withina study and for studies where there may only be a limited number of specimens to collect (e.g.,small populations and fewer individuals).
Table 3. A list of the results from the various tests of significance used to determine if there were dif-ferences in groupings of goodness-of-fit statistics at a sample size 50.
Type of test Groups being tested p-value
T-test High and low evenness dataset R-statistics p < 0.001
T-test High and low evenness datasets m2-values p = 0.003
T-test R-statistics for the datasets with 5 samples and 10 sample p = 0.03
T-test m2-values for the datasets with 5 samples and 10 sample p < 0.001
ANOVA R-statistics for the datasets with a richness of 10, 20, and 50 p = 0.006
Bonferroni corrected T-test
R-statistics for the datasets with a richness of 20 and 50 p = 0.009
Bonferroni corrected T-test
R-statistics for the datasets with a richness of 10 and 20 p = 0.053
Bonferroni corrected T-test
R-statistics for the datasets with a richness of 10 and 50 p = 0.94
ANOVA m2-values for the datasets with a richness of 10, 20, and 50 p = 0.53
T-test R-statistics the datasets with a richness of 10 and 50 (mixedevenness datasets)
p = 0.09
T-test m2-values the datasets with a richness of 10 and 50 (mixedevenness datasets)
p = 0.04
These tests were conducted on the 132 created datasets with selected abundance structures because
those datasets resulted in the greatest amount of variation among samples sizes. Because of this variation,
we used these tests to determine if certain parameters would require larger sample sizes.
doi:10.1371/journal.pone.0128379.t003
Sample Size for Multivariate, Community Research
PLOS ONE | DOI:10.1371/journal.pone.0128379 June 9, 2015 11 / 18

The previously published datasets we examined were from a range of environments, geo-graphic locations, and contained a range of taxonomic groups as well as both terrestrial andmarine taxa. In addition, the real and created datasets contain a range of numbers of samples,numbers of taxa, and evenness, resulting in datasets spanning an extremely broad range of pos-sible communities. The results were consistent across this broad range of real or realistic com-munities; none of the above dataset parameters or variables would require larger sample sizes.However, we did not examine methods of tallying taxa other than abundance counts and onlymultivariate analytical methods were used. So, if methods other than abundance counts andthe multivariate statistics employed herein are used, the present study cannot provide insightinto the sample size requirements.
Fig 3. (a) Mantel test and (b) PROTEST comparisons for each of the five median subsample sizes for eachof the 132 created datasets with selected abundance structures. Each point (black circles) represents themean, plus and minus one standard deviation, (a) R-statistic and (b) m2-values for the 1000 subsamples ofone datasets at one sample size. There are five points for each dataset—one for each of thesubsample sizes.
doi:10.1371/journal.pone.0128379.g003
Sample Size for Multivariate, Community Research
PLOS ONE | DOI:10.1371/journal.pone.0128379 June 9, 2015 12 / 18
In order to strengthen the present results, we recommend future research using a nestedsampling protocol (collecting smaller sample sizes within larger) to provide additional infor-mation on required sample sizes. Although our data include field-collected datasets, all of thesamples sizes smaller than the original were simulated. We did not collect any data at varioussample sizes to compare the multivariate statistical results. Future research utilizing nestedfield sampling may reveal patterns (e.g., patchiness) that would indicate larger sample sizes arerequired. Conversely, a study of multiple datasets from various environments, locations, andusing a range of taxa could provide additional support for the present result that smaller sam-ples sizes produce statistically robust results.
Although we have demonstrated that smaller samples sizes are appropriate for a large rangeof multivariate ecological research, in many cases, researchers may not be limited in resources,and thus, there would be no real benefit for collecting smaller samples sizes. When resourcesare not limited, the possibility of over collecting may not be an issue. One instance in whichresource-intensive over-sampling may be costly is when studying an endangered species, par-ticularly at the geographic extremes of those species [42,43].
There are many situations in which the costs of identification are high, particularly whenspecies identification requires substantial handling time by the researcher or the number oftaxa in a collection locality is low. In such cases, oversampling of individuals results in signifi-cantly increased costs, with little improvement in the ability to answer specific ecological ques-tions. For example, taxonomic datasets that were not originally intended to be used forcommunity research may exist that contain a median sample size of 58. With the evidence pre-sented from the present research, ecologists can safely use those data to ask new questions orconduct meta-analyses. These practical implications of the present study demonstrate the mostimportant part of understanding the smallest required sample size for abundance-based, multi-variate ecological research.
When are larger sample sizes required?Evenness. Of the three parameters (number of samples, number of taxa, and evenness)
that were systematically varied among the 132 created datasets with selected abundances,
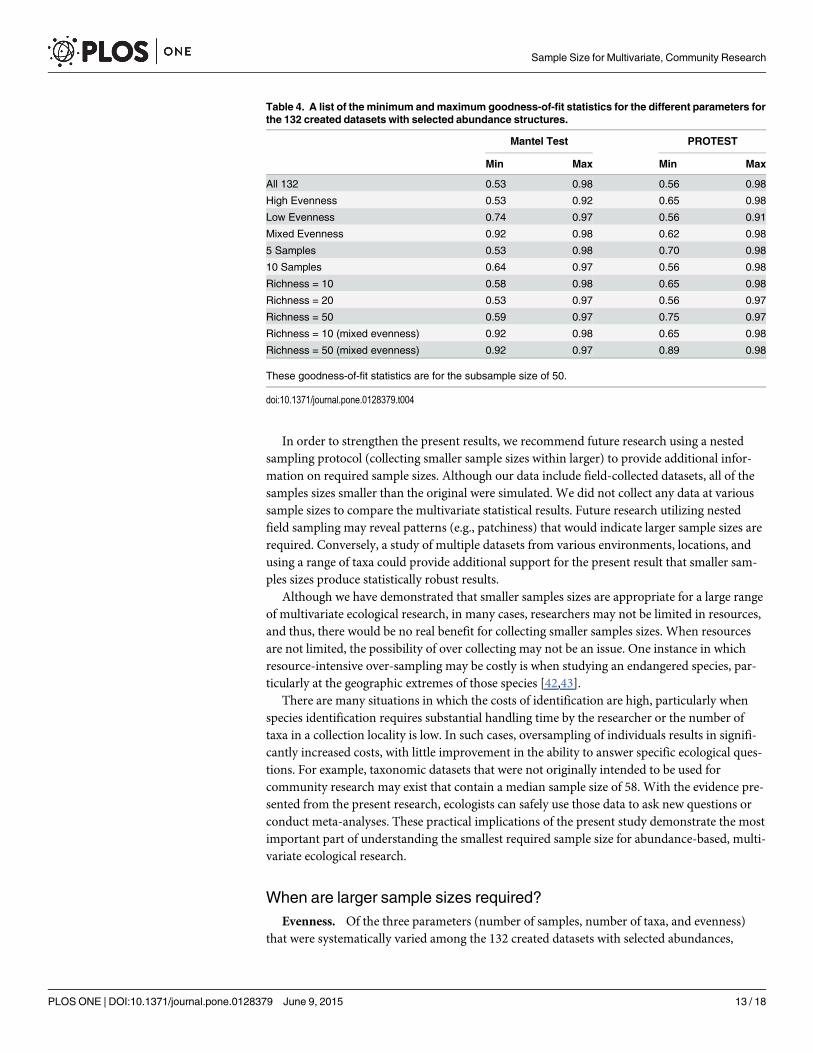
Table 4. A list of the minimum andmaximum goodness-of-fit statistics for the different parameters forthe 132 created datasets with selected abundance structures.
Mantel Test PROTEST
Min Max Min Max
All 132 0.53 0.98 0.56 0.98
High Evenness 0.53 0.92 0.65 0.98
Low Evenness 0.74 0.97 0.56 0.91
Mixed Evenness 0.92 0.98 0.62 0.98
5 Samples 0.53 0.98 0.70 0.98
10 Samples 0.64 0.97 0.56 0.98
Richness = 10 0.58 0.98 0.65 0.98
Richness = 20 0.53 0.97 0.56 0.97
Richness = 50 0.59 0.97 0.75 0.97
Richness = 10 (mixed evenness) 0.92 0.98 0.65 0.98
Richness = 50 (mixed evenness) 0.92 0.97 0.89 0.98
These goodness-of-fit statistics are for the subsample size of 50.
doi:10.1371/journal.pone.0128379.t004
Sample Size for Multivariate, Community Research
PLOS ONE | DOI:10.1371/journal.pone.0128379 June 9, 2015 13 / 18

evenness had the greatest effect on whether the subsamples of a dataset produced the samemultivariate result as the complete dataset. The low evenness datasets had consistently greatergoodness-of-fit statistics than the high evenness datasets. There is a significant difference be-tween the low and high evenness datasets for both the R-statistics and m2-values; datasets con-taining samples with consistently high evenness may require larger sample sizes. Thus, whendatasets contain samples with consistently high evenness, larger sample sizes are required fordetecting similarity and differences among samples in a dataset.
Number of taxa. Datasets with more taxa often had lower goodness-of-fit statistics (Tables3 and 4). However, this pattern was not consistent throughout all numbers of taxa and the twocomparison methods. Overall, this effect of the number of taxa on the required sample size isminor relative to the complete analysis of all 396 datasets. In addition to the effect of the num-ber of taxa on selected-created dataset, 11 of the previously published datasets and 50 of thesimulated-created datasets had more than 50 taxa, and all of these datasets produced consis-tently high goodness-of-fit statistics between subsampled and corresponding complete datasets(Tables 1 and 2). So, the majority of datasets, even those with a larger number of taxa, still dem-onstrate that smaller samples sizes are sufficient for multivariate community research.
Number of samples. There was a significant difference in results between 132 selectedabundances datasets with 5 and those with 10 samples (Tables 3 and 4; Fig 3). The datasetswere constructed so that each sample within the each of these 132 datasets represents a differ-ent community. With a greater number of communities (10 versus 5), the multivariate analysisis more likely to distinguish between most of the communities even with fewer individuals persample. The multivariate analyses are better able to distinguish between the two dichotomousgroups of samples, even at smaller sample sizes, which was likely the cause for the high good-ness-of-fit statistics. When the datasets are limited to 5 communities, there is less of a chancethat the community gradient will still be apparent when sample sizes decrease. When there are10 communities, there is a higher probability that the relative order of one or two communitieswill remain intact even at smaller sample sizes, producing the same or similar community gra-dient in ordination space.
This is additional evidence that homogeneity of communities within a dataset may requirelarger sample sizes. However, it should be noted that many, if not most, studies seek to deter-mine the cause of community change, so they deliberately sample along suspected gradients orbetween environmental conditions known to be different. Environmental homogeneity amongsampled communities is not a common goal. So, this issue of larger sample size requirementsamong homogeneous communities should not have a grave impact on community research.
ConclusionThe primary goal of this study was to determine if smaller sample sizes produce the same re-sults as larger, more typically collected sample sizes. Examining 44 previously published and220 created datasets with simulated abundance structures, we found evidence that smaller sam-ple sizes (i.e., 58 individuals) produce the same community results as larger sample sizes.
This finding is most important for ecologists with limited resources (e.g., money, time, orthe data). Many ecology researchers are underfunded. Money spent on field collections and re-search assistantships can, if limited, still obtaining meaningful statistical information becausesmaller samples sizes are sufficient to accomplish the same research goals.
To detect possible dataset parameters that require larger sample sizes, we subsampled select-ed-created datasets in which the number of samples, number of taxa, and evenness were sys-tematically altered to test for an effect on the required sample size. We found that highevenness datasets produced lower goodness-of-fit statistics than low evenness and mixed
Sample Size for Multivariate, Community Research
PLOS ONE | DOI:10.1371/journal.pone.0128379 June 9, 2015 14 / 18

evenness datasets. Although high evenness datasets may have led to lower goodness-of-fit, fewstudies would consist entirely of uniformly high-evenness communities.
Supporting InformationS1 Fig. Visual representation of the synthetic dataset simulation process using 5 taxa and 5samples. Each of the five normal distributions represents the simulated, possible distributionof on taxon along that environmental gradient. Each of the five black dashed lines representsfive randomly selected locations along the environmental gradient where samples were select-ed, representing the fossil collection. For each normal distribution that crossed each sampleline a random select of abundance was selected, represented by the dashed gray line.(EPS)
S1 R Data. List of the created datasets with selected abundances. A R-formatted file contain-ing the 132 created datasets with selected abundance distributions.(TXT)
S1 Supplemental Methods. Supplemental methods section. A more detailed description ofthe methods used to develop the 132 created datasets with selected abundance distributions.(DOCX)
AcknowledgmentsThis research would not have been possible without the NSF- EAR-0746072 grant to Leighton.Thank you to Guillermo Bueno, Justine Karst, Tan Bao, Jon Bennett, and the rest of the Uni-versity of Alberta Plant Ecology Group, without whom this research would lack the proper eco-logical edge it required. We would like to thank Chris Schneider, Emily Stafford, and BrianChatterton for their feedback on the manuscript and the project overall.
Author ContributionsConceived and designed the experiments: FLF LRL. Performed the experiments: FLF LRL PT.Analyzed the data: FLF LRL JFC. Contributed reagents/materials/analysis tools: FLF LRL JFC.Wrote the paper: FLF LRL JFC.
References1. Warwick RM, Clarke KR. Comparing the severity of disturbance: a meta-analysis of marine macro-
benthic community data. Mar. Ecol. Prog. 1993; 92: 221–231.
2. Legendre P, Legendre L. Numerical Ecology. Elsevier, Amsterdam, The Netherlands; 1998.
3. McCune B, Grace JB. Analysis of Ecological Communities. MjM Software Design, Gleneden Beach,Oregon; 2002.
4. Beals ML. Understanding community structure: a data-driven multivariate approach. Oecologia 2006;150: 484–495. PMID: 17048012
5. Vanschoenwinkel B, De Vries C, SeamanM, Brendonck L. The role of metacommunity processes inshaping invertebrate rock pool communities along a dispersal gradient. Oikos 2007; 116: 1255–1266.
6. Forcino FL, Stafford ES, Warner JJ, Webb AE, Leighton LR, Schneider CL, et al. Effects of data catego-rizations on paleocommunity analysis: a case study from the Pennsylvanian Finis Shale of Texas.PALAIOS 2010; 25:144–157.
7. Wolda H. Similarity indices, sample size and diversity. Oecologia 1981; 50: 296–302.
8. Zandt HS. A comparison of three sampling techniques to estimate the population size of caterpillars intrees. Oecologia 1994; 97: 399–406.
9. Hayek LC, Buzas MA. Surveying Natural Populations. Columbia Univ. Press, New York; 1997.
Sample Size for Multivariate, Community Research
PLOS ONE | DOI:10.1371/journal.pone.0128379 June 9, 2015 15 / 18

10. Jalonen J, Vanha-Majamaa I, Tonteri T. Optimal sampling and plot size for inventory of field andground layer vegetation in mature Myrtillus-type boreal spruce forest. Annales Botinici Fennici 1998;35: 191–196.
11. Bennington JB, Rutherford SD. Precision and reliability in paleocommunity comparisons based on clus-ter-confidence intervals: how to get more statistical bang for your statistical buck. Palaios 1999; 14:506–515.
12. Cao Y, Williams DD, Larsen DP. Comparison of ecological communities: the problem of sample repre-sentativeness. Ecol. Monogr. 2002; 72: 41–56.
13. Olszewski TD. A unified mathematical framework for the measurement of richness and evenness withinand among multiple communities. Oikos 2004; 104: 377–387.
14. Schloss PD. Evaluating different approaches that test whether microbial communities have the samestructure. The ISME Journal 2008; 2: 265–275. doi: 10.1038/ismej.2008.5 PMID: 18239608
15. Biro PA. Are most samples of animals systematically biased? Consistent individual trait differencesbias samples despite random sampling. Oecologia 2013; 171: 339–345. doi: 10.1007/s00442-012-2426-5 PMID: 22885993
16. Chang YM. Accuracy of fossil percentage estimation. Journal of Paleontology 1967; 41: 500–502.
17. Fatela F, Taborda R. Confidence limits of species proportions in microfossil assemblages. MarineMicropaleontology 2002; 45: 169–174.
18. Chao A, Chazdon RL, Colwell RJ, Shen TJ. A new statistical approach for assessing similarity of spe-cies composition with incidence and abundance data. Ecology Letters 2005; 8: 145–159.
19. Kang S, Mills AL. The effect of sample size in studies of soil microbial community structure. Journal ofMicrobiological Methods 2006; 66: 242–250. PMID: 16423418
20. Forcino FL. Multivariate assessment of the required sample size for paleocommunity research. Palaeo-geography, Palaeoclimatology, Palaeoecology 2012; 315: 134–141.
21. Thies CG, Hogan RE. The state of undergraduate research methods training in political science. PS:Politcal Science & Politics 2005; 38: 293–297.
22. Eagan MK Jr., Sharkness J, Hurtado S, Mosqueda CM, Change MJ. Engaging undergraduates in sci-ence research: not just about faculty willingness. Res. High. Educ. 2011; 52: 151–177. PMID:22557706
23. Phleger FB. Ecology and Distribution of Recent Forminifera. Johns Hopkins Press, Baltimore, MD;1960.
24. Patterson RT, Fishbein T. Re-examination of the statistical methods used to determine the number ofpoint counts needed for micropaleontological quantitative research. Journal of Paleontology 1989; 63:245–248.
25. Schloss PD, Handelman J. The last word: books as a statistical metaphor for microbial communities.Annual Review of Microbiology 2007; 61: 23–34. PMID: 17439361
26. Goff FG, Mitchell R. A Comparison of species ordination results from plot and stand data. Vegetatio1975; 31: 15–22.
27. Ranjard L, Lejon DPH, Mougel C, Schehrer L, Merdinoglu D, Chaussod R. Sampling strategy in molec-ular microbial ecology: influence of soil sample size on DNA finger printing analysis of fungal and bacte-rial communities. Environmental Microbiology 2003; 5: 1111–1120. PMID: 14641591
28. Ulrich W, Gotelli NJ. Null model analysis of species associations using abundance data. Ecology 2010;91: 3384–3397. PMID: 21141199
29. R Development Core Team. R: A language and environment for statistical computing. R Foundationfor Statistical Computing, Vienna; 2012. http://www.R-project.org. doi: 10.1002/jcc.22917 PMID:22278855
30. Oksanen J, Blanchet FG, Kindt R, Legendre P, O'Hara RB, Simpson GL, et al. vegan: CommunityEcology Package. R package version 1.17–3. 2012; http://CRAN.R-project.org/package = vegan.
31. Mantel N. The detection of disease clustering and a generalized regression approach. Cancer Re-search 1967; 27: 209–220. PMID: 6018555
32. Fall LM, Olszewski TD. Environmental disruptions influence taxonomic composition of brachiopodpaleocommunities in the Middle Permian Bell Canyon Formation (Delaware Basin, West Texas).Palaios 2010; 25: 247–259.
33. Clarke KR, Ainsworth M. A method and linking multivariate community structure to environmental vari-ables. Marine Ecology 1993; 92: 205–219.
34. Bush AM, Brame RI. Multiple paleoecological controls on the composition of marine fossil assemblagesfrom the Frasnian (Late Devonian) of Virginia, with a comparison of ordination methods. Paleobiology2010; 36: 573–591.
Sample Size for Multivariate, Community Research
PLOS ONE | DOI:10.1371/journal.pone.0128379 June 9, 2015 16 / 18

35. Jackson DA. PROTEST: A Procrustean randomization test of community environment concordance.Écoscience 1995; 2: 297–303.
36. Peres-Neto PR, Jackson DA. How well do multivariate datasets match? The advantages of a Procrus-tean superimposition approach over the Mantel Test. Oecologia 2001; 129: 169–178.
37. Ryu J, Khim JS, Kang SG, Kang D, Lee C, Koh C. The impact of heavy metal pollution gradients in sedi-ment on benthic macrofauna at population and community levels. Environmental Pollution 2011; 159:2622–2629. doi: 10.1016/j.envpol.2011.05.034 PMID: 21684642
38. Magurran AE. Measuring Biological Diversity. Blackwell Publishing, Oxford, England; 2004.
39. Brehm G, Fiedler K. Ordinating tropical moth ensembles from an elevational gradient: a comparison ofcommonmethods. J. Trop. Ecol. 2004; 20: 165–172.
40. Forcino FL, Barclay K, Schneider CL, Linge-Johnsen S, Leighton LR. The sensitivity of paleocommu-nity sampling strategy at different spatiotemporal scales. Palaeogeography, Palaeoclimatology,Palaeoecology 2012; 313: 246–253.
41. Melo AS, Pereira RAS, Santos AJ, Shepard GJ, Machado G, Medeiros HF, et al. Comparing speciesrichness among assemblages using sample units: why not use extrapolation methods to standardizedifferent sample sizes?. Oikos 2003; 101: 398–410.
42. Boyle KJ, Bishop RC. Valuing wildlife in benefit-cost analyses: A case study involving endangered spe-cies. Water Resour. Res. 1987; 23(5): 943–950.
43. Channell R, Lomolino MV. Dynamic biogeography and conservation of endangered species. Nature2000; 403: 84–86. PMID: 10638757
44. Beehler B. Frugivory and polygamy in birds of paradise. The Auk 1983; 100: 1–12.
45. Arthur JR, Margolis L, Arai HP. Parasites of fishes of Aishihik and Stevens Lakes, Yukon Territory, andpotential consequences of their interlake transfer through a proposed water diversion for hydroelectricalpurposes. Journal of the Fisheries Research Board of Canada 1976: 33: 2489–2499.
46. Causse R, Ozouf-Costaz C, Koubbi P, Lamy D, EleaumeM, Dettaı A, et al. Demersal ichthyofaunalshelf communities from the Dumont d’Urville Sea (East Antarctica). Polar Science 2011; 5: 272–285.
47. Wong DCL, Maltby L, Whittle D, Warren P, Dorna PB. Spatial and temporal variability in the structure ofinvertebrate assemblages in control streammesocosms. Water Research 2004; 38: 128–138. PMID:14630110
48. VanNimwegen RE, Kretzer J, Cully JF. Ecosystem engineering by a colonial mammal: how prairiedogs structure rodent communities. Ecology 2008; 89: 3298–3305. PMID: 19137937
49. Ieno EN, Bastida RO. Spatial and Temporal Patterns in Coastal Macrobenthos of Samborombon Bay,Argentina: A Case Study of Very Low Diversity. Estuaries 1998; 41: 690–699.
50. Kinnunen H, Tiainen J. Carabid distribution in a farmland mosaic: the effect of patch type and location.Annales Zoologici Fennici 1999; 36: 149–158.
51. Nicolaidou A, Petrou K, Kormas KA, Reizopouloz S. Inter-annual variability of soft bottommacrofaunalcommunities in two Ionian Sea lagoons. Hydrobiologia 2006; 555: 89–98.
52. Arai HP, Mudry DR. Protozoan and metazoan parasites of fishes from the headwaters of the Parsnipand McGregor Rivers, British Columbia: a study of possible parasite transfaunations. Canadian Journalof Fisheries and Aquatic Sciences 1983; 40: 1676–1684.
53. Peres CA. Primate community structure at twenty western Amazonian flooded and unflooded forest.Journal of Tropical Ecology 1997; 13: 381–405.
54. Dahle S, Denisenko SG, Denisenko NV, Cochrane SJ. Benthic fauna in the Pechora Sea. Sarsia 1998;83: 183–210.
55. Repecka R, Mileriene E. Species composition and abundance in shore-zone fish communities of theKursiu bay during 1985–1989. Elologija 1991; 4: 68–80.
56. Hughes RN, Thomas MIH. The classification and ordination of shallow-water benthic samples fromPrince Edward Island, Canada. J. Exp. Mar. Biol. Ecol. 1971; 7: l–39.
57. Skłodowski JJW, Porowski J. Composition and structure of carabid communities (Col., Carabidae) liv-ing in small mid-field pine stands. Sylwan Volume 2000; 144: 45–64.
58. Snow BK, Snow DW. The feeding ecology of Tanagers and honeycreeperes in Trinidad. Auk 1971; 88:291–322.
59. Snow BK, Snow DW. Birds and Berries. England, Calton; 1988.
60. Ulrich W, Zalewski M. Abundance and co-occurrence patterns of core and satellite species of groundbeetles on small lake islands. Oikos 2006; 114: 338–348.
61. Dechtiar AO. Parasites of fish from Lake of theWoods, Ontario. Journal of Fisheries Research Board ofCanada 1972; 29: 275–283.
Sample Size for Multivariate, Community Research
PLOS ONE | DOI:10.1371/journal.pone.0128379 June 9, 2015 17 / 18

62. Anderson J, Vermeire L, Adler PB. Fourteen years of mapped, permanent quadrats in a northern mixedprairie, USA. Ecology 2011; 92: 1703. doi: 10.1016/j.athoracsur.2011.05.086 PMID: 22051266
63. Millar RB, Anderson MJ, Tolimieri N. Much ado about nothings: using zero similarity points in distance-decay curves.—Ecology 2011; 92: 1717–1722. PMID: 21939067
64. Petraitis PS, Liu H, Rhile EC. Barnacle, fucoid, and mussel recruitment in the Gulf of Maine, USA, from1997 to 2007. Ecology 2009; 90: 571.
65. Ramesh BR, Swaminath MH, Patil SV, Dasappa, Pélissier R, Venugopal PD, et al. Forest stand struc-ture and composition in 96 sites along environmental gradients in the central Western Ghats of India.Ecology 2010; 91: 3118–3118.
66. Stevens CJ, Dupré C, Dorland E, Gaudnik C, Gowing DJG, Diekmann M, et al. Grassland species com-position and biogeochemistry in 153 sites along environmental gradients in Europe. Ecology 2011; 92:1544–1544.
Sample Size for Multivariate, Community Research
PLOS ONE | DOI:10.1371/journal.pone.0128379 June 9, 2015 18 / 18