research working paper series nature or nurture: why do
TRANSCRIPT

Research Working Paper Series
Nature Or Nurture: Why Do Railroads Carry Greater Freight Share
In The United States Than In Europe?
Jose Manuel Vassallo∗
Associate Professor ETSI Caminos, Canales y Puertos
Universidad Politécnica de Madrid (UPM)
Mark Fagan+
Senior Fellow Center for Business and Government
Harvard University
December 20, 2005
WP05-15
The views expressed in the Taubman Center Research Working Paper Series are those of the author(s) and do not necessarily reflect those of the John F. Kennedy School of Government or Harvard University. Copyright belongs to the author(s). Papers may be downloadable for personal use only. ∗ First Author. Mail Address: Departamento de Transportes. ETSI Caminos, Canales y Puertos. Profesor Aranguren s/n. 28040. MADRID. SPAIN. Phone: 34 91 3366657. Fax: 34 91 3366656. e-mail: [email protected] + Second and Corresponding Author. Mail Address: Center for Business and Government. Kennedy School of Government. 79 JFK Street. CAMBRIDGE. MA-02138. USA. Phone: .Fax: 617 496 0063. e-mail: [email protected]
1

Abstract
During the 1950s the share of freight carried by railroads was similar and declining in both the
United States and Europe. By 2000 the railroads’ share of freight (measured in ton-kilometers) had
reached 38 percent in the United States while falling to 8 percent in Europe. This paper examines the
reasons for the difference in rail’s share of freight in Europe and the United States. We find that almost
80 percent of the gap in 2000 is probably due to natural or inherent differences, principally geography,
shipment distance and commodity mix. A little more than a 20 percent of the gap cannot be explained by
these inherent differences and is presumably due to public policies including priority of passenger service,
lack of interoperability at borders, and incentives of the rail operators. We estimate that if that policy gap
were closed railroads’ share of freight in Europe would almost double, increasing to 15 percent.
Key Words: Railroad, freight transportation, Europe, United States, Competition.
2

I. Introduction
During the 1950s the share of freight carried by railroads was similar and declining in both the
United States and Europe. Beginning in the 1960s, however, the trends diverged, as shown in Figure 1.
In the United States the decline slowed during the 1960s and 1970s, and railroads’ share of freight
actually increased during the 1980s and 1990s. In contrast, European rail freight share steadily declined
throughout this period. By 2000 the railroads’ share of freight (measured in ton-kilometers) had increased
to 38 percent in the United States while it fell to 8 percent in Europe.
Figure 1: Comparison of EU and US Rail Share Trends
Rail Share over total transportation (*)
0.00%10.00%20.00%30.00%40.00%50.00%60.00%70.00%
1950 1960 1970 1980 1990 2000
Year
Rai
l Sha
re T
one-
Km
EU-15USA
(*) Pipeline and coastal transportation are not included in 1950 and 1960 Source: US data from Eno Transportation Foundation, Inc.
From 1970 to 2000 EU data from EUROSTAT From 1959 to 1960 Europe Data from the Economic Division for Europe of United Nations
One possible explanation is that differences in geography and other natural or inherent
characteristics make the United States more suitable for rail freight than Europe. The United States has
three times the land area of the European Union (EU-15) which results in longer shipment distances that
favor railroads over trucks. And the United States, despite its land mass, has only one-ninth the coastline
of Europe which favors railroads over coastal shipping. The mix of commodities shipped differs between
3

the United States and Europe as well, and often in ways that bolster United States railroad share. For
example, a substantial portion of United States electricity is generated by burning coal which requires
substantial movements of coal over long distances.
An alternative explanation is that public policies have been more supportive of rail freight in the
United States than in Europe. At first glance this idea seems suspect: Europe has much higher taxes on
motor vehicle fuels and a long history of subsidizing its railroads. And although both Europe and the
United States have built extensive high-performance highway systems, in Europe these are often financed
by tolls while in the United States many are not. However, countervailing factors could be at work. The
United States has encouraged its freight railroads to be more efficient by leaving them in private hands
instead of nationalizing them, as Europe did. Moreover, the United States released the private railroads
from the obligation to provide urban commuter service in 1958 and intercity passenger service in 1970
and then substantially eliminated government controls over freight tariffs in 1980, three steps which
allowed railroad managers the freedom and flexibility to focus on freight.
This paper adds to the literature an examination of the reasons for the difference in rail’s share of
freight in Europe and the United States. As the first comprehensive analytical comparison, the research
provides an initial explanation of the rail share issue at the macro level. The methodology features a step-
by-step calculation of European Union rail share under the assumption of United States conditions. We
begin by calculating the European Union rail freight volume assuming that its rail share equals that of the
Unites States. That theoretical volume is then reduced to reflect the role of water and pipeline, shipment
distance, and commodity mix. The residual is thought to be a result of policy differences.
In brief, we find that a bit less than 80 percent of the gap in 2000 is probably due to natural or
inherent differences, principally the shorter coastline and the longer shipment distances but also
differences in commodities moved. A little bit more than 20 percent of the gap cannot be explained by
these inherent differences and is presumably due to public policies. If that gap were closed, railroads’
share of freight in Europe would approximately double, increasing from 8 to 15 percent. We believe this
estimate is conservative because of the numerous European Union policies favoring railroads.
4

Section II of this paper provides background about the railroads in the United States and the
European Union as well as the current concerns about rail share in the European Union. Section III
describes the data sources used. Section IV explains the calculations used to estimate what portion of
rail’s lower European share is due to inherent differences between Europe and the United States. Section
V considers the residual portion, which we attribute to policy differences between Europe and the United
States. Section VI provides conclusions based on the research and suggests areas of further analysis.
In this paper the European Union refers to the EU-15: Austria, Belgium, Denmark, Germany,
Greece, Finland, France, Ireland, Italy, Luxembourg, the Netherlands, Portugal, Spain, Sweden, and the
United Kingdom. The ten countries which joined the European Union in 2004 are not included both
because their integration into the Union is just beginning and because consistent data for these new
members is not readily available.
II. Background
The United States. The improvement in the performance of United States freight railroads in the
late 20th century coincides with important changes in public policy toward railroads. Until 1970 virtually
all intercity railroad services—passenger and freight—were provided by privately owned but
government-regulated companies. The most important regulator was the Interstate Commerce
Commission (ICC), which had been established by Congress in 1887 in part to prevent railroads from
abusing the monopoly power they were thought to enjoy. Toward that end, the ICC eventually acquired
powers to control entry and exit to the railroad industry, mergers, service offerings and tariffs (Kheeler
1983). By the 1950s, however, improvements in waterways, the construction of the Interstate and
Defense Highway System and the growth of trucking had substantially weakened the railroads’ natural
monopoly in freight (Winston 1990 et al., Kheeler 1983). The development of the highway system and
the improvement in aircraft technology greatly increased competition from buses, autos, and airlines and
diverted almost all passengers from the railroads, with the exception of commuter services in the largest
5

metropolitan areas and intercity services along the Northeast Corridor running from Washington through
New York to Boston.
The railroads began to complain that the ICC, and its sister regulatory agencies at the state level,
were making it difficult for them to adapt to the increased competition. Regulators often prevented the
railroads from abandoning unprofitable passenger services or lightly used freight branch lines, for
example, forcing the companies to try to make up the losses in the declining number of markets that were
profitable. The railroads’ complaints gained credibility in the 1960s as the financial situation of the
industry deteriorated steadily (Winston 2004). By 1970 the railroad industry was in crisis, and between
1970 and 1975 several large carriers filed for bankruptcy.
Congress responded in part by passing two acts that relieved the railroads of the responsibility of
providing passenger services. The first, passed in 1958, stripped state regulators of the power to prevent
the railroads from abandoning unprofitable intrastate services. This act had the effect of forcing
metropolitan areas that wanted to maintain urban commuter railroad services to either subsidize their
operation by incumbent railroads or to take over the responsibility for commuter services themselves.
The second act, passed in 1970, established a government-owned company, Amtrak, to provide intercity
passenger services. Railroads were required to make a contribution (in cash or in rolling stock)
proportional to their estimated financial losses from intercity passenger service and to grant Amtrak the
right to operate over their lines at a reasonable cost and, in return, Amtrak would assume responsibility
for their passenger services. A few years later Amtrak acquired its own right-of-way in the Northeast
Corridor as the result of the bankruptcy of the largest railroad in the region.
When relief from passenger service proved insufficient to arrest the railroads’ decline Congress
responded in the 1970s by restricting the ICC’s powers to regulate freight services and tariffs. These
efforts culminated in the Staggers Act of 1980, which virtually eliminated ICC controls over freight tariffs
and rescinded the long-standing prohibition against private long-term contracts between shippers and
railroads. The act’s intention was that shippers and railroads would negotiate long term contracts
governing the services offered and the tariffs to be paid. Shippers would be protected from monopoly
6

power because they could negotiate a long-term contract before they invested in facilities on a railroad’s
lines (Gomez-Ibanez 2003). Shippers could appeal to the ICC (and later to its successor, the Surface
Transportation Board) in the event of an impasse, but only if the railroad was insisting on tariffs that were
more than 180 percent of its variable costs and certain other tests were met.
The effect of the Staggers Act was to allow the competitive market, not regulation, to drive
railroad decision-making. Private long-term contracts gave railroads and shippers the protection they
needed to make specialized cost-saving investments tailored to particular freight movements. The use of
dedicated unit trains to carry coal and other bulk commodities spread rapidly, for example, because of the
ability to customize services and assure long-term shipper commitments. These and other innovations led
to substantial productivity gains and cost reductions (Bitzan and Keeler 2003, Chapman and Martland
1997). Revenue ton-miles per employee-hour increased more than 320 percent from 1980 to 2002, for
example, while gallons of fuel per revenue ton-mile dropped 41 percent during that same time period. As
part of the effort to improve productivity, railroads shed excess and underutilized lines while improving
core operations. Light density lines were often sold to specialized short-line operators, whose flexible
work rules and low cost structures enabled them to compete with other modes for traffic.
Competition also brought new service offerings to customers. Many of the innovations addressed
the need for the railroads to compete with trucks. Intermodal traffic (trailers and containers moving on
railroad flatcars) became the fastest growing segment of railroad traffic as railroads found their niche in
this very competitive sector by leveraging lower line-haul costs. Ironically, trucking companies–
competitors with railroads–have become major railroad customers. Railroads have also entered the
logistics services arena to increase their ability to compete with trucks. For example, railroads have been
developing logistics parks that integrate rail, truck, and transload services with warehousing capabilities
to serve major markets.
United States policies that enabled freight railroads to create new services and lower costs have
resulted in the United States railroads dramatically improving their financial position. Net railway
operating income grew from $485 million in 1970 to $3.9 billion in 2000. Return on net investment
7

improved from 1.7 percent to 6.5 percent between 1970 and 2000, according to data from the Association
of American Railroads. From a social welfare perspective annual gains have been measured in billions of
dollars (Winston et al. 1990; Peltzman and Winston 2000).
The European Union. The European railroad system is profoundly influenced by the fact that it
developed as a set of national networks focused primarily on domestic rather than international traffic
(ECMT 2003; Meersman and Van de Voorde 2004). Thus, rail networks in countries such as France and
Spain mainly have corridors radiating from their capitals. Not only were country-centric networks
constructed, but little attention was paid to interoperability of equipment or crews. At borders,
locomotives and crews often must be changed because of different signal and electrification systems and
train crew licensing requirements as well as pressure from labor unions. Spain represents an extreme case
where the track gauge is different than its neighboring countries making interoperability an overwhelming
technical hurdle (Izquierdo and Vassallo 2004).
Most European railroads were nationalized after World War II, and their primary objective
continued to be the domestic movement of people and goods (Lewis, Semeijn and Vellenga 2001). In
most cases transporting people took priority over freight. This was seen in the allocation of track time
and in the investment in passenger rolling stock and infrastructure (ECMT 1998). The absence of market
incentives for innovation and rate freedom together with the continued improvements in truck, bus, auto
and air service, contributed to worsening financial performance (Cantos and Maudos 2001).
The creation of the European Economic Community in 1957 called the nationally focused
strategies into question since the benefits of a Common Market depended on cross-border trade. Road
operators made the transition to an “EU transportation mode” fairly quickly while the railroads lagged
(Commission of the European Communities 2001). But the resulting growth in highway traffic increased
traffic congestion and air pollution. Average traffic speeds have declined, an increasing portion of fuel is
consumed in traffic jams, and the cost of traffic delays has been estimated at two percent of GDP in
Europe (Ribbink 2005).
8

During the 1990s European Union policy makers responded to the shift to highway modes with a
series of directives designed to make rail more competitive. The key reform, set out in a 1991 EEC
Directive (number 91/440) was to require the national railroads to separate their train operations from the
management of track, stations and other infrastructure and to allow independent train operators to use the
infrastructure. The idea behind this directive was that while infrastructure was a natural monopoly, train
operations were not. Infrastructure would be managed as a regulated entity, providing equal access to all
train operators. The hope was that open access to the tracks would encourage new service offerings,
innovations and cost reductions (Rothengatter 1991). Separation of infrastructure from operations was
thought particularly important to promote pan-European traffic since independent train operators could, at
least in principle, provide seamless international through services.
The European Union allowed member countries wide latitude in deciding how to separate
infrastructure from train operations and, provided a generous timetable for achieving separation,
particularly for domestic services. However, certain obstacles, such as equipment compatibility and
interoperability, have proven more difficult than originally expected. There is considerable variation
among the member states in the progress they have made in separation and the means employed. Britain
is arguably furthest along in that infrastructure and operations are fully unbundled and the train
companies are all privately owned (Kain 1998; Dunn and Perl 2001; Helm 2001; Haubrich 2001).
Germany is close behind Britain while other countries are still in the first stages of applying the European
Union policy (Henry and Quinet 1999; Izquierdo and Vassallo 2004).
The European Union Ministers placed renewed emphasis on improving rail in their 2001 White
Paper on Transport. The paper outlines rail’s problems–lack of suitable infrastructure, constrained
interoperability, limited innovation, non-transparent costs and poor reliability. The document also
reiterates that open access to infrastructure is the key reform and establishes the objective of increasing
the rail’s share of the European freight market from 8 percent to 15 percent by the year 2020.
9

III. Data Sources
The primary source of data on rail shares in Europe is the Eurostat Transport Database. Eurostat
is the Statistical Office of the European Community and its mission is to gather and adjust data from the
different member statistics offices in order to provide consistent data to European institutions. European
Union freight traffic can be divided into three categories: (1) intra-country traffic (that originates and
terminates within a single EU country), (2) intra-EU traffic (that originates and terminates in different EU
countries) and (3) extra-EU traffic (that originates or terminates within the EU but is destined for or
originates outside the EU). The Eurostat database provides the most detailed data on intra-country traffic,
including freight volumes broken down by mode, commodity type, and distance traveled. The database
has less detailed information for intra-EU traffic; in particular, it gives rail and road tonnage by
commodity type but it does not specify the distances traveled, only the countries of origin and destination.
To estimate the intra-EU distances we used the average distance between the primary industrial centers of
the origin and destination countries. Eurostat provides only aggregated data on extra-EU rail
transportation, so this traffic segment, which is relatively small, is not included in the analysis.
The United States data on rail shares is drawn primarily from Rebbie Associates’ (now Global
Insight’s) Transearch Database, but is adjusted with information from the US Census of Transportation.
Transearch is widely used by carriers and governments for evaluating transportation issues because it
provides much more detailed data than the US Census. The Transearch database consists of an enormous
sample of individual shipments including mode, origin, destination, commodity, and tonnage. The origin-
destination information is used to estimate the distance for each shipment. One problem with the
Transearch data is that it is thought to oversample long distance truck shipments and undersample short
distance truck shipments compared to figures from the Census. Consequently, we distributed the
Transearch road tons by the Census mileage blocks to assure consistency with the official Census data.
A great deal of effort was required to ensure that the commodity classifications and distance
categories in the European and US data were consistent. Commodities are classified into seven
categories: agricultural products, coal/solid mineral fuels, petroleum products, iron ore/steel/metal
10

products, building products, chemical/fertilizer, and machinery/manufactured articles. The detailed
definitions of the categories are provided in Appendix A. Of note, the code 24 of NST/R “Miscellaneous
articles”, 46 of STTC “Miscellaneous mixed shipment”, and 40 of SCTG “Miscellaneous” include
manufactured articles that are shipped in containers.
The distance blocks adopted are conditioned by the information available. The Eurostat database
provides aggregated information in only 7 blocks: 0 – 50 km, 50 – 150 km, 150 – 500 km, 500 – 1,000
km, 1,000 – 2,000 km, 2,000 – 6,000 km, and more than 6,000 km. In order to compare the information,
the United States data are aggregated according to the European Union blocks.
IV. Inherent Differences and Their Effects on Rail Share
The starting point for assessing the rail share difference between the United States and the
European Union is to estimate the impact of the key inherent differences—competitive position of water
and pipeline modes, shipment distances, and commodity mix. The European freight volume across all
modes totaled 3,068 billion ton-kilometers in 2000. The United States rail share in that year was 38
percent. If the European railroads had captured the same share of freight traffic as the United States
railroads, they would have carried 1,165 billion ton-kilometers of freight, 974 billion ton-kilometers
greater than the 201 billion ton-kilometers1 the European railroads actually carried that year. The impact
of each inherent difference is explained below.
Water and Pipeline. As Table 1 shows, coastal and inland waterways carry 45 percent of all
freight in the European Union compared to 20 percent in the United States, a difference presumably due
in large part to Europe’s longer coastline. The importance of coastal and waterway shipping in Europe
probably also contributes to the fact that pipelines carry only 3 percent of freight in Europe compared to
12 percent in the United States. Many of the commodities that move by pipeline in the United States,
particularly petroleum and its byproducts, move by coastal and inland waterway shipping in Europe.
1 The EU railroads actually carried 240 billion ton-kilometers. 38 billion ton-kilometers were extra-EU shipments, which were excluded because of the data limitation described above.
11

Table 1: Freight Mode Share (Ton-kilometers in millions)
US EU-15 US EU-15 US EU-15
Railroad 2,468,206 240,000 38.00% 7.82% 58.82% 15.11%
Road 1,728,066 1,348,000 26.60% 43.94% 41.18% 84.89%
Rail + Road 4,196,272 1,588,000 64.60% 51.76% 100.00% 100.00%
Barge 814,154 125,000 12.53% 4.07%
Pipeline 992,753 85,000 15.28% 2.77%
Coastwise 492,354 1,270,000 7.58% 41.40%
Other Modes 2,299,261 1,480,000 35.40% 48.24%
Total 6,495,533 3,068,000 100.00% 100.00%
Rail + Road ShareAll modes shareTon*KmYear 2000
To control for the impact of Europe’s more extensive coastline and waterways, this analysis focuses on
railroad versus road transportation and excludes water and pipeline shipping. Pipeline shipments are also
excluded because the petroleum and other products typically carried by pipelines are generally not carried
in large volumes by railroads. Finally, and as a practical matter, there is relatively little data on coastal
shipping by commodity type and distance for either the United States or Europe.
If water and pipeline traffic is excluded, rail’s share of freight increases from 38 percent to 58
percent in the United States and from 8 percent to 15 percent in Europe (see again Table 1). European
railroads and trucks carried 1,588 billion ton-kilometers in 2000 and if the European railroads had
captured the United States share of this traffic (58 percent) they would have carried 934 billion ton-
kilometers. Thus, water and pipeline characteristics explain 232 billion ton-kilometers (1,165 billion –
934 billion) of the US-EU freight volume gap (see Table 3). A more detailed explanation of this
calculation is provided in Appendix B. Since we have eliminated water and pipeline, the remainder of the
analysis considers only road and rail.
Shipment Distance. As Figure 2 shows, average shipping distances are substantially greater in
the United States than in Europe for every major commodity type except petroleum products. The
12

average distance for all road and rail shipments was 132 kilometers in Europe versus 386 kilometers in
the United States.
Figure 2: Comparison of Average Length of Haul in the US and EU
Road + Railroad
0200400600800
1,0001,200
Agricu
ltural Coal
Pretrol
eumMeta
ls
Constru
ction
Chemica
l
Manufac
tures
Total
Km
EUUSA
Rail becomes more competitive with truck as shipment distance increases because rail’s lower
line-haul cost becomes more important with longer distances. As Figure 3 shows, in the United States
rail’s share increases from only 3 percent in the 0-50 km block to 38 percent in the 500-1000 km block
and even more in the 1000-2000 km block. Every commodity type has the same pattern. In Europe rail’s
share also increases with distance but more gradually and it falls off for distances exceeding 1000
kilometers. Rail’s share of European road and rail traffic increases from 2 percent in the 0-50 km block to
21 percent in the 500-1000 km block, but then falls to 14 percent in the 1000-2000 kilometer block. The
low share of rail in the longer-distance blocks is probably due in part to the difficulties with cross-border
shipments in Europe, a problem analyzed in the next section.
13

Figure 3: Rail Share of Road and Rail Traffic
by Mileage Block for all Commodities
All Commodities
0%10%20%30%40%50%60%70%80%
0-50 50-150 150-500
500-1000
1000-2000
2000-6000
Block (Km)
Railroad (EU)Railroad (USA)
If the European railroads were able to capture the same share of truck and rail traffic by distance
block as the United States railroads did, then European railroads would have carried 521 billion ton-
kilometer. Shipment distance therefore explains 413 billion ton-kilometers of the gap (from 934 billion to
521 billion). It is notable that this adjustment for Europe’s shorter shipment distances is more important
than the previous adjustment for Europe’s more extensive water transportation (see Table 3). The
adjustment for distance is described in more detail in Appendix B.
Commodity Mix. A third intrinsic difference between Europe and the United States is
commodity mix. As Figure 4 shows, the commodities carried are similar with two important exceptions:
coal and manufactured goods. Coal accounts for almost 23 percent of rail and truck ton-kilometers in the
United States but only 1 percent in Europe. Manufactured goods, by contrast, account for only 10.5
percent of rail and truck ton-kilometers in the United States but 34 percent in Europe. Since railroads are
generally more competitive in carrying bulk lower-value commodities, these differences in commodity
mix favor railroads in the United States and disadvantage railroads in Europe.
14

Figure 4: Comparison of EU and US Commodity Mix
(Percent of road and rail total volume in ton-kilometers)
Rail+Road
0.00%5.00%
10.00%15.00%20.00%25.00%30.00%35.00%40.00%
Agricu
ltural Coa
l
Pretrol
eumMeta
ls
Constr
uction
Chemica
l
Manufac
tures
EUUSA
If the European railroads had the same share of road and rail traffic by commodity type and
distance block as the United States railroads did, then the European railroads would have carried 397
billion ton-kilometers in 2000. This final adjustment for commodity mix is the smaller than the previous
adjustments for coastlines and distances, reducing the European railroads’ expected traffic by only 124
billion ton-kilometers (from 521 billion to 397 billion). Table 2 shows the contribution of individual
commodities to the 124 billion ton-kilometer differential. The main effect of the commodity adjustment is
to reduce the expected coal traffic and increase the expected manufactured goods traffic on the European
railroads.
Table 2: Detailed Impact of Commodity-Mix (Million of Ton-Kilometers)
Agricultural Products
Coal and Solid
Mineral Fuels
Petroleum and
Products
Iron Ore, Steel and
Metal Products
Cement, Building Products
Chemical and
Fertilizers
Machinery and Manuf.
ArticlesTotal
28,880 -217,898 4,414 5,118 -6,100 -30,843 92,748 -123,680
Million of ton-km (Year 2000)
Commodity Mix Effect
15

Table 3 summarizes the adjustments made to the expected European rail traffic to account for
intrinsic differences between Europe and the United States. If the United States rail share is multiplied by
the freight volumes carried by all modes in Europe, European railroads should carry 1,166 billion ton-
kilometers instead of 201 billion. But this simple calculation implicitly assumes that the European
railroads enjoy the same weak water competition, long commodity distances, and heavy coal movements
that United States railroads benefit from. If the effects of water competition, distance, and commodity
mix are adjusted for, the expected European rail traffic would be 397 billion ton-kilometers, or a little less
than twice as much as actually carried. Table 4 breaks the residual difference or shortfall of 196 billion
ton-kilometers down by commodity type. The potential rail traffic gains are concentrated in agricultural
products, coal, manufactured goods, and chemical and fertilizers. In metal products, however, the
performance of the railroads in Europe appears stronger. The “negative” potential for iron, steel and
metal products reflects the comparative success of European Union rail in capturing medium distance
shipments that account for the bulk of this commodity’s volume. This could result from advantageous rail
infrastructure, custom design services or subsidies.
Table 3: Summary of the Rail Share Differential Methodology and Results (Million of Ton-
Kilometers)
Number of ton-km moved
Role of water and pipeline
Distribution of tones by
distance block
Commodity-mix
Rail share / (rail + road)
by commodity and block
Million of tone-
kilometers
Increase or Decrease
Explanatory Effect
EU 201,083
US 397,262
4 196,179 Residual
EU EU EU EU
US 520,942
3 123,680 Commodity Mix Effect
EU EU EU EU
US 934,046
2 413,104 Distance Effect
EU EU EU US
US 1,165,794
1 231,748Effect of water competitionEU EU US US
EU US US US
Step
ASSUMPTIONS RESULTS
16

Table 4: Breakdown of Shortfall by Commodity (Million of Ton-Kilometers)
Agricultural Products
Coal and Solid
Mineral Fuels
Petroleum and
Products
Iron Ore, Steel and
Metal Products
Cement, Building Products
Chemical and
Fertilizers
Machinery and Manuf.
ArticlesTotal
Current EU 25,491 9,770 12,451 46,725 18,120 18,739 69,822 201,118
124,836 26,175 13,753 26,701 28,183 37,444 140,170 397,262
Residual 99,345 16,405 1,302 -20,024 10,064 18,705 70,348 196,145
Increment 389.73% 167.90% 10.46% -42.86% 55.54% 99.82% 100.75% 97.53%
Potential EU
Million of ton-km (Year 2000)
We interpret this 196 billion ton-kilometer shortfall as the likely consequence of different public
policies toward railroads and trucking in Europe and the United States. In other words, if Europe’s
relevant policies were the same as those in the United States’, European railroads might have carried
almost twice as much freight in 2000 as they actually did.
V. Possible Policy Explanations
This residual volume is assumed to reflect a combination of policies—some favor European
Union rail share and others serve to disadvantage rail’s competitive position. This section details the
policy differences that may have contributed to the differences in rail share. The discussion is at a macro-
level, more detailed analysis is required to understand the direct impact of each policy consideration. We
note that this section is somewhat speculative; however our objective is to provide a discussion of
relevant policies. One policy difference which is unlikely to impact the residual is the European Union's
requirement to separate infrastructure from operations and require open access. Our data on rail shares
are from 2000, when many European countries were just beginning to comply with the vertical
unbundling regulations, therefore, given our data set, such an analysis would be premature.
European Policies Favoring Rail Freight. In two respects, European transport policy favors
rail freight more than United States transport policy does, which makes the European rail traffic shortfall
17

somewhat surprising. First, road fuel prices are higher and road tolls more prevalent in the European
Union than in the United States. Diesel prices vary over time and by geography but generally fuel prices
in Europe are about twice that of the United States. With respect to road tolls, Table 5 shows that for
relevant European countries user fees are charged to use between 12 and 30 percent of their trunk
network. In contrast, only 1.3 percent of the United States interstate trunk highways are toll roads. Table
5 illustrates that toll fees per kilometer were comparable in the United States and the European Union.
Table 5: Road charges applied in some European Countries and in the United States in 2000
Country Charging mechanism Truck Fees
Kilometers in which the
charges are applied(*)
Percentage of the trunk network
Belgium Vignette 8.000 €/day 1,702 13.6 %
France Toll 0.196 €/km 7,840 27.9 %
Fee by Km 0.136 €/kmGermany
Vignette 8.000 €/day11,800 28.6 %
Italy Toll 0.100 €/km 5,563 12.1 %
Spain Toll 0.154 €/km 2,783 13.8 %
United States Toll 0.150 €/km 4,529 1.3 %
(*) US data in 2003
Second, Europe subsidizes its freight railroads more heavily than the United States although
precise comparisons are difficult. The principal subsidies in the United States are restricted to passenger
services2. United States freight railroads are not subsidized directly, and in fact pay substantial corporate
income taxes ($538 million in 2001) and property taxes to federal, state and local governments. The
European railroads receive substantial subsidies that support both passenger and freight operations. Table
6 shows that the vast majority of rail service subsidies support passenger services. However, more than
half of total railroad subsidies support infrastructure facilities, which are shared by both passengers and
freight.
2 The federal government spends approximately $1 billion per year to cover the deficit of Amtrak, and state and local governments spend a significant amount supporting commuter rail services.
18

Table 6: Public Budget Contributions to European Railroads (year 2001)
Form of payment EU-15 (million Euros)
Passenger Services 11,541
Freight Services 275
Infrastructure and Capital Investment 18,364
Others 8,126
Total 38,306
Source: NERA
European Policies Disadvantaging Rail Freight. European transport policies seem to
disadvantage rail freight in several ways, but probably the most important of these is the priority that is
given to passenger service. Rail carries 6.25 percent of all intercity passenger traffic in Europe compared
to 0.3 percent in the United States. (It is interesting to note that the improvement in rail position in the
United States coincides with the shedding of passenger services.) Freight and passenger services share 70
percent of railroad infrastructure in Europe and only 12 percent is exclusively devoted to freight
transportation. Track capacity is limited, thus, to the extent that it is used for passenger trains, it is
unavailable for rail freight. However, passenger operations are generally concentrated in the morning and
evening hours. There are thus many hours for freight operations; although, the scheduling task becomes
more complex.
A second way in which rail freight is probably disadvantaged in Europe is the lack of
interoperability at the borders and its consequent delays. The estimation of the policy impact includes the
effect of the borders since we applied the market share of the United States whose network, although built
by independent companies, was designed for interoperability; in strong contrast to the nationally focused
European Union railroads. Figure 5 shows the comparison of European Union international rail shares
along with United States rail share. As expected the United States share increased with distance. The
same was true for European international rail freight when shipment distances are lower than 1,000 km.
The evidence of a borders effect in Europe is that the international share declined in the distance blocks
19

above 1,000 kilometers (see Figure 5). The international transportation share in Europe in the shorter
mileage blocks does not seem to be much lower than in the United States. A possible explanation for this
result is that most of the short haul international transport in Europe takes place in central Europe, where
there are fewer interoperability problems.. Thus the borders effect may be higher in the more peripheral
countries such as Spain. The results of this analysis should be approached with caution, since the
international transportation by distance block was estimated on the basis of the origin-destination matrix
among the European Union countries. Nevertheless, Europe’s lower market share in long-distance blocks
seems to imply that policies facilitating cross-border movements of rail freight are likely to increase rail
share in Europe.
Figure 5: Impact of Borders on Rail Share
Rail / (road + Rail) market share
0%10%20%30%40%
50%60%70%80%
EU-15 International USA
0-50 km50-150 km150-500 km500-1000 km2000-6000 kmSeries6
A third policy difference that may limit rail freight in Europe is the lack of productivity-
enhancing infrastructure in Europe. Evidence of this gap includes the substantially longer freight trains
that operate in the United States compared to the European Union. In the United States, unit trains are
typically more than 1,500 meters which is more than two times longer than those in Europe. In addition,
the United States has an extensive rail network operating double-stack container services. This technology
doubles productivity in those trains.
20

A fourth policy area of concern is the incentives of the rail operators. It is notable that United
States freight rail share accelerated in the 1980s following deregulation. Many European Union countries
have seen similar results when competition has been introduced in other sectors such as electricity,
telecommunications, and air transportation. Railroads in Europe are implementing an important reform in
order to introduce competition: unbundling infrastructure from operation. In 2000, only some countries
had seriously implemented this new approach, so it is too early to evaluate its effectiveness.
Potential policy actions to increase European rail freight share. Four policies appear to hold
promise for increasing European rail freight share. First, increasing interoperability through technical
means (e.g. unifying signal systems) and training (e.g. locomotive drivers that are qualified in multiple
countries) would be expected to yield greater rail shares for longer-distance shipments. We consider
increasing interoperability to have high impact based on our share analysis. Implementing this policy
would be challenging from the prospective of both coordination and funding. However, these challenges
can be overcome.
Second, and probably most challenging, is balancing the needs of both passenger and freight
services. We recognize that passengers would remain the priority in Europe. Notwithstanding the need for
passenger service, there are opportunities to focus on freight. For example, as new infrastructure for high
speed services is built, existing lines can be refocused on freight. Optimizing freight and passenger
schedules would likely increase freight carrying capacity without deteriorating passenger services. The
high potential for rail growth that these measures can have makes the effort worthwhile.
The third policy change is enhancing infrastructure. Adding track and improving signaling can
permit both longer trains and higher speeds, thus increasing rail freight productivity. These approaches
are capital intensive. Consequently, a financial assessment is required to confirm that the traffic growth
would provide a solid return on investment.
The final policy area is promoting competition for rail freight. The experience in the United
States demonstrates the value of competition. Several European countries (encouraged by the European
Union) have already launched efforts to increase competition. As a result, several rail companies are
21

forming with management teams exclusively focused on rail freight. These efforts should be evaluated as
they establish a longer track record. We expect that these projects will yield benefits, and that competitive
principles can be applied more broadly throughout the European Union. An additional benefit of
fostering independent rail freight operators is the value of dedicated management. The single focus on
freight enables the management team to better understand costumer needs and develop responsive service
products. It also enables investment decisions to reflect the needs of the freight market. As noted above,
passenger service is the priority in Europe. Thus, it is unlikely that freight can receive the sufficient
attention in rail companies providing both freight and passenger services.
VI. Summary and Further Research
Three key conclusions emerge from the research. First, the shorter freight distances and more
competitive coastal transportation in Europe are the main factors explaining the difference between
European Union and United States rail share. Second, commodity mix is not materially different in the
two geographies, and, even though this factor has some influence in the market share explanation, its
influence is limited. Third, notwithstanding the structural factors noted above, there is substantial
opportunity for European rail share gains through changes in policy. Estimated conservatively, the
potential rail share gains resulting from policy actions could increase current European Union rail share
97 percent or 196 billion ton-kilometers (see Figure 6). The gains due to an increase of efficiency can be
even larger since, unlike the United States, the European Railroads are subsidized and the fuel taxes in
Europe are substantially higher than in the United States. Four policy areas warrant investigation: the
impact of interoperability on the long distance rail market share, the opportunity to both segregate freight
operations and more effectively operate joint freight and passenger services, the influence of better
infrastructure to support freight operations, and the effect of fostering competition on efficiency gains.
22

Figure 6: Summary Explanation of EU and US Rail Share Differential
0
200,000
400,000
600,000
800,000
1,000,000
1,200,000
1,400,000
EU Traffic atUS RailShare
Effect ofWater
Competition
DistanceEffect
CommodityMix Effect
Residual EU Traffic
Mill
ion
Ton-
Km
Overall, our findings support the feasibility of the European Union Commission’s goal stated in
the 2001 White Paper to increase European Union rail freight share from 8 to 15 percent. However, the
structural differences between the European Union and the United States make it unlikely that the
European Union would ever approach the United States 38 percent rail share benchmark.
Additional research will enable the refinement of this macro analysis. Specifically, further work
may improve our estimates of the impact of intrinsic differences between the European Union and the
United States. More in-depth study of the four policies highlighted above can confirm their relevance and
size as well as identify additional high-impact policies.
Acknowledgements
We wish to thank Professor Jose Antonio Gómez-Ibañez of Harvard University for his
inspiration, direction, and sustentative input.
23

References
Bitzan, D. and Keeler, T.E. (2003) Productivity Growth and Some of its Determinants in the
Deregulated U.S. Railroad Industry. Southern Economic Journal Vol. 70, 232-253.
Cantos, P. and Maudos, J. (2001) Regulation and Efficiency: the Case of European Railways.
Transportation Research Part A Vol. 35, 459-472
Chapman, J.D. and Martland, C.D. (1997) Railroad Track Productivity: A Historical Perspective.
Transportation Quarterly Vol. 51, 105-118.
Commission of the European Communities (2001) White Paper. European Transport Policy for 2010:
Time to Decide. COM (2001) 370. Brussels.
Dunn, J.A. and Perl, A. (2001). Toward a ‘New Model Railway’ for the 21st Century: Lessons from Five
Countries. Transportation Quarterly Vol. 55, 43-57.
ECMT (1998) Rail Restructuring in Europe, European Conference of Ministers of Transport, OECD,
Paris.
ECMT (2003) The European Integration of Rail Freight Transportation. Round Table 125, European
Conference of Ministers of Transport, OECD, Paris.
Gomez-Ibanez, J. (2003) Regulating Infrastructure: Monopoly, Contracts, and Discretion, Harvard
University Press, Cambridge, MA.
Haubrich, D. (2001) UK rail privatization five years down the line: an evaluation of nine policy
objectives. Policy and Politics Vol. 29, 317-336.
Helm, D. (2001) The assessment: European Networks–Competition, Interconnection, and Regulation.
Oxford Review of Economics and Policy Vol. 17, 297-312.
Henry, C. and Quinet, E. (1999) Which Railways Policy and Organization for France? Journal of
Transport Economics and Policy Vol. 33, 119-126.
Izquierdo, R. and Vassallo, J.M. (2004) Nuevos Sistemas de Gestión y Financiación de Infraestructuras
de Transporte, Colección SEINOR 35, Colegio de Ingenieros de Caminos, Canales y Puertos, Madrid.
24

Kain, P. (1998) Developments in Transport Policy: The Reform of Rail Transport in Great Britain.
Journal of Transport Economics and Policy Vol. 32, 247-266.
Keeler, T. (1983) Railroads, Freight, and Public Policy, The Brookings Institute, Washington, D.C.
Lewis, I., Semeijn, J., and Vellenga, D.B. (2001) Issues and Initiatives Surrounding Rail Freight
Transportation in Europe. Transportation Journal Vol. 41, 23-31.
Meersman, H. and Van de Voorde, E. (2004) Not all dreams are deceptive. An economic analysis of
the market potential rail freight. Rail International Vol. 35, 16-29.
NERA (2004) Study of the Financing of and Public Budget Contribution to Railways. Final Report for
European Commission DG TREN. London.
Peltzman, S. and Winston, C. (2000) Deregulation of Network Industries. What’s Next? The Brookings
Institution, Washington D.C.
Ribbink, D. Van Riel, A.C.R. and Semeijn, J. (2005) Policy Decisions and Modal Choice: An Example
from the European Union. Transportation Journal Vol. 44, 33-44.
Rothengatter, W. (1991) Deregulating the European Railway Industry: Theoretical Background and
Practical Consequences. Transportation Research Part A Vol. 25, 181-191.
Winston, C. (2004). The transformation of the U.S. Rail Freight Industry. Proceedings of the
Competition in Rail Transportation Seminar. Fundación Rafael del Pino. Madrid September 16th and 17th
2004.
Winston, C., Corsi, T.M., Grimm, C.M. and Evans, C.A. (1990) The Economic
Effects of Surface Freight Deregulation, The Brookings Institution, Washington, D.C.
25

Appendix A Groups of commodities according to the UE NST/R codes,
the US STTC codes, and the US SCTG codes UE NST/R Codes
(EUROSTAT)US STTC Codes (TRANSEARCH)
01 Cereals 01 live animals and live fish
08 Alcoholic beverages
02 Potatoes, other fresh or frozen fruits and vegetables 02 Cereal grains 09 Tobacco products
03 Live animals, sugar beet 03 Other agricultural products
04 Wood and cork 08 Forest products 04 Animal feed
05 Textile materials 05 Meat, fish and seafood
06 Foodstuff and animal fodder
06 Milled grain and bakery
07 Oil seeds and oleaginous fats 07 Fats and oils
COAL AND SOLID MINERAL FUELS 08 Solid minerals fuels 11 Coal 15 Coal
09 Crude petroleum 13 Crude oil 17 Gasoline and aviation fuel
10 Petroleum products 29 Petroleum products 18 Fuel oils
11 Iron ore, iron and steel waste 10 Metal ores 14 Metallic ores
12 Non-ferrous ores and waste 33 Primary metals 32 Base metal
13 Metal products 34 Fabricated metals 33 Articles of based metal
24 Lumber and wood products 10 Building stone 13 Nonmetallic
minerals
32 Clay, concrete, glass, stone 11 Natural sands 26 Wood products
15 Crude and manufactured minerals 14 Non metallic minerals 12 Gravel and stone 31 Nonmetallic
minerals products
16 Natural and chemical fertilizers
19 Coal and petroleum prod.
23 Chemical products
17 Coal chemicals, tar 20 Basic chemicals 24 Plastics and rubbers
18 Other chemicals 21 Pharmaceutical products 27 Pulp and paper
19 Paper pulp and waste paper 26 Pulp, paper and allied products 22 Fertilizers
37 Transportation equipment 28 Paper articles 37 Transport
equipment
35 Machinery 29 Printed products 38 Precision instruments
21 Manufactures of metal 30 Textiles 39 Furniture
22 Glass, glassware, ceramic products 34 Machinery 40 Miscellaneous
23 Textile 25 Textile mill products 35 Electronic equipment
24 Miscellaneous articles 46 Miscellaneous mixed shipment 36 Vehicles
US SCTG Codes (CENSUS)
25 Logs and other wood in the rough
20 Transport equipment
28 Chemical and allied products
20 Food products
01 Farm products
14 Cement, lime, manufactured building materials
MACHINERY AND MANUFACTURED ARTICLES
CHEMICALS AND FERTILIZERS
IRON ORE, STEEL AND METAL PRODUCTS
AGRICULTURAL PRODUCTS
BUILDING PRODUCTS
PETROLEUM AND PRODUCTS
26

Appendix B:
Adjustments for Inherent Differences
Water and Pipeline. To account for the difference in water availability, the EU volume at US rail share
was reduced by the ratio of US road plus rail share to EU road plus rail share as expressed in Formula 1
below. The resulting volume deduction is 232 billion ton-kilometers.
⎥⎦
⎤⎢⎣
⎡−⋅⋅=
USUS
EUEU
US
USEUom TRR
TRRTRTr 1
omUS
USEUom r
TRTR −⋅=
(1)
=omr Other mode effect on rail transportation (ton-kilometers)
=omR Rail transportation controlling by other modes effect (ton-kilometers)
=EUT Total transportation in the EU in ton-kilometers
=UST Total transportation in the US in ton-kilometers
=USR Rail transportation in the US in ton-kilometers
=USRR Rail plus Road transportation in the US in ton-kilometers
=EURR Rail plus Road transportation in the EU in ton-kilometers
The reduction of rail plus road is calculated according to Formula 2.
⎥⎦
⎤⎢⎣
⎡−⋅=
EU
EU
US
USEUom T
RRT
RRTrr
omUS
USEUom rr
TRRTRR −⋅=
(2)
=omrr Other mode effect on rail plus road transportation (ton-kilometers)
=omRR Rail plus Road transportation controlling by other modes effect
27

Shipment Distances. The impact of the shorter distances in the EU is estimated by comparing the effect
on the railroad share when the US distance-block distribution is substituted for the EU distance-block
distribution. As shipment distances are larger in the US than in Europe and railroads are more favorable
for long distances than road, this calculation gives us the distance effect or, in other words, the part of the
market-share difference between Europe and the United States that is explained by distance. The
calculation is detailed below.
( ) ⎟⎟⎠
⎞⎜⎜⎝
⎛⋅−⋅⋅=∑∑
=
=
=
=ijUS
ijUSij
EUijUS
ni
i
mj
j
jUSomd RR
RDBDBCMRRr1 1
domdom rRR −=/
(3)
=dr Distance effect on rail transportation (ton-kilometers)
=domR / Rail transportation controlling by other modes effect and distance effect (ton-
kilometers)
=m Number of commodities
=n Number of distance blocks
=jUSCM ∑
=
=
mj
j
jUS
jUS RRRR
1 (Commodity-mix distribution in the US)
=ijUSDB ∑
=
=
mi
i
ijUS
ijUS RRRR
1 (Distance-block distribution in the US)
=ijEUDB ∑
=
=
mi
i
ijEU
ijEU RRRR
1 (Distance-block distribution in the EU)
=ijUSR Rail transportation in the US in ton-kilometers (distance block i and commodity
j)
=ijUSRR Rail plus Road transportation in the US in ton-kilometers (distance block i and
commodity j)
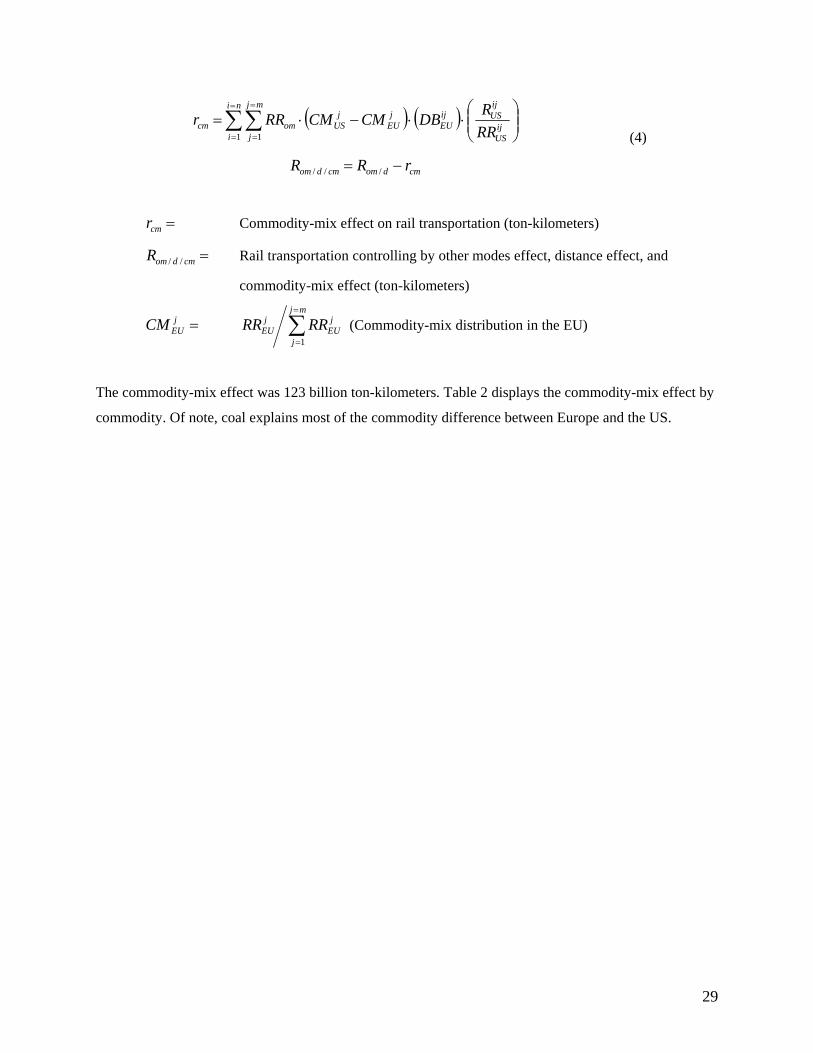
Commodity Mix. The commodity-mix effect is calculated as the difference between the ton-kilometers
that the EU would move if the EU followed the pattern of the US in terms of commodity mix. The
commodity mix effect is calculated according to equation 4.
28
( ) ( ) ⎟⎟⎠
⎞⎜⎜⎝
⎛⋅⋅−⋅=∑∑
=
=
=
=ijUS
ijUSij
EU
ni
i
mj
j
jEU
jUSomcm RR
RDBCMCMRRr1 1
cmdomcmdom rRR −= ///
(4)
=cmr Commodity-mix effect on rail transportation (ton-kilometers)
=cmdomR // Rail transportation controlling by other modes effect, distance effect, and
commodity-mix effect (ton-kilometers)
=jEUCM ∑
=
=
mj
j
jEU
jEU RRRR
1 (Commodity-mix distribution in the EU)
The commodity-mix effect was 123 billion ton-kilometers. Table 2 displays the commodity-mix effect by
commodity. Of note, coal explains most of the commodity difference between Europe and the US.
29