research training and support: institutional impact on ...aabri.com/sa12manuscripts/sa12124.pdf ·...
TRANSCRIPT

SA12124
Research Training and Support: Institutional Impact on
Publications
Stuart R. Monroe
Metropolitan State College of Denver
Denver, Colorado, USA
Rakesh Kumar
Aksum University
Axum, Ethiopia
Dr. Aklilu Hailemichael
Aksum University
Axum, Ethiopia
2
ABSTRACT The objective of this study was to identify and describe the Aksum University (AKU)
faculty’s training and support needs for academic research as a basis of improvement in the
productivity of academic research publications. The stratified random sample was 51 faculties
from five of the six colleges in Aksum University representing 16.3% of the on-campus teaching
faculties. The hypotheses of the study were: (a) training in data analysis and research paper
writing is needed; (b) faculties know how to do research design and methodology; (c) faculties
need internet access; (d) research training does not impacts teaching; and (e) there are no
qualified faculties at AKU for research training. Two Principle Component Analysis factors
related to these hypotheses were described as a training factor TFAC1(I need training in data
analysis and research report writing ) and a support factor TFAC2 (Internet access is essential
and research class would not interfere with teaching).
Keywords: Training, Support, Research, Publications, University

3
INTRODUCTION The strategic plans for the seventeen new universities in Ethiopia and other public
universities in such countries as China (Ng & Li, 2000), the United Kingdom (Tapper, & Salter,
2004), and the U.S. (Tierney, 1999) have driven administrators (Clarke, 2004) to achieve their
objectives for recognition and their national funding niche through emphasize of academic
research productivity. Since world-wide academic ranking methodologies invariably place a
significant emphasis on faculty research productivity, university leaders and mobile faculty
members are constantly seeking to enhance their personal and institutional research profiles
(Tien & Blackburn, 1996). Over the last decade, Ethiopian university policies have been put in
place to establish better university-government linkages to facilitate economic research
supporting national policy decisions. Universities are strongly encouraged to provide research for
economic and environmental leadership to grow Ethiopia’s emerging global economy.
Factors influencing faculty’s research productivity have been studied for decades (Lotka,
1926). There are a number of factors such as scholarship (Arora & Gambardella, 1996), age and
life cycle (Diamond, 1984), research activity performance of department (Hogan, 1981),
scientific collaboration (Modrego, 1998), quality of training or individual's abilities and skills
(Anderson, 1989; Buchmueller, 1999) and faculty motivation and incentives (Monroe & Kumar,
2011b) have all shown a significant relation to academic research productivity.
Additional research (Szymanski, et al., 2007) demonstrated that research training
environments (RTE) are associated with increased scholarly productivity, especially for early
career professionals. The researcher-practitioner RTE model and internship RTE model were
found to be the most effective in fostering research interests and productivity.
Dora Marinova (2008) documented that government changes in the research funding
methods for universities in Australia that used quantitative indicators such as citations
dramatically increased research productivity. One of the unexpected consequences of the
university funding change was the trend to centralize research activities on the campuses to
optimize overall university research funding and productivity. In summary, the original
productive research universities became increasingly more productive.
Hadhjinicola and Soteriou (2005) identified salary raises and promotions as the most
important factor in the research productivity. Secondly, they found that researcher’s affiliation
with a research center significantly affected the total number of articles published and the
number of articles that appeared in elite journals. A related administrative policy finding showed
that external funding for research activities (i.e. research centers) on real-world problems
promoted higher research productivity. Further, enhanced library facilities (specifically internet
search engines) and the presence of doctoral students were both driving force behind research
productivity and research quality.
Chen, Gupta and Hoshower (2006) utilized expectancy theory to identify key factors that
motivated business faculty to conduct research. Faculty members who attributed high
importance to both intrinsic and extrinsic rewards from research productivity exhibited
significantly higher research outputs. Additionally, untenured faculty members were motivated
by extrinsic rewards. Tenured faculty members were motivated by intrinsic rewards. Overall,
research productivity was positively correlated with tenure status and the percentage of time
allocated to research activities and years in academic employment was negatively correlated with
research productivity. Further, there was no relationship between research productivity and
academic discipline and gender.

4
In the process of obtaining and disseminating knowledge, numerous personal
characteristics impact faculty research productivity. The strength and confidence of the faculty
were confirmed as necessary for high levels of research productivity (Bland et al., 2002).
However, a study by Abramo ,D’Angelo and D’Costa (2008) on the effects of internal and
external collaboration on research productivity found no clear evidence of a correlation between
extramural collaboration and overall productivity of academic research organizations.
Training is expected to develop and strengthen the skills and knowledge of the faculty
which enables them to take up the challenging research activities. Training builds self-
confidence in the minds of faculty (Subrahmanian, 2010). Training is the process whereby
people learn the skills, knowledge, attitude and behavior needed to perform their job effectively.
No educational organization can ignore the training and development (doctorial program) needs
of faculties in research productivity (Subrahmanian, 2010). Research training is a process that
takes place during a faculties’ entire professional life. Research and publication activity can also
be understood as a means of training in itself (Carlson, 1995; Martin, 1983; Irvine, 1980).
On the contrary, Pagey (1981) found most organizations allocate very little of their
budget for the training. Their reasoning was that the effectiveness of training had very little value
added to the organization outcomes.
University faculties are the primary actors in research production systems and ultimately,
it is their skill and knowledge that influence the production of academic research and
publications. This study should be of interest to research directors, college deans, and other
academic leaders engaged in the formulation of institutional research training policies and
procedures that will strengthen the scholarly performance and contributions of faculties.
The objectives of this study at Aksum University (AKU) were to identify and measure
the faculties’ perceived training and support needs for conducting academic research and
creating research publications.
On the basis of the literature review and an AKU organizational environmental analysis, the
following research hypotheses were developed:
• training in data analysis and research publication writing is needed;
• faculties know how to do research design and methodology;
• faculties need internet access;
• research training will not impact classroom teaching time and
• there are no qualified faculties at AKU to provide comprehensive research training.
PROBLEM STATEMENT Ethiopia is one of the largest and most rapidly developing nations in Africa and
conversely, the lowest per-capita income in Sub-Saharan Africa. One of Ethiopia’s primary
strategies to mitigate the negative impact of globalization was to rapidly expand access to
education. This national education initiative required a significant commitment to teacher
recruiting and training to assure the continued eradication of the nation’s poverty. In 2009
approximately 23% of the United Nations Development Program (UNDP) annual capital
infusion was allocated to accomplishing the Ethiopian Education Millennium Development
Goals (MDGs) (UNDP, 2010).
Commencing in 2006, thirteen new Ethiopian Universities were opened that more than
doubled the number of higher education graduates in 2009. An additional four new higher
education campuses were opened in fall 2011 bringing the total number of Ethiopian Universities
to thirty. The total enrollments in Ethiopian post-secondary education is planned to expand from

5
264,000 in 2008-2009 academic year to 467,000 in the 2014-2015 academic year. (FDRE,
2010a). The following excerpt from the UNDP MDG (2010) report illuminates the global
education challenges:
Many MDG Country Reports raised concerns about teacher quality. For example, as
primary education becomes mandatory, the demand for teachers rises, leaving
governments with the unpleasant choice between increasing student-teacher ratios or
hiring less-qualified teachers, at least until a larger supply of certified educators
graduates. The Ethiopia country report observes; “A second challenge [following
regional disparities] relates to the trade-offs between the substantial success in raising the
level of enrolment and the quality of education,” (pg. 23).
In 2005 the Federal Democratic Republic of Ethiopia Ministry of Education (MoE)
(FDRE MoE, 2005) established a National Higher Education Program Action Plan III of
conducting and publishing faculty academic research activities for all institutions of higher
education. Each institution was required to implement an operational strategic plan for faculty
research publications in support of the National initiative. Since 2006, faculties at AKU and
other new Ethiopian universities have received considerable pressure to conduct academic
research with only limited results. Consequently, frustration and anxiety about research
publications remained high for both the faculties and the administrators.
From a 10 year Google Scholar search it was determined that more than 80% of the
academic publications in Ethiopia are from four well established universities. Further, thirty five
of the thirty nine Ethiopian academic journals were published in Addis Ababa (Library of
Congress Overseas Office, 2010).
The research questions for this paper were:
1. At what level are the faculties’ perceived research training and support needs being met
at AKU?
2. What actions should be taken to mitigate the faculties’ perceived research training
deficiencies as a basis for improvement of research productivity?
3. What actions should be taken to mitigate the faculties’ perceived research support needs
as a basis for improvement of research productivity?
4. What organizational changes should be implemented to facilitate faculty research
activities?
5. What employment changes should be implemented to improve the faculties’ commitment
to Ethiopian higher education?
6. What employment changes should be implemented to improve the faculties’
commitment to research productivity in Ethiopian higher education?
METHODOLOGY
Research Design A non-experimental cross sectional design by academic discipline within the target
population was used with five non-equivalent groups with multiple replications to reduce non-
random self-selection bias. This design used a hypothesized expectation based on the pretest
instrument and random interviews of pretest respondents. The design was situational and
implementable. Problems in measurement and database construction were adjusted to improve
the quality of the responses, to eliminate irrelevant variables and to improve the construct and

6
internal validity of the data. Efforts were made to obtain appropriate cross-sections of the
population groups through repeated individual solicitations of responses.
Study Population This study was conducted with the target population of the 2011-2012 on-campus
teaching faculties at AKU. The 313 faculty study population was selected on the basis of the
proximity and accessibility of the campus to the researchers and the newness of the educational
institution and its faculties. Open-ended comments from respondents reflected their appreciation
of the research study in anticipation of changes that may occur to facilitate the implementation of
the strategic research and publication objectives at AKU.
Sampling Method and Sample Statistics Approximately 10 to 25 questionnaires were randomly distributed to faculties in each of
the five Colleges on the main campus, depending on the size of the staff. The College of
Agriculture located in the city of Shire, 65 kilometers from the main campus, was excluded from
the sampling. Collection of the completed questionnaires was tedious; however, through
repeated personal requests a sample size of 51 questionnaires were obtained. The final sample
represented 16.3% of the target population which is statistically adequate to assure the internal
validity of the findings. The number of responses from each of the colleges and the total number
of faculties in each are shown in Table 1.
TABLE 1 Data Collection by College
College # Responses % Responses # in Pop. Resp % Tot Pop.
Business & Economics 15 29.4 66 22.7
Engineering & Technology 6 11.8 70 8.6
Natural & Comp. Science 10 19.6 85 11.8
Social Science & Language 15 29.4 81 18.5
Health Sciences 5 9.8 11 4.5
Agriculture 0 0 0 0.0
TOTALS 51 100 % 313 16.3 %
The demographics of the respondents are shown in Table 2. It should be noted that the
respondents’ median age is twenty six and their median years in education is two. Almost half of
the respondents (47.1%) were bachelors degree qualified, thirty one percent had Masters degree
and 9.8 percent had Doctorate degrees.
TABLE 2 Demographics of Respondents
Variable N Statistics
Age 51 Mean = (27.0) 72.5% Median = (26) 58.8% 21 to 29 = (42) 82.4%
Gender 51 Male = (44) 86.3 % Female = (4) 7.8% missing = (3) 5.9%
Birth Nation 51 Ethiopia = (47) 92.2% India = (4) 7.8%
Yrs. AKU 51 Mean = 2.12 Median = 2 1 & 2 yrs. = (42) 82.4%

7
Yrs. In Educ. 51 Mean = 3.75 Median = 2 1 to 4 yrs. = (42) 82.4%
Credits 51 Mean/Median = 10 0 to 9 credits = 41.2% 0 to 12 credits = 88.2%
Highest Deg. 51 Bachelors = (24) 47.1% Masters = (16) 31.4% Doctorate = (5) 9.8%
Sampling Instrument
A pilot instrument was developed based on interviews and administrative presentations
on the academic research strategic objective of the AKU. The pilot instrument was completed by
fifteen College of Business and Economics full-time faculties. Analysis of the responses
documented numerous misunderstandings of English survey questions by an Amharic and Tigray
native language community. Elimination of confusing questions and rewording of other
questions was completed with the assistance of native language speakers. The statements were
randomly alternated between positive and negative to reduce the possibility of respondent
responses on only one of the five Likert item scales. Demographic data was collected for each
respondent relative to significant pretest determined independent variables. The quality of the
data was validated by checking the logical consistency of the responses to the positive and
negative statements. Individual responses were logically linked to the research question under
investigation. It was determined that the respondents were highly motivated and provided
thoughtful responses. One respondent questionnaire was eliminated from the sample due to
consistent selection of a single Likert scale value. The data collection instrument is shown
Figure 1.
Statistical Procedures for Data Analysis
The researchers used non-parametric statistical methods to determine the initial results of
the research study (Corder & Foreman, 2009). Statistical analysis was accomplished using the
SPSS statistical package as the primary driver. Spearman correlations were used to investigate
the relationships of the ten research training and support variables. The Wilcoxon Signed Rank
test for a single sample was used to determine the significant difference of each research
statement median from the Likert five point scale median = 3. In the data analysis phases the
negatively worded question responses were re-coded as a positive response.

8
FIGURE 1: Training and Support For Academic Research
Analysis of the construct validity of the Likert scale responses used Spearman correlations for
each of the variables with the observation total scores (Packer, 2004). Variables that had a
correlation coefficient less than .4 were eliminated from the Principle Component Analysis
(PCA) analysis. Variables T3, T5+ and T9+ were eliminated due to not significant (p > .05) and
correlation coefficients less than .4 with total score. Table 3 shows the distribution of responses.
Please check the appropriate response (1 to 5 or NA) for each question!
Q.
#
Training and Support
Questions
Str
on
gly
Dis
ag
ree
Dis
ag
ree
Neu
tral
Ag
ree
Str
on
gly
Ag
ree
No
t
Ap
pli
c.
T1 An academic research training class would be
helpful to me. □1 □2 □3 □4 □5 □NA
T2 Internet access is essential for doing academic
research □1 □2 □3 □4 □5 □NA
T3 AKU provides sufficient training on academic
research methodology. □1 □2 □3 □4 □5 □NA
T4+ Academic research class will not detract from my
teaching. □1 □2 □3 □4 □5 □NA
T5+ I need training in academic research design. □1 □2 □3 □4 □5 □NA
T6+ Writing a research paper in English not difficult. □1 □2 □3 □4 □5 □NA
T7 I need training in the data analysis methods in
academic research. □1 □2 □3 □4 □5 □NA
T8 I need training on how to write an academic
research paper. □1 □2 □3 □4 □5 □NA
T9+ I know how to get started on an academic
research project. □1 □2 □3 □4 □5 □NA
T10 There are no qualified faculties to teach academic
research methods. □1 □2 □3 □4 □5 □NA
(+) Original questions restated here as positive

9
TABLE 3 Variable Descriptive Statistics
The internal validity of the seven remaining training and support variables was verified
using Cronback’s Alpha (Cronbach, 1951) and resulted in an acceptable alpha of .75.
Principle Component Analysis (PCA) with Varimax rotation was used to consolidate the
remaining seven variables. Although PCA is a parametric procedure, numerous research papers
over many years confirmed that the PCA is a very robust analysis and violation the underlying
normality assumption did not provide incorrect answers (Norman, 2010; Carifio & Perla, 2008;
Darlington, 1966; Pearson, 1931). The seven training and support variables were found not to be
normally distributed using the statistical goodness-of-fit tests Anderson-Darling and
Kolmogorov-Smirnov.
RESULTS
Descriptive Statistics and Significance Tests
Table 3 also shows the summary descriptive statistics for the original ten variables
measuring faculties’ training and support needs for academic research. The One sample
Wilcoxon Signs Rank Test (Null: Median/Mean = 3) hypotheses test for each variable are noted.
The responses for all negatively worded questions for variables T4+, T5+, T6+, T9+ were re-
coded to a positive response on the five-point Likert scale (Brendl & Higgins, 1996).
The variable T3 (AKU provides sufficient training in research methodology), was scored
as Disagreed or Strongly Disagreed by the respondents with a significant (p < .05) median = 2
and mean = 2.06. Although the variable was eliminated from the PCA analysis by total score
correlation and significance, it provided a clear indication that this is an area that needs
improvement for research training at AKU.
The variable T5+ (I understand research design steps), was scored as Agreed by
respondents with a significant median = 4 and mean = 3.78. Although the variable was
eliminated from the PCA analyses by total score correlation and significance, it provided an
indication that research design was not a training issue.
Variable Meana Med
b Sig.
b Variance #SD
c #D
c #N
c #A
c #SA
c N
T1 4.52 5 .001 .294 1 22 28 51
T2 4.88 5 .001 .106 6 45 51
T3 2.06 2 .001 1.06 17 20 10 2 2 51
T4+ 3.88 4 .001 .906 6 8 23 14 51
T5+ 3.78 4 .001 1.17 3 5 3 29 11 51
T6+ 4.16 4 .001 .815 1 3 2 26 19 51
T7 4.12 4 .001 .856 2 2 1 29 17 51
T8 3.82 4 .001 1.47 5 3 3 25 15 51
T9+ 3.63 4 .002 1.40 5 4 6 26 10 51
T10 3.22 3 .178 1.33 3 13 12 16 7 51
(+) Recoded as positive
10
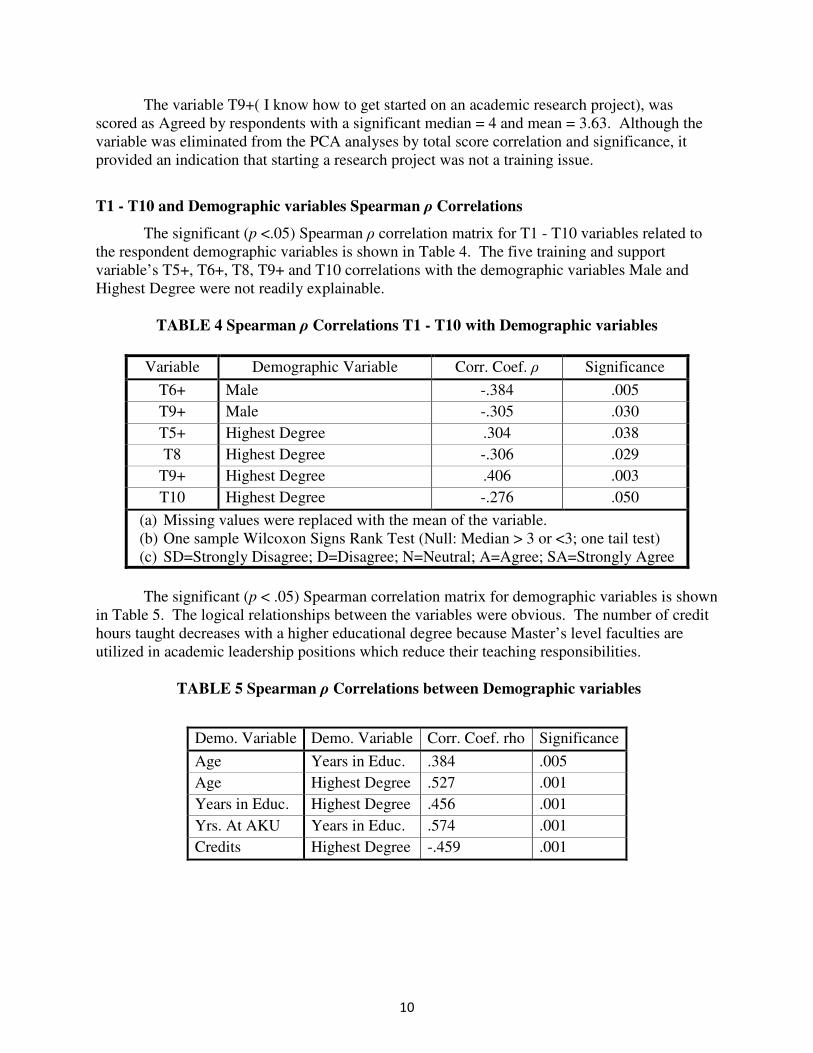
The variable T9+( I know how to get started on an academic research project), was
scored as Agreed by respondents with a significant median = 4 and mean = 3.63. Although the
variable was eliminated from the PCA analyses by total score correlation and significance, it
provided an indication that starting a research project was not a training issue.
T1 - T10 and Demographic variables Spearman ρ Correlations
The significant (p <.05) Spearman ρ correlation matrix for T1 - T10 variables related to
the respondent demographic variables is shown in Table 4. The five training and support
variable’s T5+, T6+, T8, T9+ and T10 correlations with the demographic variables Male and
Highest Degree were not readily explainable.
TABLE 4 Spearman ρ Correlations T1 - T10 with Demographic variables
The significant (p < .05) Spearman correlation matrix for demographic variables is shown
in Table 5. The logical relationships between the variables were obvious. The number of credit
hours taught decreases with a higher educational degree because Master’s level faculties are
utilized in academic leadership positions which reduce their teaching responsibilities.
TABLE 5 Spearman ρ Correlations between Demographic variables
Variable Demographic Variable Corr. Coef. ρ Significance
T6+ Male -.384 .005
T9+ Male -.305 .030
T5+ Highest Degree .304 .038
T8 Highest Degree -.306 .029
T9+ Highest Degree .406 .003
T10 Highest Degree -.276 .050
(a) Missing values were replaced with the mean of the variable.
(b) One sample Wilcoxon Signs Rank Test (Null: Median > 3 or <3; one tail test)
(c) SD=Strongly Disagree; D=Disagree; N=Neutral; A=Agree; SA=Strongly Agree
Demo. Variable Demo. Variable Corr. Coef. rho Significance
Age Years in Educ. .384 .005
Age Highest Degree .527 .001
Years in Educ. Highest Degree .456 .001
Yrs. At AKU Years in Educ. .574 .001
Credits Highest Degree -.459 .001

11
Principle Components Factor Analysis
PCA with Varimax rotation was used to reduce the seven variables relating to training
and support needs for academic research (Darlington, 1966; Norusis, 2004). The use of PCA
with Likert Scale data limitations were considered (Allen & Seaman, 2007; Clason & Dormody,
1993; Colman, Norris & Preston, 1997; Dawes, 2008; Lubke & Muthen, 2009; McCall, 2001)
and based on evidence from the data analysis the researchers judged the application to be
appropriate. The two factors constructed by PCA explained 51% of the variance by sums of
squared loadings. The results of the complete PCA are shown in Tables 6 through Table 8 and
Figure 2 and Figure 3.
TABLE 6 Factor Components and Variance Explained
Figure 2 is Cattell’s scree plot (Cattell, 1966) of the components shown as the X axis and
the corresponding eigenvalues as the Y axis. Where the decrease in eigenvalues flattens and the
curve makes an elbow, Cattell's scree test says to not consider further components after the one
starting the elbow. An eigenvalue of 1.0 was used for the selection of two components.
FIGURE 2 Cattell’s Scree Plot

12
Figure 3, Component Plot in Rotated Space, shows each of the seven variables included
in the two factors selected in this analysis. Significant correlation between the seven variables in
the PCA procedure made identification of an appropriate models challenging. The two factors
selected were on the basis of a training factor TFAC1 and a support factor TFAC2 with two
shared variables T1and T10. The training factor TFAC1 variables T7, T8, T1, and T10 are well
clustered. The support factor TFAC2 variables T2, T4+, T6+, T1, T10 are also well clustered.
FIGURE 3 Component Plot in Rotated Space
Table 7 shows the Variable Loadings (correlations) for each factor after rotation. An
arbitrary rule-of-thumb for level of correlation significance for primary variable loadings in a
factor should be .7 or higher to confirm that about half of the variance in the variable (r2 = .49) is
being explained by the factor. This rule was violated by variable T4+ in factor TFAC2.
TABLE 7 Factor Variable Loadings
Rotated Component Matrixa
Component
1 2
T1 .534 .494
T2 .103 .716
T4P .041 .418
T6P -.056 .693
T7 .867 -.013
T8 .855 -.105
T10 .495 .337

13
Extraction Method: Principal Component Analysis. Rotation Method: Varimax with Kaiser Normalization. a. Rotation converged in 3 iterations.
Factor Models, Correlations and Test of significance
Table 8 shows the standardized component factor scores which are used as coefficients
for the variables in resulting factor models. The factor definitions TFAC1 and TFAC2
demonstrate the factor mathematical models, their means, medians and the test of significance
against an implied neutral Likert scale median = 3. It should be noted that variables T1 (A
research training class would be helpful) and T10 (There are no qualified faculty to teach
research methods), are present in both factors. Their factor model coefficients were smaller than
desirable but closely related in magnitude for both factors indicating they are shared variables
across both factors.
TABLE 8 Standardized Variable Scores by Factor
Standardized Component Score Coefficient Matrix
Component
Question 1 2
T7 I need training in the data analysis methods in academic research. .450 -.120
T8 I need training on how to write an academic research paper. .456 -.181
T1 An academic research training class would be helpful to me. .213 .268
T10 There are no qualified faculties to teach academic research methods. .213 .166
T2 Internet access is essential for doing academic research -.039 .475
T4+ Attending an academic research class would enhance my teaching. -.033 .280
T6+ Writing a research paper in English not difficult. -.118 .481
T1 An academic research training class would be helpful to me. .213 .268
T10 There are no qualified faculties to teach academic research methods. .213 .166
(+) Recoded question to be positive
Extraction Method: Principal Component Analysis.
Rotation Method: Equamax with Kaiser Normalization.
TFAC1 Training Factor 1 ( Variables T7, T8, T1, T10)
Training Factor Description: I need training in data analysis and research report writing.
Research training would be helpful; however, qualified faculty is a question.
Observation Values = .213*T1-.039*T2-.033*T4P-.118*T6P +.450*T7+.456*T8 +.213*T10
Factor mean = 4.43
Factor median = 4.5
Factor Median Test Value =.213*3 -.039*3 -.033*3 -.118*3 +.450*3+.456*3 +.213*3 = 3.43
Median test conclusion: 4.5 > 3.43 (Strongly Agree)

14
TFAC2Support Factor 2 (Variables T2, T4+, T6+, T1, T10)
Support Factor Description: Internet access is essential and research class would not
interfere with teaching. Research training would be helpful; however qualified faculty is a
question. Observation Value = .268*T1 +.475*T2 +.280*T4P +.481*T6P -.120*T7 -.180*T8 +.166*T10
Factor mean = 5.98
Factor median = 6.19
Factor Median Test Value = .268*3 +.475*3 +.280*3 +.481*3 -.120*3 -.180*3 +.166*3 = 4.11
Median test conclusion: 6.19 > 4.11 (Strongly Agree)
In Table 9 the factor medians were tested against the factor test median calculated by
assigning a median value = 3 for each of the variables included in the factor. The One-Sample
Wilcoxon Signs Rank Test (Null: Median >3; one tail test) nonparametric statistical was used.
The two factor median calculations were significantly (p<.001) highly than the test median
values.
TABLE 9 Summary of Factor tests of significance
Factor Mean Median Test Md.b Sig.
a N Indication
TFAC1 4.43 4.50 3.43 .001 51 S. Agree
TFAC2 5.98 6.19 4.11 .001 51 S. Agree
(a) One-Sample Wilcoxon Signs Rank Test (Null: Median >test median
(b) Factor Test Median (all variables = 3)
Training and Support Factors Related To Demographic Variables
Table 10 shows the spearman ρ correlation analysis for TFAC1 and TFAC2 and the
demographic variables. Only three significant (p<.10) relationships were found. TFAC1, I need
training in data analysis and research report writing, was significantly related to total credits
taught ρ = .281 (p =.097) and highest degree ρ = -.348 (p = .012). The TFAC1 finding was
consistent with previous demographic variable relationships of total credits taught being highly
negatively correlated with highest degree. TFAC2, Internet access is essential and research class
would not interfere with teaching, was significantly related to male ρ = -.248 (p = .080). The
TFAC2 correlation with male is not readily explainable.
TABLE 10 Correlations Training and Support Factors and Demographic Variables
Training Factors & Demographic Correlations
Training
Factors
Demographic
Variables
Corr.a Sig.
P =
TFAC1 Credits .281 .097
TFAC1 Highest Degree -.348 .012
TFAC2 Male -.248 .080
(a)Spearman ρ

15
Respondent Comments
The twenty respondents’ comments to the open ended question at the end of the survey
instrument are summarized for training and support in Table 11. A recurring theme was the need
for research methodology and writing training. Even though the respondents in aggregate were
overwhelmingly positive about research there was some discouragement expressed that
colleagues were not supportive of participation in research activities and thought it was a waste
of time. The AKU respondents’ comments implied that there was resistance to academic
research activities at a subliminal level. Intellectual curiosity was not a universal behavior of the
AKU faculties.
TABLE 11 Respondent Comments on Training
R&D group should organize workshop and training for AKU staff on how to conduct,
analyze, and write research reports.
Faculty needs training on how to find the research problem or area/field of research.
Faculties want recognition in the University and want some training on Research
Methods.
Training on Research Methods.
Training on Research Methods and Less Responsibility.
Collaboration with national & international institution is necessary for training.
Good if university will provide an opportunity for academic research training.
Wants to become a researcher and he wants training.
Training and Support Factor Correlations With Attitude And Incentive Factors
A parallel study of this same population at AKU identified and described the faculty’s
attitudes towards research as a basis of improvement in academic research publication
productivity (Monroe & Kumar, 2011a). The hypothesis for this study was that the faculty’s
attitudes about academic research publications were negative in new universities. The empirical
analysis found highly positive faculty’s attitudes for all aspects of academic research process.
The three principle component factors are described as: AFAC1, academic research is positive
for me; AFAC2, reading research is enjoyable and research helps build the institution’s
reputation; and AFAC3, a research team experience is positive and will make me work harder.
A additional parallel study of this same population at AKU identify and describe the
faculty’s incentives and motivations for academic research as a basis of improvement in
academic research publication productivity (Monroe & Kumar, 2011b). The hypothesis for this
study was that new universities faculty’s incentives and motivations for academic research
publications were negative. The empirical analysis found that the respondents perceived
numerous personal incentives and motivations for academic research activities but generally they
were not any present at AKU. The three principle component factors were described as: IFAC1,
AKU career, teaching skills, research presentations and job description are positive motivators; IFAC2, using academic time and financial rewards are not incentives; and IFAC3, collaboration
with peers is a positive incentive and motivator.
Table 12 shows the correlation relationships between training and support factors and the
research attitude and incentive factors identified in previous studies of this same population. The

16
support factor TFAC2, Internet access is essential and research class would not interfere with
teaching, and the incentive factor IFAC1, AKU career, teaching skills, research presentations and
job description are positive motivators, were significantly correlated at ρ = .331 (p = .018). The
support factor TFAC2 was also correlated with the attitude factors AFAC1, academic research is
positive for me, at ρ = .234 (p = .098) and AFAC2, reading research is enjoyable and research
helps build the institutions’ reputation, at ρ = .251 (p = .075). The consistency of these
correlations supported the internal validity of the data.
TABLE 12 Correlations, Training, Attitudes and Incentives Factors
DISCUSSION
Faculty Training and Support for Academic Research
The objective of this study was to understand how to facilitate faculty research
productivity through training and support activities in a newly established university. The
instrument used in this study was constructed through an iterative process that included
expressed faculty opinions from: (a) a University wide research training lecture, (b) a College of
Business research training session, (c) faculty informal personal interviews and (d) the
researchers’ experiences on the University campus in efforts to facilitate faculty research teams.
The culmination of these activities resulted in the pilot survey instrument and the finalized
survey instrument.
This research study significantly confirmed these hypotheses at the variable and factor
levels. These findings are summarized as; (a) there is not sufficient research methodology
training at AKU; (b) research design and starting a research project are not training issues; (c)
training is needed in data analysis and research paper writing; and (d) internet access is essential
and a research class would not interfere with teaching.
Consolidation of the seven study training and support variables using PCA indicated that
two factors significantly confirmed the study hypotheses. The training factor TFAC1, I need
training in data analysis and research report writing, indicated that the faculties are not confident
in these two areas of research methodology. The support factor TFAC2. Internet access is
essential and research class would not interfere with teaching, indicates a need for improvement
in internet access and teaching load is not an issue for research. The variables T1 and T10 were
common to both of these factors indicating generally the faculties perceive they need research
training and qualified faculty for teaching research is questionable.
Of the 21 written questionnaire open-ended comments, eight specifically mentioned a
need for training and support relative to research activities. The faculties relative inexperience
Training, Incentives and Attitudes Factor Correlations
Training
Factors
Attitude &
Incentive
Factors
Corr.a Sig.
p=
TFAC2 IFAC1 .331 .018
TFAC2 AFAC1 .234 .098
TFAC2 AFAC2 .251 .075
(a) Spearman ρ

17
(majority are bachelors level qualified) and related inexperience in academia (median = 2 years)
exacerbates their need for training and support in research activities.
Nowick (2008) identified a potentially confounding factor for this study relating to
academic research publication productivity. Results from this study are consistent with
Lotka’s law (1926), which states that a relatively few scholars contribute disproportionately
to the body of scientific literature. Full professors make up 25% of the total U.S. faculty
(Almanac, 2007). In this study, full professors were found to author 46% of open access
journal articles and 63% of for-free journal articles.
Other bibliometric studies for Africa confirmed that this relationship of rank to academic
research publications is present in Ethiopia (Schamp & Schmid; & Mugabushaka, 2008).
However, these studies did not include the influence important impact of faculty’s perceived
training and support needs on academic research productivity. Additional research about this
confounding factor is beyond the scope of this study but is a fertile field for further exploration
of research publication capacity building in new academic environments with scarce resources
and a limited pool of qualified faculties.
The empirical indications of the faculty’s perceived needs for training and support in
academic research activities provides significant direction for University administration’s
emphasis in activities to facilitate the faculties research activities. Faculties’ inactivity in
academic research projects can be attributed to a lack of training in academic research
methodologies.
Additional research is needed to replicate this study at other new institutions of higher
education in Ethiopia and other rapidly expanding higher education systems worldwide.
Confirmation of the research training and support needs in rapidly expanding higher education
systems in transitioning nations is needed to provide administrative direction for research.
Additional data are necessary to confirm the extrapolation of these results to other higher
education systems worldwide.
RECOMMENDATIONS
The economic and human resource challenges of high growth tertiary education in
Ethiopia and other developing nations are daunting. The shortage of qualified teachers, the limit
of infrastructure and the fiscal budget for sustaining growth and support of education are globally
endemic. The following recommendations are applicable to AKU and may also be applicable to
other new Universities in Ethiopia.
1. Recruit and hire more Masters and Doctorial faculty as teaching staff, not administrators.
2. Make research training by a qualified academic professional a condition of employment
for all University faculties.
3. Make research publications part of the annual faculty evaluation process and an
expectation of employment renewal.
4. Provide monetary rewards such as accelerated promotion, department research budget,
and one-time stipend for successful research project completion and publication.
5. Provide non-monetary rewards such as campus recognition, funding for Ethiopian
conference presentation, reduced teaching load and annual distinguished researcher
award for successful research project completion and publication.
6. Establish an AKU research center, funded by government and private sector grants, for
faculties’ financial and professional assistance to conducting and publishing research.

18
7. Implement a research evaluation regime to measure the effectives of research efforts.
8. Provide internet service for all faculties through campus facilities and/or individual
wireless access (CDMA).
9. Facilitate new faculty research-team formation and mentoring with experienced
researcher-publisher faculty.
10. Mentor new faculty to encourage commitment to teaching as a first choice career (reduce
faculty turnover) and research productivity as a rewarding activity.

19
REFERENCES
Abramo, G., D’Angelo, C. A. & Di Costa, F. (2008). Research Collaboration and Productivity:
Is there Correlation? Journal of Higher Education, 57, 155-171.
Allen, I. E., & Seaman, C. A. (2007) . Likert Scales and Data Analyses. The American Society
for Quality, July.
Almanac of Higher Education (2007-8. 2007). Number of Full-Time Faculty Members by Sex,
Rank, and Racial and Ethnic Group, Fall 2005. Chronicle of Higher Education, 54(1): 24.
Anderson, J. (1989). The evaluation of research training. In Evered, D (ed). The Evaluation of
Scientific Research. 93-113. Chichester: John Wiley & Sons.
Arora, A. & Gambardella, A. (1996). The Impact of NSF Support for Basic Research in
Economics. Working Paper, Carnegie Mellon University, Pittsburgh, Pennsylvania.
Bland, C. J., Seaquist, E., Pacala, J. T., Center, B. & Finstad, D. (2002). One school’s strategy
to assess and improve the vitality of its faculty. Academy of Medicine, 77, 368 –76.
Brendl, C. M., & Higgins, E. T. (1996). Principles of judging valence: What makes events
positive or negative?. Advances in Experimental Social Psychology, 28, 95–160. San Diego,
CA: Academic.
Buchmueller, T. C., Dominitz, J., & Hansen, W. L. (1999). Graduate Training and the Early
Career Productivity of PhD Economists. Economics of Education Review, 14, 65-77.
Carifio, L., & Perla, R. (2008). Resolving the 50 year debate around using and misusing Likert
scales. Medical Education, 42, 1150–1152.
Carlson, T., & Martin-Rovet, D. (1995). The Implications of Scientific Mobility Between
France and United States. Minerva, 33, 211-50.
Cattell, R. B. (1966). The Scree Test for the Number of Factors. Multivariate Behavioral
Research, 1(2), 245-276.
Chen, Y., Gupta, A. & Hoshower, L. (2006). Factors That Motivate Business Faculty to Conduct
Research: An Expectancy Theory Analysis. Journal of Education for Business, March-April
2006, 179-189.
Clarke, M. (2004). Weighing things up: A closer look at “U.S. News & World Report’s”
ranking formulas. College and University, 79(3), 3-9.
Clason, D. S. & Dormody, T. J. (1993). Analyzing Data Measured by Individual Likert-Type
Items. Journal of Agricultural Education, 35(4), 31-35.
Colman, A. M., Norris, C. E. & Preston, C. C. (1997). Comparing Rating Scales of Different
Lengths: Equivalence of Scores from 5-Point and 7-Point Scales. Psychology Reports,
80: 355-362.
Corder, G. W., & Foreman, D. I. (2009). Nonparametric Statistics for Non-Statisticians: A
Step-by-Step Approach. New York, N.Y.,Wiley.
Cronbach, L. J. (1951). Coefficient alpha and the internal structure of tests. Psychometrika, 16
(3), 297-334.
Darlington, R. B. (1966). Factor Analysis. The American Journal of Psychology,
www.psych.cornell.edu/darlington/factor.htm. retrieved on 17 May 2011@ 6:00 PM.
Dawes, J. (2008). Do Data Characteristics Change According to the Number of Scale Points
Used?. International Journal of Marketing Research, 50: 61-77.
Diamond, A. M. Jr. (1984). An Economic Model of the Life-Cycle Research Productivity of
Scientists. Scientometrics, 6 (3), 189-96.

20
FDRE, MoE (2005). Education Sector Development Program III, p.13. Electronic document.
Retrieved from http://www.moe.gov.et/ggdocs/ESDPIII.pdf. Accessed 17 May 2011
FDRE, MoE, (2010a). Education Sector Development Program IV (ESDP IV) 2010/2011 –
2014/2015. Program Action Plan. Addis Ababa , 2010, p.63.
Hadjinicola, G. & Soteriou, A. (2005). Factors Affecting Research Productivity of Production
and Operations Management Groups: An Empirical Study. Journal of Applied Mathematics
and Decision Sciences, 2006, 1-16.
Hogan, T. D. (1981). Faculty Research Activity and the Quality of Graduate Training. The
Journal of Human Resources. XVI: 398-415
Irvine, J., & Martin, B. R. (1980). The Economic Effects of Big Science: the Case of Radio
Astronomy. Proceeding of the International Colloquium on the Economic Effects of Space
and Other Advanced Technologies. Paris: ESA.
Library of Congress Overseas Offices (2010). Ethiopia Journals Indexed, Nairobi, Kenya.
Lotka, A. J. (1926). The frequency distribution of scientific productivity. Journal of the
Washington Academy of Sciences, 16 (2), 317-24.
Lubke, G., & Muthen, B. (2004). Factor-analyzing Likert-scale data under the assumption of
multivariate normality complicates a meaningful comparison of observed groups or latent
classes, http://gseis.ucla.edu/faculty/muthen/Likart.pdf. retrieved on 17 May 2011@
5:00 PM.
Marinova, D. (2008). The Cganging Research Funding Regime in Australia and Academic
Productivity. Mathematics and Computers in Simulation, 78, 283-291.
Martin, B. R., & Irvine, J. (1983). Assessing Basic Research. Some Partial Indicators of
Scientific Progress in Radio Astronomy. Research Policy, 12, 61-90.
McCall, C. H. (2001). Proceedings from the 80th
CERA Conference: An Empirical Examination
of the Likert Scale: Some Assumptions, Development, and Cautions. South Lake Tahoe:
CA
Modrego, A. (1998). El español y la Ciencia. Jornadas sobre el español. Instituto Cervantes y
Fundación Duques de Soria. Tordesillas.
Monroe, S. R., & Kumar, R. (2011a). Faculties Attitudes Towards Research: A Basis For
Improvement In Publication Productivity (Unpublished working paper). Metropolitan
State College of Denver, Denver, Colorado, USA.
Monroe, S. R., & Kumar, R. (2011b). Motivations and Incentives for Academic Research: A
Basis for Improvement in Publication Productivity (Unpublished working paper).
Metropolitan State College of Denver, Denver, Colorado, USA.
Ng, Y. C., & Li, S. K. (2000). Measuring the research performance of Chinese higher education
institutions: An application of data envelopment analysis. Education Economics, 8 (2),
139-156.
Norman, G. (2010). Likert scales, levels of measurement and the laws of statistics. Advances in
Health Scinece Education Methodologist Corner, (2)1-8.
Norusis, M. (2004). SPSS 13.0 Statistical Procedures Companion. Upper Saddle-River, N.J.:
Prentice Hall, Inc..
Nowick, E. (2008). Academic rank of authors publishing in open access journals. Agricultural
Information Worldwide, 1(2), 45-51.
Packer, M. J. (2004). Tests and Test Validity. www.mathcs.duq.edu/~packer/Courses/Psy
624/test.html retrieved on 17 May 2011@ 7:00 PM.

21
Pagey, U. (1981). Assessing the Effectiveness of Training. Indian Journal for Training &
Development, XI (4), 156 – 158.
Pearson, E. S. (1931). The analysis of variance in the case of non-normal variation. Biometrika,
23, 114– 133.
Schamp, E. W., & Schmid, S. (2008). Academic cooperation with Africa: lessons for
partnership in higher education. Mugabushaka, A. M. (Ed.), 3 Great disparities: A
bibliometric analysis of patterns and trends of African scientific publications 1990-2003.
books.google.com.
Subrahmanian, M. (2010). Evaluating Training Programmes in India Post. Researchers World-
Journal of Arts Science & Commerce, 1 (1), 81-94.
Szymanski, D., Ozegovic, J., Phillips, J. & Briggs-Phillips, M. (2006). Fostering Scholarly
Productivity Through Academic and Internship Research Training Environments. Training
and Education in Professional Psychology, 1(2), 135-146.
Tapper, T., & Salter, B. (2004). Governance of higher significance of the research assessment
exercises. Higher Education Quarterly, 58(1), 4-30.
Tien, F. F., & Blackburn, R. T. (1996). Faculty rank system, research motivation, and faculty
research productivity: Measure refinement and theory testing. Journal of Higher
Education, 67(1), 2-22.
Tierney, W. G. (1999). The responsive university: Restructuring for high performance.
Baltimore, MD: Johns Hopkins University Press
UNDP MDG Report (2010). Unlocking Progress: MDG acceleration on the road to 2015,
United Nations Development Program, One United Nations Plaza, New York, N.Y.
http://www.undp.org/mdg; retrieved on 20 June 2011@7:00 PM