research statistics jobayer hossain, phd larry holmes, jr, phd,drph, face october 2, 2008
Post on 20-Dec-2015
219 views
TRANSCRIPT

RESEARCH STATISTICSRESEARCH STATISTICS
Jobayer Hossain PhD
Larry Holmes Jr PhDDrPH FACE
October 2 2008
Class StructureClass Structure
Course Website httpmedsciudeleduopenStatClassOctober2008
Classes 8 Contact Hours 2 hours Assignment
ndash 3 Take-home ndash To be assigned in week 3 5 and 6ndash Due in week 4 6and 8
1 Take-home final examassignmentndash Assigned in week 8 -- return for final comments via e-
Class ParticipationClass Participation
Default datasetndash 60 subjectsndash 3 or 4 groupsndash Several measures of different types
(Nominal Ordinal Interval Ratio)
Contributed datasets - (bring your own)
ndash DE-IDENTIFIED
Areas of special interestndash Let us know yours
Course objectivesCourse objectives
At the end of the course participants are expected to
ndash Understand the basic notion of statistics in research
ndash Know designs used to conduct research
ndash Understand some key elements in research such as- selection of
criteria of subjects variables measurement scales of variables
and hypothesis
ndash Learn various statistical techniques used to analyze data
ndash Be able to interpret results and draw conclusion
ndash Learn the tools used in the analysis of data ndash Excel and SPSS
Research Design and MethodologyResearch Design and Methodology
Research is the process of investigating scientific questions
Steps in Research process-
ndash Defining the problem and conceptualizing the study
ndash Designing and conducting study
Collecting data
Analyzing data
ndash Making sense of data
Defining the problem and Defining the problem and conceptualizing the studyconceptualizing the study
Review relevant previous research and identify-
ndash The problem (s) and causes of the problem (s)
ndash State outcomes of previous research on the problem
ndash State clearly what you are planning for the proposed research
ndash Form careful research questions and hypotheses
ndash Identify variables needed to achieve the objective (s)
Defining the problem and Defining the problem and conceptualizing the studyconceptualizing the study
Review relevanthellipidentify contd
ndash Identify scales to measure the variables
ndash Assess the feasibility of study objectives ie assess if it
is measurable what you want to measure
ndash Identify the target populations and define the eligibility
criteria
Research QuestionResearch Question
Example -
ndash Does smoking increase the risk of renal carcinoma
ndash Is oral inhaler effective in controlling asthma among
children
Hypothesis statementHypothesis statement
Example -ndash Smoking increases the risk of renal carcinoma in
pediatric patient
ndash Oral inhaler is effective in controlling asthma among
children
Study ObjectiveStudy Objective
The purpose or aim of the study
Example-
ndash To assess the risk of renal carcinoma associated with
smoking among pediatric patients (primary objective)
ndash To determine the race and gender disparities in the
prevalence of smoking (secondary objective)
Study variableStudy variable
Refers to measurement that changes from one individual to
another
Example- age gender BMI Systolic blood pressure
hematocrit
Outcome vs independent variableOutcome vs independent variable
Responseoutcome variable Measures the outcome of the study treatment or experimental manipulation
Examples-ndash Renal carcinoma incident among children
ndash Asthma control in pediatric asthmatic patients
Independent predictorexplanatory variable Explains or influences changes in a response variable
Examples-ndash Smoking
ndash Oral inhaler
Scale of variableoutput measurementScale of variableoutput measurement
Nominal - Categorical variables without any order or
ranking sequence such as names or classes (eg gender)
Binary- two categories multinomial- more than two
categories
Ordinal - Variables with an inherent rank or order eg
mild moderate severe Can be compared for equality or
greater or less but not how much greater or less
Scale of variableoutput measurementScale of variableoutput measurement
Interval - Values of the variable are ordered as in Ordinal and
additionally differences between values are meaningful however the
scale is not absolutely anchored Calendar dates and temperatures on
the Fahrenheit scale are examples Addition and subtraction but not
multiplication and division are meaningful operations
Ratio - Variables with all properties of Interval plus an absolute non-
arbitrary zero point eg age weight temperature (Kelvin) Addition
subtraction multiplication and division are all meaningful operations
Measurement biasMeasurement bias
Bias arises due to measurement error
Example-
ndash Suppose In the case of remission of Asthma the possible
outcomes are complete remission partial remission and no
remission If we measure the outcome variable as only remission
and non-remission basically we are committing an error by
putting partial remission in the non-remission group (type II error)
Designing the studyDesigning the study
A study design is a careful advance plan of data collection
and the analytic approach needed to answer the research
question under investigation in a scientific way
The basic elements of a study design-
ndash Selecting an appropriate sample size for a specified
level of power and level of significance
ndash Selecting methods of sampling data collection and
analysis appropriate to the studys objectives
ClinicalExperimental versus Observational designClinicalExperimental versus Observational design
The Lancet 2002 Vol 359
ClinicalExperimental vs Observational ClinicalExperimental vs Observational designdesign
The choice of a design mainly depends on the research
question (s) and type of research conduct ( experimental
or observational)
Experimental Interventional The investigator controls
the experimental environment in which the hypothesis is
tested The randomized double-blind clinical trial is the
gold standard
ClinicalExperimental vs Observational ClinicalExperimental vs Observational designdesign
Non-experimentalObservational The population is
observed without any interference by the investigator
For example in a study to see the effect of smoking it is
impossible for an investigator to assign smoking to the subjects
Instead investigator can study the effect by choosing a control
group and find the cause and relation effect Some examples are-
ndash Cross-sectional study
ndash Cohort study
ndash Case-control study
Randomized control designRandomized control design
Random allocation of subjects to different interventions
(or treatments) for the purpose of comparingdetermining
the efficacy of the study treatment (s)
ndash Eg placebo or standard medication (active control) can
be used as a control
ndash Patients with cancer or painful disease can not receive
placebo as a control
Randomized control designRandomized control design
Blindness Reduces the bias due to the preconception or
personal bias ndash Open trial Investigator and subject know the full details of the
treatment
ndash Single-blind trial Investigator knows about the treatment but
subject does not
ndash Double-blind Both investigator and subject do not know about the
treatment
ndash Triple-blind Sponsor investigator and subject do not know about
the treatment
Distribution of a variableDistribution of a variable
Distribution - (of a variable) tells us what values the
variable takes and how often it takes these values Eg
distribution of some 26 pediatric patients of ages 1 to 6
at AIDHC are as follows-
Age 1 2 3 4 5 6
Frequency 5 3 7 5 4 2
StatisticsStatistics
Science of data collection summarization analysis
and interpretation
Descriptive versus Inferential Statistics
ndash Descriptive Statistic Data description
(summarization) such as center variability and
shape
ndash Inferential Statistic Drawing conclusion beyond the
sample studied allowing for prediction
A Taxonomy ofA Taxonomy of StatisticsStatistics
How does statistics help usHow does statistics help us
Age Distribution
0
2
4
6
8
10
12
14
16
40 60 80 100 120 140 More
Age in Month
Nu
mb
er o
f S
ub
ject
s
Ages (in month) of the 60 patients in our data set 1 are- 71 127 65 82 140 53 114 56 84 65 67 134 64 hellip 91 51
Mean 9041666667
Standard Error 3902649518
Median 84
Mode 84
Standard Deviation 3022979318
Sample Variance 9138403955
Kurtosis -1183899591
Skewness 0389872725
Range 95
Minimum 48
Maximum 143
Sum 5425
Count 60
By simply looking at the data we fail to produce any informative account to describe the data how ever statistics produce a quick insight in to data using graphical and numerical statistical tools
60
80
10
01
20
14
0
Distribution of age
Ag
e (
mo
nth
)
Statistical Description of DataStatistical Description of Data
Statistics describes a numeric set of data by its
Center (mean median mode etc)
Variability (standard deviation range etc)
Shape (skewness kurtosis etc)
Statistics describes a categorical set of data by
Frequency percentage or proportion of each
category
Statistical inference is the process by which we acquire information about populations from samples
Two types of estimates for making inferencesndash Point estimationndash Interval estimate
Statistical Inference
Statistical Inference
Sample Population
Population and samplePopulation and sample
Population The entire collection of individuals or measurements about which information is desired
Sample A subset of the population selected for study
ndash Primary objective is to create a subset of population whose center spread and shape are as close as that of population
ndash Methods of sampling Random sampling stratified sampling systematic sampling cluster sampling multistage sampling area sampling qoata sampling etc
Parameter vs StatisticsParameter vs Statistics
Parameter
ndash Any statistical characteristic of a population
ndash Population mean population median population
standard deviation are examples of parameters
ndash Parameter describes the distribution of a population
ndash Parameters are fixed and usually unknown
Parameter vs StatisticsParameter vs Statistics
Statistic Any statistical characteristic of a sample
ndash Sample mean sample median sample standard
deviation are some examples of statistics
ndash Statistic describes the distribution of population
ndash Value of a statistic is known and is varies for different
samples
ndash Are used for making inference on parameter
Parameter vs StatisticsParameter vs Statistics
Statistical Issue To describe the distribution of a
population through census or making inference on
population distribution population parameter using sample
distribution statistic
Eg sample mean is an estimate of the population mean
Hypothesis TestingHypothesis Testing
Null hypothesis and Alternative hypothesis
Real Situation Ho is true Ho is false Reject Ho Type I
error (α) Correct Decision (1-)
D e c i s i o n
Accept Ho Correct Decision (1- α)
Type II Error ()
ElementsSteps in hypothesisElementsSteps in hypothesis
Hypothesis testing steps
ndash 1 Null (Ho) and alternative (H1)hypothesis specification
ndash 2 Selection of significance level (alpha) - 005 or 001
ndash 3 Calculating the test statistic ndasheg t F Chi-square
ndash 4 Calculating the probability value (p-value) or confidence
Interval
ndash 5 Describing the result and statistic in an understandable
way
Point estimator
Sample distribution
Parameter
Population distribution
bull A point estimate draws inference about a population by estimating the value of an unknown parameter using a single value or a point
Point Estimation
Interval estimatorSample distribution
bull An interval estimator draws inferences about a population by
estimating the value of an unknown parameter using an interval
Population distribution Parameter
Interval Estimation
P-Value versus the Confidence IntervalP-Value versus the Confidence Interval
Two main ways to assess study precision and the role of
chance in a study
ndash P value measures ( in probability) the evidence against
the null hypothesis
ndash An interval within which the value of the parameter lies
with a specified probability
ndash Eg 95 CI implies that if one repeats a study 100
times the true measure of association will lie inside the
CI in 95 out of 100 measures
Procedures for sample size Procedures for sample size calculationcalculation
Selection of primary variables of interest and formulation
of hypotheses
Information of standard deviation ( if numeric) or
proportion (if categorical)
A tolerance level of significance ()
Selection of reasonable test statistic
Power or Confidence level
A scientifically or clinically meaning effect difference
Brief concept of Statistical SoftwareBrief concept of Statistical Software
There are many software packages to perform statistical
analysis and visualization of data Some of them are-
ndash System for Statistical Analysis (SAS) S-plus R Matlab Minitab
BMDP STATA SPSS StatXact Statistica LISREL JMP
GLIM HIL MS Excel etc We will discuss MS Excel and SPSS in
brief
useful websites-
httpwwwR-projectorg (a free but powerful statistical software)
Microsoft ExcelMicrosoft Excel
A Spreadsheet Application It features calculation graphing tools pivot tables and a macro programming language called VBA (Visual Basic for Applications)
There are many versions of MS-Excel Excel XP Excel 2003 Excel 2007 are capable of performing a number of statistical analyses
Starting MS Excel Double click on the Microsoft Excel icon on the desktop or Click on Start --gt Programs --gt Microsoft Excel
Worksheet Consists of a multiple grid of cells with numbered rows down the page and alphabetically-tilted columns across the page Each cell is referenced by its coordinates For example A3 is used to refer to the cell in column A and row 3 B10B20 is used to refer to the range of cells in column B and rows 10 through 20
Microsoft ExcelMicrosoft Excel
Creating Formulas 1 Click the cell that you want to enter the formula 2 Type = (an equal sign) 3 Click the Function Button 4 Select the formula you want and step through the on-screen instructions
xf
Opening a document File Open (From a existing workbook) Change the directory area or drive to look for file in other locations
Creating a new workbook FileNewBlank Document
Saving a File FileSave
Selecting more than one cell Click on a cell eg A1) then hold the Shift key and click on another (eg D4) to select cells between and A1 and D4 or Click on a cell and drag the mouse across the desired range
Microsoft ExcelMicrosoft Excel
Entering Date and Time Dates are stored as MMDDYYYY No need to enter in that format For example Excel will recognize Jan 9 or jan-9 as 192007 and Jan 9 1999 as 191999 To enter todayrsquos date press Ctrl and together Use a or p to indicate am or pm For example 830 p is interpreted as 830 pm To enter current time press Ctrl and together
Copy and Paste all cells in a Sheet Ctrl+A for selecting Ctrl +C for copying and Ctrl+V for Pasting
Sorting Data Sort Sort By hellip
Descriptive Statistics and other Statistical methods ToolsData Analysis Statistical method If Data Analysis is not available then click on Tools Add-Ins and then select Analysis ToolPack and Analysis toolPack-Vba
Microsoft ExcelMicrosoft Excel
Statistical and Mathematical Function Start with lsquo=lsquo sign and then select function from function wizard xf
Inserting a Chart Click on Chart Wizard (or InsertChart) select chart give Input data range Update the Chart options and Select output range Worksheet
Importing Data in Excel File open FileType Click on File Choose Option ( DelimitedFixed Width) Choose Options (Tab Semicolon Comma Space Other) Finish
Limitations Excel uses algorithms that are vulnerable to rounding and truncation errors and may produce inaccurate results in extremecases
Statistics PackageStatistics Packagefor the Social Science (SPSS)for the Social Science (SPSS)
A general purpose statistical package SPSS is widely used in the social sciences particularly in sociology and psychology
SPSS can import data from almost any type of file to generate tabulated reports plots of distributions and trends descriptive statistics and complex statistical analyzes
Starting SPSS Double Click on SPSS on desktop or ProgramSPSS
Opening a SPSS file FileOpen
bull Data Editor
Various pull-down menus appear at the top of the Data Editor window These pull-down menus are at the heart of using SPSSWIN The Data Editor menu items (with some of the uses of the menu) are
MENUS AND TOOLBARS
Statistics PackageStatistics Packagefor the Social Science (SPSS)for the Social Science (SPSS)
FILE used to open and save data files
EDIT used to copy and paste data values used to find data in a file insert variables and cases OPTIONS allows the user to set general preferences as well as the setup for the Navigator Charts etc
VIEW user can change toolbars value labels can be seen in cells instead of data values
DATA select sort or weight cases merge files
MENUS AND TOOLBARS
TRANSFORM Compute new variables recode variables etc
Statistics PackageStatistics Packagefor the Social Science (SPSS)for the Social Science (SPSS)
ANALYZE perform various statistical procedures
GRAPHS create bar and pie charts etc
UTILITIES add comments to accompany data file (and other advanced features)
ADD-ons these are features not currently installed (advanced statistical procedures)
WINDOW switch between data syntax and navigator windows
HELP to access SPSSWIN Help information
MENUS AND TOOLBARS
Statistics PackageStatistics Packagefor the Social Science (SPSS)for the Social Science (SPSS)
Navigator (Output) Menus
When statistical procedures are run or charts are created the output will appear in the Navigator window The Navigator window contains many of the pull-down menus found in the Data Editor window Some of the important menus in the Navigator window include
INSERT used to insert page breaks titles charts etc
FORMAT for changing the alignment of a particular portion of the output
MENUS AND TOOLBARS
Statistics PackageStatistics Packagefor the Social Science (SPSS)for the Social Science (SPSS)
bull Formatting Toolbar
When a table has been created by a statistical procedure the user can edit the table to create a desired look or adddelete information Beginning with version 140 the user has a choice of editing the table in the Output or opening it in a separate Pivot Table (DEFINE) window Various pulldown menus are activated when the user double clicks on the table These include
EDIT undo and redo a pivot select a table or table body (eg to change the font)
INSERT used to insert titles captions and footnotes
PIVOT used to perform a pivot of the row and column variables
FORMAT various modifications can be made to tables and cells
Statistics PackageStatistics Packagefor the Social Science (SPSS)for the Social Science (SPSS)
Importing tab-delimited dataIn SPSSWIN click on FILE OPEN DATA Look in the appropriate location for rArr rArrthe text file Then select ldquoTextrdquo from ldquoFiles of typerdquo Click on the file name and then click on ldquoOpenrdquo You will see the Text Import Wizard ndash step 1 of 6 dialog box
You will now have an SPSS data file containing the former tab-delimited data You simply need to add variable and value labels and define missing values
Exporting Data to Excelclick on FILE SAVE AS Click on the File Name for the file to be exported For rArrthe ldquoSave as Typerdquo select from the pull-down menu Excel (xls) You will notice the checkbox for ldquowrite variable names to spreadsheetrdquo Leave this checked as you will want the variable names to be in the first row of each column in the Excel spreadsheet Finally click on Save
Statistics PackageStatistics Packagefor the Social Science (SPSS)for the Social Science (SPSS)
bull Additional menusCHART EDITOR used to edit a graph
SYNTAX EDITOR used to edit the text in a syntax window
bull Show or hide a toolbar
Click on VIEW TOOLBARS 1048635to show it to hide itrArr rArr
bull Move a toolbar
Click on the toolbar (but not on one of the pushbuttons) and then drag the toolbar to its new location
bull Customize a toolbar
Click on VIEW TOOLBARS CUSTOMIZErArr rArr
Statistics PackageStatistics Packagefor the Social Science (SPSS)for the Social Science (SPSS)
Importing data from an EXCEL spreadsheetData from an Excel spreadsheet can be imported into SPSSWIN as follows1 In SPSSWIN click on FILE OPEN DATA The OPEN DATA FILE Dialog rArr rArrBox will appear2 Locate the file of interest Use the Look In pull-down list to identify the folder containing the Excel file of interest3 From the FILE TYPE pull down menu select EXCEL (xls)
4 Click on the file name of interest and click on OPEN or simply double-click on the file name
5 Keep the box checked that reads Read variable names from the first row of data This presumes that the first row of the Excel data file contains variable names in the first row [If the data resided in a different worksheet in the Excel file this would need to be entered]
6 Click on OK The Excel data file will now appear in the SPSSWIN Data Editor
Statistics PackageStatistics Packagefor the Social Science (SPSS)for the Social Science (SPSS)
Importing data from an EXCEL spreadsheet
7 The former EXCEL spreadsheet can now be saved as an SPSS file (FILE rArrSAVE AS) and is ready to be used in analyses Typically you would label variable and values and define missing values
Importing an Access tableSPSSWIN does not offer a direct import for Access tables Therefore we must follow these steps1 Open the Access file2 Open the data table3 Save the data as an Excel file4 Follow the steps outlined in the data import from Excel Spreadsheet to SPSSWIN
Importing Text Files into SPSSWINText data points typically are separated (or ldquodelimitedrdquo) by tabs or commas Sometimes they can be of fixed format
Statistics PackageStatistics Packagefor the Social Science (SPSS)for the Social Science (SPSS)
Running the FREQUENCIES procedure
1 Open the data file (from the menus click on FILE OPEN DATA) of rArr rArrinterest
2 From the menus click on ANALYZE DESCRIPTIVE STATISTICS rArr rArrFREQUENCIES
3 The FREQUENCIES Dialog Box will appear In the left-hand box will be a listing (source variable list) of all the variables that have been defined in the data file The first step is identifying the variable(s) for which you want to run a frequency analysis Click on a variable name(s) Then click the [ gt ] pushbutton The variable name(s) will now appear in the VARIABLE[S] box (selected variable list) Repeat these steps for each variable of interest
4 If all that is being requested is a frequency table showing count percentages (raw adjusted and cumulative) then click on OK
Statistics PackageStatistics Packagefor the Social Science (SPSS)for the Social Science (SPSS)
Requesting STATISTICSDescriptive and summary STATISTICS can be requested for numeric variables To request Statistics1 From the FREQUENCIES Dialog Box click on the STATISTICS pushbutton2 This will bring up the FREQUENCIES STATISTICS Dialog Box3 The STATISTICS Dialog Box offers the user a variety of choices
DESCRIPTIVES
The DESCRIPTIVES procedure can be used to generate descriptive statistics (click on ANALYZE DESCRIPTIVE STATISTICS DESCRIPTIVES) The rArr rArrprocedure offers many of the same statistics as the FREQUENCIES procedure but without generating frequency analysis tables
Statistics PackageStatistics Packagefor the Social Science (SPSS)for the Social Science (SPSS)
Requesting CHARTSOne can request a chart (graph) to be created for a variable or variables included in a FREQUENCIES procedure
1 In the FREQUENCIES Dialog box click on CHARTS2 The FREQUENCIES CHARTS Dialog box will appear Choose the intended chart (eg Bar diagram Pie chart histogram
Pasting charts into Word1 Click on the chart2 Click on the pulldown menu EDIT COPY OBJECTSrArr3 Go to the Word document in which the chart is to be embedded Click on EDIT rArr PASTE SPECIAL4 Select Formatted Text (RTF) and then click on OK5 Enlarge the graph to a desired size by dragging one or more of the black squares along the perimeter (if the black squares are not visible click once on the graph)
Statistics PackageStatistics Packagefor the Social Science (SPSS)for the Social Science (SPSS)
BASIC STATISTICAL PROCEDURES CROSSTABS
1 From the ANALYZE pull-down menu click on DESCRIPTIVE STATISTICS rArrCROSSTABS
2 The CROSSTABS Dialog Box will then open
3 From the variable selection box on the left click on a variable you wish to designate as the Row variable The values (codes) for the Row variable make up the rows of the crosstabs table Click on the arrow (gt) button for Row(s) Next click on a different variable you wish to designate as the Column variable The values (codes) for the Column variable make up the columns of the crosstabstable Click on the arrow (gt) button for Column(s)
4 You can specify more than one variable in the Row(s) andor Column(s) A cross table will be generated for each combination of Row and Column variables
Limitations SPSS users have less control over data manipulation and statistical output than other statistical packages such as SAS Stata etc
SPSS is a good first statistical package to perform quantitative research in social science because it is easy to use and because it can be a good starting point to learn more advanced statistical packages
Statistics PackageStatistics Packagefor the Social Science (SPSS)for the Social Science (SPSS)
QuestionsQuestions

Defining the problem and Defining the problem and conceptualizing the studyconceptualizing the study
Review relevanthellipidentify contd
ndash Identify scales to measure the variables
ndash Assess the feasibility of study objectives ie assess if it
is measurable what you want to measure
ndash Identify the target populations and define the eligibility
criteria
Research QuestionResearch Question
Example -
ndash Does smoking increase the risk of renal carcinoma
ndash Is oral inhaler effective in controlling asthma among
children
Hypothesis statementHypothesis statement
Example -ndash Smoking increases the risk of renal carcinoma in
pediatric patient
ndash Oral inhaler is effective in controlling asthma among
children
Study ObjectiveStudy Objective
The purpose or aim of the study
Example-
ndash To assess the risk of renal carcinoma associated with
smoking among pediatric patients (primary objective)
ndash To determine the race and gender disparities in the
prevalence of smoking (secondary objective)
Study variableStudy variable
Refers to measurement that changes from one individual to
another
Example- age gender BMI Systolic blood pressure
hematocrit
Outcome vs independent variableOutcome vs independent variable
Responseoutcome variable Measures the outcome of the study treatment or experimental manipulation
Examples-ndash Renal carcinoma incident among children
ndash Asthma control in pediatric asthmatic patients
Independent predictorexplanatory variable Explains or influences changes in a response variable
Examples-ndash Smoking
ndash Oral inhaler
Scale of variableoutput measurementScale of variableoutput measurement
Nominal - Categorical variables without any order or
ranking sequence such as names or classes (eg gender)
Binary- two categories multinomial- more than two
categories
Ordinal - Variables with an inherent rank or order eg
mild moderate severe Can be compared for equality or
greater or less but not how much greater or less
Scale of variableoutput measurementScale of variableoutput measurement
Interval - Values of the variable are ordered as in Ordinal and
additionally differences between values are meaningful however the
scale is not absolutely anchored Calendar dates and temperatures on
the Fahrenheit scale are examples Addition and subtraction but not
multiplication and division are meaningful operations
Ratio - Variables with all properties of Interval plus an absolute non-
arbitrary zero point eg age weight temperature (Kelvin) Addition
subtraction multiplication and division are all meaningful operations
Measurement biasMeasurement bias
Bias arises due to measurement error
Example-
ndash Suppose In the case of remission of Asthma the possible
outcomes are complete remission partial remission and no
remission If we measure the outcome variable as only remission
and non-remission basically we are committing an error by
putting partial remission in the non-remission group (type II error)
Designing the studyDesigning the study
A study design is a careful advance plan of data collection
and the analytic approach needed to answer the research
question under investigation in a scientific way
The basic elements of a study design-
ndash Selecting an appropriate sample size for a specified
level of power and level of significance
ndash Selecting methods of sampling data collection and
analysis appropriate to the studys objectives
ClinicalExperimental versus Observational designClinicalExperimental versus Observational design
The Lancet 2002 Vol 359
ClinicalExperimental vs Observational ClinicalExperimental vs Observational designdesign
The choice of a design mainly depends on the research
question (s) and type of research conduct ( experimental
or observational)
Experimental Interventional The investigator controls
the experimental environment in which the hypothesis is
tested The randomized double-blind clinical trial is the
gold standard
ClinicalExperimental vs Observational ClinicalExperimental vs Observational designdesign
Non-experimentalObservational The population is
observed without any interference by the investigator
For example in a study to see the effect of smoking it is
impossible for an investigator to assign smoking to the subjects
Instead investigator can study the effect by choosing a control
group and find the cause and relation effect Some examples are-
ndash Cross-sectional study
ndash Cohort study
ndash Case-control study
Randomized control designRandomized control design
Random allocation of subjects to different interventions
(or treatments) for the purpose of comparingdetermining
the efficacy of the study treatment (s)
ndash Eg placebo or standard medication (active control) can
be used as a control
ndash Patients with cancer or painful disease can not receive
placebo as a control
Randomized control designRandomized control design
Blindness Reduces the bias due to the preconception or
personal bias ndash Open trial Investigator and subject know the full details of the
treatment
ndash Single-blind trial Investigator knows about the treatment but
subject does not
ndash Double-blind Both investigator and subject do not know about the
treatment
ndash Triple-blind Sponsor investigator and subject do not know about
the treatment
Distribution of a variableDistribution of a variable
Distribution - (of a variable) tells us what values the
variable takes and how often it takes these values Eg
distribution of some 26 pediatric patients of ages 1 to 6
at AIDHC are as follows-
Age 1 2 3 4 5 6
Frequency 5 3 7 5 4 2
StatisticsStatistics
Science of data collection summarization analysis
and interpretation
Descriptive versus Inferential Statistics
ndash Descriptive Statistic Data description
(summarization) such as center variability and
shape
ndash Inferential Statistic Drawing conclusion beyond the
sample studied allowing for prediction
A Taxonomy ofA Taxonomy of StatisticsStatistics
How does statistics help usHow does statistics help us
Age Distribution
0
2
4
6
8
10
12
14
16
40 60 80 100 120 140 More
Age in Month
Nu
mb
er o
f S
ub
ject
s
Ages (in month) of the 60 patients in our data set 1 are- 71 127 65 82 140 53 114 56 84 65 67 134 64 hellip 91 51
Mean 9041666667
Standard Error 3902649518
Median 84
Mode 84
Standard Deviation 3022979318
Sample Variance 9138403955
Kurtosis -1183899591
Skewness 0389872725
Range 95
Minimum 48
Maximum 143
Sum 5425
Count 60
By simply looking at the data we fail to produce any informative account to describe the data how ever statistics produce a quick insight in to data using graphical and numerical statistical tools
60
80
10
01
20
14
0
Distribution of age
Ag
e (
mo
nth
)
Statistical Description of DataStatistical Description of Data
Statistics describes a numeric set of data by its
Center (mean median mode etc)
Variability (standard deviation range etc)
Shape (skewness kurtosis etc)
Statistics describes a categorical set of data by
Frequency percentage or proportion of each
category
Statistical inference is the process by which we acquire information about populations from samples
Two types of estimates for making inferencesndash Point estimationndash Interval estimate
Statistical Inference
Statistical Inference
Sample Population
Population and samplePopulation and sample
Population The entire collection of individuals or measurements about which information is desired
Sample A subset of the population selected for study
ndash Primary objective is to create a subset of population whose center spread and shape are as close as that of population
ndash Methods of sampling Random sampling stratified sampling systematic sampling cluster sampling multistage sampling area sampling qoata sampling etc
Parameter vs StatisticsParameter vs Statistics
Parameter
ndash Any statistical characteristic of a population
ndash Population mean population median population
standard deviation are examples of parameters
ndash Parameter describes the distribution of a population
ndash Parameters are fixed and usually unknown
Parameter vs StatisticsParameter vs Statistics
Statistic Any statistical characteristic of a sample
ndash Sample mean sample median sample standard
deviation are some examples of statistics
ndash Statistic describes the distribution of population
ndash Value of a statistic is known and is varies for different
samples
ndash Are used for making inference on parameter
Parameter vs StatisticsParameter vs Statistics
Statistical Issue To describe the distribution of a
population through census or making inference on
population distribution population parameter using sample
distribution statistic
Eg sample mean is an estimate of the population mean
Hypothesis TestingHypothesis Testing
Null hypothesis and Alternative hypothesis
Real Situation Ho is true Ho is false Reject Ho Type I
error (α) Correct Decision (1-)
D e c i s i o n
Accept Ho Correct Decision (1- α)
Type II Error ()
ElementsSteps in hypothesisElementsSteps in hypothesis
Hypothesis testing steps
ndash 1 Null (Ho) and alternative (H1)hypothesis specification
ndash 2 Selection of significance level (alpha) - 005 or 001
ndash 3 Calculating the test statistic ndasheg t F Chi-square
ndash 4 Calculating the probability value (p-value) or confidence
Interval
ndash 5 Describing the result and statistic in an understandable
way
Point estimator
Sample distribution
Parameter
Population distribution
bull A point estimate draws inference about a population by estimating the value of an unknown parameter using a single value or a point
Point Estimation
Interval estimatorSample distribution
bull An interval estimator draws inferences about a population by
estimating the value of an unknown parameter using an interval
Population distribution Parameter
Interval Estimation
P-Value versus the Confidence IntervalP-Value versus the Confidence Interval
Two main ways to assess study precision and the role of
chance in a study
ndash P value measures ( in probability) the evidence against
the null hypothesis
ndash An interval within which the value of the parameter lies
with a specified probability
ndash Eg 95 CI implies that if one repeats a study 100
times the true measure of association will lie inside the
CI in 95 out of 100 measures
Procedures for sample size Procedures for sample size calculationcalculation
Selection of primary variables of interest and formulation
of hypotheses
Information of standard deviation ( if numeric) or
proportion (if categorical)
A tolerance level of significance ()
Selection of reasonable test statistic
Power or Confidence level
A scientifically or clinically meaning effect difference
Brief concept of Statistical SoftwareBrief concept of Statistical Software
There are many software packages to perform statistical
analysis and visualization of data Some of them are-
ndash System for Statistical Analysis (SAS) S-plus R Matlab Minitab
BMDP STATA SPSS StatXact Statistica LISREL JMP
GLIM HIL MS Excel etc We will discuss MS Excel and SPSS in
brief
useful websites-
httpwwwR-projectorg (a free but powerful statistical software)
Microsoft ExcelMicrosoft Excel
A Spreadsheet Application It features calculation graphing tools pivot tables and a macro programming language called VBA (Visual Basic for Applications)
There are many versions of MS-Excel Excel XP Excel 2003 Excel 2007 are capable of performing a number of statistical analyses
Starting MS Excel Double click on the Microsoft Excel icon on the desktop or Click on Start --gt Programs --gt Microsoft Excel
Worksheet Consists of a multiple grid of cells with numbered rows down the page and alphabetically-tilted columns across the page Each cell is referenced by its coordinates For example A3 is used to refer to the cell in column A and row 3 B10B20 is used to refer to the range of cells in column B and rows 10 through 20
Microsoft ExcelMicrosoft Excel
Creating Formulas 1 Click the cell that you want to enter the formula 2 Type = (an equal sign) 3 Click the Function Button 4 Select the formula you want and step through the on-screen instructions
xf
Opening a document File Open (From a existing workbook) Change the directory area or drive to look for file in other locations
Creating a new workbook FileNewBlank Document
Saving a File FileSave
Selecting more than one cell Click on a cell eg A1) then hold the Shift key and click on another (eg D4) to select cells between and A1 and D4 or Click on a cell and drag the mouse across the desired range
Microsoft ExcelMicrosoft Excel
Entering Date and Time Dates are stored as MMDDYYYY No need to enter in that format For example Excel will recognize Jan 9 or jan-9 as 192007 and Jan 9 1999 as 191999 To enter todayrsquos date press Ctrl and together Use a or p to indicate am or pm For example 830 p is interpreted as 830 pm To enter current time press Ctrl and together
Copy and Paste all cells in a Sheet Ctrl+A for selecting Ctrl +C for copying and Ctrl+V for Pasting
Sorting Data Sort Sort By hellip
Descriptive Statistics and other Statistical methods ToolsData Analysis Statistical method If Data Analysis is not available then click on Tools Add-Ins and then select Analysis ToolPack and Analysis toolPack-Vba
Microsoft ExcelMicrosoft Excel
Statistical and Mathematical Function Start with lsquo=lsquo sign and then select function from function wizard xf
Inserting a Chart Click on Chart Wizard (or InsertChart) select chart give Input data range Update the Chart options and Select output range Worksheet
Importing Data in Excel File open FileType Click on File Choose Option ( DelimitedFixed Width) Choose Options (Tab Semicolon Comma Space Other) Finish
Limitations Excel uses algorithms that are vulnerable to rounding and truncation errors and may produce inaccurate results in extremecases
Statistics PackageStatistics Packagefor the Social Science (SPSS)for the Social Science (SPSS)
A general purpose statistical package SPSS is widely used in the social sciences particularly in sociology and psychology
SPSS can import data from almost any type of file to generate tabulated reports plots of distributions and trends descriptive statistics and complex statistical analyzes
Starting SPSS Double Click on SPSS on desktop or ProgramSPSS
Opening a SPSS file FileOpen
bull Data Editor
Various pull-down menus appear at the top of the Data Editor window These pull-down menus are at the heart of using SPSSWIN The Data Editor menu items (with some of the uses of the menu) are
MENUS AND TOOLBARS
Statistics PackageStatistics Packagefor the Social Science (SPSS)for the Social Science (SPSS)
FILE used to open and save data files
EDIT used to copy and paste data values used to find data in a file insert variables and cases OPTIONS allows the user to set general preferences as well as the setup for the Navigator Charts etc
VIEW user can change toolbars value labels can be seen in cells instead of data values
DATA select sort or weight cases merge files
MENUS AND TOOLBARS
TRANSFORM Compute new variables recode variables etc
Statistics PackageStatistics Packagefor the Social Science (SPSS)for the Social Science (SPSS)
ANALYZE perform various statistical procedures
GRAPHS create bar and pie charts etc
UTILITIES add comments to accompany data file (and other advanced features)
ADD-ons these are features not currently installed (advanced statistical procedures)
WINDOW switch between data syntax and navigator windows
HELP to access SPSSWIN Help information
MENUS AND TOOLBARS
Statistics PackageStatistics Packagefor the Social Science (SPSS)for the Social Science (SPSS)
Navigator (Output) Menus
When statistical procedures are run or charts are created the output will appear in the Navigator window The Navigator window contains many of the pull-down menus found in the Data Editor window Some of the important menus in the Navigator window include
INSERT used to insert page breaks titles charts etc
FORMAT for changing the alignment of a particular portion of the output
MENUS AND TOOLBARS
Statistics PackageStatistics Packagefor the Social Science (SPSS)for the Social Science (SPSS)
bull Formatting Toolbar
When a table has been created by a statistical procedure the user can edit the table to create a desired look or adddelete information Beginning with version 140 the user has a choice of editing the table in the Output or opening it in a separate Pivot Table (DEFINE) window Various pulldown menus are activated when the user double clicks on the table These include
EDIT undo and redo a pivot select a table or table body (eg to change the font)
INSERT used to insert titles captions and footnotes
PIVOT used to perform a pivot of the row and column variables
FORMAT various modifications can be made to tables and cells
Statistics PackageStatistics Packagefor the Social Science (SPSS)for the Social Science (SPSS)
Importing tab-delimited dataIn SPSSWIN click on FILE OPEN DATA Look in the appropriate location for rArr rArrthe text file Then select ldquoTextrdquo from ldquoFiles of typerdquo Click on the file name and then click on ldquoOpenrdquo You will see the Text Import Wizard ndash step 1 of 6 dialog box
You will now have an SPSS data file containing the former tab-delimited data You simply need to add variable and value labels and define missing values
Exporting Data to Excelclick on FILE SAVE AS Click on the File Name for the file to be exported For rArrthe ldquoSave as Typerdquo select from the pull-down menu Excel (xls) You will notice the checkbox for ldquowrite variable names to spreadsheetrdquo Leave this checked as you will want the variable names to be in the first row of each column in the Excel spreadsheet Finally click on Save
Statistics PackageStatistics Packagefor the Social Science (SPSS)for the Social Science (SPSS)
bull Additional menusCHART EDITOR used to edit a graph
SYNTAX EDITOR used to edit the text in a syntax window
bull Show or hide a toolbar
Click on VIEW TOOLBARS 1048635to show it to hide itrArr rArr
bull Move a toolbar
Click on the toolbar (but not on one of the pushbuttons) and then drag the toolbar to its new location
bull Customize a toolbar
Click on VIEW TOOLBARS CUSTOMIZErArr rArr
Statistics PackageStatistics Packagefor the Social Science (SPSS)for the Social Science (SPSS)
Importing data from an EXCEL spreadsheetData from an Excel spreadsheet can be imported into SPSSWIN as follows1 In SPSSWIN click on FILE OPEN DATA The OPEN DATA FILE Dialog rArr rArrBox will appear2 Locate the file of interest Use the Look In pull-down list to identify the folder containing the Excel file of interest3 From the FILE TYPE pull down menu select EXCEL (xls)
4 Click on the file name of interest and click on OPEN or simply double-click on the file name
5 Keep the box checked that reads Read variable names from the first row of data This presumes that the first row of the Excel data file contains variable names in the first row [If the data resided in a different worksheet in the Excel file this would need to be entered]
6 Click on OK The Excel data file will now appear in the SPSSWIN Data Editor
Statistics PackageStatistics Packagefor the Social Science (SPSS)for the Social Science (SPSS)
Importing data from an EXCEL spreadsheet
7 The former EXCEL spreadsheet can now be saved as an SPSS file (FILE rArrSAVE AS) and is ready to be used in analyses Typically you would label variable and values and define missing values
Importing an Access tableSPSSWIN does not offer a direct import for Access tables Therefore we must follow these steps1 Open the Access file2 Open the data table3 Save the data as an Excel file4 Follow the steps outlined in the data import from Excel Spreadsheet to SPSSWIN
Importing Text Files into SPSSWINText data points typically are separated (or ldquodelimitedrdquo) by tabs or commas Sometimes they can be of fixed format
Statistics PackageStatistics Packagefor the Social Science (SPSS)for the Social Science (SPSS)
Running the FREQUENCIES procedure
1 Open the data file (from the menus click on FILE OPEN DATA) of rArr rArrinterest
2 From the menus click on ANALYZE DESCRIPTIVE STATISTICS rArr rArrFREQUENCIES
3 The FREQUENCIES Dialog Box will appear In the left-hand box will be a listing (source variable list) of all the variables that have been defined in the data file The first step is identifying the variable(s) for which you want to run a frequency analysis Click on a variable name(s) Then click the [ gt ] pushbutton The variable name(s) will now appear in the VARIABLE[S] box (selected variable list) Repeat these steps for each variable of interest
4 If all that is being requested is a frequency table showing count percentages (raw adjusted and cumulative) then click on OK
Statistics PackageStatistics Packagefor the Social Science (SPSS)for the Social Science (SPSS)
Requesting STATISTICSDescriptive and summary STATISTICS can be requested for numeric variables To request Statistics1 From the FREQUENCIES Dialog Box click on the STATISTICS pushbutton2 This will bring up the FREQUENCIES STATISTICS Dialog Box3 The STATISTICS Dialog Box offers the user a variety of choices
DESCRIPTIVES
The DESCRIPTIVES procedure can be used to generate descriptive statistics (click on ANALYZE DESCRIPTIVE STATISTICS DESCRIPTIVES) The rArr rArrprocedure offers many of the same statistics as the FREQUENCIES procedure but without generating frequency analysis tables
Statistics PackageStatistics Packagefor the Social Science (SPSS)for the Social Science (SPSS)
Requesting CHARTSOne can request a chart (graph) to be created for a variable or variables included in a FREQUENCIES procedure
1 In the FREQUENCIES Dialog box click on CHARTS2 The FREQUENCIES CHARTS Dialog box will appear Choose the intended chart (eg Bar diagram Pie chart histogram
Pasting charts into Word1 Click on the chart2 Click on the pulldown menu EDIT COPY OBJECTSrArr3 Go to the Word document in which the chart is to be embedded Click on EDIT rArr PASTE SPECIAL4 Select Formatted Text (RTF) and then click on OK5 Enlarge the graph to a desired size by dragging one or more of the black squares along the perimeter (if the black squares are not visible click once on the graph)
Statistics PackageStatistics Packagefor the Social Science (SPSS)for the Social Science (SPSS)
BASIC STATISTICAL PROCEDURES CROSSTABS
1 From the ANALYZE pull-down menu click on DESCRIPTIVE STATISTICS rArrCROSSTABS
2 The CROSSTABS Dialog Box will then open
3 From the variable selection box on the left click on a variable you wish to designate as the Row variable The values (codes) for the Row variable make up the rows of the crosstabs table Click on the arrow (gt) button for Row(s) Next click on a different variable you wish to designate as the Column variable The values (codes) for the Column variable make up the columns of the crosstabstable Click on the arrow (gt) button for Column(s)
4 You can specify more than one variable in the Row(s) andor Column(s) A cross table will be generated for each combination of Row and Column variables
Limitations SPSS users have less control over data manipulation and statistical output than other statistical packages such as SAS Stata etc
SPSS is a good first statistical package to perform quantitative research in social science because it is easy to use and because it can be a good starting point to learn more advanced statistical packages
Statistics PackageStatistics Packagefor the Social Science (SPSS)for the Social Science (SPSS)
QuestionsQuestions

Scale of variableoutput measurementScale of variableoutput measurement
Interval - Values of the variable are ordered as in Ordinal and
additionally differences between values are meaningful however the
scale is not absolutely anchored Calendar dates and temperatures on
the Fahrenheit scale are examples Addition and subtraction but not
multiplication and division are meaningful operations
Ratio - Variables with all properties of Interval plus an absolute non-
arbitrary zero point eg age weight temperature (Kelvin) Addition
subtraction multiplication and division are all meaningful operations
Measurement biasMeasurement bias
Bias arises due to measurement error
Example-
ndash Suppose In the case of remission of Asthma the possible
outcomes are complete remission partial remission and no
remission If we measure the outcome variable as only remission
and non-remission basically we are committing an error by
putting partial remission in the non-remission group (type II error)
Designing the studyDesigning the study
A study design is a careful advance plan of data collection
and the analytic approach needed to answer the research
question under investigation in a scientific way
The basic elements of a study design-
ndash Selecting an appropriate sample size for a specified
level of power and level of significance
ndash Selecting methods of sampling data collection and
analysis appropriate to the studys objectives
ClinicalExperimental versus Observational designClinicalExperimental versus Observational design
The Lancet 2002 Vol 359
ClinicalExperimental vs Observational ClinicalExperimental vs Observational designdesign
The choice of a design mainly depends on the research
question (s) and type of research conduct ( experimental
or observational)
Experimental Interventional The investigator controls
the experimental environment in which the hypothesis is
tested The randomized double-blind clinical trial is the
gold standard
ClinicalExperimental vs Observational ClinicalExperimental vs Observational designdesign
Non-experimentalObservational The population is
observed without any interference by the investigator
For example in a study to see the effect of smoking it is
impossible for an investigator to assign smoking to the subjects
Instead investigator can study the effect by choosing a control
group and find the cause and relation effect Some examples are-
ndash Cross-sectional study
ndash Cohort study
ndash Case-control study
Randomized control designRandomized control design
Random allocation of subjects to different interventions
(or treatments) for the purpose of comparingdetermining
the efficacy of the study treatment (s)
ndash Eg placebo or standard medication (active control) can
be used as a control
ndash Patients with cancer or painful disease can not receive
placebo as a control
Randomized control designRandomized control design
Blindness Reduces the bias due to the preconception or
personal bias ndash Open trial Investigator and subject know the full details of the
treatment
ndash Single-blind trial Investigator knows about the treatment but
subject does not
ndash Double-blind Both investigator and subject do not know about the
treatment
ndash Triple-blind Sponsor investigator and subject do not know about
the treatment
Distribution of a variableDistribution of a variable
Distribution - (of a variable) tells us what values the
variable takes and how often it takes these values Eg
distribution of some 26 pediatric patients of ages 1 to 6
at AIDHC are as follows-
Age 1 2 3 4 5 6
Frequency 5 3 7 5 4 2
StatisticsStatistics
Science of data collection summarization analysis
and interpretation
Descriptive versus Inferential Statistics
ndash Descriptive Statistic Data description
(summarization) such as center variability and
shape
ndash Inferential Statistic Drawing conclusion beyond the
sample studied allowing for prediction
A Taxonomy ofA Taxonomy of StatisticsStatistics
How does statistics help usHow does statistics help us
Age Distribution
0
2
4
6
8
10
12
14
16
40 60 80 100 120 140 More
Age in Month
Nu
mb
er o
f S
ub
ject
s
Ages (in month) of the 60 patients in our data set 1 are- 71 127 65 82 140 53 114 56 84 65 67 134 64 hellip 91 51
Mean 9041666667
Standard Error 3902649518
Median 84
Mode 84
Standard Deviation 3022979318
Sample Variance 9138403955
Kurtosis -1183899591
Skewness 0389872725
Range 95
Minimum 48
Maximum 143
Sum 5425
Count 60
By simply looking at the data we fail to produce any informative account to describe the data how ever statistics produce a quick insight in to data using graphical and numerical statistical tools
60
80
10
01
20
14
0
Distribution of age
Ag
e (
mo
nth
)
Statistical Description of DataStatistical Description of Data
Statistics describes a numeric set of data by its
Center (mean median mode etc)
Variability (standard deviation range etc)
Shape (skewness kurtosis etc)
Statistics describes a categorical set of data by
Frequency percentage or proportion of each
category
Statistical inference is the process by which we acquire information about populations from samples
Two types of estimates for making inferencesndash Point estimationndash Interval estimate
Statistical Inference
Statistical Inference
Sample Population
Population and samplePopulation and sample
Population The entire collection of individuals or measurements about which information is desired
Sample A subset of the population selected for study
ndash Primary objective is to create a subset of population whose center spread and shape are as close as that of population
ndash Methods of sampling Random sampling stratified sampling systematic sampling cluster sampling multistage sampling area sampling qoata sampling etc
Parameter vs StatisticsParameter vs Statistics
Parameter
ndash Any statistical characteristic of a population
ndash Population mean population median population
standard deviation are examples of parameters
ndash Parameter describes the distribution of a population
ndash Parameters are fixed and usually unknown
Parameter vs StatisticsParameter vs Statistics
Statistic Any statistical characteristic of a sample
ndash Sample mean sample median sample standard
deviation are some examples of statistics
ndash Statistic describes the distribution of population
ndash Value of a statistic is known and is varies for different
samples
ndash Are used for making inference on parameter
Parameter vs StatisticsParameter vs Statistics
Statistical Issue To describe the distribution of a
population through census or making inference on
population distribution population parameter using sample
distribution statistic
Eg sample mean is an estimate of the population mean
Hypothesis TestingHypothesis Testing
Null hypothesis and Alternative hypothesis
Real Situation Ho is true Ho is false Reject Ho Type I
error (α) Correct Decision (1-)
D e c i s i o n
Accept Ho Correct Decision (1- α)
Type II Error ()
ElementsSteps in hypothesisElementsSteps in hypothesis
Hypothesis testing steps
ndash 1 Null (Ho) and alternative (H1)hypothesis specification
ndash 2 Selection of significance level (alpha) - 005 or 001
ndash 3 Calculating the test statistic ndasheg t F Chi-square
ndash 4 Calculating the probability value (p-value) or confidence
Interval
ndash 5 Describing the result and statistic in an understandable
way
Point estimator
Sample distribution
Parameter
Population distribution
bull A point estimate draws inference about a population by estimating the value of an unknown parameter using a single value or a point
Point Estimation
Interval estimatorSample distribution
bull An interval estimator draws inferences about a population by
estimating the value of an unknown parameter using an interval
Population distribution Parameter
Interval Estimation
P-Value versus the Confidence IntervalP-Value versus the Confidence Interval
Two main ways to assess study precision and the role of
chance in a study
ndash P value measures ( in probability) the evidence against
the null hypothesis
ndash An interval within which the value of the parameter lies
with a specified probability
ndash Eg 95 CI implies that if one repeats a study 100
times the true measure of association will lie inside the
CI in 95 out of 100 measures
Procedures for sample size Procedures for sample size calculationcalculation
Selection of primary variables of interest and formulation
of hypotheses
Information of standard deviation ( if numeric) or
proportion (if categorical)
A tolerance level of significance ()
Selection of reasonable test statistic
Power or Confidence level
A scientifically or clinically meaning effect difference
Brief concept of Statistical SoftwareBrief concept of Statistical Software
There are many software packages to perform statistical
analysis and visualization of data Some of them are-
ndash System for Statistical Analysis (SAS) S-plus R Matlab Minitab
BMDP STATA SPSS StatXact Statistica LISREL JMP
GLIM HIL MS Excel etc We will discuss MS Excel and SPSS in
brief
useful websites-
httpwwwR-projectorg (a free but powerful statistical software)
Microsoft ExcelMicrosoft Excel
A Spreadsheet Application It features calculation graphing tools pivot tables and a macro programming language called VBA (Visual Basic for Applications)
There are many versions of MS-Excel Excel XP Excel 2003 Excel 2007 are capable of performing a number of statistical analyses
Starting MS Excel Double click on the Microsoft Excel icon on the desktop or Click on Start --gt Programs --gt Microsoft Excel
Worksheet Consists of a multiple grid of cells with numbered rows down the page and alphabetically-tilted columns across the page Each cell is referenced by its coordinates For example A3 is used to refer to the cell in column A and row 3 B10B20 is used to refer to the range of cells in column B and rows 10 through 20
Microsoft ExcelMicrosoft Excel
Creating Formulas 1 Click the cell that you want to enter the formula 2 Type = (an equal sign) 3 Click the Function Button 4 Select the formula you want and step through the on-screen instructions
xf
Opening a document File Open (From a existing workbook) Change the directory area or drive to look for file in other locations
Creating a new workbook FileNewBlank Document
Saving a File FileSave
Selecting more than one cell Click on a cell eg A1) then hold the Shift key and click on another (eg D4) to select cells between and A1 and D4 or Click on a cell and drag the mouse across the desired range
Microsoft ExcelMicrosoft Excel
Entering Date and Time Dates are stored as MMDDYYYY No need to enter in that format For example Excel will recognize Jan 9 or jan-9 as 192007 and Jan 9 1999 as 191999 To enter todayrsquos date press Ctrl and together Use a or p to indicate am or pm For example 830 p is interpreted as 830 pm To enter current time press Ctrl and together
Copy and Paste all cells in a Sheet Ctrl+A for selecting Ctrl +C for copying and Ctrl+V for Pasting
Sorting Data Sort Sort By hellip
Descriptive Statistics and other Statistical methods ToolsData Analysis Statistical method If Data Analysis is not available then click on Tools Add-Ins and then select Analysis ToolPack and Analysis toolPack-Vba
Microsoft ExcelMicrosoft Excel
Statistical and Mathematical Function Start with lsquo=lsquo sign and then select function from function wizard xf
Inserting a Chart Click on Chart Wizard (or InsertChart) select chart give Input data range Update the Chart options and Select output range Worksheet
Importing Data in Excel File open FileType Click on File Choose Option ( DelimitedFixed Width) Choose Options (Tab Semicolon Comma Space Other) Finish
Limitations Excel uses algorithms that are vulnerable to rounding and truncation errors and may produce inaccurate results in extremecases
Statistics PackageStatistics Packagefor the Social Science (SPSS)for the Social Science (SPSS)
A general purpose statistical package SPSS is widely used in the social sciences particularly in sociology and psychology
SPSS can import data from almost any type of file to generate tabulated reports plots of distributions and trends descriptive statistics and complex statistical analyzes
Starting SPSS Double Click on SPSS on desktop or ProgramSPSS
Opening a SPSS file FileOpen
bull Data Editor
Various pull-down menus appear at the top of the Data Editor window These pull-down menus are at the heart of using SPSSWIN The Data Editor menu items (with some of the uses of the menu) are
MENUS AND TOOLBARS
Statistics PackageStatistics Packagefor the Social Science (SPSS)for the Social Science (SPSS)
FILE used to open and save data files
EDIT used to copy and paste data values used to find data in a file insert variables and cases OPTIONS allows the user to set general preferences as well as the setup for the Navigator Charts etc
VIEW user can change toolbars value labels can be seen in cells instead of data values
DATA select sort or weight cases merge files
MENUS AND TOOLBARS
TRANSFORM Compute new variables recode variables etc
Statistics PackageStatistics Packagefor the Social Science (SPSS)for the Social Science (SPSS)
ANALYZE perform various statistical procedures
GRAPHS create bar and pie charts etc
UTILITIES add comments to accompany data file (and other advanced features)
ADD-ons these are features not currently installed (advanced statistical procedures)
WINDOW switch between data syntax and navigator windows
HELP to access SPSSWIN Help information
MENUS AND TOOLBARS
Statistics PackageStatistics Packagefor the Social Science (SPSS)for the Social Science (SPSS)
Navigator (Output) Menus
When statistical procedures are run or charts are created the output will appear in the Navigator window The Navigator window contains many of the pull-down menus found in the Data Editor window Some of the important menus in the Navigator window include
INSERT used to insert page breaks titles charts etc
FORMAT for changing the alignment of a particular portion of the output
MENUS AND TOOLBARS
Statistics PackageStatistics Packagefor the Social Science (SPSS)for the Social Science (SPSS)
bull Formatting Toolbar
When a table has been created by a statistical procedure the user can edit the table to create a desired look or adddelete information Beginning with version 140 the user has a choice of editing the table in the Output or opening it in a separate Pivot Table (DEFINE) window Various pulldown menus are activated when the user double clicks on the table These include
EDIT undo and redo a pivot select a table or table body (eg to change the font)
INSERT used to insert titles captions and footnotes
PIVOT used to perform a pivot of the row and column variables
FORMAT various modifications can be made to tables and cells
Statistics PackageStatistics Packagefor the Social Science (SPSS)for the Social Science (SPSS)
Importing tab-delimited dataIn SPSSWIN click on FILE OPEN DATA Look in the appropriate location for rArr rArrthe text file Then select ldquoTextrdquo from ldquoFiles of typerdquo Click on the file name and then click on ldquoOpenrdquo You will see the Text Import Wizard ndash step 1 of 6 dialog box
You will now have an SPSS data file containing the former tab-delimited data You simply need to add variable and value labels and define missing values
Exporting Data to Excelclick on FILE SAVE AS Click on the File Name for the file to be exported For rArrthe ldquoSave as Typerdquo select from the pull-down menu Excel (xls) You will notice the checkbox for ldquowrite variable names to spreadsheetrdquo Leave this checked as you will want the variable names to be in the first row of each column in the Excel spreadsheet Finally click on Save
Statistics PackageStatistics Packagefor the Social Science (SPSS)for the Social Science (SPSS)
bull Additional menusCHART EDITOR used to edit a graph
SYNTAX EDITOR used to edit the text in a syntax window
bull Show or hide a toolbar
Click on VIEW TOOLBARS 1048635to show it to hide itrArr rArr
bull Move a toolbar
Click on the toolbar (but not on one of the pushbuttons) and then drag the toolbar to its new location
bull Customize a toolbar
Click on VIEW TOOLBARS CUSTOMIZErArr rArr
Statistics PackageStatistics Packagefor the Social Science (SPSS)for the Social Science (SPSS)
Importing data from an EXCEL spreadsheetData from an Excel spreadsheet can be imported into SPSSWIN as follows1 In SPSSWIN click on FILE OPEN DATA The OPEN DATA FILE Dialog rArr rArrBox will appear2 Locate the file of interest Use the Look In pull-down list to identify the folder containing the Excel file of interest3 From the FILE TYPE pull down menu select EXCEL (xls)
4 Click on the file name of interest and click on OPEN or simply double-click on the file name
5 Keep the box checked that reads Read variable names from the first row of data This presumes that the first row of the Excel data file contains variable names in the first row [If the data resided in a different worksheet in the Excel file this would need to be entered]
6 Click on OK The Excel data file will now appear in the SPSSWIN Data Editor
Statistics PackageStatistics Packagefor the Social Science (SPSS)for the Social Science (SPSS)
Importing data from an EXCEL spreadsheet
7 The former EXCEL spreadsheet can now be saved as an SPSS file (FILE rArrSAVE AS) and is ready to be used in analyses Typically you would label variable and values and define missing values
Importing an Access tableSPSSWIN does not offer a direct import for Access tables Therefore we must follow these steps1 Open the Access file2 Open the data table3 Save the data as an Excel file4 Follow the steps outlined in the data import from Excel Spreadsheet to SPSSWIN
Importing Text Files into SPSSWINText data points typically are separated (or ldquodelimitedrdquo) by tabs or commas Sometimes they can be of fixed format
Statistics PackageStatistics Packagefor the Social Science (SPSS)for the Social Science (SPSS)
Running the FREQUENCIES procedure
1 Open the data file (from the menus click on FILE OPEN DATA) of rArr rArrinterest
2 From the menus click on ANALYZE DESCRIPTIVE STATISTICS rArr rArrFREQUENCIES
3 The FREQUENCIES Dialog Box will appear In the left-hand box will be a listing (source variable list) of all the variables that have been defined in the data file The first step is identifying the variable(s) for which you want to run a frequency analysis Click on a variable name(s) Then click the [ gt ] pushbutton The variable name(s) will now appear in the VARIABLE[S] box (selected variable list) Repeat these steps for each variable of interest
4 If all that is being requested is a frequency table showing count percentages (raw adjusted and cumulative) then click on OK
Statistics PackageStatistics Packagefor the Social Science (SPSS)for the Social Science (SPSS)
Requesting STATISTICSDescriptive and summary STATISTICS can be requested for numeric variables To request Statistics1 From the FREQUENCIES Dialog Box click on the STATISTICS pushbutton2 This will bring up the FREQUENCIES STATISTICS Dialog Box3 The STATISTICS Dialog Box offers the user a variety of choices
DESCRIPTIVES
The DESCRIPTIVES procedure can be used to generate descriptive statistics (click on ANALYZE DESCRIPTIVE STATISTICS DESCRIPTIVES) The rArr rArrprocedure offers many of the same statistics as the FREQUENCIES procedure but without generating frequency analysis tables
Statistics PackageStatistics Packagefor the Social Science (SPSS)for the Social Science (SPSS)
Requesting CHARTSOne can request a chart (graph) to be created for a variable or variables included in a FREQUENCIES procedure
1 In the FREQUENCIES Dialog box click on CHARTS2 The FREQUENCIES CHARTS Dialog box will appear Choose the intended chart (eg Bar diagram Pie chart histogram
Pasting charts into Word1 Click on the chart2 Click on the pulldown menu EDIT COPY OBJECTSrArr3 Go to the Word document in which the chart is to be embedded Click on EDIT rArr PASTE SPECIAL4 Select Formatted Text (RTF) and then click on OK5 Enlarge the graph to a desired size by dragging one or more of the black squares along the perimeter (if the black squares are not visible click once on the graph)
Statistics PackageStatistics Packagefor the Social Science (SPSS)for the Social Science (SPSS)
BASIC STATISTICAL PROCEDURES CROSSTABS
1 From the ANALYZE pull-down menu click on DESCRIPTIVE STATISTICS rArrCROSSTABS
2 The CROSSTABS Dialog Box will then open
3 From the variable selection box on the left click on a variable you wish to designate as the Row variable The values (codes) for the Row variable make up the rows of the crosstabs table Click on the arrow (gt) button for Row(s) Next click on a different variable you wish to designate as the Column variable The values (codes) for the Column variable make up the columns of the crosstabstable Click on the arrow (gt) button for Column(s)
4 You can specify more than one variable in the Row(s) andor Column(s) A cross table will be generated for each combination of Row and Column variables
Limitations SPSS users have less control over data manipulation and statistical output than other statistical packages such as SAS Stata etc
SPSS is a good first statistical package to perform quantitative research in social science because it is easy to use and because it can be a good starting point to learn more advanced statistical packages
Statistics PackageStatistics Packagefor the Social Science (SPSS)for the Social Science (SPSS)
QuestionsQuestions
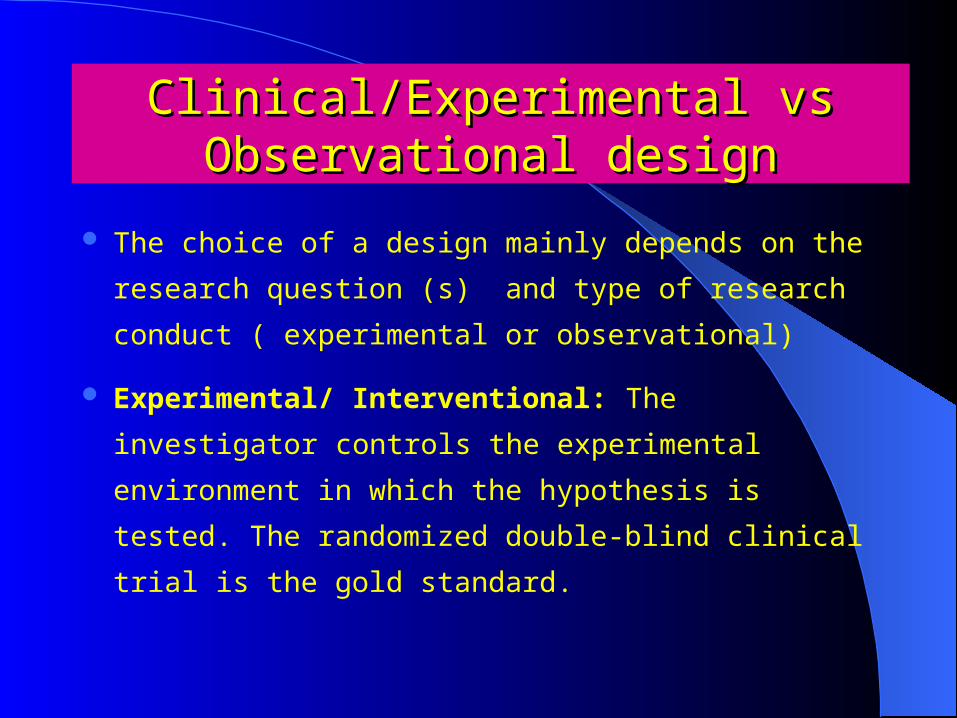
ClinicalExperimental vs Observational ClinicalExperimental vs Observational designdesign
Non-experimentalObservational The population is
observed without any interference by the investigator
For example in a study to see the effect of smoking it is
impossible for an investigator to assign smoking to the subjects
Instead investigator can study the effect by choosing a control
group and find the cause and relation effect Some examples are-
ndash Cross-sectional study
ndash Cohort study
ndash Case-control study
Randomized control designRandomized control design
Random allocation of subjects to different interventions
(or treatments) for the purpose of comparingdetermining
the efficacy of the study treatment (s)
ndash Eg placebo or standard medication (active control) can
be used as a control
ndash Patients with cancer or painful disease can not receive
placebo as a control
Randomized control designRandomized control design
Blindness Reduces the bias due to the preconception or
personal bias ndash Open trial Investigator and subject know the full details of the
treatment
ndash Single-blind trial Investigator knows about the treatment but
subject does not
ndash Double-blind Both investigator and subject do not know about the
treatment
ndash Triple-blind Sponsor investigator and subject do not know about
the treatment
Distribution of a variableDistribution of a variable
Distribution - (of a variable) tells us what values the
variable takes and how often it takes these values Eg
distribution of some 26 pediatric patients of ages 1 to 6
at AIDHC are as follows-
Age 1 2 3 4 5 6
Frequency 5 3 7 5 4 2
StatisticsStatistics
Science of data collection summarization analysis
and interpretation
Descriptive versus Inferential Statistics
ndash Descriptive Statistic Data description
(summarization) such as center variability and
shape
ndash Inferential Statistic Drawing conclusion beyond the
sample studied allowing for prediction
A Taxonomy ofA Taxonomy of StatisticsStatistics
How does statistics help usHow does statistics help us
Age Distribution
0
2
4
6
8
10
12
14
16
40 60 80 100 120 140 More
Age in Month
Nu
mb
er o
f S
ub
ject
s
Ages (in month) of the 60 patients in our data set 1 are- 71 127 65 82 140 53 114 56 84 65 67 134 64 hellip 91 51
Mean 9041666667
Standard Error 3902649518
Median 84
Mode 84
Standard Deviation 3022979318
Sample Variance 9138403955
Kurtosis -1183899591
Skewness 0389872725
Range 95
Minimum 48
Maximum 143
Sum 5425
Count 60
By simply looking at the data we fail to produce any informative account to describe the data how ever statistics produce a quick insight in to data using graphical and numerical statistical tools
60
80
10
01
20
14
0
Distribution of age
Ag
e (
mo
nth
)
Statistical Description of DataStatistical Description of Data
Statistics describes a numeric set of data by its
Center (mean median mode etc)
Variability (standard deviation range etc)
Shape (skewness kurtosis etc)
Statistics describes a categorical set of data by
Frequency percentage or proportion of each
category
Statistical inference is the process by which we acquire information about populations from samples
Two types of estimates for making inferencesndash Point estimationndash Interval estimate
Statistical Inference
Statistical Inference
Sample Population
Population and samplePopulation and sample
Population The entire collection of individuals or measurements about which information is desired
Sample A subset of the population selected for study
ndash Primary objective is to create a subset of population whose center spread and shape are as close as that of population
ndash Methods of sampling Random sampling stratified sampling systematic sampling cluster sampling multistage sampling area sampling qoata sampling etc
Parameter vs StatisticsParameter vs Statistics
Parameter
ndash Any statistical characteristic of a population
ndash Population mean population median population
standard deviation are examples of parameters
ndash Parameter describes the distribution of a population
ndash Parameters are fixed and usually unknown
Parameter vs StatisticsParameter vs Statistics
Statistic Any statistical characteristic of a sample
ndash Sample mean sample median sample standard
deviation are some examples of statistics
ndash Statistic describes the distribution of population
ndash Value of a statistic is known and is varies for different
samples
ndash Are used for making inference on parameter
Parameter vs StatisticsParameter vs Statistics
Statistical Issue To describe the distribution of a
population through census or making inference on
population distribution population parameter using sample
distribution statistic
Eg sample mean is an estimate of the population mean
Hypothesis TestingHypothesis Testing
Null hypothesis and Alternative hypothesis
Real Situation Ho is true Ho is false Reject Ho Type I
error (α) Correct Decision (1-)
D e c i s i o n
Accept Ho Correct Decision (1- α)
Type II Error ()
ElementsSteps in hypothesisElementsSteps in hypothesis
Hypothesis testing steps
ndash 1 Null (Ho) and alternative (H1)hypothesis specification
ndash 2 Selection of significance level (alpha) - 005 or 001
ndash 3 Calculating the test statistic ndasheg t F Chi-square
ndash 4 Calculating the probability value (p-value) or confidence
Interval
ndash 5 Describing the result and statistic in an understandable
way
Point estimator
Sample distribution
Parameter
Population distribution
bull A point estimate draws inference about a population by estimating the value of an unknown parameter using a single value or a point
Point Estimation
Interval estimatorSample distribution
bull An interval estimator draws inferences about a population by
estimating the value of an unknown parameter using an interval
Population distribution Parameter
Interval Estimation
P-Value versus the Confidence IntervalP-Value versus the Confidence Interval
Two main ways to assess study precision and the role of
chance in a study
ndash P value measures ( in probability) the evidence against
the null hypothesis
ndash An interval within which the value of the parameter lies
with a specified probability
ndash Eg 95 CI implies that if one repeats a study 100
times the true measure of association will lie inside the
CI in 95 out of 100 measures
Procedures for sample size Procedures for sample size calculationcalculation
Selection of primary variables of interest and formulation
of hypotheses
Information of standard deviation ( if numeric) or
proportion (if categorical)
A tolerance level of significance ()
Selection of reasonable test statistic
Power or Confidence level
A scientifically or clinically meaning effect difference
Brief concept of Statistical SoftwareBrief concept of Statistical Software
There are many software packages to perform statistical
analysis and visualization of data Some of them are-
ndash System for Statistical Analysis (SAS) S-plus R Matlab Minitab
BMDP STATA SPSS StatXact Statistica LISREL JMP
GLIM HIL MS Excel etc We will discuss MS Excel and SPSS in
brief
useful websites-
httpwwwR-projectorg (a free but powerful statistical software)
Microsoft ExcelMicrosoft Excel
A Spreadsheet Application It features calculation graphing tools pivot tables and a macro programming language called VBA (Visual Basic for Applications)
There are many versions of MS-Excel Excel XP Excel 2003 Excel 2007 are capable of performing a number of statistical analyses
Starting MS Excel Double click on the Microsoft Excel icon on the desktop or Click on Start --gt Programs --gt Microsoft Excel
Worksheet Consists of a multiple grid of cells with numbered rows down the page and alphabetically-tilted columns across the page Each cell is referenced by its coordinates For example A3 is used to refer to the cell in column A and row 3 B10B20 is used to refer to the range of cells in column B and rows 10 through 20
Microsoft ExcelMicrosoft Excel
Creating Formulas 1 Click the cell that you want to enter the formula 2 Type = (an equal sign) 3 Click the Function Button 4 Select the formula you want and step through the on-screen instructions
xf
Opening a document File Open (From a existing workbook) Change the directory area or drive to look for file in other locations
Creating a new workbook FileNewBlank Document
Saving a File FileSave
Selecting more than one cell Click on a cell eg A1) then hold the Shift key and click on another (eg D4) to select cells between and A1 and D4 or Click on a cell and drag the mouse across the desired range
Microsoft ExcelMicrosoft Excel
Entering Date and Time Dates are stored as MMDDYYYY No need to enter in that format For example Excel will recognize Jan 9 or jan-9 as 192007 and Jan 9 1999 as 191999 To enter todayrsquos date press Ctrl and together Use a or p to indicate am or pm For example 830 p is interpreted as 830 pm To enter current time press Ctrl and together
Copy and Paste all cells in a Sheet Ctrl+A for selecting Ctrl +C for copying and Ctrl+V for Pasting
Sorting Data Sort Sort By hellip
Descriptive Statistics and other Statistical methods ToolsData Analysis Statistical method If Data Analysis is not available then click on Tools Add-Ins and then select Analysis ToolPack and Analysis toolPack-Vba
Microsoft ExcelMicrosoft Excel
Statistical and Mathematical Function Start with lsquo=lsquo sign and then select function from function wizard xf
Inserting a Chart Click on Chart Wizard (or InsertChart) select chart give Input data range Update the Chart options and Select output range Worksheet
Importing Data in Excel File open FileType Click on File Choose Option ( DelimitedFixed Width) Choose Options (Tab Semicolon Comma Space Other) Finish
Limitations Excel uses algorithms that are vulnerable to rounding and truncation errors and may produce inaccurate results in extremecases
Statistics PackageStatistics Packagefor the Social Science (SPSS)for the Social Science (SPSS)
A general purpose statistical package SPSS is widely used in the social sciences particularly in sociology and psychology
SPSS can import data from almost any type of file to generate tabulated reports plots of distributions and trends descriptive statistics and complex statistical analyzes
Starting SPSS Double Click on SPSS on desktop or ProgramSPSS
Opening a SPSS file FileOpen
bull Data Editor
Various pull-down menus appear at the top of the Data Editor window These pull-down menus are at the heart of using SPSSWIN The Data Editor menu items (with some of the uses of the menu) are
MENUS AND TOOLBARS
Statistics PackageStatistics Packagefor the Social Science (SPSS)for the Social Science (SPSS)
FILE used to open and save data files
EDIT used to copy and paste data values used to find data in a file insert variables and cases OPTIONS allows the user to set general preferences as well as the setup for the Navigator Charts etc
VIEW user can change toolbars value labels can be seen in cells instead of data values
DATA select sort or weight cases merge files
MENUS AND TOOLBARS
TRANSFORM Compute new variables recode variables etc
Statistics PackageStatistics Packagefor the Social Science (SPSS)for the Social Science (SPSS)
ANALYZE perform various statistical procedures
GRAPHS create bar and pie charts etc
UTILITIES add comments to accompany data file (and other advanced features)
ADD-ons these are features not currently installed (advanced statistical procedures)
WINDOW switch between data syntax and navigator windows
HELP to access SPSSWIN Help information
MENUS AND TOOLBARS
Statistics PackageStatistics Packagefor the Social Science (SPSS)for the Social Science (SPSS)
Navigator (Output) Menus
When statistical procedures are run or charts are created the output will appear in the Navigator window The Navigator window contains many of the pull-down menus found in the Data Editor window Some of the important menus in the Navigator window include
INSERT used to insert page breaks titles charts etc
FORMAT for changing the alignment of a particular portion of the output
MENUS AND TOOLBARS
Statistics PackageStatistics Packagefor the Social Science (SPSS)for the Social Science (SPSS)
bull Formatting Toolbar
When a table has been created by a statistical procedure the user can edit the table to create a desired look or adddelete information Beginning with version 140 the user has a choice of editing the table in the Output or opening it in a separate Pivot Table (DEFINE) window Various pulldown menus are activated when the user double clicks on the table These include
EDIT undo and redo a pivot select a table or table body (eg to change the font)
INSERT used to insert titles captions and footnotes
PIVOT used to perform a pivot of the row and column variables
FORMAT various modifications can be made to tables and cells
Statistics PackageStatistics Packagefor the Social Science (SPSS)for the Social Science (SPSS)
Importing tab-delimited dataIn SPSSWIN click on FILE OPEN DATA Look in the appropriate location for rArr rArrthe text file Then select ldquoTextrdquo from ldquoFiles of typerdquo Click on the file name and then click on ldquoOpenrdquo You will see the Text Import Wizard ndash step 1 of 6 dialog box
You will now have an SPSS data file containing the former tab-delimited data You simply need to add variable and value labels and define missing values
Exporting Data to Excelclick on FILE SAVE AS Click on the File Name for the file to be exported For rArrthe ldquoSave as Typerdquo select from the pull-down menu Excel (xls) You will notice the checkbox for ldquowrite variable names to spreadsheetrdquo Leave this checked as you will want the variable names to be in the first row of each column in the Excel spreadsheet Finally click on Save
Statistics PackageStatistics Packagefor the Social Science (SPSS)for the Social Science (SPSS)
bull Additional menusCHART EDITOR used to edit a graph
SYNTAX EDITOR used to edit the text in a syntax window
bull Show or hide a toolbar
Click on VIEW TOOLBARS 1048635to show it to hide itrArr rArr
bull Move a toolbar
Click on the toolbar (but not on one of the pushbuttons) and then drag the toolbar to its new location
bull Customize a toolbar
Click on VIEW TOOLBARS CUSTOMIZErArr rArr
Statistics PackageStatistics Packagefor the Social Science (SPSS)for the Social Science (SPSS)
Importing data from an EXCEL spreadsheetData from an Excel spreadsheet can be imported into SPSSWIN as follows1 In SPSSWIN click on FILE OPEN DATA The OPEN DATA FILE Dialog rArr rArrBox will appear2 Locate the file of interest Use the Look In pull-down list to identify the folder containing the Excel file of interest3 From the FILE TYPE pull down menu select EXCEL (xls)
4 Click on the file name of interest and click on OPEN or simply double-click on the file name
5 Keep the box checked that reads Read variable names from the first row of data This presumes that the first row of the Excel data file contains variable names in the first row [If the data resided in a different worksheet in the Excel file this would need to be entered]
6 Click on OK The Excel data file will now appear in the SPSSWIN Data Editor
Statistics PackageStatistics Packagefor the Social Science (SPSS)for the Social Science (SPSS)
Importing data from an EXCEL spreadsheet
7 The former EXCEL spreadsheet can now be saved as an SPSS file (FILE rArrSAVE AS) and is ready to be used in analyses Typically you would label variable and values and define missing values
Importing an Access tableSPSSWIN does not offer a direct import for Access tables Therefore we must follow these steps1 Open the Access file2 Open the data table3 Save the data as an Excel file4 Follow the steps outlined in the data import from Excel Spreadsheet to SPSSWIN
Importing Text Files into SPSSWINText data points typically are separated (or ldquodelimitedrdquo) by tabs or commas Sometimes they can be of fixed format
Statistics PackageStatistics Packagefor the Social Science (SPSS)for the Social Science (SPSS)
Running the FREQUENCIES procedure
1 Open the data file (from the menus click on FILE OPEN DATA) of rArr rArrinterest
2 From the menus click on ANALYZE DESCRIPTIVE STATISTICS rArr rArrFREQUENCIES
3 The FREQUENCIES Dialog Box will appear In the left-hand box will be a listing (source variable list) of all the variables that have been defined in the data file The first step is identifying the variable(s) for which you want to run a frequency analysis Click on a variable name(s) Then click the [ gt ] pushbutton The variable name(s) will now appear in the VARIABLE[S] box (selected variable list) Repeat these steps for each variable of interest
4 If all that is being requested is a frequency table showing count percentages (raw adjusted and cumulative) then click on OK
Statistics PackageStatistics Packagefor the Social Science (SPSS)for the Social Science (SPSS)
Requesting STATISTICSDescriptive and summary STATISTICS can be requested for numeric variables To request Statistics1 From the FREQUENCIES Dialog Box click on the STATISTICS pushbutton2 This will bring up the FREQUENCIES STATISTICS Dialog Box3 The STATISTICS Dialog Box offers the user a variety of choices
DESCRIPTIVES
The DESCRIPTIVES procedure can be used to generate descriptive statistics (click on ANALYZE DESCRIPTIVE STATISTICS DESCRIPTIVES) The rArr rArrprocedure offers many of the same statistics as the FREQUENCIES procedure but without generating frequency analysis tables
Statistics PackageStatistics Packagefor the Social Science (SPSS)for the Social Science (SPSS)
Requesting CHARTSOne can request a chart (graph) to be created for a variable or variables included in a FREQUENCIES procedure
1 In the FREQUENCIES Dialog box click on CHARTS2 The FREQUENCIES CHARTS Dialog box will appear Choose the intended chart (eg Bar diagram Pie chart histogram
Pasting charts into Word1 Click on the chart2 Click on the pulldown menu EDIT COPY OBJECTSrArr3 Go to the Word document in which the chart is to be embedded Click on EDIT rArr PASTE SPECIAL4 Select Formatted Text (RTF) and then click on OK5 Enlarge the graph to a desired size by dragging one or more of the black squares along the perimeter (if the black squares are not visible click once on the graph)
Statistics PackageStatistics Packagefor the Social Science (SPSS)for the Social Science (SPSS)
BASIC STATISTICAL PROCEDURES CROSSTABS
1 From the ANALYZE pull-down menu click on DESCRIPTIVE STATISTICS rArrCROSSTABS
2 The CROSSTABS Dialog Box will then open
3 From the variable selection box on the left click on a variable you wish to designate as the Row variable The values (codes) for the Row variable make up the rows of the crosstabs table Click on the arrow (gt) button for Row(s) Next click on a different variable you wish to designate as the Column variable The values (codes) for the Column variable make up the columns of the crosstabstable Click on the arrow (gt) button for Column(s)
4 You can specify more than one variable in the Row(s) andor Column(s) A cross table will be generated for each combination of Row and Column variables
Limitations SPSS users have less control over data manipulation and statistical output than other statistical packages such as SAS Stata etc
SPSS is a good first statistical package to perform quantitative research in social science because it is easy to use and because it can be a good starting point to learn more advanced statistical packages
Statistics PackageStatistics Packagefor the Social Science (SPSS)for the Social Science (SPSS)
QuestionsQuestions

Randomized control designRandomized control design
Blindness Reduces the bias due to the preconception or
personal bias ndash Open trial Investigator and subject know the full details of the
treatment
ndash Single-blind trial Investigator knows about the treatment but
subject does not
ndash Double-blind Both investigator and subject do not know about the
treatment
ndash Triple-blind Sponsor investigator and subject do not know about
the treatment
Distribution of a variableDistribution of a variable
Distribution - (of a variable) tells us what values the
variable takes and how often it takes these values Eg
distribution of some 26 pediatric patients of ages 1 to 6
at AIDHC are as follows-
Age 1 2 3 4 5 6
Frequency 5 3 7 5 4 2
StatisticsStatistics
Science of data collection summarization analysis
and interpretation
Descriptive versus Inferential Statistics
ndash Descriptive Statistic Data description
(summarization) such as center variability and
shape
ndash Inferential Statistic Drawing conclusion beyond the
sample studied allowing for prediction
A Taxonomy ofA Taxonomy of StatisticsStatistics
How does statistics help usHow does statistics help us
Age Distribution
0
2
4
6
8
10
12
14
16
40 60 80 100 120 140 More
Age in Month
Nu
mb
er o
f S
ub
ject
s
Ages (in month) of the 60 patients in our data set 1 are- 71 127 65 82 140 53 114 56 84 65 67 134 64 hellip 91 51
Mean 9041666667
Standard Error 3902649518
Median 84
Mode 84
Standard Deviation 3022979318
Sample Variance 9138403955
Kurtosis -1183899591
Skewness 0389872725
Range 95
Minimum 48
Maximum 143
Sum 5425
Count 60
By simply looking at the data we fail to produce any informative account to describe the data how ever statistics produce a quick insight in to data using graphical and numerical statistical tools
60
80
10
01
20
14
0
Distribution of age
Ag
e (
mo
nth
)
Statistical Description of DataStatistical Description of Data
Statistics describes a numeric set of data by its
Center (mean median mode etc)
Variability (standard deviation range etc)
Shape (skewness kurtosis etc)
Statistics describes a categorical set of data by
Frequency percentage or proportion of each
category
Statistical inference is the process by which we acquire information about populations from samples
Two types of estimates for making inferencesndash Point estimationndash Interval estimate
Statistical Inference
Statistical Inference
Sample Population
Population and samplePopulation and sample
Population The entire collection of individuals or measurements about which information is desired
Sample A subset of the population selected for study
ndash Primary objective is to create a subset of population whose center spread and shape are as close as that of population
ndash Methods of sampling Random sampling stratified sampling systematic sampling cluster sampling multistage sampling area sampling qoata sampling etc
Parameter vs StatisticsParameter vs Statistics
Parameter
ndash Any statistical characteristic of a population
ndash Population mean population median population
standard deviation are examples of parameters
ndash Parameter describes the distribution of a population
ndash Parameters are fixed and usually unknown
Parameter vs StatisticsParameter vs Statistics
Statistic Any statistical characteristic of a sample
ndash Sample mean sample median sample standard
deviation are some examples of statistics
ndash Statistic describes the distribution of population
ndash Value of a statistic is known and is varies for different
samples
ndash Are used for making inference on parameter
Parameter vs StatisticsParameter vs Statistics
Statistical Issue To describe the distribution of a
population through census or making inference on
population distribution population parameter using sample
distribution statistic
Eg sample mean is an estimate of the population mean
Hypothesis TestingHypothesis Testing
Null hypothesis and Alternative hypothesis
Real Situation Ho is true Ho is false Reject Ho Type I
error (α) Correct Decision (1-)
D e c i s i o n
Accept Ho Correct Decision (1- α)
Type II Error ()
ElementsSteps in hypothesisElementsSteps in hypothesis
Hypothesis testing steps
ndash 1 Null (Ho) and alternative (H1)hypothesis specification
ndash 2 Selection of significance level (alpha) - 005 or 001
ndash 3 Calculating the test statistic ndasheg t F Chi-square
ndash 4 Calculating the probability value (p-value) or confidence
Interval
ndash 5 Describing the result and statistic in an understandable
way
Point estimator
Sample distribution
Parameter
Population distribution
bull A point estimate draws inference about a population by estimating the value of an unknown parameter using a single value or a point
Point Estimation
Interval estimatorSample distribution
bull An interval estimator draws inferences about a population by
estimating the value of an unknown parameter using an interval
Population distribution Parameter
Interval Estimation
P-Value versus the Confidence IntervalP-Value versus the Confidence Interval
Two main ways to assess study precision and the role of
chance in a study
ndash P value measures ( in probability) the evidence against
the null hypothesis
ndash An interval within which the value of the parameter lies
with a specified probability
ndash Eg 95 CI implies that if one repeats a study 100
times the true measure of association will lie inside the
CI in 95 out of 100 measures
Procedures for sample size Procedures for sample size calculationcalculation
Selection of primary variables of interest and formulation
of hypotheses
Information of standard deviation ( if numeric) or
proportion (if categorical)
A tolerance level of significance ()
Selection of reasonable test statistic
Power or Confidence level
A scientifically or clinically meaning effect difference
Brief concept of Statistical SoftwareBrief concept of Statistical Software
There are many software packages to perform statistical
analysis and visualization of data Some of them are-
ndash System for Statistical Analysis (SAS) S-plus R Matlab Minitab
BMDP STATA SPSS StatXact Statistica LISREL JMP
GLIM HIL MS Excel etc We will discuss MS Excel and SPSS in
brief
useful websites-
httpwwwR-projectorg (a free but powerful statistical software)
Microsoft ExcelMicrosoft Excel
A Spreadsheet Application It features calculation graphing tools pivot tables and a macro programming language called VBA (Visual Basic for Applications)
There are many versions of MS-Excel Excel XP Excel 2003 Excel 2007 are capable of performing a number of statistical analyses
Starting MS Excel Double click on the Microsoft Excel icon on the desktop or Click on Start --gt Programs --gt Microsoft Excel
Worksheet Consists of a multiple grid of cells with numbered rows down the page and alphabetically-tilted columns across the page Each cell is referenced by its coordinates For example A3 is used to refer to the cell in column A and row 3 B10B20 is used to refer to the range of cells in column B and rows 10 through 20
Microsoft ExcelMicrosoft Excel
Creating Formulas 1 Click the cell that you want to enter the formula 2 Type = (an equal sign) 3 Click the Function Button 4 Select the formula you want and step through the on-screen instructions
xf
Opening a document File Open (From a existing workbook) Change the directory area or drive to look for file in other locations
Creating a new workbook FileNewBlank Document
Saving a File FileSave
Selecting more than one cell Click on a cell eg A1) then hold the Shift key and click on another (eg D4) to select cells between and A1 and D4 or Click on a cell and drag the mouse across the desired range
Microsoft ExcelMicrosoft Excel
Entering Date and Time Dates are stored as MMDDYYYY No need to enter in that format For example Excel will recognize Jan 9 or jan-9 as 192007 and Jan 9 1999 as 191999 To enter todayrsquos date press Ctrl and together Use a or p to indicate am or pm For example 830 p is interpreted as 830 pm To enter current time press Ctrl and together
Copy and Paste all cells in a Sheet Ctrl+A for selecting Ctrl +C for copying and Ctrl+V for Pasting
Sorting Data Sort Sort By hellip
Descriptive Statistics and other Statistical methods ToolsData Analysis Statistical method If Data Analysis is not available then click on Tools Add-Ins and then select Analysis ToolPack and Analysis toolPack-Vba
Microsoft ExcelMicrosoft Excel
Statistical and Mathematical Function Start with lsquo=lsquo sign and then select function from function wizard xf
Inserting a Chart Click on Chart Wizard (or InsertChart) select chart give Input data range Update the Chart options and Select output range Worksheet
Importing Data in Excel File open FileType Click on File Choose Option ( DelimitedFixed Width) Choose Options (Tab Semicolon Comma Space Other) Finish
Limitations Excel uses algorithms that are vulnerable to rounding and truncation errors and may produce inaccurate results in extremecases
Statistics PackageStatistics Packagefor the Social Science (SPSS)for the Social Science (SPSS)
A general purpose statistical package SPSS is widely used in the social sciences particularly in sociology and psychology
SPSS can import data from almost any type of file to generate tabulated reports plots of distributions and trends descriptive statistics and complex statistical analyzes
Starting SPSS Double Click on SPSS on desktop or ProgramSPSS
Opening a SPSS file FileOpen
bull Data Editor
Various pull-down menus appear at the top of the Data Editor window These pull-down menus are at the heart of using SPSSWIN The Data Editor menu items (with some of the uses of the menu) are
MENUS AND TOOLBARS
Statistics PackageStatistics Packagefor the Social Science (SPSS)for the Social Science (SPSS)
FILE used to open and save data files
EDIT used to copy and paste data values used to find data in a file insert variables and cases OPTIONS allows the user to set general preferences as well as the setup for the Navigator Charts etc
VIEW user can change toolbars value labels can be seen in cells instead of data values
DATA select sort or weight cases merge files
MENUS AND TOOLBARS
TRANSFORM Compute new variables recode variables etc
Statistics PackageStatistics Packagefor the Social Science (SPSS)for the Social Science (SPSS)
ANALYZE perform various statistical procedures
GRAPHS create bar and pie charts etc
UTILITIES add comments to accompany data file (and other advanced features)
ADD-ons these are features not currently installed (advanced statistical procedures)
WINDOW switch between data syntax and navigator windows
HELP to access SPSSWIN Help information
MENUS AND TOOLBARS
Statistics PackageStatistics Packagefor the Social Science (SPSS)for the Social Science (SPSS)
Navigator (Output) Menus
When statistical procedures are run or charts are created the output will appear in the Navigator window The Navigator window contains many of the pull-down menus found in the Data Editor window Some of the important menus in the Navigator window include
INSERT used to insert page breaks titles charts etc
FORMAT for changing the alignment of a particular portion of the output
MENUS AND TOOLBARS
Statistics PackageStatistics Packagefor the Social Science (SPSS)for the Social Science (SPSS)
bull Formatting Toolbar
When a table has been created by a statistical procedure the user can edit the table to create a desired look or adddelete information Beginning with version 140 the user has a choice of editing the table in the Output or opening it in a separate Pivot Table (DEFINE) window Various pulldown menus are activated when the user double clicks on the table These include
EDIT undo and redo a pivot select a table or table body (eg to change the font)
INSERT used to insert titles captions and footnotes
PIVOT used to perform a pivot of the row and column variables
FORMAT various modifications can be made to tables and cells
Statistics PackageStatistics Packagefor the Social Science (SPSS)for the Social Science (SPSS)
Importing tab-delimited dataIn SPSSWIN click on FILE OPEN DATA Look in the appropriate location for rArr rArrthe text file Then select ldquoTextrdquo from ldquoFiles of typerdquo Click on the file name and then click on ldquoOpenrdquo You will see the Text Import Wizard ndash step 1 of 6 dialog box
You will now have an SPSS data file containing the former tab-delimited data You simply need to add variable and value labels and define missing values
Exporting Data to Excelclick on FILE SAVE AS Click on the File Name for the file to be exported For rArrthe ldquoSave as Typerdquo select from the pull-down menu Excel (xls) You will notice the checkbox for ldquowrite variable names to spreadsheetrdquo Leave this checked as you will want the variable names to be in the first row of each column in the Excel spreadsheet Finally click on Save
Statistics PackageStatistics Packagefor the Social Science (SPSS)for the Social Science (SPSS)
bull Additional menusCHART EDITOR used to edit a graph
SYNTAX EDITOR used to edit the text in a syntax window
bull Show or hide a toolbar
Click on VIEW TOOLBARS 1048635to show it to hide itrArr rArr
bull Move a toolbar
Click on the toolbar (but not on one of the pushbuttons) and then drag the toolbar to its new location
bull Customize a toolbar
Click on VIEW TOOLBARS CUSTOMIZErArr rArr
Statistics PackageStatistics Packagefor the Social Science (SPSS)for the Social Science (SPSS)
Importing data from an EXCEL spreadsheetData from an Excel spreadsheet can be imported into SPSSWIN as follows1 In SPSSWIN click on FILE OPEN DATA The OPEN DATA FILE Dialog rArr rArrBox will appear2 Locate the file of interest Use the Look In pull-down list to identify the folder containing the Excel file of interest3 From the FILE TYPE pull down menu select EXCEL (xls)
4 Click on the file name of interest and click on OPEN or simply double-click on the file name
5 Keep the box checked that reads Read variable names from the first row of data This presumes that the first row of the Excel data file contains variable names in the first row [If the data resided in a different worksheet in the Excel file this would need to be entered]
6 Click on OK The Excel data file will now appear in the SPSSWIN Data Editor
Statistics PackageStatistics Packagefor the Social Science (SPSS)for the Social Science (SPSS)
Importing data from an EXCEL spreadsheet
7 The former EXCEL spreadsheet can now be saved as an SPSS file (FILE rArrSAVE AS) and is ready to be used in analyses Typically you would label variable and values and define missing values
Importing an Access tableSPSSWIN does not offer a direct import for Access tables Therefore we must follow these steps1 Open the Access file2 Open the data table3 Save the data as an Excel file4 Follow the steps outlined in the data import from Excel Spreadsheet to SPSSWIN
Importing Text Files into SPSSWINText data points typically are separated (or ldquodelimitedrdquo) by tabs or commas Sometimes they can be of fixed format
Statistics PackageStatistics Packagefor the Social Science (SPSS)for the Social Science (SPSS)
Running the FREQUENCIES procedure
1 Open the data file (from the menus click on FILE OPEN DATA) of rArr rArrinterest
2 From the menus click on ANALYZE DESCRIPTIVE STATISTICS rArr rArrFREQUENCIES
3 The FREQUENCIES Dialog Box will appear In the left-hand box will be a listing (source variable list) of all the variables that have been defined in the data file The first step is identifying the variable(s) for which you want to run a frequency analysis Click on a variable name(s) Then click the [ gt ] pushbutton The variable name(s) will now appear in the VARIABLE[S] box (selected variable list) Repeat these steps for each variable of interest
4 If all that is being requested is a frequency table showing count percentages (raw adjusted and cumulative) then click on OK
Statistics PackageStatistics Packagefor the Social Science (SPSS)for the Social Science (SPSS)
Requesting STATISTICSDescriptive and summary STATISTICS can be requested for numeric variables To request Statistics1 From the FREQUENCIES Dialog Box click on the STATISTICS pushbutton2 This will bring up the FREQUENCIES STATISTICS Dialog Box3 The STATISTICS Dialog Box offers the user a variety of choices
DESCRIPTIVES
The DESCRIPTIVES procedure can be used to generate descriptive statistics (click on ANALYZE DESCRIPTIVE STATISTICS DESCRIPTIVES) The rArr rArrprocedure offers many of the same statistics as the FREQUENCIES procedure but without generating frequency analysis tables
Statistics PackageStatistics Packagefor the Social Science (SPSS)for the Social Science (SPSS)
Requesting CHARTSOne can request a chart (graph) to be created for a variable or variables included in a FREQUENCIES procedure
1 In the FREQUENCIES Dialog box click on CHARTS2 The FREQUENCIES CHARTS Dialog box will appear Choose the intended chart (eg Bar diagram Pie chart histogram
Pasting charts into Word1 Click on the chart2 Click on the pulldown menu EDIT COPY OBJECTSrArr3 Go to the Word document in which the chart is to be embedded Click on EDIT rArr PASTE SPECIAL4 Select Formatted Text (RTF) and then click on OK5 Enlarge the graph to a desired size by dragging one or more of the black squares along the perimeter (if the black squares are not visible click once on the graph)
Statistics PackageStatistics Packagefor the Social Science (SPSS)for the Social Science (SPSS)
BASIC STATISTICAL PROCEDURES CROSSTABS
1 From the ANALYZE pull-down menu click on DESCRIPTIVE STATISTICS rArrCROSSTABS
2 The CROSSTABS Dialog Box will then open
3 From the variable selection box on the left click on a variable you wish to designate as the Row variable The values (codes) for the Row variable make up the rows of the crosstabs table Click on the arrow (gt) button for Row(s) Next click on a different variable you wish to designate as the Column variable The values (codes) for the Column variable make up the columns of the crosstabstable Click on the arrow (gt) button for Column(s)
4 You can specify more than one variable in the Row(s) andor Column(s) A cross table will be generated for each combination of Row and Column variables
Limitations SPSS users have less control over data manipulation and statistical output than other statistical packages such as SAS Stata etc
SPSS is a good first statistical package to perform quantitative research in social science because it is easy to use and because it can be a good starting point to learn more advanced statistical packages
Statistics PackageStatistics Packagefor the Social Science (SPSS)for the Social Science (SPSS)
QuestionsQuestions

Parameter vs StatisticsParameter vs Statistics
Parameter
ndash Any statistical characteristic of a population
ndash Population mean population median population
standard deviation are examples of parameters
ndash Parameter describes the distribution of a population
ndash Parameters are fixed and usually unknown
Parameter vs StatisticsParameter vs Statistics
Statistic Any statistical characteristic of a sample
ndash Sample mean sample median sample standard
deviation are some examples of statistics
ndash Statistic describes the distribution of population
ndash Value of a statistic is known and is varies for different
samples
ndash Are used for making inference on parameter
Parameter vs StatisticsParameter vs Statistics
Statistical Issue To describe the distribution of a
population through census or making inference on
population distribution population parameter using sample
distribution statistic
Eg sample mean is an estimate of the population mean
Hypothesis TestingHypothesis Testing
Null hypothesis and Alternative hypothesis
Real Situation Ho is true Ho is false Reject Ho Type I
error (α) Correct Decision (1-)
D e c i s i o n
Accept Ho Correct Decision (1- α)
Type II Error ()
ElementsSteps in hypothesisElementsSteps in hypothesis
Hypothesis testing steps
ndash 1 Null (Ho) and alternative (H1)hypothesis specification
ndash 2 Selection of significance level (alpha) - 005 or 001
ndash 3 Calculating the test statistic ndasheg t F Chi-square
ndash 4 Calculating the probability value (p-value) or confidence
Interval
ndash 5 Describing the result and statistic in an understandable
way
Point estimator
Sample distribution
Parameter
Population distribution
bull A point estimate draws inference about a population by estimating the value of an unknown parameter using a single value or a point
Point Estimation
Interval estimatorSample distribution
bull An interval estimator draws inferences about a population by
estimating the value of an unknown parameter using an interval
Population distribution Parameter
Interval Estimation
P-Value versus the Confidence IntervalP-Value versus the Confidence Interval
Two main ways to assess study precision and the role of
chance in a study
ndash P value measures ( in probability) the evidence against
the null hypothesis
ndash An interval within which the value of the parameter lies
with a specified probability
ndash Eg 95 CI implies that if one repeats a study 100
times the true measure of association will lie inside the
CI in 95 out of 100 measures
Procedures for sample size Procedures for sample size calculationcalculation
Selection of primary variables of interest and formulation
of hypotheses
Information of standard deviation ( if numeric) or
proportion (if categorical)
A tolerance level of significance ()
Selection of reasonable test statistic
Power or Confidence level
A scientifically or clinically meaning effect difference
Brief concept of Statistical SoftwareBrief concept of Statistical Software
There are many software packages to perform statistical
analysis and visualization of data Some of them are-
ndash System for Statistical Analysis (SAS) S-plus R Matlab Minitab
BMDP STATA SPSS StatXact Statistica LISREL JMP
GLIM HIL MS Excel etc We will discuss MS Excel and SPSS in
brief
useful websites-
httpwwwR-projectorg (a free but powerful statistical software)
Microsoft ExcelMicrosoft Excel
A Spreadsheet Application It features calculation graphing tools pivot tables and a macro programming language called VBA (Visual Basic for Applications)
There are many versions of MS-Excel Excel XP Excel 2003 Excel 2007 are capable of performing a number of statistical analyses
Starting MS Excel Double click on the Microsoft Excel icon on the desktop or Click on Start --gt Programs --gt Microsoft Excel
Worksheet Consists of a multiple grid of cells with numbered rows down the page and alphabetically-tilted columns across the page Each cell is referenced by its coordinates For example A3 is used to refer to the cell in column A and row 3 B10B20 is used to refer to the range of cells in column B and rows 10 through 20
Microsoft ExcelMicrosoft Excel
Creating Formulas 1 Click the cell that you want to enter the formula 2 Type = (an equal sign) 3 Click the Function Button 4 Select the formula you want and step through the on-screen instructions
xf
Opening a document File Open (From a existing workbook) Change the directory area or drive to look for file in other locations
Creating a new workbook FileNewBlank Document
Saving a File FileSave
Selecting more than one cell Click on a cell eg A1) then hold the Shift key and click on another (eg D4) to select cells between and A1 and D4 or Click on a cell and drag the mouse across the desired range
Microsoft ExcelMicrosoft Excel
Entering Date and Time Dates are stored as MMDDYYYY No need to enter in that format For example Excel will recognize Jan 9 or jan-9 as 192007 and Jan 9 1999 as 191999 To enter todayrsquos date press Ctrl and together Use a or p to indicate am or pm For example 830 p is interpreted as 830 pm To enter current time press Ctrl and together
Copy and Paste all cells in a Sheet Ctrl+A for selecting Ctrl +C for copying and Ctrl+V for Pasting
Sorting Data Sort Sort By hellip
Descriptive Statistics and other Statistical methods ToolsData Analysis Statistical method If Data Analysis is not available then click on Tools Add-Ins and then select Analysis ToolPack and Analysis toolPack-Vba
Microsoft ExcelMicrosoft Excel
Statistical and Mathematical Function Start with lsquo=lsquo sign and then select function from function wizard xf
Inserting a Chart Click on Chart Wizard (or InsertChart) select chart give Input data range Update the Chart options and Select output range Worksheet
Importing Data in Excel File open FileType Click on File Choose Option ( DelimitedFixed Width) Choose Options (Tab Semicolon Comma Space Other) Finish
Limitations Excel uses algorithms that are vulnerable to rounding and truncation errors and may produce inaccurate results in extremecases
Statistics PackageStatistics Packagefor the Social Science (SPSS)for the Social Science (SPSS)
A general purpose statistical package SPSS is widely used in the social sciences particularly in sociology and psychology
SPSS can import data from almost any type of file to generate tabulated reports plots of distributions and trends descriptive statistics and complex statistical analyzes
Starting SPSS Double Click on SPSS on desktop or ProgramSPSS
Opening a SPSS file FileOpen
bull Data Editor
Various pull-down menus appear at the top of the Data Editor window These pull-down menus are at the heart of using SPSSWIN The Data Editor menu items (with some of the uses of the menu) are
MENUS AND TOOLBARS
Statistics PackageStatistics Packagefor the Social Science (SPSS)for the Social Science (SPSS)
FILE used to open and save data files
EDIT used to copy and paste data values used to find data in a file insert variables and cases OPTIONS allows the user to set general preferences as well as the setup for the Navigator Charts etc
VIEW user can change toolbars value labels can be seen in cells instead of data values
DATA select sort or weight cases merge files
MENUS AND TOOLBARS
TRANSFORM Compute new variables recode variables etc
Statistics PackageStatistics Packagefor the Social Science (SPSS)for the Social Science (SPSS)
ANALYZE perform various statistical procedures
GRAPHS create bar and pie charts etc
UTILITIES add comments to accompany data file (and other advanced features)
ADD-ons these are features not currently installed (advanced statistical procedures)
WINDOW switch between data syntax and navigator windows
HELP to access SPSSWIN Help information
MENUS AND TOOLBARS
Statistics PackageStatistics Packagefor the Social Science (SPSS)for the Social Science (SPSS)
Navigator (Output) Menus
When statistical procedures are run or charts are created the output will appear in the Navigator window The Navigator window contains many of the pull-down menus found in the Data Editor window Some of the important menus in the Navigator window include
INSERT used to insert page breaks titles charts etc
FORMAT for changing the alignment of a particular portion of the output
MENUS AND TOOLBARS
Statistics PackageStatistics Packagefor the Social Science (SPSS)for the Social Science (SPSS)
bull Formatting Toolbar
When a table has been created by a statistical procedure the user can edit the table to create a desired look or adddelete information Beginning with version 140 the user has a choice of editing the table in the Output or opening it in a separate Pivot Table (DEFINE) window Various pulldown menus are activated when the user double clicks on the table These include
EDIT undo and redo a pivot select a table or table body (eg to change the font)
INSERT used to insert titles captions and footnotes
PIVOT used to perform a pivot of the row and column variables
FORMAT various modifications can be made to tables and cells
Statistics PackageStatistics Packagefor the Social Science (SPSS)for the Social Science (SPSS)
Importing tab-delimited dataIn SPSSWIN click on FILE OPEN DATA Look in the appropriate location for rArr rArrthe text file Then select ldquoTextrdquo from ldquoFiles of typerdquo Click on the file name and then click on ldquoOpenrdquo You will see the Text Import Wizard ndash step 1 of 6 dialog box
You will now have an SPSS data file containing the former tab-delimited data You simply need to add variable and value labels and define missing values
Exporting Data to Excelclick on FILE SAVE AS Click on the File Name for the file to be exported For rArrthe ldquoSave as Typerdquo select from the pull-down menu Excel (xls) You will notice the checkbox for ldquowrite variable names to spreadsheetrdquo Leave this checked as you will want the variable names to be in the first row of each column in the Excel spreadsheet Finally click on Save
Statistics PackageStatistics Packagefor the Social Science (SPSS)for the Social Science (SPSS)
bull Additional menusCHART EDITOR used to edit a graph
SYNTAX EDITOR used to edit the text in a syntax window
bull Show or hide a toolbar
Click on VIEW TOOLBARS 1048635to show it to hide itrArr rArr
bull Move a toolbar
Click on the toolbar (but not on one of the pushbuttons) and then drag the toolbar to its new location
bull Customize a toolbar
Click on VIEW TOOLBARS CUSTOMIZErArr rArr
Statistics PackageStatistics Packagefor the Social Science (SPSS)for the Social Science (SPSS)
Importing data from an EXCEL spreadsheetData from an Excel spreadsheet can be imported into SPSSWIN as follows1 In SPSSWIN click on FILE OPEN DATA The OPEN DATA FILE Dialog rArr rArrBox will appear2 Locate the file of interest Use the Look In pull-down list to identify the folder containing the Excel file of interest3 From the FILE TYPE pull down menu select EXCEL (xls)
4 Click on the file name of interest and click on OPEN or simply double-click on the file name
5 Keep the box checked that reads Read variable names from the first row of data This presumes that the first row of the Excel data file contains variable names in the first row [If the data resided in a different worksheet in the Excel file this would need to be entered]
6 Click on OK The Excel data file will now appear in the SPSSWIN Data Editor
Statistics PackageStatistics Packagefor the Social Science (SPSS)for the Social Science (SPSS)
Importing data from an EXCEL spreadsheet
7 The former EXCEL spreadsheet can now be saved as an SPSS file (FILE rArrSAVE AS) and is ready to be used in analyses Typically you would label variable and values and define missing values
Importing an Access tableSPSSWIN does not offer a direct import for Access tables Therefore we must follow these steps1 Open the Access file2 Open the data table3 Save the data as an Excel file4 Follow the steps outlined in the data import from Excel Spreadsheet to SPSSWIN
Importing Text Files into SPSSWINText data points typically are separated (or ldquodelimitedrdquo) by tabs or commas Sometimes they can be of fixed format
Statistics PackageStatistics Packagefor the Social Science (SPSS)for the Social Science (SPSS)
Running the FREQUENCIES procedure
1 Open the data file (from the menus click on FILE OPEN DATA) of rArr rArrinterest
2 From the menus click on ANALYZE DESCRIPTIVE STATISTICS rArr rArrFREQUENCIES
3 The FREQUENCIES Dialog Box will appear In the left-hand box will be a listing (source variable list) of all the variables that have been defined in the data file The first step is identifying the variable(s) for which you want to run a frequency analysis Click on a variable name(s) Then click the [ gt ] pushbutton The variable name(s) will now appear in the VARIABLE[S] box (selected variable list) Repeat these steps for each variable of interest
4 If all that is being requested is a frequency table showing count percentages (raw adjusted and cumulative) then click on OK
Statistics PackageStatistics Packagefor the Social Science (SPSS)for the Social Science (SPSS)
Requesting STATISTICSDescriptive and summary STATISTICS can be requested for numeric variables To request Statistics1 From the FREQUENCIES Dialog Box click on the STATISTICS pushbutton2 This will bring up the FREQUENCIES STATISTICS Dialog Box3 The STATISTICS Dialog Box offers the user a variety of choices
DESCRIPTIVES
The DESCRIPTIVES procedure can be used to generate descriptive statistics (click on ANALYZE DESCRIPTIVE STATISTICS DESCRIPTIVES) The rArr rArrprocedure offers many of the same statistics as the FREQUENCIES procedure but without generating frequency analysis tables
Statistics PackageStatistics Packagefor the Social Science (SPSS)for the Social Science (SPSS)
Requesting CHARTSOne can request a chart (graph) to be created for a variable or variables included in a FREQUENCIES procedure
1 In the FREQUENCIES Dialog box click on CHARTS2 The FREQUENCIES CHARTS Dialog box will appear Choose the intended chart (eg Bar diagram Pie chart histogram
Pasting charts into Word1 Click on the chart2 Click on the pulldown menu EDIT COPY OBJECTSrArr3 Go to the Word document in which the chart is to be embedded Click on EDIT rArr PASTE SPECIAL4 Select Formatted Text (RTF) and then click on OK5 Enlarge the graph to a desired size by dragging one or more of the black squares along the perimeter (if the black squares are not visible click once on the graph)
Statistics PackageStatistics Packagefor the Social Science (SPSS)for the Social Science (SPSS)
BASIC STATISTICAL PROCEDURES CROSSTABS
1 From the ANALYZE pull-down menu click on DESCRIPTIVE STATISTICS rArrCROSSTABS
2 The CROSSTABS Dialog Box will then open
3 From the variable selection box on the left click on a variable you wish to designate as the Row variable The values (codes) for the Row variable make up the rows of the crosstabs table Click on the arrow (gt) button for Row(s) Next click on a different variable you wish to designate as the Column variable The values (codes) for the Column variable make up the columns of the crosstabstable Click on the arrow (gt) button for Column(s)
4 You can specify more than one variable in the Row(s) andor Column(s) A cross table will be generated for each combination of Row and Column variables
Limitations SPSS users have less control over data manipulation and statistical output than other statistical packages such as SAS Stata etc
SPSS is a good first statistical package to perform quantitative research in social science because it is easy to use and because it can be a good starting point to learn more advanced statistical packages
Statistics PackageStatistics Packagefor the Social Science (SPSS)for the Social Science (SPSS)
QuestionsQuestions

Parameter vs StatisticsParameter vs Statistics
Statistical Issue To describe the distribution of a
population through census or making inference on
population distribution population parameter using sample
distribution statistic
Eg sample mean is an estimate of the population mean
Hypothesis TestingHypothesis Testing
Null hypothesis and Alternative hypothesis
Real Situation Ho is true Ho is false Reject Ho Type I
error (α) Correct Decision (1-)
D e c i s i o n
Accept Ho Correct Decision (1- α)
Type II Error ()
ElementsSteps in hypothesisElementsSteps in hypothesis
Hypothesis testing steps
ndash 1 Null (Ho) and alternative (H1)hypothesis specification
ndash 2 Selection of significance level (alpha) - 005 or 001
ndash 3 Calculating the test statistic ndasheg t F Chi-square
ndash 4 Calculating the probability value (p-value) or confidence
Interval
ndash 5 Describing the result and statistic in an understandable
way
Point estimator
Sample distribution
Parameter
Population distribution
bull A point estimate draws inference about a population by estimating the value of an unknown parameter using a single value or a point
Point Estimation
Interval estimatorSample distribution
bull An interval estimator draws inferences about a population by
estimating the value of an unknown parameter using an interval
Population distribution Parameter
Interval Estimation
P-Value versus the Confidence IntervalP-Value versus the Confidence Interval
Two main ways to assess study precision and the role of
chance in a study
ndash P value measures ( in probability) the evidence against
the null hypothesis
ndash An interval within which the value of the parameter lies
with a specified probability
ndash Eg 95 CI implies that if one repeats a study 100
times the true measure of association will lie inside the
CI in 95 out of 100 measures
Procedures for sample size Procedures for sample size calculationcalculation
Selection of primary variables of interest and formulation
of hypotheses
Information of standard deviation ( if numeric) or
proportion (if categorical)
A tolerance level of significance ()
Selection of reasonable test statistic
Power or Confidence level
A scientifically or clinically meaning effect difference
Brief concept of Statistical SoftwareBrief concept of Statistical Software
There are many software packages to perform statistical
analysis and visualization of data Some of them are-
ndash System for Statistical Analysis (SAS) S-plus R Matlab Minitab
BMDP STATA SPSS StatXact Statistica LISREL JMP
GLIM HIL MS Excel etc We will discuss MS Excel and SPSS in
brief
useful websites-
httpwwwR-projectorg (a free but powerful statistical software)
Microsoft ExcelMicrosoft Excel
A Spreadsheet Application It features calculation graphing tools pivot tables and a macro programming language called VBA (Visual Basic for Applications)
There are many versions of MS-Excel Excel XP Excel 2003 Excel 2007 are capable of performing a number of statistical analyses
Starting MS Excel Double click on the Microsoft Excel icon on the desktop or Click on Start --gt Programs --gt Microsoft Excel
Worksheet Consists of a multiple grid of cells with numbered rows down the page and alphabetically-tilted columns across the page Each cell is referenced by its coordinates For example A3 is used to refer to the cell in column A and row 3 B10B20 is used to refer to the range of cells in column B and rows 10 through 20
Microsoft ExcelMicrosoft Excel
Creating Formulas 1 Click the cell that you want to enter the formula 2 Type = (an equal sign) 3 Click the Function Button 4 Select the formula you want and step through the on-screen instructions
xf
Opening a document File Open (From a existing workbook) Change the directory area or drive to look for file in other locations
Creating a new workbook FileNewBlank Document
Saving a File FileSave
Selecting more than one cell Click on a cell eg A1) then hold the Shift key and click on another (eg D4) to select cells between and A1 and D4 or Click on a cell and drag the mouse across the desired range
Microsoft ExcelMicrosoft Excel
Entering Date and Time Dates are stored as MMDDYYYY No need to enter in that format For example Excel will recognize Jan 9 or jan-9 as 192007 and Jan 9 1999 as 191999 To enter todayrsquos date press Ctrl and together Use a or p to indicate am or pm For example 830 p is interpreted as 830 pm To enter current time press Ctrl and together
Copy and Paste all cells in a Sheet Ctrl+A for selecting Ctrl +C for copying and Ctrl+V for Pasting
Sorting Data Sort Sort By hellip
Descriptive Statistics and other Statistical methods ToolsData Analysis Statistical method If Data Analysis is not available then click on Tools Add-Ins and then select Analysis ToolPack and Analysis toolPack-Vba
Microsoft ExcelMicrosoft Excel
Statistical and Mathematical Function Start with lsquo=lsquo sign and then select function from function wizard xf
Inserting a Chart Click on Chart Wizard (or InsertChart) select chart give Input data range Update the Chart options and Select output range Worksheet
Importing Data in Excel File open FileType Click on File Choose Option ( DelimitedFixed Width) Choose Options (Tab Semicolon Comma Space Other) Finish
Limitations Excel uses algorithms that are vulnerable to rounding and truncation errors and may produce inaccurate results in extremecases
Statistics PackageStatistics Packagefor the Social Science (SPSS)for the Social Science (SPSS)
A general purpose statistical package SPSS is widely used in the social sciences particularly in sociology and psychology
SPSS can import data from almost any type of file to generate tabulated reports plots of distributions and trends descriptive statistics and complex statistical analyzes
Starting SPSS Double Click on SPSS on desktop or ProgramSPSS
Opening a SPSS file FileOpen
bull Data Editor
Various pull-down menus appear at the top of the Data Editor window These pull-down menus are at the heart of using SPSSWIN The Data Editor menu items (with some of the uses of the menu) are
MENUS AND TOOLBARS
Statistics PackageStatistics Packagefor the Social Science (SPSS)for the Social Science (SPSS)
FILE used to open and save data files
EDIT used to copy and paste data values used to find data in a file insert variables and cases OPTIONS allows the user to set general preferences as well as the setup for the Navigator Charts etc
VIEW user can change toolbars value labels can be seen in cells instead of data values
DATA select sort or weight cases merge files
MENUS AND TOOLBARS
TRANSFORM Compute new variables recode variables etc
Statistics PackageStatistics Packagefor the Social Science (SPSS)for the Social Science (SPSS)
ANALYZE perform various statistical procedures
GRAPHS create bar and pie charts etc
UTILITIES add comments to accompany data file (and other advanced features)
ADD-ons these are features not currently installed (advanced statistical procedures)
WINDOW switch between data syntax and navigator windows
HELP to access SPSSWIN Help information
MENUS AND TOOLBARS
Statistics PackageStatistics Packagefor the Social Science (SPSS)for the Social Science (SPSS)
Navigator (Output) Menus
When statistical procedures are run or charts are created the output will appear in the Navigator window The Navigator window contains many of the pull-down menus found in the Data Editor window Some of the important menus in the Navigator window include
INSERT used to insert page breaks titles charts etc
FORMAT for changing the alignment of a particular portion of the output
MENUS AND TOOLBARS
Statistics PackageStatistics Packagefor the Social Science (SPSS)for the Social Science (SPSS)
bull Formatting Toolbar
When a table has been created by a statistical procedure the user can edit the table to create a desired look or adddelete information Beginning with version 140 the user has a choice of editing the table in the Output or opening it in a separate Pivot Table (DEFINE) window Various pulldown menus are activated when the user double clicks on the table These include
EDIT undo and redo a pivot select a table or table body (eg to change the font)
INSERT used to insert titles captions and footnotes
PIVOT used to perform a pivot of the row and column variables
FORMAT various modifications can be made to tables and cells
Statistics PackageStatistics Packagefor the Social Science (SPSS)for the Social Science (SPSS)
Importing tab-delimited dataIn SPSSWIN click on FILE OPEN DATA Look in the appropriate location for rArr rArrthe text file Then select ldquoTextrdquo from ldquoFiles of typerdquo Click on the file name and then click on ldquoOpenrdquo You will see the Text Import Wizard ndash step 1 of 6 dialog box
You will now have an SPSS data file containing the former tab-delimited data You simply need to add variable and value labels and define missing values
Exporting Data to Excelclick on FILE SAVE AS Click on the File Name for the file to be exported For rArrthe ldquoSave as Typerdquo select from the pull-down menu Excel (xls) You will notice the checkbox for ldquowrite variable names to spreadsheetrdquo Leave this checked as you will want the variable names to be in the first row of each column in the Excel spreadsheet Finally click on Save
Statistics PackageStatistics Packagefor the Social Science (SPSS)for the Social Science (SPSS)
bull Additional menusCHART EDITOR used to edit a graph
SYNTAX EDITOR used to edit the text in a syntax window
bull Show or hide a toolbar
Click on VIEW TOOLBARS 1048635to show it to hide itrArr rArr
bull Move a toolbar
Click on the toolbar (but not on one of the pushbuttons) and then drag the toolbar to its new location
bull Customize a toolbar
Click on VIEW TOOLBARS CUSTOMIZErArr rArr
Statistics PackageStatistics Packagefor the Social Science (SPSS)for the Social Science (SPSS)
Importing data from an EXCEL spreadsheetData from an Excel spreadsheet can be imported into SPSSWIN as follows1 In SPSSWIN click on FILE OPEN DATA The OPEN DATA FILE Dialog rArr rArrBox will appear2 Locate the file of interest Use the Look In pull-down list to identify the folder containing the Excel file of interest3 From the FILE TYPE pull down menu select EXCEL (xls)
4 Click on the file name of interest and click on OPEN or simply double-click on the file name
5 Keep the box checked that reads Read variable names from the first row of data This presumes that the first row of the Excel data file contains variable names in the first row [If the data resided in a different worksheet in the Excel file this would need to be entered]
6 Click on OK The Excel data file will now appear in the SPSSWIN Data Editor
Statistics PackageStatistics Packagefor the Social Science (SPSS)for the Social Science (SPSS)
Importing data from an EXCEL spreadsheet
7 The former EXCEL spreadsheet can now be saved as an SPSS file (FILE rArrSAVE AS) and is ready to be used in analyses Typically you would label variable and values and define missing values
Importing an Access tableSPSSWIN does not offer a direct import for Access tables Therefore we must follow these steps1 Open the Access file2 Open the data table3 Save the data as an Excel file4 Follow the steps outlined in the data import from Excel Spreadsheet to SPSSWIN
Importing Text Files into SPSSWINText data points typically are separated (or ldquodelimitedrdquo) by tabs or commas Sometimes they can be of fixed format
Statistics PackageStatistics Packagefor the Social Science (SPSS)for the Social Science (SPSS)
Running the FREQUENCIES procedure
1 Open the data file (from the menus click on FILE OPEN DATA) of rArr rArrinterest
2 From the menus click on ANALYZE DESCRIPTIVE STATISTICS rArr rArrFREQUENCIES
3 The FREQUENCIES Dialog Box will appear In the left-hand box will be a listing (source variable list) of all the variables that have been defined in the data file The first step is identifying the variable(s) for which you want to run a frequency analysis Click on a variable name(s) Then click the [ gt ] pushbutton The variable name(s) will now appear in the VARIABLE[S] box (selected variable list) Repeat these steps for each variable of interest
4 If all that is being requested is a frequency table showing count percentages (raw adjusted and cumulative) then click on OK
Statistics PackageStatistics Packagefor the Social Science (SPSS)for the Social Science (SPSS)
Requesting STATISTICSDescriptive and summary STATISTICS can be requested for numeric variables To request Statistics1 From the FREQUENCIES Dialog Box click on the STATISTICS pushbutton2 This will bring up the FREQUENCIES STATISTICS Dialog Box3 The STATISTICS Dialog Box offers the user a variety of choices
DESCRIPTIVES
The DESCRIPTIVES procedure can be used to generate descriptive statistics (click on ANALYZE DESCRIPTIVE STATISTICS DESCRIPTIVES) The rArr rArrprocedure offers many of the same statistics as the FREQUENCIES procedure but without generating frequency analysis tables
Statistics PackageStatistics Packagefor the Social Science (SPSS)for the Social Science (SPSS)
Requesting CHARTSOne can request a chart (graph) to be created for a variable or variables included in a FREQUENCIES procedure
1 In the FREQUENCIES Dialog box click on CHARTS2 The FREQUENCIES CHARTS Dialog box will appear Choose the intended chart (eg Bar diagram Pie chart histogram
Pasting charts into Word1 Click on the chart2 Click on the pulldown menu EDIT COPY OBJECTSrArr3 Go to the Word document in which the chart is to be embedded Click on EDIT rArr PASTE SPECIAL4 Select Formatted Text (RTF) and then click on OK5 Enlarge the graph to a desired size by dragging one or more of the black squares along the perimeter (if the black squares are not visible click once on the graph)
Statistics PackageStatistics Packagefor the Social Science (SPSS)for the Social Science (SPSS)
BASIC STATISTICAL PROCEDURES CROSSTABS
1 From the ANALYZE pull-down menu click on DESCRIPTIVE STATISTICS rArrCROSSTABS
2 The CROSSTABS Dialog Box will then open
3 From the variable selection box on the left click on a variable you wish to designate as the Row variable The values (codes) for the Row variable make up the rows of the crosstabs table Click on the arrow (gt) button for Row(s) Next click on a different variable you wish to designate as the Column variable The values (codes) for the Column variable make up the columns of the crosstabstable Click on the arrow (gt) button for Column(s)
4 You can specify more than one variable in the Row(s) andor Column(s) A cross table will be generated for each combination of Row and Column variables
Limitations SPSS users have less control over data manipulation and statistical output than other statistical packages such as SAS Stata etc
SPSS is a good first statistical package to perform quantitative research in social science because it is easy to use and because it can be a good starting point to learn more advanced statistical packages
Statistics PackageStatistics Packagefor the Social Science (SPSS)for the Social Science (SPSS)
QuestionsQuestions

Microsoft ExcelMicrosoft Excel
Statistical and Mathematical Function Start with lsquo=lsquo sign and then select function from function wizard xf
Inserting a Chart Click on Chart Wizard (or InsertChart) select chart give Input data range Update the Chart options and Select output range Worksheet
Importing Data in Excel File open FileType Click on File Choose Option ( DelimitedFixed Width) Choose Options (Tab Semicolon Comma Space Other) Finish
Limitations Excel uses algorithms that are vulnerable to rounding and truncation errors and may produce inaccurate results in extremecases
Statistics PackageStatistics Packagefor the Social Science (SPSS)for the Social Science (SPSS)
A general purpose statistical package SPSS is widely used in the social sciences particularly in sociology and psychology
SPSS can import data from almost any type of file to generate tabulated reports plots of distributions and trends descriptive statistics and complex statistical analyzes
Starting SPSS Double Click on SPSS on desktop or ProgramSPSS
Opening a SPSS file FileOpen
bull Data Editor
Various pull-down menus appear at the top of the Data Editor window These pull-down menus are at the heart of using SPSSWIN The Data Editor menu items (with some of the uses of the menu) are
MENUS AND TOOLBARS
Statistics PackageStatistics Packagefor the Social Science (SPSS)for the Social Science (SPSS)
FILE used to open and save data files
EDIT used to copy and paste data values used to find data in a file insert variables and cases OPTIONS allows the user to set general preferences as well as the setup for the Navigator Charts etc
VIEW user can change toolbars value labels can be seen in cells instead of data values
DATA select sort or weight cases merge files
MENUS AND TOOLBARS
TRANSFORM Compute new variables recode variables etc
Statistics PackageStatistics Packagefor the Social Science (SPSS)for the Social Science (SPSS)
ANALYZE perform various statistical procedures
GRAPHS create bar and pie charts etc
UTILITIES add comments to accompany data file (and other advanced features)
ADD-ons these are features not currently installed (advanced statistical procedures)
WINDOW switch between data syntax and navigator windows
HELP to access SPSSWIN Help information
MENUS AND TOOLBARS
Statistics PackageStatistics Packagefor the Social Science (SPSS)for the Social Science (SPSS)
Navigator (Output) Menus
When statistical procedures are run or charts are created the output will appear in the Navigator window The Navigator window contains many of the pull-down menus found in the Data Editor window Some of the important menus in the Navigator window include
INSERT used to insert page breaks titles charts etc
FORMAT for changing the alignment of a particular portion of the output
MENUS AND TOOLBARS
Statistics PackageStatistics Packagefor the Social Science (SPSS)for the Social Science (SPSS)
bull Formatting Toolbar
When a table has been created by a statistical procedure the user can edit the table to create a desired look or adddelete information Beginning with version 140 the user has a choice of editing the table in the Output or opening it in a separate Pivot Table (DEFINE) window Various pulldown menus are activated when the user double clicks on the table These include
EDIT undo and redo a pivot select a table or table body (eg to change the font)
INSERT used to insert titles captions and footnotes
PIVOT used to perform a pivot of the row and column variables
FORMAT various modifications can be made to tables and cells
Statistics PackageStatistics Packagefor the Social Science (SPSS)for the Social Science (SPSS)
Importing tab-delimited dataIn SPSSWIN click on FILE OPEN DATA Look in the appropriate location for rArr rArrthe text file Then select ldquoTextrdquo from ldquoFiles of typerdquo Click on the file name and then click on ldquoOpenrdquo You will see the Text Import Wizard ndash step 1 of 6 dialog box
You will now have an SPSS data file containing the former tab-delimited data You simply need to add variable and value labels and define missing values
Exporting Data to Excelclick on FILE SAVE AS Click on the File Name for the file to be exported For rArrthe ldquoSave as Typerdquo select from the pull-down menu Excel (xls) You will notice the checkbox for ldquowrite variable names to spreadsheetrdquo Leave this checked as you will want the variable names to be in the first row of each column in the Excel spreadsheet Finally click on Save
Statistics PackageStatistics Packagefor the Social Science (SPSS)for the Social Science (SPSS)
bull Additional menusCHART EDITOR used to edit a graph
SYNTAX EDITOR used to edit the text in a syntax window
bull Show or hide a toolbar
Click on VIEW TOOLBARS 1048635to show it to hide itrArr rArr
bull Move a toolbar
Click on the toolbar (but not on one of the pushbuttons) and then drag the toolbar to its new location
bull Customize a toolbar
Click on VIEW TOOLBARS CUSTOMIZErArr rArr
Statistics PackageStatistics Packagefor the Social Science (SPSS)for the Social Science (SPSS)
Importing data from an EXCEL spreadsheetData from an Excel spreadsheet can be imported into SPSSWIN as follows1 In SPSSWIN click on FILE OPEN DATA The OPEN DATA FILE Dialog rArr rArrBox will appear2 Locate the file of interest Use the Look In pull-down list to identify the folder containing the Excel file of interest3 From the FILE TYPE pull down menu select EXCEL (xls)
4 Click on the file name of interest and click on OPEN or simply double-click on the file name
5 Keep the box checked that reads Read variable names from the first row of data This presumes that the first row of the Excel data file contains variable names in the first row [If the data resided in a different worksheet in the Excel file this would need to be entered]
6 Click on OK The Excel data file will now appear in the SPSSWIN Data Editor
Statistics PackageStatistics Packagefor the Social Science (SPSS)for the Social Science (SPSS)
Importing data from an EXCEL spreadsheet
7 The former EXCEL spreadsheet can now be saved as an SPSS file (FILE rArrSAVE AS) and is ready to be used in analyses Typically you would label variable and values and define missing values
Importing an Access tableSPSSWIN does not offer a direct import for Access tables Therefore we must follow these steps1 Open the Access file2 Open the data table3 Save the data as an Excel file4 Follow the steps outlined in the data import from Excel Spreadsheet to SPSSWIN
Importing Text Files into SPSSWINText data points typically are separated (or ldquodelimitedrdquo) by tabs or commas Sometimes they can be of fixed format
Statistics PackageStatistics Packagefor the Social Science (SPSS)for the Social Science (SPSS)
Running the FREQUENCIES procedure
1 Open the data file (from the menus click on FILE OPEN DATA) of rArr rArrinterest
2 From the menus click on ANALYZE DESCRIPTIVE STATISTICS rArr rArrFREQUENCIES
3 The FREQUENCIES Dialog Box will appear In the left-hand box will be a listing (source variable list) of all the variables that have been defined in the data file The first step is identifying the variable(s) for which you want to run a frequency analysis Click on a variable name(s) Then click the [ gt ] pushbutton The variable name(s) will now appear in the VARIABLE[S] box (selected variable list) Repeat these steps for each variable of interest
4 If all that is being requested is a frequency table showing count percentages (raw adjusted and cumulative) then click on OK
Statistics PackageStatistics Packagefor the Social Science (SPSS)for the Social Science (SPSS)
Requesting STATISTICSDescriptive and summary STATISTICS can be requested for numeric variables To request Statistics1 From the FREQUENCIES Dialog Box click on the STATISTICS pushbutton2 This will bring up the FREQUENCIES STATISTICS Dialog Box3 The STATISTICS Dialog Box offers the user a variety of choices
DESCRIPTIVES
The DESCRIPTIVES procedure can be used to generate descriptive statistics (click on ANALYZE DESCRIPTIVE STATISTICS DESCRIPTIVES) The rArr rArrprocedure offers many of the same statistics as the FREQUENCIES procedure but without generating frequency analysis tables
Statistics PackageStatistics Packagefor the Social Science (SPSS)for the Social Science (SPSS)
Requesting CHARTSOne can request a chart (graph) to be created for a variable or variables included in a FREQUENCIES procedure
1 In the FREQUENCIES Dialog box click on CHARTS2 The FREQUENCIES CHARTS Dialog box will appear Choose the intended chart (eg Bar diagram Pie chart histogram
Pasting charts into Word1 Click on the chart2 Click on the pulldown menu EDIT COPY OBJECTSrArr3 Go to the Word document in which the chart is to be embedded Click on EDIT rArr PASTE SPECIAL4 Select Formatted Text (RTF) and then click on OK5 Enlarge the graph to a desired size by dragging one or more of the black squares along the perimeter (if the black squares are not visible click once on the graph)
Statistics PackageStatistics Packagefor the Social Science (SPSS)for the Social Science (SPSS)
BASIC STATISTICAL PROCEDURES CROSSTABS
1 From the ANALYZE pull-down menu click on DESCRIPTIVE STATISTICS rArrCROSSTABS
2 The CROSSTABS Dialog Box will then open
3 From the variable selection box on the left click on a variable you wish to designate as the Row variable The values (codes) for the Row variable make up the rows of the crosstabs table Click on the arrow (gt) button for Row(s) Next click on a different variable you wish to designate as the Column variable The values (codes) for the Column variable make up the columns of the crosstabstable Click on the arrow (gt) button for Column(s)
4 You can specify more than one variable in the Row(s) andor Column(s) A cross table will be generated for each combination of Row and Column variables
Limitations SPSS users have less control over data manipulation and statistical output than other statistical packages such as SAS Stata etc
SPSS is a good first statistical package to perform quantitative research in social science because it is easy to use and because it can be a good starting point to learn more advanced statistical packages
Statistics PackageStatistics Packagefor the Social Science (SPSS)for the Social Science (SPSS)
QuestionsQuestions

Statistics PackageStatistics Packagefor the Social Science (SPSS)for the Social Science (SPSS)
ANALYZE perform various statistical procedures
GRAPHS create bar and pie charts etc
UTILITIES add comments to accompany data file (and other advanced features)
ADD-ons these are features not currently installed (advanced statistical procedures)
WINDOW switch between data syntax and navigator windows
HELP to access SPSSWIN Help information
MENUS AND TOOLBARS
Statistics PackageStatistics Packagefor the Social Science (SPSS)for the Social Science (SPSS)
Navigator (Output) Menus
When statistical procedures are run or charts are created the output will appear in the Navigator window The Navigator window contains many of the pull-down menus found in the Data Editor window Some of the important menus in the Navigator window include
INSERT used to insert page breaks titles charts etc
FORMAT for changing the alignment of a particular portion of the output
MENUS AND TOOLBARS
Statistics PackageStatistics Packagefor the Social Science (SPSS)for the Social Science (SPSS)
bull Formatting Toolbar
When a table has been created by a statistical procedure the user can edit the table to create a desired look or adddelete information Beginning with version 140 the user has a choice of editing the table in the Output or opening it in a separate Pivot Table (DEFINE) window Various pulldown menus are activated when the user double clicks on the table These include
EDIT undo and redo a pivot select a table or table body (eg to change the font)
INSERT used to insert titles captions and footnotes
PIVOT used to perform a pivot of the row and column variables
FORMAT various modifications can be made to tables and cells
Statistics PackageStatistics Packagefor the Social Science (SPSS)for the Social Science (SPSS)
Importing tab-delimited dataIn SPSSWIN click on FILE OPEN DATA Look in the appropriate location for rArr rArrthe text file Then select ldquoTextrdquo from ldquoFiles of typerdquo Click on the file name and then click on ldquoOpenrdquo You will see the Text Import Wizard ndash step 1 of 6 dialog box
You will now have an SPSS data file containing the former tab-delimited data You simply need to add variable and value labels and define missing values
Exporting Data to Excelclick on FILE SAVE AS Click on the File Name for the file to be exported For rArrthe ldquoSave as Typerdquo select from the pull-down menu Excel (xls) You will notice the checkbox for ldquowrite variable names to spreadsheetrdquo Leave this checked as you will want the variable names to be in the first row of each column in the Excel spreadsheet Finally click on Save
Statistics PackageStatistics Packagefor the Social Science (SPSS)for the Social Science (SPSS)
bull Additional menusCHART EDITOR used to edit a graph
SYNTAX EDITOR used to edit the text in a syntax window
bull Show or hide a toolbar
Click on VIEW TOOLBARS 1048635to show it to hide itrArr rArr
bull Move a toolbar
Click on the toolbar (but not on one of the pushbuttons) and then drag the toolbar to its new location
bull Customize a toolbar
Click on VIEW TOOLBARS CUSTOMIZErArr rArr
Statistics PackageStatistics Packagefor the Social Science (SPSS)for the Social Science (SPSS)
Importing data from an EXCEL spreadsheetData from an Excel spreadsheet can be imported into SPSSWIN as follows1 In SPSSWIN click on FILE OPEN DATA The OPEN DATA FILE Dialog rArr rArrBox will appear2 Locate the file of interest Use the Look In pull-down list to identify the folder containing the Excel file of interest3 From the FILE TYPE pull down menu select EXCEL (xls)
4 Click on the file name of interest and click on OPEN or simply double-click on the file name
5 Keep the box checked that reads Read variable names from the first row of data This presumes that the first row of the Excel data file contains variable names in the first row [If the data resided in a different worksheet in the Excel file this would need to be entered]
6 Click on OK The Excel data file will now appear in the SPSSWIN Data Editor
Statistics PackageStatistics Packagefor the Social Science (SPSS)for the Social Science (SPSS)
Importing data from an EXCEL spreadsheet
7 The former EXCEL spreadsheet can now be saved as an SPSS file (FILE rArrSAVE AS) and is ready to be used in analyses Typically you would label variable and values and define missing values
Importing an Access tableSPSSWIN does not offer a direct import for Access tables Therefore we must follow these steps1 Open the Access file2 Open the data table3 Save the data as an Excel file4 Follow the steps outlined in the data import from Excel Spreadsheet to SPSSWIN
Importing Text Files into SPSSWINText data points typically are separated (or ldquodelimitedrdquo) by tabs or commas Sometimes they can be of fixed format
Statistics PackageStatistics Packagefor the Social Science (SPSS)for the Social Science (SPSS)
Running the FREQUENCIES procedure
1 Open the data file (from the menus click on FILE OPEN DATA) of rArr rArrinterest
2 From the menus click on ANALYZE DESCRIPTIVE STATISTICS rArr rArrFREQUENCIES
3 The FREQUENCIES Dialog Box will appear In the left-hand box will be a listing (source variable list) of all the variables that have been defined in the data file The first step is identifying the variable(s) for which you want to run a frequency analysis Click on a variable name(s) Then click the [ gt ] pushbutton The variable name(s) will now appear in the VARIABLE[S] box (selected variable list) Repeat these steps for each variable of interest
4 If all that is being requested is a frequency table showing count percentages (raw adjusted and cumulative) then click on OK
Statistics PackageStatistics Packagefor the Social Science (SPSS)for the Social Science (SPSS)
Requesting STATISTICSDescriptive and summary STATISTICS can be requested for numeric variables To request Statistics1 From the FREQUENCIES Dialog Box click on the STATISTICS pushbutton2 This will bring up the FREQUENCIES STATISTICS Dialog Box3 The STATISTICS Dialog Box offers the user a variety of choices
DESCRIPTIVES
The DESCRIPTIVES procedure can be used to generate descriptive statistics (click on ANALYZE DESCRIPTIVE STATISTICS DESCRIPTIVES) The rArr rArrprocedure offers many of the same statistics as the FREQUENCIES procedure but without generating frequency analysis tables
Statistics PackageStatistics Packagefor the Social Science (SPSS)for the Social Science (SPSS)
Requesting CHARTSOne can request a chart (graph) to be created for a variable or variables included in a FREQUENCIES procedure
1 In the FREQUENCIES Dialog box click on CHARTS2 The FREQUENCIES CHARTS Dialog box will appear Choose the intended chart (eg Bar diagram Pie chart histogram
Pasting charts into Word1 Click on the chart2 Click on the pulldown menu EDIT COPY OBJECTSrArr3 Go to the Word document in which the chart is to be embedded Click on EDIT rArr PASTE SPECIAL4 Select Formatted Text (RTF) and then click on OK5 Enlarge the graph to a desired size by dragging one or more of the black squares along the perimeter (if the black squares are not visible click once on the graph)
Statistics PackageStatistics Packagefor the Social Science (SPSS)for the Social Science (SPSS)
BASIC STATISTICAL PROCEDURES CROSSTABS
1 From the ANALYZE pull-down menu click on DESCRIPTIVE STATISTICS rArrCROSSTABS
2 The CROSSTABS Dialog Box will then open
3 From the variable selection box on the left click on a variable you wish to designate as the Row variable The values (codes) for the Row variable make up the rows of the crosstabs table Click on the arrow (gt) button for Row(s) Next click on a different variable you wish to designate as the Column variable The values (codes) for the Column variable make up the columns of the crosstabstable Click on the arrow (gt) button for Column(s)
4 You can specify more than one variable in the Row(s) andor Column(s) A cross table will be generated for each combination of Row and Column variables
Limitations SPSS users have less control over data manipulation and statistical output than other statistical packages such as SAS Stata etc
SPSS is a good first statistical package to perform quantitative research in social science because it is easy to use and because it can be a good starting point to learn more advanced statistical packages
Statistics PackageStatistics Packagefor the Social Science (SPSS)for the Social Science (SPSS)
QuestionsQuestions
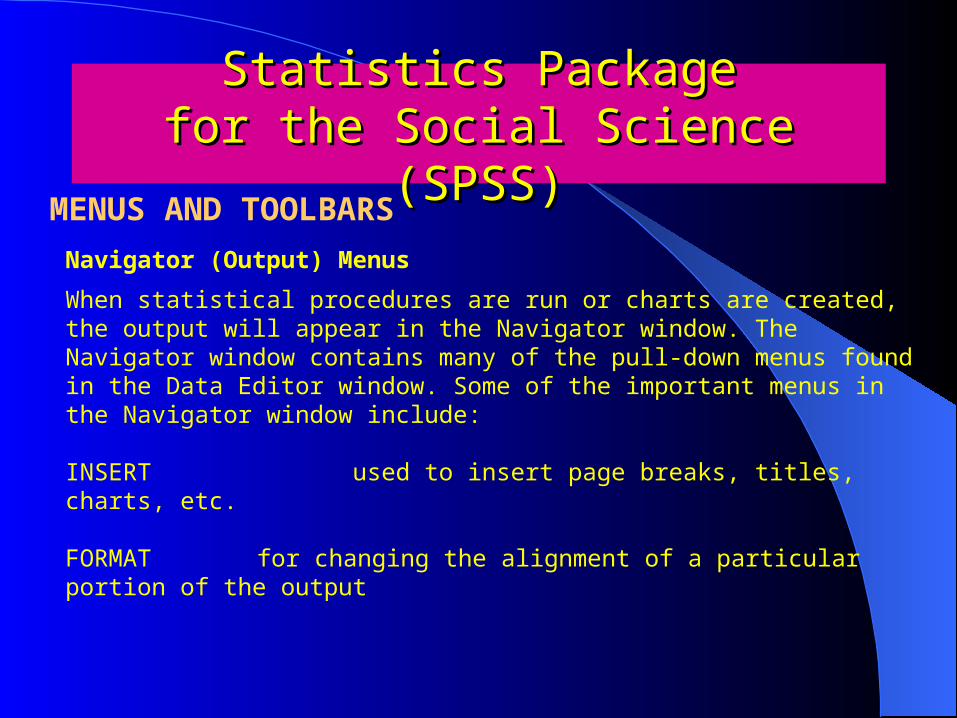
Statistics PackageStatistics Packagefor the Social Science (SPSS)for the Social Science (SPSS)
BASIC STATISTICAL PROCEDURES CROSSTABS
1 From the ANALYZE pull-down menu click on DESCRIPTIVE STATISTICS rArrCROSSTABS
2 The CROSSTABS Dialog Box will then open
3 From the variable selection box on the left click on a variable you wish to designate as the Row variable The values (codes) for the Row variable make up the rows of the crosstabs table Click on the arrow (gt) button for Row(s) Next click on a different variable you wish to designate as the Column variable The values (codes) for the Column variable make up the columns of the crosstabstable Click on the arrow (gt) button for Column(s)
4 You can specify more than one variable in the Row(s) andor Column(s) A cross table will be generated for each combination of Row and Column variables
Limitations SPSS users have less control over data manipulation and statistical output than other statistical packages such as SAS Stata etc
SPSS is a good first statistical package to perform quantitative research in social science because it is easy to use and because it can be a good starting point to learn more advanced statistical packages
Statistics PackageStatistics Packagefor the Social Science (SPSS)for the Social Science (SPSS)
QuestionsQuestions

QuestionsQuestions