research report 79: the heroin epidemic of the 1980s … the heroin epidemic of the 1980s and 1990s...
TRANSCRIPT

The heroin epidemic of the 1980s and 1990s and its effect on crime trends - then and now
Research Report 79
Nick Morgan
July 2014

2 The heroin epidemic of the 1980s and 1990s and its effect on crime trends - then and now
Contents
Summary 3
Chapter 1: Introduction and methodology 6
Chapter 2: An overview of crime trends and explanations of the crime drop 10
Chapter 3: A historical overview of the spread of heroin in England and Wales 24
Chapter 4: The relationship between opiate/crack use and crime 31
Chapter 5: The relationship between opiate/crack use and crime locally, 36 nationally and internationally Chapter 6: Quantifying the impact of changing levels of opiate/crack use on 49
acquisitive crime trends
Conclusion 57
References 60
Keywords
Drugs, crime, heroin, crack, cocaine, crime trends, regions, police
Acknowlegements
This report was written by Nick Morgan with contributions from Andy Feist, James Allan, John Ferrier and Zoe Brass. Additional thanks for their comments, suggestions or fact-checking should also go to Matthias Pierce, Tim Millar, Amanda White, Anna Richardson, Christine Cooper, Rob Street, Andrew Kent, Jackie Hoare, Dalbir Uppal, Maryam Ahmad, Alan Hall, Peter Blyth, John Elliott and Richard Dubourg. We would also like to thank the four independent academics who peer reviewed different draft versions of the report: David Farrington, Ken Pease, Matthew Hickman and Hayley Jones.
3 The heroin epidemic of the 1980s and 1990s and its effect on crime trends - then and now
Summary
A variety of factors have been cited to explain the rise and fall in crime that has occurred in many nations since 1980. But as yet, no definitive explanation has been produced. In the UK context, a rise and fall in illicit drug use has not been especially prominent in this debate, perhaps due to a lack of robust data for the whole period.
This paper gathers available evidence and conducts new analysis to try to assess the effect that heroin and crack-cocaine1 use may have had on acquisitive crime (i.e. theft-type offences) in England and Wales since 1980. It also suggests implications for future crime trends.
Numerous sources of evidence agree that the number of heroin users increased markedly through the 1980s and early 1990s and that many also used crack as their drug-using career developed. This ‘epidemic’ spread from area to area but the national peak probably occurred between 1993 and 2000. Crime peaked between 1993 and 1995.
Current data, particularly from treatment providers, show that heroin/crack use has declined for at least a decade and that – as with offending – the decline has been most marked amongst younger people. This means those who began using these drugs during the epidemic still dominate the heroin/crack-using population today.
Studies agree that, in aggregate, heroin/crack users commit a large number of offences; large enough, this paper shows, to be an important driver of overall crime trends.
Studies disagree about whether it is illicit drug use that causes the criminality. This is because a sizable proportion of heroin/crack users do not resort to theft. And many were offending before taking these drugs. However, evidence suggests that, for at least some users, heroin/crack was the catalyst for offending, and for others it probably accelerated and extended their criminal career. Thus aggregate-level change in numbers of heroin/crack users is likely to affect crime trends.
An examination of the considerable regional and international variation in crime trends, particularly geographical areas where the crime drop was not marked or the peak occurred at a different time, also points to a possible causal relationship, rather than simple correlation.
Within England and Wales, the starkest example of regional variation was Merseyside, which had a recorded acquisitive crime peak five years before other police force areas. Evidence also suggests that Merseyside was one of the first areas to be hit by the heroin epidemic and the first to mount a concerted treatment response.
1 Hereafter crack-cocaine is referred to simply as ‘crack’.

4 The heroin epidemic of the 1980s and 1990s and its effect on crime trends - then and now
Acquisitive (and total) recorded crime in Scotland peaked in 1991, which studies suggest is in line with the national peak in heroin/crack use. But in Edinburgh and its surrounding region (Lothian and Borders) recorded acquisitive crime peaked seven years earlier, in 1984. Data show that Lothian and Borders had a severe heroin epidemic at this time, which was not prolonged into the 1990s as in other parts of Scotland.
Like Merseyside and Edinburgh, the Republic of Ireland suffered a short, sharp heroin epidemic in the early 1980s and crime surged at this time. Northern Ireland did not have a heroin epidemic and its crime trend was much flatter over the period.
In the US all types of crime fell from 1991 but the US crime survey shows that property crime peaked over a decade earlier, in line with the US heroin epidemic. Likewise, many east European nations had a heroin epidemic about a decade after those in western Europe. Eastern Europe also had a recorded acquisitive crime peak around a decade after western Europe.
Two approaches were used in this paper to estimate the effect of heroin/crack use on crime. Both suggest that the epidemic may have had a significant impact on acquisitive crime in England and Wales.
The first approach was a police force area-level comparison of the Addicts Index and police recorded crime data from 1981 to 1996, through the crime turning point. This showed that different types of theft generally peaked together within an area. But the timing and size of these peaks varied across areas and was highly correlated with heroin use. Fixed effects regression analysis suggested that about 40 per cent of the national rise in the highest volume crime types (burglary and vehicle crime), from 1981 to the peak, can be attributed to rises in the number of heroin users.
The second approach was to model the number of heroin/crack users over time and their offending. Exploratory model results found that heroin/crack use could account for at least one-half of the rise in acquisitive crime in England and Wales to 1995 and between one-quarter and one-third of the fall to 2012, as the epidemic cohort aged, received treatment, quit illicit drug use or died.
Model results also suggested that the epidemic still affects acquisitive crime today. In the recent recession, crime in England and Wales continued to fall, which correlates with a slowly shrinking heroin/crack user population but not with economic factors. Projecting forwards, a further downward pressure on crime, of a lessening degree, might be expected as the heroin/crack cohort continues to age and get treatment.
The evidence presented shows that detecting and preventing future drug epidemics is paramount, and this requires local as well as national monitoring. Evidence also suggests that, for volume-crime reduction, it is crucial to maintain a focus on heroin/crack, despite the higher prevalence of other illicit drugs like cannabis, powder cocaine and ecstasy, and the emergence of new psychoactive substances. Specifically, it remains important to identify the minority of heroin/crack users who commit large volumes of crime during addiction periods. If that can be done, and those periods of addiction and offending can be shortened or prevented, the potential for further reductions in crime remains significant. However, many of these individuals will have been using heroin/crack intermittently for a decade or more and will have tried most current forms of treatment, so innovative approaches may be needed.

5 The heroin epidemic of the 1980s and 1990s and its effect on crime trends - then and now
Finally, although this paper has drawn together a wide body of evidence, the ‘hidden’ nature of the group being studied – heroin/crack users – means that robust data remain sparse. Hence, results should be treated cautiously and hopefully built upon in the future.

6 The heroin epidemic of the 1980s and 1990s and its effect on crime trends - then and now
1. Introduction and methodology
The long-run decline in crime in England and Wales has prompted a variety of analyses and research, but a defining explanation remains elusive (for a review, see Farrell et al., 2010). Improving the understanding of past crime trends is more than just an academic exercise. It has the potential to add considerable value to policy approaches to crime reduction. Only by understanding the factors that have driven crime in the past can these factors be correctly prioritised in the future.
The particular focus of this study is the relationship between illicit drug use and crime. It examines the potential crime impact of the marked changes in the number of users of opiates (primarily heroin) and crack-cocaine (hereafter referred to as ‘crack’) that have occurred since 1980. This is because, despite a wide literature on the link between opiate/crack use and crime, few, if any, studies have attempted to quantify its effect on overall crime trends.
This study is a first attempt to marshal all the available evidence on this question. It concludes with some quantitative estimates of the proportion of the rise and fall in crime that might be attributable to changes in the number of opiate/crack users (OCUs), but these should be seen as exploratory rather than definitive.
Specifically, the study has the following aims.
- To describe the nature of heroin epidemics, specifically the spread of opiate/crack use in England and Wales since 1980.
- To examine the relationship between changes in the levels of acquisitive crime and opiate/crack use, focusing particularly on how crime changes in police force areas map onto changes in the OCU population.
- To model changes in the OCU population since 1980, and if possible, assess the contribution that changes in the number of OCUs has made to overall acquisitive crime trends.
There are two versions of this paper: this shorter version and a longer, more technical version. The latter provides more methodological details, but also more background material on general crime trends and other explanations for the rise and fall.
Methodology
One of the challenges of analysing the relationship between trends in illicit drug use and offending is the quality of data available. Data on the numbers and trends in OCUs are sparse due to the hidden nature of this population. This creates two significant and related problems.
- Because the most chaotic users tend not to be captured by national-level surveys, much of what is known about OCUs comes from data on treatment or the criminal justice system. As many researchers have pointed out (see, for example, Stevens, 2007) this almost certainly creates a biased sample. As the evidence presented throughout this paper suggests, many OCUs do not get arrested, and many quit without treatment, hence relying on these risks delivering a sample that is more crime-prone than the true population.

7 The heroin epidemic of the 1980s and 1990s and its effect on crime trends - then and now
- The second problem relates to longitudinal research into illicit drug use. For opiate/crack use, virtually all longitudinal studies are retrospective, due to the fact that only a very small proportion of the general population become OCUs. So prospective cohorts, like, for example, the Cambridge Delinquency Study (Farrington et al, 2006), often fail to pick up enough individuals who go on to become OCUs for any meaningful conclusions to be drawn. But retrospective studies, of the kind drawn upon in this study, may be affected by selection bias if the more recalcitrant users are those easiest to identify in retrospect.
Data on offending are also problematic. Offending rates and trends obtained from surveys may suffer from recall bias and almost invariably involve extrapolation over time. Frustratingly, these two issues balance each other, so researchers can only make one better by making the other worse. A shorter reference period in which to capture offending levels (say, the past four weeks) will improve the chances of accurate recall, but will invariably mean a greater degree of extrapolation. It will require multiplying up by a factor of 13 to get an annual figure, which increases the chance that the measured 4-week period may not be representative. But offending rates and trends obtained from official data, like police recorded crime, provide only a partial picture, as not all crime is reported and an even smaller proportion results in arrest or conviction.
The overall approach has been to exploit the full range of international research evidence and UK datasets, since no single dataset and no single methodology can definitively answer the research questions posed. A key feature of the analysis has therefore been triangulation. Conclusions have, where possible, been tested against a variety of alternative approaches and data sources. A second feature of the analysis is the focus on examining regional trends in crime and OCU populations, rather than focusing solely on the national level. Finally, the study also attempts to assess when and how opiate/crack use might have interacted with other drivers of crime.
For the most part, the paper uses three types of methodology.
1) Reviews of the existing research literature: For the chapters on general crime trends, theories of crime trends, the history of the heroin epidemic and the possible causal relationship between crime and opiate/crack use (Chapters 2 to 4), the existing UK and international research evidence was reviewed and synthesised. In other words, the focus was on summarising and categorising existing studies rather than conducting new analysis. Although the principles of systematic searching were adhered to, the review does not meet the standards set in formal rapid evidence assessments or systematic reviews. This partly reflected the diverse nature of the subject matter covered. Hence the researchers merely seek to be transparent about the process and to encourage others to add evidence that may have been missed or misrepresented.
2) Statistical analysis of recorded crime and the Addicts Index trends: Chapter 5 contains a section of new statistical analysis aiming to test whether regional trends in opiate/crack use help to explain the geographic variation in crime that was seen through the 1980s and 1990s. It uses the following datasets:
- annual police force area level recorded crime volumes for burglary and vehicle crime from 1980/81 to 1997/98;
- annual police force area level Addicts Index data for volumes of new and total heroin users from 1977 to 1996;
- annual police force area level claimant count volumes (a proxy for unemployment) from NOMIS for the period 1983 to 1998.

8 The heroin epidemic of the 1980s and 1990s and its effect on crime trends - then and now
This panel dataset was used to conduct a series of statistical, parametric tests, ranging from standard bivariate correlations and scatter-plots, to multivariate fixed effects regression analyses.
The data sources were selected as the best available, but they have limitations. For crime, recorded crime data were used because they are the only source available at the local level. Victimisation surveys like the Crime Survey for England and Wales (CSEW), formerly the British Crime Survey, are generally better measures of trends because they are unaffected by reporting/recording changes. But the CSEW sample sizes were too small throughout the 1980s and early 1990s to conduct meaningful analysis at the sub-national level. To try to mitigate the issues with the recorded crime data, the analysis was restricted to the period before 1998 (recorded crime was affected by recording practice changes from 1998 until around 2004).2 Only trends in burglary and vehicle crime were looked at for two reasons.
- It is generally acknowledged that these are the most reliably recorded volume crime types (Chapter 2 shows that for these crimes there is a high degree of similarity between the trends in police recorded crime and those from the CSEW).
- These crimes comprised more than one-half of all offences recorded by the police at that time, so were the ones driving the overall trend.3
For trends in heroin/crack use, the Addicts Index was used as this is the only data source for OCUs available at police force level through the period. It is not a perfect measure as OCUs tended to be notified to the Index once they sought medical attention. Evidence suggests that this usually occurs several years after the onset of regular use, and some users may never seek treatment (Millar et al., 2001). Hence the data probably lag and under-count reality. Various methods are used to mitigate this issue, including specific modelling of lags. The dataset was discontinued after 1996.
3) Modelling offending by the OCU population: In addition to examining the
relationship between OCUs and crime at the aggregate level (a kind of top-down approach), the study also employs a bottom-up method in Chapter 6. This uses evidence from studies measuring the self-reported offending of specific cohorts of OCUs and then extrapolates the results – taking care to avoid potential bias – to the entire OCU population. By also modelling the trend in the OCU population over time, the analysis leads to estimates for the amount of additional acquisitive crime generated by the epidemic, and hence the degree to which opiate/crack use might have contributed to the rise and fall in crime. Unlike Chapter 4, which uses recorded crime, this chapter uses self-reported offending data. This was partly to provide triangulation and partly because studies have shown that annual offending rates generated from criminal justice system data are likely to under-represent the degree to which total offending is skewed towards a small number of the most prolific offenders (Farrington et al., 2006).
Modelling of this type inevitably involves numerous simplifications and assumptions. These are listed in full in the longer version of this paper, but most relate to the
2 The City of London was also excluded from the analysis as it generally has much smaller counts of crime than the other police force areas, which can skew results. 3 Specifically, 57 per cent of the rise in total recorded crime from 1980 to 1992 was due to the increase in burglary and theft of/from vehicle.

9 The heroin epidemic of the 1980s and 1990s and its effect on crime trends - then and now
weaknesses in the underlying data explained above. For that reason, the results of this modelling process should be viewed as exploratory.
Structure of the paper
The paper is divided into six chapters. Chapter 2 looks at what is known about crime trends in England and Wales from 1980 to the present, including a brief examination of their similarity to trends in other nations. The focus is mainly on acquisitive crime because this has the strongest link to opiate/crack use. A short summary of some of the other theories that have been offered to explain these trends is included.
Chapter 3 pieces together the story of the heroin epidemic in England and Wales with a particular emphasis on the variation in the timing at which the epidemic affected different areas, so that variation in the crime data can be considered against this. Chapter 4 summarises the existing research evidence on whether there is a causal link between opiate/crack use and crime.
Chapter 5 examines the relationship between trends in opiate/crack use and crime at the local, national and international level. The chapter is part descriptive, examining whether the epidemic narrative helps to explain some of the variation in crime trends described in Chapter 2. But it also contains statistical analysis in which these explanations are tested more robustly.
Chapter 6 provides a brief description of the modelling of the OCU population and estimates the potential impact of the heroin epidemic on CSEW acquisitive crime trends.
Finally there is a brief conclusion, summarising the findings and drawing out several policy implications.
10 The heroin epidemic of the 1980s and 1990s and its effect on crime trends - then and now
2. An overview of crime trends and explanations of the crime drop
Crime trends in England and Wales
The first section of this chapter provides a short overview of the data on longer term crime trends in England and Wales. It draws out some key facts against which to judge factors that might explain the rise and fall in crime.
There are two primary measures of crime in England and Wales:
- police recorded crime (PRC); and
- the Crime Survey for England and Wales (CSEW), formerly the British Crime Survey.
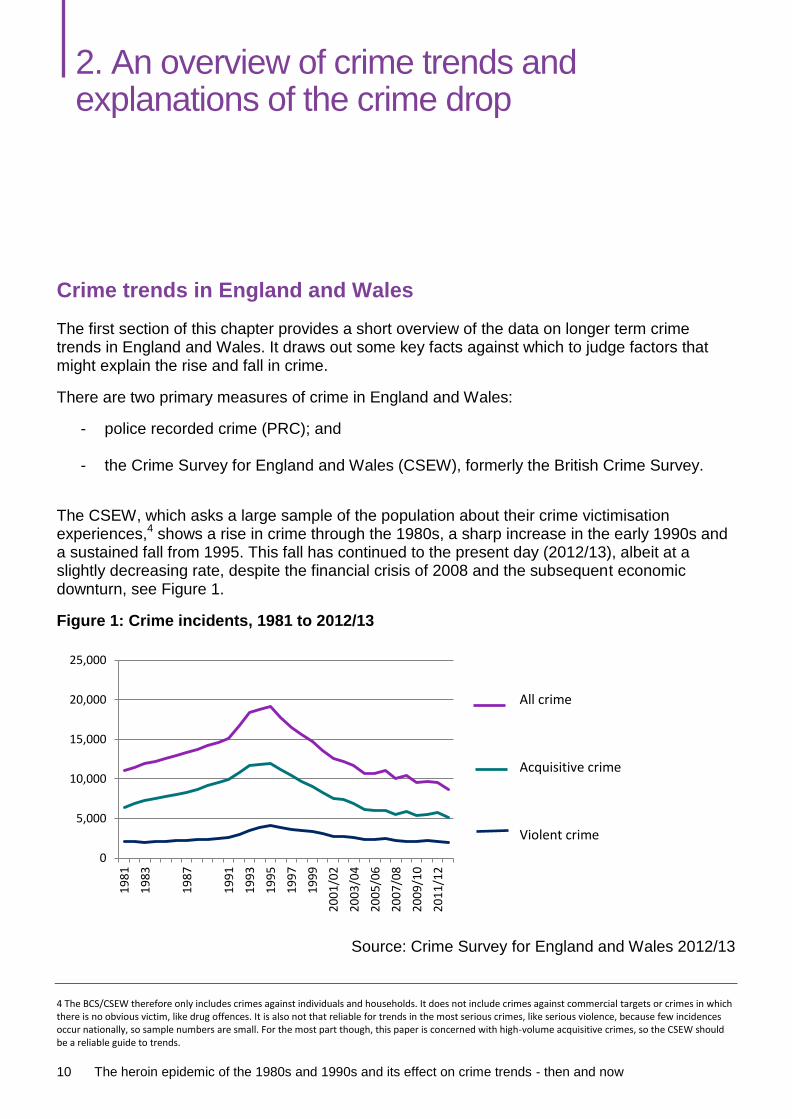
The CSEW, which asks a large sample of the population about their crime victimisation experiences,4 shows a rise in crime through the 1980s, a sharp increase in the early 1990s and a sustained fall from 1995. This fall has continued to the present day (2012/13), albeit at a slightly decreasing rate, despite the financial crisis of 2008 and the subsequent economic downturn, see Figure 1.
Figure 1: Crime incidents, 1981 to 2012/13
Source: Crime Survey for England and Wales 2012/13
4 The BCS/CSEW therefore only includes crimes against individuals and households. It does not include crimes against commercial targets or crimes in which there is no obvious victim, like drug offences. It is also not that reliable for trends in the most serious crimes, like serious violence, because few incidences occur nationally, so sample numbers are small. For the most part though, this paper is concerned with high-volume acquisitive crimes, so the CSEW should be a reliable guide to trends.
0
5,000
10,000
15,000
20,000
25,000
19
81
19
83
19
87
19
91
19
93
19
95
19
97
19
99
20
01
/02
20
03
/04
20
05
/06
20
07
/08
20
09
/10
20
11
/12
Violent crime
Acquisitive crime
All crime
All crime
Acquisitive crime
Violent crime

11 The heroin epidemic of the 1980s and 1990s and its effect on crime trends - then and now
Figure 1 also shows that at the peak, acquisitive crime made up over 60 per cent of all offences and has therefore been the driving force behind the overall trend, but violent crime shows a similar pattern.
PRC describes crime that is reported to and recorded by the police. Changes in police recording practice occurred in 1998 and 2002.5 These changes resulted in the improved recording of some crimes (particularly minor violence), which is almost certainly the reason that PRC peaks in 2003/04 (see Figure 2). Removing the period during which the recording changes would have biased the trend (1998 to 2004), PRC reveals a reasonably similar picture to the CSEW. It rises gradually in the 1980s, sharply in the early 1990s and then has a prolonged decline.
Figure 2: Total offences, 1981 to 2011/12
Source: ONS, police recorded crime
Furthermore, there is agreement in the trends between the CSEW and PRC on the high-volume acquisitive crimes that have really driven overall crime – see Figures 3 and 4 below. So for these offences, which provide the focus for much of this paper, there can be confidence that the trend is genuine and worthy of explanation.
5 For full details of these see Berman, 2008.
0
1000000
2000000
3000000
4000000
5000000
6000000
7000000
19
81
19
82
19
83
19
84
19
85
19
86
19
87
19
88
19
89
19
90
19
91
19
92
19
93
19
94
19
95
19
96
19
97
19
98
/99
19
99
/00
20
00
/01
20
01
/02
20
02
/03
20
03
/04
20
04
/05
20
05
/06
20
06
/07
20
07
/08
20
08
/09
20
09
/10
20
10
/11
20
11
/12
20
12
/13
Period affected
by recording
changes

12 The heroin epidemic of the 1980s and 1990s and its effect on crime trends - then and now
Figure 3: Comparison of burglary trends, police recorded crime and Crime Survey for England and Wales, 1981 to 2011/12
Sources: ONS, police recorded crime, 2011/12 and Crime Survey for England and Wales
2012/13
Figure 4: Comparison of theft of vehicle trends, police recorded crime and Crime Survey for England and Wales, 1981 to 2011/12
Sources: ONS, police recorded crime, 2011/12 and Crime Survey for England and Wales
2012/13
Figures 3 and 4 also show that, nationally, there was a high degree of consistency across these crime types (‘theft from vehicle’ has an almost identical trend). They all rose, peaked in the mid-1990s, and then fell together. It is also worth noting that for PRC there was a small fall in the trends in the late 1980s, prior to the sharp rise. The CSEW was not carried out between 1987
0
200,000
400,000
600,000
800,000
1,000,000
1,200,000
1,400,000
1,600,000
1,800,000
2,000,000
19
81
19
83
19
85
19
87
19
89
19
91
19
93
19
95
19
97
19
99
/00
20
01
/02
20
03
/04
20
05
/06
20
07
/08
20
09
/10
20
11
/12
CSEW
PRC
0
100,000
200,000
300,000
400,000
500,000
600,000
700,000
19
81
19
83
19
85
19
87
19
89
19
91
19
93
19
95
19
97
19
99
/00
20
01
/02
20
03
/04
20
05
/06
20
07
/08
20
09
/10
20
11
/12
CSEW
PRC

13 The heroin epidemic of the 1980s and 1990s and its effect on crime trends - then and now
and 1991 so would not register this, but the consistency with which it appears in the PRC trends suggest that it was a genuine ‘lull’ in the rise in crime.
Commentators have noted that the trend in England and Wales has been similar to that in other western nations. This is true to an extent but there are also important differences. According to the National Crime Victimization Survey (NCVS), the equivalent of the CSEW in the US, the rate of property crime, which is mostly theft offences, peaked in the mid-1970s in the US, far earlier than it did in England and Wales.6
Figure 5: Crime trends in the US, 1973 to 2011
Source: US Bureau of Justice, National Crime Victimization Survey
Recorded acquisitive crime also peaked earlier than in England and Wales in the Republic of Ireland (1984)7, Canada (1991) and Scotland (1991). But other nations had a later peak. For example, Aebi (2004) found that whilst crime started to fall in England and Wales and most western European nations in the mid-1990s, the peak in central and eastern European nations occurred up to a decade later. Overall, it is clear that there are similarities and differences between crime trends across nations and any explanation needs to contend with these.
Moving from the national to the police force area level (there are 44 police force areas in England and Wales8) reveals a similar picture – whilst the trends in virtually all areas show an overall rise and fall in acquisitive crime, they do so at different times and to different degrees.
Virtually all forces had large increases in acquisitive crime from 1980 to 1993 and, as at the national level, the rise was particularly concentrated for most areas at the beginning of the 1990s. This is shown for police recorded burglary in Table 1.9 Taking a single example, South Yorkshire has a 235 per cent rise in burglary from 1980/81 to 1993/94, but the vast majority of this rise (81%) occurred in the 4-year period from 1989/90.
6 It is important to note that the NCVS property crime peak would be slightly later if measured in volumes rather than rates, probably around 1979 to 1981 by this paper’s calculations; and that the property crime peak in US recorded crime is 1991. But, even amongst the recorded crime types, the most reliably recorded offences like burglary show an earlier peak (1981). So, whichever measure is used, the data suggest that the US had a far earlier peak in acquisitive crime than England and Wales. 7 The 1984 peak in the Republic of Ireland refers to total recorded crime involving both indictable and non-indictable offences – http://www.crimecouncil.gov.ie/statistics_cri_crime.html. The trend in indictable offences also shows a 1983/84 peak but reaches its highest level in 2002, although this is likely to be an artefact of recording practice changes. 8 Though there are currently 44 police forces in England and Wales, we exclude British Transport Police from Table 1 as it does not cover a geographical area as such. City of London police is also excluded as it is much lower volumes of offences, so is not really comparable to the other forces. 9 It is necessary to use PRC data at the police force area level, due to the small sample size of the CSEW.
0
10
20
30
40
50
60
0
100
200
300
400
500
600
19
73
19
75
19
77
19
79
19
81
19
83
19
85
19
87
19
89
19
91
19
93
19
95
19
97
19
99
20
01
20
03
20
05
20
07
20
09
NCVS property crime rate per 1,000 households – left axis
NCVS violent crime per 1,000 population – right axis

14 The heroin epidemic of the 1980s and 1990s and its effect on crime trends - then and now
Table 1: Table showing increases in police recorded burglary, by police force area, 1980/81 to 1993/94
Burglary
volume in 1980/81
Burglary volume in 1989/90
Burglary volume in 1993/94
Total burglary increase: 1980/81 to
1993/94 (volume)
Total burglary increase: 1980/81 to
1993/95 (%
change)
Percentage of total rise occurring between 1989/90
and 1993/94
Avon and Somerset
11,484 17,572 40,655 29,171 254% 79%
Bedfordshire 5,604 7,610 15,596 9,992 178% 80%
Cambridgeshire 4,859 6,701 15,023 10,164 209% 82%
Cheshire 8,176 10,501 22,034 13,858 170% 83%
Cleveland 8,962 14,395 18,738 9,776 109% 44%
Cumbria 4,064 6,460 10,733 6,669 164% 64%
Derbyshire 9,087 9,390 25,612 16,525 182% 98%
Devon and Cornwall
8,850 15,831 32,578 23,728 268% 71%
Dorset 4,567 5,969 9,625 5,058 111% 72%
Durham 7,711 9,730 13,677 5,966 77% 66%
Dyfed-Powys 1,829 2,721 4,632 2,803 153% 68%
Essex 11,347 15,228 27,149 15,802 139% 75%
Gloucestershire 3,930 8,215 17,294 13,364 340% 68%
Greater Manchester
46,949 73,438 97,850 50,901 108% 48%
Gwent 3,967 3,838 7,091 3,124 79% 104%
Hampshire 13,297 19,578 33,066 19,769 149% 68%
Hertfordshire 5,807 6,360 13,419 7,612 131% 93%
Humberside 12,710 22,111 48,031 35,321 278% 73%
Kent 10,429 14,420 30,743 20,314 195% 80%
Lancashire 12,728 17,017 29,550 16,822 132% 75%
Leicestershire 7,162 11,552 25,210 18,048 252% 76%
Lincolnshire 3,532 6,808 13,008 9,476 268% 65%
Merseyside 34,801 36,871 33,688 -1,113 -3% 0%

15 The heroin epidemic of the 1980s and 1990s and its effect on crime trends - then and now
Metropolitan 125,944 148,901 174,770 48,826 39% 53%
Norfolk 5,273 10,455 18,178 12,905 245% 60%
North Wales 6,107 7,387 11,990 5,883 96% 78%
North Yorkshire 5,283 8,071 16,275 10,992 208% 75%
Northamptonshire 6,048 6,392 15,944 9,896 164% 97%
Northumbria 31,068 49,585 63,007 31,939 103% 42%
Nottinghamshire 18,161 18,267 40,038 21,877 121% 100%
South Wales 20,437 25,067 38,188 17,751 87% 74%
South Yorkshire 15,641 22,514 52,396 36,755 235% 81%
Staffordshire 8,750 13,406 30,091 21,341 244% 78%
Suffolk 3,223 6,022 9,147 5,924 184% 53%
Surrey 50,84 7,193 12,815 7,731 152% 73%
Sussex 9,970 16,038 26,672 16,702 168% 64%
Thames Valley 15,227 20,280 40,345 25,118 165% 80%
Warwickshire 3,289 5,472 12,554 9,265 282% 76%
West Mercia 7,096 9,566 17,980 10,884 153% 77%
West Midlands 49,783 58,123 100,002 50,219 101% 83%
West Yorkshire 35,303 44,663 94,294 58,991 167% 84%
Wiltshire 3,780 5,301 9,118 5,338 141% 72%
Total 617,319 825,019 1,368,806 751,487 121.70% 72.36%
Source: ONS, police recorded crime, 1980/81 to 1993/94
Table 1 also reveals some variation. Whilst the majority of forces had very marked burglary increases during the period 1980/81 to 1993/94, the size of this rise (both in volume and percentage terms) does vary. In one force, Merseyside, burglary volumes actually fell.
Graphing the trends in each police force area reveals that the reason for Merseyside’s overall drop in burglary was simply that it had a far earlier peak. Amongst other forces, though the vast majority had peaks between 1992 and 1994, there is still some variation, as Table 2 demonstrates.10
10 The longer version of this paper shows that a similar variation also exists for the two types of vehicle theft.

16 The heroin epidemic of the 1980s and 1990s and its effect on crime trends - then and now
Table 2: Peak year for recorded burglary, by police force area
Police force areas Peak year for recorded
burglary
Merseyside 1986/87
Northumbria 1991/92
Metropolitan Police Service, Greater Manchester Police, Avon and Somerset, Bedfordshire, Cumbria, Dyfed-Powys, Hampshire, North Wales, South Wales,
Sussex, Warwickshire, West Midlands, Wiltshire 1992/93
Cambridgeshire, Cheshire, Derbyshire, Devon and Cornwall, Essex, Gloucestershire, Hertfordshire, Humberside, Lincolnshire, Norfolk,
Northamptonshire, Nottinghamshire, South Yorkshire, Staffordshire, Suffolk, Surrey, Thames Valley, West Mercia, West Yorkshire
1993/94
Leicester, North Yorkshire 1994/95
Cleveland, Dorset, Durham, Kent 1995/96
Lancashire 1996/97
Gwent 1997/98
The variation in the timing of the peaks can also be shown graphically, using the trends in three forces chosen to illustrate this.

17 The heroin epidemic of the 1980s and 1990s and its effect on crime trends - then and now
Figure 6: Police recorded burglaries in three police force areas, 1980 to 1999
Source: ONS, police recorded crime
However, within each police force area, as at the national level, different acquisitive crime types tended to rise and fall together. So although Table 1 focused on burglary, the rises in theft of and from a vehicle were of a similar magnitude, and peaks in these offences were also similar. This pattern is clearly evident in Figure 7 (next page), which shows the trends in the first two forces alphabetically, though it is generally true across most forces (see the longer version of this paper for similar charts for all forces).
0
10,000
20,000
30,000
40,000
50,000
60,000
0
2,000
4,000
6,000
8,000
10,000
12,000
14,000 1
98
0/8
1
19
82
/83
19
84
/85
19
86
/87
19
88
/89
19
90
/91
19
92
/93
19
94
/95
19
96
/97
19
98
/99
North Wales Dorset Merseyside (right axis)

18 The heroin epidemic of the 1980s and 1990s and its effect on crime trends - then and now
Figure 7: Trends in burglary and vehicle crime in two police force areas, indexed to 1988/89
Avon and Somerset Bedfordshire
Source: ONS, police recorded crime
In addition, as Figure 7 shows, peaks at the local level were often very sharp during the early 1990s. In other words – a sharp rise was immediately followed by a sharp fall that became more gradual over time. This was particularly true for the less urban forces, which tended to have almost all their increase in crime focused in just a few years. Table 1 showed this, but it is even clearer in Figure 8 below, which compares the slightly more gradual rises in burglary in the larger metropolitan forces with the sharper ‘spikes’ seen in some of the more rural forces.11
11 Again, the picture is generally similar for vehicle crime – see the longer version of this paper.
0.6
0.8
1
1.2
1.4
1.6
1.8
2
2.2
2.4
2.6
19
88
/89
19
89
/90
19
90
/91
19
91
/92
19
92
/93
19
93
/94
19
94
/95
19
95
/96
19
96
/97
Burglary
Theft of vehicle
Theft from vehicle
0.6
0.8
1
1.2
1.4
1.6
1.8
2
2.2
2.4
2.6
19
88
/89
19
89
/90
19
90
/91
19
91
/92
19
92
/93
19
93
/94
19
94
/95
19
95
/96
19
96
/97
Burglary
Theft of vehicle
Theft from vehicle

19 The heroin epidemic of the 1980s and 1990s and its effect on crime trends - then and now
Figure 8: Burglary trends in selected police forces, 1980/81 to 2000/0112
Note: MPS is the Metropolitan Police Force, and GMP is the Greater Manchester Police.
Source: ONS, police recorded crime
In summary, trends in recorded acquisitive crime at the police force area level show a series of ‘spikes’ that varied in time across areas but tended to feature all the main acquisitive offences within areas and which were particularly sharp in the less urban forces. This analysis raises some important questions about the longer term trends in acquisitive crime.
12 A valid question is whether the apparent discrepancy between urban and rural forces is simply driven by the fact that urban forces had larger crime volumes to start with so rises will look less dramatic in percentage terms. This is explored in more detail in the longer version of the paper, but the point can be made here that even though this is almost certainly a factor, there is also some evidence in Figure 8 that less urban forces had more temporally focused peaks, which may be important for the link to heroin/crack, as explored in chapter 5.
0
50,000
100,000
150,000
200,000
250,000
19
80
/81
19
82
/83
19
84
/85
19
86
/87
19
88
/89
19
90
/91
19
92
/93
19
94
/95
19
96
/97
19
98
/99
20
00
/01
MPS
0
5,000
10,000
15,000
20,000
25,000
30,000
35,000
19
80
/81
19
82
/83
19
84
/85
19
86
/87
19
88
/89
19
90
/91
19
92
/93
19
94
/95
19
96
/97
19
98
/99
20
00
/01
Staffordshire
0
20,000
40,000
60,000
80,000
100,000
120,000
19
80
/81
19
82
/83
19
84
/85
19
86
/87
19
88
/89
19
90
/91
19
92
/93
19
94
/95
19
96
/97
19
98
/99
20
00
/01
GMP
0
2,000
4,000
6,000
8,000
10,000
12,000
14,000
19
80
/81
19
82
/83
19
84
/85
19
86
/87
19
88
/89
19
90
/91
19
92
/93
19
94
/95
19
96
/97
19
98
/99
20
00
/01
Warwickshire

20 The heroin epidemic of the 1980s and 1990s and its effect on crime trends - then and now
- Why did crime in England and Wales rise steadily in the 1980s (with a slight lull from 1987 to 1989) and then increase sharply just after 1990?
- Why did it start falling equally sharply in the mid-1990s and continue to fall despite the recession?
- What factors might explain why the crime decline in England and Wales started later than in some other nations (like the US) but earlier than others (like most eastern European nations)?
- At the local level, why did the timing of acquisitive crime peaks vary and specifically, why did Merseyside peak five years before anywhere else in England and Wales?
- Within police force areas, why did high-volume acquisitive crimes peak together?
- Why was the sharpness of the peak particularly apparent in the non-metropolitan forces, rather than areas like London and Manchester?
Theories for the rise and fall in crime
Many theories have been put forward to explain the trends set out in the previous section. While it is beyond the scope of this paper to examine them all in detail, a brief summary is included here to provide context, but also because it seems likely that ultimately a combination of these factors will be important, possibly to different degrees at different times, and that at times opiate/crack use may have interacted with other drivers of crime in important ways. For brevity, the explanations are grouped under five headings.
Economic explanations
There are essentially two theories of how economic conditions might drive crime trends and they operate in opposite directions. Under the first hypothesis, as a society gets richer crime will go up because there are more goods to steal and more people go out and socialise (and consume alcohol), leading to more violence. Under the second hypothesis, crime goes up instead during times of economic hardship because people have less money so the temptation to steal is greater, and poverty causes antagonism between groups driving up violence.
During the 1990s and early 2000s, it was largely the second hypothesis that held sway in relation to acquisitive crime (see, for example, Field, 1990; Rosenfeld and Fornango, 2007). In particular, the clear rise and then fall in unemployment that occurred in the early 1990s correlated markedly with the sudden spikes in crime, as did the long period of falling crime and benign economic conditions from 1995 to 2008.

21 The heroin epidemic of the 1980s and 1990s and its effect on crime trends - then and now
Figure 9: Comparison between police recorded burglary and unemployment levels, as measured by male claimant count, 1974 to 2010
Sources: ONS, police recorded crime; NOMIS.
Two problems have emerged with this explanation. First, the correlation broke down in the recent recession as Figure 9 shows. Crime continued to decline despite the 2008 fall in gross domestic product (GDP) and rise in unemployment. Secondly, the relationship between crime and the economy, which Figure 9 would suggest is strong during the 1980s and 1990s, does not look nearly so strong when it is analysed at the police force area level.13
Offender-based theories (demographics, abortion and lead)
Another set of theories argue that changes in crime levels have been caused by changes in the stock of offenders (either through general demographics or some other mechanism like changes to abortion laws) or in their propensity to commit crime, for example, because of the degree of lead exposure during childhood (Donohue and Levitt, 2001; Nevin, 2007; Reyes 2007).
These theories have been examined in detail elsewhere. In the current context, it is merely worth noting that, because these theories operate on a generational basis, any rise or fall in crime predicted is likely to be gradual. Changes that affect the stock or propensity of offenders are likely to feed through to crime trends gradually, as new cohorts become less crime prone and previous cohorts slowly age out of offending. As such, these theories do not provide a convincing explanation of the sudden acquisitive crime ‘spikes’ that took place in the mid-1990s in England and Wales.
Criminal justice system theories
Some researchers have linked changes in crime to changes in policing or incarceration levels. Policing-based explanations can be divided into two types:
- those that focus on resources; and
- those that focus on police performance, tactics and techniques.
13 This is explored further in Chapter 5, but briefly, around one-half of police forces areas had a higher unemployment level in the mid-1980s than in the early 1990s, yet every police force area, except Merseyside, had an acquisitive crime peak in the 1990s.
0
200,000
400,000
600,000
800,000
1,000,000
1,200,000
1,400,000
1,600,000
1,800,000
2,000,000 1
97
4
19
76
19
78
19
80
19
82
19
84
19
86
19
88
19
90
19
92
19
94
19
96
19
98
/99
20
00
/01
20
02
/03
20
04
/05
20
06
/07
20
08
/09
20
10
/11
20
12
/13
Police recorded burglary Male claimant count

22 The heroin epidemic of the 1980s and 1990s and its effect on crime trends - then and now
The former is a fairly obvious formulation. If police resources increase, crime might be expected to fall and vice versa. This is unlikely to have caused the turn-around in crime, for the simple reason that the number of police officers was essentially flat through the mid-1990s when crime rose and fell rapidly.14
Changes to police practice have therefore tended to play a bigger role in potential explanations for the decline of crime (Zimring, 2001, 2011; Bandyopadhyay et al., 2012). But here too, it seems unlikely that changes in police tactics drove the sudden crime spikes evident in local-area data. For that to be true, police practice would need to have suddenly worsened and then improved at different times in different areas.
Studies have also explored the link between incarceration levels and crime. For the most part, these have yielded statistically significant but small effects (for a review see Durlauf and Nagin, 2011). Overall, they suggest that increases in the prison population have probably played some role in the decline of crime but that they are unlikely to be the main factor.
Opportunity and security theories (routine activities, changes in the stolen goods market, and security improvements)
These theories suggest that crime will flourish in conditions when it is easy to commit, and diminish when this ease is removed. Under this hypothesis, the long-term rise in burglary can be explained by the increase in female employment, which leaves more houses empty during the day; the rise in shoplifting can be explained by the shift of items to the shop floor where they are more accessible to thieves; and the rise in vehicle theft can be explained by the rising numbers of cars on the road (Ross, 2013).
Similarly, the fall in crime can be explained by security improvements that make offences harder to commit. Car immobilizers are the most studied example, though improved house security has also been cited (Farrell et al., 2011a; Vollaard and van Ours, 2011). Arguably, the biggest weakness of this theory is that, at the turning point of crime, all types of theft offences showed similar trends. It seems unlikely that the opportunity to commit burglary rose and fell at exactly the same time, and so markedly, as it rose and fell for vehicle theft. Supporters of the opportunity hypothesis suggest that there may be knock-on effects that explain this. They argue that by making cars harder to steal, immobilizers may also have prevented burglaries either due to the fact that stolen cars were often used in burglaries or because vehicle crime is frequently a ‘debut offence’ hence its prevention may stop offenders graduating on to other acquisitive crimes. This is certainly a possibility, but hard evidence is lacking. In any case, even these explanations do not appear to offer a reason for the local variations in crime – for example, why Merseyside had an earlier peak.
14 For a chart demonstrating this see the longer version of this paper.

23 The heroin epidemic of the 1980s and 1990s and its effect on crime trends - then and now
Substance abuse theories (drugs and alcohol)
The final set of theories discussed here link changes in crime to changes in the consumption of drugs and/or alcohol. Generally, the evidence on alcohol suggests that it should be considered a potential driver of violence rather than of the acquisitive crimes that have dominated overall trends (Bushman and Cooper, 1990).
So, for the remainder of this report the focus is on the other substance abuse hypothesis: that changes in drug consumption cause changes in crime.

24 The heroin epidemic of the 1980s and 1990s and its effect on crime trends - then and now
3. A historical overview of the spread of heroin in England and Wales
This chapter contains a descriptive account of the heroin epidemic and its influence on the number of opiate/crack users (OCUs) from the late 1970s through to the present day (2013).
The growth in heroin use
Available data and qualitative evidence agree that before the late 1970s heroin was not used widely in the UK and crack was unheard of. Heroin use was confined largely to London and users were mainly middle class and relatively affluent (Parker et al., 1988). One study of 37 users published in The Lancet in 1968 found that they had “little association with crime” (Kosviner et al, 1968).15
This changed in 1977–78 when a new supply route opened up from Iran and Pakistan (Pearson, 1987; Yates, 2002). This made heroin more available and affordable, but equally important was that the ‘new’ product was smoking heroin (Griffiths et al., 1994). This had two crucial effects, both of which probably increased take up:
- potential users put off by injection were no longer faced with that barrier; and
- smoking heroin came with the myth that, unlike the injection-variety, it was non-addictive (Yates, 2002).16
As a result, pockets of heroin use began to be recorded outside London. The main indicator of heroin use at this time was the Addicts Index, a dataset of new and existing dependent illicit drug users reported to the Home Office, largely by general practitioners and other medical institutions.17 Unfortunately it is likely both to lag and under-count the true population because evidence shows users tend not to seek medical help until several years after initiation, and some never do (Millar et al., 2001). However, along with other available indicators, the Addicts Index does give an idea of the scale of the increase in heroin use.
15 See also http://www.ncbi.nlm.nih.gov/pmc/articles/PMC1924404/?page=1 16 The degree to which heroin is addictive is explored to an extent in the longer version of this paper, as part of an attempt to establish how many OCUs cease using each year. In summary, heroin was found to be far from universally addictive – not everyone who tries it becomes a long-term user. But a proportion do become dependent and they can go on using for several decades. 17 The Addicts Index also changed its methodology slightly in 1987, meaning that estimates for the total addicts notified are not strictly comparable before and after this point. This is why throughout this paper the term ‘new heroin addicts’ is used where possible, as this category was not affected by the change.
25 The heroin epidemic of the 1980s and 1990s and its effect on crime trends - then and now
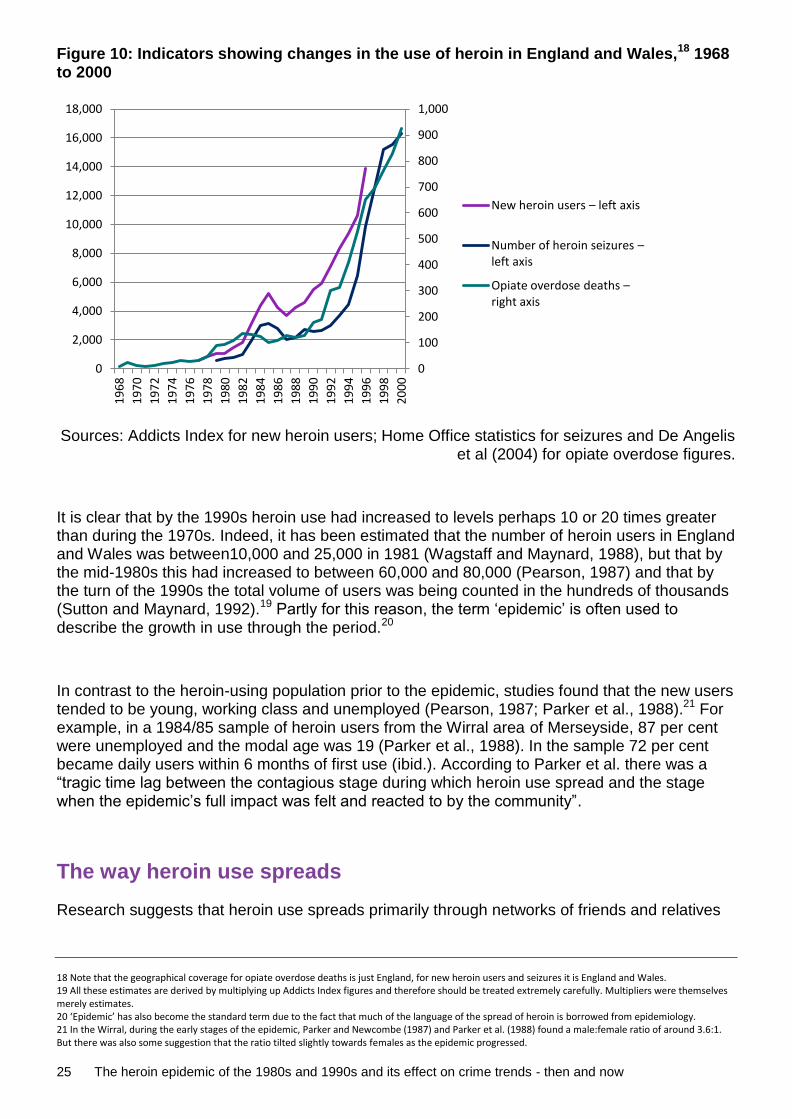
Figure 10: Indicators showing changes in the use of heroin in England and Wales,18 1968 to 2000
Sources: Addicts Index for new heroin users; Home Office statistics for seizures and De Angelis et al (2004) for opiate overdose figures.
It is clear that by the 1990s heroin use had increased to levels perhaps 10 or 20 times greater than during the 1970s. Indeed, it has been estimated that the number of heroin users in England and Wales was between10,000 and 25,000 in 1981 (Wagstaff and Maynard, 1988), but that by the mid-1980s this had increased to between 60,000 and 80,000 (Pearson, 1987) and that by the turn of the 1990s the total volume of users was being counted in the hundreds of thousands (Sutton and Maynard, 1992).19 Partly for this reason, the term ‘epidemic’ is often used to describe the growth in use through the period.20
In contrast to the heroin-using population prior to the epidemic, studies found that the new users tended to be young, working class and unemployed (Pearson, 1987; Parker et al., 1988).21 For example, in a 1984/85 sample of heroin users from the Wirral area of Merseyside, 87 per cent were unemployed and the modal age was 19 (Parker et al., 1988). In the sample 72 per cent became daily users within 6 months of first use (ibid.). According to Parker et al. there was a “tragic time lag between the contagious stage during which heroin use spread and the stage when the epidemic’s full impact was felt and reacted to by the community”.
The way heroin use spreads
Research suggests that heroin use spreads primarily through networks of friends and relatives
18 Note that the geographical coverage for opiate overdose deaths is just England, for new heroin users and seizures it is England and Wales. 19 All these estimates are derived by multiplying up Addicts Index figures and therefore should be treated extremely carefully. Multipliers were themselves merely estimates. 20 ‘Epidemic’ has also become the standard term due to the fact that much of the language of the spread of heroin is borrowed from epidemiology. 21 In the Wirral, during the early stages of the epidemic, Parker and Newcombe (1987) and Parker et al. (1988) found a male:female ratio of around 3.6:1. But there was also some suggestion that the ratio tilted slightly towards females as the epidemic progressed.
0
100
200
300
400
500
600
700
800
900
1,000
0
2,000
4,000
6,000
8,000
10,000
12,000
14,000
16,000
18,000 1
96
8
19
70
19
72
19
74
19
76
19
78
19
80
19
82
19
84
19
86
19
88
19
90
19
92
19
94
19
96
19
98
20
00
New heroin users – left axis
Number of heroin seizures – left axis
Opiate overdose deaths – right axis

26 The heroin epidemic of the 1980s and 1990s and its effect on crime trends - then and now
rather than through the marketing techniques of drug dealers. Nine out of every ten users in the Wirral said that they had first received heroin from a friend or relative, rather than from a dealer (ibid.). This fits the ‘model’ of the take up of heroin developed by Hunt and Chambers (1976) using data from the UK and from the US heroin epidemic more than a decade earlier. They suggested that at the person-to-person level, heroin use spreads via micro-diffusion. A few ‘initiators’ enter a community and pass on their heroin use, through networks of friends, to susceptible individuals. These secondary users then spread heroin to their susceptible friends, and so on. Importantly, what Hunt and Chambers (1976) found was that while initiators can pass on use to many people, secondary users spread heroin to a far smaller number because many of their friends will have already been exposed by the initiator. This means that the number of new users can rise very quickly but also fall equally rapidly, once all the susceptible individuals have been exposed and saturation is achieved. This ‘spike’ in new users (incidence) was evident in data from US epidemics in Chicago (Hughes et al., 1972); and in the district of Columbia, as shown in Figure 11 (Greene and Dupont, 1974).22
Figure 11: Annual incidence of heroin use in the district of Columbia
Source: Greene and Dupont, 1974
A similar pattern occurred in the Wirral. Incidence decreased almost as sharply as it had increased. Parker (2004) found that there were 800 new cases in 1984/85 but this fell to 260 in 1986/87, and to less than 100 by 1990.
US authors also suggested that heroin use spread from the most densely populated urban areas to the less populated surroundings (Hunt and Chambers, 1976). This process, which they labelled macro-diffusion, meant that larger cities were affected first, then smaller cities, then
22 The Hunt and Chambers (1976) model of heroin epidemics is only one possible theory that fits the data and many more have been developed since – for a summary see Caulkins (2005). For this paper, the crucial point is that available data continue to show that, during epidemic periods, numbers of new users rise and fall very sharply and that in some models, the peak in total users is also very sharp (see, for example, Rossi, 2002). In other words, in a given locality, the epidemic trends tend to cause ‘spikes’ in illicit drug use, similar to the ‘spikes’ in crime shown in Chapter 1.
0
0.5
1
1.5
2
2.5
3
3.5
4
4.5
19
60
19
61
19
62
19
63
19
64
19
65
19
66
19
67
19
68
19
69
19
70
19
71
19
72
19
73
Nu
mb
er o
f ca
ses
per
1,0
00
p
op
ula
tio
n

27 The heroin epidemic of the 1980s and 1990s and its effect on crime trends - then and now
towns, and finally rural areas. In addition, they found that once an area had an epidemic, it rarely had another one for 20 years – until there was a new susceptible youth population. Again, there is evidence that the UK epidemic followed a similar pattern. Millar et al. (2001), looking at Greater Manchester, demonstrated both the sharpness of the peak in new users, particularly in the less population-dense suburbs like Bolton, but also that the peak was later there (1992/93) than for Central Manchester (1989/90), see Figure 12.
Figure 12: Estimated trend in new heroin users in Bolton and central Manchester, 1986 to 2000
Bolton
Central Manchester
Source: Millar et al., 2004
Figure 12 shows another pattern seen throughout the Addicts Index data: the spike in opiate/crack use was generally sharper in areas with a single urban centre, like Bolton, rather
0
50
100
150
200
250
300
350
19
86
19
87
19
88
19
89
19
90
19
91
19
92
19
93
19
94
19
95
19
96
19
97
19
98
19
99
20
00
0
50
100
150
200
250
300
350
19
86
19
87
19
88
19
89
19
90
19
91
19
92
19
93
19
94
19
95
19
96
19
97
19
98
19
99
20
00

28 The heroin epidemic of the 1980s and 1990s and its effect on crime trends - then and now
than more sprawling urban locations like London and Central Manchester. The Hunt and Chambers (1976) theory offers a potential explanation: big cities have many urban centres of varying size, which would have been likely to have been affected by the epidemic at different times, giving rise to a more gradual rise and fall in opiate/crack use. But single urban-centre locations like Bolton would have seen a more focused impact.
The two waves of the epidemic
Qualitative research suggests that the UK epidemic occurred in two distinct waves with a lull in the middle, and that (in a slight contradiction of the US model), some areas were affected during both waves (Parker, 2004).23 So whilst parts of London (Hartnoll et al, 1985), the major Scottish cities (Haw, 1985) and other western regions of the British Isles (Parker and Gay, 1987; Fazey, 1991) appeared to follow Liverpool in having an outbreak in the early 1980s, much of the country remained relatively free of heroin until a second wave in the 1990s.24 The data – see Figure 10 above – also support the notion of two waves. There is an initial peak in all three national drugs indicators, followed by a slight lull, before a second, far higher peak.
Parker (2004) identified three types of area:
- those that only had a heroin surge during the first phase of the epidemic;
- those that only had a surge in the second phase; and
- those that had surges in both periods.
Parker concluded that Merseyside fitted into the first of these categories and this is supported by the Addicts Index data. They show that Merseyside was alone in having a decreasing number of new heroin users by the 1990s. It is not known definitively why Merseyside was the only area to escape a second heroin surge, but there are perhaps two possible theories.
- Merseyside was one of the first areas to be affected, so it is possible that the epidemic had simply run its course before the second wave started.
- Merseyside (particularly its main city Liverpool) was the first area to pioneer a ‘harm reduction’ response to heroin (O’Hare, 2007). It is possible that this strategy, which focused on methadone maintenance and the referral of arrestees to treatment, may have brought the epidemic to a swifter end.25
Of the other police force areas, some, like Greater Manchester, saw surges in heroin use in both epidemic waves, but many were only affected during the second wave. Parker et al. (1998)
23 This depends, of course, on the geographic granularity. For the most part this review uses police force area level data, which is a high-level data source. It is possible that the US model is correct and different local areas within each force were hit in different waves. 24 Possible reasons for the two-wave structure are briefly explored in the long version of this paper. 25 The same paper (http://www.canadianharmreduction.com/sites/default/files/Merseyside%20-%20Early%20Hx%20of%20HR%20-%202007.pdf) also claims that the early adoption of a harm reduction approach in Merseyside meant that “an HIV epidemic did not happen amongst injecting drug users in Mersey”.

29 The heroin epidemic of the 1980s and 1990s and its effect on crime trends - then and now
use an Addicts Index map of the UK in 1989 to show that large parts of England and Wales remained largely unaffected by heroin at this point.26 But their map had changed by the mid-1990s, following a survey of police forces and drug action teams. With the exception of Staffordshire, Gloucestershire, Kent, Dorset and North Wales all police forces in England and Wales that returned data reported having, or in Merseyside’s case having had, a heroin outbreak. Furthermore, the Addicts Index data (see Figure 13) suggest that the survey responses from the exception areas possibly reflected a lack of awareness of a newly emerging epidemic, rather than no epidemic at all.
Figure 13: Trends in total heroin users reported to the Addicts Index, in the five forces that did not report an epidemic in Parker et al. (1998), 1987 to 1996
Source: Addicts Index
In summary, whilst the first wave seemed to affect Merseyside and a few other western parts of the country, by the time of the second wave, the heroin epidemic was a national phenomenon.
It was also during the second wave that crack use started to feature. A study by Gossop et al. (1994) found that before 1987, cocaine use was generally confined to powder cocaine ingested intra-nasally. But from 1987 a growing number of crack smokers began to emerge. However, most evidence suggests that these crack users were existing heroin users diversifying their drug use rather than totally new users (see, for example, Hope et al., 2005). Hence, unlike in the US, England and Wales did not really experience a separate crack epidemic, but an extension or diversification of the existing heroin epidemic.27 This is why, throughout this paper, then, OCUs are grouped together and the term OCU (opiate/crack user) is used to describe them.
26 Though see discussion of lag on Addicts Index data below. 27 Even in the US, evidence suggests that many crack users were existing heroin users diversifying their drug misuse. However, there is little doubt that crack markets became more established in the US, with two important effects. Firstly, this probably resulted in the creation of more new users (i.e. those who initiated with crack, rather than diversified from heroin), but also the intense competition between suppliers in the market, particularly at the street-level, almost certainly had a greater impact on levels of violence than occurred in the UK. This is explored further in the long version of this paper.
0
100
200
300
400
500
600
700
800
900
1987 1988 1989 1990 1991 1992 1993 1994 1995 1996
Staffordshire
North Wales
Kent
Gloucester
Dorset
30 The heroin epidemic of the 1980s and 1990s and its effect on crime trends - then and now
The epidemic peak and the cohort today
Determining the national peak of the epidemic is not easy. The Addicts Index was still showing a rise in new and total users in 1996, but as already noted this is likely to lag the true situation by at least two to three years, and after 1996 the index was discontinued. There was then no standardized measure of OCU volumes until the annual estimates (Hay et al., 2006; 2012) began in the mid-2000s. These suggest that the total number of OCUs has fallen at an average rate of around 2.5 per cent per year since 2004/05. Taken on their own then, these series suggest that the peak was probably somewhere between 1993 and 2004 but do not allow for more precision than that.28
The situation is further complicated by the fact that there are two ways of measuring the peak. It might be regarded as the point at which the number of new users stopped increasing and started to decline, or the point at which the number of total users started falling, which, in theory, could have been a number of years later.
For new users, De Angelis et al. (2004), using a variety of models that work backwards from drug overdose deaths to estimate the year of first use, concluded that the peak probably occurred around 1996 in England and Wales.29 Similarly Frischer et al. (2009), using longitudinal data from the General Practice Research database, suggested that the number of new and total OCUs under the age of 25 was falling from 1998.
Though the epidemic may have been past its peak by the turn of the century, the speed at which new and total users fell was probably quite different. As was visible at the local level, volumes of new users tend to decrease very quickly once all susceptible individuals have been ‘exposed’ in an area. By contrast the number of total users – as the Hay et al. (2006; 2012) estimates suggest – have probably declined far more slowly. This is due to the fact that, whilst some users manage to quit opiate/crack use relatively quickly (Kaya et al., 2004; Sweeting et al., 2009), a proportion of individuals continue to use these drugs for decades after initiation, often cycling in and out of treatment services and periods of cessation and relapse during this time (Darke and Hall, 2003; Hamilton and Grella, 2009).
Both the Hay et al. (2012) estimates and the Drugs Data Warehouse (DDW)30 agree that by the late 2000s, the OCU cohort had an average age of around 35. Yet the average age of initiation is around 18 to 20; and only about 3 per cent of OCUs start using opiates/crack over the age of 35 (Donmall and Jones, 2005). This therefore provides further evidence that new OCUs were sparse by the late 2000s, that the epidemic was well past its peak at this point and that today’s population of OCUs are still, in all likelihood, dominated by those who began use during the epidemic period.
A final conclusion follows logically from this. If there were around 300,000 OCUs in the late-2000s, as suggested by the Hay et al. (2006) estimates, but the epidemic was well past its peak at this point, then at the peak, the total number must have been higher.
28 This paper does not graph the number of OCUs over time using its two main data sources – the Addicts Index and the Hay et al. estimates. Doing this would have made it appear that the numbers of OCUs must have continued to increase dramatically during the gap between the two series. The evidence presented in this paper (particularly the age breakdown of the current cohort) suggests that this conclusion, which may have led many to reject opiate/crack use as a partial cause of the crime drop, is almost certainly wrong. The difference in magnitude between the two series is due to the under-counting of the Addicts Index, not because the trend continued to increase. Figure 23 hopefully gives a better view of the true trend in OCUs. It is an attempt to model this trend. However, please note that this modelling is highly exploratory and encompasses a number of necessary assumptions that are open to challenge. 29 A study by Sutton et al (2004) also looks at incidence levels nationally, but only of injecting users. It concluded that initiation peaked in the early 1980s and remained stable through to the mid-1990s before declining. Though this pattern does not seem to agree with much of the rest of the evidence, it does at least tally with the conclusions presented here in the sense that incidence was almost certainly falling by the late 1990s. 30 The Drugs Data Warehouse is a Home Office database that has linked anonymised information for over 1 million drug-misusing individuals identified either within the criminal justice system and/or through contact with drug treatment services between 1 April 2005 and 31 March 2009. See Millar et al (2012).

31 The heroin epidemic of the 1980s and 1990s and its effect on crime trends - then and now
4. The relationship between crack/opiate use and crime
Central to the analysis in this paper is the question of whether opiate/crack use causes acquisitive crime. To examine this, a review of international research was conducted, with the aim of identifying all studies in which offending levels among cohorts of opiate/crack users (OCUs) were measured. This identified 36 relevant studies, which are summarised in appendix 4 in the longer version of this paper.
Generally the studies were consistent on a number of points.
- It is clear that, overall, illicit drug users have higher odds of offending than those who don’t use illicit drugs. A meta-analysis of 30 studies showed that the odds of offending were between 2.8 and 3.8 times greater for illicit drug users (Bennett et al., 2008).
- Studies that measured self-reported offending amongst OCUs (whether from a treatment, criminal justice system or community setting) generally reported very high numbers of offences – certainly high enough to impact national-level crime trends. For example, from a sample of 384 arrested heroin users in Baltimore, 243 males had on average committed more than 2,000 offences per individual per year for the previous 11 years (Ball et al., 1983).
- Apart from drug dealing (and prostitution amongst female OCUs) the most common crimes were theft offences. For instance, a sample of 1,075 treatment seekers from across England and Wales recruited for the National Treatment Outcome Research Study (NTORS), 87 per cent of whom were heroin users, self-reported 27,787 theft offences in the previous 3 months, an average of 26 per person (Stewart et al., 2000). In a smaller study of 210 illicit drug users in Scotland recruited from community settings, injecting opioid users admitted committing theft on 108 days per year on average (Hammersley et al., 1989). In volume terms, shoplifting stood out as the most common crime type, but cohorts generally reported a wide variety of theft-type crimes, including burglary, vehicle theft and robbery.
- Virtually all studies agreed that a few individuals committed the bulk of offences. Or to put it another way, many OCUs commit little or no crime.31 For example, in the NTORS sample, 75 per cent of crimes were committed by 10 per cent of the sample and 50 per cent reported no acquisitive crime at all.32 Another area of general agreement was that a
31 This point becomes even starker if the category is restricted to ‘acquisitive crimes’. Many OCUs seem to be able to fund their illicit drug use through a combination of legal means and dealing. 32 This is important for the modelling of OCU crime carried out later in this paper. Without exception studies find that there are always a few OCUs, within any given cohort, who commit very high numbers of crimes. This drags up the average offending rate for the cohort as a whole and means that the average is a poor predictor for the majority of OCUs (who will have far lower offending rates). But the fact that across time and geography there consistently seems

32 The heroin epidemic of the 1980s and 1990s and its effect on crime trends - then and now
high proportion (though, importantly, not all) of the OCUs who offend at high rates began their criminal careers before opiate/crack initiation. Hence drug misuse did not cause the onset of offending for these individuals.33
These facts – which are generally agreed – present something of a puzzle. On the one hand, OCUs seem to commit very large numbers of thefts and the need to fund their habit seems an obvious explanation. But on the other hand, it is clearly possible for some individuals to be OCUs without committing (acquisitive) crime and many of those who do were already offenders beforehand. Hence the main area of disagreement between the studies: whether opiate/crack use actually causes the crime committed by OCU cohorts.
In theory there are three ways to explain the fact that cohorts of OCUs seem to commit very large amounts of crime:
- Illicit drug use causes crime;
- crime causes illicit drug use;
- a third factor causes both.
In a 2009 paper Bennett and Holloway looked at the first two of these options. They summarised all the different ways in which 41 offenders reported that drugs (including alcohol) were involved in their offending. They identified 77 different drug-crime connections (incidences where offenders self-reported a link between a particular drug type and a particular crime type) and they then coded these to either drugs-cause-crime explanations or crime-causes-drugs explanations. The main mechanisms are summarised below.
Drugs cause crime34
Psychopharmacological: Crime occurs when the use of drugs results in change or impairment in cognitive functioning.35
Economic-compulsive: Individuals commit acquisitive crime in order to buy drugs.
Systemic: Because buying and selling drugs is a lucrative but illegal activity, offending often surrounds those who take part in it. So drugs markets can give rise to violence between dealers competing over territory, or to theft of drugs/money by potential buyers or sellers in the system.
Crime causes drugs
Psychopharmacological: Individuals take drugs to find the courage to commit an offence.
Surplus proceeds of crime spent on drugs: Some offenders report that they bought and consumed opiates and crack as rewards for committing a particularly lucrative offence.
The findings revealed that almost 90 per cent of the narratives were classified as drug-causes-crime, with the economic motive being by far the most important individual mechanism, accounting for 56 per cent of the narratives (ibid.). Despite this, the authors found that it was
to be these high-rate offending outliers, means that the average offending rate can be applied to aggregated cohorts of OCUs over time. 33 An important point here is that although the exact proportion of those whose offending starts after opiate/crack use varies by study, it is above zero in every study. Hence for a proportion of every OCU cohort there will be a group of individuals for whom the causal link between drugs and crime appears far stronger from this perspective. See the longer version of the paper for more on this. 34 These categories are taken from Goldstein (1985). Bennett and Holloway (2009) prefer the term ‘lifestyle’ and argue that many of the categories can be split into both drugs-causing crime and crime-causing drugs narratives. 35 Bennett and Holloway (2009) note that this process can also follow a crime-causes-drugs connection if individuals take drugs to find the courage to commit an offence.

33 The heroin epidemic of the 1980s and 1990s and its effect on crime trends - then and now
often very difficult to say in which direction the causality lay, and that criminality and drug misuse often seemed to mutually reinforce each other.
Even so, their findings are generally mirrored across other self-report studies. For example, in the NEW-ADAM study of arrestees, 83 per cent of offenders who said that their drug misuse and offending were linked said the connection was that they needed money to buy drugs. The psychopharmacological (drug-causes crime) explanation was the second most popular, with 27% of those who saw a connection citing this. Just 8% said that they used the money from crime to buy drugs and hence that crime drove drug use rather than vice versa (Bennett and Holloway, 2004). The only exceptions that could be located were studies that looked at younger OCUs (aged 14-20), who tended to report that a smaller proportion of offences were committed to finance opiate/crack use (Johnson et al., 1991).
The findings from cross-sectional regression analyses are also somewhat split along youth/adult lines. In a UK context, two studies by Hammersley et al. (1989; 1990) using cohorts of Scottish OCUs with a mean age of just 15 years, offered perhaps the strongest challenge to the causal link between heroin/crack use and crime. They found that: “(non-drug) crime explained opioid use better than opioid use explained (acquisitive) crime”. Coid et al. (2000), who found conflicting results, pointed out that for very young cohorts it is possible that the crime-causes-drugs relationship may be stronger but that this would reverse in adulthood once regular use became cemented and crime became a necessity to finance it. However, a more recent paper, using data from English OCUs with a mean age of 32, suggests that the Hammersley et al. findings are mirrored in adult cohorts (Hayhurst et al., 2012). Although median drug spend over a four-week period was £910.50 amongst the acquisitive crime offenders and £240 among non-offenders, the link between drug spend and crime was weak once other factors (like poly-drug misuse) were controlled for.
Klee and Morris (1994) also question the strength of the causal relationship, taking a different approach. They found a very high level of offending amongst young heroin users, in line with other studies, but they found an almost equally high level of offending amongst an otherwise similar cohort of amphetamine users, even though amphetamines are far cheaper, which meant that this group spent much less on drugs. Like Hammersley et al. (1989; 1990) they concluded that the direct need to finance use did not seem to be the main explanation for offending, and hence an underlying third factor causing both crime and drug use was more important. Arguably though, the strongest methodological approach for isolating causality comes from longitudinal studies. This is because, even if a third factor (or combination of factors) does make people both more likely to commit crime and take opiates/crack, it is still possible for drugs to cause additional offences if the drug-taking accelerates the frequency of offending, or extends the criminal career. The evidence from the few longitudinal studies that have been undertaken suggests this is the case.36
These studies are examined in more detail in the longer version of this paper but here the point can be made by referring to Ball et al.’s (1983) study, which followed 354 regular heroin users in Baltimore through periods of addiction and non-addiction. They found that heroin addicts tend to cycle in and out of addiction after onset, and that their criminality declined dramatically when not addicted, (Figure 14).
36 Unfortunately, as made clear in Chapter 1, the longitudinal studies that have been done are exclusively retrospective. This means that bias cannot be ruled out. It is possible that short-duration, less crime-prone users may have been excluded and that this inflates the drugs-causes-crime implications of the studies. In relation to this though, it should be noted that the same bias almost certainly exists in calculations of the size of the cohort – i.e. by necessity, treatment and criminal justice system datasets were used to construct these estimates, meaning that the potential hidden population of more benign users will almost certainly be largely excluded from these also. In other words, although this bias may affect the view of the OCU cohort as a whole – and as a result it should be emphasised again that not all OCUs are alike and many probably use these drugs and quit without recourse to acquisitive crime – it may not statistically significantly bias estimates for the total volume of crime committed by the cohort (in Chapter 6), as long as the ‘hidden’ population is excluded both from the offending rate calculations and from the cohort-size figures.
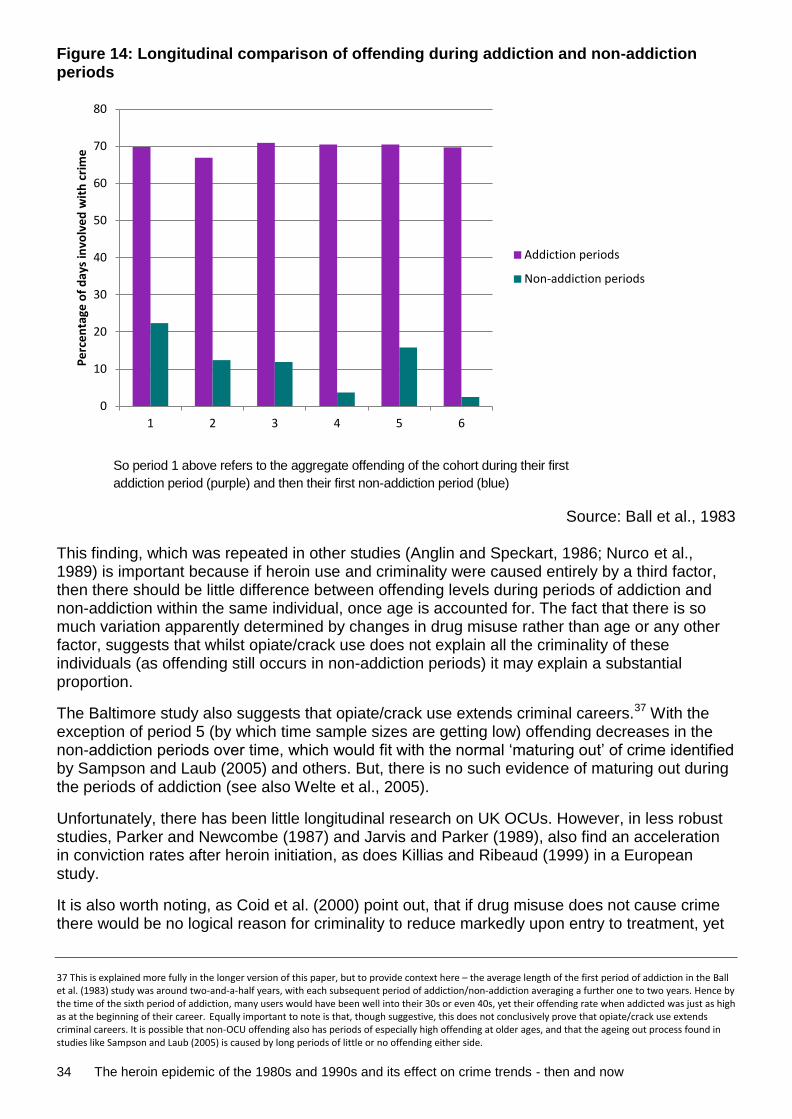
34 The heroin epidemic of the 1980s and 1990s and its effect on crime trends - then and now
Figure 14: Longitudinal comparison of offending during addiction and non-addiction periods
So period 1 above refers to the aggregate offending of the cohort during their first
addiction period (purple) and then their first non-addiction period (blue)
Source: Ball et al., 1983 This finding, which was repeated in other studies (Anglin and Speckart, 1986; Nurco et al., 1989) is important because if heroin use and criminality were caused entirely by a third factor, then there should be little difference between offending levels during periods of addiction and non-addiction within the same individual, once age is accounted for. The fact that there is so much variation apparently determined by changes in drug misuse rather than age or any other factor, suggests that whilst opiate/crack use does not explain all the criminality of these individuals (as offending still occurs in non-addiction periods) it may explain a substantial proportion.
The Baltimore study also suggests that opiate/crack use extends criminal careers.37 With the exception of period 5 (by which time sample sizes are getting low) offending decreases in the non-addiction periods over time, which would fit with the normal ‘maturing out’ of crime identified by Sampson and Laub (2005) and others. But, there is no such evidence of maturing out during the periods of addiction (see also Welte et al., 2005).
Unfortunately, there has been little longitudinal research on UK OCUs. However, in less robust studies, Parker and Newcombe (1987) and Jarvis and Parker (1989), also find an acceleration in conviction rates after heroin initiation, as does Killias and Ribeaud (1999) in a European study.
It is also worth noting, as Coid et al. (2000) point out, that if drug misuse does not cause crime there would be no logical reason for criminality to reduce markedly upon entry to treatment, yet
37 This is explained more fully in the longer version of this paper, but to provide context here – the average length of the first period of addiction in the Ball et al. (1983) study was around two-and-a-half years, with each subsequent period of addiction/non-addiction averaging a further one to two years. Hence by the time of the sixth period of addiction, many users would have been well into their 30s or even 40s, yet their offending rate when addicted was just as high as at the beginning of their career. Equally important to note is that, though suggestive, this does not conclusively prove that opiate/crack use extends criminal careers. It is possible that non-OCU offending also has periods of especially high offending at older ages, and that the ageing out process found in studies like Sampson and Laub (2005) is caused by long periods of little or no offending either side.
0
10
20
30
40
50
60
70
80
1 2 3 4 5 6
Pe
rce
nta
ge o
f d
ays
invo
lve
d w
ith
cri
me
Addiction periods
Non-addiction periods

35 The heroin epidemic of the 1980s and 1990s and its effect on crime trends - then and now
evidence suggests that it does (see, for example, Killias and Ribeaud, 1999; Killias et al, 2000; Bukten, 2012).
Two tentative conclusions emerge from the evidence presented.
- Regardless of the causality question, the large change in the number of OCUs over the last 35 years and the strong evidence of their high aggregate rate of offending means that the cohort itself is likely to have played a role in the rise and fall of crime, even if most of the offending was ultimately driven by a third factor.
- Opiate/crack use is likely to be causally related to crime to a degree, though the magnitude remains uncertain. For the group who start offending in line with or after initiation into regular opiate/crack use, this seems clear, but even for those whose offending preceded drug misuse, studies suggest that opiate/crack use would be likely to have accelerated their offending and extended their criminal career to some extent, which would cause additional offending in the aggregate.
If the above observations are correct (and this paper accepts that there is certainly some conflicting evidence) then some correlation between opiate/crack use and acquisitive crime should be evident at the local/national and international level. This is examined in the next chapter.

36 The heroin epidemic of the 1980s and 1990s and its effect on crime trends - then and now
5. The relationship between opiate/crack use and crime locally, nationally and internationally
This chapter examines how the marked changes in the opiate/crack user (OCU) population outlined in Chapter 3 might help to explain some of the crime trends identified in Chapter 2. To start with, some qualitative similarities are drawn out.
- The rise in recorded acquisitive crime had two phases: gradual growth in the early 1980s; and faster growth in the early 1990s. In the middle, there was a slight crime fall from around 1986 to 1988. Opiate/crack indicators also suggest a two-wave pattern with closely matching dates and a greater overall increase in OCUs in the second wave.
- Crime data show that within areas, different types of acquisitive crime rose and fell together. This would be expected if opiate/crack use were a driving factor, as OCUs report a wide variety of theft-type crimes.
- Geographic variation in crime between areas appears to match geographic variation in opiate/crack use. This is tested more formally later in this chapter, but the clearest example is Merseyside, which had a crime peak around five years before anywhere else and which was also one of the first areas to be affected by the heroin epidemic and certainly the first area to be free of it.
- The police force level recorded crime analysis showed that for many areas, the increase in crime was not gradual but a ‘spike’. Evidence from epidemic studies suggests that the number of new heroin users also tends to ‘spike’ in a given locality. A valid question is why crime might have more closely followed the trend in new users rather than the trend in total users, which may not have ‘spiked’ to the same degree. A possible reason is that at the peak in new users, a very high proportion of the OCU population (by definition) will be in the first period of addiction, and hence would be likely to be committing crime at a high rate on aggregate. But even a year or two later, many OCUs who started at or just before the peak will have either quit (there is some evidence that the highest exit rates occur in the early years, Sweeting et al., 2009) or started to cycle in and out of treatment/addiction/non-addiction. Overall crime would therefore be expected to decline swiftly until the entire cohort reached this ‘cycling’ phase, when the decline would flatten again.38
- The crime data showed that the rise and fall in crime were not driven by just a few large
areas. Instead, every police force area was affected. The Addicts Index data suggest that the same is true for the heroin epidemic. By the mid-1990s it had spread to most, if not
38 This brief explanation generalises what is almost certainly a far more complex process – and this is explored in more depth in the longer version of this paper.
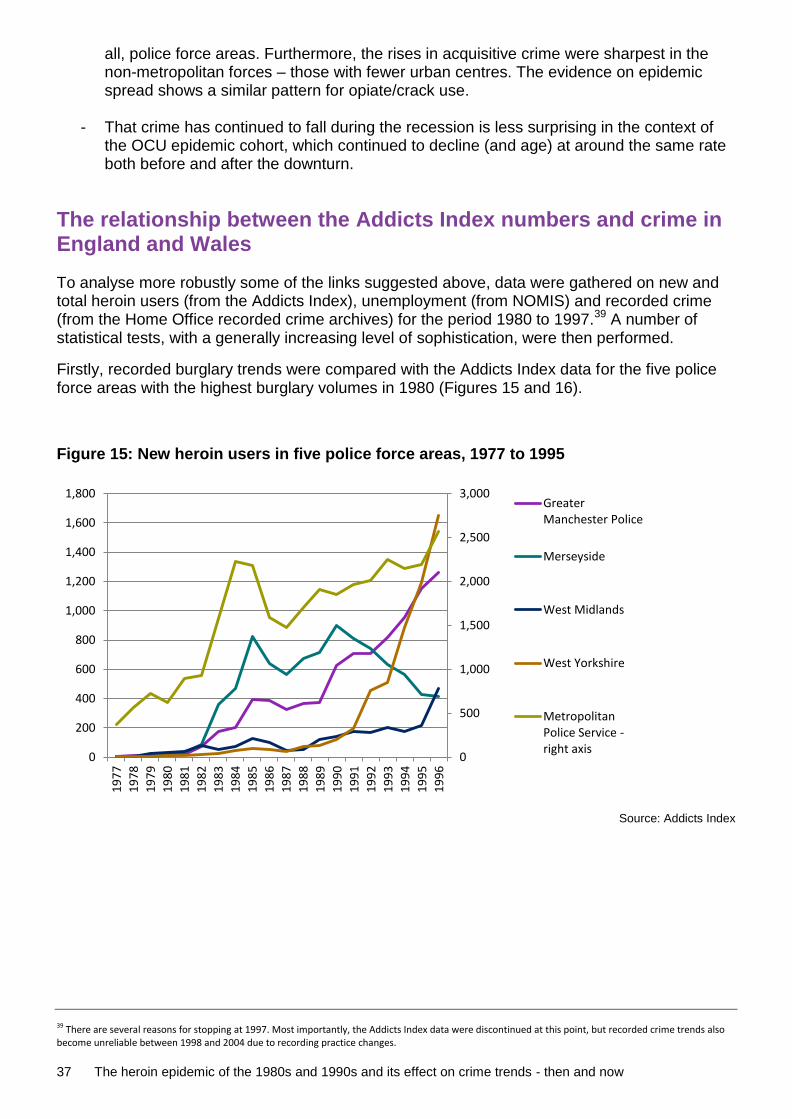
37 The heroin epidemic of the 1980s and 1990s and its effect on crime trends - then and now
all, police force areas. Furthermore, the rises in acquisitive crime were sharpest in the non-metropolitan forces – those with fewer urban centres. The evidence on epidemic spread shows a similar pattern for opiate/crack use.
- That crime has continued to fall during the recession is less surprising in the context of the OCU epidemic cohort, which continued to decline (and age) at around the same rate both before and after the downturn.
The relationship between the Addicts Index numbers and crime in England and Wales
To analyse more robustly some of the links suggested above, data were gathered on new and total heroin users (from the Addicts Index), unemployment (from NOMIS) and recorded crime (from the Home Office recorded crime archives) for the period 1980 to 1997.39 A number of statistical tests, with a generally increasing level of sophistication, were then performed.
Firstly, recorded burglary trends were compared with the Addicts Index data for the five police force areas with the highest burglary volumes in 1980 (Figures 15 and 16).
Figure 15: New heroin users in five police force areas, 1977 to 1995
Source: Addicts Index
39 There are several reasons for stopping at 1997. Most importantly, the Addicts Index data were discontinued at this point, but recorded crime trends also become unreliable between 1998 and 2004 due to recording practice changes.
0
500
1,000
1,500
2,000
2,500
3,000
0
200
400
600
800
1,000
1,200
1,400
1,600
1,800
19
77
19
78
19
79
19
80
19
81
19
82
19
83
19
84
19
85
19
86
19
87
19
88
19
89
19
90
19
91
19
92
19
93
19
94
19
95
19
96
Greater Manchester Police
Merseyside
West Midlands
West Yorkshire
Metropolitan Police Service - right axis

38 The heroin epidemic of the 1980s and 1990s and its effect on crime trends - then and now
Figure 16: Recorded burglary in five force areas, 1980/81 to 1996/97
Source: ONS, police recorded crime
Figure 15 shows that Merseyside, having seen a marked increase in new users notified to the Addicts Index in the mid-1980s, had a declining trend by the 1990s. Of these areas then, it is the only one that might be considered to have been affected by just the first epidemic wave. London and Manchester were clearly affected by both waves, while West Yorkshire (and to a lesser extent West Midlands) were only affected by the second wave.
Figure 16 shows this pattern is generally mirrored in the acquisitive crime data (represented here by burglary). Merseyside has a large burglary rise in the 1980s but nothing in the 1990s. Areas affected by both waves (London and Manchester) saw rises in both phases, and areas affected only by the second wave (West Yorkshire) had only moderate growth in crime in the 1980s, but then had a huge increase in the 1990s. Arguably the one area that does not quite fit the pattern is the West Midlands, which has a lower level of new users throughout, yet has quite marked increases in burglary in both waves.
The next set of analyses looked at the correlation between crime and opiate/crack use in all 42 police forces, rather than just the 5 forces in Figures 15 and 16.40 A series of correlation coefficients were calculated for all forces for the period 1983 to 1996. For the opiate/crack use variables, new heroin users and total addicts notified were used. And for the crime variables, burglary, theft of vehicle and theft from vehicle were tested. Also, given the high degree of correlation at the national level (see Figure 9), coefficients for the correlation between unemployment and these crime types were also produced.
In each case, four variations were tried to see if relationships were robust.
40 The City of London was excluded due to its (small) size, and British Transport police was also left out – not being a geographical force, it does not have an OCU population as such.
0
50,000
100,000
150,000
200,000
250,000
0
20,000
40,000
60,000
80,000
100,000
120,000 1
98
0/8
1
19
81
/82
19
82
/83
19
83
/84
19
84
/85
19
85
/86
19
86
/87
19
87
/88
19
88
/89
19
89
/90
19
90
/91
19
91
/92
19
92
/93
19
93
/94
19
94
/95
19
95
/96
19
96
/97
Greater Manchester Police
Merseyside
West Midlands
West Yorkshire
Metropolitan Police Service - right axis

39 The heroin epidemic of the 1980s and 1990s and its effect on crime trends - then and now
- In the first variation police forces were ranked for every year, by their levels of crime, OCUs and unemployment. A Pearson correlation coefficient was then calculated based on these ranks, across all years and for all forces.
- The second variation used volumes of crimes/OCUs/unemployed rather than ranks. - The third variation also used volumes but excluded the Metropolitan Police Service as it
generally had markedly higher levels for all three variables, which may skew the correlation.
- Finally, for the same reason, a fourth variation that excluded several more outliers was performed (see the longer version of this paper for details). The results are shown in Table 3.
Table 3: Correlation coefficients between acquisitive crimes and opiate/crack users and
unemployment across all police forces41, 1983 to 1986
Correlation coefficients
All addicts notified
New heroin users
Un-employment
Burglary
ranks 0.69*** 0.61*** 0.14**
volumes (all) 0.79*** 0.84*** 0.92***
volumes (exc. London) 0.54*** 0.61*** 0.85***
volumes (exc. other outliers) 0.49*** 0.47*** 0.85***
Theft of vehicle
ranks 0.66*** -0.10* 0.02
volumes (all) 0.74*** 0.81*** 0.88***
volumes (exc. London) 0.55*** 0.58*** 0.77***
volumes (exc. other outliers) 0.44*** 0.41*** 0.75***
Theft from
vehicle
ranks 0.72*** 0.63*** 0.11**
volumes (all) 0.80*** 0.84*** 0.90***
volumes (exc. London) 0.55*** 0.61*** 0.81***
volumes (exc. other outliers) 0.51*** 0.49*** 0.81***
Note: *** = statistically significant at 0.1 per cent level.
** = statistically significant at 1 per cent level.
* = statistically significant at 5 per cent level.
Sources: Addicts Index; police recorded crime, NOMIS
Table 3 suggests that there is a potentially strong relationship between both the OCU variables and acquisitive crime and between unemployment and acquisitive crime. However, whereas the OCU variables were robust to all specifications (with the exception of the rank correlation
41 Excluding City of London and British Transport Police.
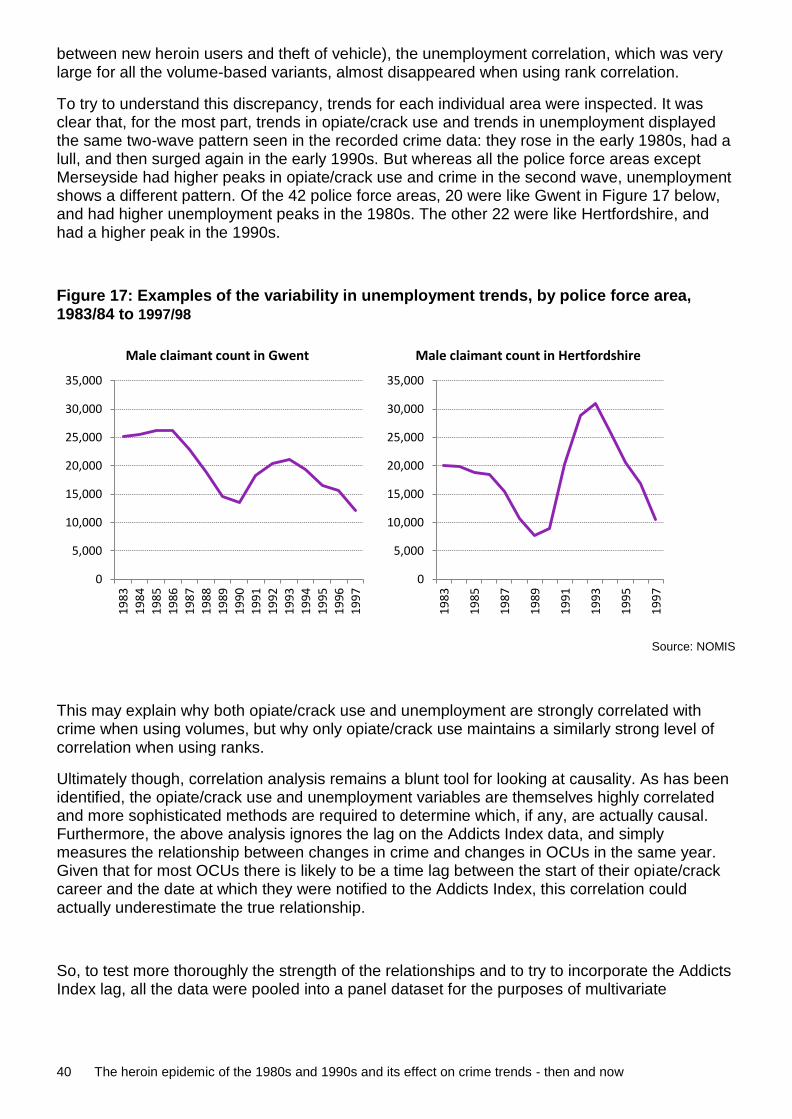
40 The heroin epidemic of the 1980s and 1990s and its effect on crime trends - then and now
between new heroin users and theft of vehicle), the unemployment correlation, which was very large for all the volume-based variants, almost disappeared when using rank correlation.
To try to understand this discrepancy, trends for each individual area were inspected. It was clear that, for the most part, trends in opiate/crack use and trends in unemployment displayed the same two-wave pattern seen in the recorded crime data: they rose in the early 1980s, had a lull, and then surged again in the early 1990s. But whereas all the police force areas except Merseyside had higher peaks in opiate/crack use and crime in the second wave, unemployment shows a different pattern. Of the 42 police force areas, 20 were like Gwent in Figure 17 below, and had higher unemployment peaks in the 1980s. The other 22 were like Hertfordshire, and had a higher peak in the 1990s.
Figure 17: Examples of the variability in unemployment trends, by police force area, 1983/84 to 1997/98
Source: NOMIS
This may explain why both opiate/crack use and unemployment are strongly correlated with crime when using volumes, but why only opiate/crack use maintains a similarly strong level of correlation when using ranks.
Ultimately though, correlation analysis remains a blunt tool for looking at causality. As has been identified, the opiate/crack use and unemployment variables are themselves highly correlated and more sophisticated methods are required to determine which, if any, are actually causal. Furthermore, the above analysis ignores the lag on the Addicts Index data, and simply measures the relationship between changes in crime and changes in OCUs in the same year. Given that for most OCUs there is likely to be a time lag between the start of their opiate/crack career and the date at which they were notified to the Addicts Index, this correlation could actually underestimate the true relationship.
So, to test more thoroughly the strength of the relationships and to try to incorporate the Addicts Index lag, all the data were pooled into a panel dataset for the purposes of multivariate
0
5,000
10,000
15,000
20,000
25,000
30,000
35,000
19
83
19
84
19
85
19
86
19
87
19
88
1
98
9
19
90
19
91
19
92
19
93
19
94
19
95
19
96
19
97
Male claimant count in Gwent
0
5,000
10,000
15,000
20,000
25,000
30,000
35,000
19
83
19
85
19
87
19
89
19
91
19
93
19
95
19
97
Male claimant count in Hertfordshire

41 The heroin epidemic of the 1980s and 1990s and its effect on crime trends - then and now
analysis.42 The panel dataset for 42 police forces43 in England and Wales contained:
- police recorded crime volumes from 1981 to 1996 for burglary, theft of vehicle and theft from vehicle;
- new heroin users from 1981 to 1996 (from the Addicts Index); - total addicts notified from 1987 to 1996 (from the Addicts Index);44 - unemployment by area from 1983 to 1996 (from NOMIS);45 - total population in each area from 1983 to 1996 (from NOMIS).
The primary aim of the analysis was to estimate the relationship between the number of OCUs and crime, which can be expressed as a regression equation:
CRit = αit + β1Hit + β2COit + ηFi +γTt + εit where
CR represents crime (burglaries, theft of vehicles or theft from vehicles);
α represents a constant;
H represents OCUs (either total heroin users or new heroin users as notified in the Addicts Index);46
CO represents a vector of control variables;
F is a vector of police force level fixed effects;
T is a vector of annual time dummies;
ε is a random error term following a normal distribution with mean zero and standard variation σ^2; and
the subscripts i and t represent the variation by area and time respectively. This analysis uses two control variables. The first is unemployment. The previous section showed that both numbers of OCUs and volumes of unemployed had strong individual correlations with crime. This multivariate analysis goes a stage further – it gives the effect of, for example, an extra new heroin user, holding unemployment constant. By controlling for the other variable in this way, it should provide a better idea of which was the more important causal factor. Initial analysis – see the longer version of this paper– suggested that both the volume and rate of unemployment should be tested. In the final results just one was included, whichever showed the greater statistical significance.47 The second control variable tested was demographics. This included the total volume of people in each police force area throughout the period. However, initial regressions showed that this variable had no statistically significant effect, so it was removed from the final results.48 It would have been preferable to test further control variables, but data for this time period, at the required geographical level, were not available. However, there is reasonable confidence
42 A detailed account of the methodology for this section can be found in the long version of this paper 43 Again, the City of London and British Transport police were excluded. 44 Total heroin users were taken from 1987 rather than earlier because there was a break in the series between 1986 and 1987 – see the long version of this paper. 45 The unemployment variable used was actually a close proxy, total claimant count, as this was the only unemployment variable available throughout the period with sufficient geographic granularity. 46 As the interest is in the relationship between total OCUs and crime, total heroin users is the preferred variable. However, it is subject to measurement error (see the long version of this paper for more details) and is also a truncated series due to the break in the data. So whether there is a relationship between new heroin users and crime was also tested, effectively as a robustness check. 47 The unemployment rate variable was actually total claimants per 100 population. The reason for this choice comes from the system dynamics model contained in the long version of this paper. But note that this is a different form of unemployment rate from the standard definition where the denominator is not total population but the total population of those seeking employment. 48 The results relating to population are shown in full in the long version of this paper.

42 The heroin epidemic of the 1980s and 1990s and its effect on crime trends - then and now
that the results are not markedly biased by the exclusion of any such explanatory variable. For the results to be biased there must be a third factor that influences both heroin use and crime, and that would change between areas over time. This is because the fixed effects will account for underlying differences in the crime propensity between areas and the time dummies remove any crime variation between years that is constant across the country. Many of the other explanatory variables that might have been included would be controlled for in large part through these two devices. For example, changes in police numbers between areas might conceivably influence both the number of heroin users and crime, so is a candidate for a missing variable. But as police budgets are decided centrally, changes across time are unlikely to vary much across areas. When budgets increase, all areas will likely see a rise in police numbers and vice versa. These changes then, which are in effect national rather than regional, would be captured by the time dummies and will not bias the results.49 There remains the issue of the lag on the Addicts Index data. A rapid review of the evidence was conducted on the typical gap between opiate/crack initiation and first notification/treatment attendance. Separate studies agreed that the median lag is about two years and the mean lag around three to four years (Millar et al., 2004; Donmall and Jones, 2005; Nordt and Stohler, 2006). As a result this analysis uses a three-year forward lag for the main results. Effectively then, the model assumes that an increase in OCU numbers in year T, as recorded by the Addicts Index, actually occurred in year T-3 because those users would have been likely to be using opiates/crack for around three years before being notified.50 Six variations were tested, three using total heroin users as an explanatory variable and three using new heroin users. The first variation used all police forces, the second excluded the Metropolitan Police Service (to see whether its larger volumes biased results) and the third included an interaction term. This was to investigate the possibility that opiate/crack use and unemployment may interact to drive up crime.51 A series of robustness checks were also performed in relation to measurement error, multicollinearity and serial correlation. The conclusions, outlined in Table 4 below (with standard errors in brackets), were generally robust to these issues but full details are given in the longer version of the paper. Table 4: Results of fixed effects regression analysis
Burglary
Total heroin users
(all police
forces)
Total heroin users
(exc. MPS)
Total heroin users
(all forces
and interaction
term)
New heroin users
(all police
forces)
New heroin users
(exc. MPS)
New heroin users
(all forces
and interaction
term)
Total heroin users 8.83*** 11.16*** 9.07***
(3.27) (2.94) (3.22)
New heroin users 25.2*** 29.9*** 22.4***
(3.95) (2.97) (6.42)
Unemployment rate 1180 1711* 972 983 858
(944) (944) (952) (909) (678)
49 Clustered standard errors were also used to allow for heteroskedasticity between police forces. See the long version of this paper for more on this. 50 Sensitivity analysis was also run to check the importance of this assumption – see the longer version of this paper for more details. 51 This possibility had been suggested by some other exploratory analysis – see the longer version of this paper for more details.

43 The heroin epidemic of the 1980s and 1990s and its effect on crime trends - then and now
Unemployment volume
0.14***
(0.043)
Interaction term -0.054 0.66
(0.63) (1.84)
Theft of vehicle
Total heroin users
(all police
forces)
Total heroin users
(exc. MPS)
Total heroin users
(all forces
and interaction
term)
New heroin users
(all police
forces)
New heroin users
(exc. MPS)
New heroin users
(all forces
and interaction
term)
Total heroin users 4.27 7.11*** 0.62
(3.01) (1.18) (3.12)
New heroin users 11.6** 15.7*** 2.44
(4.83) (1.80) (5.46)
Unemployment rate -1209* -607 -1334**
(630) (366) (650)
Unemployment volume
0.35** 0.0016 0.032*
(0.015) (0.21) (0.018)
Interaction term 0.74*** 1.94***
(0.53) (0.21)
Theft from vehicle
Total heroin users
(all police
forces)
Total heroin users
(exc. MPS)
Total heroin users
(all forces
and interaction
term)
New heroin users
(all police
forces)
New heroin users
(exc. MPS)
New heroin users
(all forces
and interaction
term)
Total heroin users 10.87*** 8.96*** 7.66***
(1.82) (0.78) (1.95)
New heroin users 24.44*** 20.5*** 16.3***
(4.89) (2.29) (4.82)
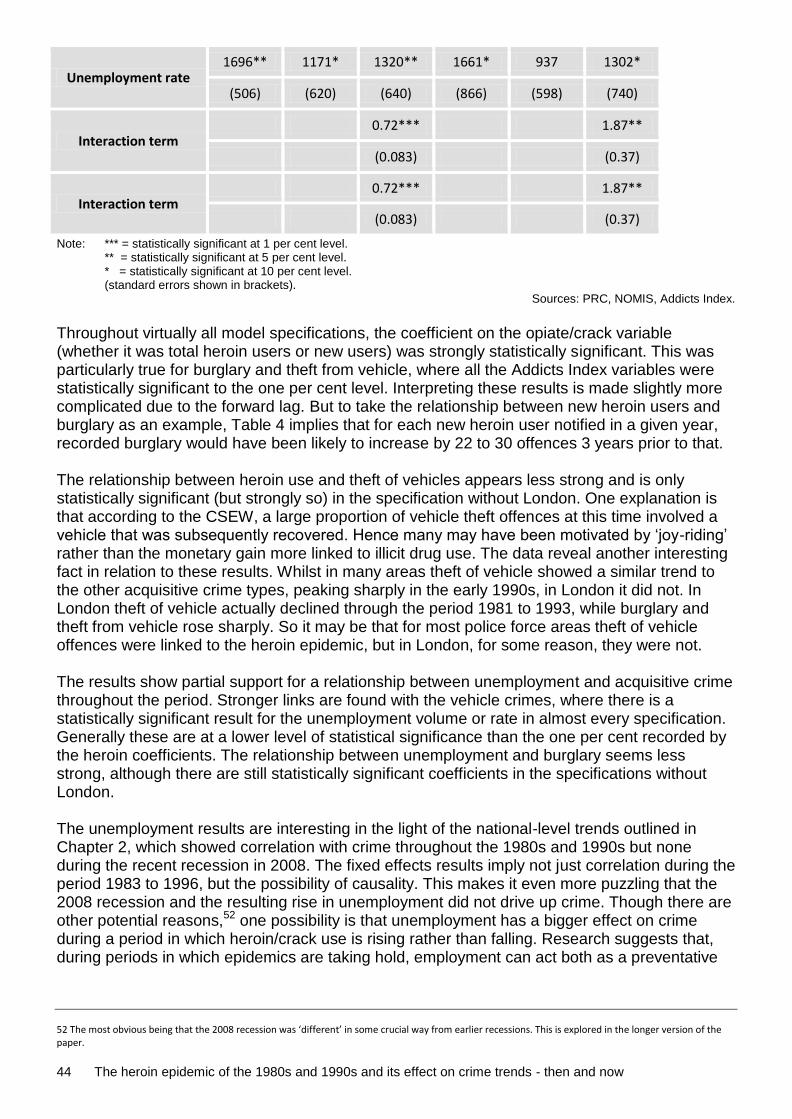
44 The heroin epidemic of the 1980s and 1990s and its effect on crime trends - then and now
Unemployment rate 1696** 1171* 1320** 1661* 937 1302*
(506) (620) (640) (866) (598) (740)
Interaction term 0.72*** 1.87**
(0.083) (0.37)
Interaction term 0.72*** 1.87**
(0.083) (0.37)
Note: *** = statistically significant at 1 per cent level. ** = statistically significant at 5 per cent level. * = statistically significant at 10 per cent level. (standard errors shown in brackets).
Sources: PRC, NOMIS, Addicts Index.
Throughout virtually all model specifications, the coefficient on the opiate/crack variable (whether it was total heroin users or new users) was strongly statistically significant. This was particularly true for burglary and theft from vehicle, where all the Addicts Index variables were statistically significant to the one per cent level. Interpreting these results is made slightly more complicated due to the forward lag. But to take the relationship between new heroin users and burglary as an example, Table 4 implies that for each new heroin user notified in a given year, recorded burglary would have been likely to increase by 22 to 30 offences 3 years prior to that. The relationship between heroin use and theft of vehicles appears less strong and is only statistically significant (but strongly so) in the specification without London. One explanation is that according to the CSEW, a large proportion of vehicle theft offences at this time involved a vehicle that was subsequently recovered. Hence many may have been motivated by ‘joy-riding’ rather than the monetary gain more linked to illicit drug use. The data reveal another interesting fact in relation to these results. Whilst in many areas theft of vehicle showed a similar trend to the other acquisitive crime types, peaking sharply in the early 1990s, in London it did not. In London theft of vehicle actually declined through the period 1981 to 1993, while burglary and theft from vehicle rose sharply. So it may be that for most police force areas theft of vehicle offences were linked to the heroin epidemic, but in London, for some reason, they were not. The results show partial support for a relationship between unemployment and acquisitive crime throughout the period. Stronger links are found with the vehicle crimes, where there is a statistically significant result for the unemployment volume or rate in almost every specification. Generally these are at a lower level of statistical significance than the one per cent recorded by the heroin coefficients. The relationship between unemployment and burglary seems less strong, although there are still statistically significant coefficients in the specifications without London. The unemployment results are interesting in the light of the national-level trends outlined in Chapter 2, which showed correlation with crime throughout the 1980s and 1990s but none during the recent recession in 2008. The fixed effects results imply not just correlation during the period 1983 to 1996, but the possibility of causality. This makes it even more puzzling that the 2008 recession and the resulting rise in unemployment did not drive up crime. Though there are other potential reasons,52 one possibility is that unemployment has a bigger effect on crime during a period in which heroin/crack use is rising rather than falling. Research suggests that, during periods in which epidemics are taking hold, employment can act both as a preventative
52 The most obvious being that the 2008 recession was ‘different’ in some crucial way from earlier recessions. This is explored in the longer version of the paper.

45 The heroin epidemic of the 1980s and 1990s and its effect on crime trends - then and now
factor, deterring opiate/crack initiation or descent into daily use, and as a source of funds, meaning less reliance on illegal income (Pearson, 1987). The interaction term is an attempt to model the second of these two possibilities (the effect of the first will be incorporated in the heroin use variables).53 The results are slightly equivocal. There are highly statistically significant results for the two vehicle crimes but not for burglary. Taken together this analysis suggests that there was a strong relationship between heroin use and crime throughout the years before and during the crime turning point. There is also some more tentative evidence that unemployment played a role and also that high levels heroin use and unemployment may have interacted to drive up crime even further. However, given the difficulties of the Addicts Index data, these conclusions remain tentative. Further tests of these relationships in other areas and time periods would be welcomed. The results from Table 4 were used to estimate the proportion of the total rise in each crime type that might be ‘explained’ by increases in OCUs. The ranges in brackets were calculated using the confidence intervals from the coefficients in Table 4. Findings indicate that the increase in the number of total heroin users between 1984 and 1993 might account for between 9 per cent and 60 per cent of the increase in burglary, with a central estimate of 35 per cent.54 This is shown along with the equivalent findings for the two vehicle offences in Table 5.55
Table 5: Proportion of the rise in each acquisitive crime explained by the heroin-use variables
Burglary Theft of vehicle
Theft from vehicle
Proportion of the increase in crime 1984–93 explained by total heroin users
35% 30% 44%
(9–60%) (-16–77%) (29–59%)
Proportion of the increase in crime 1981–93 explained by new heroin users
48% 41% 48%
(33–63%) (3–80%) (29–68%)
Note: Central estimates are shown with ranges, in brackets, produced from the confidence intervals on the original coefficients.
Sources: PRC, NOMIS, Addicts Index.
It should be noted that although the central estimates for theft of vehicle are in line with the other crime types, the uncertainty around these estimates is much wider and when using total heroin users the estimate is not statistically significantly different from zero. However, as has
53 If high unemployment drives greater opiate/crack initiation then this effect would be captured by the numbers of users recorded to the Addicts Index. However, given that the Addicts Index counts only a proportion of the true user population it is possible that the statistical significance of the unemployment variables is at least partly due to picking up part of this effect (i.e. anything not captured by the Addicts Index due to measurement error). 54 The period 1984 to 1993 was used as the measurement period when using the total heroin use variable because of the break in the series from 1986 to 1987. This coupled with the three-year forward lag meant that the data period for that variable effectively starts in 1984. For the new heroin users variable, which has no break in the series, a slightly longer time horizon, back to 1981, could be used. 55 See the longer version of this paper for a full description of the methodology for calculating the values in Table 6.

46 The heroin epidemic of the 1980s and 1990s and its effect on crime trends - then and now
been shown, the relationship becomes much stronger if London is excluded – recall that theft of vehicle actually fell in London during this period.
Overall though, the model suggests that opiate/crack use was an important factor in the large changes in acquisitive crime volumes that occurred across police force areas during this period. The central estimates suggest that opiate/crack use may explain about 40 per cent of the rise in these main acquisitive crime categories.56
Scotland, Northern Ireland, the Republic of Ireland and the international picture
Though the correlation between opiate/crack use and acquisitive crime throughout England and Wales appears to be very strong, the data only really contain one area (Merseyside) that followed a noticeably different trend, hence any causal conclusion must remain tentative. Fortunately, Scotland, Northern Ireland and the Republic of Ireland provide further examples. Ditton and Speirits (1981) chart a marked surge in new heroin users (and crime) in Glasgow starting in 1979. Edinburgh also seems to have been affected by the epidemic very early in the 1980s. But while the Addicts Index data suggest that Strathclyde, the police force area containing Glasgow, had surges in new users during both waves of the epidemic (peaking in the second wave), the trends in Edinburgh more closely resemble Merseyside. That is, Lothian and Borders – the police force area containing Edinburgh – appears to have had a large rise in heroin users during the early 1980s but not to have suffered a second wave at all. Once again, this was mirrored by the recorded acquisitive crime data (burglary), with a similar ‘spike’ in the early 1980s (Figure 18). Figure 18: Recorded burglary and new heroin users in Lothian and Borders, 1977 to 199657
Source: Addicts Index, Scottish recorded crime data. Like Merseyside, Lothian and Borders was an exception to the overall national trend. Total police recorded crime and recorded acquisitive crime for Scotland peaked in 1991. And
56 The average of the ‘proportion of the total rise in crime’ estimates for each of the crime types is 41 per cent. 57 When examining this chart it is important to recall, again, that the Addicts Index operates with a lag, hence the fact that it shows a peak in new heroin users a few years after the start of the sharp rise in burglary is in line with the possibility that increases in heroin use drove the increases in crime.
0
20
40
60
80
100
120
140
160
180
0
5,000
10,000
15,000
20,000
25,000
19
77
19
79
19
81
19
83
19
85
19
87
19
89
19
91
19
93
19
95
-96
Recorded burglary (left axis)
New heroin users (right axis)

47 The heroin epidemic of the 1980s and 1990s and its effect on crime trends - then and now
separately, Ditton and Frischer (2001), using parameters from the US epidemic model, modelled the likely spread of the epidemic across Scotland. They concluded that the peak in new users occurred around 1991, in line with the peak in total police recorded crime in Scotland.58 The Republic of Ireland and Northern Ireland also provide an instructive comparison. Northern Ireland did not appear to suffer a significant heroin epidemic (see McElrath, 2002), whereas the Republic of Ireland did have an epidemic in the early 1980s, confined largely to Dublin (Dean et al., 1985). Burglary and total crimes spike very sharply in the Republic of Ireland in line with this epidemic (Figure 19). No spike is visible in Northern Ireland. The overall crime trend remains relatively stable throughout the period. Figure 19: Crime trends in the Republic of Ireland and Northern Ireland, 1980 to 1997
Sources: Northern Ireland crime data were found here:
http://www.psni.police.uk/directory/updates/updates_statistics/update_crime_statistics/updates_
crime_statistics_archive.htm . Data for the Republic of Ireland were found here:
http://www.crimecouncil.gov.ie/statistics_cri_crime_murder.html
The international evidence is also supportive. In the US, the peak in new users was probably reached between 1971 and 1977 (Hughes & Rieche, 1995). This would put the US property crime peak, according to the National Crime Victimization Survey (NCVS), in line with the (incidence) peak of the epidemic, as in England and Wales.59
Europe provides a final example. Aebi (2004) showed that, in aggregate, crime in western Europe peaked in the early 1990s and crime in central and eastern Europe peaked around a decade later. A similar pattern is to be found in the spread of heroin across Europe, according to a new set of studies by the European Monitoring Centre for Drugs and Drug Addiction
58 As with most models of OCU trends, their findings are based on various assumptions so should be treated cautiously, but their estimates are similar to those found in a separate Scottish study, focusing on Glasgow (Hutchison et al, 2006). 59 It is also worth noting that the slightly later peak in burglary volumes (between 1979 and 1981 depending on whether NCVS or police reports are used)) would be more in line with the prevalence peak, but also it coincided with large rises in unemployment. Generally speaking, across all the nations examined in this paper the combination of high unemployment and being in an epidemic state of heroin use seems to drive the largest spikes in crime. High unemployment on its own apparently has far less of an effect.
0
10,000
20,000
30,000
40,000
50,000
60,000
70,000
80,000
0
100,000
200,000
300,000
400,000
500,000
600,000
700,000
800,000
900,000
1,000,000
19
80
19
81
19
82
19
83
19
84
19
85
19
86
19
87
19
88
19
89
19
90
19
91
19
92
19
93
19
94
19
95
19
96
19
97
Total recorded crime in Republic of Ireland
Total recorded acquisitive Crime in N. Ireland
Heroin epidemic
period in Ireland but
not Northern Ireland

48 The heroin epidemic of the 1980s and 1990s and its effect on crime trends - then and now
(EMCDDA). These conclude that: “the beginning of the heroin use epidemic probably occurred more recently in Central and Eastern European countries than in western ones” (Barrio et al., 2013). To summarise then, there is evidence of correlation between trends in acquisitive crime and changes in OCU numbers at the local, national and international level. Alongside the statistical analysis described above, the combined evidence from the examples of Merseyside, Edinburgh, and the Republic of Ireland is quite compelling. In the British Isles, there was not a single, uniform crime increase in acquisitive crime, followed by a uniform fall. Instead there were marked regional (and national) variations in trends in crime and these appear to be matched by corresponding OCU trends. This is not to say that changes in OCUs have solely driven trends in acquisitive crime. But they do appear to be an important contributory factor. The next chapter attempts to estimate the size and nature of that impact, both on the rise in crime, and the subsequent fall, through to the present day (2013).

49 The heroin epidemic of the 1980s and 1990s and its effect on crime trends - then and now
6. Quantifying the impact of changing levels of opiate/crack use on acquisitive crime trends
This chapter seeks to estimate the proportion of the rise and fall in acquisitive crime in England and Wales that might be attributable to the heroin epidemic, and its long-term consequences. Due to the data limitations, the model used to generate these estimates contains a number of simplifications and assumptions. For that reason, all results should be viewed as exploratory. The analysis that follows is really a tentative first attempt, upon which it is hoped others will build. The general approach was:
- to generate estimates for the number of opiate/crack users (OCUs) in England and Wales over time;
- to estimate the average offending rate per OCU per year; - to multiply these two estimates to give an estimate for the amount of crime generated
by opiate/crack use over time.
For the first step a trial-and-error approach was used. The analysis was based around the question: what must the earlier pattern of the epidemic have looked like to result in a cohort of the size and age distribution that exists currently? There are two crucial unknowns in this process:
- the trend in the number of new users; and
- the rate at which OCUs exit the population (either through quitting or dying).
But there are also two things that are known:
- the size; and
- age distribution of the current OCU cohort.60
So a range of possible exit rates were selected based on available evidence. These were then combined, in turn, with many different trends in new users until a trend was found that, when projected forwards from a pre-epidemic 1975 baseline, produced an OCU cohort of the same size and age distribution as that suggested by current data.
60 These things are known – to a reasonable level of accuracy – from the Hay et al. (2006; 2012) estimates and the Drugs Data Warehouse (DDW). See the longer version of this paper for more discussion on the validity of these measures.

50 The heroin epidemic of the 1980s and 1990s and its effect on crime trends - then and now
Most studies suggest that between 5 per cent and 13 per cent of OCUs quit opiate/crack use or die each year (see, for example, Hickman et al., 2004), so all single-integer rates between these boundaries were tested. However, some studies also suggest that the exit rate can be higher than 13 per cent in the first few years after initiation and then decrease over time (for example, Kaya et al., 2004, Sweeting et al., 2009); so variations of this type were also tested along with exit rates based on the actual results from one particular longitudinal study (Hser et al., 2001). The results are below (Table 6), showing the ‘best fit’ epidemic profile for each exit rate.61
Table 6: Modelling results
Exit rate (the rate at which
opiate/crack users exit the population annually)
Incidence Prevalence
Peak of new users
No. of new users at peak
Peak of total users
No. of users at peak
5% Fixed 1994 36,416 1999 383,810
6% Fixed 1994 42,813 1998 410,381
7% Fixed 1993 56,797 1997 481,372
8% Fixed 1992 62,383 1997 496,481
9% Fixed 1992 75,612 1997 559,286
10% Fixed 1992 94,600 1996 686,826
11% Fixed 1992 117,219 1995 792,211
12% Fixed 1991 137,181 1995 842,158
13% Fixed 1991 160,090 1995 941,155
30% Variable reducing by 10% annually 1993 239,097 1997 869,657
30% Variable reducing by 15% annually 1994 125,535 1998 543,887
30% Variable reducing by 20% annually 1994 104,234 1998 428,699
Rate to match Hser et al, study v1 1993 103,635 1998 493,730
Rate to match Hser et al. study v2 1995 98,011 1998 475,146
Note: The Hser et al. study followed a group of heroin users for 30 years and charted the exit rate, see the long version of this paper for more
information.
These results highlight the level of uncertainty. They suggest that incidence (new users) peaked between 1991 and 1995 with a range of between 36,000 and 239,000 new users per year at the peak, though the best estimates cluster around 100,000). The results also suggest that prevalence (total users) peaked between 1995 and 1999, with most estimates suggesting at least 400,000 users at this peak. Using a scoring system and available evidence, the ‘Hser et al. study v2’ exit rate was selected as the best overall fit. Its relationship to the most recent (2008)
61 ‘Best fit’ in this context means that, following a trial-and-error process, this epidemic profile was found to produce the closest match with data for the current OCU cohort, i.e. fixing the exit rate, profiles of new users were experimented with to find the profile that gave rise to an OCU cohort of the same size and age as that seen in the real data.

51 The heroin epidemic of the 1980s and 1990s and its effect on crime trends - then and now
data on the size and age profile of the OCU population is shown below. Figure 20 compares the 2008 modelled OCU population by age band with actual data on OCUs from the Drugs Data Warehouse for 2005 to 2009.
Figure 20: Comparison between modelled results and the actual Drugs Data Warehouse data for the age distribution of the opiate/crack user population in 2008
Source: Drugs Data Warehouse
The second known variable used to ‘anchor’ the modelled estimates are from the Hay et al. (2006; 2012) estimates of the size of the OCU population, over time.
0
2,000
4,000
6,000
8,000
10,000
12,000
14,000
16,000
16 18 20 22 24 26 28 30 32 34 36 38 40 42 44
OC
Us
Age
Modelled
Actual

52 The heroin epidemic of the 1980s and 1990s and its effect on crime trends - then and now
Figure 21: Comparison between modelled results and the Hay et al. estimates for the opiate/crack user population between 2005/06 and 2010/1162
Source: Hay et al (2011)
To match the modelled OCU trend to the offending data, it was important to estimate the number of OCUs in treatment over time. There is good evidence that those receiving treatment generally offend at a much lower rate than OCUs not in treatment (see Coid et al., 2000; Stewart et al, 2000; Davies et al, 2009). So for each year an estimate of the proportion of the OCU population in contact with treatment services was generated using a variety of sources, principally the National Drug Treatment Monitoring System and the Regional Drug Misuse Databases.63 Figure 22 shows both the modelled OCU trend and the estimated numbers in treatment.
Figure 22: Modelled opiate/crack user population, 1975 to 2012
62 It is important to note that both the modelling results and the Hay et al. (2006; 2012) estimates have a degree of uncertainty around them, hence this closeness of fit should not necessarily been seen as a mark of the overall reliability of the estimates produced in this chapter. In a sense, the trial-and-error method followed ensured that only results that were a good fit were carried forward – the process was not carried out prospectively. In other words, the results offer a possible version of what happened that fit the available data. They are not a conclusive version. 63 The methodology is described in full in the longer version of this paper.
0
50,000
100,000
150,000
200,000
250,000
300,000
350,000
400,000
20
05
-06
20
06
-07
20
07
-08
20
08
-09
20
09
-10
20
10
-11
Actual
Modelled
0
50,000
100,000
150,000
200,000
250,000
300,000
350,000
400,000
450,000
500,000
19
75
19
77
19
79
19
81
19
83
19
85
19
87
19
89
19
91
19
93
19
95
19
97
19
99
20
01
20
03
20
05
20
07
20
09
20
11
Total OCU prevalence
Number in treatment

53 The heroin epidemic of the 1980s and 1990s and its effect on crime trends - then and now
The opiate/crack user offending rate To model the OCU offending rate, the 36 UK and international studies on the relationship between drug misuse and offending were reviewed. Of these, data from five UK-based studies that yielded more granular data were considered for the model. In each case, an offending rate per OCU was calculated. To allow for comparison with overall crime trends, the results were made comparable to the Crime Survey for England and Wales (CSEW) acquisitive crime categories. In particular, crimes against commercial targets, like shoplifting, were excluded as these are not included in the CSEW. Prostitution and drug dealing were excluded for the same reason. A summary of the analysis is given in Table 7. As expected, the studies that used treatment cohorts find lower levels of offending compared with those that use criminal justice system (CJS)-based samples. But within cohort subsets, there was a good level of agreement, once the studies were rendered comparable (i.e. looking at the bottom row of the table).
Table 7: Average number of offences committed by opiate/crack users per year, calculated from available studies
NTORS (1995-2000) DTORS (2006-2007) Coid et al. (2000)
Arrestee Survey (2004/05)
New- Adam
(2001/02)
Average number of
offences per opiate/crack
user per year
Out-of-treatment
In-treatment
Out-of-treatment
In-treatment
Out-of-treatment
In-treatment
Total 103.4 67.9 135.0 90.9 238.1 143.6 269.3 158.7
All acquisitive
crime 91.3 42.8 92.2 47.1 81.8 37.2 257.1 141.5
CSEW acquisitive
crime 8.4 4.0 9.6 6.4 8.7 5.71 33.9 41.0
Notes: The top two rows of this table are not strictly comparable across studies because they include different baskets of
offences.
NTORS is the National Treatment Outcome Research Study.
DTORS is the Drug Treatment Outcome Research Study.
CSEW is the Crime Survey for England and Wales.
NEW-ADAM is the New English and Welsh Arrestee Drug Abuse Monitoring Programme.
Sources: Stewart et al, 2000; Davies et al, 2009; Coid et al, 2000; Boreham et al, 2006; Bennett and Holloway, 2004).
As Chapter 4 showed, OCU offending is heavily skewed with a small proportion of individuals committing a high proportion of total offences. Many OCUs from the shortlisted studies (particularly the treatment-based studies) self-reported little or no acquisitive crime. So the offending rates in the table should not be viewed as a likely level of offending for each and every OCU. They incorporate both the users who report no crime and the users who report very high levels, and hence should only be used – as here - for aggregate level estimates for offending at the cohort level. There is also a noticeable difference between the top two rows of the table (total and all acquisitive crime) and the bottom one (CSEW crime). This is because most OCU crime does not fall within the CSEW acquisitive crime category as the CSEW captures offences against individuals and households only. The most common OCU crimes are drug dealing and shoplifting.

54 The heroin epidemic of the 1980s and 1990s and its effect on crime trends - then and now
For the main results, the focus is on the offending rate for crimes that would appear on the CSEW, the main measure for crime trends in England and Wales. Hence, the offending rates from the bottom row of the table were used. Care was taken to ensure that the amount of (CSEW) crime committed by OCUs was not biased upwards. Firstly, the results from the table were not directly extrapolated to the entire OCU population. This is because not all OCUs get arrested and not every OCU will have a rate of offending equivalent to that of a pre-treatment individual. This was resolved by having two estimates:
- one generated from treatment studies; and
- one generated from the CJS-based studies.
This ensured that rates were only extrapolated to appropriate populations.
For the treatment estimate the offending rates from Table 7 were averaged for both the pre-treatment period (9.0 CSEW acquisitive crimes per year) and the post-treatment period (5.5 CSEW acquisitive crimes per year). These were then adjusted downwards by 20 per cent to account for the proportion of crime that might have been committed by these individuals even in the absence of the epidemic (the counterfactual). The long version of this paper gives a full explanation for this counterfactual adjustment. The adjusted pre-treatment rate, 7.2 acquisitive crimes per year, was applied to the estimates for the number of OCUs not in treatment and the post-treatment adjusted rate (4.4 CSEW acquisitive crimes per year) was applied to the estimates for those in treatment, for each year. By combining these, an estimate for the total amount of additional acquisitive crime generated by opiate/crack use over time, was produced. For the CJS-based estimate, rather than averaging the offending rates from the two studies, the (more conservative) figures from the Arrestee Survey were used for reasons given in the long version of this paper. The offending rate was used in conjunction with estimates from the Offending, Crime and Justice Survey (OCJS), a general population survey that asks about illicit drug use and crime and hence allows for an estimate of offending rates among OCUs who did not get arrested in a given year. This was to ensure that the relatively high Arrestee Survey offending rate (33.9 acquisitive crimes per annum) was only applied to those OCUs who are both regular OCUs and who get arrested in a given year, and who are therefore comparable with the Arrestee Survey sample. Analysis of the Arrestee Survey and the OCJS suggested that the proportion of the total OCU cohort within this category was just over 30 per cent in 2004.64 For the proportion not arrested, (i.e. the other 70 per cent), the OCJS was used to calculate an applicable offending rate, which was far lower: 2.2 CSEW acquisitive crimes per annum. These estimates were also adjusted for the counterfactual in an identical way as for the treatment cohorts. This produced an overall offending rate for the OCU population of 9.5 CSEW acquisitive crimes per annum that was applied to the number of OCUs per year from step one. The results are shown below. The estimates suggest that the additional crimes committed by OCUs might be responsible for around one-half to three-quarters of the rise in acquisitive crime and between one-quarter and one-third of the fall.
64 It was necessary to assume that this figure remains constant over time, which is an important assumption. See the assumption log and sensitivity analysis in the longer version of this paper for more on this.

55 The heroin epidemic of the 1980s and 1990s and its effect on crime trends - then and now
Figure 23: Total crime compared with the estimated number of offences generated by opiate/crack use, 1981 to 2012
Note: The teal line uses the Arrestee Survey-based estimates. Crime Survey for England and
Wales (CSEW) values have been converted to calendar year figures. Source: CSEW
Table 8: Final modelling results
Treatment approach
Arrestee Survey/OCJS approach
Estimated percentage of CSEW acquisitive crime rise explained (1981–95)
54.9% 77.0%
Estimated percentage of CSEW acquisitive crime fall explained (1995–2012)
27.3% 31.1%
Notes: OCJS is the Offending, Crime and Justice Survey.
CSEW is the Crime Survey for England and Wales.
The results of the model also imply that even though today’s OCU cohort is almost certainly smaller and older than it was at the epidemic peak, OCUs may still be responsible for a large number of acquisitive crimes. The model’s results are broadly in line with those from alternative Home Office research, suggesting that as much as 45 per cent of theft offences may be committed by OCUs (Mills et al, 2013)65 This also means, though, that the continuing decline of the OCU cohort is probably still exerting important, though diminishing, downward pressure on CSEW acquisitive and total crime. The model employs a number of assumptions typical of models of this type. A complete list of these, and the evidence behind them, is contained in the long version of this paper. Generally, wherever choices could be made in the input variables, the more conservative estimates have been used. However, to check the sensitivity of the final results to these assumptions, several extra analyses were conducted. The model was re-run varying some of the central parameters to see how much this changed the final result. The full findings are in the long version of this
65 Note that the Mills et al (2013) estimates include offences against businesses (like shoplifting) that are not included here.
0
2,000,000
4,000,000
6,000,000
8,000,000
10,000,000
12,000,000
14,000,000
19
81
19
83
19
85
19
87
19
89
19
91
19
93
19
95
19
97
19
99
20
01
20
03
20
05
20
07
20
09
20
11
CSEW acquisitive crime Estimated offences due to opiate/crack use

56 The heroin epidemic of the 1980s and 1990s and its effect on crime trends - then and now
paper, but generally it was found that the results were reasonably robust to changes in many of the main parameters. The choice of the ‘baseline’ level of OCU incidence (in 1975) had very little effect on the main results, which are also relatively robust to changes in the Hay et al. (2006; 2012) estimates for OCU prevalence. Even ten per cent changes in the offending rates had relatively small effects. However, the results were sensitive to the counterfactual and the choice of the exit rate, and to a slightly lesser extent to the number of OCUs who get arrested annually. To try to offer a ‘lower-bound’ estimate, three key assumptions were adjusted:
- it was assumed that 50 per cent of OCU crime (rather than 20%) would have occurred anyway;
- all offending rates were decreased by 30 per cent; and
- the exit rate was changed from the decreasing rate found in the Hser et al (2001) study to a 5 per cent fixed rate (which has a downward effect on results).
In this scenario opiate/crack use was responsible for between 15 per cent and 20 per cent of the rise in acquisitive crime, and for between 7 per cent and 8 per cent of the fall.
There are limitations to these analyses of course. Apart from in a crude way with the ‘lower-bound’ option, the methodology does not really test the degree to which uncertainties compound each other. Plus, there are other aspects of the model (like the application of offending rates to different periods of time) that are uncertain, yet cannot be tested by sensitivity analysis in this way. This is why the modelling results should be seen as exploratory.66 Nevertheless, the evidence gathered here does generally support the notion that changing levels of opiate/crack use have affected acquisitive crime trends in England and Wales over the last 40 years, possibly in a substantial way. The central estimates suggest it can explain over one-half of the rise in crime in the period between 1981 and 1995 and between one-quarter and one-third of the fall since 1995.
66 And also why there has been no attempt to put confidence intervals around the estimates in this chapter.

57 The heroin epidemic of the 1980s and 1990s and its effect on crime trends - then and now
7. Conclusion
The rise and fall in crime that has occurred in England and Wales and in a number of other developed nations has been the subject of much academic debate. Ultimately though, despite much “imaginative scholarship”, a convincing overall explanation remains elusive (Farrell et al., 2011a). This paper has attempted to add to the evidence by piecing together the available data and research on the extent to which opiate/crack use may have played a role, both in the sharp 1990s crime peak(s) and the downward trend since, which started steeply and has become more gradual. Overall, the evidence presented shows that cohorts of opiate/crack users (OCUs) – on aggregate – commit markedly more crime than offenders not taking these drugs (Bennett et al., 2008). Studies also agree that the number of users increased dramatically in England and Wales and in many other western nations and then tailed off as users quit or died (Pearson, 1987; Barrio et al., 2013). Those two – largely undisputed – facts offer a compelling explanation for at least some of the rise and fall in crime, which has received relatively little attention, especially in relation to the decline in crime. Probably the main reason why the waning of these opiate/crack epidemics has not always featured prominently in crime-drop research is that two other facts are disputed:
- whether opiates/crack caused the crime committed by OCUs; and
- whether the peaks in illicit drug use correlated with peaks in crime. Lack of high-quality data mean that these two questions may never be answered definitively.
On causality, the evidence gathered here shows that opiate/crack use almost certainly generated additional offences, but quantifying this precisely remains challenging. The problem is that evidence also suggests that other factors, related perhaps to genetics and upbringing, produced an increased propensity for crime and opiate/crack use in many individuals. A key conclusion of this paper is that belief in the importance of such an underlying ‘third factor’ is compatible with the notion that the heroin epidemic was a crucial driver of crime trends. Without the epidemic, the underlying propensity for illicit drug use would not have been translated into the accelerated and extended offending self-reported by some OCUs in repeated studies. The possibility of a causal relationship is further bolstered by the evidence presented here on the correlation between peaks in opiate/crack use and peaks in crime. A key element of this analysis involved deconstructing local, national and international crime trends to show that there was no single rise and fall. At the national level England and Wales, the US, the Republic of Ireland and many eastern European nations had peaks in acquisitive crime that matched the timing of their heroin epidemics, rather than each other. The same is true for regional exceptions like Merseyside and Edinburgh. No doubt there are areas that do not follow this pattern (and this paper highlighted at least one, the West Midlands). But whether or not researchers decide that the geographical crime variation is driven by variation in opiate/crack

58 The heroin epidemic of the 1980s and 1990s and its effect on crime trends - then and now
use, the variation itself should be embraced. Its analysis surely offers the best chance of unlocking the crime-drop puzzle. This paper focuses on England and Wales. It attempts to tell the full story of the epidemic and to try to quantify its impact on acquisitive crime. For the latter, two models were used. Although both should be viewed as exploratory due to data limitations, they do produce similar results. Regression analysis, looking at the correlation between OCU indicators and recorded crime trends from 1981 to 1996, found that around 40 per cent of the rise in key crime types like theft and vehicle crime may be attributable to the epidemic. A second exploratory model that combined best estimates of OCU numbers through time with best estimates for their offending, suggested that opiate/crack use might have driven around one-half of the rise in acquisitive crime in England and Wales and between one-quarter and one-third of the fall. These results hide considerable uncertainty. Perhaps the best summary of this paper is that it has demonstrated the existence of an epidemic ‘narrative’, which fits many of the facts available, and which suggests that opiate/crack use has been an important driver of crime trends. But it has not proven that this is the only explanation for those facts. The ‘narrative’ would run something like this.
Following the opening of a new heroin supply route in the late 1970s, England and Wales had a significant drugs epidemic, or wave of epidemics, through the 1980s and early 1990s. This produced a cohort of heroin users, many of whom also used crack as their drug misuse developed.
The cohort was not homogeneous. Many (perhaps most) did not become either long-term addicted or prolific criminals and some were offenders before using opiates or crack. While many probably had the clustering of crime risk factors that could have marked them out for a criminal career in the absence of the epidemic, the cohort probably also included a number of individuals whose only crime risk factor was a susceptibility to peer influence at a time when heroin use was spreading in their area. For the first group, heroin use may have accelerated and extended an existing criminal career and for some of the second group heroin may have kick-started a criminal career.
Crimes committed were mainly minor theft offences. As a result, this cohort became prominent in the offending population and probably had a large impact on total crime, which is dominated by acquisitive crime.
The crime rise was steady during the 1980s, when the majority of England and Wales remained relatively unaffected by the epidemic. It then increased very rapidly in the 1990s as every police force area except Merseyside reached its peak of opiate/crack use.
Once the epidemic had spread across England and Wales and all susceptible individuals had been ‘exposed’, the number of new users probably decreased just as quickly as it had risen. Crime therefore began to fall; quickly at first as the less-recalcitrant users quit in significant numbers. But then more steadily as the population whittled down to more established users.
There are several important caveats to this story that need mentioning. Firstly, the effect of the OCU cohort was almost certainly greater on crime volumes than on the overall harm from crime, because OCUs tend to commit minor theft or drug dealing offences rather than the violent and

59 The heroin epidemic of the 1980s and 1990s and its effect on crime trends - then and now
sexual crimes that cause most harm. As such, it is also important to note that the evidence presented does not explain why violence rose and fell with a similar trend. The most important caveat though, is that this narrative does not imply that opiate/crack use was the sole factor driving crime trends. This paper has argued instead that trends are never likely to be driven by a single factor. Many factors are likely to have been important and interactions may also be crucial. Indeed, some findings suggest that rapid rises in unemployment, at a time when heroin use was spreading, may have exacerbated the crime impact beyond the level that either factor would have had on its own. The analysis has several policy implications. It suggests that relative to other drugs, OCUs continue to have the biggest impact on acquisitive crime trends. The central model estimates imply that the number of users will continue to reduce, but at a relatively gradual pace. If the rate of cessation could be increased, the potential for further crime reduction is large. Raising the cessation rate of the existing cohort is unlikely to be easy though. It is made up largely of older users, many of whom will have repeatedly tried and failed to achieve cessation through existing treatment practices. Focusing resources on the most important individuals may be the key. Evidence shows that not all OCUs are alike. A minority commit the vast majority of offences. So identifying these individuals is paramount. The other main policy conclusion is that preventing a future epidemic is crucial. Evidence shows epidemics do not strike all areas simultaneously and there is a lag between epidemic start and the moment it becomes visible on treatment or criminal justice datasets. Local-level monitoring is therefore crucial, so that future epidemics can be restricted before spreading. Evidence also shows that the main mechanism for epidemic spread is through person-to-person contact, which may have important implications for the way in which, for example, OCU prisoners are housed in relation to non-OCU prisoners. There is also some evidence that supply surges can act as triggers for epidemics, so the prevention of these remains important. Finally, data in this area are sparse (but improving) and there may be better ways than those employed in this paper to explore the question of whether opiate/crack use is an important driver of crime trends. Suggestions for improving or refining this work are therefore welcomed.

60 The heroin epidemic of the 1980s and 1990s and its effect on crime trends - then and now
References
Aebi, M. (2004) `Crime trends in Western Europe from 1990 to 2000’, European journal on
criminal policy and research, vol. 10(2-3), pp 163-186. Available at:
<http://www.peacepalacelibrary.nl/ebooks/files/ob35f37b1qqdnk(1).pdf#page=43>
Anglin, M. D. and Speckart, G. (1986) ‘Narcotics use, property crime, and dealing: Structural
dynamics across the addiction career’, Journal of Quantitative Criminology,vol. 2 (4), December
1986, pp 355–375. Available at: <http://link.springer.com/article/10.1007/BF01064260>
Ball, J. C., Shaffer, J. W. and Nurco, D. N. (1983) ‘The day to-day criminality of heroin addicts
in Baltimore — A study in the continuity of offence rates’. Drug and Alcohol Dependence, vol.
12(2), pp 119-142. Available at:
<http://www.sciencedirect.com/science/article/pii/0376871683900376>
Bandyopadhyay, S., Bhattacharya, S., Koli, M., & Sensarma, R. (2012) ‘Acquisitive Crime,
Sentencing and Detection: An Analysis of England and Wales’, Sentencing and Detection: An
Analysis of England and Wales. Available at:
<http://www.bhamlive3.bham.ac.uk/Documents/college-social-
sciences/business/economics/2012-discussion-papers/12-09.pdf>
Barrio, G., Montanari, L., Bravo, M. J., Guarita, B., de la Fuente, L. and Vicente, J. (2013)
‘Trends of heroin use and heroin injection epidemics in Europe: Findings from the EMCDDA
treatment demand indicator (TDI)’. Journal of substance abuse treatment, vol. 45(1), pp 19-30.
Available at: <http://www.journalofsubstanceabusetreatment.com/article/S0740-5472(12)00424-
2/abstract>
Bennet, T., and Holloway, K. (2004). Drug use and offending: summary results of the first two
years of the NEW-ADAM programme. Home Office, UK. Accessed at:
<http://www.dldocs.stir.ac.uk/documents/r179.pdf>
Bennett, T. and Holloway, K. (2009) ‘The Causal Connection Between Drug Misuse and
Crime’. British Journal of Criminology, vol. 49(4), pp 513-531. Available at:
<http://bjc.oxfordjournals.org/content/49/4/513.short>

61 The heroin epidemic of the 1980s and 1990s and its effect on crime trends - then and now
Bennett, T., Holloway, K. and Farrington, D. (2008) ‘The statistical association between drug
misuse and crime: A meta-analysis’. Aggression and Violent Behavior, vol. 13(2), pp 107-118.
Available at: <http://www.sciencedirect.com/science/article/pii/S1359178908000037>
Berman, G. (2008). Changes in crime recording practices. Standard Note SN/SG/2607, Library
of the House of Commons. Available at: <
http://scholar.google.co.uk/scholar?cluster=9656269533492427061&hl=en&as_sdt=0,5>
Best, D., Day, E. and Morgan, B. (2006) Addiction Careers and the Natural History of Change.
London: NTA. Accessed at:
<http://www.misbrugsnet.dk/fagligt/self_change/nta_addiction_careers_2006.pdf>
Bloor, M., McIntosh, J., McKeganey, N., & Robertson, M. (2008). ‘Topping up’ methadone:
An analysis of patterns of heroin use among a treatment sample of Scottish drug users. Public
health, vol. 122(10), pp 1013-1019. Available at: <http://eprints.gla.ac.uk/52916/>
Blumstein, A., & Rosenfeld, R. (1997). `Explaining recent trends in US homicide rates’, J.
Crim. L. & Criminology, vol. 88, pp 1175. Available at:
<http://scholarlycommons.law.northwestern.edu/cgi/viewcontent.cgi?article=6976&context=jclc>
Blumstein, A., & Wallman, J. (Eds.). (2006). The Crime drop in America. Cambridge University
Press. Accessed at: <http://www.crab.rutgers.edu/~goertzel/CrimeDrop.pdf>
Boreham, R., Fuller, E., Hills, A., & Pudney, S. (2006). The Arrestee Survey Annual Report:
Oct 2003-Sept 2004 England and Wales. Statistical Bulletin: Home Office Research
Development and Statistics Directorate, 4. Accessed at:
<http://webarchive.nationalarchives.gov.uk/20110220105210/rds.homeoffice.gov.uk/rds/pdfs06/
hosb0406.pdf>
Braakmann, N. and Jones, S. (2013) ‘Cannabis consumption, crime, anti-social behaviour and
victimization – Evidence from the 2004 cannabis declassification in the UK’. Working paper.
Accessed at: <http://www.eea-esem.com/files/papers/eea-
esem/2013/10/paper_jan13_new.pdf>
Bretteville-Jensen, A. L. (2006) ‘Drug Demand – Initiation, Continuation and Quitting’, De
Economist, December 2006, vol. 154 (4), pp 491–516. Available at:
<http://link.springer.com/article/10.1007/s10645-006-9027-9>
Brewer, D. D., Fleming, C. B., Haggerty, K. P., & Catalano, R. F. (1998) `Drug use predictors
of partner violence in opiate-dependent women’, Violence and Victims, vol. 13(2), pp 107-115.
Available at:
<http://www.ingentaconnect.com/content/springer/vav/1998/00000013/00000002/art00002>

62 The heroin epidemic of the 1980s and 1990s and its effect on crime trends - then and now
Brown, R. and Clark, R. V. (2004) ‘Police intelligence and theft of vehicles for export: Recent
UK experience’, Crime Prevention Studies, vol. 17, pp 173–192. Available at:
<https://www.ncjrs.gov/App/publications/abstract.aspx?ID=208056>
Bukten, A., Røislien, J., Skurtveit, S., Waal, H., Gossop, M., & Clausen, T. (2013). `A day-
by-day investigation of changes in criminal convictions before and after entering and leaving
opioid maintenance treatment: a national cohort study’, BMC psychiatry, vol. 13(1), pp 262.
Available at: < http://www.biomedcentral.com/content/pdf/1471-244X-13-262.pdf>
Bushman, B. J., & Cooper, H. M. (1990) `Effects of alcohol on human aggression: An
intergrative research review’, Psychological bulletin, vol. 107(3), pp 341. Available at:
<http://www-personal.umich.edu/~bbushman/bc90.pdf>
Byqvist, S., & Olsson, B. (1998) `Male drug abuse, criminality and subcultural affiliation in a
career perspective’, Journal of psychoactive drugs, vol. 30(1), pp 53-68. Available at:
<http://www.tandfonline.com/doi/abs/10.1080/02791072.1998.10399671>
Caulkins, J. P. (2005). `Models pertaining to how drug policy should vary over the course of a
drug epidemic’, Advances in health economics and health services research, vol. 16, pp 397-
429.
Charles, K. K., & Stephens Jr, M. (2006) `Abortion Legalization and Adolescent Substance
Use’, Journal of Law and Economics, vol. 49(2), pp 481-505. Available at:
<http://www.jstor.org/discover/10.1086/508249?uid=3738032&uid=2&uid=4&sid=211026798312
01>
Chen, A., Cai, B., Dietrich, K. N., Radcliffe, J., & Rogan, W. J. (2007) `Lead exposure, IQ,
and behavior in urban 5-to 7-year-olds: does lead affect behavior only by lowering IQ?’
Pediatrics, vol. 119(3), pp e650-e658. Available at:
<http://www.pediatricsdigest.mobi/content/119/3/e650.full>
Coid, J., Carvell, A., Kittler, Z., Healey, A. and Henderson, J. (2000) Opiates, criminal
behaviour and methadone treatment. London: Home Office. Available at:
<http://www.drugsandalcohol.ie/5422/1/Home_Office_Opiates_criminal_behaviour.pdf>
Conroy, E., Degenhardt, L., Mattick, R. P. and Nelson, E. C. (2009) ‘Child maltreatment as a
risk factor for opioid dependence: comparison of family characteristics and type and severity of
child maltreatment with a matched control group’, Child Abuse Negl., vol. 33 (6), June 2009, pp
343–352. Available at: <http://www.ncbi.nlm.nih.gov/pmc/articles/PMC2729332/>

63 The heroin epidemic of the 1980s and 1990s and its effect on crime trends - then and now
Cribb, J., Hood, A., Joyce, R. and Phillips, D. (2013) Living Standards, Poverty and Inequality
in the UK: 2013. Institute of Fiscal Studies. Available at: <http://www.ifs.org.uk/comms/r81.pdf>
Darke, S., & Hall, W. (2003) `Heroin overdose: research and evidence-based intervention’,
Journal of urban health, vol. 80(2), pp 189-200. Accessed at:
<http://www.ncbi.nlm.nih.gov/pmc/articles/PMC3456279/pdf/11524_2006_Article_206.pdf>
Davies, L., Jones, A., Vamvakas, G., Dubourg, R., & Donmall, M. (2009) The Drug
Treatment Outcomes Research Study (DTORS): Cost-effectiveness analysis. Home Office:
Research Report 25. Accessed at:
<http://tna.europarchive.org/20100413151426/rds.homeoffice.gov.uk/rds/pdfs09/horr25c.pdf>
De Alarcon, R., & Rathod, N. H. (1968) `Prevalence and early detection of heroin abuse’,
British medical journal, vol. 2(5604), pp 549. Accessed at:
<http://www.ncbi.nlm.nih.gov/pmc/articles/PMC1991846/pdf/brmedj02086-0067.pdf>
De Angelis, D., Hickman, M. and Yang, S. (2004) `Estimating Long-term Trends in the
Incidence and Prevalence of Opiate Use/Injecting Drug Use and the Number of Former Users:
Back-Calculation Methods and Opiate Overdose Deaths’ American Journal of Epidemiology vol.
160 (10). Accessed at: <http://aje.oxfordjournals.org/content/160/10/994.full.pdf>
Dean, G, O’Hare, A., Kelly, M. G., and Kelly, G. (1985) `The opiate epidemic in Dublin’, Irish
Med. J, vol. 78, pp 107-110. Accessed at: <http://www.drugsandalcohol.ie/6506/1/323-
0265.pdf>
Degenhardt, L., Lynskey, M., & Hally, W. (2000). `Cohort trends in the age of initiation of drug
use in Australia’, Australian and New Zealand Journal of Public Health, vol. 24(4), pp 421-426.
Accessed at:
<http://www.ndarc.med.unsw.edu.au/sites/default/files/ndarc/resources/TR.083.pdf>
Desimone, J. (2001) `The effect of cocaine prices on crime’, Economic Inquiry, vol. 39(4), pp
627-643.Accessed at:
<http://citeseerx.ist.psu.edu/viewdoc/download?doi=10.1.1.195.8843&rep=rep1&type=pdf>
Dhiri, S., Brand, S., Harries, R. and Price, R. (1999) Modelling and Predicting Property Crime
Trends. Home Office Research Study 198: London: HMSO. Accessed at:
<http://www.nationalarchives.gov.uk/ero/details.aspx?seriesid=64444&deliverableUnitId=520&e
ntrypoint=HO/421/2/P2/RDS/PDFS/HORS198.PDF>
Ditton, J., and Frischer, M. (2001) `Computerized projection of future heroin epidemics: a
necessity for the 21st century?’ Substance use & misuse, vol. 36(1-2), pp 151-166. Available at:
<http://informahealthcare.com/doi/abs/10.1081/JA-100000233>

64 The heroin epidemic of the 1980s and 1990s and its effect on crime trends - then and now
Ditton, J., and Speirits, K. (1981) The Rapid Increase of Heroin: Addiction in Glasgow During
1981. Department of Sociology. University of Glasgow.
Donmall, M. and Jones, A. (2005) Initiation of drug use, injecting and treatment, Age specific
analyses of NDTMS for ACMD(PWG) Pathways Work Programme. University of Manchester.
Accessed at:
<https://www.gov.uk/government/uploads/system/uploads/attachment_data/file/119058/Appendi
xs5.pdf>
Donohue, J., & Levitt, S. D. (2001) `The impact of legalized abortion on crime’, Quarterly
Journal of Economics, vol. 116(2). Accessed at:
<http://www.international.ucla.edu/CMS/files/Levitt.pdf>
DuPont, R. L. (1978) `International challenge of drug abuse: A perspective from the United
States’, The International Challenge of Drug Abuse, vol. 19, pp 3-4. Available at:
<http://free4ever.info/assets/applets/Research_Monograph_Series_19.pdf#page=17>
Durlauf, S. N., & Nagin, D. S. (2011) `Overview of “Imprisonment and crime: Can both be
reduced?’, Criminology & Public Policy, vol. 10(1), pp 9-12. Accessed at:
<http://www.public.asu.edu/~gasweete/crj524/readings/04-12%202011-Durlauf-
Nagin%20(imprisonment%20and%20crime%20-%20can%20both%20be%20reduced).pdf>
Economist (2013) ‘Where have all the burglars gone?’ Accessed at: <http://www.economist.com/news/briefing/21582041-rich-world-seeing-less-and-less-crime-even-face-high-unemployment-and-economic> El-Bassel, N., Gilbert, L., Wu, E., Go, H., & Hill, J. (2005). `Relationship between drug abuse and intimate partner violence: a longitudinal study among women receiving methadone’, American Journal of Public Health, vol. 95(3), pp 465-470. Accessed at: <http://www.ncbi.nlm.nih.gov/pmc/articles/PMC1449203/> Elias, N. (1969) The Civilising Process (The Civilizing Process, Vol. I The History of Manners, 1969; The Civilizing Process, Vol. II. State Formation and Civilization, 1982; The Civilizing Process, Sociogenetic and Psychogenetic Investigations, revised edition, 2000). Oxford: Blackwell.
Evans, W. N., & Owens, E. G. (2007) `COPS and Crime’, Journal of Public Economics, vol. 91(1), pp 181-201. Accessed at: <http://www.utexas.edu/law/journals/tlr/sources/Volume%2091/Issue%202/Mayrell/Mayrell.fn062.EvansOwens.COPSandCrime.pdf>
Farrell, G., Mansur, K. and Tullis, M. (1996) ‘Cocaine and heroin in Europe 1983–1993. A

65 The heroin epidemic of the 1980s and 1990s and its effect on crime trends - then and now
cross national comparison of trafficking and prices’, Brit. J. Criminol., vol. 36 (2), Spring 1996.
Accessed at: <https://dspace.lboro.ac.uk/dspace-
jspui/bitstream/2134/647/1/cocaine_heroin.pdf>
Farrell, G., Tilley, N., Tseloni, A. and Mailley, J. (2010) ‘Explaining and sustaining the crime
drop: Clarifying the role of opportunity-related theories’, Crime Prevention and Community
Safety, vol. 12, pp 24–41.
Farrell, G., Tseloni, A., Mailley, J., & Tilley, N. (2011a) `The crime drop and the security
hypothesis’, Journal of Research in Crime and Delinquency, vol. 48(2), pp 147-175. Accessed
at: <http://jrc.sagepub.com/content/early/2011/02/10/0022427810391539.abstract>
Farrell, G., Tseloni, A., & Tilley, N. (2011b) `The effectiveness of vehicle security devices and
their role in the crime drop’, Criminology and Criminal Justice, vol. 11(1), pp 21-35.Accessed at:
<http://www.sfu.ca/content/dam/sfu/icurs/Publications/2011/Farrell,%20Tseloni,%20Tilley.pdf>
Farrington, D. P., Coid, J. W., Harnett, L., Jolliffe, D., Soteriou, N., Turner, R. and West, D.
J. (2006) Criminal careers and life success: new findings from the Cambridge Study in
Delinquent Development. London: Home Office. Accessed at:
<http://www.psychblog.co.uk/ForensicPsych/OriginalStudies/16456515851247828851.pdf>
Fazey, C. (1991) The consequences of illegal drug use. Policing and Prescribing: The British
System of Drug Control. London: Macmillan.
Field, S. (1990) Trends in Crime and their Interpretation: A study of recorded crime in post war
England and Wales. London: Home Office. Accessed at:
<http://webarchive.nationalarchives.gov.uk/20110218135832/http://rds.homeoffice.gov.uk/rds/p
dfs05/hors119.pdf>
Field, S. (1999) Trends in Crime Revisited. London: Home Office. Accessed at:
<http://webarchive.nationalarchives.gov.uk/20110220105210/rds.homeoffice.gov.uk/rds/pdfs/ho
rs195.pdf>
Frisher, M. and Forsyth, A. (2009) ‘Assessing the validity of recent estimates of problematic
drug use in England’, J. Epidemiol. Community Health, vol. 63 (1), pp 87–88. Accessed at:
<http://www.sccjr.ac.uk/wp-
content/uploads/2009/01/Assessing_the_Validity_of_Recent_Estimates.pdf>

66 The heroin epidemic of the 1980s and 1990s and its effect on crime trends - then and now
Frisher, M., Heatlie, H. and Hickman, M. (2007) ‘Validating estimates of problematic drug use
in England’, BMC Public Health, vol. 7, p 286. Available at:
<http://www.biomedcentral.com/1471-2458/7/286>
Frischer, M., Hickman, M., Kraus, L., Mariani, F., & Wiessing, L. (2001) `A comparison of
different methods for estimating the prevalence of problematic drug misuse in Great Britain’,
Addiction, vol. 96(10), pp 1465-1476. Available at:
<http://onlinelibrary.wiley.com/doi/10.1046/j.1360-0443.2001.9610146510.x/abstract>
Frisher, M., Martino, O., Crome, I. and Croft, P. (2009) ‘Trends in drug misuse recorded in
primary care in the UK from 1998 to 2005’, J. Public Health (Oxf.), vol. 31 (1), pp 69–73.
Available at: <http://www.ncbi.nlm.nih.gov/pubmed/18836199>
Gallet, C. A. (2014). `Can Price Get The Monkey Off Our Back? A Meta‐Analysis Of Illicit Drug
Demand’, Health economics, vol. 23(1), pp 55-68. Available at:
<http://onlinelibrary.wiley.com/doi/10.1002/hec.2902/full>
Godfrey, C., Eaton, G., McDougall, C. and Culyer, A. (2002) The economic and social costs
of Class A drug use in England and Wales, 2000. Home Office Research, Development and
Statistics Directorate. Accessed at:
<http://drogfokuszpont.hu/wpcontent/uploads/kokk_economic_social_cost_england.pdf>
Goldstein, P.J. (1985) `The Drugs/Violence Nexus: A Tripartite Conceptual Framework’,
Journal of Drug Issues vol. 39 pp 143-174. Accessed at:
<http://www.drugpolicy.org/docUploads/nexus.pdf>
Gossop, M., Griffiths, P., Powis, B. and Strang, J. (1994) `Cocaine: patterns of use, route of
administration, and severity of dependence’, The British Journal of Psychiatry, vol. 164(5),pp
660-664. Available at: <http://bjp.rcpsych.org/content/164/5/660.short>
Greene, M. H. and Dupont, R. L. (1974) ‘Heroin Addiction Trends’, Am. J. Psychiatry, vol. 131,
May 1974, pp 545–550. Available at: <http://psycnet.apa.org/psycinfo/1974-30381-001>
Griffiths, P., Gossop, M., Powis, B. and Strang, J. (1994) ‘Transitions in patterns of heroin
administration: a study of heroin chasers and heroin injectors’, Addiction, vol. 89 (3), pp 301–
309. Available at: <http://onlinelibrary.wiley.com/doi/10.1111/j.1360-0443.1994.tb00896.x/full>
Hamilton, A. B. and Grella, C. B. (2009) ‘Gender Differences Among Older Heroin Users’,
Journal of women & aging, vol. 21(2), pp 111-124. Available at:
<http://www.ncbi.nlm.nih.gov/pmc/articles/PMC2733531/>

67 The heroin epidemic of the 1980s and 1990s and its effect on crime trends - then and now
Hammersley, R., Forsyth, A., Morrison, V., & Davies, J. B. (1989) `The Relationship Between
Crime and Opioid Use’ British Journal of Addiction, vol. 84(9), pp 1029-1043. Available at:
<http://onlinelibrary.wiley.com/doi/10.1111/j.1360-0443.1989.tb00786.x/abstract>
Hammersley, R., Forsyth, A., & Lavelle, T. (1990) `The criminality of new drug users in
Glasgow’, British Journal of Addiction, vol. 85(12), pp 1583-1594. Available at:
<http://onlinelibrary.wiley.com/doi/10.1111/j.1360-0443.1990.tb01646.x/abstract>
Hartnoll, R., Lewis, R., Mitcheson, M. and Bryer, S. (1985) `Estimating the prevalence of
opioid dependence’, The Lancet, vol. 325 (8422), pp 203-205. Available at:
<http://cat.inist.fr/?aModele=afficheN&cpsidt=9242600>
Haw, S. (1985) Drug Problems in Greater Glasgow. London: Chameleon Press.
Hay, G., dos Santos, A. R. and Millar, T. (2012) Estimates of the Prevalence of Opiate Use
and/or Crack Cocaine Use, 2010/11: Sweep 7 report. Available at:
<http://www.nta.nhs.uk/uploads/estimatesoftheprevalenceofocu201011%5B0%5D.pdf>
Hay, G., Gannon, M., MacDougall, J., Millar, T., Eastwood, C., McKeganey, N. and Gordon,
L. (2006) ‘Local and national estimates of the prevalence of opiate use and/or crack cocaine
use (2004/05)’. In Measuring different aspects of problem drug use: Methodological
developments, Singleton, N. Murray, R. and Tinsley, L. (eds). London: Home Office.
Hayhurst, K., Jones, A., Millar, T., Pierce, M., Davies, L., Weston, S. and Donmall, M.
(2012) ‘Drug spend and acquisitive offending by substance misusers’, Drug and Alcohol
Dependence Vol. 130, Issues 1–3, June 2013, pp 24–29.
Available at: <http://www.sciencedirect.com/science/article/pii/S0376871612004073>
Heyman, G. (2004) ‘Quitting Drugs: Quantitative and Qualitative Features’, Annual Review of
Clinical Psychology, vol. 9, pp 29–59. Available at:
<http://www.annualreviews.org/doi/abs/10.1146/annurev-clinpsy-032511-143041> Accessed ?.
Hickman, M., Carnwath, M. Z., Madden, M. P., Farrell, M., Rooney, C., Ashcroft, R. &
Stimson, G. (2003). Drug-related mortality and fatal overdose risk: pilot cohort study of heroin
users recruited from specialist drug treatment sites in London. Journal of Urban Health, vol.
80(2), pp 274-287. Accessed at:
<http://www.ncbi.nlm.nih.gov/pmc/articles/PMC3456282/pdf/11524_2006_Article_214.pdf>

68 The heroin epidemic of the 1980s and 1990s and its effect on crime trends - then and now
Hickman, M., Griffin, M., Mott, J., Corkery, J., Madden, P., Sondhi, A. and Stimson, G.
(2004) ‘Continuing the epidemiological function of the addicts index –evidence from matching
the Home Office Addicts Index with the National Drug Treatment Monitoring System’, Drugs:
Education, Prevention, Policy, vol. 11 (2), pp 91–100. Available at:
<http://informahealthcare.com/doi/abs/10.1080/0968763031000121562>
Hickman, M., Seaman, S., & De Angelis, D. (2001). `Estimating the relative incidence of
heroin use: application of a method for adjusting observed reports of first visits to specialized
drug treatment agencies’, American Journal of Epidemiology, vol. 153(7), pp. 632-641.Available
at: <http://aje.oxfordjournals.org/content/153/7/632.long>
Holloway, K. and Bennett, T. (2004) The results of the first two years of the NEW-ADAM
programme. London: Home Office. Accessed at:
<http://collection.europarchive.org/tna/20040722012352/http://www.homeoffice.gov.uk/rds/pdfs0
4/rdsolr1904.pdf>
Hope, V. D., Hickman, M. and Tilling, K. (2005) ‘Capturing crack cocaine use: estimating the
prevalence of crack cocaine use in London using capture–recapture with covariates’, Addiction,
vol. 100(11), pp 1701-1708. Available at: <http://onlinelibrary.wiley.com/doi/10.1111/j.1360-
0443.2005.01244.x/full>
Hops, H., Tildesley, E., Lichtenstein, E., Ary, D. and Sherman, L. (1990) ‘Parent adolescent
problem-solving interactions and drug use’, American Journal of Drug and Alcohol Abuse, vol.
16, pp 239–258.
Hser, Y. I. (2007) `Predicting long-term stable recovery from heroin addiction: Findings from a
33-year follow-up study’, Journal of Addictive Diseases, vol. 26(1), pp 51-60. Available at:
<http://www.oatc.ca/wp-content/uploads/2013/04/Predicting-Long-Term-Stable-Recovery-from-
long-term-heroin-addiction.pdf>
Hser, Y. I., Hoffman, V., Grella, C. E., & Anglin, M. D. (2001) `A 33-year follow-up of narcotics
addicts’, Archives of general psychiatry, vol. 58(5), pp 503-508.
Hughes, P. H., Barker, N. W., Crawford, G. A., & Jaffe, J. H. (1972) `The natural history of a
heroin epidemic’, American Journal of Public Health, vol. 62(7), pp995-1001. Accessed at:
<http://www.ncbi.nlm.nih.gov/pmc/articles/PMC1530426/pdf/amjph00729-0095.pdf>
Hughes, P. H., & Rieche, O. (1994) `Heroin epidemics revisited’, Epidemiologic reviews, vol.
17(1), pp 66-73. Available at: <http://europepmc.org/abstract/MED/8521947>

69 The heroin epidemic of the 1980s and 1990s and its effect on crime trends - then and now
Hunt, L. G., & Chambers, C. D. (1976) The heroin epidemics: a study of heroin use in the
United States, 1965-1975. New York, New York: Spectrum Publications. Available at:
<http://www.getcited.org/pub/101602503>
Hutchinson, S. J., Bird, S. M., Taylor, A., & Goldberg, D. J. (2006). `Estimating the
prevalence, incidence and cessation of injecting drug use in Glasgow 1960–2000: Combining
expert opinion with capture–recapture prevalence data’, International Journal of Drug Policy,
vol. 17(1), pp 29-34.
Inciardi, J. A. (1979) `Heroin use and street crime’, Crime & Delinquency, vol. 25(3), pp 335-
346. Available at: <http://cad.sagepub.com/content/25/3/335.short>
Inciardi, J. A., McBride, D., & Surratt, H. (1998) `The heroin street addict: profiling a national
population’, Heroin in the age of crack-cocaine, Thousand Oaks, CA: Sage, pp 31-50.
Jarvis, G. and Parker, H. (1989) ‘Young Heroin Users and Crime’, Brit. J. Criminol., vol. 29 (2),
Spring 1989. Available at:
<http://heinonline.org/HOL/LandingPage?collection=journals&handle=hein.journals/bjcrim29&di
v=19&id=&page>
Johnson, B. D., Wish, E. D., Schmeidler, J. and Huizinga, D. (1991) ‘Concentration of
delinquent offending: Serious drug involvement and high delinquency rates’, Journal of Drug
Issues, vol. 21 (2), pp 205–229. Available at: <http://psycnet.apa.org/psycinfo/1991-30634-001>
Johnson, B. D., Golub, A., & Fagan, J. (1995) `Careers in crack, drug use, drug distribution,
and nondrug criminality’, Crime & Delinquency, vol. 41(3), pp 275-295. Accessed at:
<https://www.ncjrs.gov/pdffiles1/Digitization/153430NCJRS.pdf>
Johnson, D. (2001) Age of illicit drug initiation, Australian Institute of Criminology. Accessed at:
<http://faculty.kfupm.edu.sa/DCC/ahamdan/_notes/docs/Age%20of%20illicit%20drug%20initiati
on.pdf>
Joyce, T. (2004) ‘Did Legalized Abortion Lower Crime?’, Journal of Human Resources, vol. 39
(1), pp 1–28. Accessed at: <http://piketty.pse.ens.fr/files/Joyce2001.pdf>
Joyce, T. (2009) ‘A Simple Test of Abortion and Crime’, Review of Economics and Statistics,
vol. 91(1), pp 112-123. Accessed at:
<http://zicklin.baruch.cuny.edu/faculty/profiles/papers/joyce9.pdf>

70 The heroin epidemic of the 1980s and 1990s and its effect on crime trends - then and now
Kahane, L., Paton, D. and Simmons, R. (2005) The abortion-crime link: evidence from
England and Wales, Lancaster University Management School Working Paper 2005/06.
Accessed at: <http://eprints.lancs.ac.uk/30519/1/003054.pdf>
Kaufman, A. S. (2001) `How dangerous are low (not moderate or high) doses of lead for
children's intellectual development?’, Archives of clinical Neuropsychology, vol. 16(4), pp 403-
431. Accessed at: <http://courses.washington.edu/bethics/Lead/Kaufman2001reply.pdf>
Kaya, C. Y., Tugai, Y., Filar, J. A., Agrawal, M. R., Ali, R. L., Gowing, L. R., & Cooke, R.
(2004). `Heroin users in Australia: population trends’, Drug and alcohol review, vol. 23(1), pp
107-116. Available at:
<http://informahealthcare.com/doi/abs/10.1080/09595230410001645600>
Kaye, S., Darke, S., & Finlay-Jones, R. (1998) ‘The onset of heroin use and criminal
behaviour: does order make a difference?’ Drug and alcohol dependence, vol. 53(1), pp 79-86.
Available at: <http://www.sciencedirect.com/science/article/pii/S0376871698001070>
Keen, J., Rowse, G., Mathers, N., Campbell, M. and Seivewright, N. (2000) ‘Can methadone
maintenance for heroin-dependent patients retained in general practice reduce criminal
conviction rates and time spent in prison?’, Br. J. Gen. Pract., vol. 50 (450), January 2000, pp
48–49. Available at: <http://www.ncbi.nlm.nih.gov/pmc/articles/PMC1313612/>
Killias, M., & Ribeaud, D. (1999). `Drug use and crime among juveniles. An international
perspective’, Studies on crime and crime prevention, vol. 8, pp 189-209.
Killias, M., Aebi, M. F., & Jurist, K. (2000) `The impact of heroin prescription on heroin
markets in Switzerland’, Crime Prevention Studies vol. 11, pp 83-100.
Kilpatrick, D. G., Acierno, R., Saunders, B., Resnick, H. S., Best, C. L. and Schnurr, P. P.
(2000) ‘Risk factors for adolescent substance abuse and dependence: data from a national
sample’, J. Consult. Clin. Psychol., vol. 68 (1), February 2000, pp 19–30.
Kinlock, T. W., Hanlon, T. E., & Nurco, D. N. (1998) `Heroin use in the United States: History
and present developments’, in Heroin in the age of crack-cocaine, Thousand Oaks, CA: Sage,
pp 1-30.
Klee, H. and Morris, J. (1994) ‘Crime and Drug Misuse: Economic and Psychological Aspects
of the Criminal Activities of Heroin and Amphetamine Injectors’, Addiction Research & Theory,
vol. 1 (4), pp 377–386. Available at:
<http://informahealthcare.com/doi/abs/10.3109/16066359409005204>

71 The heroin epidemic of the 1980s and 1990s and its effect on crime trends - then and now
Klick, J., & Tabarrok, A. (2004) `Using terror alert levels to estimate the effect of police on
crime’ in American Law & Economics Association Annual Meetings (p. 38). Bepress. Accessed
at:
<http://theunbrokenwindow.com/Labor%20Economics/USING%20TERROR%20ALERT%20LE
VELS%20TO%20ESTIMATE%20THE.pdf>
Kosviner, A., Mitcheson, M. C., Ogborne, A., Myers, K., Stimson, G. V., Zacune, J., &
Edwards, G. (1968) `Heroin use in a provincial town’, The Lancet, vol. 291(7553), pp 1189-
1192. Available at: <http://www.sciencedirect.com/science/article/pii/S0140673668918813>
Kozel, N. J., & Adams, E. H. (1986) `Epidemiology of drug abuse: an overview’, Science
(Washington), vol. 334(4779), pp 970-974. Accessed at:
<http://www.reviewingaids.com/awiki/files/PHDDC/KOZ.PDF>
Laub, J. H., Nagin, D. S. and Sampson. R. J. (1998) ‘Trajectories of Change in Criminal
Offending: Good Marriages and the Desistance Process’, American Sociological Review, vol.
63, pp 225–238.
Leri, F., Bruneau, J., & Stewart, J. (2003) `Understanding polydrug use: review of heroin and
cocaine co‐use’, Addiction, vol. 98, pp 7–22. Accessed at: <http://www.oatc.ca/wp-
content/uploads/2013/04/Understanding.polydrug.use_.among_.MMT_.patients.pdf>
Levengood, R., Lowinger, P., & Schooff, K. (1973) `Heroin addiction in the suburbs--an
epidemiologic study’, American journal of public health, vol. 63(3), pp 209-214. Accessed at:
<http://www.ncbi.nlm.nih.gov/pmc/articles/PMC1775144/pdf/amjph00816-0023.pdf>
Levitt, S. D. (2004) ‘Understanding Why Crime Fell in the 1990s: Four Factors That Explain the
Decline and Six That Do Not’, The Journal of Economic Perspectives, vol. 18 (1), pp 163–190.
Machin, S., & Meghir, C. (2004) `Crime and economic incentives’, Journal of Human
Resources, vol. 39(4), pp 958-979. Available at:
<http://www.jstor.org/discover/10.2307/3559034?uid=3738032&uid=2&uid=4&sid=21102898595
831>
Matrix Knowledge Group (2007) The illicit drug trade in the United Kingdom. London: Home
Office. Accessed at:
<http://webarchive.nationalarchives.gov.uk/20110220105210/rds.homeoffice.gov.uk/rds/pdfs07/
rdsolr2007.pdf>

72 The heroin epidemic of the 1980s and 1990s and its effect on crime trends - then and now
Mattick, R. P., Breen, C., Kimber, J., & Davoli, M. (2009), `Methadone maintenance therapy
versus no opioid replacement therapy for opioid dependence’, Cochrane Database Syst Rev 3,
Issue 3. Accessed at: <http://www.update-software.com/pdf/CD002209.pdf>
McElrath, K. (2002) Prevalence of Problem Heroin Use in Northern Ireland. Belfast:
Department of Health, Social Services and Public Safety. Accessed at:
<http://www.dhsspsni.gov.uk/print/heroin_use_ni.pdf>
Millar T., Craine, N., Carnwath, T. and Donmall, M. (2001) `The dynamics of heroin use;
implications for intervention’, J Epidemiol Community Health, vol. 55 (12), pp 930-933. Available
at: <http://jech.bmj.com/content/55/12/930.full>
Millar, T., Gemmell, I., Hay, G., & Donmall, M. (2004) The Dynamics of Drug Misuse:
assessing changes in prevalence. London: Home Office.
Millar, T., Ahmad, M., Richardson, A., Skodbo, S., Donmall M., and Jones, A. (2012) The
Drug Data Warehouse: Linking data on drug misusers and drug-misusing offenders. Home
Office, UK. Accessed at:
<https://www.gov.uk/government/uploads/system/uploads/attachment_data/file/116521/horr63-
report.pdf>
Mills, H., Skodbo, S., Blyth, P. (2013) Understanding Organised Crime: Estimating the Scale
and the Social and Economic Costs. London: Home Office. Accessed at:
<https://www.gov.uk/government/uploads/system/uploads/attachment_data/file/246390/horr73.p
df >.
Ministry of Justice (2013) Story of the Prison Population: 1993 – 2012, England and Wales.
London: Ministry of Justice. Accessed at:
<https://www.gov.uk/government/uploads/system/uploads/attachment_data/file/218185/story-
prison-population.pdf>
Moffitt, T. E. (1996). `Measuring children's antisocial behaviors’, Jama, vol. 275(5), pp 403-404.
Available at: <http://jama.jamanetwork.com/article.aspx?articleid=395806>
Moffitt, T. E., Caspi, A., Harrington, H. and Milne, B. J. (2002) ‘Males on the life-course-
persistent and adolescence-limited antisocial pathways: follow-up at age 26 years’, Dev.
Psychopathol., vol. 14 (1), Winter 2002, pp 179–207.
Needleman, H. L., McFarland, C., Ness, R. B., Fienberg, S. E., & Tobin, M. J. (2002) `Bone
lead levels in adjudicated delinquents: a case control study’, Neurotoxicology and teratology,
vol. 24(6), pp 711-717. Accessed at: <http://www.precaution.org/lib/covanta_41.pdf>

73 The heroin epidemic of the 1980s and 1990s and its effect on crime trends - then and now
Nevin, R. (2007) `Understanding international crime trends: the legacy of preschool lead
exposure’, Environmental research, vol, 104(3), pp 315-336. Accessed at: <http://mpra.ub.uni-
muenchen.de/35338/1/MPRA_paper_35338.pdf>
Nordt, C. and Stohler, R. (2006) ‘Incidence of heroin use in Zurich, Switzerland: a treatment
case register analysis’, Lancet, vol. 367, pp 1830–1834. Accessed at: <http://www.puk-
west.uzh.ch/research/substanzstoerungen/Nordt_Stohler_Lancet_2006.pdf>
Nurco, D. N., Hanlon, T. E., Kinlock, T. W., & Duszynski, K. R. (1989) `The consistency of
types of criminal behavior over preaddiction, addiction, and nonaddiction status periods’,
Comprehensive psychiatry, vol. 30(5), pp391-402. Available at:
<http://europepmc.org/abstract/MED/2791532>
O’Hare, P. (2007) `Merseyside, the first harm reduction conferences, and the early history of
harm reduction’, International Journal of Drug Policy, vol. 18(2), pp 141-144 Accessed at:
<http://www.canadianharmreduction.com/sites/default/files/Merseyside%20-
%20Early%20Hx%20of%20HR%20-%202007.pdf>
ONS (2012) Trends in Crime – A Short Story 2011/12. Office for National Statistics: London.
Accessed at: http://www.ons.gov.uk/ons/rel/crime-stats/crime-statistics/period-ending-march-
2012/trends-in-crime--a-short-story.html
ONS (2013a) Crime in England and Wales, Year Ending March 2013. Office for National
Statistics: London. Accessed at: <http://www.ons.gov.uk/ons/dcp171778_318761.pdf>
ONS (2013b) Crime against businesses: Detailed findings from the 2012 Commercial
Victimisation Survey. Office for National Statistics: London. Accessed at:
<https://www.gov.uk/government/uploads/system/uploads/attachment_data/file/207818/crime-
against-businesses-detailed-12.pdf>
Parker, H. (2004). `Heroin epidemics and social exclusion in the UK, 1980–2000. Heroin
Addiction and The British System: Volume I Origins and Evolution, 171. Available at:
<http://books.google.co.uk/books?hl=en&lr=&id=IxF78IYnJdIC&oi=fnd&pg=PA71&ots=2Pqz2H0
n0v&sig=pSm-D2RfDE0ysh_JvcxEXb-95ps#v=onepage&q&f=false>
Parker, H., Bakx, K. and Newcombe, R. (1988) Living With Heroin. Milton Keynes: Open
University Books.
Available at: <https://www.ncjrs.gov/App/Publications/abstract.aspx?ID=125283>
Parker, H., Bury, C., & Egginton, R. (1998). New heroin outbreaks amongst young people in
England and Wales. London: Home Office. Accessed at:
<http://www.drugsandalcohol.ie/3604/1/Home_Office_New_heroin_outbreaks.pdf>

74 The heroin epidemic of the 1980s and 1990s and its effect on crime trends - then and now
Parker, H. and Kirby, P. (1996) Methadone Maintenance and Crime Reduction on Merseyside,
Crime Detection and Prevention Series Paper 72. Available at:
<https://www.ncjrs.gov/app/abstractdb/AbstractDBDetails.aspx?id=163701>
Parker H. and Newcombe, R. (1987) ‘Heroin Use and Acquisitive Crime in an English
Community’, British Journal of Sociology, vol. XXXVIII (3), pp 331–350. Available at:
<http://www.jstor.org/discover/10.2307/590692?uid=3738032&uid=2&uid=4&sid=211026799770
71>
Parker, J. and Gay, M. (1987) ‘Problem drug users known to Bristol general Practitioners’,
Journal of the royal college of general practitioners. Accessed at:
<http://www.ncbi.nlm.nih.gov/pmc/articles/PMC1710892/pdf/jroyalcgprac00030-0021.pdf>
Pearson, G. (1987) The New Heroin Users. Oxford, UK: Blackwell. Available at:
<http://www.getcited.org/pub/102608390>
Pedersen, W., & Skardhamar, T. (2010) `Cannabis and crime: Findings from a longitudinal
study’, Addiction, vol. 105(1), pp 109-118. Available at:
<http://onlinelibrary.wiley.com/doi/10.1111/j.1360-0443.2009.02719.x/abstract>
Pinker, S. (2008) The Better Angels of our Nature: The decline of violence in history and its
causes. Penguin: UK. Available at:
<http://www.law.yale.edu/documents/pdf/Intellectual_Life/LTW-Pinker.pdf>
Pudney, S. (2002) The road to ruin? Sequences of initiation into drug use and
offending by young people in Britain. London: Home Office. Accessed at:
<http://webarchive.nationalarchives.gov.uk/20110218135832/http://rds.homeoffice.gov.uk/rds/p
dfs2/hors253.pdf>
Quinton, P., & Morris, J. (2008) `Neighbourhood policing: the impact of piloting and early
national implementation’, London: Home Office. London: Home Office. Accessed at:
<http://socialwelfare.bl.uk/subject-areas/services-activity/criminal-
justice/homeoffice/141882rdsolr0108.pdf>
Reyes, J. W. (2007). Environmental policy as social policy? The impact of childhood lead
exposure on crime. The BE Journal of Economic Analysis & Policy, 7(1). Accessed at:
<http://www3.amherst.edu/~jwreyes/papers/LeadCrime.pdf>
Rosenfeld, R., & Fornango, R. (2007) `The impact of economic conditions on robbery and
property crime: the role of consumer sentiment’, Criminology, vol. 45(4), pp 735-769. Accessed
at: <http://www.soc.umn.edu/~uggen/Rosenfeld_CRIM_07.pdf>

75 The heroin epidemic of the 1980s and 1990s and its effect on crime trends - then and now
Rosenfeld, R., Fornango, R. and Rengifo, A. F. (2007) ‘Impact of Order-Maintenance Policing
on New York City Homicide and Robbery Rates: 1988–2001’, Criminology, vol. 45 (2), May
2007, pp 355–384.
Ross, N. (2013) Crime: How to solve it – and why so much of what we’re told is wrong. Great
Britain: Biteback Publishing.
Rossi, C. (2002). `A mover-stayer type model for epidemics of problematic drug use’, Bulletin
on narcotics, pp 39-64. Accessed at: <http://ungift.org/pdf/bulletin_2001-01-01_1.pdf#page=46>
Reuter, P. and Stevens, A. (2007) An Analysis of UK Drug Policy A Monograph Prepared for the UK Drug Policy Commission. UK Drug Policy Commission:
Accessed at: <http://kar.kent.ac.uk/13332/1/analysis_of_UK_drug_policy.pdf>
Saffer, H. and Chaloupka, F. (1995) ‘The Demand for Illicit Drugs’, Economic Inquiry, vol. 37
(3). Accessed at: <http://druglibrary.org/schaffer/misc/w5238.pdf>
Sampson, R. J., & Laub, J. H. (2005). `A life-course view of the development of crime’, The
Annals of the American Academy of Political and Social Science, vol. 602(1), pp 12-45.
Available at: <http://psycnet.apa.org/psycinfo/2005-12846-001>
Sen, A. (2007) ‘Does Increased Abortion Lead to Lower Crime? Evaluating the Relationship
Between Crime, Abortion and Fertility’, The B. E. Journal of Economic Analysis and Policy, vol.
7 (1). Accessed at: <http://socserv.mcmaster.ca/bjerk/PublicPapers/AnindyaSen1.pdf>
Shaffer, J. W., Nurco, D. N., & Kinlock, T. W. (1984) `A new classification of narcotic addicts
based on type and extent of criminal activity’ Comprehensive psychiatry, vol. 25(3), pp 315-328.
Available at: <https://www.ncjrs.gov/App/AbstractDB/AbstractDBDetails.aspx?id=102178>
Silverman, L. P. and Spruill, N. L. (1977) ‘Urban crime and the price of heroin’, Journal of
Urban Economics, vol. 4 (1), January 1977, pp 80–103. Available at:
<http://www.sciencedirect.com/science/article/pii/0094119077900328>
Singleton, N., Farrell, M., & Meltzer, H. (2003) `Substance misuse among prisoners in
England and Wales’ International Review of Psychiatry, vol. 15(1-2), pp 150-152. Accessed at:
<http://informahealthcare.com/doi/pdf/10.1080/0954026021000046092>
Stevens, A. (2007) `When two dark figures collide: Evidence and discourse on drug-related
crime’ Critical Social Policy, vol. 27(1), pp 77-99. Accessed at:
<http://kar.kent.ac.uk/29895/1/Stevens%202007_WhenTwoDarkFigures.pdf>

76 The heroin epidemic of the 1980s and 1990s and its effect on crime trends - then and now
Stewart, D., Gossop, M., Marsden, J., & Rolfe, A. (2000) `Drug misuse and acquisitive crime
among clients recruited to the National Treatment Outcome Research Study (NTORS)’, Criminal
Behaviour and Mental Health, vol. 10(1), pp 10-20. Available at:
<http://onlinelibrary.wiley.com/doi/10.1002/cbm.339/abstract>
Strang, J., Griffiths, P., & Gossop, M. (1990) `Crack and cocaine use in South London drug
addicts: 1987–1989’, British journal of addiction, vol. 85(2), pp 193-196. Available at:
<http://onlinelibrary.wiley.com/doi/10.1111/j.1360-0443.1990.tb03070.x/abstract>
Strang, J. and Taylor, C. (1997) ‘Different Gender and Age Characteristics of the UK Heroin
Epidemic of the 1990s Compared to the 1980s’, European Addiction Research, vol. 3, pp 43–
48. Available at: <http://www.karger.com/Article/Abstract/259146>
Sumnall, H. R., Bellis, M. A., Cole, J. C., & McVeigh, J. (2005) `Crack-cocaine injection: A
retrospective analysis of clients in Merseyside specialist drug treatment agencies’, Drugs:
Education, Prevention, and Policy, vol. 12(3), pp 213-221. Available at:
<http://informahealthcare.com/doi/abs/10.1080/0968763042000322648>
Sutton, A. J., Gay, N. J., Edmunds, W. J., Andrews, N. J., Hope, V. D., & Gill, O. N. (2005)
`Modelling the characteristics of the male injecting drug user population in England and Wales’,
International Journal of Drug Policy, vol. 16(3), pp 176-182. Available at:
<http://www.ijdp.org/article/S0955-3959(04)00124-0/abstract>
Sutton, M., & Maynard, A. (1992) What is the Size and Nature of the Drug Problem in the UK?
Centre for Health Economics, University of York. Accessed at:
<http://www.york.ac.uk/media/che/documents/papers/yartic/YARTIC%20Occasional%20Paper
%203.pdf>
Sweeting, M. J., De Angelis, D., Ades, A. E., & Hickman, M. (2009), `Estimating the
prevalence of ex-injecting drug use in the population’, Statistical Methods in Medical Research,
vol. 8(4), pp 381-395. Available at: <http://smm.sagepub.com/content/18/4/381.short>
Vollaard, B., and Hamed, J. (2012). `Why the Police Have an Effect on Violent Crime After All:
Evidence from the British Crime Survey’. Journal of Law and Economics, vol. 55(4), pp 901-924.
Vollaard, B., & Van Ours, J. C. (2011) `Does Regulation of Built‐in Security Reduce Crime?
Evidence from a Natural Experiment’, The Economic Journal, vol. 121(552), pp 485-504.
Accessed at: <http://ist-socrates.berkeley.edu/~raphael/IGERT/Workshop/Crime-
March2010.pdf>

77 The heroin epidemic of the 1980s and 1990s and its effect on crime trends - then and now
Wagstaff, A., & Maynard, A. (1988) Economic aspects of the illicit drug market and drug
enforcement policies in the United Kingdom. HM Stationery Office. Accessed at:
<http://library.npia.police.uk/docs/hors/hors95.pdf>
Welte, J. W., Barnes, G. M., Hoffman, J. H., Wieczorek, W. F., & Zhang, L. (2005)
`Substance involvement and the trajectory of criminal offending in young males’, The American
journal of drug and alcohol abuse, vol. 31(2), pp 267-284. Available at:
<http://informahealthcare.com/doi/abs/10.1081/ADA-47934>
White, H. R., & Gorman, D. M. (2000) `Dynamics of the drug-crime relationship’, Criminal
justice, vol. 1(15), pp 1-218. Accessed at: <http://www.dldocs.stir.ac.uk/documents/02d.pdf>
Wolfgang, M. E., Figlio, R. M. and Sellin, T. E. (1972) Delinquency in a Birth Cohort. Chicago:
University of Chicago Press.
Wright, J. P., Dietrich, K. N., Ris, M. D., Hornung, R. W., Wessel, S. D., Lanphear, B. P.,
and Rae, M. N. (2008) `Association of prenatal and childhood blood lead concentrations with
criminal arrests in early adulthood’, PLoS Medicine, vol. 5(5), e101. Available at:
<http://www.plosmedicine.org/article/info%3Adoi%2F10.1371%2Fjournal.pmed.0050101>
Yates, R. (2002) ‘A Brief History of British Drug Policy, 1950-2001’, Drugs: Education,
Prevention, and Policy, vol. 9 (2), pp 113–124. Accessed at:
<https://dspace.stir.ac.uk/bitstream/1893/1135/1/1950-2001.pdf>
Zimring, F. E. (2001) The Great American Crime Decline. US: Oxford University Press.
Zimring, F. E. (2012) The City that Became Safe: New York’s Lessons for Urban Crime and its
Control. New York, US: Oxford University Press.
Zinberg, N. E., Harding, W. M., Stelmack, S. M., & Marblestone, R. A. (1978) `Patterns of
heroin use’, Annals of the New York Academy of Sciences, vol. 311(1), pp 10-24. Available at:
<http://onlinelibrary.wiley.com/doi/10.1111/j.1749-6632.1978.tb16759.x/abstract>

ISBN: 978-1-78246-403-7 ISSN: 1756-3666 Published by the Home Office ©Crown Copyright 2014