research report 585 risk assessment of road stormwater runoff · risk assessment of road stormwater...
TRANSCRIPT

Risk assessment of road stormwater runoff
March 2016 LR Gardinera, J Mooresb, A Osbornea and A Semadeni-Daviesb a MWH New Zealand Ltd, Wellington b National Institute of Water and Atmospheric Research Ltd, Auckland NZ Transport Agency research report 585 Contracted research organisation – MWH New Zealand Ltd.

ISBN 978-0-478-44589-3 (electronic) ISSN 1173-3764 (electronic)
NZ Transport Agency Private Bag 6995, Wellington 6141, New Zealand Telephone 64 4 894 5400; facsimile 64 4 894 6100 [email protected] www.nzta.govt.nz
Gardiner, LR, J Moores, A Osborne and A Semadeni-Davies (2016) Risk assessment of road stormwater runoff. NZ Transport Agency research report 585. 146pp.
MWH New Zealand Ltd was contracted by the NZ Transport Agency in 2014 to carry out this research.
This publication is copyright © NZ Transport Agency 2016. Material in it may be reproduced for personal or in-house use without formal permission or charge, provided suitable acknowledgement is made to this publication and the NZ Transport Agency as the source. Requests and enquiries about the reproduction of material in this publication for any other purpose should be made to the Manager National Programmes, Investment Team, NZ Transport Agency, at [email protected].
Keywords: case study, coast, contaminants, copper, estuary, load reduction, modelling, receiving environment, risk assessment, rivers, road runoff, stormwater, streams, traffic, vehicle emissions, zinc.

An important note for the reader
The NZ Transport Agency is a Crown entity established under the Land Transport Management Act 2003. The objective of the Agency is to undertake its functions in a way that contributes to an efficient, effective and safe land transport system in the public interest. Each year, the NZ Transport Agency funds innovative and relevant research that contributes to this objective.
The views expressed in research reports are the outcomes of the independent research, and should not be regarded as being the opinion or responsibility of the NZ Transport Agency. The material contained in the reports should not be construed in any way as policy adopted by the NZ Transport Agency or indeed any agency of the NZ Government. The reports may, however, be used by NZ Government agencies as a reference in the development of policy.
While research reports are believed to be correct at the time of their preparation, the NZ Transport Agency and agents involved in their preparation and publication do not accept any liability for use of the research. People using the research, whether directly or indirectly, should apply and rely on their own skill and judgement. They should not rely on the contents of the research reports in isolation from other sources of advice and information. If necessary, they should seek appropriate legal or other expert advice.

Acknowledgements
The authors wish to thank the following individuals and organisations:
• The NZ Transport Agency for commissioning this research.
• The Steering Group for their insight and direction: Carol Bannock (Chair: NZ Transport Agency), Andy Irwin (Auckland Transport), Hayley Vujcich (Greater Wellington Regional Council), Nicci Wood (Wellington City Council), Peter Mitchell (Auckland Motorways) and Warren Bird (Opus, Auckland).
• Carol Bannock for her encouragement as the Research Owner, Sarah Lindberg for her initial role in this capacity and Rob Hannaby for his support (all NZ Transport Agency).
• Juliet Milne (Greater Wellington Regional Council) and Bruce Williamson (Diffuse Sources Ltd) for their expertise and technical advice in completing the peer review.
• MWH colleagues Caroline van Halderen and Richard Peterson for their contribution on the planning and legislative context (Chapter 3).
• NIWA colleagues Dr Craig Depree and Dr Chris Hickey for guidance on the development of the risk assessment methodology, and Dr Jennifer Gadd for a helpful review of a draft version of this report.
• Dr Joanne Clapcott of Cawthron Institute for the provision of modelled MCI data, Dr Richard Storey of NIWA for advice on its use and the Ministry for the Environment for granting approval for the use of those data in this study.
Contents
Executive summary ................................................................................................................................................ 7 Abstract ................................................................................................................................................................... 10 1 Introduction ............................................................................................................................................... 11
1.1 Background ......................................................................................................... 11 1.2 Previous research and study context .................................................................... 11 1.3 Purpose and objectives ........................................................................................ 15 1.4 Study overview and outputs ................................................................................. 15 1.5 Report structure .................................................................................................. 17
2 Literature review ..................................................................................................................................... 18 2.1 Introduction ......................................................................................................... 18 2.2 Scope of review .................................................................................................... 18 2.3 Review of road runoff contaminant prediction models .......................................... 18 2.4 Review of models to assess water body sensitivity to road runoff .......................... 22 2.5 Conclusions ......................................................................................................... 29
3 Planning and legislative context ....................................................................................................... 31 3.1 Introduction ......................................................................................................... 31 3.2 Current statutory framework ................................................................................ 31 3.3 Non-statutory frameworks ................................................................................... 35 3.4 Implementation of the NPS-FM and significance for the research project .............. 37 3.5 Focus areas ......................................................................................................... 41 3.6 Implications for RSS model development .............................................................. 44 3.7 Further aspects for consideration ......................................................................... 45
4 Methodology.............................................................................................................................................. 46 4.1 Introduction ......................................................................................................... 46 4.2 Basis for a screening model ................................................................................. 46 4.3 Estimation of contaminant loads .......................................................................... 47 4.4 River and stream risk assessment ........................................................................ 50 4.5 Coast and estuary risk assessment ....................................................................... 51 4.6 Summary of model features, assumptions and limitations .................................... 54
5 Case study evaluation ........................................................................................................................... 59 5.1 Introduction ......................................................................................................... 59 5.2 Case study area ................................................................................................... 59 5.3 Model implementation ......................................................................................... 67 5.4 Results and discussion – rivers and streams risk assessment ................................ 67 5.5 Results and discussion – Pauatahanui Inlet risk assessment .................................. 78 5.6 Results and discussion – Onepoto Arm risk assessment ........................................ 85 5.7 Sensitivity analysis and RSS model validation ........................................................ 95 5.8 Other RSS model applications ............................................................................. 102 5.9 Conclusions from case study .............................................................................. 108
6 Conclusions and recommendations .............................................................................................. 112 6.1 Conclusions ....................................................................................................... 112 6.2 Recommendations ............................................................................................. 114
5

7 References ............................................................................................................................................... 115 Appendix A: Estimation of road traffic loads of copper and zinc ................................................. 119 Appendix B: Estimation of urban loads of copper and zinc ............................................................. 127 Appendix C: Rivers and streams risk assessment ............................................................................... 130 Appendix D: Coasts and estuaries risk assessment ........................................................................... 132 Appendix E: Note on RAMM data issues and remedies ..................................................................... 135 Appendix F: Modelled loads and sediment concentrations of zinc and copper discharged to Pauatahanui Inlet and Onepoto Arm.................................................................................................... 140 Appendix G: Comparison of observed and modelled in- stream concentrations of copper and zinc................................................................................................................................................................. 144 Appendix H: Glossary ...................................................................................................................................... 145
6

Executive summary
Overview
Road runoff may adversely affect aquatic receiving environments. Contaminants in road stormwater discharges are complex. They include fuels, additives, oil and brake and tyre residues containing a variety of toxic and ecotoxic components, such as heavy metals and organic compounds. Receiving environments from road runoff include streams, rivers, lakes, wetlands, estuaries, harbours and the open coastline. The characteristics of these different types of water body influence the fate of contaminant inputs, how they are assimilated and therefore their sensitivity.
Reflecting the need for cost-effective ways of prioritising the management of road runoff in relation to the risk of adverse effects, the NZ Transport Agency commissioned MWH in association with NIWA to develop a screening model that addressed the following research question:
Under what conditions is stormwater run-off likely to cause adverse environmental effects?
Building on earlier research, the aim of this one-year study was to revise and enhance the Transport Agency’s vehicle kilometres travelled (VKT) screening tool for road runoff to allow its wider application to rivers/streams and coasts/estuaries, and to be able to factor in the effects of pathway attenuation, traffic congestion and non-road contaminant sources. While the principal intention was to develop an improved screening method for road networks, the study also considered how this could be extended to provide for an absolute risk assessment in relation to established effects thresholds.
The road stormwater screening (RSS) model developed in this study provides a robust, consistent method for establishing the relative risk of adverse effects from road runoff that can be applied anywhere in New Zealand using existing datasets. Other applications include i) a ‘drill down’ facility to screen the road network for contaminant load ‘hot spots’, ii) apportioning contaminant loads between local roads and state highways and iii) whole of catchment analysis for road contributions.
The RSS model is to be used on a comparative rather than absolute basis for screening road networks and their likely risks to receiving environments. It is intended to provide guidance to network operators and road controlling authorities on the management of road runoff and the development of catchment management plans.
Reflecting uncertainty in the estimation of contaminant loads, the relative contribution of road and non-road sources of copper and zinc in any given sub-catchment estimated by the RSS model should be considered indicative. While these load estimates provide a fit-for-purpose basis for supporting the risk assessment provided by the screening model, any management response is likely to require a targeted investigation of the relative importance of different contaminant sources in a given stormwater catchment.
Literature review
The US Federal Highways Administration and UK Highways Agency have developed relatively sophisticated models which combine the prediction of contaminant loads and assessment of risk based on the sensitivity of receiving waterbodies. In both cases these authorities have had access to large datasets of road runoff quality and have invested considerable resources in the analysis required to support the development of tools which deliver assessments of absolute risk.
The literature review confirmed the suitability of a relative assessment method for the study due to lack of equivalent datasets and resourcing in New Zealand. It also supported adoption of a ‘source-pathway-receptor’ approach where the source is the road section or network that generates a contaminant load in
7

Risk assessment of road stormwater runoff
runoff and the pathway is the route from the road to where the runoff enters the receptor or receiving waterbody (eg river, lake or estuary). The novel inclusion of factors to account for road traffic congestion, road drainage characteristics and urban land use as moderators of contaminant load and hence risk to the waterbody were considered to be feasible. The review favoured risk being assessed using scores based on source strength and receiving environment sensitivity. These aspects have been incorporated into the RSS model. Commonalities in approaches by US and UK agencies provide a template for a New Zealand-based absolute risk assessment method for road runoff as a potential future stage of research.
Planning and legislative review
The review focused on the future approach that regional councils might take for consenting stormwater discharges for road runoff and the potential value of a risk-based process to support consenting approvals/assessments. Of particular importance is the National Policy Statement for Freshwater Management 2014 (NPS-FM), given that it will provide regional councils and unitary authorities with the regulatory framework to set objectives, attributes and limits for water quality. The RSS model is closely aligned with the requirements of the NPS-FM, although it would benefit from inclusion of attribute tables for zinc and copper that may shortly be under consideration by the National Objectives Framework Reference Group.
The road stormwater screening model
The RSS model has been developed using a combination of ESRI ArcGIS and MS Excel. ArcGIS is used to determine data inputs and to map results, adopting the River Environments Classification as the basis for analysis. Excel provides the platform for estimation of contaminant loads and risk. Key concepts underlying the RSS model are:
• the adoption of a source-pathway-receptor conceptual model
• a focus on potential effects of copper and zinc, using New Zealand road runoff sampling data collected under previous Transport Agency research and other complementary studies, recognising that these metals also function as proxies for a wider range of stormwater contaminants
• the ability to assess risk associated with discharges to a range of receiving waterbodies including rivers and streams, and coasts and estuaries.
The VKT screening tool, developed under a 2007 Transport Agency study, provided the starting point for the RSS model. The VKT tool also adopted a source-pathway-receptor approach but was limited to the assessment of depositional receiving environments and assessed risk using VKT by sub-catchment as a proxy for contaminant load. The RSS model has added a range of significant enhancements and new features to the VKT method. These include:
1 A road contaminant load module for estimation of zinc and copper loads at the sub-catchment level from road traffic, vehicle emission factors that vary in relation to traffic congestion, pathway attenuation and conversion of VKT to contaminant load
2 A non-road (urban) contaminant load module for estimating zinc and copper loads at the sub-catchment level from the extent of urban non-road impervious surfaces and contaminant yields for residential and industrial/commercial areas, respectively
3 A method for assessing risk to streams and rivers, based on estimates of in-stream copper and zinc concentrations relative to guideline concentrations combined with a receiving environment sensitivity score indicated by modelled values of the macroinvertebrate community index
8

Executive summary
4 A method for assessing risk to coasts and estuaries, based on estimates of copper and zinc concentrations in sediments delivered to coastal discharge points relative to guideline concentrations combined with a receiving environment sensitivity score determined from the physical depositional characteristics of the water body.
Case study evaluation
The RSS model was evaluated in a case study applied to Te Awarua-o-Porirua Harbour and its catchment. The area was chosen because it comprises a mix of local roads and state highways that discharge to streams of varying dilution potential as well as coastal waterbodies (Pauatahanui Inlet and Onepoto Arm). The sub-catchments of these two waterbodies contain markedly different urban/rural land use (with Onepoto more urbanised), allowing for model evaluation under widely different catchment conditions.
Streams and rivers risk assessment
For the assessment of road-traffic risk to rivers and streams, the majority of reaches are classified as ‘lowest risk’. In most of these sub-catchments, the streams are able to adequately dilute the relatively small copper and zinc loads discharged in road runoff from the limited extent of roads present. Exceptions are the Onepoto Arm sub-catchments and those south of Pauatahanui Inlet containing SH1 and/or relatively dense local road networks, and which are drained by streams with limited dilution potential. Road traffic risk in these sub-catchments is assessed as ‘highest risk’.
In contrast, most sub-catchments containing any urban land use are classified as ‘highest risk’ according to the urban risk assessment. Thus, even in sub-catchments containing relatively limited areas of urban impervious surfaces, loads of copper and zinc are high in relation to stream dilution potential. Only a small proportion of sub-catchments containing urban land are assessed as being in lower risk categories. These results show the importance of including contaminants from other urban sources as well as from road traffic when assessing stormwater risk. Considering road traffic derived contaminants in isolation has the potential to lead to a marked under-assessment of risks to aquatic environments.
Coasts and estuaries risk assessment
The distribution of metal loads at coastal outlets around the Harbour reflects the mix of urban and rural land use and size of the catchments that discharge to these locations. The stormwater risk profile is determined by the combination of contaminant concentration and receiving environment sensitivity at each discharge point. For Pauatahanui Inlet, the highest risk occurs for discharges to Browns Bay, reflecting the combination of high copper and zinc loads and the Bay being partly enclosed and highly depositional. While the urban contribution drives the overall ‘highest’ risk score, road traffic makes a significant contribution at this location, with the traffic-related risk classified as ‘lower’ to ‘medium’.
For Onepoto Arm, where land use is predominantly urban, no stormwater outlets were found with a ‘highest’ risk level. The load profiles for zinc and copper are both dominated by the relatively high (80% plus) contribution from Porirua Stream and its catchment that discharges to a single outlet (which includes the bulk of Semple Street stormwater catchment draining Porirua’s CBD). Despite having the highest metal load, the high sediment load discharged from the Porirua Stream catchment results in this outlet being ranked only 10th (for zinc) and 11th (for copper) in terms of sediment metal concentrations compared with all 13 outlets, with a resultant risk level of ‘medium’.
Sensitivity analysis and validation
A sensitivity analysis assessed the extent to which uncertainty in model inputs influences the assessment of risk. Varying the road-derived loads of copper and zinc by ±15% was found to change the road-traffic risk classification of around 3% of stream reaches in the case study catchment. The adoption of higher residential roof zinc yields in the estimation of urban zinc loads resulted in an approximate 2% increase in
9

Risk assessment of road stormwater runoff
the proportion of stream reaches assessed as ‘highest’ risk. The minor change in risk level indicates that assumptions made in estimating contaminant loads are unlikely to have a major bearing on the outcome of the risk assessment, thus providing assurance in the reliability of the RSS model output.
Model validation compared modelled concentrations of copper and zinc with observations from water and sediment quality monitoring programmes in the case study area. While based on very limited samples, mean in-stream concentrations of modelled copper and zinc provided a reasonable reflection of observed stream water quality. Estimates of zinc concentrations were approximately an order of magnitude higher than those for copper. The relativity between sites for modelled and observed concentrations was found to be consistent.
For the coastal validation, there are no data collected near outfalls with which a direct comparison could be made. Observed sub-tidal concentrations for zinc and copper in sediment were typically up to an order of magnitude lower than those modelled at coastal outlets. This is attributed to significant reworking and dilution of sediment from the point of discharge near the intertidal zone. Limited data on observed metal concentrations in sediment taken from nearby catchpits that discharge to one outlet suggest reasonable agreement with the ‘delivered’ sediment metal concentrations modelled at this discharge point.
Further work
This study also looked at further development of the RSS model in providing for assessments of absolute risk. Key aspects of the such work would include: collection of additional data on road runoff quality to allow development of a more comprehensive set of vehicle emission factors related to traffic congestion and road characteristics; incorporation of methods for estimating the frequency with which acute toxicity guideline concentrations of copper and zinc in rivers and stream are exceeded; incorporation of methods for estimating metal accumulation in estuary bed sediments; and undertaking field surveys of stream and estuarine ecological condition.
Abstract
This report describes a GIS-based road stormwater screening (RSS) model developed to upgrade and widen application of the NZ Transport Agency’s 2007 vehicle kilometres travelled screening tool. The RSS model provides a robust, consistent method for assessing relative risks to receiving waterbodies using estimates of copper and zinc from road traffic and non-road (urban) sources. Risk levels are evaluated using contaminant strength and receiving environment sensitivity scores with streams/rivers assessed by sub-catchment reach and coasts/estuaries at their catchment outlets. The model uses nationally consistent datasets and takes account of traffic congestion, load attenuation in the road corridor and land use type. Results of a case study risk assessment of Te Awarua-o-Porirua Harbour catchment (Pauatahanui Inlet and Onepoto Arm) are described including risk profiling, sensitivity analysis, validation against field data and example applications. The spatial output supports a global consenting approach for road networks appropriate to receiving environment risk and is consistent with the water quality accounting system under the National Policy Statement on Freshwater Management. The model should assist road controlling authorities and network operators screen new developments, prioritise areas of the existing network for improved management of road runoff and develop supporting catchment management plans for consenting purposes.
10

1 Introduction
1 Introduction
1.1 Background Road runoff can have potentially significant adverse effects on the ecological, cultural and human-use values associated with aquatic receiving environments. Contaminants in stormwater discharges from the road network are complex and include fuels, additives, oil, grease and brake and tyre residues containing a variety of toxic and ecotoxic components, including heavy metals and organic compounds. The sources include these traffic-related contaminants as well as pollution from urban and industrial sources elsewhere in the vicinity that are unrelated to roads per se but are transported onto the road surface.
Stormwater runoff from the road network may discharge directly or indirectly to freshwater and marine waters. These ‘receiving environments’ include streams, rivers, lakes, wetlands, estuaries, harbours and the open coastline. The characteristics of each of these different types of water body influence the fate of contaminant inputs and how they are assimilated, therefore their sensitivity. Each type of receiving environment will also exhibit varying degrees of sensitivity depending on their specific bio-physical characteristics and the ecological, cultural and human-use values associated with them. Given the complexity of the relationship between road networks, road runoff and the receiving environments, the assessment of effects is generally undertaken using specifically developed models.
The NZ Transport Agency (‘the Transport Agency’) commissioned MWH (lead researcher) in association with NIWA to complete a research project entitled Risk assessment of road stormwater runoff. The project was completed in the period September 2014 to December 2015 and has national application.
The research question forming the underlying basis for the subject study was:
Under what conditions is stormwater runoff likely to cause adverse environmental effects?
Building on earlier research, the aim of this study was to revise and enhance the Transport Agency’s vehicle kilometres travelled (VKT) screening tool for road runoff (Gardiner and Armstrong 2007) to allow its wider application to rivers/streams and coasts/estuaries, and provide for factoring in the effects of pathway attenuation, traffic congestion and non-road pollution sources.
While the principal intention of the current study was to develop a screening model for making assessments of relative risk, a secondary objective was to describe ways in which the method could be extended to provide for an absolute risk assessment.
The revised methodology developed in this study is the road stormwater screening (RSS) model. The RSS model is intended to assist road controlling and consenting authorities in their move towards using a risk-based approach to identify, prioritise, manage and regulate the effects of road runoff in a cost-effective way consistent with the risk to the receiving environment.
1.2 Previous research and study context This section sets the context for the purpose and objectives of the current study. It provides some key concepts on the research topic and a summary of the status and limitations of the current Transport Agency VKT screening tool, which was further developed and enhanced in this project.
11

Risk assessment of road stormwater runoff
1.2.1 Key concepts 1.2.1.1 Contaminants of concern
While road runoff contains a range of contaminants of concern to waterbodies, including suspended solids, various metals and hydrocarbon compounds, this assessment is limited to the potential effects of copper and zinc. This reflects the intention to make use of New Zealand road runoff sampling data collected under previous research funded by the Transport Agency and other complementary studies (eg Moores et al 2009; 2010; 2012): studies which have largely focused on copper and zinc. However, it is important to note that copper and zinc are not the only contaminants of concern, but that these can also function as proxies for a wider range of stormwater contaminants.
1.2.1.2 Effects on receiving environments
Contaminants in road runoff, such as the metals zinc and copper, can be transported as either dissolved
components or by being chemically or physically bound to sediment particles (particulate component). Zinc and copper may therefore affect receiving waterbodies through two principal pathways:
• acute toxicity in streams and rivers (mainly from dissolved components)1
• chronic toxicity in depositional environments (mainly particulate contaminant build-up in sediment).
In looking at risks from road runoff, both acute and chronic effects need to be considered depending on the type of receiving environment affected.
1.2.1.3 Source–pathway–receptor conceptual model
A conceptual model is used to characterise the effects of road runoff on the receiving environment in modelling studies. The source–pathway–receptor model is well established in risk assessment and has been applied to modelling road runoff in New Zealand (eg Irving and Moncrieff 2004; Gardiner et al 2007; Ellis et al 2012):
• The source is the road section or network that generates a contaminant load in runoff.
• The pathway is the route from the road to where the runoff enters the receiving environment.
• The receptor is the receiving environment (ie waterbody such as river, lake or estuary).
In terms of road runoff, the concentration of vehicle-derived contaminants in the receiving environment – and therefore the risk of adverse effects – is a function of the following components:
• Source ‘strength’ – primarily dependent on road traffic volumes and length of road in the catchment; for copper and zinc this is heavily influenced by traffic behaviour (braking and acceleration) caused, for example, by congestion and road characteristics (eg traffic lights and topography)
• Pathway attenuation – influenced by pathway type (discharge via natural infiltration, drainage channel or piped direct to outfall) and stormwater treatment devices (eg wetlands, filtration devices, swales and catchpits)
• Receiving environment attributes – including physical characteristics of the water body (eg dilution capacity for stream/river flow; depositional nature of estuaries) and the sensitivity of the water body to contaminants (a combination of ecological and human use values).
1 Dissolved contaminants can also have chronic toxicity effects in rivers and streams, for instance associated with the release of metals from stream sediments to the water column. In relation to stormwater discharges, however, more emphasis is generally given to the acute effects of elevated contaminant concentrations during storm events.
12
1 Introduction
For models that consider relative, rather than absolute effects on waterbodies (as in the current study), the risk factors for each of the above three components are defined for a given road catchment (ie road network and its receiving environments) and combined to give an overall measure of risk for ranking purposes.
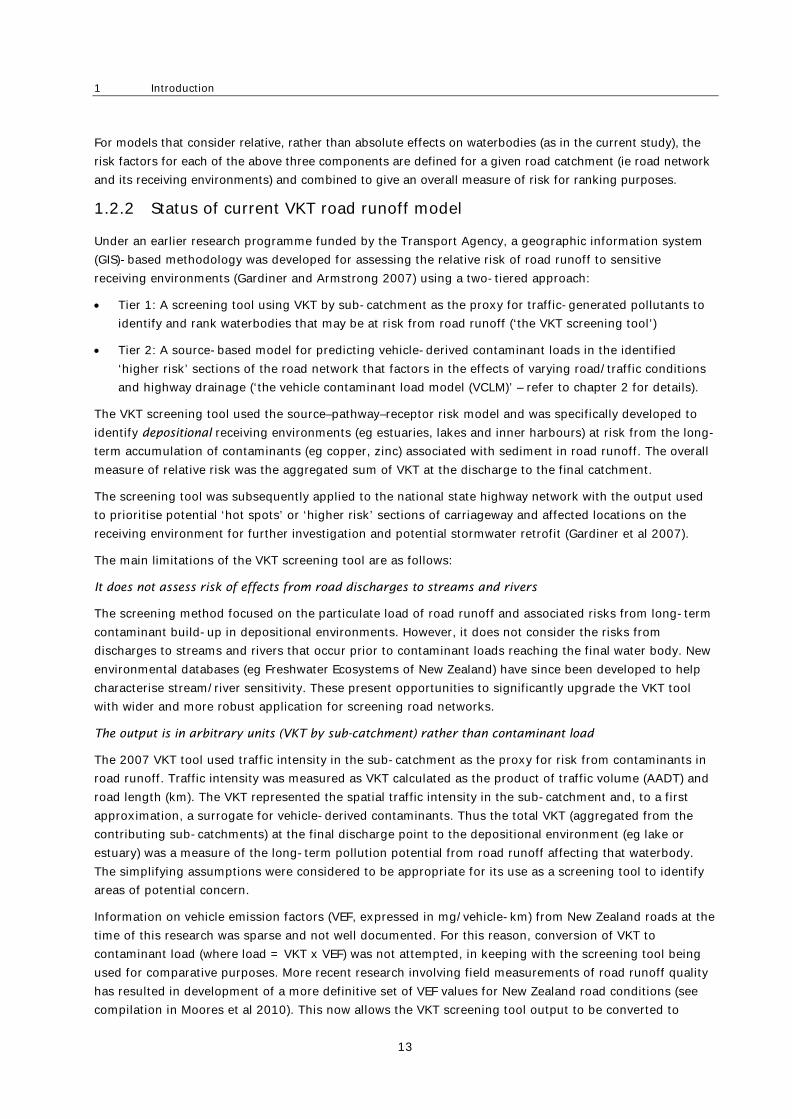
1.2.2 Status of current VKT road runoff model
Under an earlier research programme funded by the Transport Agency, a geographic information system (GIS)-based methodology was developed for assessing the relative risk of road runoff to sensitive receiving environments (Gardiner and Armstrong 2007) using a two-tiered approach:
• Tier 1: A screening tool using VKT by sub-catchment as the proxy for traffic-generated pollutants to identify and rank waterbodies that may be at risk from road runoff (‘the VKT screening tool’)
• Tier 2: A source-based model for predicting vehicle-derived contaminant loads in the identified ‘higher risk’ sections of the road network that factors in the effects of varying road/traffic conditions and highway drainage (‘the vehicle contaminant load model (VCLM)’ – refer to chapter 2 for details).
The VKT screening tool used the source–pathway–receptor risk model and was specifically developed to identify depositional receiving environments (eg estuaries, lakes and inner harbours) at risk from the long-term accumulation of contaminants (eg copper, zinc) associated with sediment in road runoff. The overall measure of relative risk was the aggregated sum of VKT at the discharge to the final catchment.
The screening tool was subsequently applied to the national state highway network with the output used to prioritise potential ‘hot spots’ or ‘higher risk’ sections of carriageway and affected locations on the receiving environment for further investigation and potential stormwater retrofit (Gardiner et al 2007).
The main limitations of the VKT screening tool are as follows:
It does not assess risk of effects from road discharges to streams and rivers
The screening method focused on the particulate load of road runoff and associated risks from long-term contaminant build-up in depositional environments. However, it does not consider the risks from discharges to streams and rivers that occur prior to contaminant loads reaching the final water body. New environmental databases (eg Freshwater Ecosystems of New Zealand) have since been developed to help characterise stream/river sensitivity. These present opportunities to significantly upgrade the VKT tool with wider and more robust application for screening road networks.
The output is in arbitrary units (VKT by sub-catchment) rather than contaminant load
The 2007 VKT tool used traffic intensity in the sub-catchment as the proxy for risk from contaminants in road runoff. Traffic intensity was measured as VKT calculated as the product of traffic volume (AADT) and road length (km). The VKT represented the spatial traffic intensity in the sub-catchment and, to a first approximation, a surrogate for vehicle-derived contaminants. Thus the total VKT (aggregated from the contributing sub-catchments) at the final discharge point to the depositional environment (eg lake or estuary) was a measure of the long-term pollution potential from road runoff affecting that waterbody. The simplifying assumptions were considered to be appropriate for its use as a screening tool to identify areas of potential concern.
Information on vehicle emission factors (VEF, expressed in mg/vehicle-km) from New Zealand roads at the time of this research was sparse and not well documented. For this reason, conversion of VKT to contaminant load (where load = VKT x VEF) was not attempted, in keeping with the screening tool being used for comparative purposes. More recent research involving field measurements of road runoff quality has resulted in development of a more definitive set of VEF values for New Zealand road conditions (see compilation in Moores et al 2010). This now allows the VKT screening tool output to be converted to
13
Risk assessment of road stormwater runoff
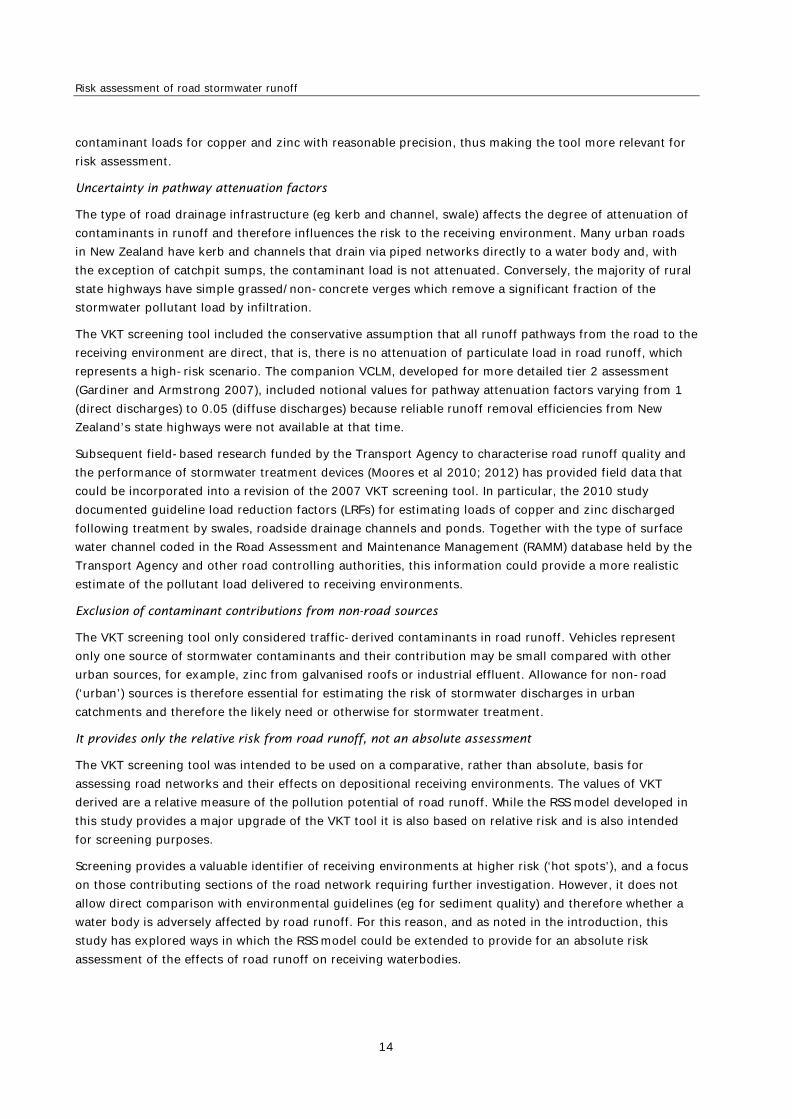
contaminant loads for copper and zinc with reasonable precision, thus making the tool more relevant for risk assessment.
Uncertainty in pathway attenuation factors
The type of road drainage infrastructure (eg kerb and channel, swale) affects the degree of attenuation of contaminants in runoff and therefore influences the risk to the receiving environment. Many urban roads in New Zealand have kerb and channels that drain via piped networks directly to a water body and, with the exception of catchpit sumps, the contaminant load is not attenuated. Conversely, the majority of rural state highways have simple grassed/non-concrete verges which remove a significant fraction of the stormwater pollutant load by infiltration.
The VKT screening tool included the conservative assumption that all runoff pathways from the road to the receiving environment are direct, that is, there is no attenuation of particulate load in road runoff, which represents a high-risk scenario. The companion VCLM, developed for more detailed tier 2 assessment (Gardiner and Armstrong 2007), included notional values for pathway attenuation factors varying from 1 (direct discharges) to 0.05 (diffuse discharges) because reliable runoff removal efficiencies from New Zealand’s state highways were not available at that time.
Subsequent field-based research funded by the Transport Agency to characterise road runoff quality and the performance of stormwater treatment devices (Moores et al 2010; 2012) has provided field data that could be incorporated into a revision of the 2007 VKT screening tool. In particular, the 2010 study documented guideline load reduction factors (LRFs) for estimating loads of copper and zinc discharged following treatment by swales, roadside drainage channels and ponds. Together with the type of surface water channel coded in the Road Assessment and Maintenance Management (RAMM) database held by the Transport Agency and other road controlling authorities, this information could provide a more realistic estimate of the pollutant load delivered to receiving environments.
Exclusion of contaminant contributions from non-road sources
The VKT screening tool only considered traffic-derived contaminants in road runoff. Vehicles represent only one source of stormwater contaminants and their contribution may be small compared with other urban sources, for example, zinc from galvanised roofs or industrial effluent. Allowance for non-road (‘urban’) sources is therefore essential for estimating the risk of stormwater discharges in urban catchments and therefore the likely need or otherwise for stormwater treatment.
It provides only the relative risk from road runoff, not an absolute assessment
The VKT screening tool was intended to be used on a comparative, rather than absolute, basis for assessing road networks and their effects on depositional receiving environments. The values of VKT derived are a relative measure of the pollution potential of road runoff. While the RSS model developed in this study provides a major upgrade of the VKT tool it is also based on relative risk and is also intended for screening purposes.
Screening provides a valuable identifier of receiving environments at higher risk (‘hot spots’), and a focus on those contributing sections of the road network requiring further investigation. However, it does not allow direct comparison with environmental guidelines (eg for sediment quality) and therefore whether a water body is adversely affected by road runoff. For this reason, and as noted in the introduction, this study has explored ways in which the RSS model could be extended to provide for an absolute risk assessment of the effects of road runoff on receiving waterbodies.
14

1 Introduction
1.3 Purpose and objectives The purpose of the research study as stated in the research brief was to provide guidance to road controlling authorities – demonstrated through a GIS-based risk runoff model – on the conditions under which stormwater runoff is likely to cause adverse environment effects and to prioritise areas on the road network where further investigations including treatment may be warranted.
The key objectives of the research study were to:
• Enhance the current VKT risk model for road runoff and demonstrate its applicability through a case study, based on the following improvements:
- rivers and streams: develop a new method for assessing risks to rivers and streams from runoff based on contaminant load, mean stream flow and receiving environment sensitivity
- traffic congestion: develop a congestion factor based on level of service (LoS) to allow for increased contaminant loads (eg in urban or heavily-trafficked road sections)
- pathway attenuation: provision of load reduction factors to allow for attenuation of contaminant load in runoff due to varying drainage characteristics of local roads and state highways
non-road pollution sources: explore the ability to take account of non-road contaminant sources in stormwater based on catchment land use (eg % urban as proxy).
• Further study the linkage between VKT, VEF, road pollution load, receiving environment sensitivity and the indicative level of stormwater treatment that may be required for identified areas of higher risk on the road network.
• Disseminate and promote the study findings through a research report and facilitated presentations at three workshops (Auckland, Wellington and Christchurch).
1.4 Study overview and outputs 1.4.1 Study overview
The research study was conducted in four interrelated stages, as summarised below.
1.4.1.1 Stage 1: Literature review and method concept
The findings of the literature review, which primarily focused on the development of methods and tools with the potential to inform the current project, are described in chapter 2 of this report.
Under stage one, an additional task was completed to analyse the requirements for treatment with New Zealand’s legislative framework, eg Resource Management Act (RMA) 1991, the National Policy Statement for Freshwater Management (NPS-FM) (MfE 2014) and regional plans. The output from this task was a review of the current and emerging planning/legislative regime for stormwater treatment and the findings are described in chapter 3 of this report.
A further task under stage one was to review relevant publications and industry guidance on the estimated costs for stormwater treatment; however, aspects concerning the costs and level of stormwater treatment options for discharges to receiving environments were not researched. This is because the topic is well documented and being researched elsewhere, and the nature of stormwater treatment is largely dictated by space and road geometry considerations that are site specific. In addition, the determination of the degree of treatment required (and hence the treatment train and costs) requires an effects-based assessment rather than the relative risk approach used in the model developed in this study.
15

Risk assessment of road stormwater runoff
1.4.1.2 Stage 2: Method development
This stage comprised the main development steps for upgrading and enhancing the existing VKT screening tool as discussed in section 1.2 and in line with the project objectives (section 1.3). The five strands of method development were as follows:
• Develop road contaminant load module – Excel-based routine for bottom-up estimation of zinc and copper loads at the sub-catchment level from road traffic, including factors for traffic congestion, pathway attenuation and conversion of VKT to contaminant load (separate modules for local roads and state highways).
• Develop non-road (urban) contaminant load module – Excel- based routine for estimating zinc and
copper loads at the sub-catchment level from urban non-road impervious surfaces.
• Risk assessment of streams/rivers (water column environments) – method to assess risks from zinc and copper at the sub-catchment level from road traffic and non-road (urban) sources in stormwater run-off discharged to the river or stream reach (impact on the immediate receiving environment).
• Risk assessment of coasts and estuaries (depositional environments) – method to assess risks from zinc and copper from road traffic and non-road (urban) sources in stormwater run-off associated with suspended particulate that builds up over time in sediment (impact on the final receiving environment).
A number of technical issues were encountered in the development of the road contaminant load model in relation to information held in the RAMM database. These related to GIS mapping of RAMM data (eg the carriageway and stormwater channel (SWC) data sets do not have a common spatial datum) and the presence of data errors and inconsistencies that interrupted the model run and required manual intervention. Appendix E provides details of the data issues, how they were remedied and implications for model use.
1.4.1.3 Stage 3: Case study evaluation
This stage applied the interim risk assessment methodology developed under stage 2 to a selected area in the Wellington region to comprise a mix of local roads, state highways, stream/river discharges and depositional environments. The area chosen was the Pauatahanui Inlet and contributing catchments. An extension to this case study to include the adjacent Onepoto Arm was subsequently completed to test the RSS model under a wider range of conditions. The case study findings are described in chapter 5.
1.4.1.4 Stage 4: Research report and workshop dissemination
The research report (this document) provides a consolidated reference to work developed from earlier stages and includes selected representative outputs and illustrations from model application developed during the case study. The report includes recommendations for closing identified information gaps and potential end user applications.
A set of three half-day workshops are to be held in Auckland, Wellington and Christchurch to present the study findings and engage in a facilitated discussion with end users.
1.4.2 Study outputs
The specific deliverables for this project comprised:
1 A geospatial model to aid the Transport Agency’s understanding of risk from road runoff on the receiving environment to assist investment decisions and prioritise where follow-up investigations may be required including the need for stormwater treatment.
2 A set of input and output datasets for the model developed from the case study.
16

1 Introduction
3 The research report to provide recommendations from the case study on potential areas where regulatory authorities may target water quality planning provisions in regards to road runoff; a brief section analysing the legislative requirements for stormwater treatment in the context of this study; and a high level overview of costs associated with stormwater treatment requirements.2
4 The research report to include guidance for road controlling authorities, based on application of the model in the case study, on how to identify areas of potential risk from road runoff for prioritising investment in stormwater treatment assets.
5 A set of three workshops (in Auckland, Wellington and Christchurch) to promote the findings of the research to Transport Agency staff, other road controlling authorities and stormwater regulators.
1.5 Report structure This report is structured as follows:
Chapter 1 sets out the background, previous research, context and objectives for the research project, together with the study overview and outputs.
Chapter 2 presents the findings from the literature review. This looked at recent published work in New Zealand and overseas on predictive modelling of stormwater contaminants and assessing water body sensitivity to road runoff. The review also sought to identify potential data sources that may supplement existing information. Conclusions from the review are presented in the context of method development.
Chapter 3 describes the planning and legislative context for stormwater management as it relates to the subject study, including the statutory and non-statutory frameworks, the NPS-FM and implications for model development.
Chapter 4 presents a summary of the final methodology developed during the study including the risk assessment framework, estimation of contaminant loads (road traffic and urban sources) and the complementary methodologies for assessing risks to rivers/streams and coasts/estuaries. This section also discussed the assumptions and limitation of the RSS model developed in this study. (Further details on the methodology and model inputs are described in the appendices).
Chapter 5 documents how the RSS model performed in the case study (Pauatahanui Inlet, and the later extension to Onepoto Arm, and their contributing catchments) in terms of the river/stream and coast/estuary risk assessments. Results of sensitivity testing and model validation are described together with other potential model applications.
Chapter 6 summarises key conclusions from the study together with potential end user applications of the RSS model. Recommendations for closing information gaps and potentially extending the RSS model to provide an absolute (effects-based) risk assessment tool are briefly outlined.
A list of cited references is provided at the end of the report. Supporting technical information is included as appendices.
2 This task was not completed in agreement with the Transport Agency – see section 1.4.1
17

Risk assessment of road stormwater runoff
2 Literature review
2.1 Introduction This chapter presents findings from the literature review and method concept development completed under stage 1 of the project. The purpose was to help inform the initial concept development stage of the study by identifying concepts and approaches that might add value to this process.
2.2 Scope of review The study reviewed two aspects at the outset of the project:
1 New Zealand and overseas road stormwater contaminant prediction models
2 Models to determine waterbodies’ sensitivity to road stormwater runoff.
While the focus was on methods developed specifically for road runoff assessments, the review also considered methods developed for broader assessments of risks associated with urban stormwater discharges, of which discharges from roads are a major component. Particular attention was also given in the review to identifying concepts, procedures and data sources relevant to the model enhancements sought under the study objectives (see section 1.3).
For the purposes of this chapter, the review findings for the above two topics are presented in two parts: section 2.3 describes methods for assessing runoff quality or, to use the language of the source–pathway–receptor approach, ‘source strength’ and section 2.4 describes models to assess receiving environment sensitivity or the risk to the ‘receptor’ part of the system.
In practice, however, many papers were found to describe models that make assessments in relation to both topic areas and therefore the distinction is somewhat artificial. Thus the review found that tools which provide for an assessment of receiving environment sensitivity typically also deal with the ‘source’ and, in some cases, the ‘pathway’ parts of the system. This involves linking methods for characterising runoff quality, representing the performance of stormwater treatment and assessing receiving environment risk.
Rather than describe these component methods individually in the sections on contaminant prediction models and receiving environment sensitivity (sections 2.3 and 2.4, respectively), tools involving a combination of methods resulting in a risk assessment are described in their entirety in section 2.4. There is, therefore, a degree of crossover between the two sections.
The above approach enabled findings from the literature review to inform both the risk runoff model design attributes as well as the contributing data sources as part of the method concept development.
2.3 Review of road runoff contaminant prediction models This section describes a selection of models that have been developed for predicting contaminant levels in road runoff.
As noted in section 1.2.1, the discharge of road runoff to receiving waterbodies has the potential to result in both acute and chronic effects. Acute effects can result from the short-term elevation of contaminant concentrations in the water column while chronic effects can reflect the longer-term accumulation of contaminants in river, lake or estuary sediments.
18

2 Literature review
Assessments of these two types of effects require information on contaminant concentrations and loads, respectively. Accordingly, this section reviews studies that have developed models which make predictions of either concentrations or loads (or both) of the principal contaminants in road runoff. Typically, both types of model have applied the results of sampling studies to characterise road runoff quality, although they have differed in the way in which these results have been manipulated.
Methods for predicting road runoff contaminant concentrations used statistical analysis of sampling results to develop relationships between traffic volumes and representative contaminant concentrations, such as the mean or median event mean concentration (EMC). Predictions of runoff contaminant concentrations are then able to be made for any given site based on its traffic characteristics. Methods developed by the US Federal Highways Authority (US FHWA) and UK Highways Agency (UKHA) have both adopted this approach (Driscoll et al 1990a; UKHA 2009). In both of these cases, the prediction of runoff contaminant concentrations forms part of an assessment of receiving environment risk. These methods are therefore summarised in section 2.4.
Methods for predicting contaminant loads fall into one of two groups. First, some methods calculate load as the product of representative EMCs for different classes of road and a representative storm event runoff volume. The second approach is to calculate load as the product of some unit measure of contaminant load, ie a yield or VEF, and a scaling factor, ie area of road surface or VKT.
A concentration-based approach for estimating loads forms part of the US FWHA risk assessment method described in section 2.4 (Driscoll et al 1990a). More recently, Ellis and Revitt (2008) described the development of a UK-based method that calculates annual ‘unit area loads’ (UALs) from average EMCs and modelled runoff volumes for each hectare of land in an urban catchment. This method was used to identify ‘hot spots’ of contaminant generation, for instance coinciding with the locations of major roads (Ellis and Revitt 2008). The method has also been applied in a risk assessment setting, involving comparison of the UALs with maximum acceptable loads derived from environmental standards for receiving waterbodies (Mitchell 2005, section 2.4).
2.3.1.1 Vehicle fleet emissions model for water (VFEM- W)
New Zealand-based models for predicting the generation of contaminants in road runoff and urban stormwater have adopted a yield- or VEF-based approach. The Ministry of Transport developed its vehicle fleet emissions model for water (VFEM-W) as an extension of a method for estimating vehicle exhaust emissions (Moncrieff and Kennedy 2004). The model calculated loadings of stormwater contaminants based on VEFs estimated from a survey of international data sources (Kennedy et al 2002) and information on fleet composition and traffic conditions.
In a case study set in Waitakere City, the VFEM-W was linked to GIS layers of the road and stormwater networks to estimate stormwater contaminants loadings for stormwater ‘basins’ defined on the basis of the layout of the pipe system and catchment topography (Irving and Moncrieff 2004). While it appears that stormwater treatment was not taken into account in this application of the VFEM-W, the broader concept of defining road source areas by sub-catchment, characterising those source areas according to traffic volumes and conditions and applying representative VEFs represents much the same approach as adopted in the present study.
However, as reported by Gardiner and Armstrong (2007), no working model was issued from the VFEM-W programme. Also, subsequent field investigations in New Zealand allowed estimation of New Zealand-specific VEFs for some contaminants (refer to section 4.3.1 and appendix A), so that some of the VEFs published as part of the VEFM-W programme can be considered to have been superseded.
19

Risk assessment of road stormwater runoff
2.3.1.2 Contaminant load model (CLM)
Auckland Council’s contaminant load model (CLM) was developed in the early 2000s and has become a widely adopted method for estimating stormwater contaminant loads in urban catchments. While developed on the basis of an extensive data collection programme in Auckland, the model has also been applied in stormwater assessments at locations elsewhere in New Zealand, including selected roading projects3. The CLM is a simple spreadsheet-based annual loads model in which untreated loads of suspended solids, copper, zinc and total petroleum hydrocarbons are calculated as the product of an area of a given source type and an annual contaminant yield associated with that source type (Auckland Regional Council 2010). LRFs are then applied to these loads to estimate the annual load following treatment by one or more stormwater treatment devices.
The CLM distinguishes contaminant yields for six road-size classes, defined by ranges of vehicle numbers. These yields were estimated by multiplying VEFs estimated from road runoff monitoring at Richardson Road in Auckland by the number of vehicles in each road class and are scaled for a unit area (m2) of road over a one-year period (Auckland Regional Council 2010). LRFs in the CLM are based on literature review and ‘represent the maximum degree of contaminant retention that could be expected for well designed, installed and maintained devices’ (Auckland Regional Council 2010).
While its ease of use and origin in locally collected data make the CLM an attractive method, its developers were careful to caution users over a number of limitations, such as uncertainty over some of the yields, especially in relation to paved surfaces, as well as road runoff copper and total petroleum hydrocarbons; uncertainty over LRFs, especially for catchpits; caution over its transferability to other regions; and an emphasis on the model being for broad-scale planning rather than design purposes (Auckland Regional Council 2010). However, despite its limitations, the CLM represents the best available New Zealand source of estimates of stormwater contaminant yields for a comprehensive range of impervious surface types. Consequently, the model has provided an evidence-based approach for estimating loads of stormwater contaminants, making comparisons between catchments, assessing the need for and potential effectiveness of stormwater treatment and prioritising stormwater management actions. It has also provided the basis for the development of other tools for use in stormwater management and urban planning settings.
2.3.1.3 Catchment contaminant annual loads model (C- CALM)
The catchment contaminant annual loads model (C-CALM) is a GIS-based tool for estimating and mapping annual loads of sediment, copper and zinc with variations in land use and stormwater treatment (Semadeni-Davies and Wadhwa 2014). The tool applies the CLM’s method for estimating annual contaminant loads but differs in that LRFs are drawn from a library of ‘performance rules.’ These rules were developed through a combination of modelling treatment device performance under a range of New Zealand-wide climatic, catchment and device characteristics, and literature review. Consequently, C-CALM provides greater national applicability and flexibility in the representation and assessment of stormwater treatment options than the original CLM.
While C-CALM is a potential source of LRFs for the present study, both it and the CLM share a limitation in common with the other methods summarised above, in that while these methods make predictions in relation to traffic volumes, they do not take account of the influence of other traffic characteristics, such as congestion levels. This limitation is significant, in that vehicle emissions of contaminants such as
3 For example, MacKays to Peka Peka Expressway (SH1) www.nzta.govt.nz/projects/mackays-to-peka-peka-application/docs/technical-report-25.pdf
20

2 Literature review
copper and zinc have been found to vary markedly in relation to congestion levels and other influences on rates of vehicle braking and acceleration (see, for instance, Moores et al 2010).
2.3.1.4 Source- based vehicle contaminant load model (VCLM)
In contrast to the other methods described above, Gardiner and Armstrong (2007) developed a source-based VCLM that does take account of variations in VEFs according to road and driving conditions. The VCLM was developed to be applied as part of the second stage of a two-tier risk assessment, following an initial assessment of risk based on the VKT screening tool (see section 1.2.2).
Loads are derived from traffic flow (AADT), level of service (speed/ congestion), vehicle type and pollutant emission rates (ie brake, tyre and road surface wear, oil leakage and exhaust emissions). The model allows for user selection of existing and future highway drainage features (eg sumps) which attenuate stormwater load. The VCLM allows prediction of loads of copper, zinc, total suspended solids and Polycyclic Aromatic Hydrocarbons (PAHs), based on 11 attributes including road type, level of service, vehicle numbers, fleet composition, topography and type of treatment device available from the Transport Agency’s (RAMM) database (table 2.1).
Table 2.1 Inputs to the vehicle contaminant load model(a)
Variable name RAMM database table
AADT (vehicle/day) Traffic (use ADT)
Road type Carriageway
Level of service (LoS) Calculate from AADT and road capacity
HCV (%) Loading
No. of lanes Carriageway
Road length (km) Carriageway
Horizontal terrain (degrees/km) High speed geometry
Vertical terrain (m/km) High speed geometry
No. of seal layers Surface structure
ALD (mm) Surface structure
Treatment device Drainage (or user specified) (a) Source: Gardiner and Armstrong (2007)
Initial validation of the VCLM was achieved for copper and zinc using published field data and road characteristics for the Richardson Road site in Auckland. The predicted emission factors from the VCLM (mg/VKT) are within a factor of two (for copper) and four (for zinc) compared with factors compared with those derived for this site from an empirical model (Timperley et al 2003). In both cases the VCLM overestimates the contaminant load. The VEFs used in the VCLM were based on data published under the earlier Ministry of Transport’s research programme (Kennedy et al 2002) with the caution that ‘there is considerable uncertainly in the derivation of emission factors in the model, given the wide variability in source data, hence the model predictions must be treated as only “order of magnitude” estimates of contaminant load’. For this reason the authors recommended that the VCLM be used to estimate contaminant loads on a comparative basis and that further refinement and calibration with field data is required before the model is used to estimate absolute pollutant loads in road runoff.
As noted in section 1.2.2, more recent Transport Agency-funded research (Moores et al 2010) involving field sampling of road runoff under defined traffic conditions has provided a more robust set of VEF values under New Zealand conditions. In reviewing these values in the current study it was found that the
21

Risk assessment of road stormwater runoff
existing VEF dataset does not cover the full range of congestion and road type characteristics needed to adequately calibrate the VCLM model. However, as described in section 4.4.1 and appendix A, the VEFs available provide sufficient resolution of traffic congestion for screening purposes which has allowed further refinement of the VKT screening tool supporting its application in the current study.
2.4 Review of models to assess water body sensitivity to road runoff
This section describes a selection of models that have been developed for assessing receiving environment sensitivity or the risk to the ‘receptor’ part of the system. An assessment of the sensitivity of receiving environments to the effects of road runoff discharges can be made on either an absolute or a relative basis.
Absolute assessments are made with reference to some measure of environmental impact, such as receiving water concentrations above which adverse effects are considered likely. In order to make this comparison, methods for absolute assessments involve calculation of receiving water contaminant concentrations for representative rainfall-runoff events. Potential impacts can be quantified and described using terms such as ‘negligible’ or ‘high risk’. Method development is relatively resource intensive, potentially involving hydrological, water quality and ecological analyses. Examples of absolute methods for assessing receiving environment sensitivity to road runoff have been developed by highway agencies in the USA and UK.
In contrast, relative assessments involve ranking the risks to receiving environments from highest to lowest but involve no quantification of the risks. In other words, it could be the case that even the highest ranked discharges have minor impact or, conversely, it could be that even the lowest ranked discharges have a significant impact. In a relative assessment, risks can only be described using terms such as ‘less likely’ and ‘more likely’.
The following paragraphs illustrate methods that have been used for making absolute and relative assessments of risk. While the principal intention of the current study was to develop a method for making assessments of relative risk, a secondary objective was to describe ways in which the method could be extended to provide for an absolute risk assessment. In reviewing existing tools for making absolute risk assessment, regard was therefore made to the potential for these methods to inform any future extension of the RSS model developed under the current study.
2.4.1.1 US Federal Highway Administration (FHWA) model
An early US FHWA absolute risk method allowed an assessment of the effects of discharges of highway runoff to streams and lakes (Driscoll et al 1990a). For streams, the method allowed a range of contaminants to be used in the assessment (ie suspended solids, metals and nutrients) while for lakes the focus was on phosphorus. The method was developed following the collection, collation and analysis of highway runoff monitoring data collected at 31 sites throughout the US (Driscoll et al 1990b).
Users of the method were required to work through a series of steps (see figure 2.1) presented as four sequential worksheets. The first step was to define site characteristics, which involved identifying drainage areas, rainfall characteristics, stream flow, runoff contaminant concentrations and target concentrations in the receiving waterbodies. Guidance for parameter estimation was provided in a series of tables. The second step incorporated a contaminant generation model which estimated highway runoff volume and quality using data on design rainfall events and representative contaminant concentrations.
22

2 Literature review
Concentrations were provided for two classes of highway, termed ‘urban’ and ‘rural’ based on a traffic volume threshold of 30,000 vehicles per day. In the case of streams, receiving water concentrations following dilution were calculated for the three-year average recurrence interval (ARI) flow event and compared with US EPA acute toxicity water quality criteria to determine whether further assessment or mitigation was required. For lakes, the method assessed the potential for eutrophication based on estimated phosphorus concentrations.
Figure 2.1 Outline of US FHWA method for evaluating water quality impacts from highway runoff
Source: Driscoll et al (1990)
2.4.1.2 Stochastic empirical loading and dilution model (SELDM)
In an update to the FHWA method, the FHWA and US Geological Survey have developed the stochastic empirical loading and dilution model (SELDM) (Granato 2013). SELDM provides ‘planning-level’ estimates of EMCs, flows, and loads in stormwater from a highway site and its upstream catchment. Using input information on site characteristics, catchment characteristics, rainfall, stormflow, water quality and the performance of mitigation measures, the model generates statistical distributions of runoff quality in highway runoff and receiving river water. Input data on rainfall, flow and water quality can be selected from US national datasets, including the national Highway Runoff Database which contains data from over 4,000 storm events. SELDM is defined as a stochastic model because it uses Monte Carlo methods (repeated random sampling of input variable values) to generate distributions of output variables, such as river water EMCs. The risk of exceedance of concentrations of concern in receiving waterbodies can then be quantified as the percentage of EMCs that fail to meet a given water quality standard.
23

Risk assessment of road stormwater runoff
SELDM has recently been applied in an Oregon case study of six highway study sites (Risley and Granato 2014). A range of data manipulation techniques were implemented to prepare data for the study. These included: spatial interpolation of rainfall and streamflow data; stream hydrograph analyses; statistical analyses of water quality monitoring data; and selection of surrogate highway runoff quality data. Seven types of stochastic analyses were conducted to demonstrate the use of SELDM, concluding with risk assessments for each of the six study sites. For each site, plots comparing the distribution of EMCs in highway runoff, upstream and downstream river flow and water quality standards were produced (see figure 2.2).
Figure 2.2 Example results generated by SELDM model
Source: Risley and Granato (2014) Note: in this example the probability of the exceedance of the average water quality standard (27.3 mg/L) is less than 2% upstream of the road and approximately 8-9% downstream of site 91, annotations added.
This application of SELDM shows that while it is a sophisticated, well-conceived and well-developed model for assessing highway runoff risk, its capabilities exceed those required for the type of screening-level method to be developed under the current study.
2.4.1.3 Highways Agency Water Risk Assessment Tool
The UK method ‘Highways Agency Water Risk Assessment Tool’ (HAWRAT) provides for an assessment of the impacts of highway runoff quality on receiving water quality, groundwater quality and flooding (UKHA 2009). The tool was designed to provide improved guidance on where, and to what level, treatment of runoff is required for UK highway designers to manage the risk of ecological impact from highway runoff (Crabtree et al 2008).
The method adopts a three-tiered approach to the assessment (see figure 2.3).
24

2 Literature review
Figure 2.3 Outline of UK HAWRAT method for evaluating impacts of dissolved contaminants in highway runoff
Source: UKHA (2009)
25

Risk assessment of road stormwater runoff
Figure 2.4 Outline of UK HAWRAT method for evaluating impacts of sediment- bound contaminants in highway
runoff
Source: UKHA (2009)
26
2 Literature review
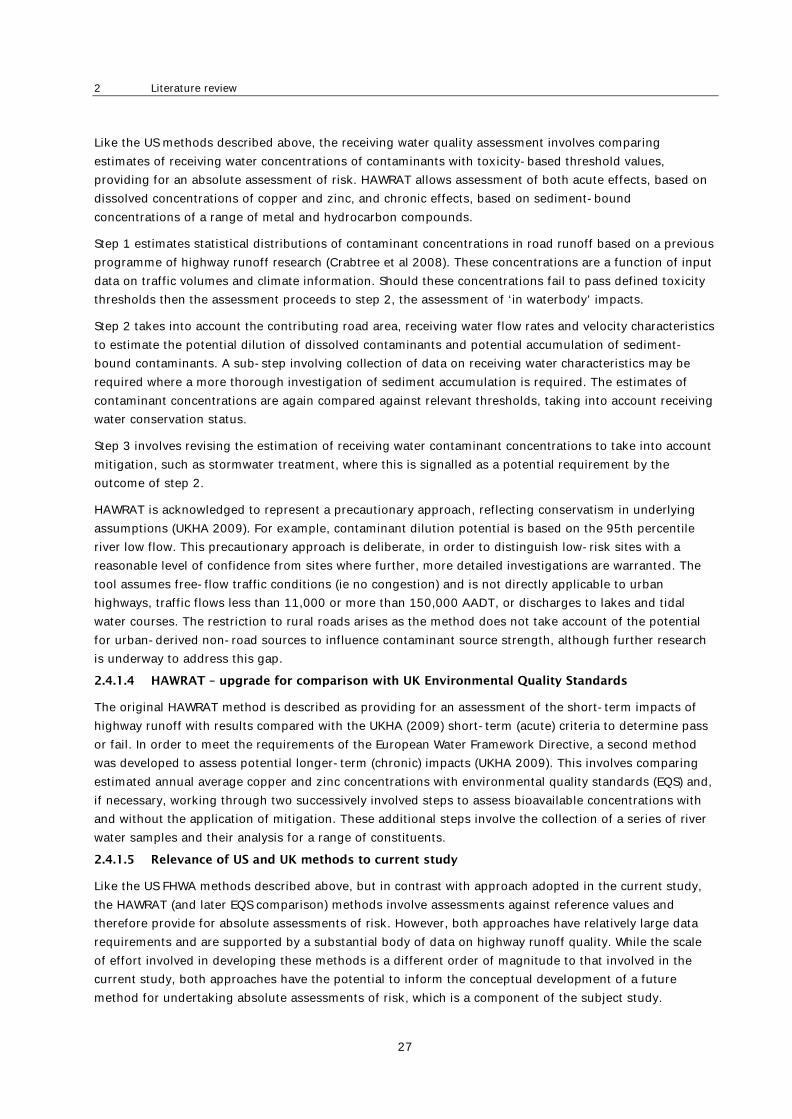
Like the US methods described above, the receiving water quality assessment involves comparing estimates of receiving water concentrations of contaminants with toxicity-based threshold values, providing for an absolute assessment of risk. HAWRAT allows assessment of both acute effects, based on dissolved concentrations of copper and zinc, and chronic effects, based on sediment-bound concentrations of a range of metal and hydrocarbon compounds.
Step 1 estimates statistical distributions of contaminant concentrations in road runoff based on a previous programme of highway runoff research (Crabtree et al 2008). These concentrations are a function of input data on traffic volumes and climate information. Should these concentrations fail to pass defined toxicity thresholds then the assessment proceeds to step 2, the assessment of ‘in waterbody’ impacts.
Step 2 takes into account the contributing road area, receiving water flow rates and velocity characteristics to estimate the potential dilution of dissolved contaminants and potential accumulation of sediment-bound contaminants. A sub-step involving collection of data on receiving water characteristics may be required where a more thorough investigation of sediment accumulation is required. The estimates of contaminant concentrations are again compared against relevant thresholds, taking into account receiving water conservation status.
Step 3 involves revising the estimation of receiving water contaminant concentrations to take into account mitigation, such as stormwater treatment, where this is signalled as a potential requirement by the outcome of step 2.
HAWRAT is acknowledged to represent a precautionary approach, reflecting conservatism in underlying assumptions (UKHA 2009). For example, contaminant dilution potential is based on the 95th percentile river low flow. This precautionary approach is deliberate, in order to distinguish low-risk sites with a reasonable level of confidence from sites where further, more detailed investigations are warranted. The tool assumes free-flow traffic conditions (ie no congestion) and is not directly applicable to urban highways, traffic flows less than 11,000 or more than 150,000 AADT, or discharges to lakes and tidal water courses. The restriction to rural roads arises as the method does not take account of the potential for urban-derived non-road sources to influence contaminant source strength, although further research is underway to address this gap.
2.4.1.4 HAWRAT – upgrade for comparison with UK Environmental Quality Standards
The original HAWRAT method is described as providing for an assessment of the short-term impacts of highway runoff with results compared with the UKHA (2009) short-term (acute) criteria to determine pass or fail. In order to meet the requirements of the European Water Framework Directive, a second method was developed to assess potential longer-term (chronic) impacts (UKHA 2009). This involves comparing estimated annual average copper and zinc concentrations with environmental quality standards (EQS) and, if necessary, working through two successively involved steps to assess bioavailable concentrations with and without the application of mitigation. These additional steps involve the collection of a series of river water samples and their analysis for a range of constituents.
2.4.1.5 Relevance of US and UK methods to current study
Like the US FHWA methods described above, but in contrast with approach adopted in the current study, the HAWRAT (and later EQS comparison) methods involve assessments against reference values and therefore provide for absolute assessments of risk. However, both approaches have relatively large data requirements and are supported by a substantial body of data on highway runoff quality. While the scale of effort involved in developing these methods is a different order of magnitude to that involved in the current study, both approaches have the potential to inform the conceptual development of a future method for undertaking absolute assessments of risk, which is a component of the subject study.
27
Risk assessment of road stormwater runoff
More broadly, the methods are consistent with an approach to model risk as a function of: source strength, reflecting road catchment area and traffic volumes; in-stream dilution potential; and receiving water sensitivity (in HAWRAT, concentration thresholds reflect conservation status). Another similarity is that the HAWRAT and SELDM methods also allow pathway attenuation, such as stormwater treatment, to be taken into account in the assessment.
However, there are two aspects of the approach developed in the current study not explicitly accounted for in either of the US FHWA and UKHA methods. First, while both methods relate source strength to traffic volumes, neither takes account of variations in traffic conditions nor in the potential influence of drainage pathways to provide varying rates of contaminant attenuation. As noted in section 2.3, vehicle emissions have been found to vary in relation to traffic characteristics and New Zealand data is available to support the development of methods which can reflect this variability.
Second, neither the US FHWA nor UKHA method accounts for the influence of non-road urban stormwater contaminants. The ‘urban’ and ‘rural’ road classes used in the original US FHWA method were simply labels for roads carrying more than or less than 30,000 vehicles per day, respectively. Differences in contaminant concentrations between the two classes were therefore a reflection of traffic volumes rather than land use. The UKHA model is intended for use in rural settings and, as noted above, users are cautioned over its use for urban roads. In contrast, the current study did explicitly take account of the potential influence of urban land uses by considering non-road derived urban contaminant loads as a factor in the risk assessment (see section 4.3).
2.4.1.6 Other methods for assessing impacts of urban stormwater runoff
In addition to models developed specifically for the assessment of the effects of road runoff, a number of other methods developed for broader assessments of the impacts of urban stormwater were of relevance for the current project, as discussed below.
In the UK, Mitchell (2005) developed a GIS-based screening tool for mapping hazards from urban stormwater pollution. Annual loads were calculated from a land-use based runoff model and EMCs, while maximum acceptable loads were calculated from river flow data and EQSs. A hazard score was then calculated based on the relationship between the estimated loads and the maximum acceptable loads. Hazard scores were ranked and mapped, providing a means of identifying contaminant ‘hot spots’ warranting further investigation. The method contrasts with those described above in that the risk assessment is based on loads derived from threshold river water concentrations, rather than on a comparison of diluted runoff contaminant concentrations with the threshold concentrations themselves. However the fundamental data needs of the two approaches are the same: they both require the river water quality thresholds to be defined and contaminant loads and dilution rates to be estimated.
Lundy et al (2012) developed a risk prioritisation approach for a comparative assessment of stormwater pollutants based on the ‘likelihood of occurrence’ and ‘severity of impact’. The method involves, first, assigning a score on a scale of 1 (very low probability) to 5 (very high probability) to reflect the likelihood of a given stormwater contaminant being present in stormwater from a given source type. Second, a score on a scale of 1 (insignificant) to 5 (critical) is assigned to reflect the consequences of a discharge of a given pollutant (eg taking account of pollutant EMCs, dilution and relevant water quality standards). The two scores are multiplied to calculate a ‘risk score’ with ranges of 1–5 (low), 6–14 (medium) and 15–25 (high).
The method was demonstrated by applying it to UK data on motorway runoff quality to estimate risk scores for total suspended solids, biochemical oxygen demand, cadmium and lead. Risk scores fell in the low-to-medium ranges for rural highways and medium-to-high ranges for urban motorways (Lundy et al 2012). There are similarities between this method and that developed in the current study in that both
28

2 Literature review
involve a relative assessment of variables reflecting (a) source strength (following mitigation by treatment in the case of the current study) and (b) receiving environment sensitivity, including physico-chemical characteristics. Consistent with the approach adopted by Lundy et al (2012), the method to be developed by the current study also involves the multiplication of scores for these two variables to calculate an overall risk score for each discharge point or sub-catchment (see sections 4.4 and 4.5).
In another UK study, Ellis et al (2012) explicitly followed a ‘source-pathway-receptor’ approach to develop a methodology which considered not only contaminant source strength and potential impact but also took account of the effects of stormwater treatment. A pollution index (PI) was developed which, for each combination of contaminant and land use, reflected the median and range of EMCs drawn from 71 separate UK studies. The higher the value of the pollution index (on a scale 0–1), the greater the likelihood that runoff quality will exceed a receiving water EQS. A pollution mitigation index (PMI) was also developed which, for each combination of stormwater treatment device and group of contaminants, reflects the likely effectiveness of mitigation based on the contaminant removal processes involved: the better the performance, the lower the value of PMI (also on a scale of 0-1). The site pollution index (SPI) was calculated as the product of the PI and PMI for each land use type, averaged over the site as a whole. The SPI was assigned to one of five impact classes, ranging from ‘negligible’ (SPI <0.1) to ‘severe’ (SPI 0.7-1.0).
The method was applied by Ellis et al (2012) to a hypothetical motorway case study to demonstrate the potential performance of a range of stormwater treatment devices in relation to the mitigation of different contaminants. This application of the method appears to represent something of a hybrid between absolute and relative approaches to the assessment of risk. While the PI is referenced to an EQS (hence, an absolute assessment), the PMI is based on a relative ranking of treatment device performance, being described by the authors as “qualitative” and unable to “be used to indicate the magnitude of difference” between the performance of different forms of stormwater treatment (Ellis et al 2012). The (absolute) PI and (relative) PMI are then combined to produce the SPI which appears to be interpreted in a relative sense, using terms such as ‘negligible’ and ‘severe’.
2.5 Conclusions The literature review has informed the method development in the following ways:
• It supports the development of a relative assessment approach, because methods for making absolute assessments of risk (eg in the UK and US) are better suited to situations where:
- there is a large national body of locally collected road runoff data
- significant resources have been made available to support the extensive range of analyses required for the development of such tools in response to regulatory requirements
Neither of these requirements applies to the New Zealand context, which lent support to the development of a simplified method for making relative risk assessments; this approach has significantly less data requirements and consequently was able to be delivered within the project’s available resources and timeframe.
• It supports the adoption of a source–pathway–receptor approach as the basis of the method, with:
- traffic volume and road catchment area as relevant factors influencing source strength
- natural and designed stormwater treatment systems as relevant factors influencing pathway attenuation, and therefore the contaminant load delivered to the receiving environment
29

Risk assessment of road stormwater runoff
- receiving environment sensitivity (based on, for instance, ecological metrics) as a relevant factor influencing receptor impacts.
• It suggests that the inclusion of the following factors represents novel additions when compared with risk assessment modelling methods developed elsewhere:
- road and driving characteristics (such as congestion) as factors influencing source strength
- drainage pathways (eg contrasting pipe networks with permeable drainage channels) as one of the factors influencing pathway attenuation
- urban land use as a factor influencing source strength and hence receptor impacts.
Furthermore, the review provided some insights into elements of other methods that could inform the development process. First, in the development of the RSS model for assessing relative risk, it provided support for an approach which assigns levels of risk based on a scoring or indexing system reflecting combinations of source strength and receiving environment sensitivity. Second, commonalities in the approaches adopted by US and UK agencies provide a template for a New Zealand-based absolute risk assessment method for road runoff as a subsequent stage of research. Key elements for consideration in this approach are: the estimation of design event pollutant concentrations from locally collected data; the comparison against national water quality standards; and the adoption of statistical/probabilistic approaches as a way of assessing risk.
Section 7.2 of this report further discusses considerations for the development of a method for undertaking absolute risk-based assessments and recognises the potential to incorporate some of the approaches described above.
30

3 Planning and legislative context
3 Planning and legislative context
3.1 Introduction This chapter provides an overview of the planning and legislative context for stormwater management that is relevant to end user application of the RSS model developed during the project.
With the focus being on future developments rather than the status quo, discussions were held with Greater Wellington Regional Council (GWRC) on the approach they and other councils might take in the future for consenting stormwater discharges for road runoff and the potential value of a risk-based process to support consenting approvals/assessments. While the current legislative framework is discussed briefly in this report, the review was forward looking and intended to inform how the RSS model might be of value to regulatory end users.
The research focused on reviewing aspects of the NPS-FM and identifying its significance for the RSS model. The aim was that the RSS model output would frame the relative risk level (low/medium/high) of road runoff discharged to a given receiving water body and thus provide a pointer to the consenting requirements and potential need for stormwater treatment4.
3.2 Current statutory framework The Transport Agency Environmental and Social Responsibility framework is outlined in figure 3.1. The Land Transport Management Act 2003 (LTMA) provides the legal framework for managing and funding land transport activities. The main driver of environmental and social regulatory requirements is the Resource Management Act 1991 (RMA). The Local Government Act 2002 and the Government Roading Powers Act 1989 establish functions, duties and powers of road controlling authorities (RCAs) with respect to the management of stormwater runoff from land and roads. Both pieces of legislation are exercised subject to the requirements of the RMA and its associated resource management plans.
It is the RMA regime which establishes the framework of objectives and policies within which the effects of stormwater management activities are managed. The levels of governance and legislative framework are shown in figure 3.2 and illustrate the hierarchy of responsibilities for central government, regional councils and district/city councils. Every level has a responsibility to address stormwater and the effects on water quality.
4 This chapter reflects the position as drafted in February 2015 and may no longer reflect regional council policy developments made since then.
31

Risk assessment of road stormwater runoff
Figure 3.1 NZTA Environmental and Social Policy Framework
Source: NZ Transport Agency (2014)
Figure 3.2 Diagram showing the hierarchy among the Resource Management Act 1991, national policy
statements, regional policy statements and regional plans
Source: MfE (2014) NPS-FM
32

3 Planning and legislative context
3.2.1.1 Resource Management Act 1991
Stormwater runoff from roads is considered to be a contaminant, the definition of which is contained in the RMA5. The RMA is the overarching legislation that deals with the discharge of contaminants and s15 of the RMA prohibits unauthorised discharges of contaminants to water and land. The responsibility is on regional councils to be satisfied that none of the following effects of the discharge on the receiving waters (after reasonable mixing) will arise (s70):
• the production of conspicuous oil or grease films, scums or foams, or floatable or suspended materials
• any conspicuous change in the colour or visual clarity
• any emission of objectionable odour
• the rendering of fresh water unsuitable for consumption by farm animals
• any significant adverse effects on aquatic life.
Schedule 3 of the RMA sets out water quality classes and lists standards for each class. These standards relate mainly to water temperature and dissolved oxygen and state there should be no undesirable biological growths as a result of any discharge of a contaminant into the water. There are no standards that apply specifically to contaminants such as heavy metals that would typically come from road runoff (either from vehicles themselves or non-road sources).
While the provisions of the RMA are considered relatively high level, any future guidance will need to meet these requirements.
3.2.1.2 National Policy Statement for Freshwater Management 2014
National policy statements are issued under the RMA for matters of national significance. Central government can use national policy statements to direct regional, district and city councils on how they manage these matters in their regional and district plans or when considering resource consent applications. The NPS-FM directs regional councils to consider specific matters about freshwater in regional planning in a consistent way across the country.
The NPS-FM outlines objectives and policies that direct local government to manage water in an integrated and sustainable way. A key feature is the setting of freshwater objectives with compulsory national bottom lines for ecosystem health and human health for recreation, based on robust science. It also sets minimum acceptable states for other national values (iwi and community values). Overall quality of fresh water within a region must be maintained or improved, although it is acknowledged that this will take time. In seeking to achieve this objective, regard must be had to, among other things, the connections between freshwater bodies and coastal water.
5 Contaminant includes any substance (including gases, odorous compounds, liquids, solids, and micro-organisms) or energy (excluding noise) or heat, that either by itself or in combination with the same, similar, or other substances, energy, or heat: (a) when discharged into water, changes or is likely to change the physical, chemical, or biological condition of water, or (b) when discharged onto or into land or into air, changes or is likely to change the physical, chemical, or biological condition of the land or air onto or into which it is discharged.
33

Risk assessment of road stormwater runoff
Communities and iwi will determine the timeframes and the processes to be followed to achieve this (the deadline for regional councils to implement the NPS-FM is 2025, although this may be extended to 2030 in certain circumstances6).
The NPS-FM is most relevant to this research project given that it will provide territorial authorities with the regulatory framework to set freshwater objectives and resource allocation limits and associated methods of implementation around water quality. This is discussed in further detail in section 3.3 below.
3.2.1.3 New Zealand Coastal Policy Statement
The New Zealand Coastal Policy Statement (NZCPS) (DoC 2010) contains policies on the discharge of contaminants and in particular the management of discharges of stormwater. The provisions are high level and address contaminant and sediment loadings in runoff, and promote the integrated management of catchments and stormwater networks. While there are no specific metrics contained in the NZCPS, the intent is important to note in this research project7.
There are overlaps between the NPS-FM and the NZCPS, specifically in relation to enhancement of water quality, sedimentation and discharge of contaminants (Greenberg 2014).
3.2.1.4 Regional planning provisions
In general, regional authorities have responsibility for issues related to water quality and water quantity while territorial authorities have primary responsibilities for issues related to subdivision and land use. Regional authorities implement environmental controls through regional plans that specify consenting requirements. Regional plans tend to promote rules around mitigating the effects of construction activities associated with roading projects and typically address issues around erosion and sediment control.
Auckland Regional Council (2003) Technical publication 10 (TP10) provides general guidance on the design approaches required to deliver both water quantity and water quality benefits. This guidance is commonly used by regional councils and is based on the water quality volume criterion required to achieve a certain level of suspended solid removal.
Industry is generally moving away from an approach where stormwater is designed around a compliance standard (eg a set sediment LRF) to more of a performance based approach where the discharge needs to meet defined standards. It is noted that both the Wellington City Council and the Auckland Unitary Council are no longer using ‘TP10’ as a standard, except for Roads of National Significance projects. This is discussed further in section 3.5.
As highlighted in background reports to this research project, there is little consistency among regional plans and other planning frameworks on the management of stormwater with few or no rules around management of runoff from roads during operation (in contrast to extensive controls during construction). The ambiguities and uncertainties can cause unnecessary delays in roading projects (Page 2004) and unnecessary expense in stormwater treatment options. In a regulatory environment lacking in certainty and consistency in relation to stormwater management, roading designers face difficulties in incorporating acceptable stormwater solutions, thereby forming the basis of this research project.
6 See Policy E1 (ba) of the NPS-FM (MfE 2014) 7 Note: A Supreme Court decision of 17 April 2014 is likely to lend weight to the strict interpretation of national policy statements. The decision, in relation to New Zealand King Salmon’s proposals to establish salmon farms in the Marlborough Sounds, essentially recognised that the NZCPS (and potentially any other national policy statement) is the mechanism by which part 2 of the RMA is given effect.
34

3 Planning and legislative context
3.3 Non-statutory frameworks 3.3.1 Australian and New Zealand Guidelines for Fresh and Marine Water
Quality
The Australian and New Zealand Guidelines for Fresh and Marine Water Quality (ANZECC 2000) provide an established reference for water quality management in New Zealand, particularly for toxic contaminants. They provide methods for setting limits on pollutant concentrations in freshwater, coastal and marine environments. Toxicants include heavy metals typically found in stormwater runoff from roads. These guidelines are commonly referenced in regional plans. Given the wide application of the guidelines, they are likely to be supplementary to any gaps in implementation measures to be used in promoting the NPS-FM.
Central to the ANZECC 2000 guidelines are trigger values derived according to risk assessment principles and representing the best current estimates of the concentrations of chemicals that should have no significant adverse effects on the aquatic ecosystem. Three levels of guideline trigger values for ecosystem conditions are derived – high conservation/ecological value; slightly-to-moderately disturbed; or highly disturbed. These levels have the potential to be aligned with risk indices derived from application of the RSS model although it is noted that the model provides a relative rather than absolute (effects-based) assessment of risk (see chapter 7 for discussion on potentially extending the model to provide for an absolute risk approach).
ANZECC 2000 is currently under review and the revised guidelines will incorporate new data on a wide range of contaminants, toxic chemicals, and physical and chemical stressors. This includes correcting, revising and deriving toxicant trigger values for nitrate, boron, manganese and salinity (none of which are relevant to road runoff). More importantly for this study, the review will probably8 include correcting and revising toxicant trigger values for copper and zinc in water (B Williamson, pers comm, 6 November 2015). This will enable water managers/regulators to set appropriate thresholds for protecting water quality in different types of waterbodies. The ANZECC 2000 guidelines are currently the appropriate source of data for streams and rivers for the RSS model developed in this study.
ANZECC 2000 also specifies sediment quality guidelines, termed ‘trigger values’. These are based on sediment quality guidelines described in Long et al (1995) termed ‘event range low’ and ‘event range medium’, but also include some adjustments based on guidelines developed in Hong Kong. The current revisions of ANZECC 2000 are unlikely to bring about changes to trigger values for copper, zinc or lead (B Williamson, pers comm, 6 November 2015).
3.3.2 NZ Transport Agency guidelines
The NZ Transport Agency takes its environmental and social responsibility seriously and promotes the safe and efficient movement of goods and people in a manner that avoids, to the extent reasonable in the circumstances, adverse environmental and social impacts. This is reflected in the external and internal strategy and policy documents, including the Transport Agency’s Environmental and Social Responsibility Policy and State Highway Environmental Plan. These documents and the State Highway Environmental and Social Responsibility Standard are consistent with the requirements of the LTMA and the RMA. These Transport Agency policy and strategy documents provide direction under which more detailed guidance material exists.
8 The need for these revisions has been identified by the Ministry for the Environment (MfE), Auckland Council, GWRC and Environment Canterbury (ECan), but the status of this review was uncertain at the time of writing this report
35

Risk assessment of road stormwater runoff
The Transport Agency guidance documents that are most relevant to stormwater management are briefly discussed below.
3.3.3 State Highway Environmental Plan
The State Highway Environmental Plan9 sets out the strategic environmental and social vision for the Transport Agency and helps guide the development of specifications and standards with which the contractors undertaking roading works are required to comply, as well as help and guide other land transport operators.
The environmental plan provides specific direction on stormwater-related issues including the following objectives:
• W1 ensure runoff from state highways complies with RMA requirements
• W2 limit the adverse effects of runoff from state highways on sensitive receiving environments
• W3 ensure stormwater treatment devices on the network are effective
• W4 optimise the value of water management through partnerships with others.
The plan includes the following methods to achieve these objectives of particular relevance to the research:
• Influence proposed policy statements and plans to improve consistency with accepted stormwater management practice in relation to the use and functioning of the state highway network.
• On the existing network, identify sensitive receiving environments that are adversely affected by state highway runoff. As appropriate, treat the identified sites, based on a prioritisation approach.
3.3.4 Erosion and Sediment Control Guidelines for State Highway Infrastructure
The Erosion and Sediment Control Guidelines for State Highway Infrastructure (September 2014)10 recognises that erosion and sediment control is an important issue as sediment from state highway construction sites can have significant detrimental impacts on downstream receiving systems. It is noted that these guidelines are focused on construction activities associated with state highways (rather than operational activities) and therefore have limited relevance for the research project.
3.3.5 Stormwater Treatment Standard for State Highway Infrastructure
The Stormwater Treatment Standard for State Highway Infrastructure (May 2010)11 and accompanying manuals provide guidance to assist roading practitioners with the selection and design of roading stormwater management practices.
The standard is highly relevant to this research project, in particular table 3-1 (receiving environments and stormwater issues) and the flowchart (figure 7-3) outlining stormwater practice selection that cross-references table 3-1. The risk-based model will assist users in interpreting the process flowchart by providing greater clarity on the risks to receiving environments from road stormwater runoff and therefore interpreting sites on the road network where treatment may be needed and those where it is unlikely.
9 http://air.nzta.govt.nz/state-highway-environmental-plan 10 www.nzta.govt.nz/resources/erosion-sediment-control/docs/erosion-and-sediment-control-guidelines.pdf 11 www.nzta.govt.nz/resources/stormwater-management/docs/201005-nzta-stormwater-standard.pdf
36
3 Planning and legislative context
In many situations, site conditions dictate what practices can be used. The manuals identify roading stormwater management practices, hydrologic design methods and design calculations for those practices. In addition, worked examples provide guidance on specific situations where a stormwater management practice is appropriate and how to size the assets. The main objectives of the manuals are to:
• ensure that runoff from state highways complies with RMA requirements by limiting the adverse effects of runoff from state highways on sensitive receiving environments.
• ensure that stormwater treatment devices on the network are effective.
• optimise the value of water management systems through partnership with others.
The emphasis is on meeting the requirements of the RMA but through an effective and optimal manner (as envisaged, for example, using the RSS model developed in this study to identify and prioritise higher-risk areas of the road network where discharges to stream and rivers may potentially cause adverse effects requiring further investigation).
3.3.6 Local authorities
Non-legislative frameworks also include council-wide protocols on best practice for council road maintenance and operational activities. Local area design guidelines are non-prescriptive and may form part of, or sit alongside, the district plan. Examples of these are land development and subdivision standards for stormwater management, and local plans and policies. Of relevance to the research project case study is the Te Awarua-o-Porirua Harbour Strategy and Action Plan12 which contains the overarching vision for the harbour and catchment including guidance on stormwater management.
The most significant guidelines associated with road runoff are the NZS 4404:2010 Land Development and Subdivision standards for stormwater management, and which incorporate design principles such as low impact design solutions. These standards have no status for binding a consent authority to use them and various councils seek to individualise and tailor subdivision and stormwater codes of practice standards based on their own city or district environmental and physical characteristics. The standards do, however, provide local authorities, developers, and their professional advisors with criteria for design and construction of land development and subdivision infrastructure and encourage sustainable development and modern design. They are applicable to greenfield and infill development, and brownfield redevelopment projects. In addition to stormwater management they also include requirements for earthworks and geotechnical needs, roads, wastewater, water supply, landscape, and network utility services.
Kapiti Coast District Council is considered to be at the forefront of good practice in the management of stormwater in new subdivisions with the extensive use of low-impact designs such as swales and wetlands.
3.4 Implementation of the NPS-FM and significance for the research project
One of the outcomes of the research project was to develop a road stormwater screening methodology (the RSS model) to assist decision makers in determining which receiving environments were more likely to be adversely affected by road runoff (local roads and state highways). The model aims to assist end users
12 www.pcc.govt.nz/DownloadFile/Publications/Harbour-Management/Te-Awarua-o-Porirua-Harbour-and-Catchment-Strategy-and-Action-Plan-June-2015
37

Risk assessment of road stormwater runoff
determine where stormwater treatment should be a priority, and conversely, which receiving environments are not likely to be adversely affected by road runoff and therefore do not require treatment.
The numerical states of the national objectives framework are measureable components of the NPS-FM and of relevance to the RSS model. These include freshwater management units and the freshwater quality accounting system, and potentially national bottom lines should attribute tables be developed for road-related contaminants. These requirements could in the future provide additional data in risk assessment using the RSS model and are discussed further below.
3.4.1 Freshwater management units
The first stage of plan development under the NPS-FM is to define appropriate freshwater management units (FMUs)13. These could be catchment(s), sub-catchment, zones or aquifer level and should be based on hydrological and ecological characteristics. They should also be relevant to the way that communities of interest are geographically located (such as iwi and hapu boundaries).
The catchment approach fitted well with the approach taken in the research project where the RSS model was developed on a catchment/sub-catchment basis.
3.4.1.1 Values, attributes and freshwater objectives
For each FMU, councils are required to work through a process of:
• identifying the values associated with the FMU (the NPS-FM identifies both compulsory and non-compulsory national values)
• identifying the attributes (or measurable characteristics) relevant to those values (again the NPS-FM identifies some attributes relevant to the national values)
• formulating freshwater objectives for the FMUs, which are based on the values and attributes.
In this process, councils need to identify attributes relevant to values attached to a FMU. Of relevance to the study, councils could, for example, adopt copper and zinc as attributes relevant to the value of protecting aquatic life.
In addition to the attributes specified in the NPS-FM, communities have the ability to establish others, and in fact must do so where there are not relevant attributes for chosen values. In this regard, it is noted that at the time of writing this report (November 2015), regional councils (Auckland, Wellington and Christchurch) intended to embark on a study to develop attribute tables for copper and zinc, subject to funding (B Williamson, pers comm, 6 November 2015).
3.4.1.2 National bottom lines
The ‘national bottom lines’ are the minimum acceptable state for specified attributes of the compulsory national values and are specified in appendix 2 of the NPS-FM. These scientifically informed national bottom lines are set for several key attributes of water quality including nitrogen, phosphorus and phytoplankton (trophic state) in lakes; periphyton (slime), nitrate and ammonia toxicity in rivers; E. coli in both lakes and rivers; planktonic cyanobacteria (toxic algae) in lakes and lake-fed rivers; and dissolved oxygen levels downstream of point source discharges. Attribute state is given on a scale of A (good) to D (national bottom line).
13 www.mfe.govt.nz/sites/default/files/media/Fresh%20water/report-national-objectives-framework-reference-group.pdf p8
38

3 Planning and legislative context
It is noted that heavy metals (such as copper and zinc, the subject of this research study) are not currently listed in these national bottom line attributes. As stated in section 3.3, regional councils use the thresholds in the ANZECC 2000 water quality guidelines. However, communities will have to determine values that are important to their areas. If, in the future, attribute tables were included in the NPS-FM for copper and zinc, councils would then need to assign a state at or above the national bottom line for the FMU.
3.4.1.3 Limits
The NPS-FM provides for resource allocation limits to be set for water quality (as well as quantity). Through this mechanism, for example, limits on contaminant loads entering the receiving waterbody may be set for heavy metals, such as copper and zinc. The level at which such limits are set needs to reflect the outcomes sought through the freshwater objectives and cannot allow for over-allocation, which in relation to water quality means limits above the assimilative capacity of the waterbody.
Having set limits, councils must determine the method of implementation to ensure both the limits and their associated freshwater objectives are met. At a broad level these methods could be standards and conditions applying to permitted activities, resource consent requirements and possibly non-regulatory methods (eg voluntary implementation of industry standards such as those discussed in section 3.3).
Figure 3.3 shows the diagrammatic relationship between various criteria (eg values, attributes, freshwater objectives) in the NPS-FM.
Figure 3.3 Diagram showing the relationship between criteria defined in the NPS- FM
Source: MfE (2015)
By becoming involved in the development of regional plans, the Transport Agency has the opportunity to set realistic freshwater objectives and limits for heavy metals in road runoff. It is anticipated that the RSS model will help:
• identify which freshwater objectives and limits are likely to be difficult to meet
• councils have regard to coastal waters when setting freshwater objectives, limits and methods of implementation
• determine which stormwater systems or contaminants are likely
• with the prioritisation of catchments, including in which catchments resource consent-based methods of implementation are required
• the Transport Agency and councils to determine in which catchments actual monitoring and information gathering should be focused, where region-wide stormwater rules operate (eg under the
39

Risk assessment of road stormwater runoff
Proposed Natural Resources Plan for the Wellington region (GWRC 2015). This may be useful both for determining the extent of information supplied in resource consent applications and in the drafting of resource consent conditions.
3.4.2 Freshwater quality accounting system
The NPS-FM specifies that FMUs will be measured against the bottom lines through a ‘freshwater quality accounting system’14. This system records, aggregates and keeps regularly updated information on the measured, modelled or estimated:
• loads and /or concentrations of relevant contaminants
• sources of relevant contaminants
• amount of each contaminant attributed to each source (and where limits have been set, the proportion of the limit that is being used).
The RSS model (which is applied in a screening context to quantify copper and zinc contaminant loads from both road vehicles and urban sources) would be able to assess the risk of such contaminants exceeding a given load at the catchment level from a rural road network (and differentiate the contributions from local roads and state highways, and from non-road urban sources).
3.4.3 Conclusions
While the NPS-FM provides greater direction and support to help regional councils and unitary authorities apply the requirements in a consistent way across the country through measuring water quality, the outcome will be regional policies and plans that are tailored to the region and the specific values of the community. Therefore, there will be variation from region to region with regard to how councils approach stormwater treatment on the road network.
The RSS model is a method to be applied in a nationally consistent manner; however, it is able to take into account regional and freshwater management unit variations by using contaminant load data derived from site-specific attributes of the road network (eg traffic intensity and pathway attenuation) and sensitivity of the receiving environment of the FMU.
The type of water body covered by the NPS-FM includes streams, rivers, ponds, lakes, wetlands (and aquifers). While estuarine environments are not directly included, policies A1, B1 and appendix 1 of the NPS-FM specifically instruct councils to take into account the connections between waterbodies and, in particular, the connections between freshwater and coastal waters. Although the final receiving environment for these contaminants is coastal ecosystems, the delivery mechanism is freshwater streams and creeks15.
The RSS model could potentially ‘tap’ into the data that will eventually come out of the measurable (numeric) policies and objectives of the NPS-FM. This could potentially be achieved through the application of data resulting from the key components of the NPS-FM. The attribute states and the data used to determine these could potentially benefit the research project by building criteria into the RSS model to be used in assessing the risk of contaminated runoff from the road onto the receiving environment.
14 www.mfe.govt.nz/sites/default/files/media/Fresh%20water/report-national-objectives-framework-reference-group.pdf p8 15 www.mfe.govt.nz/sites/default/files/media/Fresh%20water/freshwater-accounting-guidance-final.pdf
40

3 Planning and legislative context
Therefore the concept of relative risk (eg low, medium or high) categories identified in the study could be determined by the attributes set by the councils. For example, a high-risk receiving environment might be different in two regions because the objective set by one council is much more stringent, as opposed to a national effects-based approach which is more objective.
3.5 Focus areas This section highlights two focus areas where regional councils are promoting the policies of the NPS-FM. The examples show the different approaches taken by the GWRC and the Auckland Council, the former being guided by whaitua (catchment area) committees and the other taking a more prescriptive approach in setting limits.
3.5.1 Greater Wellington Regional Council 3.5.1.1 Integrated plan
The draft Natural Resources Plan16 for the Wellington region prepared by GWRC has since been publicly notified on 31 July 2015 as the Proposed Natural Resources Plan (PNRP)17. The PNRP combines coastal and regional plans and incorporates regulatory and non-regulatory methods. It will replace the current regional plans by a single integrated plan and will provide the future direction on regulating discharge of stormwater in the region. It is relevant given that the research project’s case study in Te Awarua-o-Porirua Harbour (the official name18 for Porirua Harbour since 1 August 2014) falls within this region.
The PNRP identifies several distinct whaitua within the region, and provides an approach to establishing priorities and programmes within each of these through whaitua committees. The regional plan uses the word ‘whaitua’ to describe a catchment or sub-catchment managed as an integrated system. GWRC is taking a staged approach to implementation, which relies on a programme of whaitua committees to implement the NPS-FM on a catchment scale. If successful, this could potentially be used as a model for other regional councils.
The PNRP has been developed ‘with’ the community rather than ‘for’ the community and the content of the proposed plan is a result of intensive engagement and discussion with many different parts of the regional community. The proposed plan has also been developed in partnership with the mana whenua iwi of the region. The plan identifies mana whenua values for water at a regional and catchment scale and also schedules more places of importance to mana whenua.
Whaitua
The proposed plan includes five chapters for the five largest catchments/whaitua: Ruamahanga, Wellington Harbour/Hutt Valley, Te Awarua-o-Porirua, Kapiti and the Wairarapa Coast. The water quality limits for discharges to land and water are yet to be developed.
In the case of the Porirua catchment, including Te Awarua-o-Porirua Harbour, the whaitua will be managed as an integrated system. Through a collaborative process, whaitua committees will develop recommendations for land and water management specific to local needs and values within their whaitua/catchment area. Te Awarua-o-Porirua Whaitua Committee will make recommendations to GWRC through a Whaitua Implementation Programme (WIP). This WIP will contain recommendations, strategies
16 www.gw.govt.nz/developing-a-new-regional-plan-q-and-a/ 17 www.gw.govt.nz/proposed-natural-resources-plan/ 18 www.pcc.govt.nz/Publications/Porirua-Harbour-and-Catchment-Management-Programme#renaming
41

Risk assessment of road stormwater runoff
and actions which will inform plan change processes and form a programme of work to achieve the community’s objectives for water quality and quantity within the whaitua/catchment.
The Te Awarua-o-Porirua Harbour Strategy and Action Plan contains the overarching vision for the harbour and catchment and the WIP will identify regulatory provisions that will achieve this vision. The action plan contains non- regulatory actions and the WIP may recommend additional non-regulatory actions to complement those already in the action plan.
The Te Awarua-o-Porirua Whaitua Committee was established in December 2014 and will have up to two years to prepare its WIP, during which time it will be supported by a technical group coordinated by GWRC. The RSS model is well timed to feed into the catchment modelling work to be overseen by this committee and may be of value in exploring the relative contribution that road traffic makes to stormwater contaminants in the region.
Wellington City Council consents
In 2010, GWRC granted global stormwater consents to Wellington City Council for a duration of 10 years, designed to drive longer-term improvements in the quality of stormwater discharges to Wellington Harbour and the South Coast. There is a strong focus on monitoring and management to reduce sewage infiltration into the stormwater network. Monitoring information collected over this period, including the management plans to be developed through this consent, will provide Wellington City Council with information to identify contaminant sources and prioritise actions to reduce stormwater contamination beyond the 10 years of the consent.
The RSS model could potentially identify the risk profile from road runoff to prioritise where more (or less) effort is needed and assist development of catchment management plans under stage 2 of the consent. Likewise the model may be of value to the Wellington Harbour/Hutt Valley whaitua when this committee is appointed.
3.5.1.2 Auckland Unitary Council
Approach
It has long been recognised that stormwater runoff is a predominant contributor to water quality and stream and coastal ecosystem health in Auckland19. As a result, stormwater management has been a significant component of the approach to managing fresh and marine waters in the operative Auckland Regional Policy Statement, the Auckland Regional Plan: Air, Land and Water Plan and the Auckland Regional Plan: Coastal (Coastal Plan). Auckland Council has developed the Auckland Unitary Plan (the Unitary Plan) and will replace the Auckland Regional Policy Statement and the 12 existing district and regional plans (legacy plans), many of which are already more than 10 years old.
The Unitary Plan continues to develop and refine this approach to improve environmental and community outcomes and address gaps in the current approach to stormwater management. In particular, the Unitary Plan seeks to better integrate the management of land use and development and associated adverse effects, with a greater focus on the generation and management of stormwater at or near‐source. This is consistent with the direction provided by the NPS-FM, the NZCPS and the Auckland Plan.
As part of development of this broader approach, Auckland Council has also reconsidered the performance requirements for the management of stormwater quality and quantity that is currently
19 www.aucklandcouncil.govt.nz/EN/planspoliciesprojects/plansstrategies/unitaryplan/Pages/home.aspx?utm_source=shorturl&utm_medium=print&utm_campaign=Unitary_Plan
42
3 Planning and legislative context
required by the legacy plans and current practice. The reconsideration of stormwater contaminant management has stemmed from concerns that the current performance requirement for stormwater quality, generally 75% removal of total suspended solids, does not adequately address the contaminants of concern (which may not be sediment) from an activity. Also the specification of a removal percentage does not guarantee the effluent quality from a device (as this is dependent on influent quality). The assessment of contaminant levels identifies the main stormwater contaminants and the extent to which they are of concern in Auckland in terms of their effects on water quality and their accumulation in receiving environments.
Design effluent quality requirement
The Unitary Plan proposes a change in the measure of performance of stormwater treatment devices from percentage removal to a design effluent quality requirement (DEQR). This includes broadening the range of indicator contaminants to total suspended solids, metals (copper and zinc) and temperature, for which the DEQR must be met depending on the nature of the receiving environment into which they discharge.
The contaminant loads generated by the RSS model for a given road network could potentially ‘feed’ into the values selected for the DEQR to assist in decision making around the most effective treatment devices for stormwater runoff in a given area.
High contaminant generating activities
The contaminant yields from a variety of land-use activities are identified, based on stormwater sampling and modelling that has been undertaken in Auckland. Those with relatively high yields have been identified as high contaminant generating activities (HCGAs). These yields are then compared with the results of an assessment of the performance of a range of best management practices, using both local and international information, to derive the land use activities to which stormwater treatment best management practices should be applied to reduce contaminant concentrations and loads.
The application of stormwater contaminant treatment to HCGAs is proposed in the Unitary Plan. HCGAs are those land-use activities that generate and discharge contaminants at a level where treatment will result in a substantial reduction in contaminant concentration and load.
HCGAs are identified as car parking areas, building roofing and high-use roads. High-use roads are:
• a motorway, state highway, regional primary arterial and/or district secondary arterial road
• a road that carries more than 10,000 vehicles per day or is modelled to carry more than 10,000 vehicles per day by 2025.
The RSS model could be used to prioritise the risk from runoff from high-use roads (as a type of HCGA) and more broadly tie in with the levels of treatment associated with the land-use activities. This could be done in conjunction with the identification of streams and their sub-catchments that are particularly susceptible to the adverse effects of increased contaminant concentrations in stormwater runoff (as discussed below).
Stormwater management area: flow (SMAF) overlay
Streams and their sub-catchments have been identified in the Unitary Plan in the stormwater management area: flow (SMAF) overlay, which is a spatially applied set of requirements for the development and redevelopment of impervious areas. Two classes of SMAF are identified. SMAF1 are sub‐catchments that discharge to streams with high current or potential value that are sensitive to increased stormwater flows and which have relatively low levels of existing impervious area.
43

Risk assessment of road stormwater runoff
SMAF2 are sub‐catchments that discharge to streams with moderate to high current and potential values and sensitivity to stormwater flow and with generally higher levels of existing impervious area within the sub‐catchment. Different mitigation requirements apply in each of these areas, with more stringent requirements applying in a SMAF1. The SMAF overlay has been mapped and included in the Unitary Plan using a GIS. This has the potential to tie in with the RSS model output.
Water sensitive design approach
Also of relevance to the research study is the Auckland Council Guideline GD2015/004 ‘Water sensitive design for stormwater’ (Lewis et al 2015), which sets principles to inform water sensitive design approaches to land-use planning and development. The four principles are to:
1 Promote inter‐disciplinary planning and design
2 Promote the values and functions of natural ecosystems
3 Mitigate stormwater effects as close to source as possible
4 Utilise natural systems and processes for stormwater management.
Stormwater hydrology rules in the Unitary Plan assist with implementation of principles 3 and 4 above, providing requirements for hydrology controls using natural systems and processes. The other two principles require integration across departments of the council and sections of the Unitary Plan. This approach will move away from the current controlled activity rules for highway network operator activities in the Auckland Council Regional Plan.
3.6 Implications for RSS model development The following bullet points summarise the implications of the planning and legislative regime for the RSS model developed under this research project. These points may be of interest to end users regarding how output from application of the model may be of use in implementing freshwater and stormwater planning legislation and guidelines.
• The NPS-FM is relevant to this research project given that it will provide regional council and unitary authorities with the regulatory framework to set objectives, attributes and limits around water quality. The RSS model is closely aligned with the requirements of the NPS-FM, although it would benefit from being able to incorporate attribute tables for zinc and copper that may shortly be under consideration by the National Objectives Framework Reference Group.
• While there are no specific metrics contained in the NZCPS, the intent with respect to enhancement of water quality (Policy 21), and reducing the discharge of sediment (Policy 22) and stormwater contaminants (within Policy 23) is important to note in the context of this research project which includes a module to assess risks to coasts and estuaries from road runoff.
• The engineering community is generally moving away from an approach where stormwater treatment is designed around a prescriptive compliance standard (eg a set of sediment LRFs) to more of an effects-based approach where the discharge needs to meet defined performance standards. Councils, through the implementation of the NPS-FM, will set limits that will also be performance based.
• The ANZECC 2000 guidelines are the appropriate source of data for risk assessment of streams and rivers, which forms part of the RSS model developed in this project. The guidelines are currently under review and, of note for this study, will probably include correcting and revising toxicant trigger values for copper and zinc. The RSS model will need to be updated with any such changes.
44

3 Planning and legislative context
• The RSS model will need to be aligned with (and potentially inform any future reviews of) the Transport Agency’s stormwater guidance documents (eg screening new roads and decisions on where on the existing road network retrospective stormwater treatment may need consideration through ‘ground-truthing’).
• The RSS model will need to be aligned with (and potentially inform any future reviews of) regional council/unitary authority guidance documents on stormwater consenting (eg Auckland Council’s SMAF overlay).
• The RSS model (and output from the case study for Te Awarua-o-Porirua Harbour) may be of interest to the Te Awarua-o-Porirua Whaitua Committee in their assessment of setting limits for water quality associated with road runoff under their remit to provide recommendations to GWRC on freshwater management required by the NPS-FM.
• Building on the development of the RSS model from this study, the Transport Agency could use the opportunity to be pro-active in raising the need for a risk-based approach in the future consenting of road runoff with regional councils through the implementation of the NPS-FM.
3.7 Further aspects for consideration This chapter summarises the findings of a briefing note prepared in March 2015. It was designed to elicit further discussion and feedback during the course of development of the RSS model developed in this study so that it was best placed to meet end-user needs. The briefing note concluded with a set of questions on aspects that needed further consideration:
• At what geographical location does the NPS-FM end its extent of influence to coastal waters?
• How can the coastal environment be incorporated into the RSS model to be consistent with the requirements around freshwater quality (as outlined in the NPS-FM)?
• Given the changes envisaged in the future due to the requirements of the NPS-FM, will the ANZECC 2000 guidelines and TP10 still play an important role in managing stormwater quality?
• Given that the implementation of the NPS-FM is a long-term process and will be implemented by regional councils at various times over the next 15 years, what metrics/values could be used in the RSS model in the shorter term?
• How can a consistent methodology be developed for the research project output that satisfies the different approaches councils will be taking in implementing the NPS-FM?
• How will the regional council allocate responsibility to the RCAs in a FMU for reducing the contaminant load in road runoff when the specified limit is being exceeded?
• How will the regional council apportion contaminant loads in road runoff from road traffic per se and other non-road sources (if at all)?
Some of these aspects were developed in the context of the RSS model as the research project progressed.
45
Risk assessment of road stormwater runoff
4 Methodology
4.1 Introduction This section provides an overview of the RSS model developed under the current study, beginning with descriptions of the model platform and risk assessment framework adopted. The methodology for estimating contaminant loads (road traffic and urban) is then described, and followed by a summary of the risk assessment process for the different receiving environments (rivers/streams and coasts/estuaries). A final section provides a summary of the features and assumptions of the model and limitations in its use.
4.2 Model platform and risk framework 4.2.1 Screening model platform
The RSS model was developed using a combination of ESRI ArcGIS and MS Excel. ArcGIS is used to determine data inputs and to map results. Excel provides the calculation platform for the estimation of contaminant loads and risk.
The basic spatial unit for the assessment is the river reach sub-catchment from the river environment classification (REC) (Snelder et al 2010). The REC dataset consists of point (confluence nodes), line (stream channels) and polygon (sub-catchments) shapefiles describing the physical characteristics of river systems in New Zealand including hydrology (source of flow, stream order, annual average flow rate, and flow direction), climate (mean annual rainfall), topography (slope) and geology.
An example of the REC dataset is given in figure 4.1 which shows the stream network by stream order in the extended case study area comprising Pauatahanui Inlet and Onepoto Arm and their catchments (a sub-set of the Te Awarua-o-Porirua Harbour catchment, as defined in figure 5.1). REC river reaches are typically between 500–1,500m in length with an average length of around 750m and average sub-catchment area of around 40ha.
For rivers and streams, risk is assessed for each of the REC reach sub-catchments. For coasts and estuaries, risk is assessed at river and stream mouths based on the contaminant contributions of all upstream REC sub-catchments20 (refer to sections 4.4 and 4.5, respectively, for further details of the risk assessment methodologies).
4.2.2 Risk assessment framework
The level of relative risk associated with the discharge of stormwater contaminants to receiving waterbodies is assessed according to the combination of two attributes:
• a contaminant strength (CS) score, based on contaminant loads
• a receiving environment sensitivity (RES) score, based on receiving environment characteristics.
While the methods of deriving the CS and RES scores for rivers and streams differ from those for coastal/estuarine receiving environments, the adoption of the same overall framework ensures conceptual consistency.
20 Except where coastal discharge points do not coincide with a river or stream mouth (ie a stormwater outlet), in which case risk is assessed based on the contaminant contribution of the immediate (non-REC) catchment (see section 4.5 and appendix D).
46
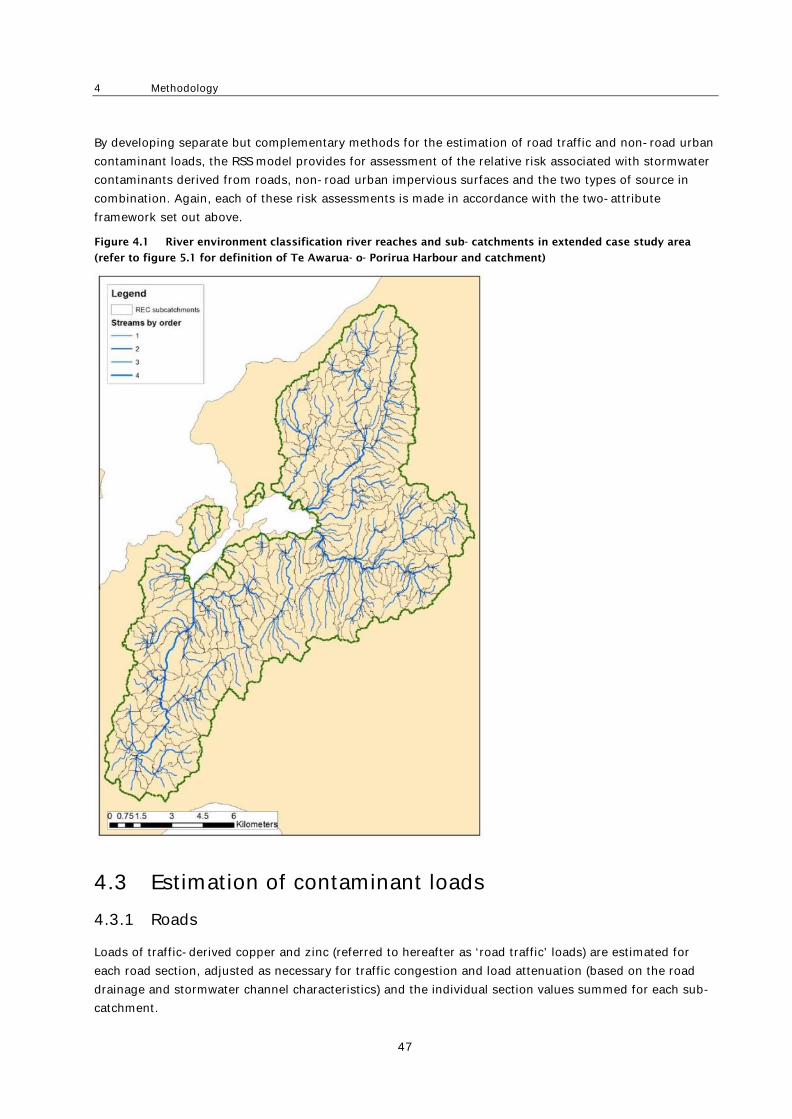
4 Methodology
By developing separate but complementary methods for the estimation of road traffic and non-road urban contaminant loads, the RSS model provides for assessment of the relative risk associated with stormwater contaminants derived from roads, non-road urban impervious surfaces and the two types of source in combination. Again, each of these risk assessments is made in accordance with the two-attribute framework set out above.
Figure 4.1 River environment classification river reaches and sub- catchments in extended case study area
(refer to figure 5.1 for definition of Te Awarua- o- Porirua Harbour and catchment)
4.3 Estimation of contaminant loads 4.3.1 Roads
Loads of traffic-derived copper and zinc (referred to hereafter as ‘road traffic’ loads) are estimated for each road section, adjusted as necessary for traffic congestion and load attenuation (based on the road drainage and stormwater channel characteristics) and the individual section values summed for each sub-catchment.
47

Risk assessment of road stormwater runoff
The road traffic contaminant loads are calculated according to the following method (see figure 4.2 and refer to appendix A for further details):
(Note: AADT = annual average daily traffic; VKT = vehicle kilometres travelled; LoS = level of service (free-flowing, interrupted or congested); VEF = vehicle emissions factor; LRF = load reduction factor; SWC = stormwater channel)
1 The road network is ‘cookie-cut’ with road sections assigned to each sub-catchment.
2 The annual VKT is calculated as the product of AADT and road length for each road section.
3 The road LoS (measure of congestion) is calculated from the AADT and road capacity.
4 The road VEF is selected from a lookup table based on LoS and contaminant (zinc or copper).
5 The annual raw copper/zinc load (g/yr) is calculated as the product of VKT and VEF.
6 LRFs are selected based on road drainage and SWC:
a A LRF is selected from a lookup table listing features of the network in RAMM (eg catchpits, side drains) which ‘treat’ stormwater (ie remove sediment and thus copper/zinc). (Refer to example in figure A.2, appendix A: note that not all stormwater treatment devices installed in the network are coded in RAMM, eg swales, detention ponds).
b A stormwater channel LRF is selected from a lookup table for SWCs that attenuates contaminant loads (eg earth lined ditches, natural grass verges); the model allows for additional user selection of natural soil permeability (poor/good) based on shapefiles sourced from https://lris.scinfo.org.nz.
7 Annual loads of copper and zinc delivered from the road are calculated as the product of VKT, VEF, the (1-LRF) factor for drainage and the (1-LRF) factor for SWCs (see example in figure A.4, appendix A).
8 Annual loads of copper and zinc for each sub-catchment are summed from the individual road contributions.
4.3.2 Urban
Annual loads of copper and zinc generated from urban non-road impervious surfaces (referred to hereafter as ‘urban’ loads) are calculated according to the following method (see figure 4.3 and refer to appendix B for further details).
1 The total built-up area in each REC sub-catchment is calculated from land covers mapped in the LCDB4 spatial database21.
2 The non-road built-up area is calculated by subtracting the areas of local roads and state highways from the total built-up area in each sub-catchment.
3 The areas of residential and industrial/commercial land uses are calculated from analysis of aerial photography. Urban land uses are grouped into these two classes as a reflection of the markedly higher copper and zinc generating potential associated with areas of industrial and commercial land use compared with areas of residential land use (see appendix B). The estimation of the areas of the different land uses could also involve the use of land-use zoning overlays, where available, to assist the interpretation of aerial photographs.
21 Source: http://mfe.govt.nz/issues/land/land-cover-dbase/ and https://lris.scinfo.org.nz/layer/412-lcdb-v40-land-cover-database-version-40/
48

4 Methodology
Figure 4.2 Method for estimating road traffic loads of copper and zinc
Note: AADT = annual average daily traffic; VKT = vehicle kilometres travelled; LoS = level of service (free-flowing, interrupted or congested); VEF = vehicle emissions factor; LRF = load reduction factor; SWC = stormwater channel
Figure 4.3 Method for estimating non- road (‘urban’) loads of copper and zinc
4 The area of non-road impervious cover in each of the two land-use classes is calculated by multiplying the non-road built-up area by the respective impervious fraction. In general, imperviousness is expected to be higher in areas of industrial and commercial land use than in areas of residential land use. Appendix B describes the derivation of the impervious fractions used in the current study.
5 Annual urban loads of copper and zinc are then calculated as the product of the area of non-road impervious cover and the copper and zinc yields. This calculation is made separately for residential and industrial/commercial land uses, respectively, and the results summed to give the total urban copper and zinc loads in each REC sub-catchment.
The copper and zinc yields specified for residential and industrial/commercial land uses are weighted averages of yields specified in Auckland Council’s CLM for each of a range of roof materials and for paved areas (Auckland Regional Council 2010). Weighting is based on the fractions of different roof materials
49
Risk assessment of road stormwater runoff
and paved surfaces in representative residential areas and industrial and commercial areas, respectively. Based on the CLM’s reference area fractions of each roof type and paved areas, the following weighted average copper and zinc yields were calculated:
• an annual copper yield of 0.016g m-2 and an annual zinc yield of 0.31g m-2 from non-road impervious surfaces in residential areas
• an annual copper yield of 0.036g m-2 and an annual zinc yield of 0.71g m-2 from non-road impervious surfaces in industrial/commercial areas.
The fractions of each land cover type can be changed to derive location-specific yields, where supported by local information22. Further details on the copper and zinc yields and their derivation, including comments relating to uncertainty, are given in appendix B.
4.4 River and stream risk assessment The assessment of risk to rivers and streams is based on:
• the CS score, which reflects the in-stream concentrations of copper and zinc in the water column
• the RES score, which reflects condition bands associated with application of the macroinvertebrate community index (MCI).
The methods by which the CS and RES scores are derived are set out below, with further details given in appendix C.
The CS score is assigned as follows:
• For each REC reach, the mean in-stream concentrations of copper and zinc are calculated from the estimated annual loads (road traffic derived, urban or combined) delivered to that reach from the immediate sub-catchment and all upstream contributing sub-catchments, divided by the estimated mean annual flow for the reach (after Woods et al 2006).
• The method then takes account of the potential for the effects of copper and zinc to be ‘cumulative’, meaning that the presence of elevated concentrations of both metals has the potential to result in effects at lower concentration thresholds than if only one or the other metal was present. The calculation of the CS score is therefore based on comparison of ‘cumulative criterion units’ (CCUs; Hickey and Golding 2002) against thresholds derived from ANZECC 2000 water quality guideline values.
CCUs are calculated as:
CCU = (Conc Cu / ANZECC 99% Cu conc) + (Conc Zn / ANZECC 99% Zn conc) (Equation 4.1)
• The lower threshold is set at CCU = 1, equivalent to both copper and zinc being present at half their ANZECC 2000 99% level of protection concentrations.
• The upper threshold is set at CCU = 2.367, equivalent to both copper and zinc being present at half their ANZECC 2000 95% level of protection concentrations.
• It is important to note that ANZECC 2000 values are used here to signal relative differences in the level of risk, not to provide an absolute assessment of risk (see appendix C for further discussion).
22 As was the case in the application of the method described in chapter 5 of this report (refer to appendix B for further details).
50

4 Methodology
The RES score is assigned as follows:
• Modelled MCI scores for each REC reach were provided by Cawthron Institute based on a previous assessment which predicted MCI scores from catchment and stream reach attributes (Clapcott et al 2013).
• Based on these modelled MCI scores, each REC reach is assigned to an ecological condition band: excellent, good, or poor-fair, and an RES score assigned accordingly.
The risk score is then the product of the CS score and the RES score as set out in table 4.1. Other than the contaminant load estimates used, the method is identical for the assessment of road, urban and combined risk. The contaminant loads used in the latter case are the sum of the estimated road and urban loads.
Table 4.1 Method for assigning risk scores (and levels, in brackets) based on the combination of CS and RES
scores for rivers and streams
Contaminant strength – cumulative criterion units
< 1 1 – 2.367 > 2.367
CS score 0 1 5
RES score
Receiving
environment
sensitivity –
MCI score
Excellent 3 0 (Lowest) 3 (Higher) 15 (Highest)
Good 2 0 (Lowest) 2 (Medium) 10 (Highest)
Poor – Fair 1 0 (Lowest) 1 (Lower) 5 (Highest)
A risk score of zero indicates the lowest level of risk. These are reaches where the combined concentrations of copper and zinc are below the CCU threshold associated with the ANZECC 2000 99% level of protection. Risk scores of 1 to 3 indicate that the combined concentrations of copper and zinc are greater than the CCU threshold associated with the ANZECC 2000 99% level of protection but below the threshold associated with the ANZECC 2000 95% level of protection. The increasing scores in this range reflect increasing receiving environment sensitivity, resulting in the risk level being assessed as either lower, medium or higher.
Risk scores of 5 and over indicate that the combined concentrations of copper and zinc are greater than the CCU threshold associated with the ANZECC 2000 95% level of protection. While the scores in this range also vary (from 5 to 15) as a function of the RES score, all are assessed as the ‘highest’ level of risk. This reflects the intent of the NPS-FM to maintain or improve water quality, irrespective of stream condition.
Thus, once the upper CCU threshold is exceeded, the method identifies a REC reach as being ‘highest risk’. The underlying risk scores then provide the ability to discriminate between ‘highest risk’ reaches potentially in need of protection (reaches currently in good or excellent condition, with risk score of 10 or 15) and ‘highest risk’ reaches potentially in need of rehabilitation (reaches currently in poor or fair condition, with risk score of 5).
4.5 Coast and estuary risk assessment The assessment of risk to coasts and estuaries is based on:
• the CS score, which reflects the concentrations of copper and zinc in sediments delivered to the receiving environment
• the RES score, which reflects the extent to which depositional processes dominate in the receiving environment.
51
Risk assessment of road stormwater runoff
The methods by which the CS and RES scores are derived are set out below, with further details given in appendix D.
The CS score is assigned as follows:
• For each coastal discharge point (including stream and river mouths), the mean sediment concentrations of copper and zinc delivered at the outlet are calculated from the respective annual loads (road traffic-derived, urban or combined) discharged from the immediate sub-catchment and all upstream contributing sub-catchments divided by the estimated annual sediment load delivered to that outlet. Sediment loads are estimated using the catchment land use for environmental sustainability (CLUES) model, based on sub-catchment land use (Semadeni-Davies et al 2011, see appendix D).
• As with the method for rivers and streams, the method takes account of the potential for the effects of copper and zinc to be ‘cumulative’, meaning that the presence of elevated concentrations of both metals has the potential to result in effects at lower concentration thresholds than if only one or the other metal was present. In this case, however, the calculation of the CS score is based on comparison of CCUs against thresholds derived from threshold effects level (TEL) and probable effects level (PEL) sediment metal concentrations (MacDonald et al 1996).
CCUs are calculated as:
CCU = (Conc Cu / TEL Cu conc) + (Conc Zn / TEL Zn conc) (Equation 4.2)
• The lower threshold is set at CCU = 1, equivalent to both copper and zinc being present at half their TEL concentrations.
• The upper threshold is set at CCU = 4.1, equivalent to both copper and zinc being present at half their PEL concentrations.
• It is important to note that the TEL and PEL values are used here to signal relative differences in the level of risk, not to provide an absolute assessment of risk (see appendix D for further discussion).
• It should also be noted that the TEL and PEL values apply to sediments deposited in receiving environments, as opposed to suspended sediments at the point of discharge. However, it is assumed that metal concentrations in suspended sediments can be adopted as surrogates for metal concentrations in deposited sediments (see appendix D for further discussion).
It should be noted that as well as water quality guidelines, ANZECC 2000 also contains interim sediment quality guidelines (SQG) values, termed ‘trigger values’. These are based on SQGs described by Long et al (1995) and termed ‘event range low’ and ‘event range medium’, which are based on an effects database. In contrast, the present study uses SQGs which were developed from a database which includes both effects data and no-effects data, and produces two trigger values: the TEL and PEL (McDonald et al 1996). These are more conservative than the ANZECC 2000 values, and are considered appropriate to use while potential revisions to the ANZECC 2000 SQG are under consideration (B Williamson, pers comm, 6 November 2015).
The risk of contaminant build-up in sediment increases with the depositional nature of the receiving environment. In contrast to the rivers and streams risk assessment method (in which the RES score reflects ecological condition), the coast and estuary risk assessment therefore focuses on the physical characteristics of the receiving environment. For any given contaminant load, risk is assessed as being relatively low in high energy environments and relatively high in low energy depositional environments.
The RES score for each outlet is assessed as follows:
52
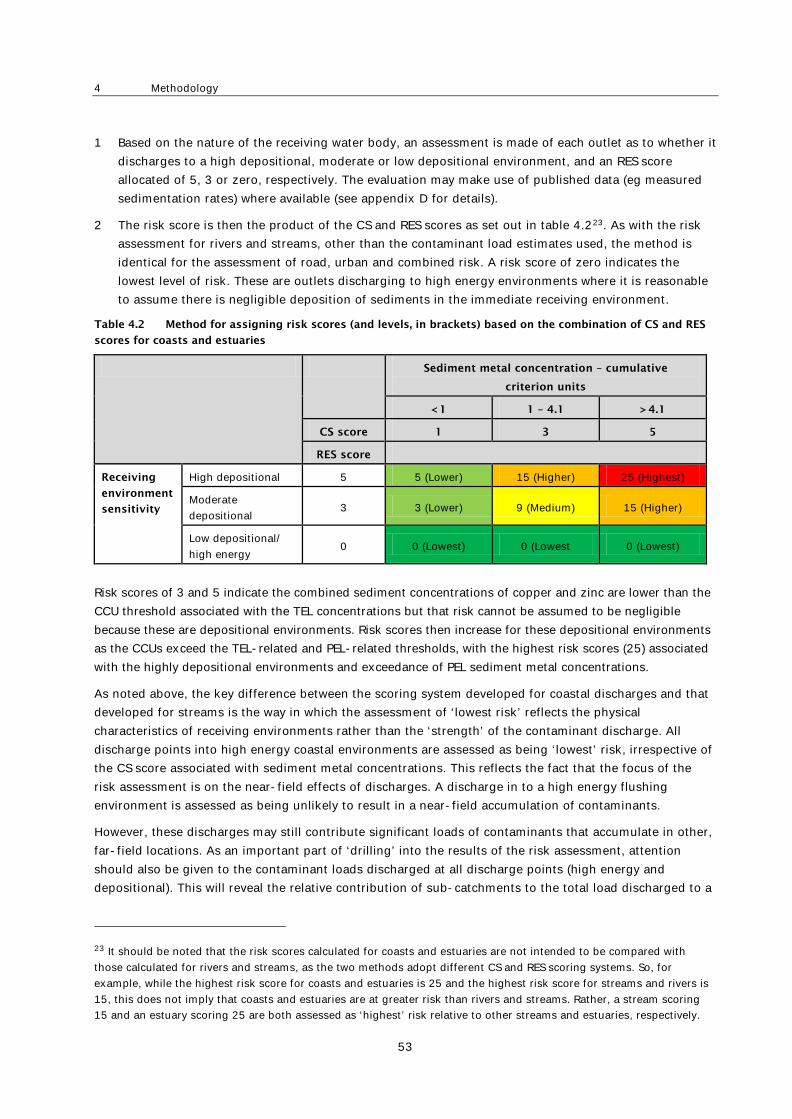
4 Methodology
1 Based on the nature of the receiving water body, an assessment is made of each outlet as to whether it discharges to a high depositional, moderate or low depositional environment, and an RES score allocated of 5, 3 or zero, respectively. The evaluation may make use of published data (eg measured sedimentation rates) where available (see appendix D for details).
2 The risk score is then the product of the CS and RES scores as set out in table 4.223. As with the risk assessment for rivers and streams, other than the contaminant load estimates used, the method is identical for the assessment of road, urban and combined risk. A risk score of zero indicates the lowest level of risk. These are outlets discharging to high energy environments where it is reasonable to assume there is negligible deposition of sediments in the immediate receiving environment.
Table 4.2 Method for assigning risk scores (and levels, in brackets) based on the combination of CS and RES
scores for coasts and estuaries
Sediment metal concentration – cumulative
criterion units
< 1 1 – 4.1 > 4.1
CS score 1 3 5
RES score
Receiving
environment
sensitivity
High depositional 5 5 (Lower) 15 (Higher) 25 (Highest)
Moderate depositional
3 3 (Lower) 9 (Medium) 15 (Higher)
Low depositional/ high energy
0 0 (Lowest) 0 (Lowest 0 (Lowest)
Risk scores of 3 and 5 indicate the combined sediment concentrations of copper and zinc are lower than the CCU threshold associated with the TEL concentrations but that risk cannot be assumed to be negligible because these are depositional environments. Risk scores then increase for these depositional environments as the CCUs exceed the TEL-related and PEL-related thresholds, with the highest risk scores (25) associated with the highly depositional environments and exceedance of PEL sediment metal concentrations.
As noted above, the key difference between the scoring system developed for coastal discharges and that developed for streams is the way in which the assessment of ‘lowest risk’ reflects the physical characteristics of receiving environments rather than the ‘strength’ of the contaminant discharge. All discharge points into high energy coastal environments are assessed as being ‘lowest’ risk, irrespective of the CS score associated with sediment metal concentrations. This reflects the fact that the focus of the risk assessment is on the near-field effects of discharges. A discharge in to a high energy flushing environment is assessed as being unlikely to result in a near-field accumulation of contaminants.
However, these discharges may still contribute significant loads of contaminants that accumulate in other, far-field locations. As an important part of ‘drilling’ into the results of the risk assessment, attention should also be given to the contaminant loads discharged at all discharge points (high energy and depositional). This will reveal the relative contribution of sub-catchments to the total load discharged to a
23 It should be noted that the risk scores calculated for coasts and estuaries are not intended to be compared with those calculated for rivers and streams, as the two methods adopt different CS and RES scoring systems. So, for example, while the highest risk score for coasts and estuaries is 25 and the highest risk score for streams and rivers is 15, this does not imply that coasts and estuaries are at greater risk than rivers and streams. Rather, a stream scoring 15 and an estuary scoring 25 are both assessed as ‘highest’ risk relative to other streams and estuaries, respectively.
53

Risk assessment of road stormwater runoff
receiving coastal water body and may highlight sub-catchments that are not high risk in terms of near-field effects but are important in terms of their contribution to the overall load discharged to a harbour or other coastal water body.
4.6 Summary of model features, assumptions and limitations
4.6.1 Summary of model features
As noted in section 1.1, the aim of this study was to revise and enhance the Transport Agency’s 2007 VKT screening tool for road runoff to allow wider application to rivers/streams and coasts/estuaries, and to factor in the effects of pathway attenuation, traffic congestion and non-road pollution sources.
Table 4.3 provides a summary of the new features and enhancements of the screening method (referred to as the RSS model) that has been developed under this research project.
4.6.2 Assumptions and limitations
The RSS model is intended for the specific purpose of screening road networks and their associated catchments for relative risk from stormwater (including road runoff) discharging to receiving environments. A number of simplifying assumptions (and therefore consequent limitations) have been incorporated and are highlighted for users, as noted below:
1 The RSS model provides estimates of risk to waterbodies based on zinc and copper concentrations in stormwater runoff derived from modelled loads; other stormwater contaminants are not included although these metals provide a proxy for stormwater pollution.
2 The ‘front end’ module of the RSS model comprises two contaminant load models – one for estimating vehicle-derived zinc and copper in road runoff and the other for non-road (urban) sources of these metals (eg zinc from galvanised roofs). The risk estimates are derived from the combination of road traffic and urban loads and therefore address the main sources of these metals in stormwater runoff.
3 The contaminant load model for road traffic includes provision for LRFs for both stormwater channels (SWCs) and stormwater treatment devices, as included in their respective RAMM datasets. A summary of default LRFs used in the RSS model is given in table A.2, appendix A. (Note that other treatment devices, such as swales or detention ponds, may be present on the road network and not included in this database, and therefore not included by the model).
4 The current model has default LRFs for catchpits and side drains. For roads with one or more catchpits, the model makes the simplifying assumption of applying an average catchpit LRF for the whole road link (see section A5.5, appendix A).
5 The model runs in the case study included treatment by SWCs but ignored any existing stormwater treatment device within the road network in order to provide a conservative estimate of contaminant load, in keeping with its screening application. Thus for the case study the catchpit LRF in the look-up table was set to zero (see discussion in section A5.1, appendix A).
6 The estimation of urban loads of copper and zinc uses representative yields for residential and industrial/commercial land uses, respectively, derived from land cover fractions and yields in Auckland Council’s CLM. The application of the method does not involve detailed land-use analysis, nor does it attempt to address uncertainty inherent in the yields adopted from the CLM, meaning that urban loads derived from the default yields should therefore be considered indicative only. However,
54

4 Methodology
as noted below, individual applications of the method can adopt alternative, locally derived yields where available.
7 The methodology was developed to address the longer-term risks to waterbodies from the total annual loads of zinc and copper in stormwater runoff. The risk assessment does not take account of variations in copper and zinc concentrations during storm events and the potential effects of these variations.
8 Reflecting the conservative nature of the assessment, the model does not disaggregate metal loads into their particulate and dissolved fractions. For the assessment of risk in rivers and streams, it is the dissolved fraction of copper and zinc that are of most concern and which would be compared with guideline concentrations in a further assessment of absolute risk.
9 The modelled MCI scores used in the rivers and stream risk assessment are considered to be useful for summarising patterns at broad scales, but should not necessarily be expected to provide accurate predictions at a site level (J Clapcott, pers comm, 23 April 2015). While noting this caution, given the emphasis of the current study on the development of a high-level RSS model for identifying relative risk, the modelled MCI scores are considered to be an appropriate metric for representing variations in receiving environment sensitivity.
10 The coastal risk assessment method involves calculation of concentrations of copper and zinc in suspended sediment and assumes that these reflect the likely relativity of risk associated with metal concentrations in deposited sediments. Physical, chemical and biological processes operating in receiving environments may result in result in metal concentrations in deposited sediments differing from those in suspended sediments. However, given the relative nature of this risk assessment, it is assumed here that relative differences between metal concentrations in suspended sediments at multiple points of discharge are preserved in differences between metal concentrations in deposited sediments, providing a basis for the use of the former in the risk assessment.
11 Overall, the model calculates an absolute load and concentration of contaminants in road runoff, absolute MCI and absolute contaminant concentrations in receiving water bodies, and compares them with absolute water and sediment quality guideline concentrations. Relativity arises in using totals instead of dissolved concentrations in stream waters, the relative scores for depositional environments, and using suspended sediment concentration (rather than sediment concentrations in the coastal receiving environment), and the absence of the consideration of storm event concentrations in the assessment of risk.
12 The RSS model identifies the relative risk to receiving environments from runoff (on a scale ‘lowest’ to ‘highest’) and the contributing sections in the road network for the traffic component. It does not assess absolute risk to waterbodies and therefore whether or not stormwater treatment is required to meet environmental standards; however, the output will aid decision making by identifying risks from stormwater discharges in a catchment and therefore prioritising which parts of the road network may warrant further investigation (eg monitoring to support a consent application).
13 The model inputs provide a framework for general (national) application of the RSS model using default values. Certain inputs (eg values in look-up tables; land-use mix and zinc yields for determining urban loads) can be adjusted to reflect local conditions and an example is described from the case study under section 5.6 dealing with model sensitivity testing.
For the above reasons, the RSS model is to be used on a comparative rather than absolute basis for screening road networks and their likely risks to receiving environments. In this respect it is intended to
55

Risk assessment of road stormwater runoff
provide guidance to network operators and road controlling authorities on the management of road runoff and the development of catchment management plans.
Similarly, reflecting uncertainty in the estimation of loads of both road and urban derived contaminants, the relative contribution of road and non-road sources of copper and zinc in any given sub-catchment estimated by the RSS model should be considered indicative. While these load estimates provide a fit-for-purpose basis for supporting the risk assessment provided by the model, any management response is likely to first require a targeted investigation of the relative importance of different contaminant sources in a given stormwater catchment.
56

4 Methodology
Table 4.3 Summary of new features and enhancements of the road stormwater screening (RSS) model developed under this research project
Attribute Capability In VKT
tool?
Proposed upgrades to VKT screening
tool
Capability of RSS model developed in this study
Platform Geospatial platform at sub-catchment level
Yes No change – as per NZ Transport Agency RR 315 (Gardiner and Armstrong 2007)
Model is fully GIS compatible
Risk model Source – pathway – receiving environment (RE)
Yes No change – as per NZ Transport Agency RR 315 (Gardiner and Armstrong 2007)
Provides a consistent SPR risk assessment approach for both rivers/streams and coasts/estuaries
Risk ranking Relative ranking of impacts for prioritisation
Yes Enhancement: ranking procedure to include effects of congestion and pathway attenuation (see below)
Allows for traffic congestion, stormwater treatment and pathway attenuation in deriving road traffic contaminant load
Risk basis Effects-based assessment (trigger levels in RE)
No Research will explore means to adopt an effects-based risk model and document with recommendations (implementation plan)
Risk assessment output linked to ANZECC water quality guidelines (rivers/streams), TEL/PEL sediment metal concentrations (coast/estuaries), and receiving environment sensitivity
Road type Model state highways and local road networks
Yes No change (but ability to compare relative pollutant loads)
Separate standalone traffic contaminant load models developed for local roads and state highways
Traffic level Based on VKT (AADT) by sub-catchment
Yes Enhancement: convert VKT to pollutant load (using VEF factors – Moores et al 2010)
Output as zinc and copper load (mg/yr) using VEF factors based on New Zealand road conditions
Traffic flow Source strength allows for traffic congestion
No New feature: congestion factor for pollutant loads based on level of service (from AADT and road capacity)
Contaminant load model allows for traffic congestion using VEF values for copper and zinc linked to level of service of road sections
Pathway attenuation
Ability to quantitatively factor in pollutant load attenuation based on drainage pathway type
No New feature: attenuation factor for road/state highway drainage based on RAMM coding (Gardiner et al 2007) and field data on stormwater treatment removal efficiencies (eg Moores et al 2010)
Provision of LRFs for attenuation of contaminants in road drainage pathway by natural infiltration (eg road verges) or stormwater treatment (eg catchpits)
Water body type
Depositional, eg lakes, estuaries, harbours (based on slow build-up of traffic-generated contaminated particulate copper, zinc)
Yes Enhancement: estimation of pollutant load at final receiving environment (based on VEF factors and pathway attenuation as described above)
Estimates zinc and copper contaminant load and sediment metal concentrations and a risk rating at final discharge locations based on combined urban and road traffic sources and receiving environment sensitivity.
Rivers and streams (impact at outfall from road stormwater run-off)
No New feature: develop a method for impact assessment of rivers and stream based on concentration (from road pollutant load
Provides risk assessment (copper and zinc) at sub-catchment level based on estimated concentration in water column (road traffic plus urban sources)
57

Risk assessment of road stormwater runoff
Attribute Capability In VKT
tool?
Proposed upgrades to VKT screening
tool
Capability of RSS model developed in this study
and mean stream flow) and RE sensitivity. and receiving environment sensitivity based on modelled MCI scores.
Stormwater treatment
Linkage of pollutant load to level of treatment required
No New feature: develop a screening relationship between VKT, VEF (road type), pollution load and receiving environment sensitivity; and determine the indicative likelihood of different levels of stormwater treatment and the need for further field investigation (note: regional plan and consent requirements will determine the level of treatment required)
Identifies water bodies at risk from copper/zinc in stormwater runoff (road traffic, urban and combined sources); ‘lower’ risk areas of road network flagged for minimal stormwater treatment (if any); ‘higher’ risk areas flagged for further investigation and potential stormwater treatment; output compatible with future risk-based consenting of road runoff based on network/catchment analysis
Non-road pollution sources
Ability to take account of non-traffic generated pollutants (eg urban contributions of zinc)
No New feature: study will explore ability to take account of non-road pollution sources in stormwater based on catchment land use (eg % urban as proxy)
Able to quantitatively assess relative risk of zinc and copper in stormwater from non-traffic (urban) sources independently and in combination with road traffic sources
Natural soil drainage
Ability for pathway attenuation factors to allow for natural soil drainage in estimating contaminant load to receiving environment
No Built-in provision for user-selected natural soil drainage (‘poor’ or ‘good’) and nominal LRFs to allow for natural permeability in road corridor
Logic check on model output
Verify confidence in RSS model output compared with council-based ranking of receiving environments
No Validation of rivers/streams and coast/estuary risk assessments by comparing model output with GWRC stream/sediment data in case study area
Sub-categories of urban contributions
Extension of sub-categories for the ‘% urban’ proxy to include commercial and industrial land use (in addition to residential)
No Enhancement to help future-proof the model
Sub-categories of urban land use (commercial and industrial) incorporated into RSS model
Sensitivity analysis
Investigate robustness of model outputs in the face of uncertainty in model inputs
No Sensitivity analysis conducted in relation to variations in road-traffic copper and zinc loads (±15%) and higher urban zinc loads representing areas of higher zinc-yielding roofs
58

5 Case study evaluation
5 Case study evaluation
5.1 Introduction This chapter presents the findings from evaluation of the RSS model in the case study area of Te Awarua-o-Porirua Harbour24 and its catchment in the Wellington region.
It covers the following topics:
• a description of the case study area
• results and discussion of application of the RSS model to rivers/streams in the case study area
• results and discussion of application of the RSS model to coastal/estuarine waterbodies in the case study area
• sensitivity analysis and RSS model validation
• illustrative applications of the model, eg to ‘drill down’ on sections of the road network.
5.2 Case study area 5.2.1 Selection of original study area
The research brief for this study put forward two candidate sites for testing and evaluating the RSS model:
• Wellington Harbour (and catchment)
• Te Awarua-o-Porirua Harbour (and catchment).
The intention was to test the RSS model on selected sub-catchments in a representative area of one of the two candidate sites. The Pauatahanui Inlet arm of Te Awarua-o-Porirua Harbour was flagged as a suitable area as this contained a mix of rural roads, state highway and rural/urban land use.
The selection of the case study area was discussed at the first Steering Group meeting on 29 January 2015. Members noted that the urbanised sub-catchments and legacy industrial contamination in the Onepoto Arm could make interpretation of model findings more challenging given the greater urban inputs, while Pauatahanui Inlet offered both rural and urban aspects, and GWRC had some recent stream and sediment quality data that might be of value. It was therefore agreed that the model should be evaluated in Te Awarua-o-Porirua Harbour (Pauatahanui Inlet).
The study proceeded on this basis with road, traffic and other input data collated for the catchments draining to Pauatahanui Inlet. The case study was later extended to include Onepoto Arm and its catchments, as discussed in the following section.
24 On 1 August 2014 the New Zealand Geographic Board (NZGB) officially gazetted the 'new' name - Te Awarua-o-Porirua Harbour. NZGB advises that ‘Pauatahanui Inlet’ is a ‘recognised’ name for the eastern arm of the harbour, and should be identified as ‘Te Awarua-o-Porirua Harbour (Pauatahanui Inlet)’ where appropriate. NZGB recognises no official name for the southern arm of the harbour which is locally known as the ‘Onepoto Arm’. Porirua City Council encourages the use of ‘Te Awarua-o-Porirua Harbour (Onepoto Arm)’ where appropriate. Both arms of the harbour officially make up Te Awarua-o-Porirua Harbour. In this report the respective arms are referred to as Pauatahanui Inlet and Onepoto Arm.
59

Risk assessment of road stormwater runoff
5.2.2 Rationale for extension to Onepoto Arm
A key objective of upgrading the VKT screening tool (see section 1.3) was to develop a robust method for estimating non-road (‘urban’) contaminants and the risk that these may pose in runoff to streams/rivers in the catchment when aggregated with road traffic contributions.
Initial application of the stream/river risk assessment to Pauatahanui Inlet and its catchment showed the RSS model was sufficiently developed to allow evaluation of both road traffic and urban contributions. However, urban areas generate such relatively high loads of zinc and copper that the risk assessment method was found to be relatively insensitive, especially in sub-catchments where streams are small. In order to see greater discrimination, there was a need to test the method in an area containing larger areas of urban land discharging to bigger rivers.
Another aspect identified from the initial case study deserving further research was the need to evaluate and ‘future-proof’ the model in a commercial/industrial land-use setting as there were none in the Inlet study area. Consequently Onepoto Arm and its catchment, which included the urbanised, commercial and industrial areas around Porirua, were added to the study.
The expanded study was anticipated to lead to a more rigorous evaluation of the model and therefore a better quality research outcome for potential users. In particular the following benefits were envisaged:
• better discrimination through demonstration of the RSS model to assess road-related risk as the wider study area includes greater diversity in road characteristics
• more robust demonstration of the contribution of risk from road runoff for state highways vs local roads, particularly in urban areas
• more rigorous evaluation of the method to assess urban (non-road) related risk as the larger study area included greater diversity in land-use characteristics (particularly urbanised sub-catchments with high commercial/industrial land use)
• the means to inform GWRC on risk from road runoff for the Te Awarua-o-Porirua Harbour area which might assist their Te Awarua-o-Porirua Whaitua Committee set objectives under the NPS-FM
• the ability to inform implementation of the Porirua Harbour and Catchment Strategy and Action Plan; here it is worth quoting from Porirua City Council’s website25 regarding the Porirua Harbour and Catchment Literature Review:
A particular issue for integrated catchment management is the effects of the roads and other
hard surfaces that encircle Te Awarua-o-Porirua Harbour, to a degree that is unique in New
Zealand. This issue needs to be better understood.
5.2.3 Description of case study area
(Note: the following information is extracted from the Porirua Harbour and Catchment Strategy and Action Plan (PCC 2015) and Blaschke et al 2010. The latter reference provides a summary of literature on Te Awarua-o-Porirua Harbour including sediment characteristics, harbour hydrodynamics/flushing, water/sediment quality and land use).
The extended case study area comprised the two arms of Te Awarua-o-Porirua Harbour and their catchments (see figure 5.1). Te Awarua-o-Porirua Harbour is an estuary and outer harbour lying 20km north of Wellington city. The harbour catchment stretches 28km north-south from Pukerua Bay to
25 www.pcc.govt.nz/Publications/Porirua-Harbour-and-Catchment-Management-Programme
60

5 Case study evaluation
Johnsonville, and 15km east-west from Titahi Bay to Haywards Hill. The suburbs draining into Te Awarua-o-Porirua Harbour are shown in figure 5.2.
Figure 5.1 Location of Te Awarua- o- Porirua Harbour and catchment
Source: PCC (2015)
Te Awarua-o-Porirua Harbour comprises two arms – the larger eastern Pauatahanui Inlet (470ha) and the western Onepoto Arm (240ha) – and an outer harbour facing Cook Strait. The harbour is the largest estuary in the lower North Island and is a significant local and regional ecological resource. It is the only one with any significant seagrass cover and it has one of the largest cockle concentrations in New Zealand. The boundaries of the catchments draining to each estuary (and the area covered by the extended case study) are shown in figure 5.1 and described further in the following two sections.
61

Risk assessment of road stormwater runoff
Figure 5.2 Suburbs associated with Te Awarua- o- Porirua Harbour catchment
5.2.3.1 Pauatahanui Inlet
Figure 5.3 identifies Pauatahanui Inlet, its sub-catchments and the local road and state highway networks that comprised the original case study. The inlet catchment has an area of about 109 km2 and comprises six major sub-catchments: Browns Bay, Duck Creek, Pauatahanui, Ration Point, Horokiri and Kakaho, and six small catchments which drain only to the shoreline. The inlet receives freshwater and fluvial sediments and is subject to tidal flushing (approximately once every three days).
62

5 Case study evaluation
Figure 5.3 Outline of original study area (Pauatahanui Inlet and contributing catchments) comprising streams,
sub- catchments, local roads and state highway SH58
An enlarged plan of Pauatahanui Inlet (figure 5.4) shows the immediate surrounding road network, urban and rural areas and geographical features referred to in this report. The inlet has an area of 4.7km2 and a shoreline length of 13.2km with 1.1km2 of tidal flats (just under 25% of the inlet area). Surrounding catchment land use comprises pasture (45.8%), native forest and scrub (15%), exotic forest and scrub (22.8%), and an increasing proportion (13.8%) of urban development, notably in the catchments draining to the southern flanks of the inlet.
63

Risk assessment of road stormwater runoff
Figure 5.4 Pauatahanui Inlet showing surrounding roads, land use and geographical features
The Pauatahanui catchment has experienced recent growth of urban (mainly residential) development. Initially, urban areas were restricted to the mouth of the inlet at Mana and Golden Gate (the peninsula between Ivey Bay and Browns Bay). Starting in the 1960s, rapid development at Whitby occurred, with development spreading to Browns Bay and Duck Creek catchments, and reaching the hills near Pauatahanui village in 2004. On the northern side of the inlet, residential development is limited to Camborne and the Motukaraka Peninsula, but throughout the remaining rural parts of the catchment there are many ‘lifestyle’ blocks. Urban areas comprise 50% of the Browns Bay catchment, 16.2% of Duck Creek catchment and 41.1% of the smaller shoreline catchments. Residential development is continuing in eastern Whitby and elsewhere (Blaschke et al 2010).
The inlet is a nationally significant location for wetland bird species. Several areas of marsh in the inlet are now protected as reserves including Pauatahanui Wildlife Management Reserve (43ha), a wildlife refuge covering the east of the inlet (169 ha), Duck Creek Scenic Reserve (1 ha) and Horokiri Wildlife Management Reserve (5 ha). Both the tidal flats and the saltmarshes on the inlet have been designated outstanding water bodies in the Proposed Natural Resources Plan for the Wellington Region (GWRC 2015). The inlet is classified as an area of significant conservation value and has been rated by the Department of Conservation as a site of national significance in the Sites of Special Wildlife Interest database.
Statutory bodies with responsibilities for the Inlet include Porirua City Council, GWRC, Department of Conservation, the Transport Agency and Ministry of Fisheries.
5.2.3.2 Onepoto Arm
Figure 5.5 shows Onepoto Arm and its contributing catchments, together with the local road and state highway networks that comprised the extension to the case study area. Onepoto Arm and its catchments comprise an area of approximately 64km2 which represents about 35% of the equivalent total area of Te Awarua-o-Porirua Harbour (Blaschke et al 2010).
64

5 Case study evaluation
Figure 5.5 Outline of extension to study area (Onepoto Arm and contributing catchments) comprising streams,
sub- catchments, local roads and SH1
The main water body entering the Onepoto Arm is the Porirua Stream and its tributaries which discharge at the head of the estuary in Porirua City. The main tributaries include Kenepuru Stream, Takapu Stream and Cannons Creek on the east side and Mitchells Stream on the west of the catchment. Other larger tributaries are Stebbings and Belmont Streams draining the southern part of the catchment around Tawa, Churton Park and Johnsonville. Significant urban growth is occurring in this part of the catchment and presenting a risk to local streams, notably Stebbings. Porirua Stream and its tributaries drain over 80% of the Onepoto catchment and consequently provide the major contribution of stormwater (and hence stormwater contaminants) received by Onepoto Arm.
Land use in the Onepoto catchment is a mix of residential, commercial and industrial and distributed around the main centre comprising Porirua city and the neighbouring communities that include Linden, Tawa, Churton Park and Johnsonville further to the south. The population of Porirua city is approximately 51,000 with about another 33,000 people living in the southern part of the catchment administered by Wellington City Council.
65

Risk assessment of road stormwater runoff
An enlarged plan of Onepoto Arm (figure 5.6) shows the immediate surrounding road network, urban areas and geographical features referred to in this report. Onepoto Arm has an area of 2.4km2 and a shoreline length of 9.0km (Gibb and Cox 2009). Tidal flats cover around 0.5km2 or 20% of its area with many exposed at low tide. Surrounding land use is a mix of residential/commercial with the communities of Titahi Bay to the west and Papakowhaia and Aotea to the east, with Porirua city at the head of the arm. State highway SH1 runs along the eastern flank of the estuary.
Figure 5.6 Onepoto Arm showing surrounding roads, land use and geographical features
Water quality is generally regarded as poorer in Onepoto Arm than in Pauatahanui Inlet. This is particularly so at the head of the Onepoto Arm near the discharge point of Porirua Stream as this is the final receiving environment for stormwater from almost all the commercial and industrial areas of Porirua city and lower Porirua Stream catchment, as well as for urban areas further up the catchment as far as Johnsonville.
66

5 Case study evaluation
5.3 Model implementation While the model is described in full in chapter 4 and appendices A to D, the following points are made with regard to its implementation in the case study:
• Copper and zinc VEFs for LoS 1 roads were assumed to be the same as LoS 2 roads, due to a lack of data relating to LoS 1 roads.
• As discussed in section 4.6.2, the estimation of copper and zinc loads (road traffic and urban) took no account of stormwater treatment (eg catchpits); however, LRFs were incorporated to allow for natural attenuation of loads in the road corridor through, for example, road verges (type C stormwater channels) – see appendix A for full details.
• Natural soil drainage was incorporated into the LRF look-up table of the road contaminant model to allow for gross regional differences (grouped as either ‘good’ or ‘poor’); soil drainage was assumed to be ‘poor’ in major road corridors.
• The estimation of urban residential loads of zinc was based on a zinc yield of 0.14g m-2, (compared with the default yield of 0.31g m-2) which resulted in zinc to copper ratios consistent with observations in estuary sediments and reflected an assumption that residential roofs in the catchment had been constructed with low zinc-yielding materials.
5.4 Results and discussion – rivers and streams risk assessment
5.4.1 Introduction
As described in section 5.2, the case study was conducted in a staged fashion, with a risk assessment of the rivers and streams in the mainly rural Pauatahanui Inlet catchment completed initially and later extended to include rivers and streams in the more heavily urbanised catchment of Onepoto Arm. In this section, the results for the two parts of the harbour catchment are presented together. This provides for a more effective comparison of the performance of the risk assessment methodology in areas of markedly different road and land-use characteristics than would be achieved by the presentation of results separately for the two parts of the study area.
As noted in section 4.3.2, the method for estimating urban loads of copper and zinc allows for the specification of alternatives to the default yields for each of these metals. In the initial application of the method in the Pauatahanui Inlet catchment area, it was found that the ratio of total (road traffic + urban) zinc to copper was markedly higher in load estimates using the default yields than has been observed in sediment samples taken from locations around Pauatahanui Inlet. A lower residential zinc yield was therefore adopted which assumed an absence of high zinc-yielding roofing materials in residential parts of the case study area and which achieved a better match with the observed zinc to copper ratios (refer to appendix B for further details). The results presented below reflect the adoption of this lower residential zinc yield. Comparative results based on the adoption of the default residential zinc yield are presented in section 5.6 describing sensitivity analysis of the model.
In interpreting the results presented in this chapter, readers are reminded of the various limitations set out in section 4.6.2 of this report. In particular, while the estimated copper and zinc loads presented in section 5.4.2 provide an appropriate basis for assessing the relative risk in different sub-catchments, the contribution of road and urban sources of copper and zinc to the assessment of risk in any given sub-
67

Risk assessment of road stormwater runoff
catchment should be considered indicative. This caution reflects the fact that the estimation of both the road and urban loads of copper and zinc are subject to a number of sources of uncertainty.
5.4.2 Contaminant load estimates
Figures 5.7 and 5.8 present the annual loads of road traffic-derived and urban zinc, respectively, estimated by the RSS model for each sub-catchment in the extended case study area. Corresponding maps for copper are provided in figures 5.9 and 5.10. The place names and suburbs associated with these sub-catchments are cross-referenced in figure 5.2.
Reflecting the differences in the road network and land use described in section 5.2, modelled loads of both road traffic-derived and urban zinc and copper are generally higher in sub-catchments of Onepoto Arm than sub-catchments of the Pauatahanui Inlet.
The highest road traffic-derived loads (>5,000g/yr zinc and >2,500g/yr copper) are in a north-south oriented group of sub-catchments in the central part of the Onepoto Arm catchment intersected by SH1 and relatively dense parts of the local road network. The lowest road traffic-derived loads (<100g/yr zinc and copper) are generally in sub-catchments of the Pauatahanui Inlet intersected by a single rural road. Slightly higher loads (500–1,000g/yr zinc and 100–450g/yr copper) are estimated for an east-west oriented group of sub-catchments intersected by SH58 in the southern part of the Pauatahanui Inlet catchment.
The highest urban loads (>5,000g/yr zinc and >2,500g/yr copper) are in those sub-catchments containing industrial and commercial land uses and/or which are predominantly occupied by urban land use. As well as being distributed throughout the Onepoto Arm catchment, a cluster of these types of sub-catchments is located to the south of Pauatahanui Inlet. The remainder of the Pauatahanui Inlet catchment contains very little urban land and consequently most sub-catchments were modelled as generating no urban copper or zinc. This is also the case in a number of headwater sub-catchments of Onepoto Arm.
68

5 Case study evaluation
Figure 5.7 Estimated road traffic zinc load (g/yr) by sub- catchment for extended case study area
69
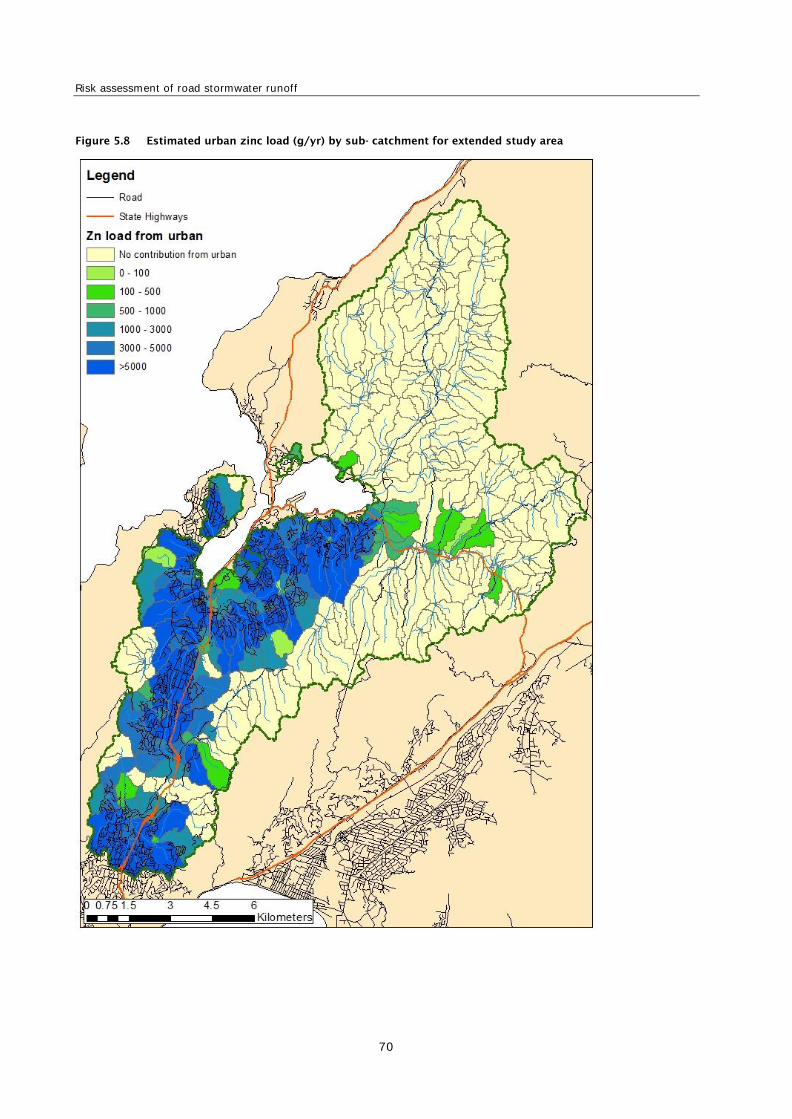
Risk assessment of road stormwater runoff
Figure 5.8 Estimated urban zinc load (g/yr) by sub- catchment for extended study area
70
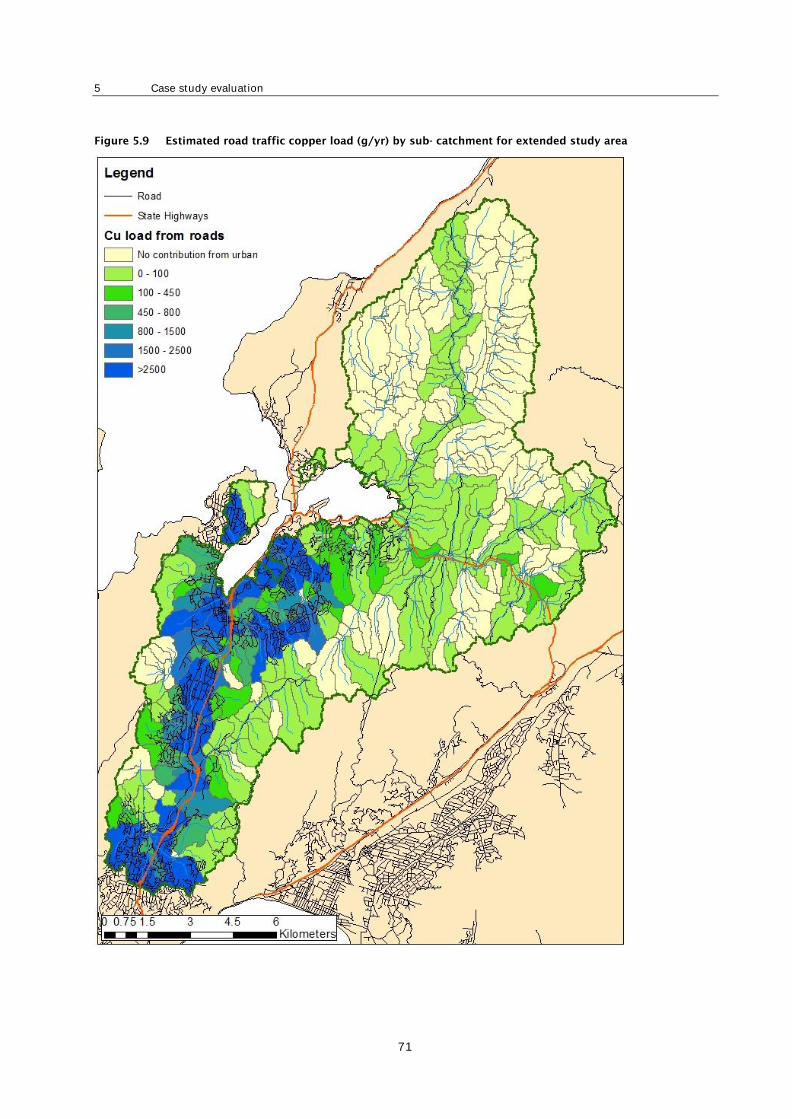
5 Case study evaluation
Figure 5.9 Estimated road traffic copper load (g/yr) by sub- catchment for extended study area
71
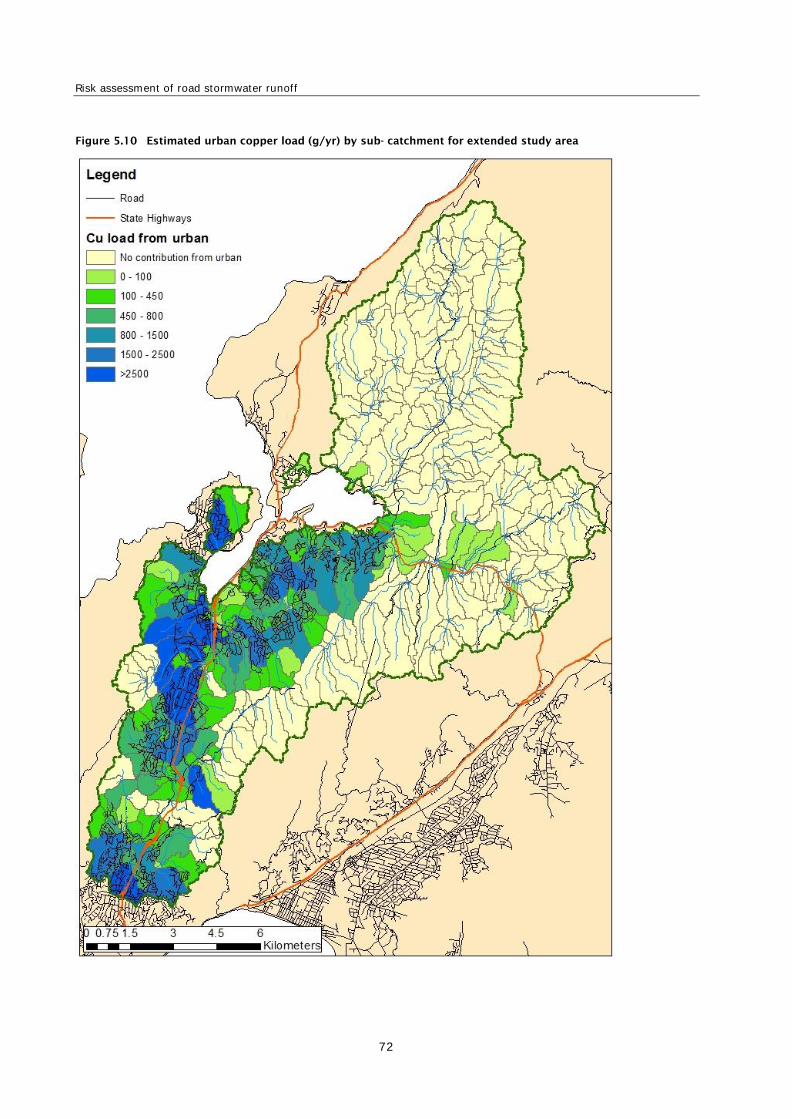
Risk assessment of road stormwater runoff
Figure 5.10 Estimated urban copper load (g/yr) by sub- catchment for extended study area
72

5 Case study evaluation
5.4.3 Risk assessment
The results of the risk assessment for rivers and streams in the case study area are shown in figure 5.11 (road traffic), figure 5.12 (urban) and figure 5.13 (combined road traffic + urban sources). In each case the risk assessment reflects the potentially cumulative effects of zinc and copper (refer to section 4.4). The place names and suburbs associated with these sub-catchments are cross-referenced in figure 5.2.
The road risk shows spatial variations in risk associated with road traffic-derived contaminants. The urban risk shows the spatial variation in risk associated with non-road derived contaminants. The combined risk is the overall effect from both contaminant sources. Note that while some of the ‘urban’ load may be conveyed in road runoff, much of it will be conveyed in the stormwater network without ever entering a road corridor (eg contaminants from roofs).
The results for road traffic risk (figure 5.11) indicate the majority of sub-catchment containing roads are classified in the ‘lowest risk’ category, especially in the catchment of Pauatahanui Inlet. In most of these sub-catchments, this indicates the streams have sufficient dilution potential to deal with the relatively small copper and zinc loads discharged in road runoff from the relatively limited road extent that they contain.
The exceptions are sub-catchments in the Onepoto Arm catchment and south of Pauatahanui Inlet containing SH1 and/or relatively dense local road networks and which are drained by streams with limited dilution potential. Road traffic risk in these sub-catchments is assessed as ‘highest risk’.
As indicated in section 4.4, these ‘highest risk’ reaches are those which are given the highest CS score, based on exceedance of the upper CCU associated with the 95% ANZECC 2000 concentrations of copper and zinc, irrespective of the RES score. However, further discrimination between these reaches designated as ‘highest’ risk is provided by drilling into the results to obtain the predicted RES scores for these reaches. Of the 36 reaches designated ‘highest’ risk, only one had the highest RES score (15), indicating it falls into the ‘excellent’ MCI condition band. A further reach had an RES score of 10, indicating it falls into the ‘good’ MCI condition band, while the remaining 34 had RES scores of 5, indicating ‘poor-fair’ MCI condition. In other words, the majority of the reaches assessed as ‘highest’ risk are predicted to be in relatively poor ecological condition at the present time.
Notably, sub-catchments through the central part of the Onepoto Arm catchment which are intersected by SH1 are not necessarily assessed as highest risk. Several of these are assessed as lower risk, reflecting the relatively high dilution potential of the Porirua Stream. Risk is higher where either the dilution potential is more limited (in the headwaters) or where the cumulative load of copper and zinc is relatively high (in the lower reaches of the stream).
In contrast to the results for road traffic risk, most sub-catchments containing any urban land use are classified as ‘highest risk’ according to the urban risk factor (figure 5.12). This reflects the fact that, even in sub-catchments containing relatively limited areas of urban impervious surfaces, loads of copper and zinc are high in relation to stream dilution potential. Only a small proportion of sub-catchments containing urban land are assessed as being in lower risk categories. These are sub-catchments on the urban fringe which are occupied by predominantly rural land use.
As with the results for road traffic risk, further discrimination between reaches designated as ‘highest’ urban risk is provided by drilling into the results to obtain the predicted RES scores for these reaches. Of the 103 reaches designated ‘highest’ risk, none had the highest RES score associated with the ‘excellent’ MCI condition band. Ten had a RES score of 10, associated with the ‘good’ MCI condition band, while the remaining 93 had RES scores of 5, indicating ‘poor-fair’ MCI condition. In other words, the majority of the
73

Risk assessment of road stormwater runoff
reaches assessed as ‘highest’ risk are again predicted to be in relatively poor ecological condition at the present time.
The results for the combined risk (figure 5.13) largely reflect the results for the urban risk. In general, in sub-catchments containing no urban land use but where roads are present, combined risk is assessed as falling in the ‘lowest risk’ category. However, where urban land use is present in a sub-catchment, the combined risk is generally assessed as being ‘highest risk’ irrespective of the road traffic risk assessed for that sub-catchment. These 107 ‘highest risk’ reaches are made up of 1, 11 and 95 reaches falling into the ‘excellent’, ‘good’ and ‘poor-fair’ MCI condition bands, respectively.
There are a small number of sub-catchments, for instance one at the eastern end of Pauatahanui Inlet and one in the southern part of the Onepoto Arm catchment (see figure 5.13), where the combined risk is assessed as being higher than either the road traffic risk or urban risk independently, reflecting the potentially cumulative effects of loads from non-road and road-derived sources.
Taken together, the road traffic, urban and combined results show the importance of not only considering road traffic derived contaminants when assessing risk but also contaminants from other urban sources. To consider road traffic derived contaminants in isolation from those derived from other sources has the potential to lead to a marked under-assessment of risks to aquatic environments.
74

5 Case study evaluation
Figure 5.11 Road traffic risk assessment by sub- catchment for extended study area
75

Risk assessment of road stormwater runoff
Figure 5.12 Urban risk assessment by sub- catchment for extended study area
76

5 Case study evaluation
Figure 5.13 Combined risk assessment (road traffic plus urban) by sub- catchment for extended study area
Note: black arrows indicate sub-catchments for which combined risk is assessed as being higher than either road traffic or urban risk individually
77

Risk assessment of road stormwater runoff
5.5 Results and discussion – Pauatahanui Inlet risk assessment
5.5.1 Introduction
As described in section 5.2, the case study was conducted in two stages with the coastal/estuary risk assessment for the Pauatahanui Inlet catchment completed initially and later extended to include the more heavily urbanised catchment of Onepoto Arm.
In the case of Onepoto Arm it was found that the very large urbanised catchment discharging to the southern end (via the Porirua Stream outlet) dominated the zinc and copper contaminant loads for all outlets in both arms of Te Awarua-o-Porirua Harbour catchment. Consequently the results are presented separately with Pauatahanui Inlet in this section and Onepoto in section 5.6. This allows a more nuanced assessment of the risks presented by the wide spatial variation in contaminant load and concentration for the case study area as a whole.
Model sensitivity and validation are discussed in section 5.7.
5.5.2 Contaminant load and sediment metal concentration at outlets
The road traffic, urban and combined zinc loads (g/yr) estimated by the RSS model at the 23 outlet locations for catchments draining into Pauatahanui Inlet are shown in figure 5.14. The corresponding plot for the zinc concentration (mg/kg) in sediment discharged at these locations is given in figure 5.15.
The road traffic, urban and combined copper loads (g/yr) estimated at these outlets are shown in figure 5.16. Figure 5.17 is the corresponding plot for copper concentration in sediment at these locations.
Tables summarising the RSS model estimates of contaminant load (table F.1) and contaminant concentration in sediment (table F.2) at each of the discharge locations to Pauatahanui Inlet are included for reference purposes in appendix F. Table F.1 also provides the total load for all outlets and the percentage contribution for road traffic and urban to the total (combined) load.
General observations from the modelled data are discussed below.
5.5.2.1 Metal loads
The distribution of metal loads from catchments around the inlet (figure 5.14 for zinc and figure 5.16 for copper) reflects the urban/rural land use around the estuary. There is a clear contrast between low metal loads from outlets draining rural catchments along the north-eastern side and those along the southern shoreline which collect runoff from urbanised (mainly residential) catchments.
The three largest contributions to the total metal load to the inlet occur at Brown’s Bay (outlet 3), Duck Creek (outlet 5) and Pauatahanui Inlet stream (outlet 7). For example, these outlets collectively discharge an estimated 102 kg/year or 67% of the total zinc load to the inlet (table F.1). The corresponding figures for copper for these outlets are estimated to be 12.4kg/year and 67% of the total load.
78

5 Case study evaluation
Figure 5.14 Road traffic, urban and combined zinc load (g/yr) by outlet
Figure 5.15 Road traffic, urban and combined zinc concentration in sediment (mg/kg) by outlet
79
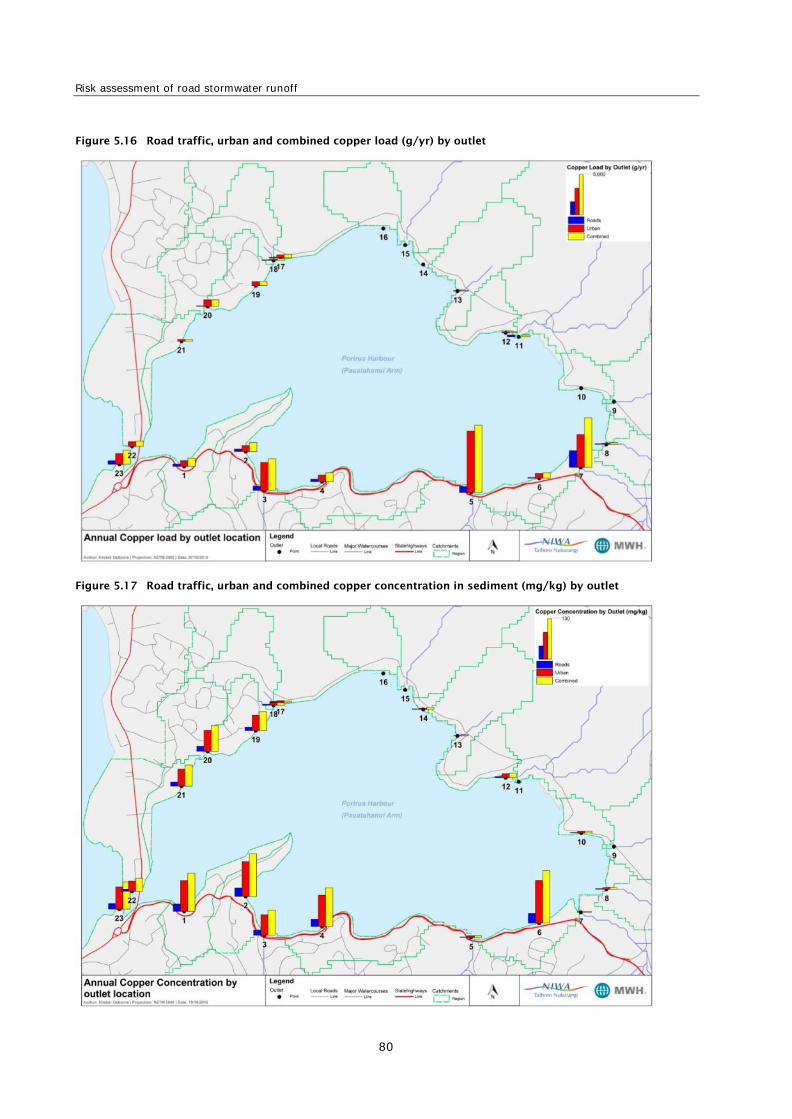
Risk assessment of road stormwater runoff
Figure 5.16 Road traffic, urban and combined copper load (g/yr) by outlet
Figure 5.17 Road traffic, urban and combined copper concentration in sediment (mg/kg) by outlet
80

5 Case study evaluation
5.5.2.2 Relative contribution of road traffic to total (’combined’) load
In urbanised inlet catchments the total (‘combined’) metal load at each outlet is dominated by urban contributions. The road traffic fraction is comparatively small in these built-up areas as illustrated by the following figures for the total annual metal loads for the above three outlets (table F.1):
• Brown’s Bay (outlet 3) – road traffic: 9% zinc and 12% copper
• Duck Creek (outlet 5) - road traffic: 6% zinc and 9% copper
• Pauatahanui Inlet stream (outlet 7) – road traffic: 25% zinc and 33% copper.
Six outlets around the Inlet (numbers 9, 10, 11, 14, 15 and 16) are rural and have no urban load (table F.1). For each of these outlets the traffic load contributes all the metal load but the lightly trafficked nature of their catchments means the actual load discharged is small. The total zinc and total copper loads from these six outlets contribute only 0.8% and 1.1%, respectively, of the annual load to the inlet.
The relative contribution of metal loads from local roads and state highways is further discussed in section 5.8 dealing with use of the model to screen priority areas of the road network.
5.5.2.3 Sediment metal concentrations
The distribution of sediment metal concentrations from catchments around the inlet (figure 5.15 for zinc and figure 5.17 for copper) may be compared with their corresponding contaminant load profiles (figure 5.14 for zinc; figure 5.16 for copper). The profiles are similar for the rural outlets to the north-east of the Inlet (both have low loads and low concentrations) but are markedly different for the urban outlets along the western and southern shoreline.
Outlets which service high load/small area catchments (eg those numbered 1, 2, 4 and 6) have relatively high sediment metal concentrations at the point of discharge on the shoreline. The ‘combined’ concentrations for these outlets range from 624 to 884mg/kg (for zinc) and from 77 to 106mg/kg (for copper).
Outlets with a high contaminant load and high sediment load (large catchment) have a large measure of dilution and generate relatively low sediment metal concentrations at the discharge (eg for outlet 5 at Duck Creek zinc load ~48kg/yr, zinc sediment concentration 35mg/kg).
The main discharge point to Browns Bay (outlet 3) is unusual with a high contaminant load but comparatively low sediment load that still generates significant sediment metal concentrations at the outlet (zinc 427mg/kg and copper 51mg/kg).
Note that the modelled sediment metal concentrations at the discharge points to the Inlet are conservative as the RSS model does not factor in load reduction from stormwater treatment devices (eg catchpits) in the road/stormwater networks. The load removal efficiency of these devices varies according to their type and maintenance regime. In addition the efficiency drops as sediment builds up in these devices.
Timperley et al (2005) estimated the total suspended solids retention efficiency for roadside catchpits to be approximately 20%. This provides the typical reduction that is achievable for the device, assuming it is well maintained and correctly sized for the expected throughput. However poorly maintained units may offer much lower sediment removal and in a worst case may provide no effective load attenuation.
5.5.3 Assigning receiving environment sensitivity score
Section 4.5 describes the method for risk assessment of zinc and copper contaminants associated with sediment in runoff discharging to coasts and estuaries. In assigning a RES score (refer to table 4.2), the
81

Risk assessment of road stormwater runoff
assessment determines whether the discharge is to a high, moderate or low depositional environment based on the nature of the receiving water body, published data and/or expert judgement.
In the case of Pauatahanui Inlet, the whole estuary is an area of conservation value under GWRC’s Regional Coastal Plan (GWRC 2000), with the saltmarsh/wetland at the east end administered by the Department of Conservation. Neither the coastal plan nor the Proposed Natural Resources Plan (GWRC 2015) identify any spatial variations in sensitivity along the inlet coastline.
However the inlet has been extensively studied and there is published data available on sedimentation rates in the estuary (Gibb 2011). Subsequent sediment plate monitoring has also been completed in Te Awarua-o-Porirua Harbour (Stevens and Robertson 2014).
The RES score for sediment discharge locations to the estuary was determined by reference to the seven sedimentation zones for the inlet (Gibb 2011), as reproduced in figure 5.18 and defined in table 5.1. The zones were developed on the basis of existing bathymetric data and the proximity of each zone to major sediment supply sources from streams draining the surrounding catchments.
Figure 5.18 Location of seven sedimentation zones for Pauatahanui Inlet
Source: Gibb (2011)
The seven sedimentation zones were then grouped into two categories (high and moderately depositional) based on published sub-tidal deposition/sedimentation rates and a nominal RES score allocated to each (table 5.1).
Based on their relationship to the sedimentation zones, a RES score (high depositional = 5; moderate depositional = 3; low depositional / high energy = 0) was allocated to each of the 23 discharge points around the inlet (table 5.2 and figure 5.14). For outlets 7–10 the nominal RES score of 3 was increased to 5 to reflect the high depositional wetland area at the eastern end of the inlet. The seaward discharge locations at the mouth of the inlet (numbers 22 and 23) were allocated a RES score of zero as these represent a high-energy flushed environment.
82

5 Case study evaluation
Table 5.1 Allocation of RES score to sedimentation zones in Pauatahanui Inlet
Zone Definition a) Depositional rate
(mm/yr)(a)
Sedimentation rate
(mm/yr)(b)
Depositional risk
rating(c)
RES score c)
1 Flood tide delta 7.0 – Moderate 3
2 Central mud basin 10.7 11.0 (Bradeys Bay) Moderate–high 5
3 Kakaho tidal flats 7.9 6.6 (Kakaho) Moderate 3
4 Horokiri tidal flats 8.1 26.4 (Horokiri) Moderate 3
5 Pauatahanui tidal flats 7.9 8.0 (Duck Creek) Moderate 3
6 Browns Bay tidal flats 14.2 – High 5
7 Browns Bay mud basin 15.2 9.2 (Browns Bay) High 5
– Inlet mouth – – Low 0 (a) based on tables 1 and 3 (Gibb 2011); rates determined from difference in sounding surveys in 1974 and 2009, and other spot soundings (b) taken from Stevens and Robertson (2014, table 2); rates measured by sedimentation plates in period 2013–14 for sub-tidal sediment (c) this study – qualitative rating based primarily on the depositional rates in the table as the sedimentation rates were reported to be preliminary.
Table 5.2 Allocation of RES score to stormwater outlet discharge locations in Pauatahanui Inlet
Outlet number
Depositional zone
Depositional risk rating
RES score Comment
1 1 Moderate 3 –
2 6 High 5 Browns Bay – high depositional
3 6 High 5 Browns Bay – high depositional
4 6 High 5 Browns Bay – high depositional
5 5 Moderate 3 –
6 5 Moderate 3 –
7 5 High 5 Wetland – high depositional
8 5 High 5 Wetland – high depositional
9 5 High 5 Wetland – high depositional
10 5 High 5 Wetland – high depositional
11 4 Moderate 3 –
12 4 Moderate 3 –
13 3 Moderate 3 –
14 3 Moderate 3 –
15 3 Moderate 3 –
16 3 Moderate 3 –
17 3 Moderate 3 –
18 3 Moderate 3 –
19 3 Moderate 3 –
20 1 Moderate 3 –
21 1 Moderate 3 –
22 – Low 0 High energy flushing environment
23 – Low 0 High energy flushing environment
83

Risk assessment of road stormwater runoff
5.5.4 Risk assessment
The results of the risk assessment for the coastal/estuarine receiving environments in the case study area from road traffic, urban and combined (road traffic + urban) sources are shown in figure 5.19. In each case the risk to the estuary reflects the potential cumulative effects of metal (zinc and copper) in the sediment at the point of discharge to the Inlet (refer to section 4.6 and appendix D).
The road traffic risk shows spatial variations in risk associated with traffic-derived contaminants. The urban risk shows the spatial variation in risk associated with non-road derived contaminants. The combined risk is the overall effect from both contaminant sources. Note that while some of the ‘urban’ load may be conveyed in road runoff, much of it will be conveyed in the stormwater network without ever entering a road corridor (eg runoff containing zinc from roofs in a residential subdivision that discharges to a drain and is piped directly to a stream).
Figure 5.19 Results of estuary risk assessment in sediment discharged to Pauatahanui Inlet
The risk profile for metal in sediment discharged to Pauatahanui Inlet (figure 5.19) reflects the risk level determined by the combination of contaminant concentration and receiving environment sensitivity for the individual outlet locations.
Road traffic, and urban and combined risk level are shown for each outlet using the qualitative grading (ie lowest, lower, medium, higher and highest) as colour-coded in the figure legend. The qualitative grading represents the limitation of the RSS model as providing a relative rather than absolute risk assessment.
Figure 5.19 shows that Browns Bay (represented by outlets 2, 3 and 4) has the highest risk profile in the inlet for metal (zinc and copper) in sediment discharged along the shoreline. This finding accords with the combination of high load/high concentration of these metals discharged to the bay which is partly
84

5 Case study evaluation
enclosed and highly depositional. While the urban contribution (‘highest’ risk level) drives the overall risk score at Browns Bay, road traffic makes a significant contribution (‘lower’ to ‘medium’). This model outcome is in accordance with results from sediment monitoring studies in the area (refer to section 5.7.3 on model validation).
5.6 Results and discussion – Onepoto Arm risk assessment
5.6.1 Introduction
Results presented below are for Onepoto Arm and its contributing catchments (refer to section 5.2.3 for a description of the case study area).
5.6.2 Contaminant load and sediment metal concentration at outlets
The road traffic, urban and combined zinc loads (g/yr) estimated by the RSS model at the 13 outlet locations for catchments draining into Onepoto Arm and the Titahi Bay coastline are shown in figure 5.20. The corresponding plot for the zinc concentration (mg/kg) in sediment discharged at these locations is given in figure 5.21.
The road traffic, urban and combined copper loads (g/yr) estimated at these outlets are shown in figure 5.22. Figure 5.23 gives the corresponding plot for copper concentration in sediment at these locations.
Tables summarising the RSS model estimates of contaminant load (table F.3) and contaminant concentration (table F.4) in sediment at each of the discharge locations are included for reference purposes in appendix F. Table F.3 also provides the total load for all outlets and the percentage contribution for road traffic and urban to the total (combined) load.
General observations made from the modelled data for Onepoto Arm are discussed below. Note that ‘outlets’ represent the discharge from the REC catchment delineation and will include loads from stormwater networks that have outfalls within these catchment (eg the stormwater network that drains to the Semple Street outfall in Porirua City lies within REC catchments that drain to outlets 27 and 28).
5.6.2.1 Metal loads
The distribution of metal loads from catchments around Onepoto Arm (figure 5.20 for zinc and figure 5.22 for copper) reflects the urbanised land use and size of catchments discharging to each outlet around the estuary. The low loads from the comparatively small sub-catchments draining the mainly residential western and eastern flanks of Onepoto Arm, and those around Titahi Bay contrast markedly with the singularly major load at outlet 27 (approximately 81% of the Onepoto catchment) representing the discharge from Porirua stream and its tributaries. This also includes the bulk of the Semple Street stormwater outfall situated about 200m along the coast to the west that drains much of the Porirua CBD. This pattern confirms findings from intertidal sediment sampling that the Semple Street stormwater outfall and the Porirua Stream are the primary sources of contaminants entering the southern end of Onepoto Arm (Sorenson and Milne 2009).
85
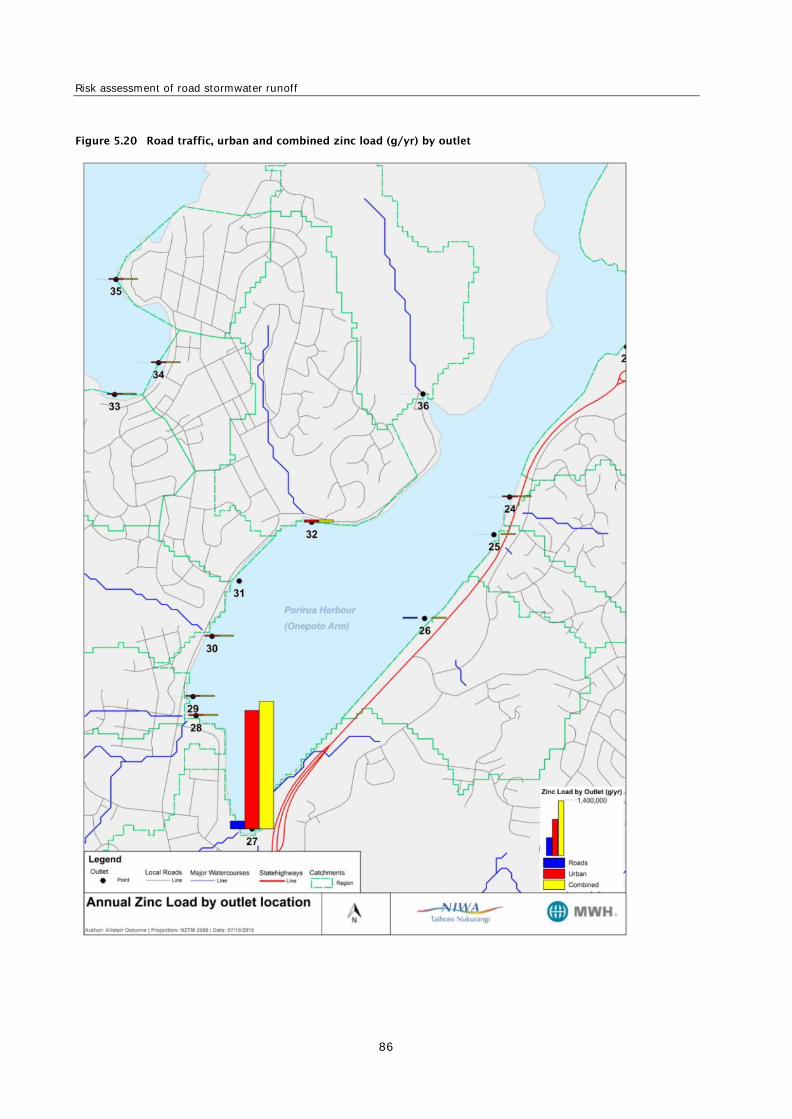
Risk assessment of road stormwater runoff
Figure 5.20 Road traffic, urban and combined zinc load (g/yr) by outlet
86

5 Case study evaluation
Figure 5.21 Road traffic, urban and combined zinc concentration in sediment (mg/kg) by outlet
87

Risk assessment of road stormwater runoff
Figure 5.22 Road traffic, urban and combined copper load (g/yr) by outlet
88
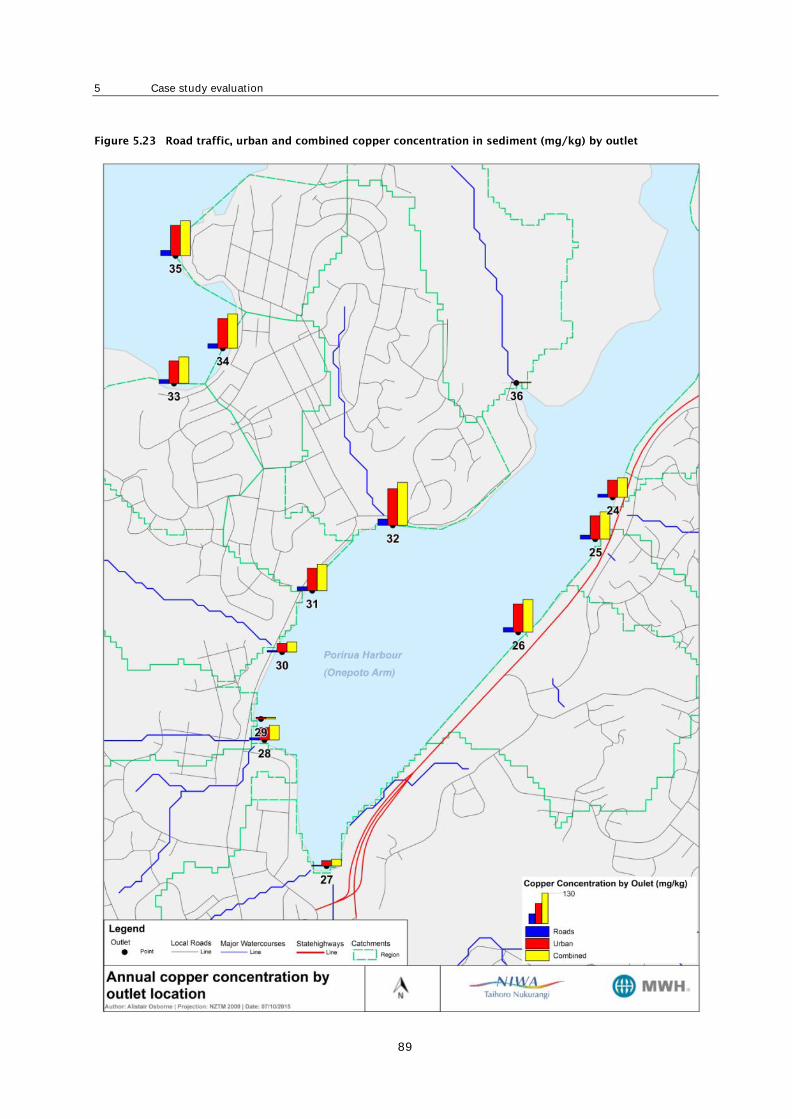
5 Case study evaluation
Figure 5.23 Road traffic, urban and combined copper concentration in sediment (mg/kg) by outlet
89
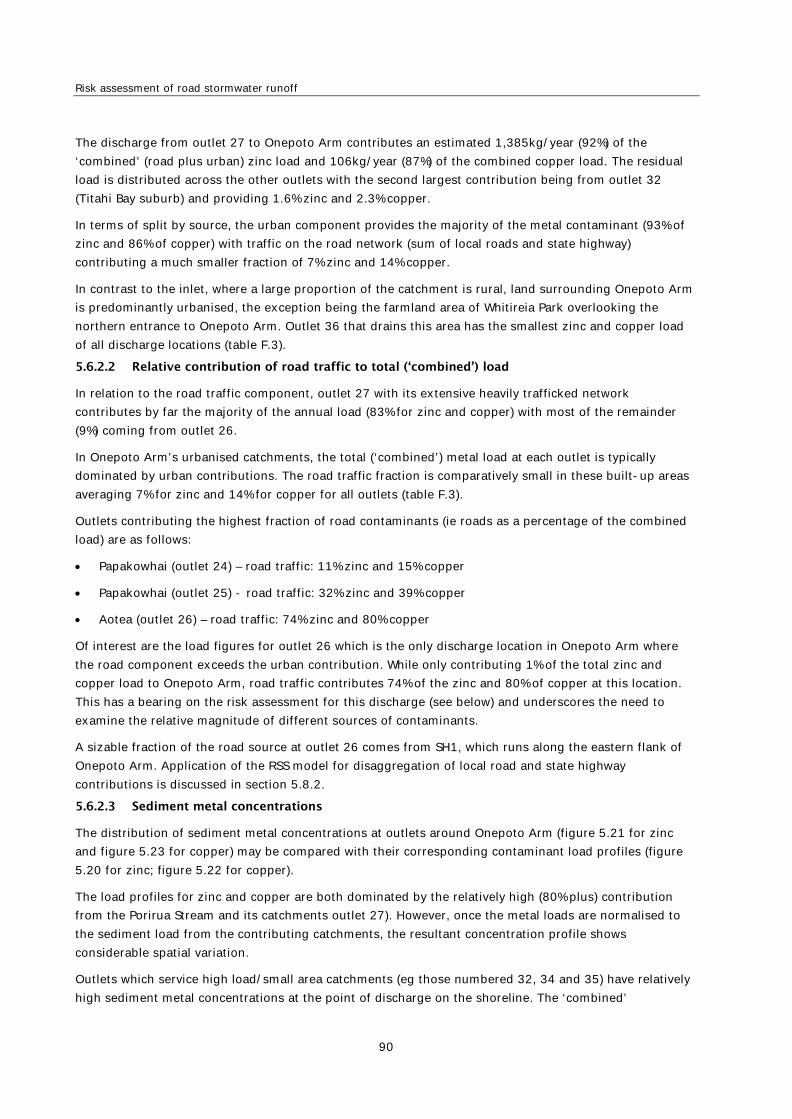
Risk assessment of road stormwater runoff
The discharge from outlet 27 to Onepoto Arm contributes an estimated 1,385kg/year (92%) of the ‘combined’ (road plus urban) zinc load and 106kg/year (87%) of the combined copper load. The residual load is distributed across the other outlets with the second largest contribution being from outlet 32 (Titahi Bay suburb) and providing 1.6% zinc and 2.3% copper.
In terms of split by source, the urban component provides the majority of the metal contaminant (93% of zinc and 86% of copper) with traffic on the road network (sum of local roads and state highway) contributing a much smaller fraction of 7% zinc and 14% copper.
In contrast to the inlet, where a large proportion of the catchment is rural, land surrounding Onepoto Arm is predominantly urbanised, the exception being the farmland area of Whitireia Park overlooking the northern entrance to Onepoto Arm. Outlet 36 that drains this area has the smallest zinc and copper load of all discharge locations (table F.3).
5.6.2.2 Relative contribution of road traffic to total (‘combined’) load
In relation to the road traffic component, outlet 27 with its extensive heavily trafficked network contributes by far the majority of the annual load (83% for zinc and copper) with most of the remainder (9%) coming from outlet 26.
In Onepoto Arm’s urbanised catchments, the total (‘combined’) metal load at each outlet is typically dominated by urban contributions. The road traffic fraction is comparatively small in these built-up areas averaging 7% for zinc and 14% for copper for all outlets (table F.3).
Outlets contributing the highest fraction of road contaminants (ie roads as a percentage of the combined load) are as follows:
• Papakowhai (outlet 24) – road traffic: 11% zinc and 15% copper
• Papakowhai (outlet 25) - road traffic: 32% zinc and 39% copper
• Aotea (outlet 26) – road traffic: 74% zinc and 80% copper
Of interest are the load figures for outlet 26 which is the only discharge location in Onepoto Arm where the road component exceeds the urban contribution. While only contributing 1% of the total zinc and copper load to Onepoto Arm, road traffic contributes 74% of the zinc and 80% of copper at this location. This has a bearing on the risk assessment for this discharge (see below) and underscores the need to examine the relative magnitude of different sources of contaminants.
A sizable fraction of the road source at outlet 26 comes from SH1, which runs along the eastern flank of Onepoto Arm. Application of the RSS model for disaggregation of local road and state highway contributions is discussed in section 5.8.2.
5.6.2.3 Sediment metal concentrations
The distribution of sediment metal concentrations at outlets around Onepoto Arm (figure 5.21 for zinc and figure 5.23 for copper) may be compared with their corresponding contaminant load profiles (figure 5.20 for zinc; figure 5.22 for copper).
The load profiles for zinc and copper are both dominated by the relatively high (80% plus) contribution from the Porirua Stream and its catchments outlet 27). However, once the metal loads are normalised to the sediment load from the contributing catchments, the resultant concentration profile shows considerable spatial variation.
Outlets which service high load/small area catchments (eg those numbered 32, 34 and 35) have relatively high sediment metal concentrations at the point of discharge on the shoreline. The ‘combined’
90

5 Case study evaluation
concentrations for these outlets range from 847 to 1058mg/kg (for zinc) and from 100 to 125mg/kg (for copper).
Outlets with a relatively high contaminant load and high sediment load (large catchment) have a large measure of dilution and generate relatively low sediment metal concentrations at the discharge (eg outlet 27 with 262mg Zn/kg and 20mg Cu/kg). The standout example is outlet 27 which is ranked 1st on size of load but only 10th (for zinc) and 11th (for copper) in terms of concentration.
Note that the modelled sediment metal concentrations at the discharge points to Onepoto Arm are conservative as the RSS model does not factor in load reduction from stormwater treatment devices (eg catchpits) in the road/stormwater networks.
5.6.3 Assigning receiving environment sensitivity score Assigning a RES score to a specific discharge location in an estuary requires an assessment of whether the discharge is to a high, moderate or low depositional environment based on the nature of the receiving water body, published data and/or expert judgement (refer to section 4.5 and table 4.2).
As for the inlet (discussed in section 5.4), published data is available on sedimentation rates in the Onepoto Arm (Gibb 2011) and recent sediment plate monitoring has also included this part of Te Awarua-o-Porirua Harbour (Stevens and Robertson 2014).
The RES scores for sediment discharge locations in Onepoto Arm were determined by reference to the four sedimentation zones for this estuary (Gibb 2011). The zones are reproduced in figure 5.24 and defined in table 5.3. They were developed on the basis of existing bathymetric data and the proximity of each zone to major sediment supply sources from streams draining the surrounding catchments.
Figure 5.24 Location of four sedimentation zones for Onepoto Arm
Source: Gibb (2011)
91

Risk assessment of road stormwater runoff
The four sedimentation zones were given a depositional risk rating (low, moderate or high) based on published sub-tidal deposition/sedimentation rates and a nominal RES score allocated to each (table 5.3).
Table 5.3 Allocation of RES score to sedimentation zones in Onepoto Arm
Zone Definition(a) Depositional rate
(mm/yr)(a)
Sedimentation rate
(mm/yr)(b)
Depositional risk
rating(c)
RES score (c)
1 Flood tide delta 5.7 -8.0 (Papakowhai) Moderate 3
2 Central mud basin 7.8 -6.0 (Onepoto) Moderate 3
3 Porirua tidal flats 3.4 0 (Titahi) Low to Moderate 3
4 Western tidal flats 6.4 0 (Titahi) Moderate 3
– Titahi Bay area – – Low 0 (a) based on tables 2 and 4 (Gibb 2011); rates determined from difference in sounding surveys in 1974 and 2009, and other spot soundings (b) taken from table 2 (Stevens and Robertson 2014); rates measured by sedimentation plates in period 2013–14 for sub-tidal sediment (c) this study using data from Gibb (2011).
Gibb (2011) found highest depositional rates in zone 2 (central mud basin) and lowest in zone 3 (Porirua tidal flats), although the author reported that the latter zone is subject to the highest uncertainty due to inadequate coverage (30%) in the 1974 survey. By comparison, Stevens and Robertson (2014) using sub-tidal plate monitoring found an overall mean annual sedimentation rate (relative to baseline) of -4.2mm/yr in Onepoto Arm indicating sediment loss. The authors compared this figure with an estimated overall sedimentation rate for the 1974–2009 period of +5.7mm/yr in Onepoto Arm (Gibb and Cox 2009). Stevens and Robertson (2014) reported that the sediment plate monitoring results for 2014 were preliminary and the negative rates might be influenced by redistribution of sediment due to strong tidal flushing in some sites. Due to this uncertainty, the depositional rates provided by Gibb (2011) in table 5.5 were used to derive the RES score for the purposes of the current study.
Based on their relationship to the sedimentation zones, a RES score (high depositional = 5; moderate depositional = 3; low depositional/high energy = 0) was allocated to each of the 13 outlets (numbered 24–36) around Onepoto Arm and in the coastal area of Titahi Bay (table 5.4 and figure 5.20). The three coastal discharge locations in the vicinity of Titahi Bay (outlet numbers 33–35) were allocated a RES score of zero as these represent a high energy coastal (marine) environment.
Table 5.4 Allocation of RES score to sediment outlet discharge locations in Onepoto Arm (including Titahi
Bay)
Outlet
number
Depositional
zone
Depositional risk
rating
RES score Comment
24 1 Moderate 3 –
25 1 Moderate 3 –
26 2 Moderate 3 –
27 3 Low to Moderate 3 Assume moderate – Porirua stream outlet
28 4 Moderate 3 –
29 4 Moderate 3 –
30 4 Moderate 3 –
31 4 Moderate 3 –
92
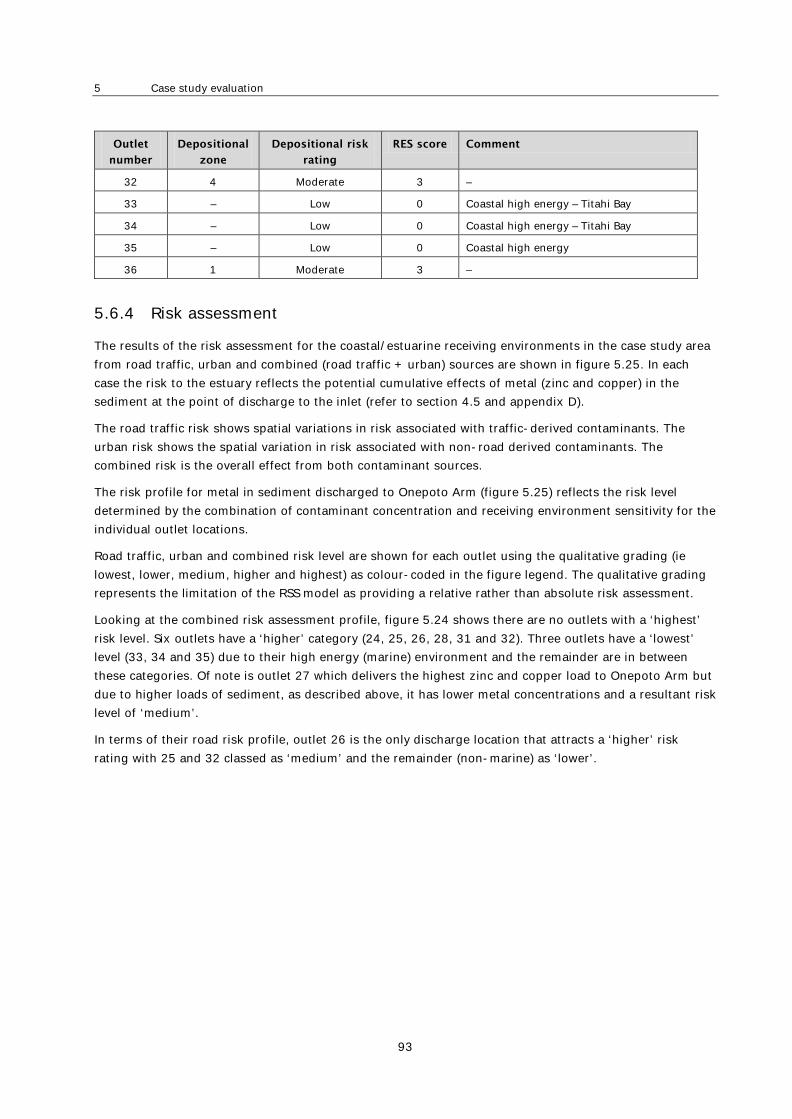
5 Case study evaluation
Outlet
number
Depositional
zone
Depositional risk
rating
RES score Comment
32 4 Moderate 3 –
33 – Low 0 Coastal high energy – Titahi Bay
34 – Low 0 Coastal high energy – Titahi Bay
35 – Low 0 Coastal high energy
36 1 Moderate 3 –
5.6.4 Risk assessment
The results of the risk assessment for the coastal/estuarine receiving environments in the case study area from road traffic, urban and combined (road traffic + urban) sources are shown in figure 5.25. In each case the risk to the estuary reflects the potential cumulative effects of metal (zinc and copper) in the sediment at the point of discharge to the inlet (refer to section 4.5 and appendix D).
The road traffic risk shows spatial variations in risk associated with traffic-derived contaminants. The urban risk shows the spatial variation in risk associated with non-road derived contaminants. The combined risk is the overall effect from both contaminant sources.
The risk profile for metal in sediment discharged to Onepoto Arm (figure 5.25) reflects the risk level determined by the combination of contaminant concentration and receiving environment sensitivity for the individual outlet locations.
Road traffic, urban and combined risk level are shown for each outlet using the qualitative grading (ie lowest, lower, medium, higher and highest) as colour-coded in the figure legend. The qualitative grading represents the limitation of the RSS model as providing a relative rather than absolute risk assessment.
Looking at the combined risk assessment profile, figure 5.24 shows there are no outlets with a ‘highest’ risk level. Six outlets have a ‘higher’ category (24, 25, 26, 28, 31 and 32). Three outlets have a ‘lowest’ level (33, 34 and 35) due to their high energy (marine) environment and the remainder are in between these categories. Of note is outlet 27 which delivers the highest zinc and copper load to Onepoto Arm but due to higher loads of sediment, as described above, it has lower metal concentrations and a resultant risk level of ‘medium’.
In terms of their road risk profile, outlet 26 is the only discharge location that attracts a ‘higher’ risk rating with 25 and 32 classed as ‘medium’ and the remainder (non-marine) as ‘lower’.
93

Risk assessment of road stormwater runoff
Figure 5.25 Results of estuary risk assessment in sediment discharged to Onepoto Arm
94

5 Case study evaluation
5.7 Sensitivity analysis and RSS model validation 5.7.1 Introduction
The previous sections describe the performance of the RSS model to discriminate different levels of risk as a function of differences in the road network, land use and the characteristics of receiving environments. Two further exercises have been conducted to contribute to the assessment of performance and, in particular, to investigate the reliability of the risk assessment in the face of uncertainty in model inputs.
The first of these was a sensitivity analysis (section 5.7.2). This involved assessing the influence of variations in contaminant loads on the results of the screening assessment. The objective of this exercise was to see the extent to which errors or uncertainty in model inputs influencing the estimation of copper and zinc loads affect the assessed level of risk.
The second exercise involved validating the method by comparing modelled concentrations of copper and zinc with observations from water and sediment quality monitoring programmes in Te Awarua-o-Porirua Harbour and its catchment (section 5.7.3). While not designed as a method for conducting absolute risk assessments, it was still considered important to investigate the extent to which the model results were consistent with observations in a relative sense. In other words, this involved checking that where the model was predicting relatively high or low copper and zinc concentrations, respectively, this was consistent with observations. It also involved comparing that relativity between loads and concentrations of copper and zinc were consistent with observations.
A final section discusses how the output of the risk assessment of coasts/estuaries may be interpreted in terms of both localised (near-field) effects at the point of stormwater discharge and more distant (far-field) effects) caused by secondary reworking/dispersion of suspended sediment.
5.7.2 Sensitivity analysis 5.7.2.1 Design and rationale
The sensitivity analysis aimed to investigate the influence of variations in both road traffic-derived and urban loads of copper and zinc on the results of the risk assessment.
The road traffic-derived loads of copper and zinc used in the case study assessment were considered to be conservative in that:
• VEFs developed from road runoff samples collected from roads with ‘interrupted’ traffic conditions were used in estimating loads for ‘free-flowing’ roads, reflecting the absence of New Zealand field data for the latter category of road
• no allowance was made for the influence of any stormwater treatment devices.
Reflecting on the possibility that road traffic-derived loads of copper and zinc might therefore be overestimates, the first part of the sensitivity analysis considered the influence of a reduction in road loads on the results of the risk assessment.
Analysis of the VEFs estimated for sampling sites included in previous monitoring studies for interrupted and congested conditions (Moores et al 2009; 2010; 2012) suggested that the VEF for free-flowing conditions might be around 30% lower than that used in the case study assessment. Reflecting that not all roads across the study area are free-flowing, a more moderate reduction in the total copper and zinc loads of 15% was adopted for investigation in the sensitivity analysis.
95

Risk assessment of road stormwater runoff
It should be noted that, while grounded in analysis of the VEFs, this difference could represent any area of uncertainty in the estimation of road traffic-derived copper and zinc loads, including the possible influence of stormwater treatment. In order to mirror the investigation of sensitivity to a lower copper and zinc load, the analysis also considered the influence of increasing the road traffic-derived copper and zinc loads by 15%.
The second part of the sensitivity analysis investigated the influence of uncertainty in the estimation of urban contaminant loads, with a focus on zinc in areas of residential land use. As described in section 4.4.2 and appendix B, the estimation of zinc loads for areas of urban land uses relies on zinc yields and land cover breakdowns developed for Auckland Council’s CLM. In the case study application of the risk assessment described above, a location-specific zinc yield was used for residential areas which assumed an absence of high zinc-yielding roofing materials. In order to examine the influence of this assumption on the results of the risk assessment, the model was re-run using the ‘default’ zinc yield for residential areas.
5.7.2.2 Results
Table 5.5 compares the results of sensitivity analysis with the results of the case study risk assessment for streams described in section 5.3. The results indicate that the method is relativity insensitive to variations in contaminant loads.
Table 5.5 Results of sensitivity analysis showing the proportion of REC stream reaches in each risk class
(Note: results of the sensitivity analysis which differ from the case study assessment are shaded; RT = road
traffic risk; U = urban risk; C = combined risk)
Case study risk
assessment
15% reduction in
road traffic loads of
zinc and copper
15% increase in road
traffic loads of zinc
and copper
Residential zinc yield
based on CLM default
land cover
breakdown
Proportion of stream reaches in each risk level class (%)
Risk
level
RT U C RT U C RT U C RT U C
No risk(a) 40.5 59.7 39.7 40.5 59.7 39.7 40.5 59.7 39.7 40.5 59.7 39.7
Lowest 42.2 9.6 28.5 42.7 9.6 28.5 41.6 9.6 28.5 42.2 8.8 27.9
Lower 7.4 1.9 1.9 9.6 1.9 1.9 4.7 1.9 1.9 7.4 0.5 1.1
Medium 0.0 0.3 0.3 0.0 0.3 0.3 0.0 0.3 0.3 0.0 0.5 0.0
Higher 0.0 0.3 0.3 0.0 0.3 0.3 0.0 0.3 0.3 0.0 0.0 0.0
Highest 9.9 28.2 29.3 7.1 28.2 29.3 13.2 28.2 29.3 9.9 30.4 31.2 (a) Sub-catchments with no roads and/or urban land use (including in contributing upstream sub-catchments)
The results of a 15% reduction and 15% increase in road traffic-derived copper and zinc loads include an approximate 3% reduction and 3% increase, respectively, in the proportion of stream reaches assessed as ‘highest’ risk, based on road traffic-related risk alone. For the most part, the decrease or increase in the number of highest risk stream reaches corresponds with an equivalent increase or decrease in the number of ‘lower’ risk stream reaches.
In contrast to the results for the road traffic-related risk, a 15% reduction or increase in road traffic-derived copper and zinc loads has no influence on the combined risk assessment, with the number of stream reaches in each risk class identical to those resulting from the case study risk assessment. This
96
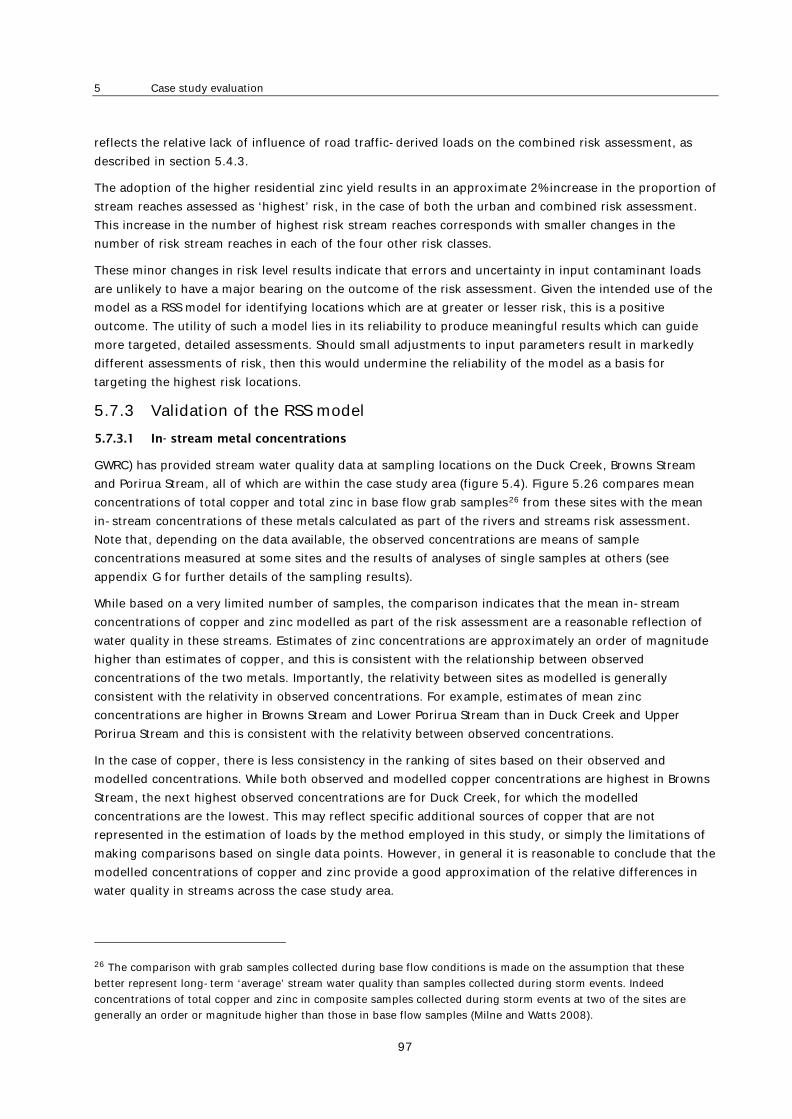
5 Case study evaluation
reflects the relative lack of influence of road traffic-derived loads on the combined risk assessment, as described in section 5.4.3.
The adoption of the higher residential zinc yield results in an approximate 2% increase in the proportion of stream reaches assessed as ‘highest’ risk, in the case of both the urban and combined risk assessment. This increase in the number of highest risk stream reaches corresponds with smaller changes in the number of risk stream reaches in each of the four other risk classes.
These minor changes in risk level results indicate that errors and uncertainty in input contaminant loads are unlikely to have a major bearing on the outcome of the risk assessment. Given the intended use of the model as a RSS model for identifying locations which are at greater or lesser risk, this is a positive outcome. The utility of such a model lies in its reliability to produce meaningful results which can guide more targeted, detailed assessments. Should small adjustments to input parameters result in markedly different assessments of risk, then this would undermine the reliability of the model as a basis for targeting the highest risk locations.
5.7.3 Validation of the RSS model 5.7.3.1 In- stream metal concentrations
GWRC) has provided stream water quality data at sampling locations on the Duck Creek, Browns Stream and Porirua Stream, all of which are within the case study area (figure 5.4). Figure 5.26 compares mean concentrations of total copper and total zinc in base flow grab samples26 from these sites with the mean in-stream concentrations of these metals calculated as part of the rivers and streams risk assessment. Note that, depending on the data available, the observed concentrations are means of sample concentrations measured at some sites and the results of analyses of single samples at others (see appendix G for further details of the sampling results).
While based on a very limited number of samples, the comparison indicates that the mean in-stream concentrations of copper and zinc modelled as part of the risk assessment are a reasonable reflection of water quality in these streams. Estimates of zinc concentrations are approximately an order of magnitude higher than estimates of copper, and this is consistent with the relationship between observed concentrations of the two metals. Importantly, the relativity between sites as modelled is generally consistent with the relativity in observed concentrations. For example, estimates of mean zinc concentrations are higher in Browns Stream and Lower Porirua Stream than in Duck Creek and Upper Porirua Stream and this is consistent with the relativity between observed concentrations.
In the case of copper, there is less consistency in the ranking of sites based on their observed and modelled concentrations. While both observed and modelled copper concentrations are highest in Browns Stream, the next highest observed concentrations are for Duck Creek, for which the modelled concentrations are the lowest. This may reflect specific additional sources of copper that are not represented in the estimation of loads by the method employed in this study, or simply the limitations of making comparisons based on single data points. However, in general it is reasonable to conclude that the modelled concentrations of copper and zinc provide a good approximation of the relative differences in water quality in streams across the case study area.
26 The comparison with grab samples collected during base flow conditions is made on the assumption that these better represent long-term ‘average’ stream water quality than samples collected during storm events. Indeed concentrations of total copper and zinc in composite samples collected during storm events at two of the sites are generally an order or magnitude higher than those in base flow samples (Milne and Watts 2008).
97
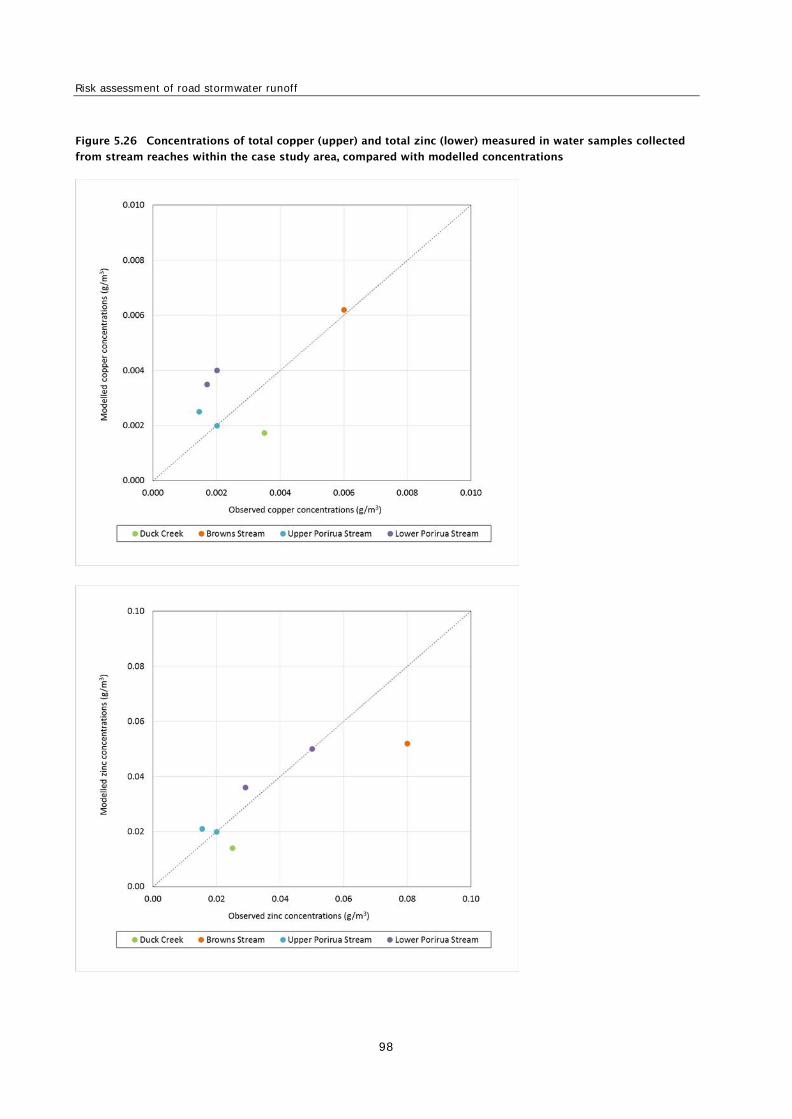
Risk assessment of road stormwater runoff
Figure 5.26 Concentrations of total copper (upper) and total zinc (lower) measured in water samples collected
from stream reaches within the case study area, compared with modelled concentrations
98

5 Case study evaluation
5.7.3.2 Sediment metal concentrations
Te Awarua-o-Porirua Harbour has been the subject of a large number of sediment sampling studies (see Blaschke et al 2010 for a review). Sections 5.7.3.3 and 5.7.3.4 look at a selection of intertidal and sub-tidal sampling results for sediment metal concentrations (zinc and copper) from these field investigations for comparison with modelled result from the study.
5.7.3.3 Intertidal sediment sampling
GWRC conducted a targeted sediment quality assessment at selected intertidal locations in Te Awarua-o-Porirua Harbour in 2009 (Sorenson and Milne 2009). More recent intertidal (and sub-tidal) sediment surveys have been completed in connection with the Transmission Gully Motorway (see, for example, Boffa Miskell 2011) and by GWRC as part of an ongoing set of fine scale monitoring surveys (see Robertson and Stevens 2015).
Table 5.6 compares mean concentrations of total copper and total zinc in sediment samples measured by Sorenson and Milne (2009) at intertidal sites in the Harbour with mean sediment concentrations of these metals (road traffic plus urban sources) estimated by the RSS model at the nearest modelled outlet (point of discharge) to the estuary.
Table 5.6 Concentrations of total copper and total zinc measured in intertidal sediment samples collected
from Pauatahanui Inlet and Onepoto Arm compared with modelled concentrations at nearest outlets to estuary
GWRC sampling site(b)
Nearest
outlet no.
(this study)
Copper (mg/kg) Zinc (mg/kg)
Observed Modelled(a) Observed Modelled(a)
Pauatahanui Inlet
BB-A to BB-C (Browns Bay) 3 2.7–11 50.8 44–140 427
DC-A and DC-B (Duck Creek mouth)
5 4.8–5.6 4.1 54–59 35.1
Onepoto Arm
OP-A and OP-B (Onepoto Stream mouth)
32 7.4–15 125 82–140 1,058
POR-A to POR-D (Porirua Stream mouth)
27 8.8–19 20.1 140–220 262
(a) Sediment concentrations calculated from combined road and urban loads of copper (zinc) divided by the total sediment load from the contributing catchments to the discharge point on the inlet (b) Samples collected in February 2009; fraction analysed <2mm; source: Sorenson and Milne (2009)
The two sets of data are not strictly comparable as they represent metals in sediment discharged at the outlet before reworking (modelled results) with metal concentrations in intertidal sediments which will have been subject to local wind and tidal effects, especially dispersion of fine suspended particulate which contain the larger proportion of these metals. However they provide the basis for a coarse comparison of contaminant levels in stormwater from the point of delivery to their local accumulation in sediment.
For the inlet, the observed concentrations at the two intertidal sites are reasonably similar but the modelled concentrations are much higher (by at least an order of magnitude) except at Duck Creek (DC-A and DC-B) where similar concentrations are found. A similar pattern was found for the Onepoto sites where modelled and observed concentrations were similar for the Porirua Stream mouth but modelled results were an order of magnitude higher for the Onepoto Stream mouth. These results suggest that the modelled metal concentrations at the outlets to the estuary are subject to localised and varied effects of sediment transport, reworking and dilution in the intertidal zone.
99

Risk assessment of road stormwater runoff
5.7.3.4 Sub- tidal sediment sampling
GWRC has carried out surveys of sub-tidal sediment quality within Te Awarua-o-Porirua Harbour in 2004, 2005, 2008 and 2010 (see Oliver and Conwell 2014 for a review). Sampling locations within the inlet (figure 5.27) comprise two in Onepoto Arm (POR1, POR2) and three in the Inlet within Browns Bay (PAH1), close to the outlet of Duck Creek (PAH2) and near Camborne (PAH3).
Figure 5.27 Te Awarua- o- Porirua Harbour showing the five sub- tidal sampling locations
Source: Milne et al (2009)
Table 5.7 compares mean concentrations of total copper and total zinc in sediment samples measured by Milne et al (2009) at the five sub-tidal sites in the Harbour with mean sediment concentrations of these metals (road traffic plus urban sources) estimated by the RSS model at the nearest modelled outlet to the estuary.
As for the intertidal results, while the two sets of data are not strictly comparable as they represent metals in sediment discharged at the outlet before reworking (modelled results) with metal concentrations in sub-tidal sediments, they provide a basis for examining the degree of dilution and dispersion that may take place as the sediment is reworked.
For the inlet, the observed concentrations are fairly similar at the three sub-tidal sites while the modelled concentrations are (a) much more variable and (b) much higher (up to an order of magnitude) except at PAH2 (Duck Creek) where similar concentrations are found. These results suggest the observed metal concentrations in the sub-tidal zone reflect the effects of sediment transport, reworking and dilution from the various discharge points which are situated along the coastline and close to the intertidal zone. These processes appear to be more important than the concentrations delivered, as there is an order of magnitude difference between concentrations delivered from Duck Creek compared with PAH3, whereas the observed concentrations in deposited sediments are very similar.
100

5 Case study evaluation
Table 5.7 Concentrations of total copper and total zinc measured in sub- tidal sediment samples collected
from Pauatahanui Inlet and Onepoto Arm compared with modelled concentrations at nearest outlets to estuary
GWRC sampling site(b)
Sampling
depth(b)
(m)
Nearest
outlet no
(this study)
Copper (mg/kg) Zinc (mg/kg)
Observed Modelled(a) Observed Modelled(a)
Pauatahanui Inlet
PAH1 – Browns Bay 2.0
2
14.6
83.0
88.6
1271
3 50.8 900
4 78.1 1257
PAH2 – Duck Creek 1.8 5 10.5 4.1 70.1 35
PAH3 – off Camborne 1.7 19 9.5 35.3 69.7 676
Onepoto Arm
POR1 – Onepoto Arm South (off Porirua city)
2.0 28 23.4 42.5 200 362
POR2 – Te Awarua-o-Porirua Harbour North (near centre of Arm)
2.9
26
20.6
96
150
660
31 77 648
32 125 1058 (a) Sediment concentrations calculated from combined road and urban loads of copper (zinc) divided by the total sediment load from the contributing catchments to the discharge point on the inlet (b) Approximate water depth at mean low water neap tide; samples collected on 10/11/2008; fraction analysed <500um (Milne et al 2009); refer to figure 5.27 for sampling locations
Similar findings are found for Onepoto Arm with observed sub-tidal concentrations for zinc and copper well below those modelled at the nearest outlets, indicating a significant degree of reworking and dilution. More recent sub-tidal sediment monitoring data in Te Awarua-o-Porirua Harbour from 2013 shows a similar pattern (Robertson and Stevens 2015).
Validation of the ‘delivered’ sediment metal concentrations modelled at each discharge point would require comparison with observed metal concentrations in sediment taken from nearby catchpits that discharge to these outlets. There is limited availability of such data as previous and current monitoring within the inlet is typically undertaken at intertidal and sub-tidal locations.
Some data is available for catchpits on the SH58 from results of a field trial to evaluate the in situ performance of proprietary catchpit filter systems (MWH 2008). The catchpits were located on the SH58 close to its intersection with SH1 at Paremata and discharge directly to the inlet. This location is in the vicinity of Ivey Bay with the closest modelled discharge location being outlet 1.
Analysis of the retained sediment collected in the catchpit filter bags over a three-month period showed variable metal concentrations for different catchpits in the approximate range 410–1,000mg/kg (for zinc) and 57–120mg/kg (copper). These concentrations are of similar magnitude to the modelled annual concentrations (outlet 1) of 1,274mg/kg (zinc) and 80.4mg/kg (copper), indicating the modelled data provides a reasonable estimate of the actual sediment metal concentration delivered to the inlet.
However, there is no data from other locations in the catchment to assess whether the relativity between sites as modelled reflects the actual relativity in sediment metal concentrations delivered to the harbour.
101

Risk assessment of road stormwater runoff
5.7.4 Near field vs far field effects
The risk to both arms of Te Awarua-o-Porirua Harbour from elevated sediment metal concentrations in stormwater discharges is derived both from near-field effects (eg at or close to the point of discharge) and to far-field effects (eg from subsequent re-dispersion and settlement of metal-contaminated sediment from other parts of the estuary).
For example, the comparatively high metal concentrations determined by the RSS model at the point of discharge represent near-field effects on sediment in the intertidal zone but through re-working and dispersion this may contribute to a build-up of metal contamination in sub-tidal sediments further offshore.
The coastal/estuary risk model has been configured to flag near-field effects with the risk score at a given outlet driven by the metal concentration in sediment rather than the contaminant load. Thus stormwater containing sediments with a high metal concentration will have a larger risk score even though the contributing metal load may be small. Conversely a high load/low concentration discharge has a smaller near-field effect. However the latter will discharge more contaminant into the inlet and may contribute to a worsening background level of metal in sediment (far-field effect).
In considering near-field effects, the RSS model may differentiate parts of the estuary shoreline where there is a higher (or lower) risk to the receiving environment from stormwater discharges. Importantly, the risk score may then be traced back to those sub-catchments where the road/urban contaminants are generated, and where management controls can be implemented, if warranted.
By prioritising the locations where near-field effects may arise from stormwater discharges to either arm, the model output may also help inform the Te Awarua-o-Porirua Whaitua Committee in providing recommendations to GWRC on measures to target specific discharge locations as well as reduce the total metal contaminant load to the waterbodies.
While the risk assessment focuses on near-field effects, the maps of metal loads delivered at each discharge point show how the information generated by the RSS model also allows an important additional aspect to be considered in terms of the relative contributions of catchments to far-field effects.
Hydrodynamic modelling studies for Te Awarua-o-Porirua Harbour should provide a clearer indication of local/regional deposition ‘hot spots’ and therefore the risk of where metals may build up in sub-tidal sediments.
5.8 Other RSS model applications This section looks at other applications of the RSS model that may be used to supplement the risk assessment applications discussed in sections 5.3 to 5.5.
Three applications are described below with examples from the case study:
1 Screening the road network by contaminant load
2 Apportioning contaminant loads between local roads and state highways
3 Whole of catchment analysis for road contributions.
102

5 Case study evaluation
5.8.1 Screening the road network by contaminant load
Section 4.4 describes how the RSS model may be used to identify sub-catchments where road runoff presents the highest risk to streams/rivers, as identified through the road traffic alone, urban risk alone or both in combination.
The road traffic risk score for each sub-catchment is determined from a combination of three parameters (refer to table 4.1 for details):
1 Mean annual contaminant load (copper or zinc) from all road traffic traversing the sub-catchment
2 Mean annual flow in the sub-catchment stream (reach)
(Note: parameters 1) and 2) above provide the notional in-stream concentration in the water column and are used to derive the CS score measured in CCUs)
3 Sensitivity of the receiving stream (reach).
Within an individual sub-catchment, where the stream flow and sensitivity of the reach are fixed, the overall risk is driven by the CS score which in turn is determined by the contaminant load (copper and zinc).
The traffic risk can be further spatially disaggregated within any identified sub-catchments by examining how contaminant loads are distributed across the road network within that sub-catchment. The following example illustrates how the RSS model can ‘drill down’ into a previously identified relative ‘hot spot’ to identify where the road traffic risk is being generated.
When considering road traffic risk alone, application of the model to streams/rivers in the Pauatahanui Inlet case study area identified three to four sub-catchments in the ‘highest risk’ category (section 4.4). These were situated within the Browns Stream sub-catchment and coloured red in figure 5.11. This relative ‘hot spot’ is the result of moderate levels of urban traffic in conjunction with a small stream with a relatively low flow, generating a CS score of 5 which automatically places the sub-catchment in the ‘highest’ risk category (ie irrespective of the RES score).
Figure 5.28 shows the zinc load (mg/day) delivered from each road in the sub-catchments. ‘No exit’ roads with least traffic have the lowest loads followed by connecting roads. The main arterial road with the highest traffic that runs north-south along the alignment of Browns Stream has, not surprisingly, the highest contaminant load. The zinc load varies by three orders of magnitude from the lowest to most trafficked road sections.
103

Risk assessment of road stormwater runoff
Figure 5.28 Example ‘drill down’ to identify zinc loads by road in a ‘highest’ risk sub- catchment
Network analysis as shown by the example in figure 5.28 could be used to identify where the relative risk from traffic-sourced contaminants in runoff is being generated. This in turn may point to priority road sections for further investigation, and in conjunction with the stormwater network, assist in managing stormwater discharges to the receiving environment.
Note that the need or otherwise for stormwater treatment on these road sections will be dependent on the combined metal contaminant risk (ie road traffic plus urban sources) in runoff at the receiving water body and the threshold for acceptable discharge after reasonable mixing.
5.8.2 Apportioning contaminant loads between local roads and state highways
This section illustrates a second application of the model to further examine priority areas of the road network. In this case the task is to apportion how much of the contaminant load (and risk) in runoff to a receiving environment from a road network is attributable to local roads and how much to state highways.
The example looks at the distribution of road traffic contaminants in runoff to Pauatahanui Inlet. Contaminant load, sediment metal concentration and the relative contributions from road traffic, urban (and combined) sources at outlets to Pauatahanui Inlet were discussed in section 5.5. Figure 5.14 identified roads as having a relatively small proportion of the total zinc contaminant load in discharges from urban catchments. This example looks to further apportion the road traffic contaminant load shown in figure 5.14 to local roads and state highways.
The different spatial representation of discharges from local roads and state highways first needs to be considered. For local roads the discharge to the final receiving environment is a physical outfall that is coded in RAMM. In the case of Pauatahanui Inlet, these locations are represented around the inlet by the 23 outlets, as previously described in section 5.5. For state highways, the point of runoff from the carriageway is represented in RAMM by various drains/sumps (with or without a culvert) along the
104
5 Case study evaluation
carriageways. RAMM does not identify the pathway that connects the point where runoff leaves the state highway carriageway to the receiving water body.
For the SH58 that runs alongside the southern flank of Pauatahanui Inlet, road runoff is directed through a large number of catchpits spaced along the road and piped directly to the inlet shoreline. The RSS model estimates the contaminant load for the total length of state highway traversing each sub-catchment.
For display purposes the state highway contaminant load is then assigned spatially to the local roads ‘outlet’ in that sub-catchment. The 23 outlets are a simplified representation of the large number of discrete outfalls along the shoreline where state highway runoff discharges to the inlet. However, the contaminant load at each outlet is a true representation of the state highway load at the sub-catchment level.
Figure 5.29 shows the road traffic contaminant load and spatial distribution to the inlet for local roads (blue), SH58 (red) and combined (yellow). The results show the higher impact of traffic contaminants from the urban road networks discharging along the southern flank of the inlet compared with rural catchments draining to the northern shoreline. Of note is the relatively high load at the eastern end of the inlet, where the total load is dominated by contributions from SH58 draining the upper reaches (see figure 5.11 for a map of the upper catchment).
For the remainder of the inlet, discharges from the state highway take the form of a more diffuse pattern along the southern shoreline in proportion to traffic flows. Also of note are the contributions from local roads (blue) to Brown’s Bay and Duck Creek, reflecting the larger area of their contributing road catchments.
Figure 5.29 Relative contributions of zinc load to Inlet from local roads and state highways
105

Risk assessment of road stormwater runoff
Note that the loads are conservative as catchpits were set in this RSS model run to have a zero LRF (refer to section 5.3 and appendix A).
5.8.3 Whole of catchment analysis
The coastal/estuarine risk assessment of Pauatahanui Inlet (section 5.5) and Onepoto Arm (section 5.6) have been considered separately with an emphasis on spatial risks around each estuary at the final discharge outlets.
The third application takes a ‘whole of catchment’ approach by comparing the total copper and zinc loads from road traffic in both arms of Te Awarua-o-Porirua Harbour and surrounding catchments (excluding the outer harbour – see figure 5.1).
This area comprises the extended case study, and potentially a FMU under the NPS-FM, and is currently being assessed by GWRC’s Te Awarua-o-Porirua Whaitua Committee. The opportunity for evaluating the RSS model within a potential FMU was one of the reasons for extending the original case study (see section 5.2.2).
The road traffic contributions in this FMU are presented below by RCA, road type and for each arm of the harbour. (Note: the urban and combined ‘roads plus urban’ zinc and copper loads in Pauatahanui Inlet and Onepoto Arm are provided in tables F.1 and F.3, respectively, in appendix F).
5.8.3.1 Road traffic loads of zinc and copper in runoff by road controlling authority
Table 5.8 summarises the modelled road traffic loads of zinc and copper that enter Pauatahanui Inlet and Onepoto Arm, disaggregated by the RCA. The percentage contributions are also provided.
Table 5.8 Road traffic loads of zinc and copper in runoff to case study area by road controlling authority
Study area Road controlling
authority
Road traffic – zinc load Road traffic – copper load
(g/yr) % % PH(b) (g/yr) % % PH(b)
Pauatahanui Inlet (and catchments)
PCC 22,612 39% – 3,796 40% 7%
Local roads 22,612 39% 6% 3,796 40% 7%
State highways 35,187 61% 10% 5,771 60% 10%
All roads 57,800 100% 16% 9,567 100% 17%
Onepoto Arm (and catchments)
WCC 32,600 11% – 5,395 11% –
PCC 92,885 31% – 15,301 32% –
Local roads 125,484 41% 35% 20,696 43% 36%
State highways 177,255 59% 49% 27,283 57% 47%
All roads 302,739 100% 84% 47,979 100% 83%
Te Awarua-o-Porirua Harbour(a)
Total all roads 360,539 – 100% 57,545 – 100%
(a) Pauatahanui Inlet, Onepoto Arm and their catchments (b) Te Awarua-o-Porirua Harbour Note: PCC = Porirua City Council; WCC = Wellington City Council
Pauatahanui Inlet
SH58 is the main state highway in the catchment with local roads administered by Porirua City Council. The road traffic zinc and copper loads are both split approximately 60% for state highways and 40% for
106

5 Case study evaluation
local roads. When expressed as a percentage of the total load from all road traffic in both arms of Te Awarua-o-Porirua Harbour, these figures reduce to around 10% (state highways) and 6% (local roads).
Onepoto Arm
SH1is the main state highway in the catchment with local roads administered by Porirua City Council around Porirua city and Wellington City Council in the southern part of the catchment.
The road traffic zinc and copper loads are split approximately 58% for state highways and 42% for local roads (the latter divided ca. 3:1 between Porirua City Council and Wellington City Council). When expressed as a percentage of the total load from all road traffic in both arms of Te Awarua-o-Porirua Harbour, these figures reduce to only around 48% (state highways) and 36% (local roads).
5.8.3.2 Road traffic loads of zinc and copper for the two arms of Te Awarua- o- Porirua Harbour
Table 5.8 also summarises the total road traffic loads of zinc and copper that enter as runoff to Pauatahanui Inlet and Onepoto Arm from the contributing catchments.
The Onepoto Arm receives the majority (ca 84%) of traffic-generated zinc and copper in road runoff discharged to the Harbour as a whole. This reflects the more intensive land use development and higher traffic intensity in the catchments draining to Onepoto Arm, compared with the inlet.
Note that road traffic itself contributes a relatively small faction of the total (ie combined road and urban) metal loads, amounting to 8% of zinc and 15% of copper discharged in stormwater to Te Awarua-o-Porirua Harbour (see appendix F for data on comparative loads from roads, urban and combined sources).
5.8.3.3 Split of road traffic zinc and copper load by road type
Table 5.9 provides the split between local roads and state highways of the total zinc and copper in runoff to Pauatahanui Inlet and Onepoto Arm.
Table 5.9 Modelled copper and zinc loads from road traffic by road type
Road type Road traffic – zinc load Road traffic – copper load
(g/yr) % (g/yr) %
Local roads 148,097 41% 24,492 43%
State highways 212,442 59% 33,054 57%
All roads(a) 360,539 100% 57,545 100% (a) Pauatahanui Inlet, Onepoto Arm and their catchments
In the extended study area comprising the two arms of Te Awarua-o-Porirua Harbour, the split in the total zinc (and copper) load from road traffic between state highways and local roads is approximately 60:40.
The traffic-generated contaminant load is directly proportional to the traffic intensity (measures as VKT where VKT = AADT x road length) in the catchment (see section 4.3 and appendix A). While the length of local roads in the study area is much greater than for state highways their traffic flows are considerably less. The ca 50% higher zinc and copper loads from state highways (compared with local roads) reflects their higher traffic intensity as modelled across the whole catchment.
107

Risk assessment of road stormwater runoff
5.9 Conclusions from case study Conclusions from applying the RSS model in the case study area are as follows:
5.9.1.1 Rivers and streams risk assessment
The majority of sub-catchments containing roads are classified in the ‘lowest risk’ category. In contrast, most sub-catchments containing any urban land use are classified as ‘highest risk’ reflecting the fact that loads of copper and zinc are high in relation to stream dilution potential. Loads from non-road impervious surfaces make up the majority of the total metal loads in these sub-catchments.
In a few cases the risk from road sources was classified as ‘lower risk’, as was the risk from urban sources, but the combined risk was classified as ‘highest risk’. This shows the cumulative risk of all sources of stormwater contaminants into a catchment can be higher than the risk of each source individually.
The model results demonstrate the importance of considering non-road (urban) sources as well as road sources when assessing overall risk from stormwater runoff and developing catchment management plans.
5.9.1.2 Coastal and estuary risk assessment
The distribution of metal loads from catchments around the inlet reflects the urban/rural land use around the estuary with highest values in stormwater runoff from urbanised (mainly residential) catchments. The road traffic fraction is comparatively small in these built-up areas.
The distribution of sediment metal concentrations at discharge points to the inlet reflects the combination of urbanisation and size of catchment. High load/small catchments have relatively high sediment metal concentrations at the point of discharge while high load/larger catchments with greater dilution by ‘clean’ sediment generate relatively low concentrations.
The overall stormwater risk profile for metal in sediment discharged to the inlet reflects the combination of contaminant concentration and receiving environment sensitivity at each outlet location. Highest risk is evident in Browns Bay where a high load/high concentration combines with a highly depositional environment. While the urban contribution drives the overall risk at Browns Bay, road traffic makes a significant contribution with risk classified as ‘lower’ to ‘medium’.
For Onepoto Arm, where land use is predominantly urban, no REC catchment outlets were found with a ‘highest’ risk level. The load profiles for zinc and copper are both dominated by the relatively high (80% plus) contribution represented by the REC catchment outlet 27. This outlet includes Porirua Stream and its sub-catchments as well as a large fraction of the discharges that flow to the Semple Street outfall that drains Porirua City CBD. Although having the highest metal load, this outlet is ranked only 10th (for zinc) and 11th (for copper) in terms of concentration (after normalising for sediment load) compared with all 13 outlets, with a resultant risk level of ‘medium’.
5.10 Further work This section considers future stages of a research programme for extending the RSS model (developed in the current study) to provide for absolute risk assessments. The rationale for this research investment is that an effects-based assessment will help inform decision making on the explicit need or otherwise for stormwater treatment.
108

5 Case study evaluation
The ultimate goal will be to link a future effects-based model with a risk-based consenting regime for regulating road runoff that sets the basis for stormwater treatment in a cost-effective way commensurate with avoiding the risk of adverse effects on the receiving environment.
5.10.1 Context
Throughout this report, the authors have emphasised that the RSS model developed under the current study is primarily intended to provide for a relative assessment of risk. That is, the method allows the risk at one location to be compared with another, allowing prioritisation of sites for further, more detailed assessments.
At the same time, development of the RSS model has had regard to its future extension to provide for assessments of absolute risk which will identify adverse effects in individual streams, rivers and coastal waterbodies, together with the level of stormwater treatment appropriate to the risk.
With this future development in mind, the method has incorporated two main concepts that provide the basic foundation for an assessment of absolute risk:
• the comparison of water and sediment metal concentrations with effects-based guideline values
• the consideration of ecological and physical characteristics which influence the sensitivity of the receiving environment.
The grounding of the method in these two concepts is reflected in the framework established for the assessment, where risk is a function of the combination of the Contaminant Strength and Receiving Environment Sensitivity scores. This same framework therefore provides the starting point for the development of an absolute risk assessment methodology. The following sections describe ways in which the methods for determining the CS and RES scores for rivers and streams and for coastal waterbodies, respectively, could be further developed to provide for an absolute assessment of risk.
5.10.2 Rivers and streams
Under the current method, the CS score for rivers and streams reflects the ‘average’ water quality in a given stream reach based on comparison with chronic (long-term) guideline concentrations of copper and zinc. This comparison with chronic criteria, rather than acute criteria (eg the US EPA acute toxicity criteria), is appropriate because in-stream concentrations of copper and zinc are calculated from annual loads and annual flows.
However, the effects of stormwater discharges are generally of greater concern in relation to the elevation of contaminant concentrations during storm events to much higher levels than under base flow conditions. While the ecotoxicity of contaminants such as copper and zinc during storm events may cause only short-lived acute effects, these have the potential to have a marked impact on the long-term ecological condition of a stream. An absolute assessment of risk should therefore consider both acute and chronic effects of stormwater discharges.
One approach would involve developing a method by which the frequency of exceedance of acute water quality guideline values can be assessed. However, high in-stream concentrations of metals typically occur only over short time periods, usually a few hours while acute toxicity testing is typically over 96 hours. Modelling would therefore also need to factor in the time of exposure. Further development of the RSS model to address the frequency and duration of exposure could, for instance, be based on probabilistic approaches which take account of distributions of copper and zinc in road runoff combined with rainfall runoff modelling to determine distributions of runoff volumes and flow rates. Methods such as the UK HAWRAT and US SELDM models (described in section 2.4) are based on this type of approach.
109

Risk assessment of road stormwater runoff
The development of these overseas models has had the advantage of access to relatively large national datasets of road runoff quality. In further developing a risk assessment method for New Zealand, careful consideration would need to be given to the adequacy of the existing road runoff quality datasets and, if further sampling was deemed necessary, on the design of a field study that would yield the most useful data in the most cost-effective manner. In this regard, the need for a more comprehensive set of VEFs covering a representative range of traffic congestion and road characteristics has been highlighted in this study (see appendix A).
As described in section 4.4, the RES score developed for the rivers and streams risk assessment method is based on modelled MCI scores. The authors of those scores have cautioned against the use of the modelled MCI scores for site-scale assessments. Where the relative risk assessment indicates that a river or stream reach should be given priority for further assessment, the obvious extension of the method is to undertake location-specific field surveys to determine the actual MCI score (and/or other measures of ecological sensitivity).
A notable aspect of the risk assessment method developed for rivers and streams in the current study is that its extension can be tailored with relative ease to provide for absolute assessments that support the implementation of the NPS-FM. The CS score could be based on comparison of median or some other specified percentile concentrations of copper and zinc (estimated using probabilistic approaches, as indicated above) with national or locally-specified target concentrations, in the event that copper and zinc bottom lines are set. Further development of the method would also need to consider ways of estimating the dissolved fractions of copper and zinc (as opposed to total metal concentrations), as these may be the relevant attributes set under a future extension of the National Objectives Framework (NOF).
It is noted that regional councils and the MfE are currently considering funding for developing attribute tables for zinc and copper under the NOF guidelines that will consider both long term (chronic) and acute affects. Such defined attribute states should be of considerable value in developing an absolute risk assessment.
5.10.3 Coastal waterbodies
Under the current method the CS score for coastal waterbodies reflects the concentrations of copper and zinc in suspended sediments delivered to a coastal discharge point. As described in appendix D, a range of physical, chemical and biological processes operating in the water column and beds of coastal receiving waterbodies can result in metal concentrations in the deposited bed sediments being different to those in suspended sediments. However, it is the metal concentrations in the bed sediments that are more relevant for an assessment of risk, because these bed sediments provide habitat for benthic macroinvertebrates and other fauna (eg shellfish).
Extension of the method to provide for an absolute risk assessment of coastal waterbodies would therefore involve incorporating methods for assessing concentrations of copper and zinc in estuary bed sediments. In a number of studies of New Zealand harbours and estuaries, trends in sediment metal concentrations have been predicted with the application of the Urban Stormwater Contaminants (USC) harbour sediment and contaminant accumulation model (eg Green 2008a; 2008b). While the application of the full version of this model involves comprehensive field surveys and detailed hydrodynamic modelling, a simpler version of the USC has been developed which can be used in low data situations (Moores et al 2014). It may be possible to incorporate this or some similar model in an extended risk assessment methodology so that a CS score can be derived from bed sediment metal concentrations.
As described in section 4.5, the RES score developed for the coastal risk assessment method reflects the physical attributes of receiving waterbodies, and in particular their depositional characteristics. The higher
110

5 Case study evaluation
the energy of the receiving environments, the lower the RES score. As part of the development of a method for assessing absolute risk, an extension of this scoring system would include taking account of the ecological characteristics of receiving environments. Similarly to the method for assigning an RES score to rivers and streams, these ecological characteristics could be based on surveys of benthic macroinvertebrates, for example, in locations identified by the RSS model as priorities for further investigation.
111

Risk assessment of road stormwater runoff
6 Conclusions and recommendations
6.1 Conclusions 6.1.1 Model development
The GIS-based road stormwater screening model (the RSS model) developed in this study has added a range of significant enhancements and new features to the VKT screening tool developed in 2007.
The RSS model assesses the relative risk associated with discharges of stormwater contaminants (copper and zinc) derived from roads, non-road urban impervious surfaces and the two types of source in combination, using estimates of contaminant load at the sub-catchment level.
The risk profile to receiving waterbodies is evaluated using two attributes:
• a contaminant strength score
• a receiving environment sensitivity score.
The risk to streams and rivers reflects the potential cumulative effects of metal (zinc and copper) in the water column in each sub-catchment reach. The risk to coastal/estuarine receiving environment reflects the potential cumulative effects of metal (zinc and copper) in the sediment at the point of discharge (‘outlet’) to the waterbody.
The modelled sediment metal loads (and concentrations) are conservative as the RSS model has been configured so as to exclude load reduction from stormwater treatment devices (eg catchpits) in the road/stormwater networks, although look-up tables allow load attenuation and other factors to be adjusted by the user.
The RSS model is subject to a number of assumptions and limitations, including uncertainty in the underlying data used in its development. It is intended to be used on a comparative rather than absolute basis for screening road networks and their likely risks to receiving environments in order to provide guidance to network operators and road controlling authorities on the management of road runoff and the development of catchment management plans. However, any management response is likely to first require a targeted investigation of the relative importance of different contaminant sources in a given stormwater catchment.
6.1.2 Case study application
A case study evaluation of the RSS model was completed for the Te Awarua-o-Porirua Harbour, focusing on Pauatahanui Inlet, Onepoto Arm and their contributing catchments. This area was selected as it contains a range of freshwater, estuarine and coastal receiving environments together with rural roads, state highways and rural/urban land use.
The case study demonstrated that the RSS model provides meaningful spatial analysis of metal contaminant loads and concentrations, and the relative risk to streams/rivers at the sub-catchment level and to coasts/estuaries at the point of stormwater discharge.
The study findings further demonstrate how the model may be used to ‘drill down’ into the road network to examine contaminant (zinc and copper) loads from individual roads as well as apportioning the fraction of contaminant load to local roads and state highways.
112

6 Conclusions and recommendations
While some data issues were identified with RAMM during development of the road contaminant load model, these were not considered to be material for its use in the RSS model. It is noted that the RAMM database is being redeveloped to remedy the present shortcomings.
A sensitivity analysis was conducted to assess the extent to which uncertainty in model inputs influences the assessment of risk. Varying the road-derived loads of copper and zinc by ±15% was found to change the road-traffic risk classification of around 3% of stream reaches in the case study catchment. It is concluded that assumptions adopted in the estimation of contaminant loads are unlikely to have a major bearing on the outcome of the risk assessment.
Model validation consisted of comparing modelled concentrations of copper and zinc with observations from water and sediment quality monitoring programmes in Te Awarua-o-Porirua Harbour and its catchment. While based on a very limited number of samples, mean in-stream concentrations of copper and zinc modelled as part of the risk assessment were found to be a reasonable reflection of observed stream water quality. Estimates of zinc concentrations are approximately an order of magnitude higher than estimates of copper and the relativity between sites as modelled is consistent with the relativity in observed concentrations.
For the coastal validation, observed intertidal and sub-tidal concentrations for zinc and copper in sediment were typically much lower (up to an order of magnitude) than those modelled at the coastal outlets indicating a significant degree of reworking and dilution of sediment from the point of discharge close to the intertidal zone. Limited data on observed metal concentrations in sediment taken from nearby catchpits that discharge to one outlet suggests reasonable agreement with the ‘delivered’ sediment metal concentrations modelled at this discharge point. However, where further observations are available, additional validation of both the streams and rivers and coasts and estuaries risk assessment methods should be considered as part of the application of the RSS model in other areas of New Zealand.
The model results demonstrate the importance of considering non-road (urban) sources as well as road sources when assessing overall risk from stormwater runoff and developing catchment management plans.
6.1.3 End user application
The RSS model developed in this study should assist the Transport Agency, territorial authorities and the wider transport sector in screening and prioritising areas of the road network for improved management of road runoff. The risk-based approach used in assessing the impact of stormwater discharges on receiving environments aligns with current development by regional councils to move towards a risk-based stormwater consenting regime in support of the NPS-FM.
The RSS model has been designed to be applied to road networks (and their associated stormwater networks) on a ‘whole of catchment’ basis. While the focus of the case study has been at the catchment level, the model has the facility to ‘drill down’ to specific areas of the road network to identify potential ‘hot spots’ and support development of network stormwater management plans.
The output from the model is compatible with the freshwater quality accounting system specified in the NPS-FM which requires updated information at the catchment level on the measured, modelled or estimated contaminant loads, concentrations, sources and the amount of each contaminant attributed to each source. The case study of Te Awarua-o-Porirua Harbour catchment (Pauatahanui Inlet and Onepoto Arm) has shown that the RSS model can be successfully applied to address these attributes for copper and zinc.
The findings of the extended case study for the Pauatahanui Inlet, Onepoto Arm and their catchments may also be of specific interest to the Te Awarua-o-Porirua Whaitua Committee in their assessment of setting
113

Risk assessment of road stormwater runoff
limits for water quality associated with road runoff under their remit to provide recommendations to GWRC on freshwater management required by the NPS-FM.
6.2 Recommendations Recommendations to address closing information gaps and possible future stages of a research programme for extending the RSS model to provide for absolute risk assessments (as discussed in section 5.10) are provided below.
1 Findings from the case study have provided initial validation of the RSS model output. The model should be further tested to confirm its robustness and application under a wider range of road and land use conditions. This should include additional validation of both the streams/rivers and coasts/estuaries risk assessment methods when applying the model in other areas of New Zealand.
2 The literature review identified a gap in VEFs for copper and zinc for free-flow traffic derived from field measurements of road runoff under New Zealand conditions. While not necessary for screening purposes, further field studies are recommended to provide a full range of VEFs to be incorporated into the contaminant load module. This will be necessary if the model is to be further developed for absolute risk assessments.
3 The research outputs should be disseminated to end users and other interested parties through a series of regional half-day workshops. Given the novelty of the method, it is further recommended that international peer review be sought through the journal publication process.
4 Consideration should be given to funding further research investment of the RSS model to provide an absolute effects-based risk assessment tool to help inform decision making on the explicit need or otherwise for stormwater treatment.
114

7 References
7 References
Auckland Regional Council (2003) Design guidelines manual: stormwater treatment devices, Accessed 28 January 2016. www.aucklandcouncil.govt.nz/EN/planspoliciesprojects/reports/technicalpublications/Pages/technicalpublications1-50.aspx
Auckland Regional Council (2010) Development of the contaminant load model. Auckland Regional Council
technical report 2010/004.
Australian and New Zealand Environment and Conservation Council (ANZECC) (2000) Australian and New
Zealand guidelines for fresh and marine water quality. Accessed 28 January 2016. www.mfe.govt.nz/fresh-water/tools-and-guidelines/anzecc-2000-guidelines
Blaschke, P, J Woods, and F Forsyth (2010) The Porirua Harbour and its catchment: a literature summary
and review. Report prepared for Porirua City Council and Wellington City Council.
Boffa Miskell (2011) Transmission Gully project technical report 10 – marine habitat & species: values and description. Prepared by Boffa Miskell Ltd for NZ Transport Agency and Porirua City Council. Report no:
W09034E. 73pp plus appendices.
Clapcott, J, E Goodwin and T Snelder (2013) Predictive models of benthic macroinvertebrate metrics. Prepared for Ministry for the Environment. Cawthron report no. 2301. 35pp plus appendices.
Crabtree B, P Dempsey, F Moy, C Brown and M Song (2008) Improved determination of pollutants in
highway runoff – phase 2 final report. Highways Agency contract reference 3/376.
Department of Conservation (DoC) (2010) New Zealand coastal policy statement (NZCPS) www.doc.govt.nz/about-us/science-publications/conservation-publications/marine-and-coastal/new-zealand-coastal-policy-statement/new-zealand-coastal-policy-statement-2010/
Driscoll, E, P Shelley and EW Strecker (1990a) Pollutant loadings and impacts from highway stormwater runoff volume I: design procedure. US Department of Transport Federal Highway Administration report FHWA-RD-88-006.
Driscoll, E, P Shelley and EW Strecker (1990b) Pollutant loadings and impacts from highway stormwater runoff, volume III: analytical investigation and research report. US Department of Transportation
Federal Highway Administration report FWHA-RD-88-008.
Ellis, JB and DM Revitt (2008) Quantifying diffuse pollution sources and loads for environmental quality standards in urban catchments. Water Air Soil Pollution: Focus 8: 577–585.
Ellis, JB, DM Revitt and L Lundy (2012) An impact assessment methodology for urban surface runoff quality following best practice treatment. Science of the Total Environment 416: 172–179.
Gardiner, LR, A Osborne and C Reller (2007) Sensitive receiving environments at risk from state highway runoff. NZ Water and Waste Association Conference, Auckland, May 2007. 20pp.
Gardiner, LR and W Armstrong (2007) Identifying receiving environments at risk from road runoff. Land
Transport NZ research report 315. 68pp (and volume II – appendices, ibid, 108pp).
Gibb, JG (2011) Sedimentation zones and rates within Pauatahanui Inlet and the Onepoto Arm of Te
Awarua-o-Porirua Harbour, addendum to CR 2009/1. Report prepared by Coastal Management Consultancy Ltd for Greater Wellington Regional Council.
115

Risk assessment of road stormwater runoff
Gibb, JG and GJ Cox (2009) Patterns and rates of sedimentation within Te Awarua-o-Porirua Harbour. Coastal Management Ltd Consultancy report (CR2009/1) for Porirua City Council.
Granato, GE (2013) Stochastic empirical loading and dilution model (SELDM) version 1.0.0 in US geological
survey techniques and methods, book 4, chap. C3, 112pp on CD-ROM. http://pubs.usgs.gov/tm/04/c03
Greater Wellington Regional Council (GWRC) (2000) Regional coastal plan for the Wellington region. Wellington: GWRC.
Greater Wellington Regional Council (GWRC) (2015) Proposed natural resources plan for the Wellington
region. Wellington: GWRC.
Greenberg, E (2014) Implementing the National Policy Statement for Freshwater Management 2011. Wellington: GWRC. Accessed 28 January 2016. www.gw.govt.nz/assets/Plans--Publications/Regional-Plan-Review/Whaitua/REPORT-Implementing-the-National-Policy-Statement-for-Freshwater-Management-2011-16-June-2014.pdf
Hickey, CW and LA Golding (2002) Response of macroinvertebrates to copper and zinc in a stream mesocosm. Environmental Toxicology and Chemistry 21: 1854–1863.
Irving P and I Moncrieff (2004) Managing the environmental impacts of land transport: integrating environmental analysis with urban planning. Science of the Total Environment 334–335: 47–59.
Joy, MK (2013) Freshwater fish predictive modelling for bioassessment; A scoping study into fish
bioassessment models as national indicators in New Zealand. Accessed 25 January 2016. www.mfe.govt.nz/sites/default/files/freshwater-fish-predictive-modelling-bioassessment-scoping-study.pdf
Kennedy, P, J Gadd and I Moncrieff (2002) Emission factors for contaminants released by motor vehicles in
New Zealand. Wellington: Ministry of Transport. 104pp.
Leathwick, JR, D West, L Chadderton, P Gerbeaux, D Kelly, H Robertson and D Brown (2010) Freshwater
ecosystems of New Zealand (FENZ) geodatabase user guide. Version one. Wellington: Department of Conservation, Te Papa Atawhai.
Lewis, M, J James, E Shaver, S Blackbourn, A Leahy, R Seyb, R Simcock, P Wihongi, E Sides and C Coste (2015). Water sensitive design for stormwater. Auckland Council guideline document GD2015/004. Prepared by Boffa Miskell for Auckland Council.
Long, ER, DD MacDonald, SL Smith and FD Calder (1995) Incidence of adverse biological effects within ranges of chemical concentrations in marine and estuarine sediments. Environmental Management 19,
no.1: 81–97.
Lundy, L, JB Ellis and DM Revitt (2012) Risk prioritisation of stormwater pollutant sources. Water Research
46: 6589–6600.
MacDonald, DD, RS Carr, FD Calder, ER Long and CG Ingersoll (1996) Development and evaluation of sediment quality guidelines for Florida coastal waters. Ecotoxicology 5: 253–278.
Milne, JR and L Watts (2008) Stormwater contaminants in urban streams in the Wellington region. Accessed 25 January 2016. www.gw.govt.nz/assets/council-publications/Stormwater%20Contaminants%20in%20Urban%20Streams%20in%20the%20Wellington%20Region.pdf
116

7 References
Milne, JR, PG Sorensen and S Kelly (2009) Porirua Harbour subtidal sediment quality monitoring: Results
from the November 2008 survey. Accessed 25 January 2016. www.gw.govt.nz/assets/council-publications/Porirua%20Harbour%20Subtidal%20Sediment%20Quality%20Monitoring%20Results%20from%20November%202008%20Survey.pdf
Ministry for the Environment (MfE) (2014) National policy statement for freshwater management 2014. Accessed 25 January 2016. www.mfe.govt.nz/publications/fresh-water/national-policy-statement-freshwater-management-2014
Ministry for the Environment (MfE) (2015) A guide to the National policy statement for freshwater
management 2014. Accessed 28 January 2016. http://www.mfe.govt.nz/publications/fresh-water/guide-national-policy-statement-freshwater-management-2014
Mitchell, G (2005) Mapping hazard from urban non-point pollution: a screening model to support sustainable urban drainage planning. Journal of Environmental Management 74: 1–9.
Moncrieff, I and P Kennedy (2004) Road transport effects on aquatic ecosystems – issues and context for
policy development. Wellington: Ministry of Transport. 128pp.
Moores, J, C Batstone, J Gadd, J, M Green, S Harper, A Semadeni-Davies and R Storey (2014) Evaluating the sustainability of urban development in New Zealand in relation to effects on water bodies. The
International Journal of Environmental Sustainability 9, no.4: 31–47.
Moores, J, J Gadd, P Pattinson, C Hyde, and P Miselis (2012) Field evaluation of media filtration stormwater treatment devices. NZ Transport Agency research report 493. 255pp.
Moores, J, P Pattinson, and C Hyde (2009) Richardson Road study: measurement and sampling of runoff and catchpit solids. Auckland Regional Council technical report TR2009/119. Accessed 25 January 2016. www.arc.govt.nz/albany/fms/main/Documents/Plans/Technical%20publications/Technical%20reports/2009%20100-150/TR2009-119.pdf
Moores, J, P Pattinson and C Hyde (2010) Enhancing the control of contaminants from New Zealand’s roads: results of a road runoff sampling programme. New Zealand Transport Agency research report
395. 161pp.
MWH (2008) SH58 Stormwater treatment trial of catchpit filter systems. Report reference Z1260713. Internal report prepared for the NZ Transport Agency.
Newsome, PFJ, RH Wilde and EI Willoughby (2008) Land resource information system spatial data layers:
data dictionary. Lincoln: Landcare Research New Zealand.
NZ Transport Agency (2014) Erosion and sediment control guidelines. Accessed 28 January 2016. www.nzta.govt.nz/resources/erosion-sediment-control/erosion-sediment.html
Oliver, MD and C Conwell (2014) Te Awarua-o-Porirua Harbour subtidal sediment quality monitoring:
Results from the 2010 survey. Wellington: GWRC. Accessed 25 January 2016. www.gw.govt.nz/assets/council-publications/Te-Awarua-o-Porirua-Harbour-subtidal-sediment-quality-monitoring-Results-from-the-2010-survey.pdf
Page, T (2004) The murky waters of stormwater management – a case study: Transit NZ SH74/Main North Road: four laning project. NZWWA Sustainable Land Transport Conference, Wellington.
117
Risk assessment of road stormwater runoff
Porirua City Council (PCC) (2015) Porirua harbour and catchment strategy and action plan. Accessed 30 January 2016. www.pcc.govt.nz/DownloadFile/Publications/Harbour-Management/Te-Awarua-o-Porirua-Harbour-and-Catchment-Strategy-and-Action-Plan-June-2015
Risley, JC and GE Granato (2014) Assessing potential effects of highway runoff on receiving-water quality at selected sites in Oregon with the stochastic empirical loading and dilution model (SELDM): US
geological survey scientific investigations report 2014–5099, 74pp.
Robertson, B and L Stevens (2015) Porirua Estuary fine scale monitoring 2014/15. Report prepared for Greater Wellington Regional Council.
Semadeni-Davies, A, S Elliott and U Shankar (2011) The CLUES project: Tutorial manual for CLUES 3.0. Commissioned by Ministry of Agriculture and Forestry, NIWA client report: HAM2011-003.
Semadeni-Davies, A and S Wadhwa (2014) C-CALM 2.0 User manual catchment contaminant annual load model. NIWA report no.AKL2014-026.
Snelder, T, B Biggs and M Weatherhead (2010) New Zealand river environment classification user guide. March 2004 (Updated June 2010). Accessed 25 January 2016. www.mfe.govt.nz/sites/default/files/environmental-reporting/about-environmental-reporting/classification-systems/rec-user-guide-2010.pdf
Sorensen, PG and JR Milne (2009) Porirua Harbour targeted intertidal sediment quality assessment. Wellington: GWRC and Porirua City Council.
Stark, JD, IKG Boothroyd, JS Harding, JR Maxted and MR Scarsbrook (2001) Protocols for sampling macroinvertebrates in wadeable streams. New Zealand Macroinvertebrate Working Group report no.1. Prepared for the Ministry for the Environment. Accessed 25 January 2016. www.cawthron.org.nz/media_new/publications/pdf/2013_09/protocols-full-manual.pdf 57pp.
Stark, JD, and JR Maxted (2007) A biotic index for New Zealand's soft‐bottomed streams. Journal of Marine
and Freshwater Research 41, no.1: 43–61.
Stevens, L and B Robertson (2014) Porirua Harbour sediment plate monitoring 2013/14. Report prepared for Greater Wellington Regional Council. Accessed 25 January 2016. www.gw.govt.nz/assets/Our-Environment/Environmental-monitoring/Porirua-Harbour-Sediment-Monitoring-2014.pdf
Timperley, M, G Bailey, P Pattinson and G Kushel (2003) Zinc, copper and lead in road run-off. 6th
Australasian Transport Research Forum, Wellington, New Zealand.
Timperley, M, B Williamson, G Mills, B Horne and M Hasan (2005) Sources and loads of metals in urban stormwater. NIWA client report AKL2004-070 to Auckland Regional Council. 78pp. Auckland Regional
Council technical publication TP318.
UK Highways Agency (UKHA) (2009) Road drainage and the water environment. Design manual for roads
and bridges HA 45/09 11, section 3, part 10.
Woods, R, J Hendrikx, R Henderson and A Tait (2006) Estimating mean flow of New Zealand rivers. Journal
of Hydrology (NZ) 45, no.2: 95–110.
118

Appendix A: Estimation of road traffic loads of copper and zinc
Appendix A: Estimation of road traffic loads of copper and zinc
A1 Introduction As described in section 4.4, annual loads of copper and zinc generated from road traffic are estimated for each road section, adjusted as necessary for traffic congestion and load attenuation and the individual section values summed for each sub-catchment to provide an input to the rivers/streams risk assessment. For the coasts/estuaries risk assessment, the road traffic load at each final discharge location (‘outlet’) is the sum of the contributing sub-catchment loads.
The load for a given road section is calculated as the product of the VKT and the VEF, selected according to the degree of traffic congestion (using the LoS for the road section), and finally adjusted for attenuation using LRFs that take account of the road drainage characteristics.
Further details on the methodology and Excel input/output parameters used in deriving road traffic loads of copper and zinc for each link of the road network are provided below.
A2 Road contaminant load model The model uses an Excel platform for data processing with the output mapped to GIS. In order to assist end users minimise data manipulation, the model was configured so that input data, processing and output steps are arranged sequentially by tabs:
• tab 1: raw sub-catchment and road data (from the REC and RAMM database)
• tab 2: raw SWC data (from the RAMM database)
• tab 3: processed SWC data
• tab 4: raw drainage data (from RAMM)
• tab 5: raw carriageway data (from RAMM)
• tab 6: processed data summary
• tab 7: calculation (contaminant load by individual road and aggregated by sub-catchment).
This structure enables the model to be applied to any road network with the raw data populated in the relevant tab and the data processed automatically without substantial modification. Users have the option of adjustment of selected data (eg values for VEFs and LRFs) in look-up tables in the calculation sheet (tab 7).
(Note: although the total zinc and copper loads from road traffic are required for the risk assessments, separate models are used for local roads and state highways because of differences in the configuration of input RAMM parameters. The outputs from each model are combined in a separate Excel file and summed to provide a total road traffic load estimate by sub-catchment for the networks in the study area).
A number of issues were found with the RAMM database during data spatialisation and extracting the relevant information for model calculations. For the majority of issues it was possible to develop solutions which allowed automatic processing of data. However, in other cases it was more efficient to have the model flag the errors and then manually check the data and correct as necessary. As the model output is conservative, and has been designed for screening road networks, the presence of a relatively small
119

Risk assessment of road stormwater runoff
number of inconsistencies due to RAMM data is considered unlikely to materially affect the model output. Full details are set out in appendix E.
A3 Input data and GIS mapping A3.1 Road, traffic and drainage data
Carriageway, traffic (AADT) and drainage features (eg drains, sumps, culverts and outlets) for local roads and state highways are sourced from the relevant RAMM database (refer table A.1) and mapped onto GIS.
Table A.1 Input data from RAMM database used by the road contaminant load model
Data set Description
Carriageways The section of road on either side of the road/highway centreline that carries the traffic and which is divided into one or more lanes.
AADT AADT provides an indicator of the amount of traffic flow on each section of road/state highway. Each carriageway has a given AADT value which, in combination with the carriageway length (in km), is used to calculate annual VKT.
Drainage The drainage data relate to the types of drainage features along the road/state highway. These may include sumps, catchpits and culverts, and are located at specific points along the road/state highway rather that along carriageways (as is the case for the surface water channel data).
Surface water channels
SWCs represent the type of drainage channels present along the side of the road/state highway. There are a number of types of drainage channels and these have been further classified into three groups for the purpose of this study: impermeable, permeable and unclassified (see SWC classification in table A.5).
A3.2 GIS data sets
Additional GIS layers are required by the load model. These include the stormwater reticulation network (showing drain connections, pipework and outlets/discharge points) and the REC database for the sub-catchments and stream reaches.
For example, in the original case study area of Pauatahanui Inlet the following data (as shapefiles) was prepared:
• REC catchments draining to the Pauatahanui Inlet (PauatahanuiInletCatchments_region)
• REC reaches for these catchments (PauatahanuiInletRivers_polyline)
• a sub-set of the above which contain a road(s) (CatchmentsIntersectRoad_region)
• local roads and state highways in the study area (Roads_in_area).
A4 Factoring traffic congestion Road traffic congestion has the effect of increasing contaminant loads for copper and zinc through increased vehicle brake and tyre wear, respectively. This is particularly important in urban areas which may include roads that are over capacity, or more frequently congested. An important part of upgrading the VKT model included provision for congestion which would otherwise underestimate the contaminant load and therefore the relative risk of road runoff to the receiving environment.
120

Appendix A: Estimation of road traffic loads of copper and zinc
The RSS model uses the LoS of a road section as a measure of traffic congestion and relates this to the appropriate VEF to estimate zinc and copper loads. Details are described below.
A4.1 Level of service
A measure of traffic congestion is given by the LoS which is defined as the ratio of traffic volume (measured as AADT) to road capacity. There are three categories of LoS with the ratio increasing in bands from free-flow conditions (LoS 1) through interrupted flow (LoS 2) to congested traffic (LoS 3). The three LoS categories and their applicable threshold values are shown in table A.2.
Table A.2 Level of service categories and applicable ranges
LoS category Name Definition
1 Free flow 𝐴𝐴𝐷𝑇
𝐶𝑎𝑝𝑎𝑐𝑖𝑡𝑦 ≤ 0.35
2 Interrupted 0.35 < 𝐴𝐴𝐷𝑇
𝐶𝑎𝑝𝑎𝑐𝑖𝑡𝑦 < 0.7
3 Congested 𝐴𝐴𝐷𝑇
𝐶𝑎𝑝𝑎𝑐𝑖𝑡𝑦 ≥ 0.7
Source: Transfund New Zealand (2004) Project evaluation manual (PFM2), amendment no.8.
A4.2 Vehicle emission factors
Traffic congestion is built into the contaminant load model by linking the LoS for each road section to the VEF. A higher LoS generally results in a higher VEF and therefore a larger contaminant load.
The relationship between LoS and VEFs is dependent on a range of traffic and road characteristics. Moores et al (2010) reported a set of guideline VEFs27 for total copper and zinc based on published field data from road runoff monitoring. This study derived VEFs from roads under interrupted (referred to as ‘normal’ conditions and derived from runoff sampling during a total of 16 storm events at two roads) and congested traffic, but did not include free-flow conditions. The authors noted that data from which these guideline VEFs were derived had been adjusted by an increase of 10% for the retention of particulate metals in catchpits (where present). Hence these guideline VEFs exclude the influence of stormwater treatment devices.
Additional data available since 2010 has allowed the guideline VEFs to be re-evaluated. Using these later sampling studies, VEFs were again estimated in the current study for interrupted conditions based on data collected during 61 storm events at five different roads, compared with 16 storm events at two roads in 2010. The 2010 guideline VEFs are reproduced in table A.3 together with the estimates from this study (in brackets) derived from the larger sampling dataset.
The resultant VEFs for both interrupted and congested conditions were similar to the guideline VEFs published in 2010 and were therefore used as a basis for the road contaminant load model in the current study. In the absence of field data to provide a VEF for ‘free flow’ conditions (LoS 1), the LoS 2 values were assigned to the LoS 1 category. The model therefore provides a conservative estimate of copper and zinc load in line with its intended use for screening purposes.
27 Refer to Moores et al (2010, table 3.1 and section 4.4.6)
121

Risk assessment of road stormwater runoff
Table A.3 Guideline VEFs (mg/veh- km) for total copper and total zinc(a)
Traffic characteristics VEF – copper VEF – zinc
Free flow (LoS 1) n/a n/a
Normal traffic(b) (LoS 2) 0.047 (0.045) 0.28 (0.31)
Congested traffic and intersections(c) (LoS 3) 0.095 (0.11) 0.62 (0.72) (a) after Moores et al (2010, table 3.1 and section 4.4.6) (b) equivalent to interrupted flow or LoS 2 for the roads monitored (c) equivalent to LoS 3; figures in brackets based on additional unpublished sampling studies since 2010.
Table A.4 lists the LoS and VEFs for copper and total zinc that were used in the model and the case study reported in chapter 5. The values are contained in a look-up table and can be adjusted by the user or revised at a later date.
Table A.4 LoS and VEF values for copper and zinc used in the model
LoS Traffic
VEF –
copper VEF – zinc
1 Free-flow 0.047 0.28
2 Interrupted 0.047 0.28
3 Congested 0.095 0.62
Note that the choice of which set of VEFs to use in table A.3 is of secondary importance as the model is intended for screening purposes based on relative not absolute risks from contaminant loads. Sensitivity analysis (section 5.7.2) shows that varying the road-derived loads of copper and zinc by ±15% had only a minor effect on the outcome of the streams/rivers risk assessment.
A5 Factoring contaminant load attenuation The copper and zinc load in road runoff may be attenuated by the road drainage characteristics depending on the type of SWC and/or the presence of stormwater treatment devices (eg catchpits) in the drainage pathway. Natural soil drainage in the road corridor may also influence the load. These aspects and their associated load reduction factors are discussed below.
A5.1 Road drainage
In order to assign attenuation factors, road drainage assets are grouped broadly by those which treat stormwater (group A: eg catchpits/sumps, side drain/swales, ponds) and those that do not affect stormwater quality (group B: eg culverts).
In the RAMM drainage database the most common assets are culverts and catchpits with occasional reference to other devices such as side drains. However RAMM does not include all stormwater treatment devices present in the road network, such as swales and treatment ponds, and therefore there is no provision for assigning a contaminant LRF in the model to these devices.
Allowing for load attenuation by catchpits was also problematic during model development, for two reasons. First, more than one catchpit (and in some cases up to 5) of various types may be present in each road link and located on one or other side of the carriageway. The model’s spatial resolution did not allow estimation of the carriageway area draining to each catchpit and hence the proportion of the load
122

Appendix A: Estimation of road traffic loads of copper and zinc
allocated to each in the link. For roads with one or more catchpits, therefore, the model makes the simplifying assumption of applying an average catchpit LRF for the whole road link.
Second, contaminant removal efficiencies for catchpits vary widely and may provide little treatment if infrequently cleaned, thus setting an average LRF may not reflect the situation in all parts of the road network.
For the above reasons, and to future-proof its use, the routine to estimate road contaminant load included a query on whether each road section had a treatment device or not (based solely on the RAMM drainage database) with an LRF assigned accordingly. The look-up table in the current model has default LRFs for catchpits and side drains (based on the treatment devices listed in RAMM for the case study area) but the values may be modified by the user.
The RSS model runs in this study ignored any existing stormwater treatment device within the road network in order to provide a conservative estimate of contaminant load, in keeping with its screening application. However, as described below, the contaminant loads reported in the case study make provision for attenuation by surface water channels.
A5.2 Surface water channels
SWCs are coded in a separate RAMM database from drainage assets (discussed above) and are treated separately by the model. SWCs in this study are assigned to one of three groups (type A, B or C) depending on their ability to attenuate contaminants in road runoff:
• type A (curb and channel)
• type B (earth-lined channel)
• type C (by default, any carriageway without an SWC, typically a soil/grass verge).
Each SWC type is illustrated in figure A.1. Type C (effectively no SWC) provides the highest attenuation due to direct infiltration of runoff into the roadside verge.
Figure A.1 Stormwater channel types and potential risk to sensitive receiving environments
123

Risk assessment of road stormwater runoff
Table A.5 lists the characteristics for the three SWC types and their corresponding RAMM look-up codes. The LRFs are based on a review by Moores et al (2010) and assume ‘good’ natural soil drainage (see section 5.3).
The nominal set of LRFs developed for these three SWC groupings has been incorporated into a look-up table in the model (section A5.4).
Table A.5 RAMM surface water channel characteristics(a)
SWC RAMM SWC look- up codes Description Load reduction
factor(b)
Type A DA, DC, DP, DS, KC, KCC, KCS, KDS, KS, MKC, MKCC, OTHER, SLTC, UKN
Hard surface, non-permeable, eg kerb and channel
0
Type B SWCD, SWCDS, SWCS, SWCSS Permeable earth channels 0.6
Type C No code (all other non-coded carriageways) No SWC on highway verge 0.8 (a) www.nzta.govt.nz/resources/road-assessment-and-maintenance-management (b) Moores et al (2010) assuming ‘good’ natural drainage – see section A5.3
A5.3 Natural soil drainage
The effect of natural soil drainage in influencing contaminant attenuation (and therefore the assigned LRFs) for roadside stormwater drainage channels was investigated during the study. This effect will potentially influence infiltration of stormwater in type B SWCs (earth drains) and type C SWCs (natural vegetation strips or roadside verges) where the subsurface is natural ground.
For example, an earth drain constructed in a free-draining sandy loam provides more load attenuation (higher LRF) and therefore less sediment/metal load in runoff to the receiving environment, compared with one excavated in a clay horizon with poor drainage. The soil permeability profile28 from the NZ Land Resource Inventory was used as a basis for a qualitative measure of natural soil drainage. To simplify the process, the three permeability classes were aggregated into two groups: ‘low’ and ‘high’ permeability corresponding to poor and good drainage, respectively (table A.6).
Table A.6 Nominal load reduction factors for different natural soil permeability
Permeability class Description Proposed grouping Nominal LRF
S Slow Low permeability (poor drainage)
0.3 M Moderate
R Rapid High permeability (good drainage)
0.8
Table A.6 includes the nominal LRFs for the two broad groupings of natural soil permeability that were built into the model.
The selection of good or poor natural soil drainage should recognise that soils in road corridors can be highly modified, eg soils are compacted or use imported fill. Highway construction will generally compact local soils which will have low permeability irrespective of natural conditions. The model default is therefore set to ‘poor’.
28 Permeability is the rate that water moves through saturated soil (Newsome et al 2008).
124

Appendix A: Estimation of road traffic loads of copper and zinc
The ability to allow for natural soil drainage in the contaminant load model requires an equivalent set of LRFs. However there appears to be very little if any published LRF data for stormwater treatment devices that utilise natural soils in their construction (eg swales) where the effect of varying natural drainage on sediment removal efficiencies has been studied.
In the model, the presence of a type B or type C SWC triggers the need to reference the permeability class for the local area and return a value. Shapefiles for soil permeability are sourced from https://lris.scinfo.org.nz. For the case study area, the soil permeability class was shown to be predominantly M (Moderate) and therefore a nominal LRF of 0.3 was assigned to the model run.
For calculating contaminant loads in the case study, default of LRFs for type B SWCs (open road drains) and type C (natural drainage) were assigned in the model look-up table for poor and good natural drainage. A look-up table then assigns the relevant LRF to the affected road sections. The current model is future proofed to allow the user to change LRFs.
A5.4 Summary of LRFs used in the RSS model
A snapshot from the Excel model’s ‘calculation’ tab for assigning LRFs in the sections dealing with drainage, SWCs and natural soil drainage is given in figure A.2.
Figure A.2 Extract from load contamination model showing default LRFs
Note: under ‘Drainage’ in figure A.2, the default catchpit LRF has a value of 0.25 (shown as 1-LRF = 0.75). During RSS model runs for the case study the catchpit LRF was set to zero (no sediment removal) – see discussion in section A5.1 above.
A6 Estimating road traffic loads A6.1 Estimating VKT by sub-catchment
An initial step is to assign road sections in the network to the individual sub-catchments. Sections of road that extend outside the sub-catchment are truncated at the boundary and the length of road inside the sub-catchment recalculated. Daily VKT is calculated as the product of AADT and road length for each section (with annual load = daily VKT * 365). Figure A.3 is a screenshot from the Excel model that shows this step.
125
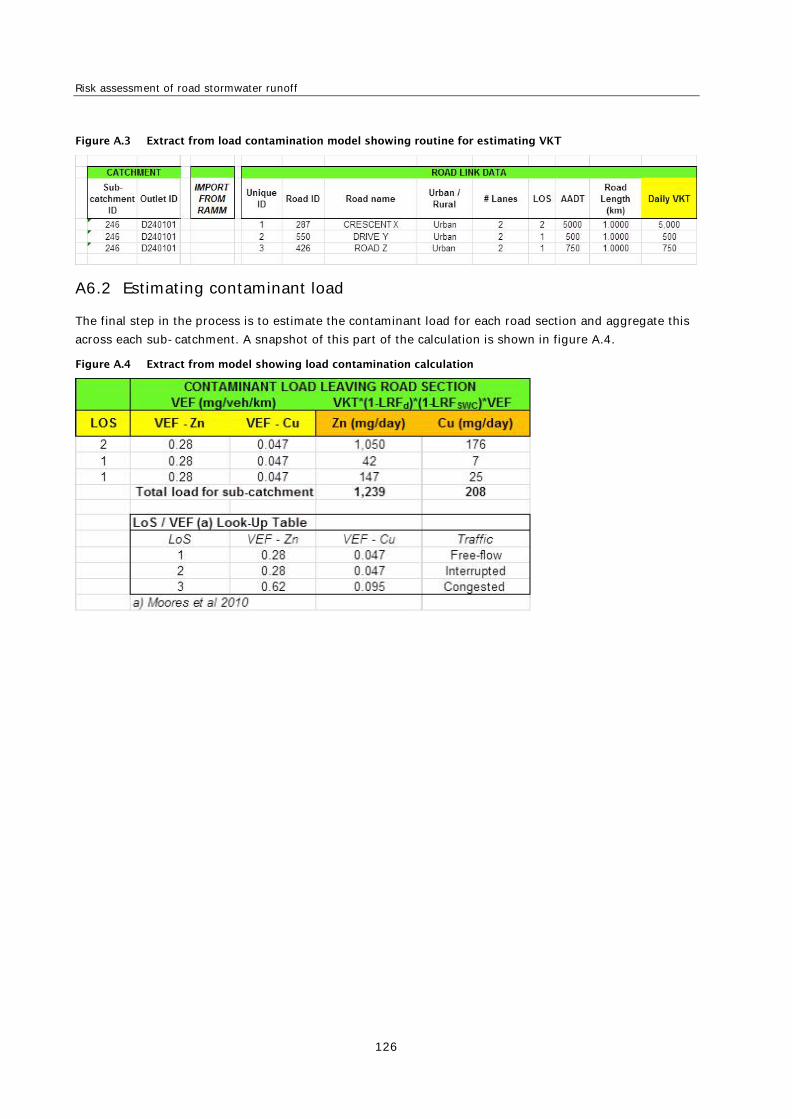
Risk assessment of road stormwater runoff
Figure A.3 Extract from load contamination model showing routine for estimating VKT
A6.2 Estimating contaminant load
The final step in the process is to estimate the contaminant load for each road section and aggregate this across each sub-catchment. A snapshot of this part of the calculation is shown in figure A.4.
Figure A.4 Extract from model showing load contamination calculation
126

Appendix B: Estimation of urban loads of copper and zinc
Appendix B: Estimation of urban loads of copper and zinc
B1 Introduction As described in section 4.3, annual loads of copper and zinc generated from urban non-road impervious surfaces are calculated as the product of the area of non-road impervious cover and copper and zinc yields for residential and industrial/commercial areas, respectively. Further details on the estimation of the areas of non-road impervious surfaces and the derivation of copper and zinc yields are provided below.
B2 Areas of non-road impervious surfaces The extent of urban land use within each REC sub-catchment is calculated from the LCDB4 spatial database. The database is provided as a GIS shapefile mapping the distribution of around 30 land cover classes, including a ‘built-up areas’ class. This is used to define the urban ‘footprint’ within each REC sub-catchment.
The non-road built-up area is then calculated by subtracting the areas of local roads and state highways from the total built-up in each sub-catchment. The road areas in each sub-catchment are estimated from the road network data specifying the lengths and widths of each road segment.
The ‘built-up areas’ class does not differentiate between the land uses in the urban footprint; however, the model uses two classes (residential and industrial/commercial) as a reflection of the different copper and zinc generating potential of each class. In this study, the areas of residential and industrial/commercial land uses were estimated from analysis of GIS-based aerial photography29. Within the case study area of Te Awarua-o-Porirua Harbour catchment it was relatively straightforward to visually identify areas of residential and non-residential land use respectively. GIS-based land use zoning information could also be used as a complementary source of information for this analysis.
The starting point for the estimation of imperviousness is Auckland Council’s CLM. This gives estimates of impervious fractions (excluding roads) for residential and industrial/commercial areas of 0.38 and 0.57, respectively (Auckland Regional Council 2010). While the method developed in the current study allows these values to be adopted, where additional information is available locally defined impervious fractions can be specified30.
In the case study application presented in this report it was found that residential areas included in the ‘built up’ land cover category included significant areas of urban grassland and trees. It was also found that adopting the CLM reference value for the impervious fraction resulted in a relatively high proportion of the total impervious area being roofs and paved surfaces (relative to roads, the total area of which was known independently from the road network data). This indicated that the non-road impervious areas (roofs and paved areas) were likely to be over-estimated, the consequence of which would be over-estimation of contaminant loads from these areas. Adopting a lower non-road impervious fraction of 0.2 for residential areas gave the result that roads make up approximately 30% of total imperviousness, which is consistent with the relativity between reference area fractions of roads and roofs/paved surfaces in the CLM.
29 Current Google Earth imagery (2015) 30 For instance, where a detailed mapping of impervious surfaces has been conducted.
127
Risk assessment of road stormwater runoff
For industrial/commercial areas a similar analysis indicated a level of imperviousness somewhat higher than the CLM reference value. An impervious fraction of 0.8 was adopted for these areas.
B3 Copper and zinc yields The starting point for the estimation of representative copper and zinc yields for residential and industrial/commercial non-road impervious surfaces is again Auckland Council’s CLM. The CLM specifies annual copper and zinc yields for each of nine roof classes and for residential, industrial and commercial paved areas. It also provides reference area fractions of a given area of residential, industrial or commercial land use occupied by each of the different types of roof and paved surfaces. Based on these yields and reference area fractions, the following weighted average copper and zinc yields were calculated:
• an annual copper yield of 0.016g m-2 and an annual zinc yield of 0.31g m-2 from non-road impervious surfaces in residential areas
• an annual copper yield of 0.036g m-2 and an annual zinc yield of 0.71g m-2 from non-road impervious surfaces in industrial/commercial areas.
These can be considered default yields for use in the RSS model, in the absence of any local information suggesting otherwise.
In the application of the method in this study, it was found that the ratio of total (road + urban) zinc to copper was markedly higher in load estimates using the default yields described above than has been observed in sediment samples taken from locations around the Pauatahanui Inlet (described in section 5.6.3). The Zn:Cu ratio in the estimated loads was around 17:1, compared with approximately 7:1 observed in sediment samples.
The predominant urban land use in the catchment of the inlet is residential land use. A possible explanation for the high Zn:Cu ratio in the load estimates from the default yields was the over-representation of high zinc-yielding roofing materials (unpainted and poorly painted galvanised steel) in the weighted-average zinc yield applying to residential areas. An alternative weighted average yield was calculated assuming that all residential roofs in the catchment of the inlet have been constructed with more recent, lower zinc-yielding materials such as concrete tiles, coated zinc/aluminium (Zincalume) and painted zinc/aluminium (Colorsteel/ColorCote). The calculation of zinc loads from residential areas using this alternative yield of 0.14g m-2 gave an overall Zn:Cu ratio of around 9:1, much closer to the observed ratio. This lower yield was therefore adopted for the estimation of the residential zinc loads in the case study application of the method.
Where local information to undertake this kind of calibration exercise is not available, the default copper and zinc yields can be adopted. Because the default zinc yield assumes the presence of CLM reference area fractions of high zinc-yielding roofing materials it is likely to lead to the overestimation of zinc in areas of more recent urban development where galvanised steel makes up little or none of the total area of roofs. The adoption of the default zinc yield can therefore be considered a conservative approach to the assessment of risk in these circumstances.
In addition, it is important to take account of the cautionary comments of the CLM’s developers in relation to uncertainty associated with certain of the yields, and especially those for paved surfaces, used in the derivation of the weighted averages described above (see section 2.3.1.2). That uncertainty is carried though into the estimates of urban loads of copper and zinc generated by the method described here. As a result, while the urban load estimates provide an appropriate basis for assessing the relative risk associated with non-road contaminant sources in different sub-catchments, the relative contribution of
128

Appendix B: Estimation of urban loads of copper and zinc
road and non-road sources of copper and zinc in any given sub-catchment estimated by this method should be considered indicative. While these load estimates provide a fit-for-purpose basis for supporting the risk assessment provided by the RSS model, any management response is likely to first require a targeted investigation of the relative importance of different contaminant sources in a given stormwater catchment.
129

Risk assessment of road stormwater runoff
Appendix C: Rivers and streams risk assessment
C1 Introduction As described in section 4.4, the assessment of risk to rivers and streams is based on the combination of:
• the contaminant strength (CS) score, reflecting in-stream concentrations of copper and zinc in the water column
• the receiving environment sensitivity (RES) score, reflecting condition bands associated with application of the macroinvertebrate community index.
Further details on the derivation of the above CS and RES scores are provided below.
C2 Calculation of in-stream copper and zinc concentrations For each REC reach, the mean in-stream concentrations of copper and zinc are calculated from the estimated annual loads (road-derived, urban or combined) delivered to that reach divided by the estimated mean annual flow for the reach.
The copper and zinc loads delivered to a reach are the accumulated load from the immediate REC sub-catchment and all upstream contributing sub-catchments. These accumulated loads are calculated by routing loads downstream from one sub-catchment to the next based on attribute data held in the REC database defining the connectivity between reaches (NZFNODE and NZTNODE identifiers). The routing of loads is performed by a macro in MS Excel, adopting the possibly conservative assumption of there being no attenuation (loss) of loads as they are transported down the river network.
The method uses mean annual flow rates previously estimated from annual precipitation and evapotranspiration for each REC reach in New Zealand (Woods et al 2006). These estimates were developed to provide flow data for ungauged catchments and have been found to compare favourably against measured runoff in gauged catchments (Woods et al 2006).
C3 Derivation of CS score As described in section 4.4, the derivation of the CS score takes account of the potential for the effects of copper and zinc to be ‘cumulative’, meaning that the presence of elevated concentrations of both metals has the potential to result in effects at lower concentration thresholds than if only one or the other metal was present. The assumption is adopted that their effects are additive, with the CS score based on comparison of CCUs (Hickey and Golding 2002) against thresholds derived from ANZECC 2000 water quality guideline values. The lower threshold is set at CCU = 1, equivalent to both copper and zinc being present at half their ANZECC 2000 99% level of protection concentrations31. The upper threshold is set at CCU = 2.367, equivalent to both copper and zinc being present at half their ANZECC 2000 95% level of protection concentrations32.
31 1.0µg L-1 copper and 2.4µg L-1 zinc, based on water hardness of 30mg L-1 CaCO3
32 1.4µg L-1 copper and 8.0µg L-1 zinc, based on water hardness of 30mg L-1 CaCO3
130

Appendix C: Rivers and streams risk assessment
It is important to note that the ANZECC 2000 99% and 95% level of protection values are used here to signal relative differences in the level of risk, not to provide an absolute assessment of risk. This is because the method uses mean annual concentrations of copper and zinc, giving an indication of the long term ‘average’ level of contamination of one stream reach compared with another. The use of ANZECC 2000 values to define ‘breakpoints’ between levels of risk aims to ground the method in an effects-based framework, providing a basis for its further development towards an absolute risk assessment methodology in the future. Further development of the method to provide for an absolute assessment of risk would involve determining appropriate threshold concentrations that reflect the effects of acute toxicity on stream organisms, and assessing the frequency and duration of any exceedance of these thresholds.
Having said that, those streams falling into the lowest risk class are assessed as having mean annual concentrations of copper and zinc which are together lower than a combined ANZECC 2000 99% level of protection value. There can be a reasonable level of confidence that streams falling into this risk class are not subject to the effects of elevated copper and zinc concentrations. There is arguably greater uncertainty over the extent of effects in streams falling into the higher risk classes – the method therefore provides a precautionary basis for identifying streams with higher risks and allowing the effort associated with an absolute assessment of risk to be targeted in these locations.
C4 Derivation of RES score As described in section 4.4, the RES score is assigned based on modelled MCI scores for each REC reach. The MCI scores were provided by Cawthron Institute from an earlier study for the Ministry for the Environment (Clapcott et al 2013). That study involved the prediction of MCI scores and a number of other macroinvertebrate metrics from a set of 23 variables representing catchment land use, water allocation pressure and environmental attributes. The environmental attributes included measures of geology, topography, slope, flow and flow influencing factors held in the Freshwater Ecosystems of New Zealand database (Leathwick et al 2010).
Clapcott et al (2013) reported a high degree of correlation (coefficient of 0.82) between predicted and observed MCI scores for a sample of around 200 sites across New Zealand. However, the authors caution that, while the model results are useful for summarising patterns at broad scales, they should not necessarily be expected to provide accurate predictions at a site level (J Clapcott, pers comm, 23 April 2015). While noting this caution, given the emphasis of the current study on the development of a high-level screening model for identifying relative risk, the modelled MCI scores are considered to be an appropriate metric for representing variations in receiving environment sensitivity.
The modelled MCI scores are predictions of the score that would be derived in the field using a method developed for hard-bottomed streams. This method has been found to understate the ecological condition of soft-bottomed streams (Stark and Maxted 2007). It is therefore necessary to apply different thresholds between MCI condition bands for hard and soft-bottomed reaches, respectively. For hard-bottomed streams, the MCI condition bands are excellent >120, good 100-120 and poor-fair <100. For soft-bottomed streams, the MCI condition bands are excellent >100, good 85-100 and poor-fair <85 (after Stark and Maxted 2007). Each REC reach was classified as hard or soft-bottomed based according to data held in the Freshwater Ecosystems of New Zealand database (noting that this data may not take account of changes to natural stream substrate conditions that have occurred as a result of land development). Reaches dominated by mud-sand substrates are classed as soft bottomed (Stark et al 2001).
131
Risk assessment of road stormwater runoff
Appendix D: Coasts and estuaries risk assessment
D1 Introduction As described in section 4.5, the assessment of risk to coastal receiving environments is based on the combination of:
• the contaminant strength (CS) score, reflecting the concentrations of copper and zinc in sediments delivered to the receiving environment
• the receiving environment sensitivity (RES) score, reflecting the extent to which depositional processes dominate.
Further details on the derivation of the above CS and RES scores are provided below.
D2 Calculation of sediment copper and zinc concentrations For each coastal discharge point, the concentrations of sediment copper and zinc are calculated from the estimated catchment loads (road-derived, urban or combined) of metals and sediment delivered from the contributing catchment.
There are two types of coastal discharge point: those corresponding with a REC stream mouth; and those that do not correspond with a REC stream mouth, such as a stormwater outlet. In the case of REC stream mouths, the annual copper and zinc loads delivered to each discharge point are the accumulated load from the immediate REC sub-catchment and all upstream contributing sub-catchments (as described in appendix C). Where a discharge point is not linked to the REC, the loads of copper and zinc are calculated for its immediate catchment area, using the methods for roads and urban areas described in sections 4.3.1 and 4.3.2, respectively.
Annual sediment loads are calculated using the CLUES model (Semadeni-Davies et al 2011) from data on soils, topography and land use in each REC sub-catchment. As with copper and zinc, in the case of REC stream mouths, the annual sediment loads delivered to each discharge point are the accumulated load from the immediate REC sub-catchment and all upstream contributing sub-catchments.
CLUES only runs in sub-catchments associated with a REC reach. This means that where a discharge point is not linked to the REC, the loads of sediment have to be calculated using an alternative method. In these instances, the sediment yields in neighbouring sub-catchments (which are part of the REC and modelled by CLUES) are assumed to be representative of the yield in the contributing catchment of the non-REC discharge point. The sediment load delivered to that point is then the representative yield multiplied by the catchment area of the non-REC discharge point.
While CLUES is a widely used model for estimating sediment loads, it is best-suited to rural and mixed land-use catchments where land covers such as pasture tend to be the dominant source of sediment. In predominantly urban catchments, CLUES is less sensitive to land use because different types of urban land cover, from areas of urban grassland to industrial land use, are all assigned the same sediment yield (Semadeni-Davies et al 2011). A potential improvement to the screening tool would be to improve sediment load estimation in predominantly urban catchments by developing separate sediment yields for residential impervious surfaces, industrial/commercial impervious surfaces and urban grasslands and
132

Appendix D: Coasts and estuaries risk assessment
trees from the CLM’s sediment yields. However, this modification would increase the complexity of the application of the method, possibly to a level that is not justified in the context of the use of the sediment load estimates for a relative risk assessment. In the event that the method is further developed to provide for an absolute assessment of risk, however, an investigation of the sensitivity of the risk assessment to variations in sediment load estimates would be warranted.
D3 Derivation of CS score As described in section 4.5, the derivation of the CS score takes account of the potential for the effects of copper and zinc to be ‘cumulative’, meaning that the presence of elevated concentrations of both metals has the potential to result in effects at lower concentration thresholds than if only one or the other metal was present. As with the rivers and stream risk assessment, the assumption is adopted that the effects of copper and zinc are additive, with the CS score based on comparison of CCUs (Hickey and Golding 2002) against threshold effects level (TEL) and probable effects level (PEL) concentrations (MacDonald et al 1996). The lower threshold is set at CCU = 1, equivalent to both copper and zinc being present at half their TEL concentrations33. The upper threshold is set at CCU = 4.1, equivalent to both copper and zinc being present at half their PEL concentrations34.
The TEL and PEL are widely used sediment quality guideline values derived from ecotoxicological studies which determined ‘no effects’ and ‘effects’ concentrations of a range of metals. While these guideline values are used here to signal relative rather than absolute differences in the level of risk, the use of the TEL and PEL guideline values to define ‘breakpoints’ between levels of risk aims to ground the method in an effects-based framework, providing a basis for its further development towards an absolute risk assessment methodology in the future. With that in mind, it should be noted that the TEL and PEL are more conservative (ie protective) than other guideline values, such as those of the ANZECC (2000) interim sediment quality guidelines. This conservative approach is consistent with the potential use of the risk assessment for screening purposes, allowing for further investigations and (if necessary) management responses to be implemented.
It should also be noted that the TEL and PEL values apply to sediments deposited in receiving environments, as opposed to suspended sediments at the point of discharge. Physical, chemical and biological processes operating in receiving environments may result in metal concentrations in deposited sediments differing from those in suspended sediments. However, reflecting the relative nature of this risk assessment, the method developed here assumes that relative differences between metal concentrations in suspended sediments at multiple points of discharge are preserved in differences between metal concentrations in deposited sediments. On that basis, metal concentrations in suspended sediments are assumed to be a surrogate for metal concentrations in deposited sediments.
D4 Derivation of RES score As described in section 4.5, the RES score is determined on the basis of whether the final discharge point (‘outlet’) is to a high, moderate or low depositional environment, taking account the nature of the receiving water body. Supplementary data (eg sedimentation plate monitoring) and/or expert judgement may assist in the evaluation.
33 18.7mg kg-1 copper and 124mg kg-1 zinc 34 108.2mg kg-1 copper and 271mg kg-1 zinc
133

Risk assessment of road stormwater runoff
A physical measure (depositional risk) is used to guide the assessment where published sedimentation rates are available for the waterbody. This measure was chosen in place of an ecological indicator as there is no systematic national database for classification of the sensitivity of coasts and estuaries. The proxy of depositional risk is relatively simple to understand, measurable and appropriate to the intent of the RSS model, ie approximating the long-term risk of stormwater discharges containing zinc/copper that may over time build up in estuarine sediments.
The RES score (0, 3 or 5) is chosen based on the following assessment of the discharge location (‘outlet’):
• High: strongly depositional/low energy environment, eg enclosed bays sheltered from wind/currents, muddy sub-tidal areas, wetlands, saltmarsh (RES score 5)
• Moderate: elevated depositional characteristics but less than ‘high’ (RES score 3)
• Low depositional: high energy environment, eg outlet discharging to sea, outer harbour or open coastline; lower estuary subject to flushing; open intertidal estuarine shoreline subject to strong wind/current dispersion (RES score 0).
Section 5.5.3 illustrates in practice how an RES score was allocated to each of the discharge outlets to Pauatahanui Inlet.
134

Appendix E: Note on RAMM data issues and remedies
Appendix E: Note on RAMM data issues and remedies
E1 Introduction
In the early stages of developing the RSS model, technical difficulties were found in using information held in the RAMM database that is essential for applying the model to local roads and state highways.
The issues were broadly grouped under two categories:
1) spatialisation of RAMM datasets for quantitative analysis (individual databases not linked to a common spatial datum)
2) presence of RAMM data errors and inconsistencies (eg duplicate links, SWC double ups, zero offsets, different naming conventions (coding) for SWCs for state highways and local roads).
Resolving the spatialisation issue was fundamental given that the research output was to comprise a GIS-based model. The presence of errors and inconsistencies raised the question of their significance on the estimated contaminant loads used in the model risk assessments. They also had a potential impact on the ability to run the model automatically on a large data set without manual intervention.
This appendix documents the issues with the RAMM data and a description of the solution found.
E2 Difficulties in spatialisation of RAMM data The core issue relating to difficulties in spatialising RAMM is that the carriageway and SWC databases do not have a common spatial datum.
Although the spatial relationship is visible in GIS and the carriageway and SWC datasets hold a road ID value that can provide a shared attribute, difficulties were encountered when building a consistent link between the two datasets for calculation purposes, ie assigning the correct traffic data to the correct SWC type as required by the contaminant load model.
Some example problems and their identified solutions are discussed below.
Example 1
Problem: During model development and application to state highways, some technical difficulties were found when spatially plotting SH58 from the RAMM data, particularly in identifying which road sections made up the state highway. For example, in plotting the SH58 carriageways it was apparent there were some gaps and missing sections at the western end (Paremata).
Solution: Solving this could not be completed by an automated process and required using a combination of road ID, displacement and sub-area fields (see also examples 2 and 3 below).
Example 2
Problem: A further issue occurred where separate road section elements/records held the same road ID. This meant in a number of cases that sub-catchments contained multiple carriageway elements with the same road ID. This made it difficult to ensure the correct traffic information was associated with the correct SWC and drainage elements.
Solution: This issue was solved by assigning a unique ID to each carriageway element once it had been plotted in GIS. The SWC elements were then linked to and associated with the carriageway elements using
135

Risk assessment of road stormwater runoff
a combination of the road ID and the ‘start’ and ‘end’ chainage for the SWC and carriageway records. Significant effort was spent developing the logic test (in Microsoft Excel) for this association so it could be applied in an automated manner; however, there were additional complications in RAMM that caused the logic test to fail in some cases.
Example 3
Problem: A further problem arose with SWC elements that did not start or finish at similar positions to the carriageway elements they were associated with by road ID. An example of this is shown in the GIS screenshots in figures E.1 and E.2 below.
Figure E.1 Screenshot from GIS layer in the RSS model showing overlapping SWC elements and SWC element
spanning multiple carriageway elements (original data)
136

Appendix E: Note on RAMM data issues and remedies
Figure E.2 Screenshot from GIS layer in the RSS model showing overlapping SWC elements and SWC element
spanning multiple carriageway elements (after truncation to fit sub- catchment)
The two screenshots show a section of SH58 traversing a number of sub-catchments. The centreline is dashed with the individual road sections coloured. The SWCs for each carriageway are shown by a solid line either side of the carriageway. Figure E.1 shows raw data from RAMM where a single SWC element spans multiple carriageway elements, not all with the same road ID. This becomes a problem when the SWC element is split by the sub-catchments (figure E.2) and is then grouped into a sub-catchment with a carriageway element that does not have the same road ID value. This is exacerbated if there is more than one carriageway element and SWC element in the catchment.
Solution: A logic test was initially developed to link the relevant carriageway and SWC in this example; however, it was later found to be more efficient to set up the model to flag such occurrences so they could be checked and dealt with manually.
E3 RAMM data errors and inconsistencies In developing the Excel model for estimating contaminant load in the case study area, a number of errors and inconsistences were identified with the RAMM data after these had been spatialised. Examples are discussed below with reference to figure E.3.
137
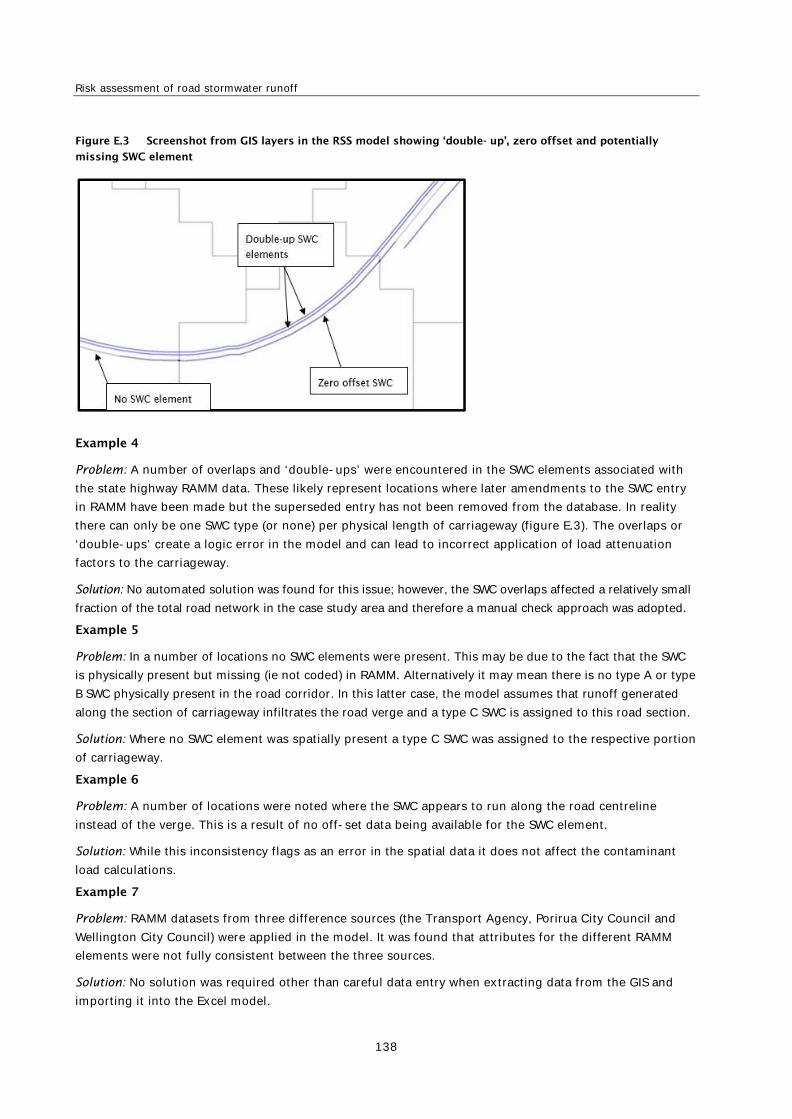
Risk assessment of road stormwater runoff
Figure E.3 Screenshot from GIS layers in the RSS model showing ‘double- up’, zero offset and potentially
missing SWC element
Example 4
Problem: A number of overlaps and ‘double-ups’ were encountered in the SWC elements associated with the state highway RAMM data. These likely represent locations where later amendments to the SWC entry in RAMM have been made but the superseded entry has not been removed from the database. In reality there can only be one SWC type (or none) per physical length of carriageway (figure E.3). The overlaps or ‘double-ups’ create a logic error in the model and can lead to incorrect application of load attenuation factors to the carriageway.
Solution: No automated solution was found for this issue; however, the SWC overlaps affected a relatively small fraction of the total road network in the case study area and therefore a manual check approach was adopted.
Example 5
Problem: In a number of locations no SWC elements were present. This may be due to the fact that the SWC is physically present but missing (ie not coded) in RAMM. Alternatively it may mean there is no type A or type B SWC physically present in the road corridor. In this latter case, the model assumes that runoff generated along the section of carriageway infiltrates the road verge and a type C SWC is assigned to this road section.
Solution: Where no SWC element was spatially present a type C SWC was assigned to the respective portion of carriageway.
Example 6
Problem: A number of locations were noted where the SWC appears to run along the road centreline instead of the verge. This is a result of no off-set data being available for the SWC element.
Solution: While this inconsistency flags as an error in the spatial data it does not affect the contaminant load calculations.
Example 7
Problem: RAMM datasets from three difference sources (the Transport Agency, Porirua City Council and Wellington City Council) were applied in the model. It was found that attributes for the different RAMM elements were not fully consistent between the three sources.
Solution: No solution was required other than careful data entry when extracting data from the GIS and importing it into the Excel model.
138

Appendix E: Note on RAMM data issues and remedies
E4 Conclusions and implications for model use In conclusion, a number of issues and inconsistencies were found with RAMM data during development of the contaminant load model. The issues were encountered when spatialising RAMM data and then extracting the relevant information for model calculations.
In some cases it was necessary to address the problem in order to be able to effectively run the model, for example the issue surrounding the association of carriageway elements with SWC elements. In other cases, such as the lack of offset data for SWC elements, this did not have a significant impact on the ability to run the model or its output.
For the majority of issues it was possible to develop solutions which allowed automatic processing of data. However for some problems (eg inconsistencies in SWC elements) it was more efficient to have the model flag the errors and then manually check the data and correct as necessary. For the case study area (Te Awarua-o-Porirua Harbour and catchments), it was found that this type of issue affected a relatively small fraction of the total road network.
The only significant implication of RAMM data issues for the model application is the additional time required to manually check the logic flag and adjust the data. As the model output is conservative, and has been designed for screening road networks, the presence of a relatively small number of inconsistencies due to RAMM data is considered unlikely to materially affect the output of the RSS model. Identifying an automatic process for remedying such issues would be preferable if the model was to be applied to a larger road network.
While the RSS model may be applied at a wider scale (eg regional networks), in the longer term the best option for avoiding such issues would be to develop a nationally consistent GIS/spatial version of RAMM.
139

Risk assessment of road stormwater runoff
Appendix F: Modelled loads and sediment concentrations of zinc and copper discharged to Pauatahanui Inlet and Onepoto Arm
Table F.1 Modelled loads of zinc and copper at each of the outlet discharge locations to Pauatahanui Inlet
140

Appendix F: Modelled loads and sediment concentrations of zinc and copper discharged to Pauatahanui Inlet and Onepoto Arm
Table F.2 Modelled sediment concentrations of zinc and copper at the REC catchment outlets to Pauatahanui Inlet
141
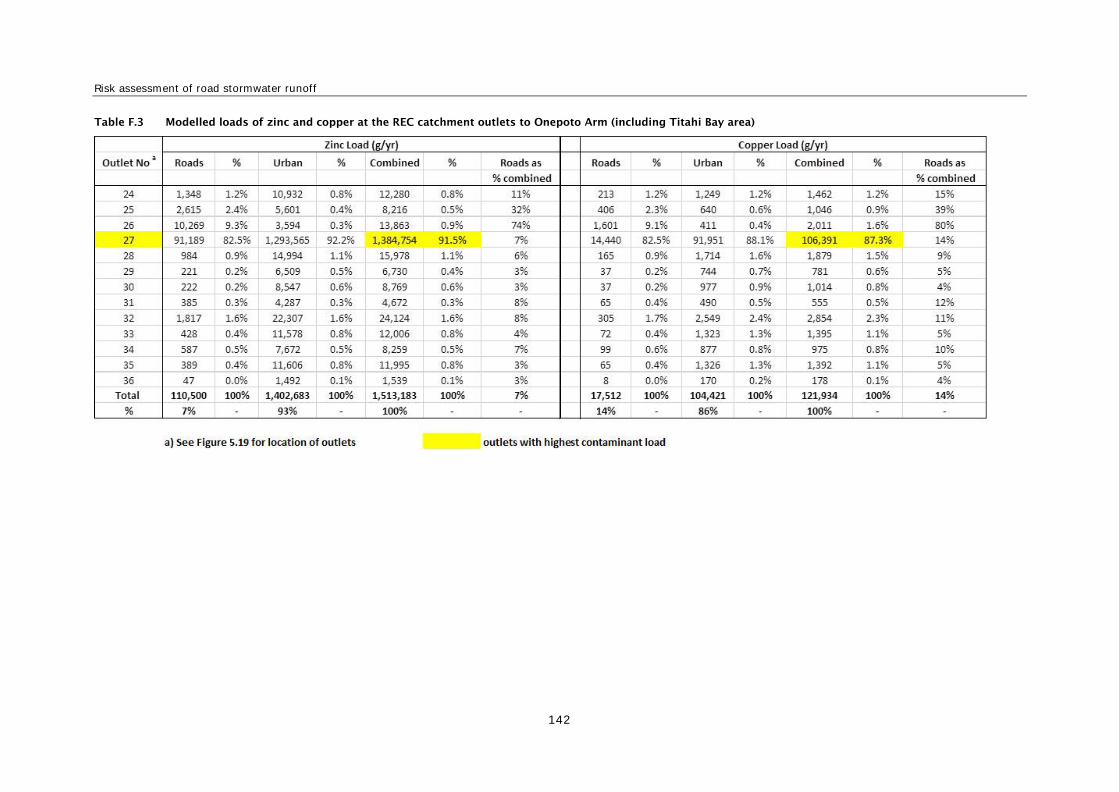
Risk assessment of road stormwater runoff
Table F.3 Modelled loads of zinc and copper at the REC catchment outlets to Onepoto Arm (including Titahi Bay area)
142

Appendix F: Modelled loads and sediment concentrations of zinc and copper discharged to Pauatahanui Inlet and Onepoto Arm
Table F.4 Modelled sediment concentrations of zinc and copper at the REC catchment outlets to Onepoto Arm (including Titahi Bay area)
143
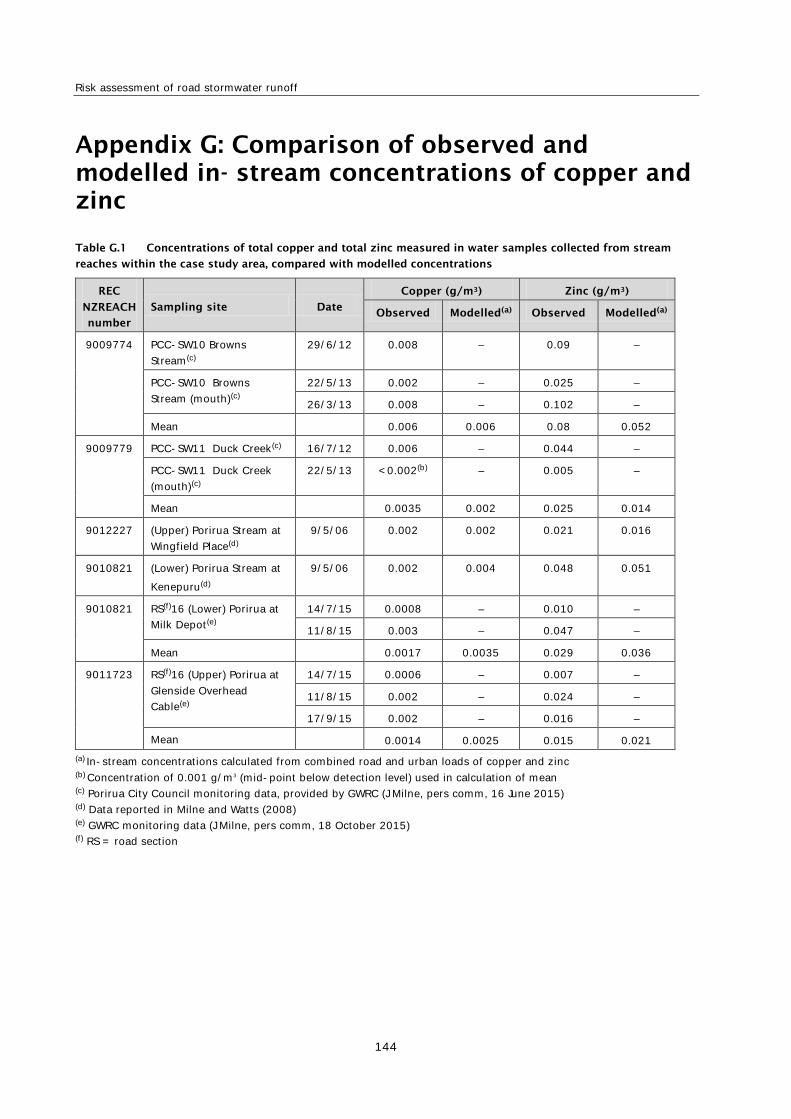
Risk assessment of road stormwater runoff
Appendix G: Comparison of observed and modelled in- stream concentrations of copper and zinc
Table G.1 Concentrations of total copper and total zinc measured in water samples collected from stream
reaches within the case study area, compared with modelled concentrations
REC
NZREACH
number
Sampling site Date
Copper (g/m3) Zinc (g/m3)
Observed Modelled(a) Observed Modelled(a)
9009774 PCC-SW10 Browns Stream(c)
29/6/12 0.008 – 0.09 –
PCC-SW10 Browns Stream (mouth)(c)
22/5/13 0.002 – 0.025 –
26/3/13 0.008 – 0.102 –
Mean 0.006 0.006 0.08 0.052
9009779 PCC-SW11 Duck Creek(c) 16/7/12 0.006 – 0.044 –
PCC-SW11 Duck Creek (mouth)(c)
22/5/13 <0.002(b) – 0.005 –
Mean 0.0035 0.002 0.025 0.014
9012227 (Upper) Porirua Stream at Wingfield Place(d)
9/5/06 0.002 0.002 0.021 0.016
9010821 (Lower) Porirua Stream at Kenepuru(d)
9/5/06 0.002 0.004 0.048 0.051
9010821 RS(f)16 (Lower) Porirua at Milk Depot(e)
14/7/15 0.0008 – 0.010 –
11/8/15 0.003 – 0.047 –
Mean 0.0017 0.0035 0.029 0.036
9011723 RS(f)16 (Upper) Porirua at Glenside Overhead Cable(e)
14/7/15 0.0006 – 0.007 –
11/8/15 0.002 – 0.024 –
17/9/15 0.002 – 0.016 –
Mean 0.0014 0.0025 0.015 0.021 (a) In-stream concentrations calculated from combined road and urban loads of copper and zinc (b) Concentration of 0.001 g/m3 (mid-point below detection level) used in calculation of mean (c) Porirua City Council monitoring data, provided by GWRC (J Milne, pers comm, 16 June 2015) (d) Data reported in Milne and Watts (2008) (e) GWRC monitoring data (J Milne, pers comm, 18 October 2015) (f) RS = road section
144

Appendix H: Glossary
Appendix H: Glossary
AADT annual average daily traffic
ANZECC Australian and New Zealand Environment and Conservation Council
ANZECC 2000 Australian and New Zealand Guidelines for Fresh and Marine Water Quality
C-CALM catchment contaminant annual loads model
CCU cumulative criterion unit
CLM contaminant load model
CLUES catchment land use for environmental sustainability (model)
CS contaminant strength (score)
Cu copper
DEQR design effluent quality requirement
EMC event mean concentration
EQS Environmental Quality Standards (UK)
FMUs freshwater management units
g/yr grams per year
GIS geographic information system
GWRC Greater Wellington Regional Council
HAWRAT Highways Agency water risk assessment tool
HCGA high contaminant generating activities
LoS level of service
LRF load reduction factor
MCI macroinvertebrate community index
mg/kg milligrams per kilogram
mg/veh-km milligrams per vehicle kilometre
MWH MWH New Zealand Ltd
NIWA National Institute of Water and Atmospheric Research Ltd
NPS-FM National Policy Statement for Freshwater Management 2014
NZCPS New Zealand Coastal Policy Statement
PCC Porirua City Council
PEL probable effects level
PI pollution index
PMI pollution mitigation index
PNRP Proposed Natural Resources Plan (for Wellington region)
RAMM Road Assessment and Maintenance Management (database)
RCA road controlling authority
REC river environment classification
145

Risk assessment of road stormwater runoff
RES receiving environment sensitivity
RfP Request for Proposals
RMA Resource Management Act 1991
RSS road stormwater screening (model)
SELDM stochastic empirical loading and dilution model
SH state highway
SMAF stormwater management area: flow
SPI site pollution index
SQG sediment quality guidelines
SWC stormwater channel
TEL threshold effects level
UALS unit area loads
UKHA UK Highways Agency
US EPA US Environmental Protection Agency
US FHWA US Federal Highway Authority
VCLM vehicle contaminant load model
VEF vehicle emission factor
VFEM-W vehicle emissions model for water
VKT vehicle kilometres travelled
Whaitua catchment areas
WIP Whaitua Implementation Programme
Zn zinc
146