research report 377 - health and safety executive · bobcat 130 compact skid steer loader 2.22...
TRANSCRIPT

HSEHealth & Safety
Executive
Evaluation of whole-body vibrationexposures in British industry
Prepared by the University of Southamptonfor the Health and Safety Executive 2005
RESEARCH REPORT 377

HSEHealth & Safety
Executive
Evaluation of whole-body vibrationexposures in British industry
M G R TowardT P Gunston
M J GriffinInstitute of Sound and Vibration Research
University of SouthamptonSouthampton
SO17 1BJ
This report describes measurements of whole-body vibration on eight excavators and two compactskid-steer loaders. Of the excavators, four were fitted with impact hammers, two with hydrauliccrushers, one with a backhoe shovel and one with steel shears.
Accelerations were measured on the seat surface and on the floor within the operators’ cabs of themachines in accordance with ISO 2631 (1997). The data have been evaluated in the context of thelevels set out in the European Union Physical Agents (Vibration) Directive (2002/44/EC). The reportprovides predicted daily vibration exposure for each machine. The effects of machine operation andother parameters on the vibration exposures are also considered.
This report and the work it describes were funded by the Health and Safety Executive (HSE). Itscontents, including any opinions and/or conclusions expressed, are those of the authors alone and donot necessarily reflect HSE policy.
HSE BOOKS

ii
© Crown copyright 2005
First published 2005
ISBN 0 7176 6155 5
All rights reserved. No part of this publication may bereproduced, stored in a retrieval system, or transmitted inany form or by any means (electronic, mechanical,photocopying, recording or otherwise) without the priorwritten permission of the copyright owner.
Applications for reproduction should be made in writing to:Licensing Division, Her Majesty's Stationery Office, St Clements House, 2-16 Colegate, Norwich NR3 1BQ or by e-mail to [email protected]

ACKNOWLEDGEMENTS
This report and the work it describes were funded by the Health and Safety Executive. Its
contents, including any opinions and/or conclusions expressed, are those of the authors alone
and do not necessarily reflect HSE policy.
iii

iv
SUMMARY
This report describes measurements of whole-body vibration on eight excavators and two
compact skid-steer loaders. Of the excavators, four were fitted with impact hammers, two with
hydraulic crushers, one with a backhoe shovel and one with steel shears.
Accelerations were measured on the seat surface and on the floor within the operators’ cabs of
the machines in accordance with ISO 2631 (1997). The data have been evaluated in the context
of the levels set out in the European Union Physical Agents (Vibration) Directive (2002/44/EC).
The report provides predicted daily vibration exposure for each machine. The effects of machine
operation and other parameters on the vibration exposures are also considered.
v

vi

CONTENTS
1 INTRODUCTION.............................................................................................................. 1
1.1 Description of test machines ..................................................................................... 1
1.2 Description of test sites .............................................................................................. 1
2 METHODS AND PROCEDURES ................................................................................... 5
2.1 Location and direction of measurements................................................................. 5
2.2 Transducers................................................................................................................ 5
2.3 Data acquisition ......................................................................................................... 5
3 RESULTS............................................................................................................................ 5
3.1 Vibration measures.................................................................................................... 6
3.2 Vibration exposures................................................................................................... 9
3.3 Machine operating patterns .................................................................................... 10
3.3.1 Bobcat 130............................................................................................................. 10
3.3.2 Bobcat 753............................................................................................................. 10
3.3.3 Kubota KX71-2 ................................................................................................... 11
3.3.4 Kubota KX161-3 (impact hammer)....................................................................... 11
3.3.5 Hitachi EX60LC-5 (impact hammer) .................................................................... 12
3.3.6 Hitachi ZX460LCH (impact hammer) .................................................................. 12
3.3.7 Hitachi EX60LC-5 (hydraulic crusher) ................................................................. 12
3.3.8 Hitachi EX455 (hydraulic crusher)........................................................................ 13
3.3.9 Case CX210 (Backhoe shovel).............................................................................. 13
3.3.10 Hitachi ZX460LCH (steel shears)..................................................................... 13
4 DISCUSSION ................................................................................................................... 14
4.1 Machine TYPE......................................................................................................... 14
4.2 Machine tool ............................................................................................................. 14
4.3 Machine operation ................................................................................................... 14
4.4 Seat performance ..................................................................................................... 15
4.5 Comparison with EU 2002/44/EC exposure levels ................................................ 15
5 CONCLUSIONS............................................................................................................... 16
vii

6 REFERENCES ................................................................................................................. 17
ANNEX A: BOBCAT 130 MEASURED 24TH
NOVEMBER 2004....................................... 18
ANNEX B: BOBCAT 753 MEASURED 19TH
NOVEMBER 2004....................................... 24
ANNEX C: KUBOTA KX71-2 MEASURED 12TH
NOVEMBER 2004 ............................ 30
ANNEX D: KUBOTA KX161-3 MEASURED 24TH
NOVEMBER 2004............................. 36
ANNEX E: HITACHI EX60LC-5 MEASURED 19TH
NOVEMBER 2004.......................... 42
ANNEX F: HITACHI ZX460LCH MEASURED 24TH
NOVEMBER 2004 ........................ 48
ANNEX G: HITACHI EX60LC MEASURED 24TH
NOVEMBER 2004 ............................ 54
ANNEX H: HITACHI EX455 MEASURED 9TH
DEC 2004 ................................................. 60
ANNEX I: CASE CX210 MEASURED 9TH
DECEMBER 2004........................................... 67
ANNEX J: HITACHI ZX460LCH MEASURED 22ND
DECEMBER 2004......................... 73
SUMMARY REPORT FORM: PART 5 – RESULTS .......................................................... 76
viii

1 INTRODUCTION
Measurements of vibration were carried out by the Human Factors Research Unit of the
Institute of Sound and Vibration Research on 10 demolition machines during the period
November to December 2004. The vibration exposures of the machine operators were
assessed in the context of the exposure action values and exposure limit values in the
European Union Physical Agents (Vibration) Directive (2002/44/EC). The effects of machine
type, machine tool, machine operation and the performance of the seats fitted in the machines
have also been considered.
1.1 DESCRIPTION OF TEST MACHINES
Whole-body vibration measurements were made on 10 demolition machines: 8 excavators
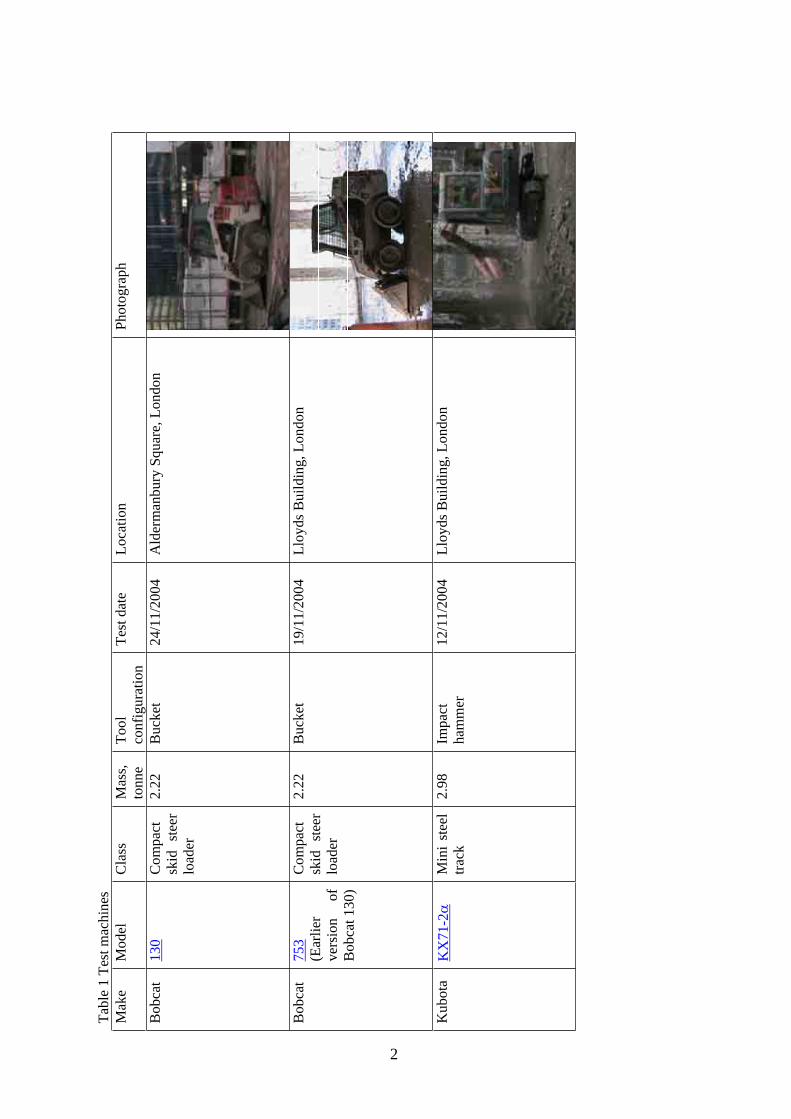
and 2 skid-steer loaders. The machines are summarised in Table 1 and further details of the
machines are given in the annexes. Where available, manufacturer specifications are available
by clicking on the ‘Model’ in Table 1. The excavators ranged in weight from 2.98 to 47.4
tonnes. Of the excavators, four were fitted with impact hammers, two with hydraulic crushers,
one with a backhoe bucket, and one with steel shears. All of the excavators were fitted with
steel tracks. The skid-steer loaders were fitted with solid rubber tyres and a bucket. The skid-
steers loaders weighed 2.22 tonnes.
1.2 DESCRIPTION OF TEST SITES
Vibration tests were conducted on three demolition sites:
Lloyds Building, London. This was a large multi-story building in central London. The
building was being demolished from the top down on a floor-by-floor basis. The
measurements were being made towards the end of demolition of the building. There were up
to twelve demolition machines operating on site.
Aldermanbury Square, London. This was high-rise office block with a relatively small
footprint in Central London. The upper floors of the tower block were being demolished
during the measurements. There were up to five demolition machines operating on site.
Chatham Street Car Park, Reading. This was a large multi-storey car park in the centre of
Reading. The majority of the building had already been demolished; a small section of the
car-park and concrete floor slab were being demolished during the measurements. There were
three machines operating on site.
Dock Gate 9, Southampton. This was the site of some disused grain silos. The grain silos were
been cut-up and dismantled during the measurements. There were two machines operating on
site during the measurements.
1
Tab
le 1
Tes
t m
ach
ines
Mak
eM
odel
Cla
ssM
ass,
ton
ne
To
ol
con
fig
ura
tio
n
Tes
t d
ate
Lo
cati
on
Ph
oto
gra
ph
Bo
bca
t1
30
Co
mp
act
skid
st
eer
load
er
2.2
2B
uck
et2
4/1
1/2
00
4A
lder
man
bu
ry S
qu
are,
Lo
nd
on
Bo
bca
t7
53
(Ear
lier
ver
sio
n
of
Bo
bca
t 1
30
)
Co
mp
act
skid
st
eer
load
er
2.2
2B
uck
et1
9/1
1/2
00
4L
loy
ds
Bu
ild
ing
, L
on
do
n
Ku
bo
taK
X7
1-2
Min
i st
eel
trac
k
2.9
8Im
pac
t
ham
mer
12
/11
/20
04
Llo
yd
s B
uil
din
g,
Lo
nd
on
2

Ku
bo
taK
X1
61
-3M
idi
stee
l
trac
k
5.1
0Im
pac
t
ham
mer
24
/11
/20
04
Llo
yd
s B
uil
din
g,
Lo
nd
on
Hit
ach
iE
X6
0L
C-5
Mid
i st
eel
trac
k
6.3
9Im
pac
t
ham
mer
19
/11
/20
04
Llo
yd
s B
uil
din
g,
Lo
nd
on
Hit
ach
iZ
X4
60
LC
HC
raw
ler
stee
l tr
ack
47
.4Im
pac
t
ham
mer
24
/11
/20
04
Ch
ath
am S
tree
t C
ar P
ark
, R
ead
ing
Hit
ach
iE
X6
0-L
C5
Mid
i st
eel
trac
k
6.9
2H
yd
rau
lic
cru
sher
24
/11
/20
04
Ald
erm
anb
ury
Sq
uar
e, L
on
do
n
3

Hit
ach
iE
X4
55
Cra
wle
r
stee
l tr
ack
47
.0H
yd
rau
lic
cru
sher
09
/12
/20
04
Ch
ath
am S
tree
t C
ar P
ark
, R
ead
ing
Cas
eC
X2
10
Cra
wle
r
stee
l
traa
ck
20
.9B
ack
ho
e
sho
vel
09
/12
/20
04
Ch
ath
am S
tree
t C
ar P
ark
, R
ead
ing
Hit
ach
iZ
X4
60
LC
HC
raw
ler
stee
l tr
ack
47
.4S
teel
cu
tter
s D
ock
Gat
e 9
, S
ou
tham
pto
n
4

2 METHODS AND PROCEDURES
The tests were conducted to determine the vibration exposure of operators of each of the
machines. Vibration exposures were calculated according to the methods described in the
European Union Physical Agents (Vibration) Directive (2002/44/EC).
2.1 LOCATION AND DIRECTION OF MEASUREMENTS
Vibration was assessed for the driver of each of the machines.
Seat vibration was measured using SIT-pads placed on the seat surface and attached to the
seat backrest. The backrest SIT-pad was attached close to the base of the backrest to
maximise the period the driver remained in contact with the transducer over the measurement
period.
Vibration on the cab floor was measured using three accelerometers mounted on an
aluminium block (40 mm x 40 mm x 25 mm) aligned with each of the three principal
translational axes of the machine. The transducer block was affixed to the machine floor.
2.2 TRANSDUCERS
Vibration on the seat surface, beneath the ischial tuberosities of the operator, was measured
using an HVLab tir-axial SIT-pad containing three Entran EGCSY-240D-10 10g piezo-
resistive accelerometers.
Vibration at the interface between the seat backrest and the operator was measured using a
single-axis HVLab SIT-pad containing an EGCSY-240D-10 10g, piezo-resistive
accelerometer.
Vibration on the cab floor was measured using Entran EGCS-DO-101/V10/L4M 10g piezo-
resistive accelerometers.
In this report, the fore-and-aft (surge) direction is referred to as the x-axis, the side-to-side
(sway) direction is referred to as the y-axis, and the vertical (heave) direction is referred to as
the z-axis.
2.3 DATA ACQUISITION
A PC-based system was used to acquire the transducer signals. The 9-channel system
comprised a laptop PC with a Measurement Computing DAS16/16 PCMCIA data acquisition
board in conjunction with a signal-conditioning box providing offset and gain control and a
low-pass filter box. The low-pass filtering was set to 100 Hz to prevent aliasing of the signals.
Data were sampled at 400 samples per second. Signals from the accelerometers were digitised
and stored using the HVLab toolbox (version 1.1) running under MATLAB (version 7.0). The
acquisition system was set to sample the seven input channels simultaneously during the
measurement period. The acquisition process and subsequent analysis of the data were carried
out using MATLAB (version 7.0) and functions in the HVLab (version 1.1) and MATLAB
signal processing (version 6.2) toolboxes.
3 RESULTS
Vibration exposures were calculated for each of the machines; a summary of the data is given
in Table 2 (Section 3.2). Comprehensive data sets for each machine can be found in the
Annexes. An explanation of the vibration measures in the tables is given in Section 3.1. The
operating patterns of each of the machines and illustrative video clips are given in Section 3.3.
5
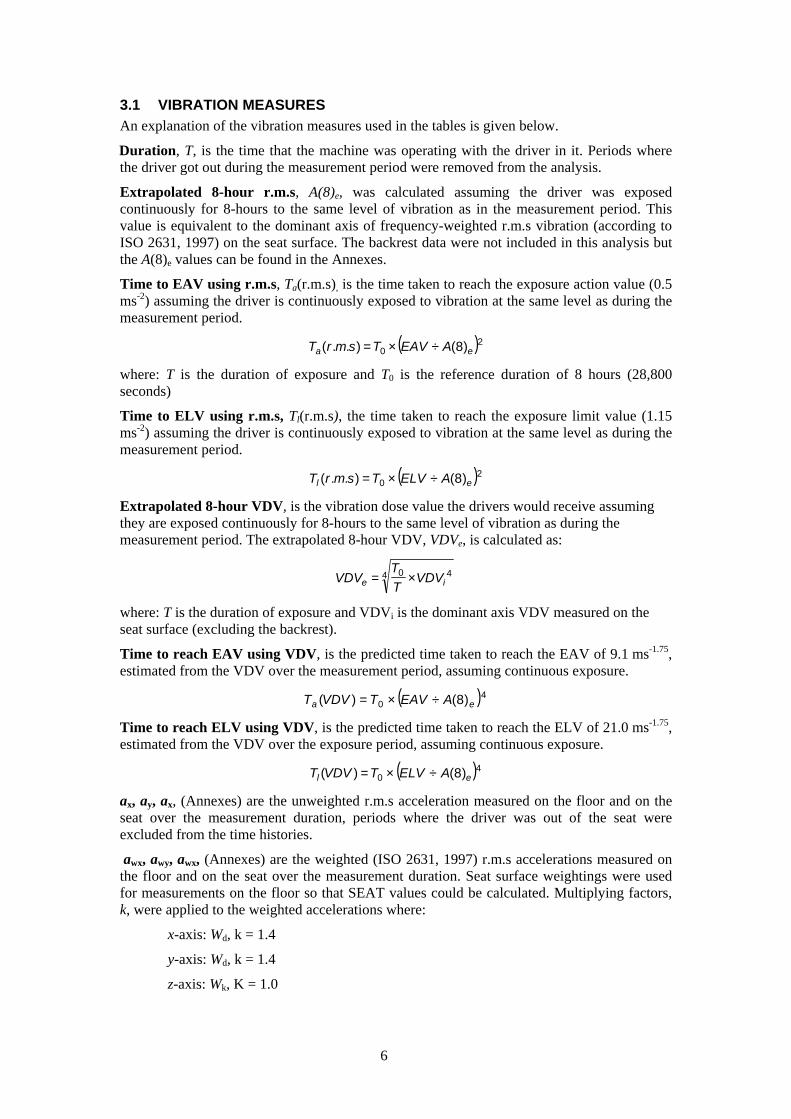
3.1 VIBRATION MEASURES
An explanation of the vibration measures used in the tables is given below.
Duration, T, is the time that the machine was operating with the driver in it. Periods where
the driver got out during the measurement period were removed from the analysis.
Extrapolated 8-hour r.m.s, A(8)e, was calculated assuming the driver was exposed
continuously for 8-hours to the same level of vibration as in the measurement period. This
value is equivalent to the dominant axis of frequency-weighted r.m.s vibration (according to
ISO 2631, 1997) on the seat surface. The backrest data were not included in this analysis but
the A(8)e values can be found in the Annexes.
Time to EAV using r.m.s, Ta(r.m.s), is the time taken to reach the exposure action value (0.5
ms-2) assuming the driver is continuously exposed to vibration at the same level as during the
measurement period.
( )20 )8(÷×=)..( ea AEAVTsmrT
where: T is the duration of exposure and T0 is the reference duration of 8 hours (28,800
seconds)
Time to ELV using r.m.s, Tl(r.m.s), the time taken to reach the exposure limit value (1.15
ms-2) assuming the driver is continuously exposed to vibration at the same level as during the
measurement period.
( )20 )8(÷×=)..( el AELVTsmrT
Extrapolated 8-hour VDV, is the vibration dose value the drivers would receive assuming
they are exposed continuously for 8-hours to the same level of vibration as during the
measurement period. The extrapolated 8-hour VDV, VDVe, is calculated as:
4 40×= ie VDV
T
TVDV
where: T is the duration of exposure and VDVi is the dominant axis VDV measured on the
seat surface (excluding the backrest).
Time to reach EAV using VDV, is the predicted time taken to reach the EAV of 9.1 ms-1.75,
estimated from the VDV over the measurement period, assuming continuous exposure.
( )40 )8(÷×=)( ea AEAVTVDVT
Time to reach ELV using VDV, is the predicted time taken to reach the ELV of 21.0 ms-1.75,
estimated from the VDV over the exposure period, assuming continuous exposure.
( )40 )8(÷×=)( el AELVTVDVT
ax, ay, ax, (Annexes) are the unweighted r.m.s acceleration measured on the floor and on the
seat over the measurement duration, periods where the driver was out of the seat were
excluded from the time histories.
awx, awy, awx, (Annexes) are the weighted (ISO 2631, 1997) r.m.s accelerations measured on
the floor and on the seat over the measurement duration. Seat surface weightings were used
for measurements on the floor so that SEAT values could be calculated. Multiplying factors,
k, were applied to the weighted accelerations where:
x-axis: Wd, k = 1.4
y-axis: Wd, k = 1.4
z-axis: Wk, K = 1.0
6

SEATawx, SEATawy, SEATawz. (Annexes) SEAT values (seat effective amplitude
transmissibility) are non-dimensional measures of the ability of a seat to isolate the body from
vibration in each of the orthogonal directions. The values here have been calculated as the
weighted r.m.s acceleration measured on the seat divided by the weighted r.m.s acceleration
measured on the floor.
VDVx, VDVy, VDVz (Annexes) are the vibration dose values measured on the floor and on the
seat in each of the orthogonal directions. The vibration dose value is a cumulative measure of
the vibration received by a person during the measurement period:
4/1
0
4 )(Tt
t
w dttaVDV
SEATVDVx, SEATVDVy, SEATVDVz. (Annexes) SEAT values (seat effective amplitude
transmissibility) are non-dimensional measures of the ability of a seat to isolate the body from
vibration in each of the orthogonal directions. The values here have been calculated as the
VDV measured on the seat divided by the VDV measured on the floor.
Power spectral density. (Annexes) The unweighted acceleration power spectral density
(PSD) was calculated separately for each of the seven acceleration time histories (seat base x,
y and z, seat surface x, y and z and backrest x) recorded for each machine. The frequency-
weighted acceleration power spectral density was also calculated for the seat surface and
backrest accelerometers including the effect of the appropriate multiplying factor for each
axis and location.
The power spectral densities were calculated using Welch’s modified periodogram method.
Each time history was divided up into Hamming-windowed 4096-point Fourier transforms
with 50% overlap. The power spectral densities were calculated from the modified
periodogram of each overlapping section:
2
1
2
1
n
q
q
n
q
qj
j
w
eaw
eS
where the modified periodogram of each overlapping section S(ej ) was given by the length of
the Fourier transform, n, the Hamming window, w, and the section of the digitised time
history, a. The resulting periodograms were averaged and then divided by the sampling rate of
the digitised time history to give the power spectral density. Each power spectral density had
a frequency resolution of 0.10 Hz. The number of degrees of freedom of each power spectral
density is shown in the appropriate figure caption.
Transfer function and coherence. (Annexes) The transfer function between the acceleration
time histories recorded at the seat base and those recorded at the seat surface were calculated
separately for each orthogonal axis (x, y, and z). The transfer functions were calculated using
the cross spectral density (CSD) method where the linear transfer function, H(ej ), was
calculated from the cross spectral density between the seat base acceleration and the seat
surface acceleration Pbc, and the power spectral density of the seat base acceleration Pbb:
j
bb
j
bcj
eP
ePeH
Welch’s method was used to calculate both the power spectral densities and cross spectral
densities, with each time history divided up into Hamming-windowed 4096-point Fourier
transforms with 50% overlap. The power spectral density, Pbb, was calculated as described in
the preceding section. The cross spectral density, Pbc, was calculated from:
7

n
q
q
n
q
qj
n
q
qj
j
w
ebwecw
eS
1
2
*
11
where the modified periodogram of each overlapping section S(ej ) was given by the length of
the Fourier transform, n, the Hamming window, w, and the section of the digitised time
histories at the seat base, b, and at the seat cushion, c. The resulting periodograms were
averaged and then divided by the sampling rate of the digitised time history to give the cross
spectral density. The resolution of the transfer functions was 0.10 Hz.
The coherence, Cbc, was calculated from the power spectral density at the seat base, Pbb, and
that at the seat cushion surface, Pcc, and the cross spectral density between the seat base and
the cushion surface, Pbc, according to:
( ))()(
)(=
2
jcc
jbb
jbcj
bcePeP
ePeC
Frequency-weighted time history and running root-mean-square average. (Annexes) The
frequency-weighted acceleration recorded at the seat surface, including the relevant multi-
plying factor, was calculated and is shown graphically. The running root-mean-square (r.m.s)
average of the frequency-weighted acceleration recorded at the seat surface was also
calculated:
2
2
21
nm
nmq
qm cn
r
where the root-mean-square acceleration, r, in the vicinity of data point, m, was calculated
from the frequency-weighted seat cushion acceleration, c, over a sample of n data points
equally distributed before and after point m. The calculation was performed using n=4000 and
evaluating r for values of m at intervals of n/2. This resulted in each value of r being
calculated from a 10-second sample of data and each 10-second sample overlapping the
previous sample by 50%.
The sample length of 10 seconds was arbitrarily selected to calculate the running RMS to aid
the identification of tasks for the particular machines investigated where unusually high
vibration was observed as compared with the remainder of the observed operating period. A
10-second moving average with a 50% overlap was estimated to be of the right order of
magnitude to differentiate between different parts of a working cycle (e.g. loading, travelling,
unloading, hammering, trimming) for the particular machines studied while still having the
capability to capture a complete part of the cycle (e.g. filling the bucket of a small loader by
pushing the machine into a rubble pile and then lifting the shovel).
The choice of 10 seconds for the averaging period was arbitrary and intended to aid in the
identification of machine tasks. It was not intended to have any quantitative relevance to the
assessment of the vibration exposure of the machine operator.
8

3.2
V
IBR
AT
ION
EX
PO
SU
RE
S
Ta
ble
2 V
ibra
tio
n e
xp
osu
res
Mac
hin
e
mak
e
Mac
hin
e
mo
del
To
ol
Du
rati
on
Ex
trap
ola
ted
8-
ho
ur
VD
V
(hh
:mm
:ss)
(ms-1
.75)
Tim
e to
EA
V u
sin
g
VD
V
(hh
:mm
:ss)
Tim
e to
EL
V u
sin
g
VD
V
(hh
:mm
:ss)
Ex
trap
ola
ted
8-h
ou
r r.
m.s
(ms-2
)
Tim
e to
EA
V u
sin
g
r.m
.s
(hh
:mm
:ss)
Tim
e to
EL
V u
sin
g
r.m
.s
(hh
:mm
:ss)
Bobca
t130
Bu
cket
00
:36
:05
21.8
20
0:1
4:3
10
6:5
1:0
00
.88
02
:35
:54
13
:44
:41
Bobca
t753
Bu
cket
00
:34
:30
22.1
70
0:1
3:3
70
6:2
6:0
01
.01
01
:58
:11
10
:25
:09
Ku
bo
taK
X71
-2a
Imp
act
ham
mer
0
1:0
5:2
61
8.0
90
0:3
0:4
51
4:3
2:0
00
.76
03
:29
:01
18
:25
:40
Ku
bo
taK
X16
1-3
Imp
act
ham
mer
0
1:4
6:4
31
7.1
60
0:3
7:5
51
7:5
5:2
80
.73
03
:45
:11
19
:51
:12
Hit
ach
iE
X6
0L
C-5
Imp
act
ham
mer
0
1:5
1:4
91
5.3
90
0:5
8:4
42
7:4
5:3
20
.66
04
:32
:08
23
:59
:37
Hit
ach
iZ
X4
60
LC
HIm
pac
t h
amm
er
02
:02
:09
17.3
50
0:3
6:1
71
7:0
9:0
50
.80
03
:07
:25
16
:31
:24
Hit
ach
iE
X6
0L
C-5
Hy
dra
uli
c cr
ush
er0
1:4
4:3
71
3.9
00
1:2
8:1
01
7:4
0:2
60
.58
05
:52
:08
<2
4
Hit
ach
iE
X455
Hy
dra
uli
c cr
ush
er0
1:2
1:5
31
2.7
60
2:0
4:0
25
8:3
7:3
40
.46
09
:32
:34
<2
4
Cas
eC
X210
Bac
kh
oe
sho
vel
0
2:0
7:1
61
0.8
40
3:5
8:0
51
12
:32
:19
0.4
60
9:2
6:3
2<
24
Hit
ach
iZ
X4
60
LC
HS
teel
cu
tter
s 0
1:2
9:1
54
.94
91
:50
:12
26
04
:31
:12
0.2
0<
24
<2
4
9
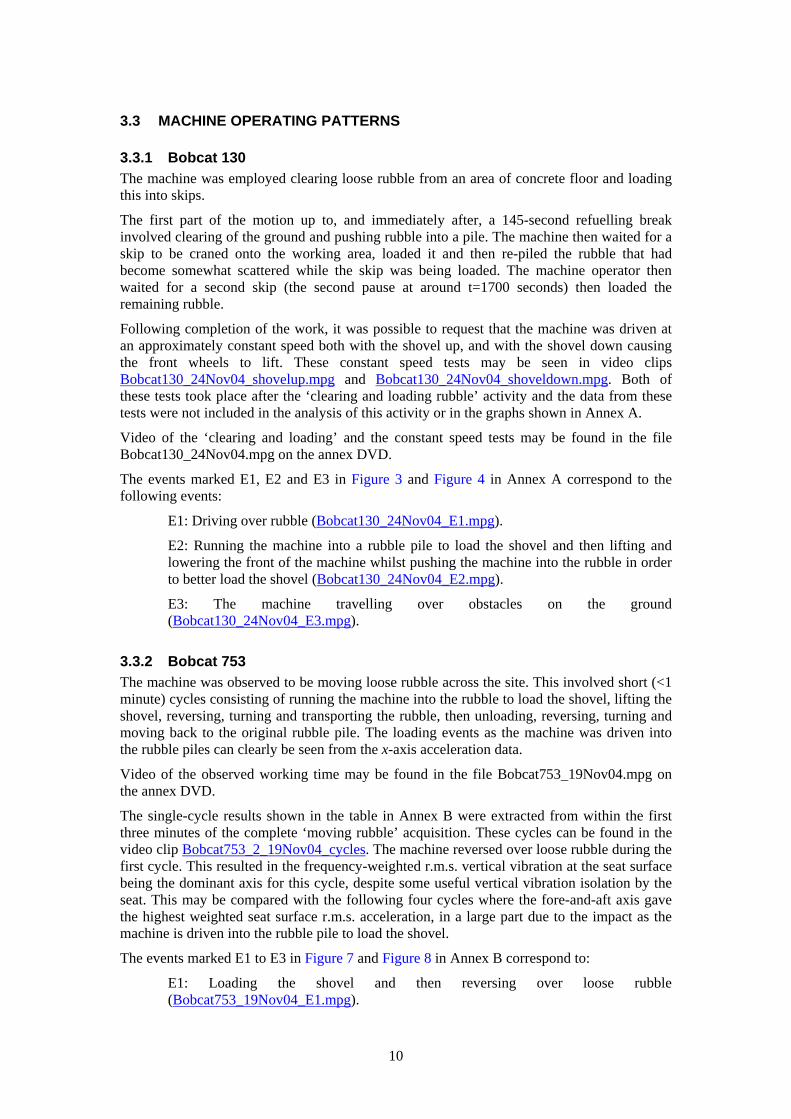
3.3 MACHINE OPERATING PATTERNS
3.3.1 Bobcat 130
The machine was employed clearing loose rubble from an area of concrete floor and loading
this into skips.
The first part of the motion up to, and immediately after, a 145-second refuelling break
involved clearing of the ground and pushing rubble into a pile. The machine then waited for a
skip to be craned onto the working area, loaded it and then re-piled the rubble that had
become somewhat scattered while the skip was being loaded. The machine operator then
waited for a second skip (the second pause at around t=1700 seconds) then loaded the
remaining rubble.
Following completion of the work, it was possible to request that the machine was driven at
an approximately constant speed both with the shovel up, and with the shovel down causing
the front wheels to lift. These constant speed tests may be seen in video clips
Bobcat130_24Nov04_shovelup.mpg and Bobcat130_24Nov04_shoveldown.mpg. Both of
these tests took place after the ‘clearing and loading rubble’ activity and the data from these
tests were not included in the analysis of this activity or in the graphs shown in Annex A.
Video of the ‘clearing and loading’ and the constant speed tests may be found in the file
Bobcat130_24Nov04.mpg on the annex DVD.
The events marked E1, E2 and E3 in Figure 3 and Figure 4 in Annex A correspond to the
following events:
E1: Driving over rubble (Bobcat130_24Nov04_E1.mpg).
E2: Running the machine into a rubble pile to load the shovel and then lifting and
lowering the front of the machine whilst pushing the machine into the rubble in order
to better load the shovel (Bobcat130_24Nov04_E2.mpg).
E3: The machine travelling over obstacles on the ground
(Bobcat130_24Nov04_E3.mpg).
3.3.2 Bobcat 753
The machine was observed to be moving loose rubble across the site. This involved short (<1
minute) cycles consisting of running the machine into the rubble to load the shovel, lifting the
shovel, reversing, turning and transporting the rubble, then unloading, reversing, turning and
moving back to the original rubble pile. The loading events as the machine was driven into
the rubble piles can clearly be seen from the x-axis acceleration data.
Video of the observed working time may be found in the file Bobcat753_19Nov04.mpg on
the annex DVD.
The single-cycle results shown in the table in Annex B were extracted from within the first
three minutes of the complete ‘moving rubble’ acquisition. These cycles can be found in the
video clip Bobcat753_2_19Nov04_cycles. The machine reversed over loose rubble during the
first cycle. This resulted in the frequency-weighted r.m.s. vertical vibration at the seat surface
being the dominant axis for this cycle, despite some useful vertical vibration isolation by the
seat. This may be compared with the following four cycles where the fore-and-aft axis gave
the highest weighted seat surface r.m.s. acceleration, in a large part due to the impact as the
machine is driven into the rubble pile to load the shovel.
The events marked E1 to E3 in Figure 7 and Figure 8 in Annex B correspond to:
E1: Loading the shovel and then reversing over loose rubble
(Bobcat753_19Nov04_E1.mpg).
10

E2: Loading the shovel (Bobcat753_19Nov04_E2.mpg).
E2: Loading the shovel (Bobcat753_19Nov04_E3.mpg).
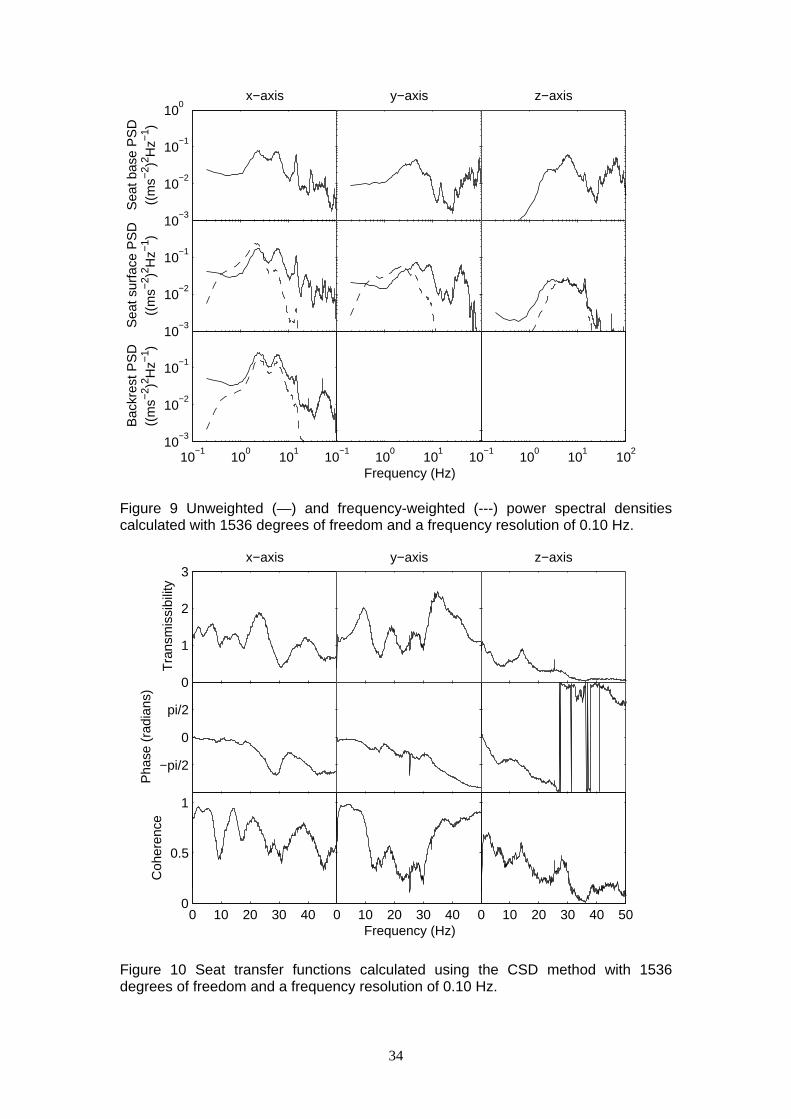
3.3.3 Kubota KX71-2
The machine was measured for one hour and five minutes breaking a concrete floor and
trimming and clearing rubble from the steel support structure that became exposed.
Video of the working period may be found in the file KX71-2alpha_12Nov04.mpg on the
annex DVD.
The events marked E1, E2 and E3 in Figure 11 and Figure 12 in Annex C correspond to video
clips:
KX71-2alpha_12Nov04_E1.mpg
KX71-2alpha_12Nov04_E2.mpg
KX71-2alpha_12Nov04_E3.mpg
These events were all situations where the front of the tracks lifted off the ground as the
weight of the machine was used to apply more force to the hammer. The machine dropped as
the hammer broke through causing the high accelerations visible in the running r.m.s.
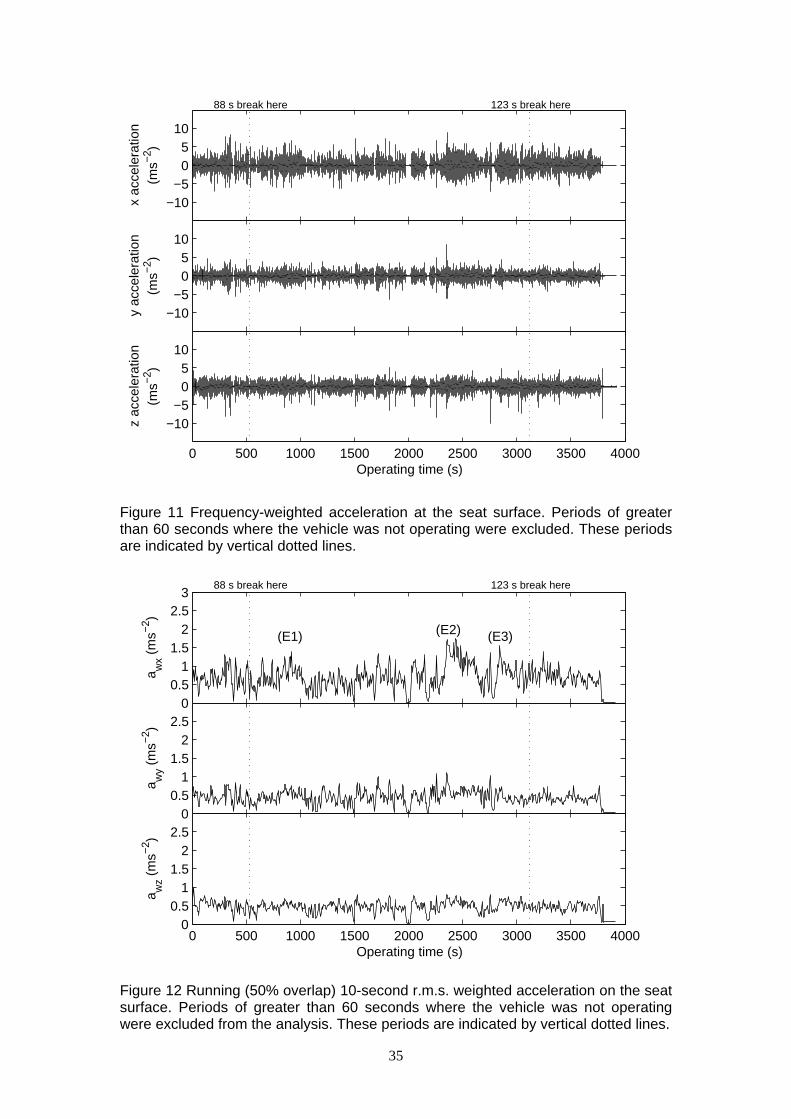
3.3.4 Kubota KX161-3 (impact hammer)
The machine was breaking a concrete floor and trimming and clearing rubble from the steel
support structure that became exposed. The machine activity might be divided into four
activities:
travelling between working locations
hammering down onto concrete floor sections using the powered impact hammer
approximately vertically.
trimming concrete still adhering to the steel building supports using the powered
impact hammer at a variety of angles.
clearing loosened concrete and steel from the working area using the tip or the body
of the unpowered impact hammer.
The machine was dropped onto the working area from a cantilever crane and was stationary
while hammering, trimming, and clearing. The machine operator would switch between
hammering, trimming and clearing and repositioning the machine, spending up to 40 seconds
travelling and between a few seconds and four minutes on each of the other activities
according to the requirements of the task.
Video of the working period may be found in the file KX161-3_12Nov04.mpg on the annex
DVD.
The events marked E1 to E3 in Figure 15 and Figure 16 in Annex D correspond to:
E1 and E2: Using the unpowered hammer to break loosened concrete from a steel
beam (KX161-3_12Nov04_E1.mpg, KX161-3_12Nov04_E2.mpg)
E3: Manoeuvring over rubble. The driver was observed to clear this loose rubble from
the working area immediately as shown towards the end of the clip (KX161-
3_12Nov04_E3.mpg).
11
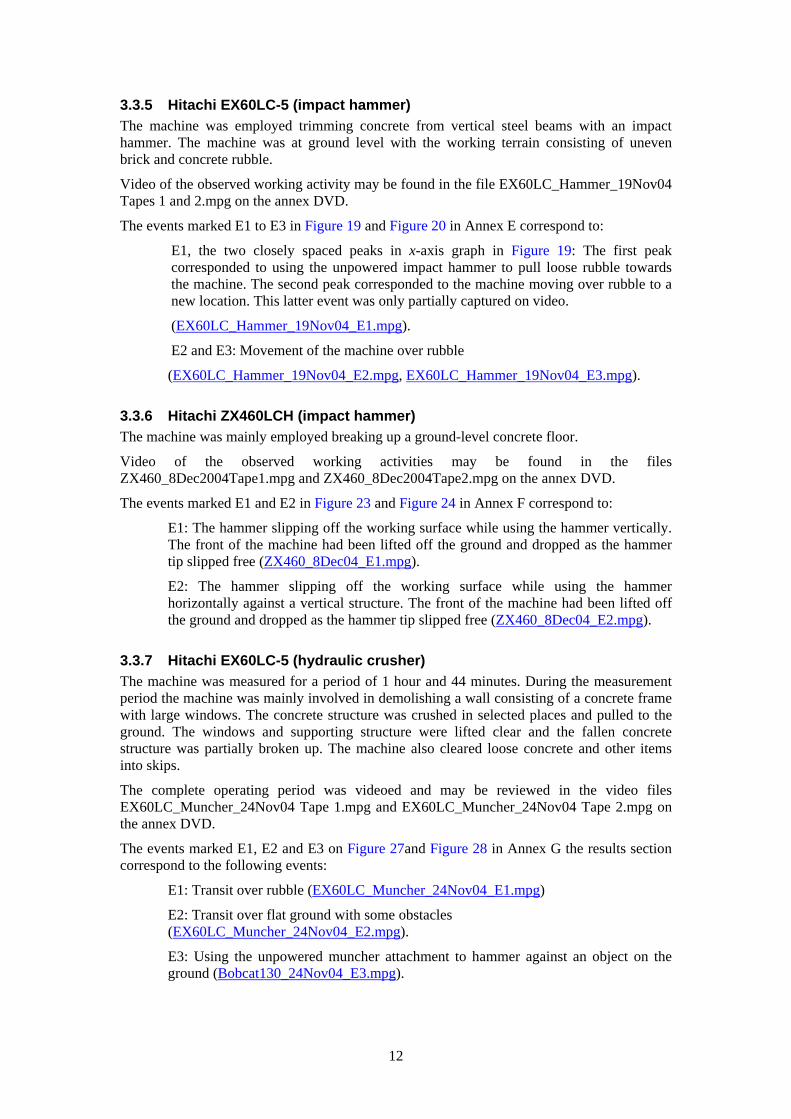
3.3.5 Hitachi EX60LC-5 (impact hammer)
The machine was employed trimming concrete from vertical steel beams with an impact
hammer. The machine was at ground level with the working terrain consisting of uneven
brick and concrete rubble.
Video of the observed working activity may be found in the file EX60LC_Hammer_19Nov04
Tapes 1 and 2.mpg on the annex DVD.
The events marked E1 to E3 in Figure 19 and Figure 20 in Annex E correspond to:
E1, the two closely spaced peaks in x-axis graph in Figure 19: The first peak
corresponded to using the unpowered impact hammer to pull loose rubble towards
the machine. The second peak corresponded to the machine moving over rubble to a
new location. This latter event was only partially captured on video.
(EX60LC_Hammer_19Nov04_E1.mpg).
E2 and E3: Movement of the machine over rubble
(EX60LC_Hammer_19Nov04_E2.mpg, EX60LC_Hammer_19Nov04_E3.mpg).
3.3.6 Hitachi ZX460LCH (impact hammer)
The machine was mainly employed breaking up a ground-level concrete floor.
Video of the observed working activities may be found in the files
ZX460_8Dec2004Tape1.mpg and ZX460_8Dec2004Tape2.mpg on the annex DVD.
The events marked E1 and E2 in Figure 23 and Figure 24 in Annex F correspond to:
E1: The hammer slipping off the working surface while using the hammer vertically.
The front of the machine had been lifted off the ground and dropped as the hammer
tip slipped free (ZX460_8Dec04_E1.mpg).
E2: The hammer slipping off the working surface while using the hammer
horizontally against a vertical structure. The front of the machine had been lifted off
the ground and dropped as the hammer tip slipped free (ZX460_8Dec04_E2.mpg).
3.3.7 Hitachi EX60LC-5 (hydraulic crusher)
The machine was measured for a period of 1 hour and 44 minutes. During the measurement
period the machine was mainly involved in demolishing a wall consisting of a concrete frame
with large windows. The concrete structure was crushed in selected places and pulled to the
ground. The windows and supporting structure were lifted clear and the fallen concrete
structure was partially broken up. The machine also cleared loose concrete and other items
into skips.
The complete operating period was videoed and may be reviewed in the video files
EX60LC_Muncher_24Nov04 Tape 1.mpg and EX60LC_Muncher_24Nov04 Tape 2.mpg on
the annex DVD.
The events marked E1, E2 and E3 on Figure 27and Figure 28 in Annex G the results section
correspond to the following events:
E1: Transit over rubble (EX60LC_Muncher_24Nov04_E1.mpg)
E2: Transit over flat ground with some obstacles
(EX60LC_Muncher_24Nov04_E2.mpg).
E3: Using the unpowered muncher attachment to hammer against an object on the
ground (Bobcat130_24Nov04_E3.mpg).
12

3.3.8 Hitachi EX455 (hydraulic crusher)
The machine was employed for approximately 1 hour and 10 minutes crushing steel-
reinforced concrete beams to separate the steel reinforcement and reduce the concrete to loose
rubble. The machine then spent approximately 8 minutes ‘munching’ concrete from upper
storey floor section of a partially demolished building. The data was analysed up to the point
when the machine completed this part of the work and then came to a stop.
Video of the observed working activities may be found in the file EX455_9Dec04_Tapes 1
and 2.mpg on the annex DVD.
The events marked E1 to E3 in Figure 31 and Figure 32 in Annex H correspond to:
E1: Moving into position (EX455_9Dec04_E1.mpg).
E2: Crushing building debris lying on the ground. The front machine appears to be
lifted off the ground as the muncher is pushed down into the pile of debris and then
drops as the muncher closes (EX455_9Dec04_E2.mpg).
E3: Jolt caused by using the weight of the machine to pull at a part of the building
structure. The back of the machine lifts and then drops as the muncher breaks free of
the building (EX455_9Dec04_E3.mpg).
3.3.9 Case CX210 (Backhoe shovel)
The machine was employed loading rubble into trucks. For most of the observed working
time the machine was positioned on top of approximately flat-topped rubble piles. There were
some pauses in the region of two minutes during the data acquisition with the machine
stationary waiting for the next truck to arrive. These were considered part of the typical
working cycle and were included in the analysis. The driver remained seated in the machine.
A longer break of just over 8 minutes where the driver left the machine was excluded from
the analysis.
Video of the complete work activity may be found in the file ‘CX210_9Dec04_Tapes1 and
2.mpg’ on the annex DVD.
The events marked E1, E2 and E3 in Figure 35 and Figure 36 in Annex I correspond to:
E1: The machine moving back and forth on top of the rubble
(CX210_9Dec04_E1.mpg).
E2: The machine travelling to a new working position on the site
(CX210_9Dec04_E2.mpg).
E3: Appears to be associated with a jolt caused by loading the shovel. However, the
excavator is obscured from view by the truck into which rubble is being loaded. A
transient movement of the upper part of the cab can clearly be seen but the exact
cause cannot be positively identified (CX210_9Dec04_E3.mpg).
3.3.10 Hitachi ZX460LCH (steel shears)
The machine was employed dismantling a steel structure with rotary shears. Video of the
observed working activities may be found in the file ZX460_22Dec04 Tapes 1 and 2.mpg on
the annex DVD.
The events marked E1 and E2 in the Figure 39 and Figure 40 in Annex J correspond to:
E1 and E2: The machine manipulating the arm and transiting to a new location on the
work site (ZX460_22Dec04_E1.mpg), (ZX460_22Dec04_E2.mpg).
13
4 DISCUSSION
The effect of machine type, tool, seat and machine operation upon the vibration exposure
experienced by operators are discussed below. The exposures are also compared with the
exposure action values and exposure limit values in EU 2002/44/EC.
4.1 MACHINE TYPE
Vibration exposures recorded on the compact skid-steers were higher than those recorded on
the other machines.
Vibration exposures recorded on the tracked crawlers using the same type of tool generally
decreased with increasing mass of the machine. The mass of the machine would act to reduce
the accelerations transmitted by a force and it is reasonable to expect that for the same force
less vibration would be transmitted to the drivers of the larger machines.
4.2 MACHINE TOOL
All vibration exposures recorded on excavators fitted with impact hammers were higher than
those recorded on machines with hydraulic crushers or steel cutters. This indicates that the
vibration caused by the tool attachment influenced the exposure of the driver. Some of the
tasks carried out by machines fitted with impact hammers could also have been carried out by
machines fitted with hydraulic crushers. Where it is possible to carry out a task using a
hydraulic crusher rather than an impact hammers it may reduce the vibration exposure of the
driver.
4.3 MACHINE OPERATION
Inspection of the time histories indicates that shock events recorded on the skid-steers had a
large effect on the vibration exposure of the driver. The main causes of these shock events
were driving over obstacles (loose rubble) on the ground and impacts with piles of rubble
prior to picking them up. The compact skid-steers had solid rubber tyres and therefore
provided little attenuation of the vibration transmitted to the driver. Generally, drivers would
try to clear the floor area of obstacles using the bucket before transiting over it. The degree to
which the floor is cleared of obstacles would therefore affect the vibration exposure of the
driver. When picking up rubble from piles, the skid-steer operators would drive into the
rubble with the bucket down in order to scoop up some of the rubble. The speed at which the
bucket impacted the rubble affects the severity of the shock experienced by the driver. It is
likely that reducing the speed at impact with piles of rubble would also reduce the vibration
exposure of the driver. The vibration exposure of skid-steers operators would be influenced
by the way in which the machines are operated and that in certain conditions (e.g. aggressive
driving, uneven terrain) drivers may be subjected to higher exposures than those measured.
Inspection of the video recordings of the excavators fitted with impact hammers show that
some of the peaks in the time histories were caused by the weight of the machines being lifted
off the ground to apply more force to the hammer and then dropping as the hammer broke
through. There were also peaks in the time histories associated with using the unpowered
hammer to clear rubble or break concrete off a steel beam. The severity of these peaks would
be influenced by the manner in which the machine is operated and therefore it might be
possible to reduce the exposure of the driver by changing their operating methods. There were
also peaks in the time histories associated with the machine transiting over rubble.
Some of the highest peaks in the vibration time histories recorded on the excavators fitted
with hydraulic-crushers, steel shears and backhoe shovels were associated with the machine
transiting around the site. It is likely that the amount of movement a machine would be
required to perform over the day, and the unevenness of the terrain, would influence the
vibration exposure of the operator. There were also peaks in the vibration time-histories
14
caused by the weight of the machine being used to pull at part of the building structure: in
these cases part of the machine would lift and then drop, as the tool breaks free of the building
causing a jolt.
4.4 SEAT PERFORMANCE
All the seats fitted in the machines were either mechanically suspended or air suspended. The
SEAT values (calculated using VDVs) show that all the seats attenuated the vibration
transmitted to the operator in the vertical direction while increasing slightly the vibration
transmitted in the horizontal directions. Where possible, the preload adjustment setting was
checked for each of the seats; in all cases the seat was set appropriately for the operator.
Vertical SEAT values (VDV) on the excavators fitted with impact hammers ranged from 0.6
to 0.75. It is likely that the seats attenuated some of the high frequency vibration transmitted
through the machine from the hammers.
SEAT values (VDV), in the vertical direction, on the skid-steer loaders ranged from 0.77 to
0.83. The suspension stroke of the seats fitted in these machines was shorter than those fitted
in the other machines, increasing the likelihood of the suspension ‘bottoming out’.
The vertical SEAT values (VDV) on the excavators fitted with hydraulic crushers, buckets
and steel cutters ranged from 0.5 to 0.75, this indicates that the seat significantly reduced the
vibration reaching the operator.
4.5 COMPARISON WITH EU 2002/44/EC EXPOSURE LEVELS
Daily vibration exposures measurements on the compact skid-steer loaders indicate that the
exposure action value (EAV) could be exceeded, over a typical working day, when assessed
using either the VDV or r.m.s method. The measurements indicate that it is unlikely that the
exposure limit value (ELV) assessed using r.m.s. values would be exceeded over a working
day. However, the ELV assessed using the VDV method would have been exceeded after 6
hours 51 minutes on the Bobcat 130 and after 6 hours 26 minutes on the Bobcat 130. During
discussions with the skid-steer operators it was stated that the machines would not normally
be operated for more than 4 hours over a typical working day.
Measurements on all the excavators fitted with impact hammers indicate that the EAV (r.m.s
or VDV) could be exceeded during a working day. The ELV (r.m.s or VDV) was not
predicted to be exceeded on any of the machines fitted with impact hammers.
Neither of the excavators fitted with hydraulic crushers was predicted to exceed the ELV
(r.m.s or VDV) during a working day. However, the action value calculated using the VDV
method may be exceeded on both machines. Assuming the operators were exposed
continuously at the measured levels, the r.m.s exposure action value would have been
exceeded after 5 hours 52 minutes on the Hitachi EX60LC-5 and after 9 hours 32 minutes on
the Hitachi EX455.
Vibration measurements on the Case CX210 fitted with a backhoe shovel indicated that the
EAV could be exceeded over a working day if calculated using the VDV method but would
be unlikely to exceed the r.m.s exposure action value. These measurements suggest that the
machine could be operated for more than 24 hours without exceeding the ELV (r.m.s or
VDV).
The vibration exposure of the operator of the Hitachi ZX460LCH fitted with the steel cutters
was very low. From these measurements it would be unlikely that either the EAV or the ELV
would be exceeded over a working day.
15

5 CONCLUSIONS
From the measurements it is predicted that operators of the skid-steer loaders and the
excavators fitted with impact hammers could be exposed to vibration greater than the Physical
Agents exposure action value (VDV or r.m.s.) during the course of a working day. The
vibration exposure on one of the excavators fitted with a hydraulic crusher was predicted to
above the r.m.s. exposure action value while the exposure on the other machine fitted with a
crusher was predicted to be below the r.m.s exposure action value. The vibration recorded on
the excavators fitted with the backhoe shovel and the steel cutters was below the exposure
action values.
None of the machines would have exceeded the r.m.s exposure limit value over an 8-hour
period. However, the VDV exposure limit value was predicted to be exceeded on both the
skid-steer loaders during the course of a working day. The exposure limit values (VDV or
r.m.s) would not have been exceeded for any of the excavators.
The magnitude of the vibration on each of the machines will vary with a large number of
factors (driving style, terrain, seat, etc.) and in some instances, might be more severe than
those measured.
16

6 REFERENCES
Council of the European Union (2002). Physical Agents (Vibration) Directive 2002/44/EC:
on the minimum health and safety requirements regarding the exposure of workers to the risks
arising from physical agents (vibration) (16th individual Directive within the meaning of
Article 16(1) of Directive 89/391/EEC). 94/449 (COD). Council of European Union,
Brussels.
International Organization for Standardization (1997). Mechanical vibration and shock –
Evaluation of human exposure to whole-body vibration – Part 1: General requirements. ISO
2631-1-1997/E. International Organization for Standardization, Geneva.
17
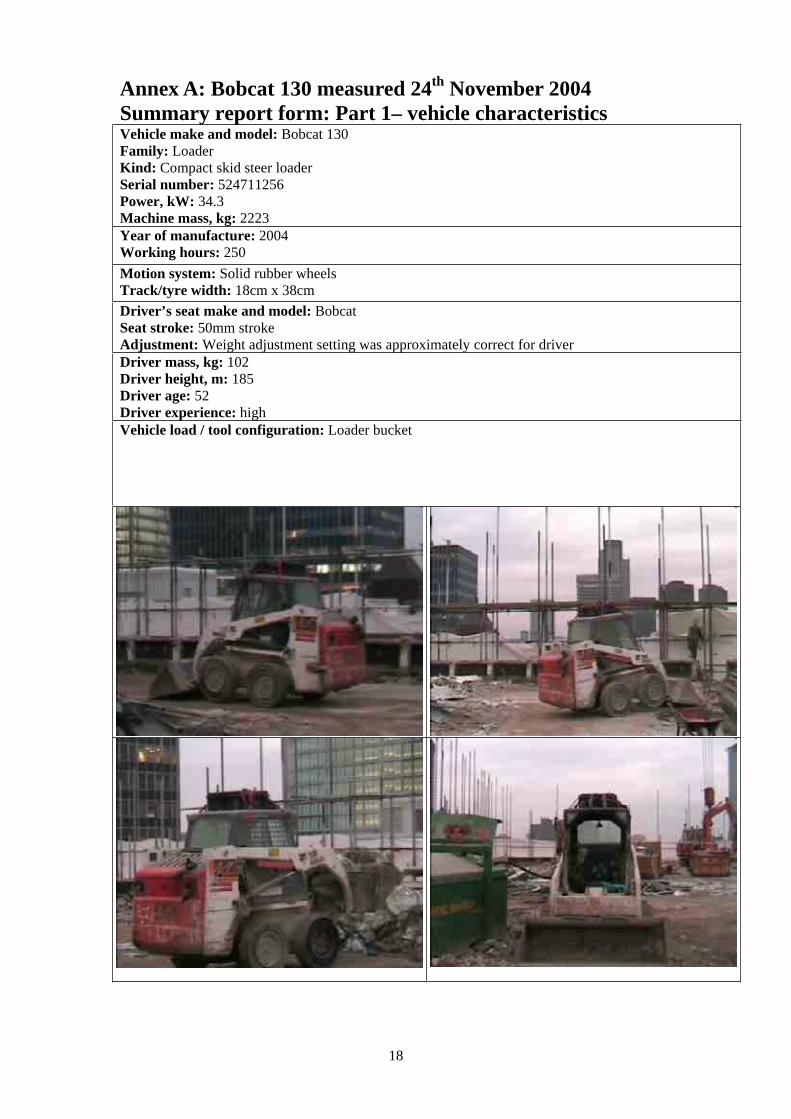
Annex A: Bobcat 130 measured 24th
November 2004
Summary report form: Part 1– vehicle characteristicsVehicle make and model: Bobcat 130
Family: Loader
Kind: Compact skid steer loader
Serial number: 524711256
Power, kW: 34.3
Machine mass, kg: 2223
Year of manufacture: 2004
Working hours: 250
Motion system: Solid rubber wheels
Track/tyre width: 18cm x 38cm
Driver’s seat make and model: Bobcat
Seat stroke: 50mm stroke
Adjustment: Weight adjustment setting was approximately correct for driver
Driver mass, kg: 102
Driver height, m: 185
Driver age: 52
Driver experience: high
Vehicle load / tool configuration: Loader bucket
18

Summary report form: Part 2- Test environment
Description of the test environment:
Demolition site. Originally a multi-storey office block. The work site was a flat concrete floor
approximately 70m x 70m. There was some loose rubble on the surface of the floor.
19
Summary report form: Part 3– Vehicle usage
Description of the operating patterns in which this vehicle is used:
The vehicle was used to clear rubble into piles and load rubble into skips.
Times for which the vehicle is used in each operating pattern by day and week, with
seasonal variations:
The vehicle was active for approximately 2 hours of the 10-hour shift. The vehicle was used
for 30-60 minute at a time. During the shift a single driver operated the vehicle.
From questioning the operator it was evident that the operating patterns for this vehicle are
variable and depend on the nature of the site. On larger sites, with more breakers operating,
the vehicle could be operated for up to 6 hours during a shift. However, typically the vehicle
would be operated for 2-4 hours during a shift.
The operator observed no weekly or seasonal operating patters.
Comments on specific factors likely to affect the vibration exposure and methods by
which the vibration exposure may be reduced:
The speed at which operators impact with piles of rubble, in order to scoop it up, would affect
the vibration exposure.
The smoothness of the terrain would affect the vibration exposure of the driver. Ensuring
drivers cleared the site of loose rubble, as far as possible, before driving over the site could
reduce the vibration exposure. Also it should be ensured that tyres appropriate for the work
site are used.
20
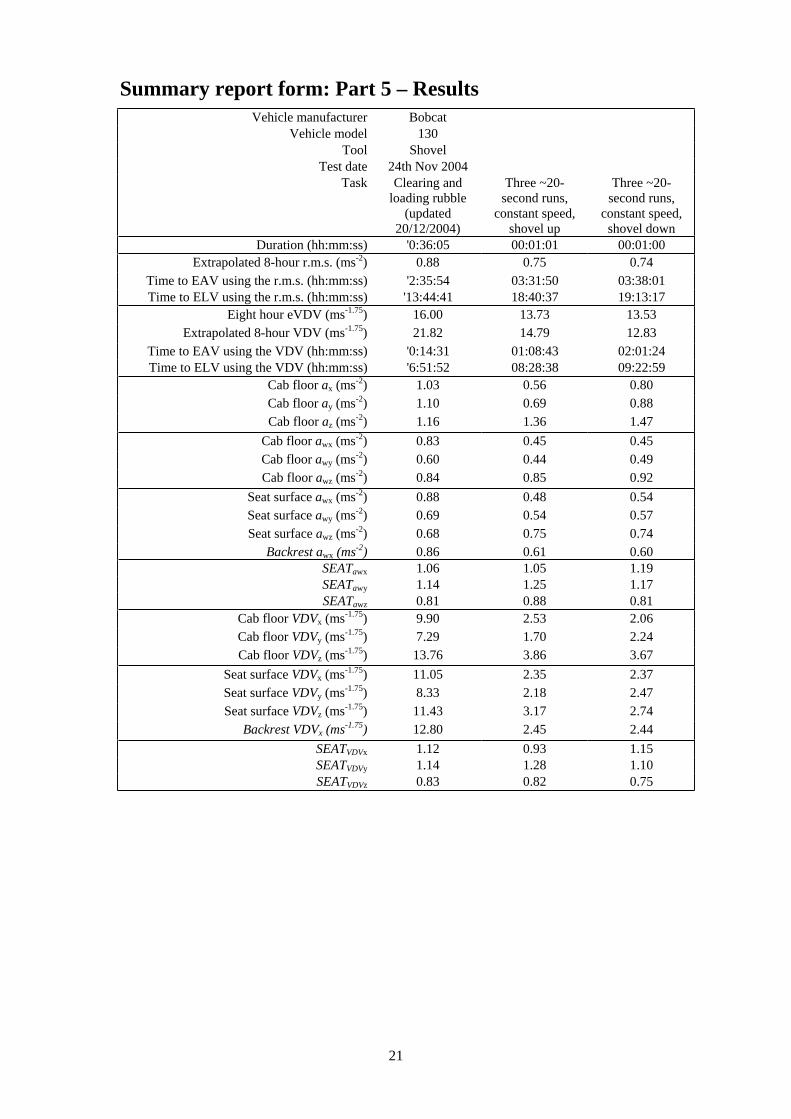
Summary report form: Part 5 – Results
Vehicle manufacturer Bobcat
Vehicle model 130
Tool Shovel
Test date 24th Nov 2004
Task Clearing and
loading rubble
(updated
20/12/2004)
Three ~20-
second runs,
constant speed,
shovel up
Three ~20-
second runs,
constant speed,
shovel down
Duration (hh:mm:ss) '0:36:05 00:01:01 00:01:00
Extrapolated 8-hour r.m.s. (ms-2) 0.88 0.75 0.74
Time to EAV using the r.m.s. (hh:mm:ss) '2:35:54 03:31:50 03:38:01
Time to ELV using the r.m.s. (hh:mm:ss) '13:44:41 18:40:37 19:13:17
Eight hour eVDV (ms-1.75) 16.00 13.73 13.53
Extrapolated 8-hour VDV (ms-1.75) 21.82 14.79 12.83
Time to EAV using the VDV (hh:mm:ss) '0:14:31 01:08:43 02:01:24
Time to ELV using the VDV (hh:mm:ss) '6:51:52 08:28:38 09:22:59
Cab floor ax (ms-2) 1.03 0.56 0.80
Cab floor ay (ms-2) 1.10 0.69 0.88
Cab floor az (ms-2) 1.16 1.36 1.47
Cab floor awx (ms-2) 0.83 0.45 0.45
Cab floor awy (ms-2) 0.60 0.44 0.49
Cab floor awz (ms-2) 0.84 0.85 0.92
Seat surface awx (ms-2) 0.88 0.48 0.54
Seat surface awy (ms-2) 0.69 0.54 0.57
Seat surface awz (ms-2) 0.68 0.75 0.74
Backrest awx (ms-2) 0.86 0.61 0.60
SEATawx 1.06 1.05 1.19
SEATawy 1.14 1.25 1.17
SEATawz 0.81 0.88 0.81
Cab floor VDVx (ms-1.75) 9.90 2.53 2.06
Cab floor VDVy (ms-1.75) 7.29 1.70 2.24
Cab floor VDVz (ms-1.75) 13.76 3.86 3.67
Seat surface VDVx (ms-1.75) 11.05 2.35 2.37
Seat surface VDVy (ms-1.75) 8.33 2.18 2.47
Seat surface VDVz (ms-1.75) 11.43 3.17 2.74
Backrest VDVx (ms-1.75) 12.80 2.45 2.44
SEATVDVx 1.12 0.93 1.15
SEATVDVy 1.14 1.28 1.10
SEATVDVz 0.83 0.82 0.75
21

10−3
10−2
10−1
100
x−axis
Sea
t bas
e P
SD
((m
s−2)2 H
z−1)
y−axis z−axis
10−3
10−2
10−1
Sea
t sur
face
PS
D((
ms−2
)2 Hz−1
)
10−1
100
101
10−3
10−2
10−1
Bac
kres
t PS
D((
ms−2
)2 Hz−1
)
10−1
100
101
Frequency (Hz)10
−110
010
110
2
Figure 1 Unweighted (—) and frequency-weighted (---) power spectral densities calculated with 712 degrees of freedom and a frequency resolution of 0.10 Hz.
0
1
2
3x−axis
Tra
nsm
issi
bilit
y
y−axis z−axis
−pi/2
0
pi/2
Pha
se (
radi
ans)
0 10 20 30 400
0.5
1
Coh
eren
ce
0 10 20 30 40Frequency (Hz)
0 10 20 30 40 50
Figure 2 Seat transfer functions calculated using the CSD method with 712 degreesof freedom and a frequency resolution of 0.10 Hz.
22

−15−10−5
05
1015
x ac
cele
ratio
n(m
s−2)
145 s break here
−15−10−5
05
1015
y ac
cele
ratio
n(m
s−2)
0 500 1000 1500 2000 2500
−15−10−5
05
1015
Operating time (s)
z ac
cele
ratio
n(m
s−2)
Figure 3 Frequency-weighted acceleration at the seat surface. Periods of greaterthan 60 seconds where the vehicle was not operating were excluded. These periodsare indicated by vertical dotted lines.
00.5
11.5
22.5
3
a wx (
ms−2
)
145 s break here
(E2)
00.5
11.5
22.5
a wy (
ms−2
)
0 500 1000 1500 2000 25000
0.51
1.52
2.5
a wz (
ms−2
)
Operating time (s)
(E1)(E3)
Figure 4 Running (50% overlap) 10-second r.m.s. weighted acceleration on the seatsurface. Periods where the driver was not in the vehicle were excluded from the analysis. These periods are indicated by vertical dotted lines.
23
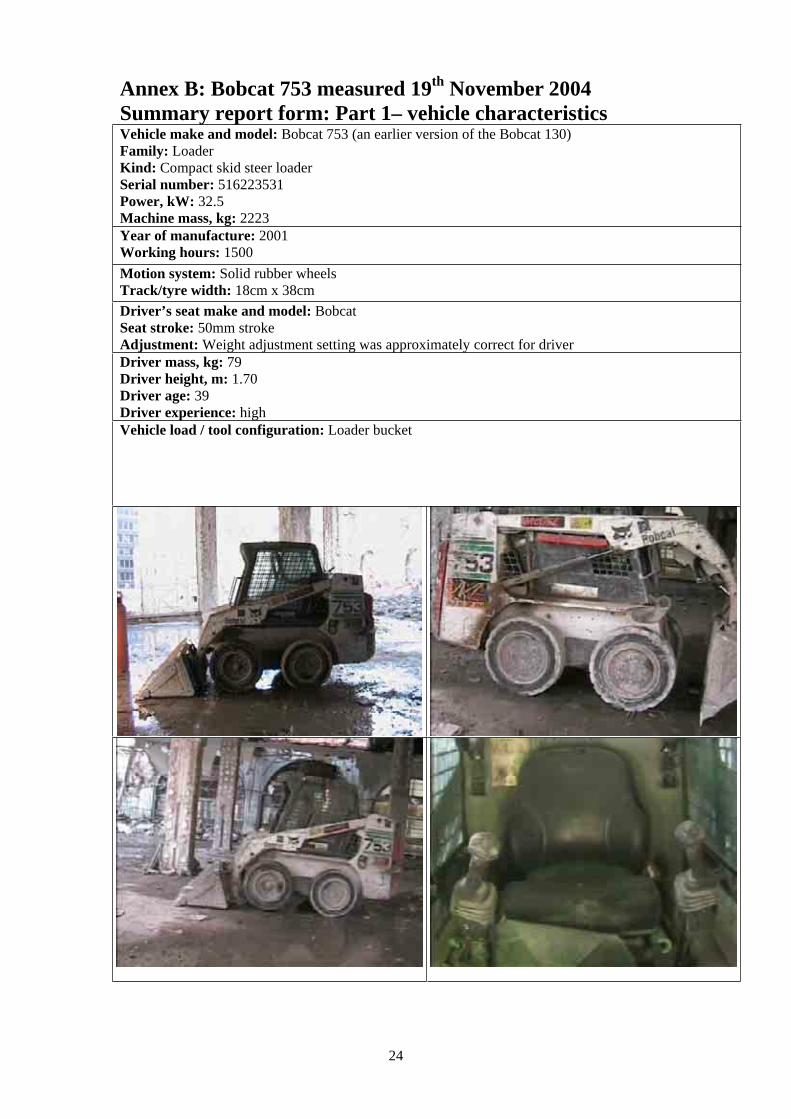
Annex B: Bobcat 753 measured 19th
November 2004
Summary report form: Part 1– vehicle characteristicsVehicle make and model: Bobcat 753 (an earlier version of the Bobcat 130)
Family: Loader
Kind: Compact skid steer loader
Serial number: 516223531
Power, kW: 32.5
Machine mass, kg: 2223
Year of manufacture: 2001
Working hours: 1500
Motion system: Solid rubber wheels
Track/tyre width: 18cm x 38cm
Driver’s seat make and model: Bobcat
Seat stroke: 50mm stroke
Adjustment: Weight adjustment setting was approximately correct for driver
Driver mass, kg: 79
Driver height, m: 1.70
Driver age: 39
Driver experience: high
Vehicle load / tool configuration: Loader bucket
24
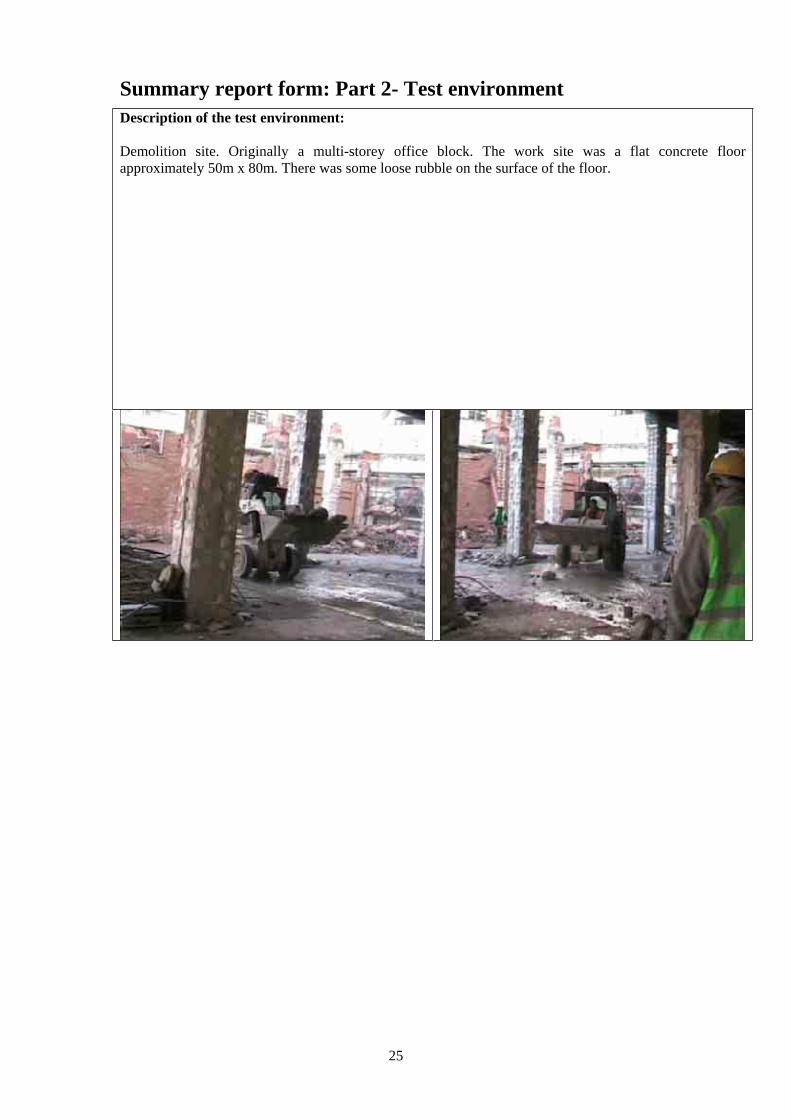
Summary report form: Part 2- Test environment
Description of the test environment:
Demolition site. Originally a multi-storey office block. The work site was a flat concrete floor
approximately 50m x 80m. There was some loose rubble on the surface of the floor.
25
Summary report form: Part 3– Vehicle usage
Description of the operating patterns in which this vehicle is used:
The vehicle was used to pick up rubble from a pile and deposit it in another pile on the other
side of the work site.
Times for which the vehicle is used in each operating pattern by day and week, with
seasonal variations:
The vehicle was active for approximately 4 hours of the 10-hour shift. The vehicle was used
for 30-60 minute at a time. During the shift a single driver operated the vehicle.
From questioning the operator it was evident that the operating patterns for this vehicle are
variable and depend on the nature of the site. On larger sites, with more breakers operating,
the vehicle could be operated for up to 6 hours during a shift. However, typically the vehicle
would be operated for 2-4 hours during a shift.
The operator observed no weekly or seasonal operating patters.
Comments on specific factors likely to affect the vibration exposure and methods by
which the vibration exposure may be reduced:
The speed at which operators impact with piles of rubble, in order to scoop it up, would affect
the vibration exposure.
The smoothness of the terrain would affect the vibration exposure of the driver. Ensuring
drivers cleared the site of loose rubble, as far as possible, before driving over the site could
reduce the vibration exposure. Also it should be ensured that tyres appropriate for the work
site are used.
26
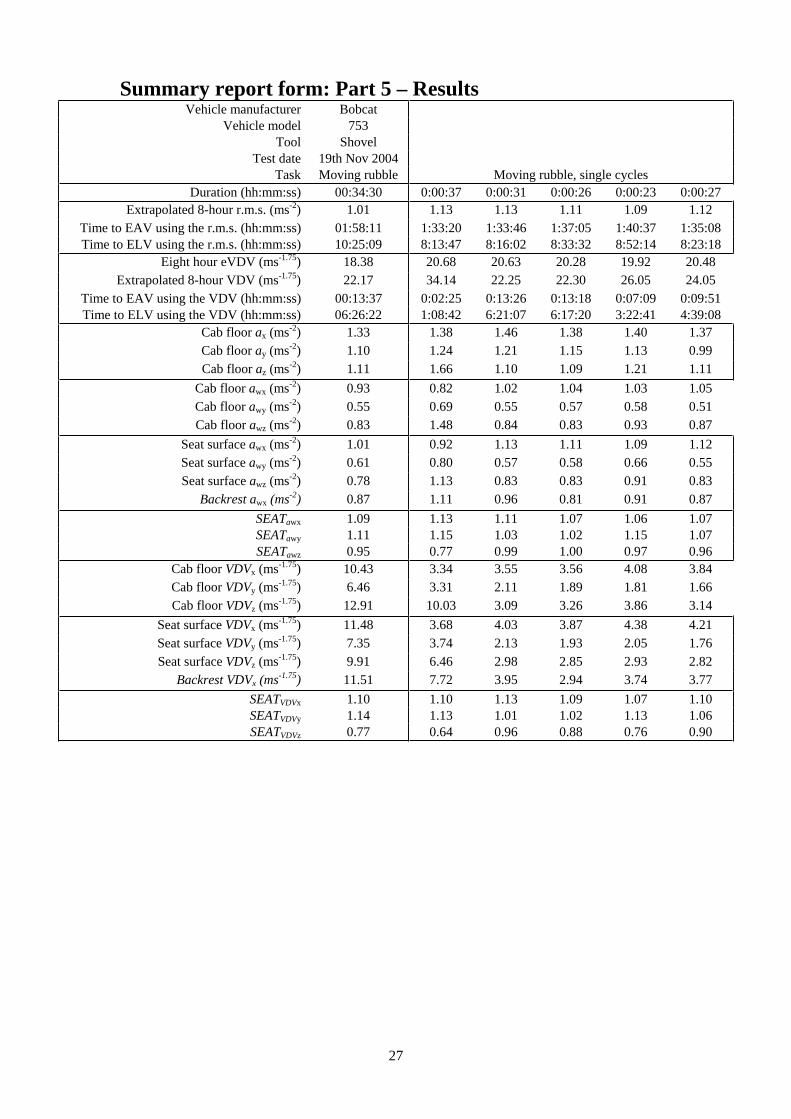
Summary report form: Part 5 – ResultsVehicle manufacturer Bobcat
Vehicle model 753
Tool Shovel
Test date 19th Nov 2004
Task Moving rubble Moving rubble, single cycles
Duration (hh:mm:ss) 00:34:30 0:00:37 0:00:31 0:00:26 0:00:23 0:00:27
Extrapolated 8-hour r.m.s. (ms-2) 1.01 1.13 1.13 1.11 1.09 1.12
Time to EAV using the r.m.s. (hh:mm:ss) 01:58:11 1:33:20 1:33:46 1:37:05 1:40:37 1:35:08
Time to ELV using the r.m.s. (hh:mm:ss) 10:25:09 8:13:47 8:16:02 8:33:32 8:52:14 8:23:18
Eight hour eVDV (ms-1.75) 18.38 20.68 20.63 20.28 19.92 20.48
Extrapolated 8-hour VDV (ms-1.75) 22.17 34.14 22.25 22.30 26.05 24.05
Time to EAV using the VDV (hh:mm:ss) 00:13:37 0:02:25 0:13:26 0:13:18 0:07:09 0:09:51
Time to ELV using the VDV (hh:mm:ss) 06:26:22 1:08:42 6:21:07 6:17:20 3:22:41 4:39:08
Cab floor ax (ms-2) 1.33 1.38 1.46 1.38 1.40 1.37
Cab floor ay (ms-2) 1.10 1.24 1.21 1.15 1.13 0.99
Cab floor az (ms-2) 1.11 1.66 1.10 1.09 1.21 1.11
Cab floor awx (ms-2) 0.93 0.82 1.02 1.04 1.03 1.05
Cab floor awy (ms-2) 0.55 0.69 0.55 0.57 0.58 0.51
Cab floor awz (ms-2) 0.83 1.48 0.84 0.83 0.93 0.87
Seat surface awx (ms-2) 1.01 0.92 1.13 1.11 1.09 1.12
Seat surface awy (ms-2) 0.61 0.80 0.57 0.58 0.66 0.55
Seat surface awz (ms-2) 0.78 1.13 0.83 0.83 0.91 0.83
Backrest awx (ms-2) 0.87 1.11 0.96 0.81 0.91 0.87
SEATawx 1.09 1.13 1.11 1.07 1.06 1.07
SEATawy 1.11 1.15 1.03 1.02 1.15 1.07
SEATawz 0.95 0.77 0.99 1.00 0.97 0.96
Cab floor VDVx (ms-1.75) 10.43 3.34 3.55 3.56 4.08 3.84
Cab floor VDVy (ms-1.75) 6.46 3.31 2.11 1.89 1.81 1.66
Cab floor VDVz (ms-1.75) 12.91 10.03 3.09 3.26 3.86 3.14
Seat surface VDVx (ms-1.75) 11.48 3.68 4.03 3.87 4.38 4.21
Seat surface VDVy (ms-1.75) 7.35 3.74 2.13 1.93 2.05 1.76
Seat surface VDVz (ms-1.75) 9.91 6.46 2.98 2.85 2.93 2.82
Backrest VDVx (ms-1.75) 11.51 7.72 3.95 2.94 3.74 3.77
SEATVDVx 1.10 1.10 1.13 1.09 1.07 1.10
SEATVDVy 1.14 1.13 1.01 1.02 1.13 1.06
SEATVDVz 0.77 0.64 0.96 0.88 0.76 0.90
27

10−3
10−2
10−1
100
x−axis
Sea
t bas
e P
SD
((m
s−2)2 H
z−1)
y−axis z−axis
10−3
10−2
10−1
Sea
t sur
face
PS
D((
ms−2
)2 Hz−1
)
10−1
100
101
10−3
10−2
10−1
Bac
kres
t PS
D((
ms−2
)2 Hz−1
)
10−1
100
101
Frequency (Hz)10
−110
010
110
2
Figure 5 Unweighted (—) and frequency-weighted (---) power spectral densities calculated with 812 degrees of freedom and a frequency resolution of 0.10 Hz.
0
1
2
3x−axis
Tra
nsm
issi
bilit
y
y−axis z−axis
−pi/2
0
pi/2
Pha
se (
radi
ans)
0 10 20 30 400
0.5
1
Coh
eren
ce
0 10 20 30 40Frequency (Hz)
0 10 20 30 40 50
Figure 6 Seat transfer functions calculated using the CSD method with 812 degreesof freedom and a frequency resolution of 0.10 Hz.
28

−15−10−5
05
1015
x ac
cele
ratio
n(m
s−2)
−15−10−5
05
1015
y ac
cele
ratio
n(m
s−2)
0 500 1000 1500 2000 2500
−15−10−5
05
1015
Operating time (s)
z ac
cele
ratio
n(m
s−2)
Figure 7 Frequency-weighted acceleration at the seat surface.
00.5
11.5
22.5
3
a wx (
ms−2
) (E2) (E3)
00.5
11.5
22.5
a wy (
ms−2
)
0 500 1000 1500 2000 25000
0.51
1.52
2.5
a wz (
ms−2
)
Operating time (s)
(E1)
Figure 8 Running (50% overlap) 10-second r.m.s. weighted acceleration on the seatsurface.
29
Annex C: Kubota KX71-2 measured 12th
November 2004
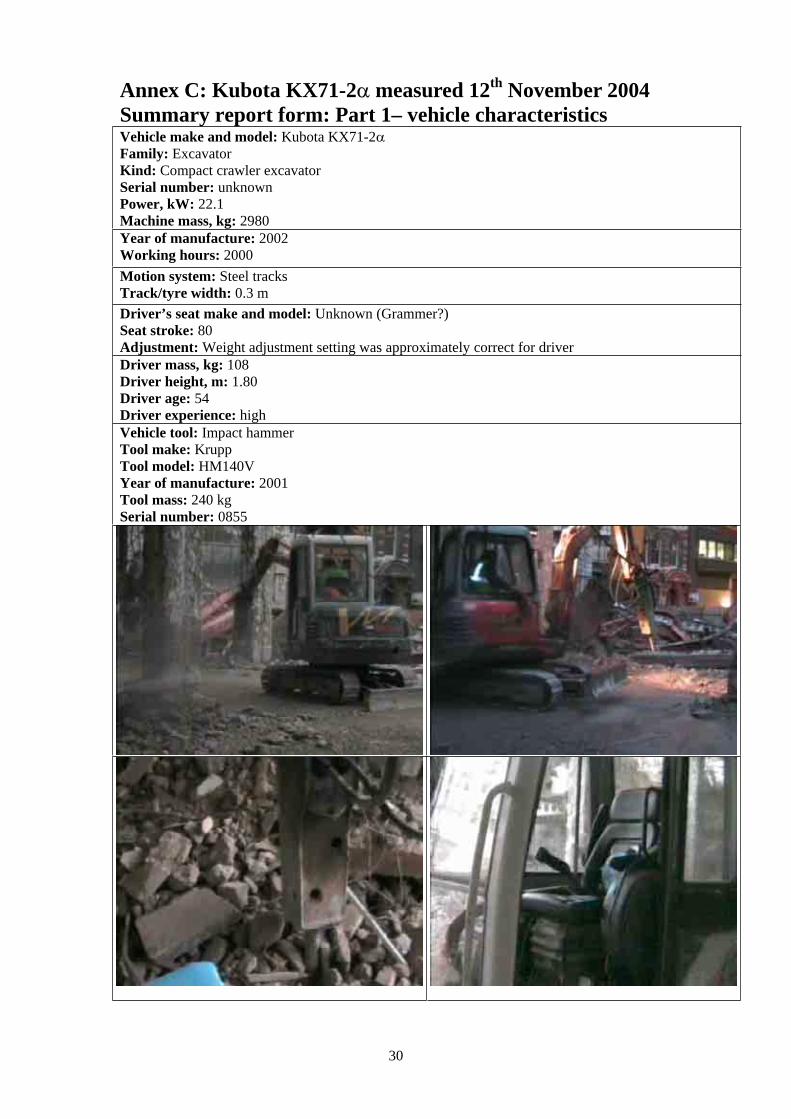
Summary report form: Part 1– vehicle characteristicsVehicle make and model: Kubota KX71-2
Family: Excavator
Kind: Compact crawler excavator
Serial number: unknown
Power, kW: 22.1
Machine mass, kg: 2980
Year of manufacture: 2002
Working hours: 2000
Motion system: Steel tracks
Track/tyre width: 0.3 m
Driver’s seat make and model: Unknown (Grammer?)
Seat stroke: 80
Adjustment: Weight adjustment setting was approximately correct for driver
Driver mass, kg: 108
Driver height, m: 1.80
Driver age: 54
Driver experience: high
Vehicle tool: Impact hammer
Tool make: Krupp
Tool model: HM140V
Year of manufacture: 2001
Tool mass: 240 kg
Serial number: 0855
30

Summary report form: Part 2- Test environment
Description of the test environment:
Site was originally a multi-storey office block. The vehicle was operating on a flat concrete floor slab. The
floor slab was approximately 200 mm thick.
31

Summary report form: Part 3– Vehicle usage
Description of the operating patterns in which this vehicle is used:
The machine was used for three main activities:
1. Breaking concrete, using the hydraulic hammer to systematically break off sections of
flooring.
2. ‘Trimming’ concrete from steel structures using the hydraulic hammer to ‘chisel’
away any concrete adhering to the steel girders.
3. Clearing the working area, using the body of the hammer, without power, to bend
exposed reinforcing bars out of the way and clear loose concrete that had not fallen
away from the working area.
The operator was observed to switch fairly rapidly between these three tasks, usually
spending less than a minute on each activity.
Times for which the vehicle is used in each operating pattern by day and week, with
seasonal variations:
Operators commentated that the operating patterns for this type of machine were highly
variable depending on the nature of the site. This site was unusual in that hammering
operations were only permitted for two-hour periods due to the noise generated in the city
location of the site. Generally operators would be operating constantly during each 2-hour
period. There were three such periods during a shift and therefore the maximum exposure, on
this site, would be 6 hours.
Operators stated that on other sites without a two-hour restriction then continuous operation
might take place for substantially longer than two hours.
The operators observed no weekly or seasonal patterns. The prime factor affecting the vehicle
operating patterns was the immediate requirements of the site.
Comments on specific factors likely to affect the vibration exposure and methods by
which the vibration exposure may be reduced:
At times the operator used the weight of the machine, to help break through the slab, by
pushing down on the tool so that the front of the machine lifted of the ground. When the tool
broke through the floor slab the front of the machine impacted the ground causing a peak in
the time histories. Reducing the number of such events could reduce the vibration exposure of
the driver.
32

Summary report form: Part 5 – ResultsVehicle manufacturer Kubota
Vehicle model KX71-2alpha
Tool Impact
hammer
Test date 12th Nov 2004
Task Breaking and
trimming
Duration (hh:mm:ss) 01:05:26
Extrapolated 8-hour r.m.s. (ms-2) 0.76
Time to EAV using the r.m.s. (hh:mm:ss) 03:29:01
Time to ELV using the r.m.s. (hh:mm:ss) 18:25:40
Eight hour eVDV (ms-1.75) 13.82
Extrapolated 8-hour VDV (ms-1.75) 18.09
Time to EAV using the VDV (hh:mm:ss) 00:30:45
Time to ELV using the VDV (hh:mm:ss) 14:32:19
Cab floor ax (ms-2) 1.08
Cab floor ay (ms-2) 1.24
Cab floor az (ms-2) 1.45
Cab floor awx (ms-2) 0.52
Cab floor awy (ms-2) 0.37
Cab floor awz (ms-2) 0.67
Seat surface awx (ms-2) 0.76
Seat surface awy (ms-2) 0.48
Seat surface awz (ms-2) 0.49
Backrest awx (ms-2) 0.94
SEATawx 1.46
SEATawy 1.28
SEATawz 0.73
Cab floor VDVx (ms-1.75) 7.55
Cab floor VDVy (ms-1.75) 5.63
Cab floor VDVz (ms-1.75) 11.37
Seat surface VDVx (ms-1.75) 10.99
Seat surface VDVy (ms-1.75) 7.01
Seat surface VDVz (ms-1.75) 6.86
Backrest VDVx (ms-1.75) 15.72
SEATVDVx 1.45
SEATVDVy 1.24
SEATVDVz 0.60
33
10−3
10−2
10−1
100
x−axis
Sea
t bas
e P
SD
((m
s−2)2 H
z−1)
y−axis z−axis
10−3
10−2
10−1
Sea
t sur
face
PS
D((
ms−2
)2 Hz−1
)
10−1
100
101
10−3
10−2
10−1
Bac
kres
t PS
D((
ms−2
)2 Hz−1
)
10−1
100
101
Frequency (Hz)10
−110
010
110
2
Figure 9 Unweighted (—) and frequency-weighted (---) power spectral densities calculated with 1536 degrees of freedom and a frequency resolution of 0.10 Hz.
0
1
2
3x−axis
Tra
nsm
issi
bilit
y
y−axis z−axis
−pi/2
0
pi/2
Pha
se (
radi
ans)
0 10 20 30 400
0.5
1
Coh
eren
ce
0 10 20 30 40Frequency (Hz)
0 10 20 30 40 50
Figure 10 Seat transfer functions calculated using the CSD method with 1536degrees of freedom and a frequency resolution of 0.10 Hz.
34
−10−5
05
10x
acce
lera
tion
(ms−2
)
88 s break here 123 s break here
−10−5
05
10
y ac
cele
ratio
n(m
s−2)
0 500 1000 1500 2000 2500 3000 3500 4000
−10−5
05
10
Operating time (s)
z ac
cele
ratio
n(m
s−2)
Figure 11 Frequency-weighted acceleration at the seat surface. Periods of greater than 60 seconds where the vehicle was not operating were excluded. These periodsare indicated by vertical dotted lines.
00.5
11.5
22.5
3
a wx (
ms−2
)
88 s break here 123 s break here
(E1) (E2) (E3)
00.5
11.5
22.5
a wy (
ms−2
)
0 500 1000 1500 2000 2500 3000 3500 40000
0.51
1.52
2.5
a wz (
ms−2
)
Operating time (s)
Figure 12 Running (50% overlap) 10-second r.m.s. weighted acceleration on the seat surface. Periods of greater than 60 seconds where the vehicle was not operatingwere excluded from the analysis. These periods are indicated by vertical dotted lines.
35
Annex D: Kubota KX161-3 measured 24th
November 2004
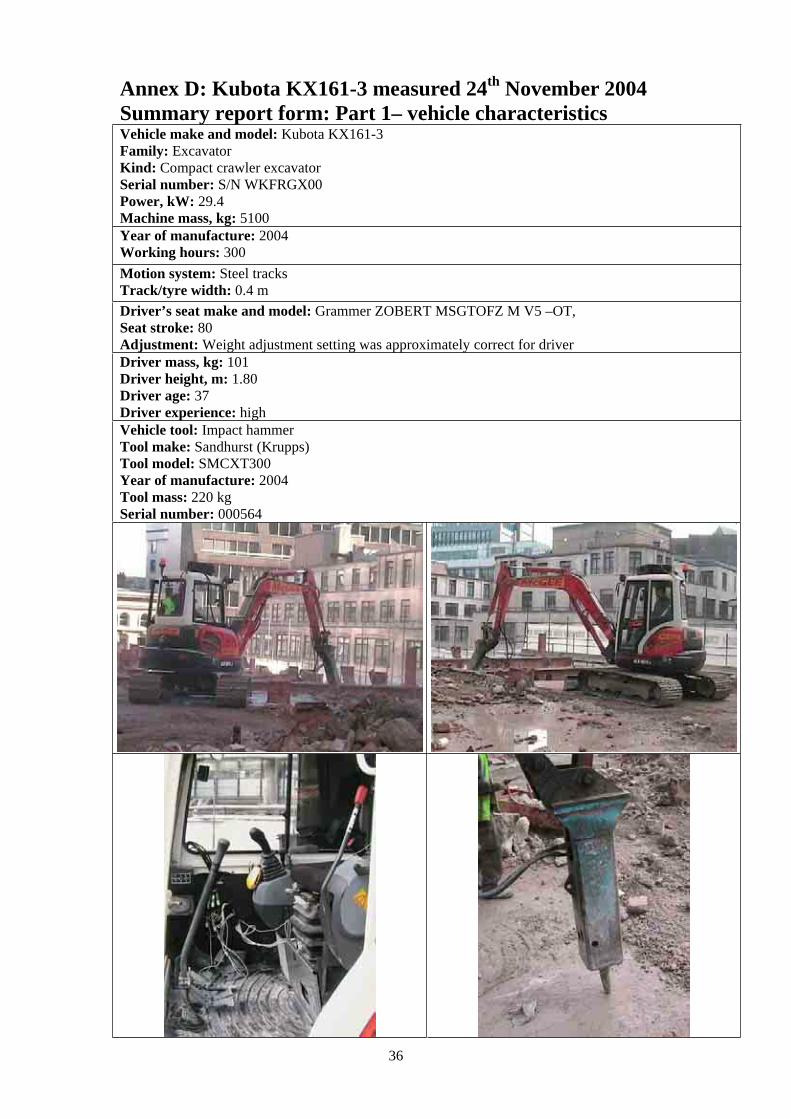
Summary report form: Part 1– vehicle characteristicsVehicle make and model: Kubota KX161-3
Family: Excavator
Kind: Compact crawler excavator
Serial number: S/N WKFRGX00
Power, kW: 29.4
Machine mass, kg: 5100
Year of manufacture: 2004
Working hours: 300
Motion system: Steel tracks
Track/tyre width: 0.4 m
Driver’s seat make and model: Grammer ZOBERT MSGTOFZ M V5 –OT,
Seat stroke: 80
Adjustment: Weight adjustment setting was approximately correct for driver
Driver mass, kg: 101
Driver height, m: 1.80
Driver age: 37
Driver experience: high
Vehicle tool: Impact hammer
Tool make: Sandhurst (Krupps)
Tool model: SMCXT300
Year of manufacture: 2004
Tool mass: 220 kg
Serial number: 000564
36

Summary report form: Part 2- Test environment
Description of the test environment:
Site was originally a multi-storey office block. The vehicle was operating on a flat concrete floor slab.
The floor slab was approximately 200 mm thick.
37

Summary report form: Part 3– Vehicle usage
Description of the operating patterns in which this vehicle is used:
The machine was used for three main activities:
1. Breaking concrete, using the hydraulic hammer to systematically break off
sections of flooring.
2. ‘Trimming’ concrete from steel structures using the hydraulic hammer to ‘chisel’
away any concrete adhering to the steel girders.
3. Clearing the working area, using the body of the hammer, without power, to bend
exposed reinforcing bars out of the way and clear loose concrete that had not
fallen away from the working area.
The operator was observed to switch fairly rapidly between these three tasks, usually
spending less than a minute on each activity.
Times for which the vehicle is used in each operating pattern by day and week, with
seasonal variations:
Operators commentated that the operating patterns for this type of machine were highly
variable depending on the nature of the site. This site was unusual in that hammering
operations were only permitted for two-hour periods due to the noise generated in the city
location of the site. Generally operators would be operating constantly during each 2-hour
period. There were three such periods during a shift and therefore the maximum exposure, on
this site, would be 6 hours.
Operators stated that on other sites without a two-hour restriction then continuous operation
might take place for substantially longer than two hours.
The operators observed no weekly or seasonal patterns. The prime factor affecting the vehicle
operating patterns was the immediate requirements of the site.
Comments on specific factors likely to affect the vibration exposure and methods by
which the vibration exposure may be reduced:
The vehicle operator was observed to clear areas to be traversed or broken up using the body
of the hammer to push rubble aside. The unpowered hammer also was used to break loosened
concrete from a steel beam by impacting the hammer against the beam. These events were
associated with peaks in the recorded vibration time histories. Reducing the occurrence of
these operations could reduce the vibration exposure of the operator.
38

Summary report form: Part 5 – ResultsVehicle manufacturer Kubota
Vehicle model KX161-3
Tool Impact
hammerTest date 12-Nov-04
Task Breaking,
trimming and
clearing
rubble.Duration (hh:mm:ss) 01:46:43
Extrapolated 8-hour r.m.s. (ms-2) 0.73
Time to EAV using the r.m.s. (hh:mm:ss) 03:45:11
Time to ELV using the r.m.s. (hh:mm:ss) 19:51:12
Eight hour eVDV (ms-1.75) 13.31
Extrapolated 8-hour VDV (ms-1.75) 17.16
Time to EAV using the VDV (hh:mm:ss) 00:37:55
Time to ELV using the VDV (hh:mm:ss) 17:55:28
Cab floor ax (ms-2) 1.42
Cab floor ay (ms-2) 1.18
Cab floor az (ms-2) 1.30
Cab floor awx (ms-2) 0.58
Cab floor awy (ms-2) 0.33
Cab floor awz (ms-2) 0.65
Seat surface awx (ms-2) 0.73Seat surface awy (ms-2) 0.39
Seat surface awz (ms-2) 0.49
Backrest awx (ms-2) 0.86
SEATawx 1.25
SEATawy 1.18
SEATawz 0.76
Cab floor VDVx (ms-1.75) 9.37
Cab floor VDVy (ms-1.75) 5.53
Cab floor VDVz (ms-1.75) 13.18
Seat surface VDVx (ms-1.75) 11.79
Seat surface VDVy (ms-1.75) 6.45
Seat surface VDVz (ms-1.75) 7.96
Backrest VDVx (ms-1.75) 15.41
SEATVDVx 1.26
SEATVDVy 1.17
SEATVDVz 0.60
39

10−3
10−2
10−1
100
x−axis
Sea
t bas
e P
SD
((m
s−2)2 H
z−1)
y−axis z−axis
10−3
10−2
10−1
Sea
t sur
face
PS
D((
ms−2
)2 Hz−1
)
10−1
100
101
10−3
10−2
10−1
Bac
kres
t PS
D((
ms−2
)2 Hz−1
)
10−1
100
101
Frequency (Hz)10
−110
010
110
2
Figure 13 Unweighted (—) and frequency-weighted (---) power spectral densitiescalculated with 2504 degrees of freedom and a frequency resolution of 0.10 Hz.
0
1
2
3x−axis
Tra
nsm
issi
bilit
y
y−axis z−axis
−pi/2
0
pi/2
Pha
se (
radi
ans)
0 10 20 30 400
0.5
1
Coh
eren
ce
0 10 20 30 40Frequency (Hz)
0 10 20 30 40 50
Figure 14 Seat transfer functions calculated using the CSD method with 2504degrees of freedom and a frequency resolution of 0.10 Hz.
40

−10−5
05
10x
acce
lera
tion
(ms−2
)
276 s break here
−10−5
05
10
y ac
cele
ratio
n(m
s−2)
0 1000 2000 3000 4000 5000 6000 7000
−10−5
05
10
Operating time (s)
z ac
cele
ratio
n(m
s−2)
Figure 15 Frequency-weighted acceleration at the seat surface. Periods of greater than 60 seconds where the vehicle was not operating were excluded. These periodsare indicated by vertical dotted lines.
00.5
11.5
22.5
3
a wx (
ms−2
)
276 s break here
(E1)(E2)
(E3)
00.5
11.5
22.5
a wy (
ms−2
)
0 1000 2000 3000 4000 5000 6000 70000
0.51
1.52
2.5
a wz (
ms−2
)
Operating time (s)
Figure 16 Running (50% overlap) 10-second r.m.s. weighted acceleration on the seat surface. Periods of greater than 60 seconds where the vehicle was not operatingwere excluded from the analysis. These periods are indicated by vertical dotted lines.
41

Annex E: Hitachi EX60LC-5 measured 19th
November 2004
Summary report form: Part 1– vehicle characteristicsVehicle make and model: Hitachi EX60LC-5
Family: Excavator
Kind: Crawler excavator
Serial number: 101PO54909
Power, kW: 41.0
Machine mass, kg: 6390
Year of manufacture: 2002
Working hours: 3000
Motion system: Steel tracks
Track/tyre width: 0.450 m
Driver’s seat make and model: Kab 411
Seat stroke: 100
Adjustment: Weight adjustment setting was approximately correct for driver
Driver mass, kg: 84
Driver height, m: 1.76
Driver age: 40
Driver experience: high
Vehicle tool: Impact hammer
Tool make: Montiavert
Tool model: 140SMS
Year of manufacture: 2002
Tool mass: 420 kg
Serial number: 137331
42
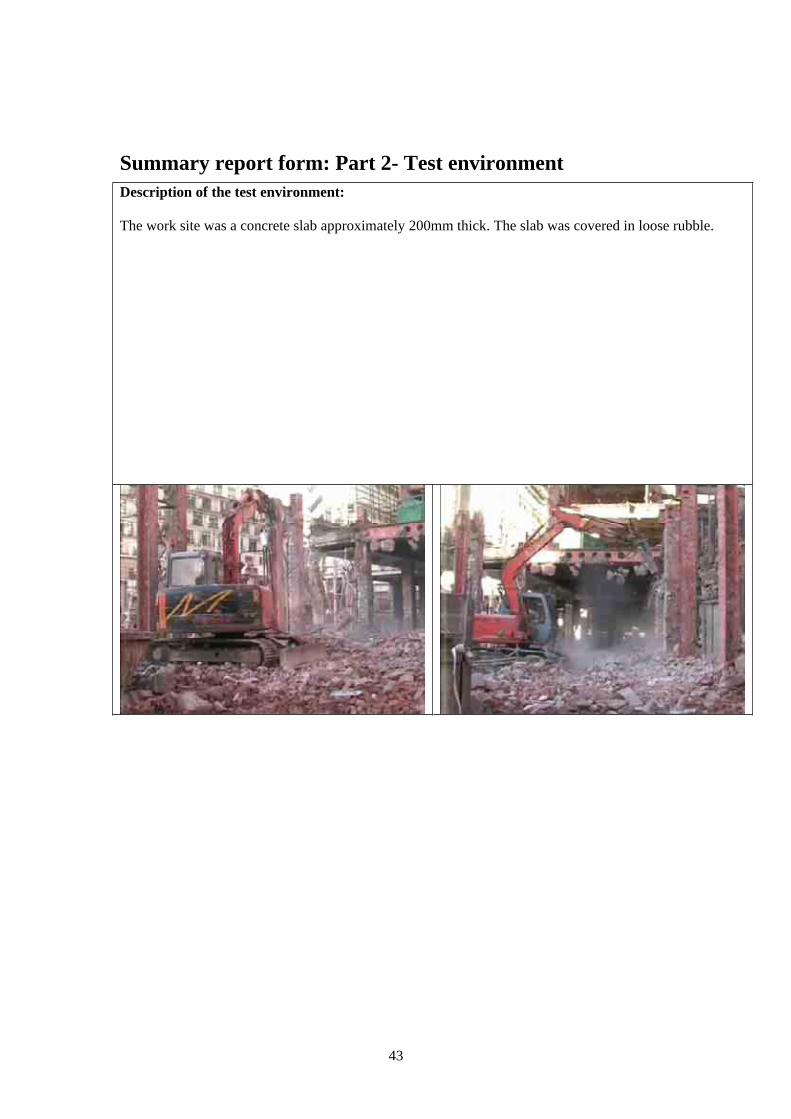
Summary report form: Part 2- Test environment
Description of the test environment:
The work site was a concrete slab approximately 200mm thick. The slab was covered in loose rubble.
43
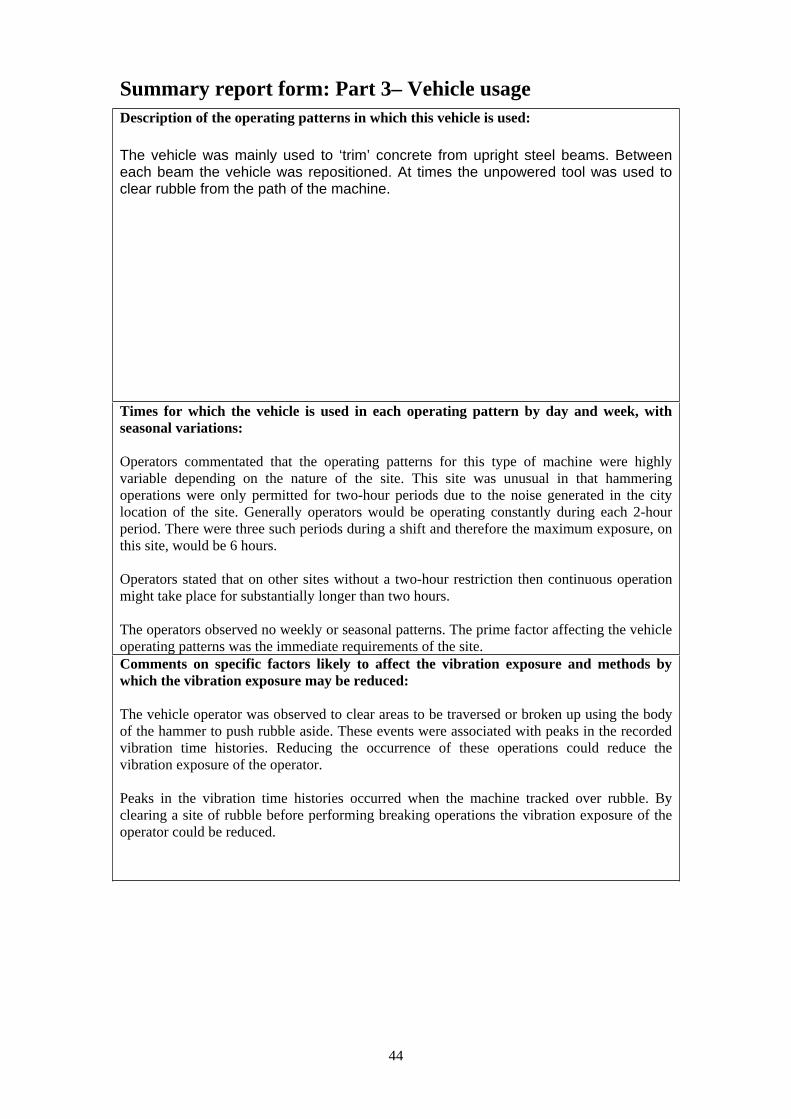
Summary report form: Part 3– Vehicle usage
Description of the operating patterns in which this vehicle is used:
The vehicle was mainly used to ‘trim’ concrete from upright steel beams. Betweeneach beam the vehicle was repositioned. At times the unpowered tool was used to clear rubble from the path of the machine.
Times for which the vehicle is used in each operating pattern by day and week, with
seasonal variations:
Operators commentated that the operating patterns for this type of machine were highly
variable depending on the nature of the site. This site was unusual in that hammering
operations were only permitted for two-hour periods due to the noise generated in the city
location of the site. Generally operators would be operating constantly during each 2-hour
period. There were three such periods during a shift and therefore the maximum exposure, on
this site, would be 6 hours.
Operators stated that on other sites without a two-hour restriction then continuous operation
might take place for substantially longer than two hours.
The operators observed no weekly or seasonal patterns. The prime factor affecting the vehicle
operating patterns was the immediate requirements of the site.
Comments on specific factors likely to affect the vibration exposure and methods by
which the vibration exposure may be reduced:
The vehicle operator was observed to clear areas to be traversed or broken up using the body
of the hammer to push rubble aside. These events were associated with peaks in the recorded
vibration time histories. Reducing the occurrence of these operations could reduce the
vibration exposure of the operator.
Peaks in the vibration time histories occurred when the machine tracked over rubble. By
clearing a site of rubble before performing breaking operations the vibration exposure of the
operator could be reduced.
44
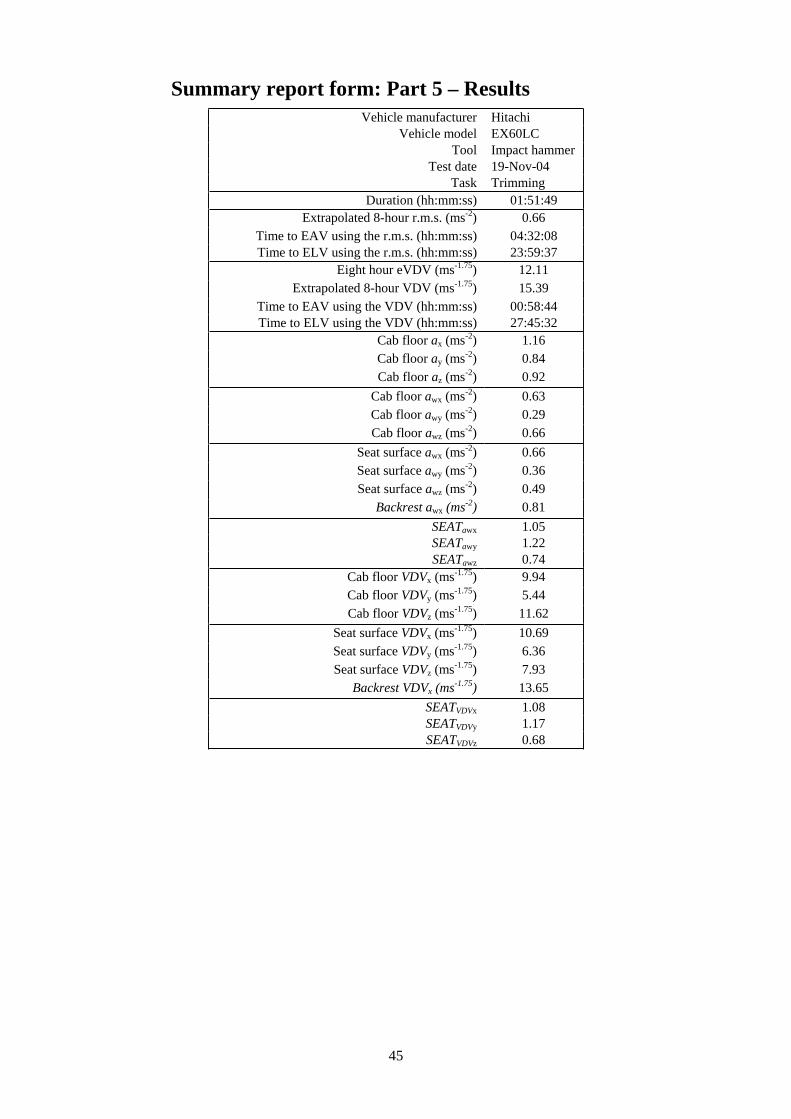
Summary report form: Part 5 – Results
Vehicle manufacturer Hitachi
Vehicle model EX60LC
Tool Impact hammer
Test date 19-Nov-04
Task Trimming
Duration (hh:mm:ss) 01:51:49
Extrapolated 8-hour r.m.s. (ms-2) 0.66
Time to EAV using the r.m.s. (hh:mm:ss) 04:32:08
Time to ELV using the r.m.s. (hh:mm:ss) 23:59:37
Eight hour eVDV (ms-1.75) 12.11
Extrapolated 8-hour VDV (ms-1.75) 15.39
Time to EAV using the VDV (hh:mm:ss) 00:58:44
Time to ELV using the VDV (hh:mm:ss) 27:45:32
Cab floor ax (ms-2) 1.16
Cab floor ay (ms-2) 0.84
Cab floor az (ms-2) 0.92
Cab floor awx (ms-2) 0.63
Cab floor awy (ms-2) 0.29
Cab floor awz (ms-2) 0.66
Seat surface awx (ms-2) 0.66
Seat surface awy (ms-2) 0.36
Seat surface awz (ms-2) 0.49
Backrest awx (ms-2) 0.81
SEATawx 1.05
SEATawy 1.22
SEATawz 0.74
Cab floor VDVx (ms-1.75) 9.94
Cab floor VDVy (ms-1.75) 5.44
Cab floor VDVz (ms-1.75) 11.62
Seat surface VDVx (ms-1.75) 10.69
Seat surface VDVy (ms-1.75) 6.36
Seat surface VDVz (ms-1.75) 7.93
Backrest VDVx (ms-1.75) 13.65
SEATVDVx 1.08
SEATVDVy 1.17
SEATVDVz 0.68
45

10−3
10−2
10−1
100
x−axis
Sea
t bas
e P
SD
((m
s−2)2 H
z−1)
y−axis z−axis
10−3
10−2
10−1
Sea
t sur
face
PS
D((
ms−2
)2 Hz−1
)
10−1
100
101
10−3
10−2
10−1
Bac
kres
t PS
D((
ms−2
)2 Hz−1
)
10−1
100
101
Frequency (Hz)10
−110
010
110
2
Figure 17 Unweighted (—) and frequency-weighted (---) power spectral densitiescalculated with 2624 degrees of freedom and a frequency resolution of 0.10 Hz.
0
1
2
3x−axis
Tra
nsm
issi
bilit
y
y−axis z−axis
−pi/2
0
pi/2
Pha
se (
radi
ans)
0 10 20 30 400
0.5
1
Coh
eren
ce
0 10 20 30 40Frequency (Hz)
0 10 20 30 40 50
Figure 18 Seat transfer functions calculated using the CSD method with 2624degrees of freedom and a frequency resolution of 0.10 Hz.
46
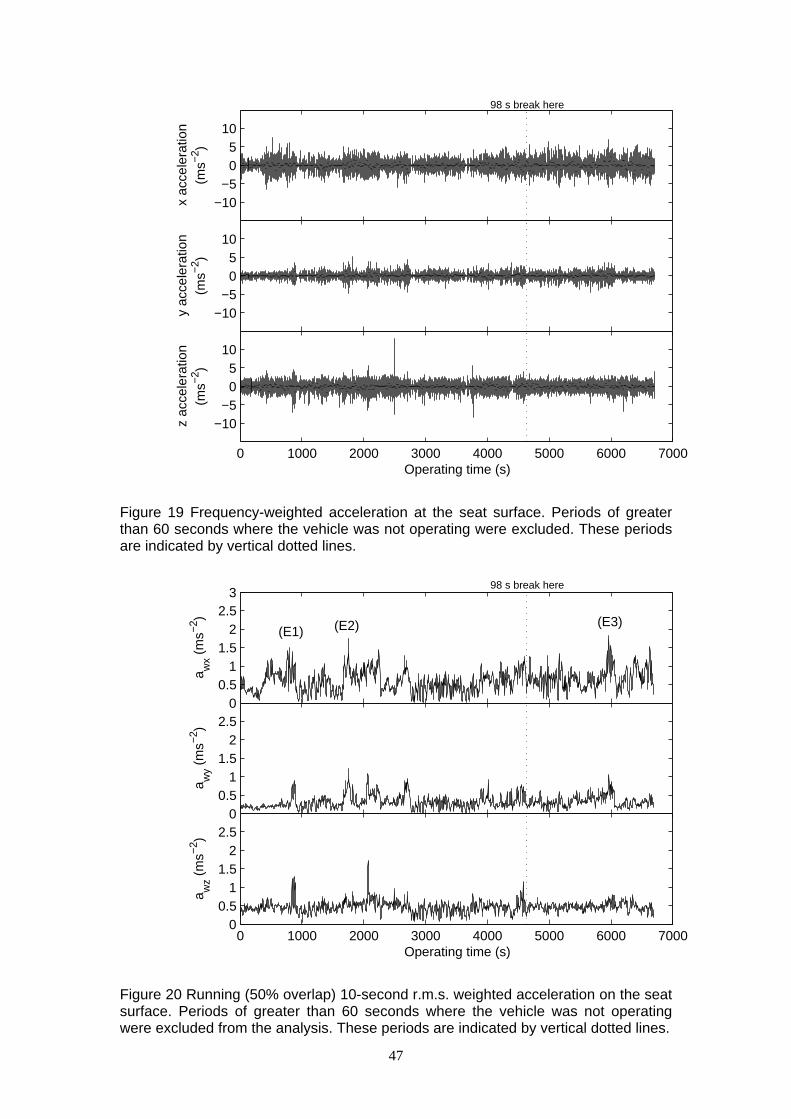
−10−5
05
10
x ac
cele
ratio
n(m
s−2)
98 s break here
−10−5
05
10
y ac
cele
ratio
n(m
s−2)
0 1000 2000 3000 4000 5000 6000 7000
−10−5
05
10
Operating time (s)
z ac
cele
ratio
n(m
s−2)
Figure 19 Frequency-weighted acceleration at the seat surface. Periods of greater than 60 seconds where the vehicle was not operating were excluded. These periodsare indicated by vertical dotted lines.
00.5
11.5
22.5
3
a wx (
ms−2
)
98 s break here
(E1) (E2) (E3)
00.5
11.5
22.5
a wy (
ms−2
)
0 1000 2000 3000 4000 5000 6000 70000
0.51
1.52
2.5
a wz (
ms−2
)
Operating time (s)
Figure 20 Running (50% overlap) 10-second r.m.s. weighted acceleration on the seat surface. Periods of greater than 60 seconds where the vehicle was not operatingwere excluded from the analysis. These periods are indicated by vertical dotted lines.
47

Annex F: Hitachi ZX460LCH measured 24th
November 2004
Summary report form: Part 1– vehicle characteristicsVehicle make and model: Hitachi ZX460LCH
Family: Excavator
Kind: Crawler excavator
Serial number: ICIRO54864
Power, kW: 235
Machine mass, kg: 47400
Year of manufacture: 2004
Working hours: 220
Motion system: Steel tracks
Track/tyre width, m: 0.6
Driver’s seat make and model: Unknown
Seat stroke: 125
Adjustment: Weight adjustment setting was approximately correct for driver
Driver mass, kg: 89
Driver height, m: 1.82
Driver age: 38
Driver experience: high
Vehicle tool: Impact hammer
Tool make: MSB
Tool model: 800
Year of manufacture: 2004
Tool mass: unknown
Serial number: ORF 006
48

Summary report form: Part 2- Test environment
Description of the test environment:
The site was originally a multi-story car park. The work site consisted of a mixture of rubble, earth and flat
concrete. The floor slab was approximately 300 mm thick.
49

Summary report form: Part 3– Vehicle usage
Description of the operating patterns in which this vehicle is used:
The machine was used to break up the floor slab of a multi-storey car park. Themachine broke up a section of the slab before tracking to a new location. At the end of the measurements the machine tracked across the site across a smooth concretesurface.
Times for which the vehicle is used in each operating pattern by day and week, with
seasonal variations:
Operators commentated that the operating patterns for this type of machine were highly
variable depending on the nature of the site. Typically the machine would be used for up to 8
hours during a shift.
The operators observed no weekly or seasonal patterns. The prime factor affecting the vehicle
operating patterns was the immediate requirements of the site.
Comments on specific factors likely to affect the vibration exposure and methods by
which the vibration exposure may be reduced:
At times the operator used the weight of the machine, to help break through the slab, by
pushing down on the tool so that the front of the machine lifted of the ground. When the tool
broke through the floor slab the front of the machine impacted the ground causing a peak in
the time histories. Reducing the number of such events could reduce the vibration exposure of
the driver.
50

Summary report form: Part 5 – ResultsVehicle manufacturer Hitachi
Vehicle model ZX460LCH
Tool impact hammer
Test date 08-Dec-04
Task Breaking concrete
floor
Duration (hh:mm:ss) 02:02:09
Extrapolated 8-hour r.m.s. (ms-2) 0.80
Time to EAV using the r.m.s. (hh:mm:ss) 03:07:25
Time to ELV using the r.m.s. (hh:mm:ss) 16:31:24
Eight hour eVDV (ms-1.75) 14.59
Extrapolated 8-hour VDV (ms-1.75) 17.35
Time to EAV using the VDV (hh:mm:ss) 00:36:17
Time to ELV using the VDV (hh:mm:ss) 17:09:05
Cab floor ax (ms-2) 0.98
Cab floor ay (ms-2) 0.86
Cab floor az (ms-2) 1.03
Cab floor awx (ms-2) 0.55
Cab floor awy (ms-2) 0.28
Cab floor awz (ms-2) 0.87
Seat surface awx (ms-2) 0.66
Seat surface awy (ms-2) 0.34
Seat surface awz (ms-2) 0.80
Backrest awx (ms-2) 0.61
SEATawx 1.20
SEATawy 1.19
SEATawz 0.92
Cab floor VDVx (ms-1.75) 8.30
Cab floor VDVy (ms-1.75) 4.81
Cab floor VDVz (ms-1.75) 16.41
Seat surface VDVx (ms-1.75) 10.01
Seat surface VDVy (ms-1.75) 5.50
Seat surface VDVz (ms-1.75) 12.33
Backrest VDVx (ms-1.75) 8.89
SEATVDVx 1.21
SEATVDVy 1.14
SEATVDVz 0.75
51

10−3
10−2
10−1
100
x−axis
Sea
t bas
e P
SD
((m
s−2)2 H
z−1)
y−axis z−axis
10−3
10−2
10−1
Sea
t sur
face
PS
D((
ms−2
)2 Hz−1
)
10−1
100
101
10−3
10−2
10−1
Bac
kres
t PS
D((
ms−2
)2 Hz−1
)
10−1
100
101
Frequency (Hz)10
−110
010
110
2
Figure 21 Unweighted (—) and frequency-weighted (---) power spectral densitiescalculated with 2868 degrees of freedom and a frequency resolution of 0.10 Hz.
0
1
2
3x−axis
Tra
nsm
issi
bilit
y
y−axis z−axis
−pi/2
0
pi/2
Pha
se (
radi
ans)
0 10 20 30 400
0.5
1
Coh
eren
ce
0 10 20 30 40Frequency (Hz)
0 10 20 30 40 50
Figure 22 Seat transfer functions calculated using the CSD method with 2868degrees of freedom and a frequency resolution of 0.10 Hz.
52

−15−10−5
05
1015
x ac
cele
ratio
n(m
s−2)
−15−10−5
05
1015
y ac
cele
ratio
n(m
s−2)
0 1000 2000 3000 4000 5000 6000 7000 8000
−15−10−5
05
1015
Operating time (s)
z ac
cele
ratio
n(m
s−2)
(E1) (E2)
Figure 23 Frequency-weighted acceleration at the seat surface. Periods of greater than 60 seconds where the vehicle was not operating were excluded.
00.5
11.5
22.5
3
a wx (
ms−2
)
00.5
11.5
22.5
a wy (
ms−2
)
0 1000 2000 3000 4000 5000 6000 7000 80000
0.51
1.52
2.5
a wz (
ms−2
)
Operating time (s)
Figure 24 Running (50% overlap) 10-second r.m.s. weighted acceleration on the seat surface.
53

Annex G: Hitachi EX60LC measured 24th
November 2004
Summary report form: Part 1– vehicle characteristicsVehicle make and model: Hitachi EX60LC-5
Family: Excavator
Kind: Crawler excavator
Serial number: ICIRO54864
Power, kW: 41.0
Machine mass, kg: 6390
Year of manufacture: 2002
Working hours: 3000
Motion system: Steel tracks
Track/tyre width, m: 0.450
Driver’s seat make and model: Kab 411
Seat stroke: 100
Adjustment: Weight adjustment setting was approximately correct for driver
Driver mass, kg: 82
Driver height, m: 1.82
Driver age: 53
Driver experience: high
Vehicle tool: Hydraulic crusher
Tool make: NPK
Tool model: 7XA
Year of manufacture: 2004
Tool mass: 700 kg
Serial number: 77684
54
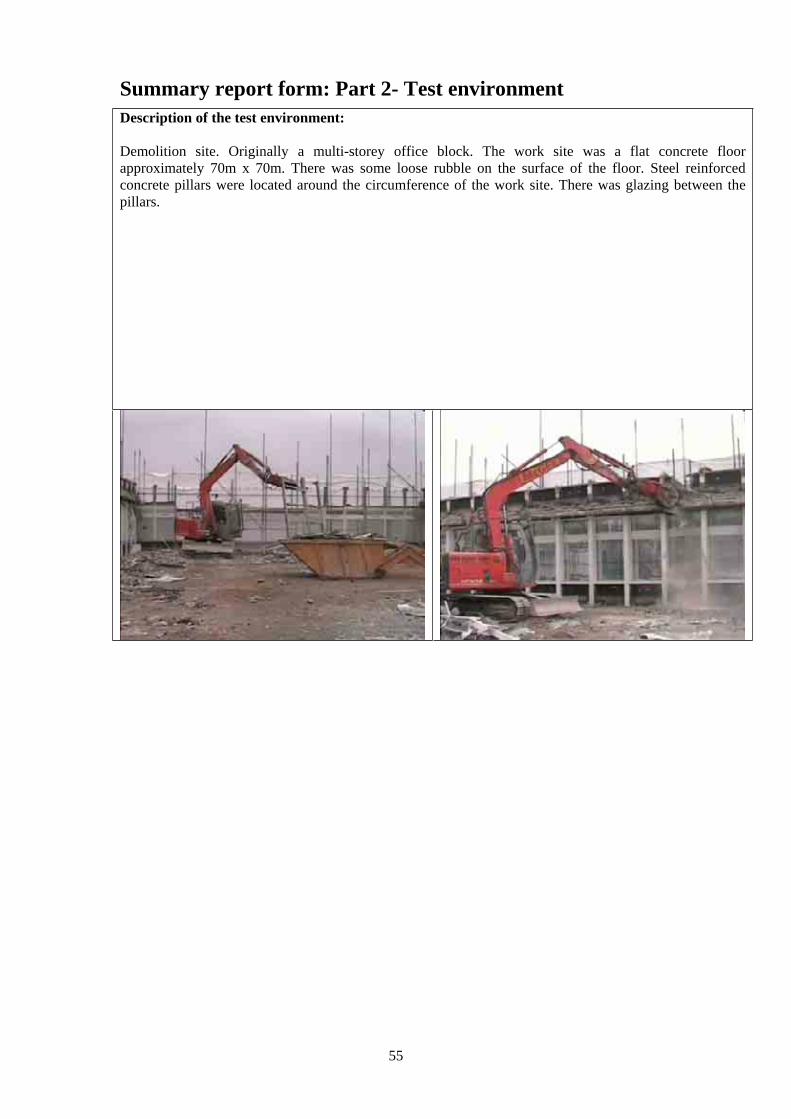
Summary report form: Part 2- Test environment
Description of the test environment:
Demolition site. Originally a multi-storey office block. The work site was a flat concrete floor
approximately 70m x 70m. There was some loose rubble on the surface of the floor. Steel reinforced
concrete pillars were located around the circumference of the work site. There was glazing between the
pillars.
55

Summary report form: Part 3– Vehicle usage
Description of the operating patterns in which this vehicle is used:
During the measurement period the machine was mainly involved in demolishing a wall consisting of a concrete frame with large windows. The concrete structure was crushed in selected places and pulled to the ground. The windows and supportingstructure were lifted clear and the fallen concrete structure was partially broken up.The machine also cleared loose concrete and other items into skips.
Times for which the vehicle is used in each operating pattern by day and week, with
seasonal variations:
Operators commentated that the operating patterns for this type of machine were highly
variable depending on the nature of the site. Typically the machine would be used for up to 8
hours during a shift.
The operators observed no weekly or seasonal patterns. The prime factor affecting the vehicle
operating patterns was the immediate requirements of the site.
Comments on specific factors likely to affect the vibration exposure and methods by
which the vibration exposure may be reduced:
Peaks were recorded in the vibration time-histories associated with the machine travelling
over loose rubble on the floor. Insuring that the floor around the machine is clear of rubble
could reduce the vibration exposure of the driver.
The operator was observed to use the unpowered tool to ‘hammer’ down upon a beam to
remove loose concrete from it. This event was associated with a peak in the time history.
56
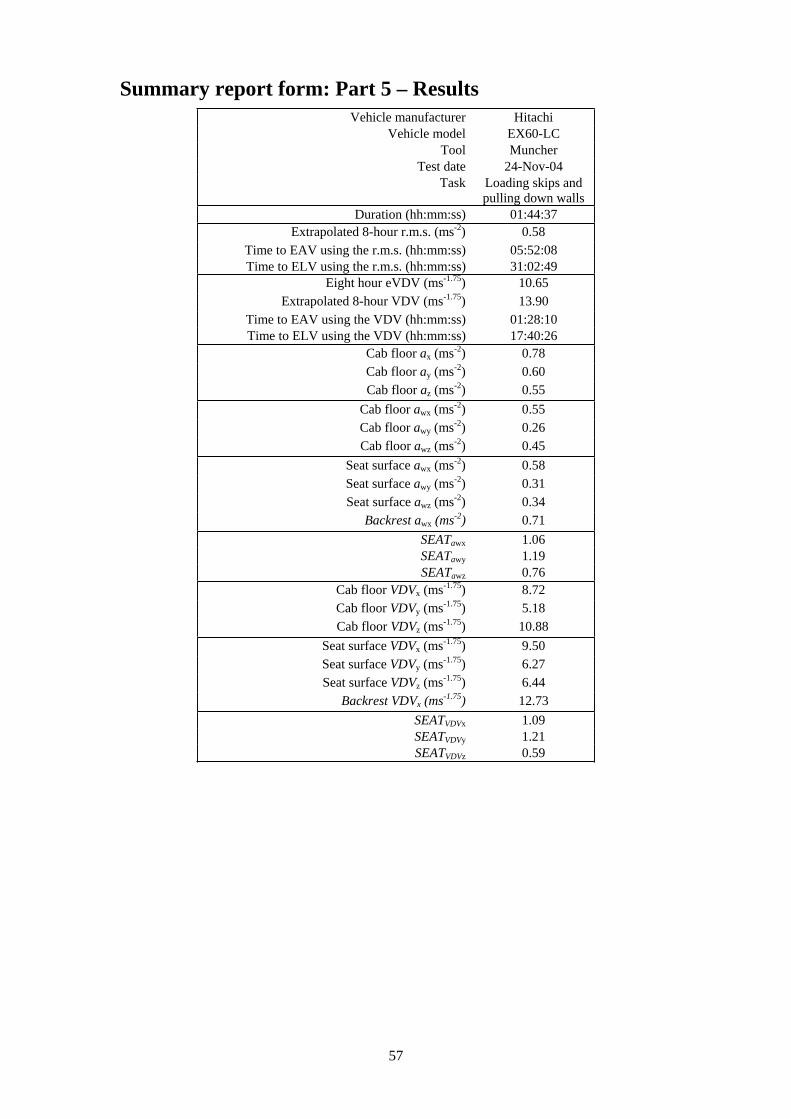
Summary report form: Part 5 – Results
Vehicle manufacturer Hitachi
Vehicle model EX60-LC
Tool Muncher
Test date 24-Nov-04
Task Loading skips and
pulling down walls
Duration (hh:mm:ss) 01:44:37
Extrapolated 8-hour r.m.s. (ms-2) 0.58
Time to EAV using the r.m.s. (hh:mm:ss) 05:52:08
Time to ELV using the r.m.s. (hh:mm:ss) 31:02:49
Eight hour eVDV (ms-1.75) 10.65
Extrapolated 8-hour VDV (ms-1.75) 13.90
Time to EAV using the VDV (hh:mm:ss) 01:28:10
Time to ELV using the VDV (hh:mm:ss) 17:40:26
Cab floor ax (ms-2) 0.78
Cab floor ay (ms-2) 0.60
Cab floor az (ms-2) 0.55
Cab floor awx (ms-2) 0.55
Cab floor awy (ms-2) 0.26
Cab floor awz (ms-2) 0.45
Seat surface awx (ms-2) 0.58
Seat surface awy (ms-2) 0.31
Seat surface awz (ms-2) 0.34
Backrest awx (ms-2) 0.71
SEATawx 1.06
SEATawy 1.19
SEATawz 0.76
Cab floor VDVx (ms-1.75) 8.72
Cab floor VDVy (ms-1.75) 5.18
Cab floor VDVz (ms-1.75) 10.88
Seat surface VDVx (ms-1.75) 9.50
Seat surface VDVy (ms-1.75) 6.27
Seat surface VDVz (ms-1.75) 6.44
Backrest VDVx (ms-1.75) 12.73
SEATVDVx 1.09
SEATVDVy 1.21
SEATVDVz 0.59
57

10−3
10−2
10−1
100
x−axis
Sea
t bas
e P
SD
((m
s−2)2 H
z−1)
y−axis z−axis
10−3
10−2
10−1
Sea
t sur
face
PS
D((
ms−2
)2 Hz−1
)
10−1
100
101
10−3
10−2
10−1
Bac
kres
t PS
D((
ms−2
)2 Hz−1
)
10−1
100
101
Frequency (Hz)10
−110
010
110
2
Figure 25 Unweighted (—) and frequency-weighted (---) power spectral densitiescalculated with 2456 degrees of freedom and a frequency resolution of 0.10 Hz.
0
1
2
3x−axis
Tra
nsm
issi
bilit
y
y−axis z−axis
−pi/2
0
pi/2
Pha
se (
radi
ans)
0 10 20 30 400
0.5
1
Coh
eren
ce
0 10 20 30 40Frequency (Hz)
0 10 20 30 40 50
Figure 26 Seat transfer functions calculated using the CSD method with 2456degrees of freedom and a frequency resolution of 0.10 Hz.
58

−10−5
05
10x
acce
lera
tion
(ms−2
)
968 s break here 160 s break here
−10−5
05
10
y ac
cele
ratio
n(m
s−2)
0 1000 2000 3000 4000 5000 6000 7000
−10−5
05
10
Operating time (s)
z ac
cele
ratio
n(m
s−2)
Figure 27 Frequency-weighted acceleration at the seat surface. Periods of greater than 60 seconds where the vehicle was not operating were excluded. These periodsare indicated by vertical dotted lines.
00.5
11.5
22.5
3
a wx (
ms−2
)
968 s break here 160 s break here
(E1)
(E3)
00.5
11.5
22.5
a wy (
ms−2
)
(E1)
0 1000 2000 3000 4000 5000 6000 70000
0.51
1.52
2.5
a wz (
ms−2
)
Operating time (s)
(E2)
Figure 28 Running (50% overlap) 10-second r.m.s. weighted acceleration on the seat surface. Periods of greater than 60 seconds where the vehicle was not operatingwere excluded from the analysis. These periods are indicated by vertical dotted lines.
59

Annex H: Hitachi EX455 measured 9th
Dec 2004
Summary report form: Part 1– vehicle characteristics
Vehicle make and model: Hitachi EX455
Family: Excavator
Kind: Crawler excavator
Serial number: 0224
Power, kW: 225
Machine mass, kg: 47000
Year of manufacture: 2002
Working hours: 4591
Motion system: Steel tracks
Track/tyre width, m: 0.6
Driver’s seat make and model: Unknown
Seat stroke: 125
Adjustment: Weight adjustment setting was approximately correct for driver
Driver mass, kg: 86
Driver height, m: 1.78
Driver age: 52
Driver experience: high
Vehicle tool: Hydraulic crusher
Tool make: Allied
Tool model: Unknown
Year of manufacture: Unknown
Tool mass: Unknown
Serial number: Unknown
60

61

Summary report form: Part 2- Test environment
Description of the test environment:
The site was originally a multi-story car park. The work site consisted of a mixture of rubble, earth and flat
concrete. A small section of the structure of the multi-storey car park remained.
62
Summary report form: Part 3– Vehicle usage
Description of the operating patterns in which this vehicle is used:
The machine was employed crushing steel-reinforced concrete beams to separatethe steel reinforcement and reduce the concrete to loose rubble. The machine thenspent approximately 8 minutes ‘munching’ concrete from upper storey floor section ofa partially demolished building.
Times for which the vehicle is used in each operating pattern by day and week, with
seasonal variations:
Operators commentated that the operating patterns for this type of machine were highly
variable depending on the nature of the site. Typically the machine would be used for up to 8
hours during a shift.
The operators observed no weekly or seasonal patterns. The prime factor affecting the vehicle
operating patterns was the immediate requirements of the site.
Comments on specific factors likely to affect the vibration exposure and methods by
which the vibration exposure may be reduced:
Peaks were recorded in the vibration time histories associated with the back of the machine
impacting the ground. This occurred when tool was used to pull at a section of the building
such that the back of the machine lifted off the ground; when the structure gave way the back
of the machine impacted with the ground.
Peaks in the vibration time histories occurred when the machine tracked over rubble. By
clearing a site of rubble before performing breaking operations the vibration exposure of the
operator could be reduced.
63
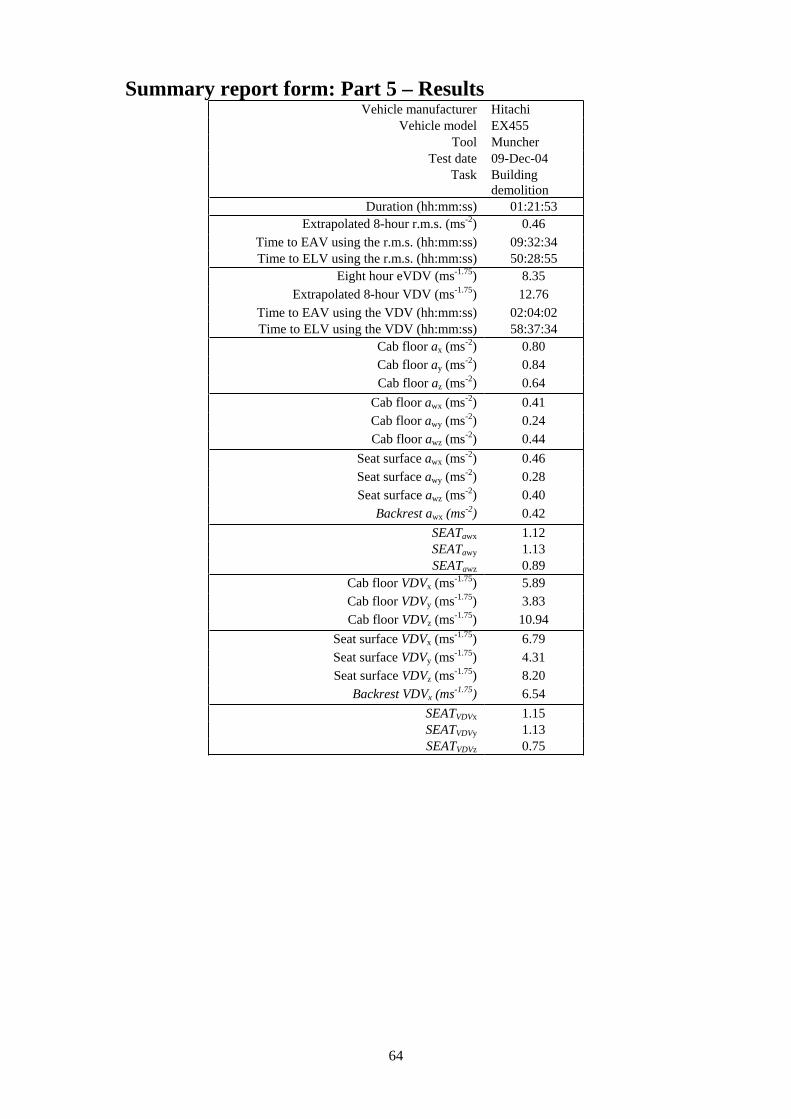
Summary report form: Part 5 – ResultsVehicle manufacturer Hitachi
Vehicle model EX455
Tool Muncher
Test date 09-Dec-04
Task Building
demolition
Duration (hh:mm:ss) 01:21:53
Extrapolated 8-hour r.m.s. (ms-2) 0.46
Time to EAV using the r.m.s. (hh:mm:ss) 09:32:34
Time to ELV using the r.m.s. (hh:mm:ss) 50:28:55
Eight hour eVDV (ms-1.75) 8.35
Extrapolated 8-hour VDV (ms-1.75) 12.76
Time to EAV using the VDV (hh:mm:ss) 02:04:02
Time to ELV using the VDV (hh:mm:ss) 58:37:34
Cab floor ax (ms-2) 0.80
Cab floor ay (ms-2) 0.84
Cab floor az (ms-2) 0.64
Cab floor awx (ms-2) 0.41
Cab floor awy (ms-2) 0.24
Cab floor awz (ms-2) 0.44
Seat surface awx (ms-2) 0.46
Seat surface awy (ms-2) 0.28
Seat surface awz (ms-2) 0.40
Backrest awx (ms-2) 0.42
SEATawx 1.12
SEATawy 1.13
SEATawz 0.89
Cab floor VDVx (ms-1.75) 5.89
Cab floor VDVy (ms-1.75) 3.83
Cab floor VDVz (ms-1.75) 10.94
Seat surface VDVx (ms-1.75) 6.79
Seat surface VDVy (ms-1.75) 4.31
Seat surface VDVz (ms-1.75) 8.20
Backrest VDVx (ms-1.75) 6.54
SEATVDVx 1.15
SEATVDVy 1.13
SEATVDVz 0.75
64

10−3
10−2
10−1
100
x−axis
Sea
t bas
e P
SD
((m
s−2)2 H
z−1)
y−axis z−axis
10−3
10−2
10−1
Sea
t sur
face
PS
D((
ms−2
)2 Hz−1
)
10−1
100
101
10−3
10−2
10−1
Bac
kres
t PS
D((
ms−2
)2 Hz−1
)
10−1
100
101
Frequency (Hz)10
−110
010
110
2
Figure 29 Unweighted (—) and frequency-weighted (---) power spectral densitiescalculated with 1920 degrees of freedom and a frequency resolution of 0.10 Hz.
0
1
2
3x−axis
Tra
nsm
issi
bilit
y
y−axis z−axis
−pi/2
0
pi/2
Pha
se (
radi
ans)
0 10 20 30 400
0.5
1
Coh
eren
ce
0 10 20 30 40Frequency (Hz)
0 10 20 30 40 50
Figure 30 Seat transfer functions calculated using the CSD method with 1920degrees of freedom and a frequency resolution of 0.10 Hz.
65

−15−10−5
05
1015
x ac
cele
ratio
n(m
s−2)
−15−10−5
05
1015
y ac
cele
ratio
n(m
s−2)
0 1000 2000 3000 4000 5000
−15−10−5
05
1015
Operating time (s)
z ac
cele
ratio
n(m
s−2)
Figure 31 Frequency-weighted acceleration at the seat surface.
00.5
11.5
22.5
3
a wx (
ms−2
)
00.5
11.5
22.5
a wy (
ms−2
)
0 1000 2000 3000 4000 50000
0.51
1.52
2.5
a wz (
ms−2
)
Operating time (s)
(E1)
(E2) (E3)
Figure 32 Running (50% overlap) 10-second r.m.s. weighted acceleration on the seat surface.
66

Annex I: Case CX210 measured 9th
December 2004
Summary report form: Part 1– vehicle characteristicsVehicle make and model: Case CX210
Family: Excavator
Kind: Crawler excavator
Serial number: DCH21B0695
Power, kW: 105
Machine mass, kg: 20900
Year of manufacture: 2002
Working hours: 3699
Motion system: Steel tracks
Track/tyre width, m: 0.8
Driver’s seat make and model: Kab 555
Seat stroke: 125
Adjustment: Weight adjustment setting was approximately correct for driver
Driver mass, kg: 83
Driver height, m: 1.80
Driver age: 28
Driver experience: high
Vehicle tool: Backhoe shovel
Tool make: Geith
Tool model: 5 foot bucket
Year of manufacture: unknown
Tool mass: unknown
Serial number: unknown
67
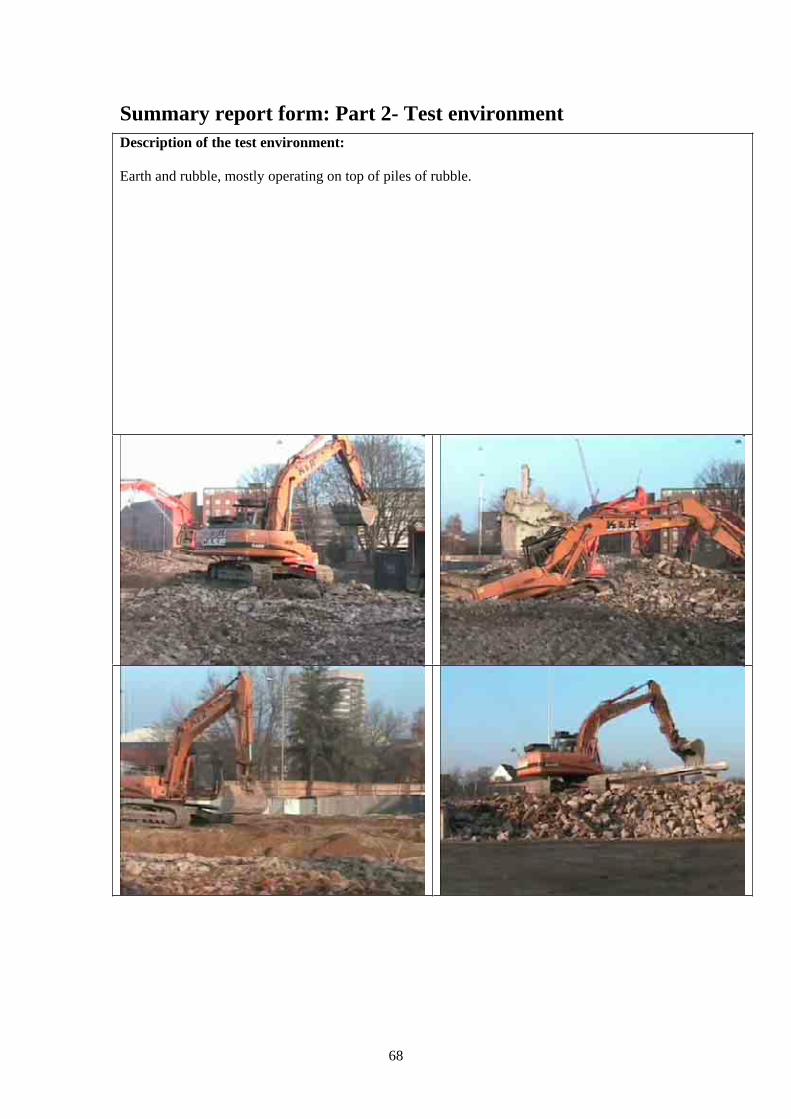
Summary report form: Part 2- Test environment
Description of the test environment:
Earth and rubble, mostly operating on top of piles of rubble.
68

Summary report form: Part 3– Vehicle usage
Description of the operating patterns in which this vehicle is used:
The machine was employed loading rubble into trucks. For most of the observed working
time the machine was positioned on top of approximately flat-topped rubble piles. There were
some pauses in the region of two minutes when the machine stationary waiting for the next
truck to arrive.
Times for which the vehicle is used in each operating pattern by day and week, with
seasonal variations:
Operators commentated that the operating patterns for this type of machine were highly
variable depending on the nature of the site. Typically the machine would be used for up to 8
hours during a shift.
The operators observed no weekly or seasonal patterns. The prime factor affecting the vehicle
operating patterns was the immediate requirements of the site.
Comments on specific factors likely to affect the vibration exposure and methods by
which the vibration exposure may be reduced:
Recorded vibration exposures were quite low on this vehicle. The highest levels of vibration
occurred when the vehicle was tracking around the site. Reducing the amount of tracking the
vehicle performs during a working day could reduce the vibration exposure of operators.
69

Summary report form: Part 5 – ResultsVehicle manufacturer CASE
Vehicle model CX210
Tool Shovel
Test date 09-Dec-04
Task Loading rubble
Duration (hh:mm:ss) 02:07:16
Extrapolated 8-hour r.m.s. (ms-2) 0.46
Time to EAV using the r.m.s. (hh:mm:ss) 09:26:32
Time to ELV using the r.m.s. (hh:mm:ss) 49:56:59
Eight hour eVDV (ms-1.75) 8.39
Extrapolated 8-hour VDV (ms-1.75) 10.84
Time to EAV using the VDV (hh:mm:ss) 03:58:05
Time to ELV using the VDV (hh:mm:ss) 112:32:19
Cab floor ax (ms-2) 0.75
Cab floor ay (ms-2) 0.54
Cab floor az (ms-2) 0.51
Cab floor awx (ms-2) 0.42
Cab floor awy (ms-2) 0.24
Cab floor awz (ms-2) 0.40
Seat surface awx (ms-2) 0.46
Seat surface awy (ms-2) 0.26
Seat surface awz (ms-2) 0.27
Backrest awx (ms-2) 0.47
SEATawx 1.09
SEATawy 1.10
SEATawz 0.68
Cab floor VDVx (ms-1.75) 6.90
Cab floor VDVy (ms-1.75) 4.57
Cab floor VDVz (ms-1.75) 9.53
Seat surface VDVx (ms-1.75) 7.78
Seat surface VDVy (ms-1.75) 5.09
Seat surface VDVz (ms-1.75) 4.76
Backrest VDVx (ms-1.75) 8.00
SEATVDVx 1.13
SEATVDVy 1.11
SEATVDVz 0.50
70

10−3
10−2
10−1
100
x−axisS
eat b
ase
PS
D((
ms−2
)2 Hz−1
)
y−axis z−axis
10−3
10−2
10−1
Sea
t sur
face
PS
D((
ms−2
)2 Hz−1
)
10−1
100
101
10−3
10−2
10−1
Bac
kres
t PS
D((
ms−2
)2 Hz−1
)
10−1
100
101
Frequency (Hz)10
−110
010
110
2
Figure 33 Unweighted (—) and frequency-weighted (---) power spectral densitiescalculated with 2988 degrees of freedom and a frequency resolution of 0.10 Hz.
0
1
2
3x−axis
Tra
nsm
issi
bilit
y
y−axis z−axis
−pi/2
0
pi/2
Pha
se (
radi
ans)
0 10 20 30 400
0.5
1
Coh
eren
ce
0 10 20 30 40Frequency (Hz)
0 10 20 30 40 50
Figure 34 Seat transfer functions calculated using the CSD method with 2988degrees of freedom and a frequency resolution of 0.10 Hz.
71

−5
0
5x
acce
lera
tion
(ms−2
)
493 s break here
−5
0
5
y ac
cele
ratio
n(m
s−2)
0 1000 2000 3000 4000 5000 6000 7000 8000
−5
0
5
Operating time (s)
z ac
cele
ratio
n(m
s−2)
Figure 35 Frequency-weighted acceleration at the seat surface. Periods where the driver exited the vehicle are excluded. These periods are indicated by vertical dottedlines.
00.5
11.5
22.5
3
a wx (
ms−2
)
493 s break here
(E1)(E2) (E3)
00.5
11.5
22.5
a wy (
ms−2
)
0 1000 2000 3000 4000 5000 6000 7000 80000
0.51
1.52
2.5
a wz (
ms−2
)
Operating time (s)
Figure 36 Running (50% overlap) 10-second r.m.s. weighted acceleration on the seat surface. Periods of greater than 60 seconds where the vehicle was not operatingwere excluded from the analysis. These periods are indicated by vertical dotted lines.
72

Annex J: Hitachi ZX460LCH measured 22nd
December 2004
Summary report form: Part 1– vehicle characteristicsVehicle make and model: Hitachi ZX460LCH
Family: Excavator
Kind: Crawler excavator fitted with an 8 meter boom for extended reach.
Serial number: 050003
Power, kW: 235
Machine mass, kg: 47400
Year of manufacture: 2004
Working hours: unknown
Motion system: Steel tracks
Track/tyre width, m: 0.6
Driver’s seat make and model: Unknown
Seat stroke: 125
Adjustment: Weight adjustment setting was approximately correct for driver
Driver mass, kg: 90
Driver height, m: 1.78
Driver age: 57
Driver experience: high
Vehicle tool: Rotary steel shears
Tool make: MMR
Tool model: unknown
Year of manufacture: unknown
Tool mass: unknown
Serial number: 3096
73

Summary report form: Part 2- Test environment
Description of the test environment:
Flat, hard roadway. This appeared to be damaged in places by the passage of the vehicle.
74

Summary report form: Part 3– Vehicle usage
Description of the operating patterns in which this vehicle is used:
The machine was employed dismantling an aluminium grain silo using steel shears.The machine was stationary for most of the measurement period. However, the operator repositioned the machine a number of times during the measurementperiod.
Times for which the vehicle is used in each operating pattern by day and week, with
seasonal variations:
Operators commentated that the operating patterns for this type of machine were highly
variable depending on the nature of the site. Typically the machine would be used for up to 8
hours during a shift.
The operators observed no weekly or seasonal patterns. The prime factor affecting the vehicle
operating patterns was the immediate requirements of the site.
Comments on specific factors likely to affect the vibration exposure and methods by
which the vibration exposure may be reduced:
Vibration levels recorded on this machine were relatively low. Periods when the vehicle was
tracking to different location on the sire were responsible for the greatest levels of measured
vibration.
75

Summary report form: Part 5 – Results Vehicle manufacturer Hitachi
Vehicle model ZX460LCH
extended reach
Tool Rotary steel shears
Test date 22-Dec-04
Task Cutting metal
structures
Duration (hh:mm:ss) 1:29:15
Extrapolated 8-hour r.m.s. (ms-2) 0.20
Time to EAV using the r.m.s. (hh:mm:ss) 50:13:54
Time to ELV using the r.m.s. (hh:mm:ss) 265:43:30
Eight hour eVDV (ms-1.75) 3.64
Extrapolated 8-hour VDV (ms-1.75) 4.94
Time to EAV using the VDV (hh:mm:ss) 91:50:12
Time to ELV using the VDV (hh:mm:ss) 2604:31:12
Cab floor ax (ms-2) 0.33
Cab floor ay (ms-2) 0.52
Cab floor az (ms-2) 0.30
Cab floor awx (ms-2) 0.17
Cab floor awy (ms-2) 0.13
Cab floor awz (ms-2) 0.22
Seat surface awx (ms-2) 0.20
Seat surface awy (ms-2) 0.15
Seat surface awz (ms-2) 0.19
Backrest awx (ms-2) 0.22
SEATawx 1.16
SEATawy 1.16
SEATawz 0.86
Cab floor VDVx (ms-1.75) 2.73
Cab floor VDVy (ms-1.75) 2.11
Cab floor VDVz (ms-1.75) 3.81
Seat surface VDVx (ms-1.75) 3.25
Seat surface VDVy (ms-1.75) 2.34
Seat surface VDVz (ms-1.75) 3.24
Backrest VDVx (ms-1.75) 3.30
SEATVDVx 1.19
SEATVDVy 1.11
SEATVDVz 0.85
76

10−3
10−2
10−1
100
x−axis
Sea
t bas
e P
SD
((m
s−2)2 H
z−1)
y−axis z−axis
10−3
10−2
10−1
Sea
t sur
face
PS
D((
ms−2
)2 Hz−1
)
10−1
100
101
10−3
10−2
10−1
Bac
kres
t PS
D((
ms−2
)2 Hz−1
)
10−1
100
101
Frequency (Hz)10
−110
010
110
2
Figure 37 Unweighted (—) and frequency-weighted (---) power spectral densitiescalculated with 2096 degrees of freedom and a frequency resolution of 0.10 Hz.
0
1
2
3x−axis
Tra
nsm
issi
bilit
y
y−axis z−axis
−pi/2
0
pi/2
Pha
se (
radi
ans)
0 10 20 30 400
0.5
1
Coh
eren
ce
0 10 20 30 40Frequency (Hz)
0 10 20 30 40 50
Figure 38 Seat transfer functions calculated using the CSD method with 2096degrees of freedom and a frequency resolution of 0.10 Hz.
77
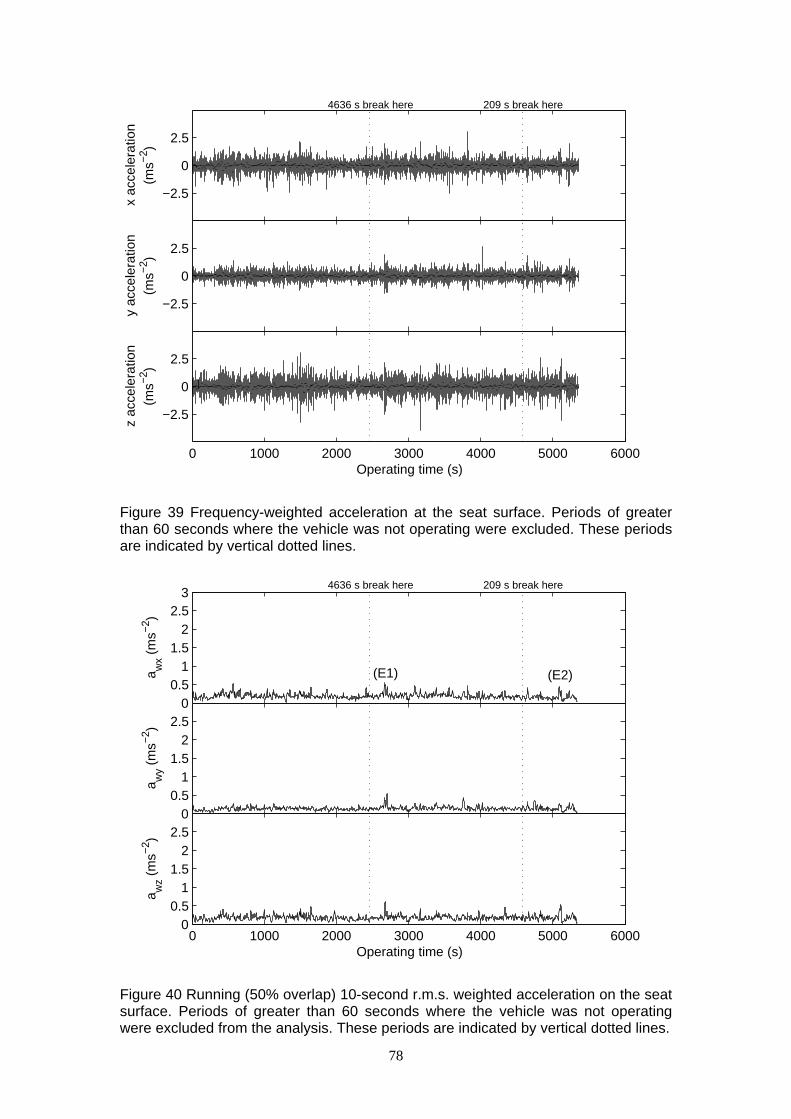
−2.5
0
2.5x
acce
lera
tion
(ms−2
)
4636 s break here 209 s break here
−2.5
0
2.5
y ac
cele
ratio
n(m
s−2)
0 1000 2000 3000 4000 5000 6000
−2.5
0
2.5
Operating time (s)
z ac
cele
ratio
n(m
s−2)
Figure 39 Frequency-weighted acceleration at the seat surface. Periods of greater than 60 seconds where the vehicle was not operating were excluded. These periodsare indicated by vertical dotted lines.
00.5
11.5
22.5
3
a wx (
ms−2
)
4636 s break here 209 s break here
(E1) (E2)
00.5
11.5
22.5
a wy (
ms−2
)
0 1000 2000 3000 4000 5000 60000
0.51
1.52
2.5
a wz (
ms−2
)
Operating time (s)
Figure 40 Running (50% overlap) 10-second r.m.s. weighted acceleration on the seat surface. Periods of greater than 60 seconds where the vehicle was not operatingwere excluded from the analysis. These periods are indicated by vertical dotted lines.
78

79

Printed and published by the Health and Safety ExecutiveC30 1/98
Printed and published by the Health and Safety ExecutiveC1.10 10/05

RR 377
£25.00 9 78071 7 661 5 5 8
ISBN 0-7176-6155-5
Eva
lua
tion
of w
ho
le-b
od
y vibra
tion
exp
osu
res in
British
ind
ustry
HS
EB
OO
KS