research programs - mdt.mt.gov · research programs evaluation of the ... figure 32. permeability...
TRANSCRIPT

R E S E A R C H P R O G R A M S
EVALUATION OF THE ENGINEERING CHARACTERISTICS OF RAP/AGGREGATE BLENDS
Final Reportprepared forTHE STATE OF MONTANADEPARTMENT OF TRANSPORTATION
in cooperation withTHE U.S. DEPARTMENT OF TRANSPORTATIONFEDERAL HIGHWAY ADMINISTRATION
August 2005prepared byDr. Robert L. Mokwa, P.E.Cole S. Peebles
Department of Civil EngineeringMontana State University205 Cobleigh HallBozeman MT 59717
FHWA/MT-05-008/8117-24

You are free to copy, distribute, display, and perform the work; make derivative works; make commercial use of the work under the condition that you give the original author and sponsor credit. For any reuse or distribution, you must make clear to others the license terms of this work. Any of these conditions can be waived if you get permission from the sponsor. Your fair use and other rights are in no way affected by the above.

EVALUATION OF THE ENGINEERING CHARACTERISTICS OF RAP/AGGREGATE BLENDS
Prepared by: Robert L. Mokwa and Cole S. Peebles Department of Civil Engineering Montana State University 205 Cobleigh Hall Bozeman, MT 59717 Prepared for: Montana Department of Transportation Research Programs Helena, Montana
July 2005

ii
TECHNICAL REPORT DOCUMENTATION PAGE
1. Report No. FHWA/MT-05-008/8117-24
2. Government Accession No.
3. Recipient's Catalog
No.
5. Report Date July 2005
4. Title and Subtitle Evaluation of the Engineering Characteristics of
RAP/Aggregate Blends
6. Performing Organization Code
7. Author(s) Robert L. Mokwa and Cole S. Peebles
8. Performing Organization Report No.
10. Work Unit No.
9. Performing Organization Name and Address
Civil Engineering Department Montana State University
Bozeman, MT 59717
11. Contract or Grant No.
8117-24
13. Type of Report and Period Covered Final Report for the period covering: June 2004
to June 2005
12. Sponsoring Agency Name and Address
Research Programs Montana Department of Transportation
2701 Prospect Avenue PO Box 201001
Helena MT 59620-1001
14. Sponsoring Agency Code 5401
15. Supplementary Notes Research performed in cooperation with the Montana Department of Transportation and the US Department of Transportation, Federal Highway Administration. This report can be found at http://www.mdt.mt.gov/research/projects/mat/rap_aggregate.shtml.
16. Abstract
This report describes results from a research program that was structured to evaluate the suitability of using reclaimed and recycled asphalt pavement (RAP) as an additive to crushed angular aggregate or pit run granular soils. Research and testing were conducted to evaluate the suitability of RAP blends in terms of significant changes observed in relatively easily measured and quantifiable properties. The laboratory testing program consisted of grain size analyses, specific gravity tests, modified Proctor compaction tests, relative density tests, Los Angeles abrasion tests, direct shear tests, permeability tests, R-value tests, and x-ray CT scans.
Based on this study, it is concluded that the outlook for the continued implementation of RAP as an additive to granular base and subbase materials for use in highway construction looks promising. Results from the extensive suite of laboratory tests indicate that blending asphalt millings with granular cohesionless material like crushed aggregate or pit run cohesionless soil results in only minor changes to the engineering properties of the virgin material. This report describes the laboratory testing program and discusses the results in terms of the suitability of integrating recycled materials (RAP/aggregate blends) into asphalt pavement sections.
17. Key Words
RAP, Reclaimed Asphalt Pavement, Recycled Base Course, Asphalt Millings
18. Distribution Statement
Unrestricted. This document is available through the National Technical Information
Service, Springfield, VA 21161.
19. Security Classif. (of this report)
Unclassified
20. Security Classif. (of this page)
Unclassified
21. No. of Pages
100
22. Price

iii
DISCLAIMER STATEMENT
This document is disseminated under the sponsorship of the Montana Department of Transportation and the United States Department of Transportation in the interest of information exchange. The State of Montana and the United States Government assume no liability of its contents or use thereof.
The contents of this report reflect the views of the authors, who are responsible for the facts and accuracy of the data presented herein. The contents do not necessarily reflect the official policies of the Montana Department of Transportation or the United States Department of Transportation.
The State of Montana and the United States Government do not endorse products of manufacturers. Trademarks or manufacturers' names appear herein only because they are considered essential to the object of this document.
This report does not constitute a standard, specification, or regulation.
ALTERNATIVE FORMAT STATEMENT
The Montana Department of Transportation attempts to provide reasonable accommodations for any known disability that may interfere with a person participating in any service, program, or activity of the Department. Alternative accessible formats of this document will be provided upon request. For further information, call (406) 444-7693 or TTY (406) 444-7696.
ACKNOWLEDGEMENTS
The author gratefully acknowledges the valuable contributions of Bill Henning, Richard Jackson, and Bob Weber for their assistance in providing information and materials for this study. Special thanks and acknowledgement are extended to Mike Lynch for conducting the R-value tests. Additional acknowledgements are extended to Montana State University students Cole Peebles, Nick Trimble, Eli Robinson, and Brent Nielsen for their hard work and contributions in conducting the laboratory tests.
Acknowledgement of financial support for this research is extended to the: Montana Department of Transportation, Montana State University Undergraduate Scholars Program (USP), Montana State University Civil Engineering Department, National Science Foundation Research Experience for Undergraduates Program (NSF/REU), and the American Indian Research Opportunities (AIRO) Program.

iv
TABLE OF CONTENTS
Technical Report Documentation Page............................................................................................ii
Disclaimer Statement ....................................................................................................................... iii
Acknowledgements........................................................................................................................... iii
Table of Contents ..............................................................................................................................iv
List of Figures .....................................................................................................................................v
List of Tables.....................................................................................................................................vii
Executive Summary ....................................................................................................................... viii
1.0 Introduction ............................................................................................................................1 1.01 Background ..............................................................................................................................1 1.02 Objectives and Scope ...............................................................................................................2
2.0 Literature Review...................................................................................................................3 2.01 Background ..............................................................................................................................3
3.0 Laboratory Tests ....................................................................................................................5 3.01 Grain Size Distribution Analysis .............................................................................................8 3.02 Specific Gravity........................................................................................................................8 3.03 Proctor Impact Compaction Tests ............................................................................................9 3.04 Relative Density .....................................................................................................................10 3.05 Los Angeles Abrasion Tests...................................................................................................10 3.06 Direct Shear Tests ..................................................................................................................11 3.07 Permeability Tests ..................................................................................................................12 3.08 R-Value Tests.........................................................................................................................15 3.09 X-Ray Computed Tomography Scans....................................................................................16
4.0 Discussion of Results ............................................................................................................18 4.01 Grain Size Distribution Analysis ...........................................................................................18 4.02 Specific Gravity......................................................................................................................19 4.03 Proctor Impact Compaction Tests ..........................................................................................19 4.04 Relative Density .....................................................................................................................26 4.05 Los Angeles Abrasion Tests...................................................................................................26 4.06 Direct Shear Tests ..................................................................................................................27 4.07 Permeability Tests ..................................................................................................................45 4.08 R-Value Tests.........................................................................................................................48 4.09 X-Ray Computed Tomography Scans....................................................................................50
5.0 Results and Recommendations ...........................................................................................52 5.01 Summary of Results ...............................................................................................................52 5.02 Conclusions and Recommendations ......................................................................................53
6.0 References .............................................................................................................................55
Appendix A Grain Size Distribution Curves..........................................................................57
Appendix B Direct Shear Stress-Displacement Curves ........................................................64
Appendix C R-Value Test Reports..........................................................................................73
Appendix D X-Ray Computed Tomography Scans...............................................................90

v
LIST OF FIGURES
FIGURE 1. Grain size distribution plots of the unblended materials. ............................................... 8 FIGURE 2. Photo of the Gilson asphalt vibro-deairator. .................................................................. 9 FIGURE 3. Los Angeles abrasion test machine............................................................................. 10 FIGURE 4. Photos of the large direct shear testing apparatus. ..................................................... 11 FIGURE 5. Preparing a sample in the large shear box. ................................................................. 12 FIGURE 6. 10-in-dia. constant head permeameter........................................................................ 13 FIGURE 7. Schematic of permeameter by Trautwein Soil Testing Equipment Co. ....................... 15 FIGURE 8. CT scan of 50% pit run with 50% RAP. ....................................................................... 17 FIGURE 9. Grain size distribution curves for the CBC#2 mixes. ................................................... 18 FIGURE 10. Grain size distribution curves for the pit run mixes. ................................................... 19 FIGURE 11. Modified Proctor compaction curves for CBC #1 blends. .......................................... 21 FIGURE 12. Modified Proctor compaction curves for CBC #2 blends. .......................................... 22 FIGURE 13. Modified Proctor compaction curves for CBC #3 blends. .......................................... 23 FIGURE 14. Modified Proctor compaction curves for pit run blends.............................................. 24 FIGURE 15. Gradation curves before and after impact compaction for the 50/50 CBC #2. .......... 25 FIGURE 16. Gradation curves before and after impact compaction for the 50/50 Pit Run. ........... 26 FIGURE 17. Shear-displacement diagrams for the CBC #3 blends............................................... 28 FIGURE 18. Shear-displacement diagrams for the pit run blends. ................................................ 29 FIGURE 19. Relationship between shear strength and RAP content. ........................................... 30 FIGURE 20. Secant moduli for CBC #3 with 50% RAP, at 1% and 10% lateral strain. ................. 32 FIGURE 21. Relationship between modulus and RAP content: (a) CBC #3, (b) Pit Run. ............. 33 FIGURE 22. Shear strength failure envelope for CBC #3 (no RAP). ............................................. 35 FIGURE 23. Shear strength failure envelope for CBC #3 with 20% RAP. ..................................... 36 FIGURE 24. Shear strength failure envelope for CBC #3 with 50% RAP. ..................................... 37 FIGURE 25. Shear strength failure envelope for CBC #3 with 75% RAP. ...................................... 38 FIGURE 26. Shear strength failure envelope for pit run (no RAP). ................................................ 39 FIGURE 27. Shear strength failure envelope for pit run with 20% RAP......................................... 40 FIGURE 28. Shear strength failure envelope for pit run with 50% RAP......................................... 41 FIGURE 29. Shear strength failure envelope for pit run with 75% RAP......................................... 42 FIGURE 30. Variation of friction angle with confining pressure for CBC #3 blends. ...................... 43 FIGURE 31. Variation of friction angle with confining pressure for pit run blends.......................... 44 FIGURE 32. Permeability test results for RAP/aggregate blends. ................................................. 46 FIGURE 33. Permeability versus percent RAP. ............................................................................. 48 FIGURE 34. Average R-Value as a function of percent RAP......................................................... 50 FIGURE 35. Porosity results from x-ray computed tomography scans.......................................... 51 FIGURE A1. Gradation: CBC #1, no RAP...................................................................................... 58 FIGURE A2. Gradation: CBC #1 with 20% RAP. ........................................................................... 58 FIGURE A3. Gradation: CBC #1 with 50% RAP. ........................................................................... 59 FIGURE A4. Gradation: CBC #2, no RAP...................................................................................... 59 FIGURE A5. Gradation: CBC #2 with 20% RAP. ........................................................................... 60 FIGURE A6. Gradation: CBC #2 with 50% RAP. ........................................................................... 60 FIGURE A7. Gradation: CBC #3, no RAP...................................................................................... 61 FIGURE A8. Gradation: CBC #3 with 20% RAP. ........................................................................... 61 FIGURE A9. Gradation: CBC #3 with 50% RAP. ........................................................................... 62 FIGURE A10. Gradation: Pit Run, no RAP. ................................................................................... 62 FIGURE A11. Gradation: Pit Run with 20% RAP........................................................................... 63 FIGURE A12. Gradation: Pit Run with 50% RAP........................................................................... 63 FIGURE B1. Stress-strain curves for CBC # 3............................................................................... 65 FIGURE B2. Stress-strain curves for Pit Run................................................................................. 66 FIGURE B3. Stress-strain curves for CBC # 3 with 20% RAP....................................................... 67 FIGURE B4. Stress-strain curves for CBC # 3 with 50% RAP....................................................... 68

vi
FIGURE B5. Stress-strain curves for CBC # 3 with 75% RAP....................................................... 69 FIGURE B6. Stress-strain curves for Pit Run with 20% RAP......................................................... 70 FIGURE B7. Stress-strain curves for Pit Run with 50% RAP......................................................... 71 FIGURE B8. Stress-strain curves for Pit Run with 75% RAP......................................................... 72 FIGURE C1. R-Value test report for CBC # 3 (test 1). ................................................................... 74 FIGURE C2. R-Value test report for CBC # 3 (test 2). ................................................................... 75 FIGURE C3. R-Value test report for CBC # 3 with 20% RAP (test 1). ........................................... 76 FIGURE C4. R-Value test report for CBC # 3 with 20% RAP (test 2). ........................................... 77 FIGURE C5. R-Value test report for CBC # 3 with 50% RAP (test 1). ........................................... 78 FIGURE C6. R-Value test report for CBC # 3 with 50% RAP (test 2). ........................................... 79 FIGURE C7. R-Value test report for CBC # 3 with 75% RAP (test 1). ........................................... 80 FIGURE C8. R-Value test report for CBC # 3 with 75% RAP (test 2). ........................................... 81 FIGURE C9. R-Value test report for Pit Run (test 1)...................................................................... 82 FIGURE C10. R-Value test report for Pit Run (test 2).................................................................... 83 FIGURE C11. R-Value test report for Pit Run with 20% RAP (test 1). ........................................... 84 FIGURE C12. R-Value test report for Pit Run with 20% RAP (test 2). ........................................... 85 FIGURE C13. R-Value test report for Pit Run with 50% RAP (test 1). ........................................... 86 FIGURE C14. R-Value test report for Pit Run with 50% RAP (test 2). ........................................... 87 FIGURE C15. R-Value test report for Pit Run with 75% RAP (test 1). ........................................... 88 FIGURE C16. R-Value test report for Pit Run with 75% RAP (test 2). ........................................... 89 FIGURE D1. CT scans for Pit Run. ................................................................................................ 91 FIGURE D2. CT scans for Pit Run with 50% RAP. ........................................................................ 92

vii
LIST OF TABLES
TABLE 1. Summary of Materials Examined in this Study ................................................................ 5 TABLE 2. Summary of Test Results for Unblended Aggregates...................................................... 6 TABLE 3. Summary of Test Results for CBC #1 Rap Blends .......................................................... 6 TABLE 4. Summary of Test Results for CBC #2 Rap Blends .......................................................... 7 TABLE 5. Summary of Test Results for CBC #3 Rap Blends .......................................................... 7 TABLE 6. Summary of Test Results for Pit Run Rap Blends ........................................................... 7 TABLE 7. Summary of Secant Moduli from Large Direct Shear Box Tests ................................... 31 TABLE 8. Relationship Between Friction Angle and Normalized Confining Pressure for CBC #3
Blends ..................................................................................................................................... 43 TABLE 9. Relationship Between Friction Angle and Normalized Confining Pressure for Pit Run
Blends ..................................................................................................................................... 44 TABLE 10. Summary of Strength Parameters from Large Direct Shear Tests .............................. 45 TABLE 11. Summary of Permeability Test Results........................................................................ 47 TABLE 12. Summary of Dry Unit Weights and Relative Densities for Permeability Samples........ 47 TABLE 13. Summary of R-Value Test Results............................................................................... 50

viii
EXECUTIVE SUMMARY
Construction using recycled materials has become more popular in North America over the past two decades. In transportation projects, emphasis has been placed on finding innovative uses for milled asphaltic pavement that is generated in large quantities during highway reconstruction. One approach for reducing waste (and cost) is known as cold in-place recycling (CIR), in which reclaimed asphalt pavement (RAP) is blended with soil or aggregate and used as a base course or subbase for new road construction. Cold in-place recycling reduces waste of petroleum based products, reduces the quantity of industrial waste in landfills, and conserves natural resources by requiring less virgin aggregate in road construction projects.
This report describes results from a research program that was structured to evaluate the suitability of using reclaimed and recycled asphalt pavement as an additive to aggregate base or granular soils (crushed and screened aggregates or natural soils). The study examined changes that occur in the engineering properties of aggregate materials when mixed with RAP. In addition to a thorough evaluation of published literature on the subject, an extensive suite of laboratory tests were conducted using four different aggregates blended with asphalt millings over a broad range of mix percentages.
Laboratory investigations suggest that the engineering properties of RAP blended soils are comparable with those of virgin aggregates. Gradation analyses indicate that the addition of RAP to virgin materials does not significantly change the particle size distribution. Large-scale constant head permeability tests indicate the permeabilities of RAP blended samples are generally greater than the virgin aggregates. The addition of RAP lowers the specific gravity of the blended material and decreases the dry unit weights. R-value tests indicate that adding recycled asphalt millings to pit run materials results in a higher R-Value. For crushed and screened base course materials, the R-values remain essentially unchanged.
Based on direct shear tests, RAP blends exhibited decreased shear strength and decreased stiffness as the quantity of asphalt millings was increased. The stiffness of the CBC and pit run blends gradually decreased and appeared to converge as the RAP content approached about 75%. At higher levels of RAP, the characteristics of the asphalt millings begin to control the behavior of the blend, resulting in a lower modulus and shear strength. The decreases observed in these values do not appear to be significant, and by no means precludes the use of RAP/aggregate blends in highway pavement sections. Because shear strength and stiffness are highly particle dependent, it is recommended that these parameters be evaluated on a project-by-project basis and further supported by field testing of controlled sections.
The outlook for continued implementation of RAP as an additive to granular base and subbase materials for use in highway construction looks promising. Results from laboratory tests indicate that blending asphalt millings with granular cohesionless material like crushed aggregate or pit run soil results in only minor changes to the engineering properties of the virgin material. However, the long-term field performance of RAP blends should be evaluated to further examine potential problems that could result from material degradation, creep, and decreases in permeability.
This report describes the laboratory testing program and discusses the results in terms of the suitability of integrating recycled materials (RAP/aggregate blends) into highway construction projects. The implications of this study should be further investigated by evaluating projects in which RAP mixtures have already been used, and by constructing and evaluating the performance of controlled test sections. The long-term performance of RAP mixtures used as base and subbase courses should be evaluated, and if viable, limits should be established on the maximum amount of RAP allowed in the mixture.

1
1.0 INTRODUCTION
1.01 Background The use of recycled materials in construction projects has become increasingly more
prevalent in the United States over the past 20 years. Based on a national survey of state highway agencies in 1996, it was reported that approximately 50 million tons of asphalt paving material are currently being milled annually (Collins and Ciesielski 1996). The quantity of milling continually increases as evidenced by a 2004 nation-wide survey, which reported that on average more than 91 million tons of asphalt is being milled annually in the United States (Asphalt Pavement Alliance 2004). Other reports estimate the amount of asphalt pavement removed yearly exceeds 100 million tons (Bushmeyer 2004). Closer to home, state construction records show that a large quantity of waste asphalt material is generated every year on Montana Department of Transportation (MDT) projects. For example, from 2001 to 2004 approximately 156 million square feet of asphalt surface was milled on reconstruction projects in the state of Montana alone (based on yearly construction price records compiled by MDT). Assuming the average mill depth was about 0.2 ft, this translates to almost 300,000 cy of material over just a four year period. These facts and figures clearly indicate there is a supply of available milled asphalt that could possibly be recycled on highway construction or reconstruction projects. An unreported percentage of the millings generated in Montana are already being recycled by local agencies for surfacing rural roads and as an additive to hot-mix and cold-mix AC surface courses. Additional possibilities for recycling include use as a: granular base or subbase, stabilized base aggregate, embankment fill, or as an aggregate substitute and asphalt cement substitute in recycled asphalt paving (FHWA 1993).
Historically, one of the primary uses of RAP has been the reintegration of reclaimed millings into new bituminous material using either hot-mix or cold-mix recycling processes. Nonetheless, a large quantity of waste asphalt remains unused. Recent investigations have shown that recycling pavement materials by combining them with base and subbase aggregate materials using cold in-place recycling techniques may represent a solution to this waste problem (Taha 2001), and could result in significant cost savings, especially on projects that require large haul distances for disposal of waste material or projects in which the availability of suitable aggregate fill is limited. In summary, recycling milled asphalt has great potential not only for preserving valuable resources, but also for controlling escalating construction prices. The question that remains to be answered is how does the use of recycled materials affect the performance of an asphalt pavement section, or the long-term integrity of an embankment fill?
The engineering characteristics of mixtures containing reclaimed asphalt pavement (RAP) and aggregate have not been fully investigated by MDT; consequently, the long-term suitability and performance of this type of blended material in Montana highway pavement sections is unknown. This report describes results from a laboratory testing program that was structured to evaluate the suitability of using reclaimed and recycled asphalt pavement as an additive to aggregate base or granular soils (crushed and screened aggregates or natural soils). An extensive suite of laboratory tests have been conducted using four different aggregates blended with asphalt millings over a broad range of mix percentages. This report examines changes that occur in the engineering properties of aggregate materials when mixed with RAP and provides a review of published literature on the subject.

2
1.02 Objectives and Scope The primary objective of this research was to evaluate changes that occur in the
engineering properties of granular soils (natural soils or crushed and screened aggregates) after they have been blended with RAP. The laboratory testing program was oriented towards examining changes in engineering properties rather than the absolute engineering characteristics of RAP blends. The suitability of the RAP blends was evaluated in terms of significant changes observed in relatively easily measured and quantifiable properties. The primary engineering properties considered included compaction, gradation, strength, stiffness, permeability, and resistance to degradation.

3
2.0 LITERATURE REVIEW
2.01 Background Construction using recycled materials has become more popular in the United States over
the past 10 to 20 years. Recently, emphasis has been placed on finding innovative uses of milled asphalt concrete pavement (asphalt) such as cold in-place recycling (CIR). CIR is a method of asphalt recycling in which the top layer of asphalt on an existing roadway is milled, pulverized, and mixed with crushed base course (CBC) and used as a base course or subbase for new road construction.
Since the 1980’s, many states have experimented with recycling or reuse of RAP in a variety of contexts including hot and cold asphalt paving surface mixes, in-place mixes, stabilized base courses, unbound aggregate base and subbases, shoulder aggregates, and open-graded drainage courses. It was reported in a 1994 NCHRP synthesis (Collins and Ciesielski 1994) that many state transportation departments are using RAP in highway construction, with recycling of RAP into asphalt paving mixes being the most predominant application. Results from a national questionnaire sent to all state highway agencies (with a 100% response) indicted that as of 1994, 16 states have at some time used RAP as an unbound aggregate base or subbase (Collins and Ciesielski 1994). The motivation for using CIR is driven by the potential cost savings and the reduced environmental impact. Cold in-place recycling eliminates the need to haul milled asphalt to a waste site, and reduces the quantity of crushed aggregate that has to be purchased. For example, in Brawley, California the cost of pavement construction materials was reduced from $40 to $16 per ton by incorporating RAP into the pavement section (Ayers 1992). From an environmental standpoint, this process reduces the needless waste of an increasingly more expensive petroleum-based product, reduces the volume of industrial waste in landfills, and conserves natural resources by requiring less virgin aggregates in road construction.
Simanski (1979) reports that the residual asphalt cement in RAP treated bases acts as an excellent binder and can help make the recycled base less susceptible to frost heave while increasing the road’s load bearing capacity in the base course layer. (No details of testing were provided in Simanski’s work to support these claims.)
As reported by Hanks and Magni (1989), the Ministry of Transportation in Ontario (MTO), Canada has been using RAP as a substitute for granular base since the early 1970’s. Based on the materials tested in their study, it appears that the strength of the blended product is of the same order as that of a standard granular soil, and may increase with time because of the binding properties of the asphalt cement. This report also suggested that permeability is of the same order of magnitude and, in some cases higher than the permeability of the virgin aggregate. Current MTO specifications allow for as much as 50% RAP in base and subbase layers.
In New Jersey, laboratory resilient modulus tests have shown that 100% RAP base has comparable strength with dense graded aggregate base and subbase materials. The in-place elastic modulus of the RAP base was measured in this study using the spectral-analysis-of-surface-waves method (SASW). The SASW field tests confirmed laboratory test results indicating RAP base typically has a higher modulus and stiffness than the dense graded aggregates typically used in roadway construction for the New Jersey Department of Transportation (Maher 1997).

4
For the Illinois Department of Transportation, Garg and Thompson (1996) evaluated the performance of a 1200-ft-long two-lane demonstration project in which an 8-in compacted RAP base course was used beneath a 3-in dense graded AC surface course. The demonstration project included a 200-ft long control section constructed using dense-graded crushed stone aggregate base. Their conclusions after two years of monitoring was that the RAP and the crushed stone base test sections provided comparable performance. Falling weight deflectometer tests indicated that the RAP base was providing adequate structural support and subgrade protection. Pavement distress surveys did not show any form of distress except for minor rutting. The field tests and observations were further supported in this study by laboratory triaxial rapid shear and resilient modulus tests, which showed the RAP material provided satisfactory response in comparison to the crushed aggregate used in their study.
A study conducted for the Massachusetts Highway Department on the use of RAP/aggregate mixtures included a series of laboratory tests to evaluate the hydraulic conductivity and the resilient modulus of nine different RAP/aggregate mixes (Highter et al. 1997). Tests were conducted using a crushed stone base and a naturally occurring granular borrow soil with RAP percentages varying from 0 to 100%. Conclusions from their laboratory tests indicate:
1. The maximum dry density as determined using the standard Proctor compaction effort decreases with an increase in the percentage of RAP.
2. The specific gravity and optimum water content do not appreciably increase or decrease in a regular manner with the percentage of RAP.
3. The hydraulic conductivity of the granular borrow soil increased with an increase in the percentage of RAP in the mixture. The addition of RAP to the crushed stone base material had little effect on the hydraulic conductivity of the aggregate.
4. The resilient modulus of the aggregate mixtures increased with an increase in the percentage of RAP.
Preliminary conclusions based on published literature reviewed during the course of this study indicate that cold in place recycling of reclaimed asphalt may provide an economical and mechanically sound alternative for use as a flexible pavement base or subbase material. Most studies to date are location specific involving laboratory testing of a limited quantity and variety of aggregates. The testing described in the following sections is oriented towards supplementing previous tests by others while providing a focus on Montana materials and concerns, which include: drainage, durability, strength, stiffness, and compressibility.

5
3.0 LABORATORY TESTS
Laboratory tests were conducted to evaluate the engineering characteristics of different RAP blends using the four aggregate materials described in Table 1.
TABLE 1. Summary of Materials Examined in this Study Material Identification General Description
CBC #1
Mechanically processed granular material that meets the MDT specified criteria for Crushed Base Course Type 6A, and is classified as an A-1-a soil in accordance to the AASHTO soil classification system (2002). This material was obtained from the Richard Haxton source, located about 6 mi. north of Melstone, MT (NE ¼, SW ¼, Section 27, Township 11-N, and Range 31-E) lab pit number 837057-066.
CBC #2 Mechanically processed granular material that meets the MDT specified criteria for Crushed Base Course Type 6A, and is classified as an A-1-a soil. This material was obtained from the JTL Group Inc. stockpile in Billings, MT.
CBC #3 Mechanically processed granular material that meets the MDT specified criteria for Crushed Base Course Type 5A, and is classified as an A-1-a soil. This material was obtained from the Dehart – East and West project (Project No. IM 90-7(75)360). The location is identified as the Gene Sondeno Source, located about 6 mi. west of Big Timber, MT (NW ¼, NW ¼, Section 35, Township 4-N, and Range 29-E).
Pit Run Natural material obtained from the JTL Group Inc. gravel pit in Belgrade, MT. Maximum nominal gravel size was 2 in.
Notes: 1) CBC is a commonly used abbreviation for Crushed Base Course. 2) Criteria for CBC materials are described in Section 701.02.4 of the Montana Standard
Specifications for Road and Bridge Construction (1995). Gradation for Type 5A ranges from 2-inch-minus to a maximum of 8% passing the No. 200 sieve. Gradation for Type 6A ranges from 1.5-inch-minus to a maximum of 8% passing the No. 200 sieve. Type “A” material has additional limitations on plasticity, wear, and particle shape.
3) AASHTO = American Association of State Highway and Transportation Officials (2002).
Each material described in Table 1 was blended with reclaimed asphalt millings obtained from the MDT Dehart Interstate Project. The materials were mechanically mixed with the reclaimed asphalt millings at percentages of 20%, 50%, and 75 % asphalt millings by weight.
The laboratory testing program consisted of grain size analyses, specific gravity, modified Proctor compaction, relative density, Los Angeles abrasion, R-value, permeability, and direct shear tests. R-value testing was conducted at the MDT Helena Materials Laboratory.
Laboratory tests were conducted in general conformance with one or more of the following standards:
• American Association for State Highway and Transportation Officials (2002),

6
• Montana Materials Manual of Test Procedures (1988), and
• American Society for Testing and Materials (2002).
A summary of test results for the unblended aggregates is provided in Table 2. Summaries of test results for the blended materials are provided in Tables 3 through 6. Testing methodologies are described in the following subsections. A detailed discussion of results from the laboratory testing program is provided in Section 4.0.
TABLE 2. Summary of Test Results for Unblended Aggregates
Sieve (% Pass.) emax emin
1.5 in: 100.0CBC # 1 A-1-a (6A) # 4: 47.5 2.67 142.0 4.85 0.65 0.36 35.7%
# 200: 6.01.5 in: 100
CBC # 2 A-1-a (6A) # 4: 44.2 2.70 143.1 5.59 0.59 0.28 33.4% # 200: 2.611.5 in: 100
CBC # 3 A-1-a (5A) # 4: 44.5 2.68 142.6 5.90 0.74 0.33 25.1% # 200: 5.15
Special 1.5 in: 83.31Pit Run Borrow # 4: 41.52 2.72 144.7 4.95 0.81 0.41 25.5%
# 200: 1.05
Soil Type
Optimum W ater
Content (w%)1
Resistance to
Degradation (Avg. Loss)
Void RatiosAASHTO Classification
Specific Gravity
(Gs)
Maximum Dry
Density (lb/ft3)1
Gradation
1Maximum dry density and optimum water content values were corrected for the percentage of oversized particles in conformance to MT-231 and AASHTO T224.
TABLE 3. Summary of Test Results for CBC #1 Rap Blends
Sieve (% Pass.) emax emin
1.5 in: 100.00Unmixed A-1-a (6A) # 4: 47.54 2.67 142.0 4.85 0.65 0.36 35.7%
# 200: 5.961.5 in: 99.19
20% RAP A-1-a (5A) # 4: 44.21 2.67 142.2 5.00 0.64 0.32 32.6% # 200: 1.821.5 in: 97.30
50% RAP A-1-a (5A) # 4: 48.02 2.59 134.7 6.20 0.86 0.34 32.1% # 200: 1.71
CBC # 1
Optimum W ater
Content (w%) 1
Resistance to Degradation (Ave. Loss)
Void RatiosAASHTO Classification
Specific Gravity
(Gs)
Maximum Dry
Density (lb/ft3) 1
Gradation
1Maximum dry density and optimum water content values were corrected for the percentage of oversized particles in conformance to MT-231 and AASHTO T224. Note: In Tables 2-6 maximum dry densities and optimum water contents were established using the modified Proctor test.

7
TABLE 4. Summary of Test Results for CBC #2 Rap Blends
Sieve (% Pass.) emax emin
1.5 in.: 100.00Unmixed A-1-a (6A) # 4: 44.20 2.70 143.1 5.59 0.59 0.28 33.4%
# 200: 2.611.5 in.: 100.00
20% RAP A-1-a (6A) # 4: 45.65 2.66 142.1 5.91 0.63 0.33 30.6% # 200: 2.101.5 in.: 97.81
50% RAP A-1-a (5A) # 4: 44.07 2.59 139.3 5.20 0.66 0.30 30.9% # 200: 1.70
CBC # 2
Optimum W ater
Content (w%)1
Resistance to Degradation (Ave. Loss)
Void RatiosAASHTO Classification
Specific Gravity
(Gs)
Maximum Dry
Density (lb/ft3)1
Gradation
1Maximum dry density and optimum water content values were corrected for the percentage of oversized particles in conformance to MT-231 and AASHTO T224.
TABLE 5. Summary of Test Results for CBC #3 Rap Blends
Sieve (% Pass.) emax emin
1.5 in: 100.00Unmixed A-1-a (5A) # 4: 44.50 2.68 142.6 5.90 0.74 0.33 25.1%
# 200: 5.151.5 in: 100.00
20% RAP A-1-a (5A) # 4: 47.69 2.66 140.4 5.75 0.70 0.32 29.4% # 200: 2.011.5 in: 100.00
50% RAP A-1-a (5A) # 4: 41.52 2.59 136.3 6.10 0.66 0.34 35.6% # 200: 1.43
CBC # 3
Optimum W ater
Content (w%)1
Resistance to Degradation (Ave. Loss)
Void RatiosAASHTO Classification
Specific Gravity
(Gs)
Maximum Dry
Density (lb/ft3)1
Gradation
1Maximum dry density and optimum water content values were corrected for the percentage of oversized particles in conformance to MT-231 and AASHTO T224.
TABLE 6. Summary of Test Results for Pit Run Rap Blends
Sieve (% Pass.) emax emin
1.5 in: 83.31Unmixed Spec. Borrow # 4: 41.52 2.72 144.7 4.95 0.81 0.41 25.5%
# 200: 1.051.5 in: 94.51
20% RAP Spec. Borrow # 4: 36.85 2.63 144.5 5.04 0.68 0.34 23.0% # 200: 1.621.5 in: 92.12
50% RAP Spec. Borrow # 4: 39.04 2.61 140.7 5.20 0.79 0.33 26.7% # 200: 1.00
Pit Run
Optimum W ater
Content (w%)1
Resistance to Degradation (Ave. Loss)
Void RatiosAASHTO Classification
Specific Gravity
(Gs)
Maximum Dry
Density (lb/ft3)1
Gradation
1Maximum dry density and optimum water content values were corrected for the percentage of oversized particles in conformance to MT-231 and AASHTO T224.

8
3.01 Grain Size Distribution Analysis Three grain size analyses were conducted on each material (unblended aggregates and
RAP blends) both before and after conducting impact compaction tests (modified Proctor). Grain size distribution plots of the four unblended materials and the asphalt millings (RAP) are shown in Figure 1. The materials were well-graded and generally exhibited relatively smooth gradation curves covering a wide distribution of particle sizes. Of the four unblended materials, the pit run was the most coarse, while the CBC #1 material contained the finest distribution of particle sizes. CBC #2 and CBC #3 had very similar particle size distributions. Grain size distribution tests were conducted in general accordance to MT-202 and AASHTO T-311 using the following sieve sizes: 1.5 in, 0.75 in, 0.375 in, #4, #10, #40, and #200. A summary of pertinent grain sizes for the unblended aggregate materials is provided in Table 2. Test results for the RAP blends are summarized in Tables 3 through 6. Plotted grain size distribution curves for all the virgin materials and RAP blends are provided in Appendix A.
RAP blends were dried before conducting final gradations using a heat lamp placed at a distance of about 2 feet from the samples. Comparison testing indicated that oven drying introduced errors in the grain size distribution measurements because the asphalt in the RAP blended samples softened at higher temperatures resulting in some agglomeration of the initially disparate finer grained particles.
FIGURE 1. Grain size distribution plots of the unblended materials.
3.02 Specific Gravity Specific gravity is defined as the ratio of the density of soil solids to the density of water,
and is represented by the symbol, Gs.
A modified specific gravity test was developed in order that the entire range of particles in the soil samples could be tested together at one time. This modified specific gravity testing procedure provided more reliable repeatable results, especially for coarse-grained soils containing RAP. Methodologies from both AASHTO T-209 and T-100 were combined to create
Grain Size (mm)0.010.1110100
0
10
20
30
40
50
60
70
80
90
100
0
10
20
30
40
50
60
70
80
90
100
CBC #1CBC #2CBC #3Pit Run100% RAP

9
a process that would accurately accomplish this task. The basic principles of the test were unchanged, and direct comparisons with the standard method using smaller sample sizes yielded similar results for the finer fraction of particles.
A brief explanation of the modified procedure is described below:
(a) A 1.2 gallon asphalt pycnometer was used as a volumetric vessel to contain a 3 to 5 lb soil sample.
(b) The pycnometer was placed on a Gilson vibrator as shown in Figure 2.
(c) A vacuum pressure of 25 psi was used to create a negative air gradient for evacuating air trapped within voids between soil particles.
(d) Sodium hexametaphosphate was used to facilitate the movement of trapped air in accordance with AASHTO T-100.
(e) Samples were vacuumed and simultaneously vibrated for 45 minutes, and then vacuumed for an additional hour without vibration.
A summary of specific gravity results is provided in Table 2 for the unblended aggregate materials, and Tables 3 through 6 for the RAP blends.
FIGURE 2. Photo of the Gilson asphalt vibro-deairator.
3.03 Proctor Impact Compaction Tests Modified Proctor compaction tests were conducted on the unblended aggregates and each
RAP mix in general accordance to AASHTO T-180 and MT-230. Particles larger than 0.75 in (19 mm) were screened and removed, and correction factors were applied to the maximum dry densities and optimum water contents to account for the absent particle components, in

10
conformance to MT-231 and AASHTO T224. Particle size analyses were conducted both before and after the compaction tests to examine potential changes in the particle size distribution as a result of the handling and compaction processes. A summary of the maximum dry unit weights and optimum water contents is provided in Table 2 for the unblended aggregate materials, and Tables 3 through 6 for the RAP blends. Compaction curves for each test are provided in later sections of this report.
3.04 Relative Density Relative density tests were conducted on the blended and unblended materials to determine
the theoretical minimum and maximum void ratios (emin and emax) using test methodologies that are quite different from the Proctor compaction test. This provides an alternate method for evaluating the relationship between relative density and percent RAP. The tests were conducted in general conformance to ASTM D4253 and ASTM D4254. Results from the relative density tests (in terms of minimum and maximum void ratios) are shown in Table 2 for the unblended aggregate materials, and Tables 3 through 6 for the RAP blends.
3.05 Los Angeles Abrasion Tests Los Angeles abrasion tests were conducted to obtain a relative measure of the resistance to
degradation of the virgin aggregates and the blended RAP mixes using the Los Angeles test machine (Figure 3). Tests were conducted in general conformance with AASHTO T-96 and MT-209. The average percent loss over the #4 sieve for the unblended aggregate materials and the RAP blends are shown in Table 2 and Tables 3 through 6, respectively.
FIGURE 3. Los Angeles abrasion test machine.

11
(a) Bottom half of shear box loaded with soil.
3.06 Direct Shear Tests A large (12 in × 12 in) Brainard Kilman direct shear test apparatus was used to measure the
shear strength of the CBC #3 and the pit run materials, both before and after blending with RAP. RAP percentages of 20%, 50% and 75% were tested in the large shear box to evaluate changes in soil shear strength that occur when aggregate material is blended with RAP. Photos of the custom-made shear box are shown in Figure 4. The machine was retrofitted with a GeoTac data acquisition system to provide electronic readings of lateral load and horizontal deflection using an S-type strain gauge load cell and an LVDT displacement transducer.
Samples were compacted in 1.3-in-thick lifts using an air driven flat-plate vibrator with a weight of 57 pounds and a 100 square inch cross section, as shown in Figure 5. The samples were sheared at a constant rate of 0.05 in/min to a maximum horizontal displacement of 3.8 in, or to failure, whichever occurred first. Normal pressures were applied to the top of the samples using a thick rubber membrane, which was inflated with air pressure. An air regulator was used to control the membrane pressure to ensure a constant normal stress throughout the test. Three normal stresses were used to develop Mohr-Coulomb failure envelopes and to determine the effective shear strength parameters for the eight different materials tested.
Stress-strain curves from each direct shear test are provided in Appendix B of this report. Mohr-Coulomb failure envelopes, estimated elastic moduli, and plots of friction angle variations verses confining pressure are discussed in Section 4.06 of this report.
FIGURE 4. Photos of the large direct shear testing apparatus.
(b) Shear machine prior to loading sample.
(c) Shear test in progress.

12
FIGURE 5. Preparing a sample in the large shear box.
3.07 Permeability Tests Constant head hydraulic conductivity (permeability) tests were conducted on each blended
sample and on the unblended aggregates in general conformance with ASTM D2434 and AASHTO T215. Samples were compacted into large 10-inch-diameter permeameters and tested using a uniquely designed system that utilizes a Marriotte tube and integral upper reservoir to maintain a constant pressure head, and complete saturation of the soil sample and testing apparatus throughout the experiment. The permeameter and its primary components are shown in Figure 6a. A photo of the permeability testing in progress using two 10-inch diameter permeameters is shown in Figure 6b.
To simulate field conditions, a ball milling process was developed for preparing the samples. This process was used to simulate the particle break-down (degradation) that occurs during construction processing and placement of aggregate in the field. The ball milling process involved the following steps:
1. The entire test specimen (approximately 22 kg +/- 0.1 kg of material) was loaded into a Los Angeles abrasion machine.
2. Twelve steel balls (each, 1-7/8 inch diameter) were placed in the machine with the soil sample.
3. The machine was turned on and tumbled for the standard 500 revolutions.
(a) Close-up view of compactor.
(b) Compacting sample prior to test.
(c) Transporting shear box to shear testing machine.

13
FIGURE 6. 10-in-dia. constant head permeameter.
Upon completion of the simulated degradation process, the samples were ready for placement into the permeameter. This large apparatus provides a more reliable means of conducting permeability tests on samples containing relatively large aggregates. Following is a brief description of the test procedure:
1. Assemble permeameter base, bottom screen, and mold.
2. Add the prepared soil specimen to the mold, compact in place using a vibratory table at 50 Hz for 10 minutes, and level off the top.
3. Install top filter screen.
4. Attach the upper portion of the permeameter reservoir.
5. Place the entire tester in a large container of water (35 gallon trash barrel, as shown in Figure 6b). Adjust the elevations of the base support and reservoir water level to ensure that the top screen is below the water level in the container. The tail water elevation coincides with the water level in the outer container.
6. Saturate the sample and the testing apparatus by applying vacuum pressure at the top of the permeameter. The negative pressure gradient pulls water upwards through the soil and into the top reservoir of the tester.
7. Obtain an initial water height reading from the external manometer, and start the timer.
(a) Primary components. (b) Two tests in progress.

14
8. Stop the test and obtain the final manometer reading when the water level drops to an elevation slightly above the bottom of the Marriotte tube. The volume of flow is calculated from the change in manometer readings.
This procedure provides a measure of the quantity of water that traveled through the soil in a given time period, at a constant pressure head. The permeability is then directly calculated by applying Darcy’s law for laminar flow through a saturated soil, using the following equation:
tHAQLk = (1)
where, k = permeability of soil specimen,
Q = volume of seeping water corresponding to elapsed time t,
L = length of specimen,
t = elapsed time corresponding to Q,
H = total head across specimen, and
A = cross sectional area of specimen.
Three permeability tests were conducted on each aggregate blend at RAP percentages of 0, 20, and 50 percent. Permeability results are summarized in Section 4.07, and a schematic diagram of the constant head test equipment is shown in Figure 7.

15
FIGURE 7. Schematic of permeameter by Trautwein Soil Testing Equipment Co.
3.08 R-Value Tests R-value tests were conducted to provide a means of comparing the stiffness properties of
CBC # 3 and pit run both before and after blending with RAP (in ratios of 20%, 50%, and 75%). The MDT Materials Lab in Helena performed R-value testing in general conformance with AASHTO T-190. The R-value findings are discussed in Section 4.08. Individual R-value test reports are provided in Appendix C.
16
3.09 X-Ray Computed Tomography Scans X-ray computed tomography scans of the pit run and the pit run mixed with 50% RAP
were conducted using the MSU Civil Engineering Department’s X-ray scanning equipment. Using stereology procedures, the digitally scanned images can be used to provide a nondestructive measure of the porosity and pore size distribution of any particulate media. Four images were produced for each soil sample. Examples of two of the scanned images are shown in Figures 8a and 8b. The remaining scanned images are provided in Appendix D.
Computed Tomography or CT scanning has been used in medical fields for several decades, and the term “CAT scan” is well known to the public. The following paragraphs present a brief overview of the CT scanning process, which is very similar to CAT scans conducted in the medical field.
A CT scan consists of two main processes: data collection and image reconstruction. During the data collection stage, a specimen is digitally photographed from multiple angles as it is exposed to x-ray beams. X-Rays are invisible, high-energy electromagnetic waves that are able to pass through many objects. As a beam of x-rays penetrates an object, the object’s matter absorbs some of the x-rays. Dense matter (e.g., rock and wood) and some heavy materials (e.g., steel and lead) absorb more x-rays than less dense materials (e.g., plastic and water). X-Rays that penetrate through the object hit an x-ray sensitive screen within the CT apparatus and cause it to illuminate. A digital camera is used to capture the image on the screen, which replicates the x-ray penetration pattern of the object.
During the reconstruction phase, the numerous individual x-ray photographs are digitally superimposed in such a way that the resulting image describes the interior structure of the specimen. Reconstructing a CT scan produces a representation of the interior features of an object using multiple x-ray scans. A regular single x-ray image can also show features within an object, but accurate locations of interior features cannot be determined from a single view. The CT process uses x-ray images from many different views through a thin section of an object to pinpoint the locations of internal features. When the scan is reconstructed, the resulting image is a cross-sectional view of the object as if it had been cut through the plane at the scan location.
In this study, a two-dimensional CT scanning approach was used to develop images of the internal structure of soils containing RAP. The data collection phase of the CT scanning process for the soil scans involved using 1/4-degree increment scans with a full rotation of the soil sample relative to the x-ray. The MSU CT equipment is capable of performing scans with 1/8-degree increments, but those scans require a significant amount of time to complete and do not provide a substantial improvement in resolution compared to the1/4-degree scans. For soil materials, the time required for a 1/4-degree rotation increment (1,440 x-ray scans) is approximately two hours; the duration of a scan is based on the degree increment and the camera exposure time, which is also dependent upon specimen density.

17
FIGURE 8. CT scan of 50% pit run with 50% RAP.
(a) CT scan of 100% pit run.
(b) CT scan of 50% pit run with 50% RAP.

18
4.0 DISCUSSION OF RESULTS
4.01 Grain Size Distribution Analysis Grain size analyses were conducted on the RAP/aggregate mixes both before and after
modified Proctor compaction tests. Particle size distribution graphs of the before and after compaction tests are provided in Appendix A. The set of numbers directly adjacent to the gradation curves represents the mesh size of each sieve in millimeters.
For the four different materials tested in this study, the addition of RAP to the virgin materials resulted in an increase in the amount of particles passing the upper sieves, and a decrease in the percentage of particles passing the lower sieves. Examples of these trends are shown in Figures 9 and 10 for the CBC #2 and the pit run, respectively. For the lower part of the gradation curve (finer than the No. 4 sieve), this behavior is attributed to:
1) the adhesiveness and viscidity of the asphalt particles, and 2) the milling process used to create the RAP material.
In comparison to a natural pit run alluvial material or a manufactured crusher run aggregate, the milling process produces proportionally less particles finer than the #4 sieve (4.75 mm). This disproportionality in the lower portions of the gradation plots (between #4 and #200 sieves) can be observed by comparing the gradation curves of all the unblended materials with the gradation curve of the RAP millings, which are compared in Figure 1 (Section 3.01). The trends observed in the upper half of the gradation curves (coarser than the #4 sieve) also can be attributed to the particle size characteristics of the RAP millings, which in comparison to the virgin (unblended) materials contains a significantly greater proportion of material above the #4 sieve size.
FIGURE 9. Grain size distribution curves for the CBC #2 mixes.
Grain Size (mm)0.010.1110100
0
10
20
30
40
50
60
70
80
90
100
0
10
20
30
40
50
60
70
80
90
100
100% CBC #2: no RAP80% CBC #2 + 20% RAP50% CBC #2 + 50% RAP

19
FIGURE 10. Grain size distribution curves for the pit run mixes.
4.02 Specific Gravity The reclaimed asphalt used in this study had an average specific gravity of 2.49. This value
is significantly lower than the specific gravities of any of the virgin soils, which ranged from 2.67 to 2.72. Consequently, the effect of adding RAP to a granular aggregate will result in a reduction in the overall specific gravity of the blend. Tables 3 through 6 contain specific gravity values for the unblended materials and the RAP mixes.
Specific gravity values obtained during this research were used in a number of calculations including the void ratio measurements, which are discussed in the relative density results, Section 4.04.
4.03 Proctor Impact Compaction Tests Laboratory impact compaction tests provide a means of quantifying the compaction
characteristics of a particulate media. Water plays a crucial role in the compaction process of soil. The soil becomes more workable as the water content is increased from a dry state towards the optimum moisture content. Near the optimum moisture content, water acts as a lubricating agent and decreases surface tension allowing soil particles to move past one another into a more efficient arrangement. This results in the densest possible state for the applied compaction energy. As the water content is increased above the optimum value, the additional water and the unexpelled air fill the soil voids and prevent closer packing. Thus, using too much or too little water during compaction may have a negative effect, and maximum density will not be achieved.
This is the primary thesis behind the Proctor method of laboratory compaction, and explains why a typical laboratory compaction curve has a peaked shape. Proctor’s compaction theory provides a useful approach for examining the unique relationship between: (1) water content, (2) dry density, (3) compaction energy, and (4) soil type. If any of these components change, the maximum dry density and optimum water content likely will change as well. Laboratory compaction tests are an essential part of developing construction specifications and comprise the primary tool for field construction quality control on earthwork projects.
Grain Size (mm)0.010.1110100
0
10
20
30
40
50
60
70
80
90
100
0
10
20
30
40
50
60
70
80
90
100
100% Pit Run: no RAP80% Pit Run + 20% RAP50% Pit Run + 50% RAP

20
Modified Proctor compaction curves for the materials examined in this study are shown in Figures 11 through 14. Maximum dry unit weights and optimum water content values are summarized in Tables 3 through 6. The materials examined in this study contained particles larger than ¾ inches; consequently, the dry unit weights and water contents presented in the tables were corrected for the percentage of oversized particles in conformance to MT-231.
The addition of RAP to each of the four virgin materials decreased the maximum dry density and altered the amount of water needed to reach optimum compaction. The water content necessary to achieve optimal compaction decreased as the percent of RAP increased for all materials except CBC # 1, in which case the optimum water content increased slightly with the addition of RAP.
Based on laboratory testing conducted on the four materials examined in this study, it appears in general terms that adding RAP causes the compaction curves to drop and shift to the left. In other words, the maximum dry density and the optimum water content are inversely proportional to the percentage of asphalt millings contained in a RAP/aggregate blend. The largest decrease in maximum dry unit density was observed in the CBC #1 material, which decreased from 139.7 pcf to 132.3 pcf (a 5.3% change) when the RAP percentage was increased from 0% to 50%. The largest decrease in water content was observed in the pit run material, which decreased from 7.6% to 5.5% when the RAP content was increased from 0% to 75%. The changes in optimum water content are relatively minor and are statistically unquantifiable based on the results of this study.

21
Water Content (%)
1 2 3 4 5 6 7 8 9 10 11
Dry
Uni
t Wei
ght (
pcf)
125
126
127
128
129
130
131
132
133
134
135
136
137
138
139
140
141
142
0% RAP, Gs = 2.6720% RAP, Gs = 2.6650% RAP, Gs = 2.59ZAV curve, Gs = 2.72
Note: Compaction tests were conducted on material finer than the 19 mm sieve.
FIGURE 11. Modified Proctor compaction curves for CBC #1 blends.

22
Water Content (%)
3 4 5 6 7 8 9 10
Dry
Uni
t Wei
ght (
pcf)
131
132
133
134
135
136
137
138
139
140
141
142
0% RAP, Gs = 2.7020% RAP, Gs = 2.6650% RAP, Gs = 2.59ZAV curve, Gs = 2.72
Note: Compaction tests were conducted on material finer than the 19 mm sieve.
FIGURE 12. Modified Proctor compaction curves for CBC #2 blends.

23
Water Content (%)
3 4 5 6 7 8 9 10 11 12
Dry
Uni
t Wei
ght (
pcf)
125
126
127
128
129
130
131
132
133
134
135
136
137
138
139
140
0% RAP, Gs = 2.6820% RAP, Gs = 2.6650% RAP, Gs = 2.59ZAV curve, Gs = 2.72
Note: Compaction tests were conducted on material finer than the 19 mm sieve.
FIGURE 13. Modified Proctor compaction curves for CBC #3 blends.

24
Water Content (%)
2 3 4 5 6 7 8 9 10 11 12
Dry
Uni
t Wei
ght (
pcf)
122
123
124
125
126
127
128
129
130
131
132
133
134
135
136
137
138
139
140
0% RAP, Gs = 2.7220% RAP, Gs = 2.6350% RAP, Gs = 2.61ZAV curve, Gs = 2.72 75% RAP
Note: Compaction tests were conducted on material finer than the 19 mm sieve.
FIGURE 14. Modified Proctor compaction curves for pit run blends.

25
As would be expected, the modified Proctor impact test caused a small amount of particle degradation in each of the soil samples. The lower (finer) portions of the gradation curves were affected by the presence of the asphalt particles. The combination of the added water for compaction testing, the residual oil in the asphalt, and the dynamic impact of the compaction hammer apparently created a binding or cementing effect between the finer soil particles and the viscous asphalt. Smaller soil particles adhered to RAP pieces during compaction, and were not completely broken into their individual parts by the sieve shaker. In some occasions, this resulted in less fine particles after compaction, as shown in Figure 15 for the CBC #2. To the extent possible, large clumps of soil were broken up before final gradations were performed. However, it was impractical to manually divide and separate every soil particle by hand before placing the aggregates into the sieve stack. From a theoretical standpoint, finer grain size distributions would be obtained post-compaction if the individual particles could be separated from the asphalt conglomerate; fortunately, there is no practical reason to do this because the same binding and agglomeration effect would be expected to occur in the field during placement and compaction.
The upper portions of the post-compaction curves responded as would be expected, and generally indicated a degradation of only a few percent for soil particles ranging in size from the 1.5 inch to the #4 sieve.
FIGURE 15. Gradation curves before and after impact compaction for the 50/50 CBC #2.
Comparison gradation tests on the pit run blends showed no significant changes to the upper regions of the gradation curves as a result of the impact compaction tests. As shown in Figure 16, the lower regions of the gradation curves (approximately minus the #4 sieve) exhibited trends similar to those observed in the CBC blends in which the percentage of particles passing the lower sieves decreased after compaction. Additional pre- and post-compaction gradation plots for all the materials tested are provided in Appendix A.
Grain Size (mm)0.010.1110100
0
10
20
30
40
50
60
70
80
90
100
0
10
20
30
40
50
60
70
80
90
100
100% CBC #2: no RAP50/50 CBC/RAP before compaction50/50 CBC/RAP after compaction

26
FIGURE 16. Gradation curves before and after impact compaction for the 50/50 Pit Run.
4.04 Relative Density Based on the testing conducted in this study, it appears that relative density testing is likely
a poor method for evaluating the compaction characteristics of RAP blends. Asphalt millings contain large and irregularly shaped conglomerates that create nesting within testing containers, which causes inaccuracies in the void ratio measurements especially when using standard methods for measuring the maximum void ratio. Impact compaction tests (i.e., Proctor) are the preferred method of determining the relative compaction of RAP/aggregate mixes in the laboratory.
The minimum and maximum void ratios summarized in Tables 2 through 6 show inconsistent trends and indicate that standard test methods for measuring emin and emax of samples containing RAP should not be relied upon unless supported by additional testing. Maximum and minimum void ratio data collected during the testing phase of this research is scattered and of no pertinent use in the evaluation of the suitability of RAP blends.
4.05 Los Angeles Abrasion Tests Based on the RAP blends tested in this study, there appears to be no causal relationship
between RAP percentage and degradation loss. Measured degradation loss of the unblended materials ranged from 35.7 % (CBC #1) to 25.1% (CBC #3). With the exception of CBC #3, none of the testing materials experienced substantial changes in degradation resistance after they were mixed with RAP. As noted in Table 5, the average degradation loss for CBC #3 increased from 25.1% with no RAP to 35.6% with 50% RAP. Although this appears a relatively significant change, the overall loss for CBC #3 with 50% RAP is still lower than the degradation loss experienced by CBC #1 in its virgin state.
Montana Supplemental Specification MT-209 establishes permissible limits on degradation of dense graded base materials to a maximum of 50% wear at 500 revolutions in an abrasion machine. Clearly, none of the materials tested in this study exceeded a degradation of 50%, even when mixed with 50% RAP. Consequently, based on the laboratory Los Angeles
Grain Size (mm)0.010.1110100
0
10
20
30
40
50
60
70
80
90
100
0
10
20
30
40
50
60
70
80
90
100
100% Pit Run: no RAP50/50 Pit Run/RAP before compaction50/50 Pit Run/RAP after compaction

27
abrasion test, it appears that adding RAP does not adversely impact the long-term durability of the material. However, it is strongly recommended that the long-term durability of these materials be further investigated by studying the effects of construction, environmental exposure, and traffic loadings on full-scale field test sections.
4.06 Direct Shear Tests A large amount of information is collected during laboratory strength tests, and numerous
approaches are available for evaluating the data. Results from the large direct shear tests conducted in this study were examined in terms of: (a) the relationship between normal stress and lateral strain or deformation, (b) the moduli computed from measured stress-strain curves, and (c) the Mohr-Coulomb constitutive model (failure envelope).
Analogous to a triaxial stress versus axial strain curve measured at a particular confining pressure, direct shear data can be plotted in terms of shear stress versus horizontal displacement, at an applied axial (normal) pressure. To develop a shear failure envelope, multiple tests are conducted at different normal pressures. For the tests conducted in this study, normal pressures of 3.63, 7.25, and 14.50 psi were applied to the top of the large specimen using a rubber membrane, as described in Section 3.06. Based on an assumed overburden unit weight of 138 pcf, these normal pressures correspond to overburden depths of about 3.8, 7.6, and 15.1 ft, respectively.
Shear stress versus horizontal displacement diagrams are shown in Figure 17 for the CBC #3 blends and Figure 18 for the Pit Run blends. The effect of RAP can be directly observed by grouping the stress-displacement plots in terms of the applied normal stress. For CBC #3 (Figure 17) a clear difference was observed in the stress-displacement response between the virgin aggregate and the RAP blends. The difference in response increases as the normal stress increases. As the RAP content increases, the stress versus displacement response becomes softer. Or in other words, as shown in Figure 19, at a given normal stress, the soil shear strength decreases as the quantity of RAP in a sample increases. This behavior appears to become more pronounced as the normal pressure increases (compare the plots in Figures 17a -c). The same trends were observed with the pit run material, but the softening response upon addition of RAP was less pronounced, as shown in Figures 18a-c. Individual stress-displacement plots for all the tests are provided in Appendix B.
As a result of the manufacturing process, crushed base course contains angular rough particles and consequently has a higher shear strength than pit run gravel, which is composed of round to sub-round particles. However, it appears that mixing asphalt millings with crushed base course results in a blended material that has a shear strength comparable to weaker, unblended pit run gravel.

28
FIGURE 17. Shear-displacement diagrams for the CBC #3 blends.
(a) 3.63 psi normal stress
Displacement (in)
0.0 0.5 1.0 1.5 2.0 2.5 3.0 3.5 4.0
Shea
r Stre
ss (p
si)
0
2
4
6
8
10
12
14 CBC #3: no RAPCBC #3: 20% RAPCBC #3: 50% RAPCBC #3: 75% RAP
(b) 7.25 psi normal stress
Displacement (in)
0.0 0.5 1.0 1.5 2.0 2.5 3.0 3.5 4.0
She
ar S
tress
(psi
)
0
2
4
6
8
10
12
14
(c) 14.5 psi normal stress
Displacement (in)
0.0 0.5 1.0 1.5 2.0 2.5 3.0 3.5 4.0
She
ar S
tress
(psi
)
0
2
4
6
8
10
12
14
Legend for all plots

29
FIGURE 18. Shear-displacement diagrams for the pit run blends.
(a) 3.63 psi normal stress
Displacement (in)0.0 0.5 1.0 1.5 2.0 2.5 3.0 3.5 4.0
Shea
r Stre
ss (p
si)
0
2
4
6
8
10
12
14 Pit Run: no RAPPit Run: 20% RAPPit Run: 50% RAPPit Run: 75% RAP
(b) 7.25 psi normal stress
Displacement (in)0.0 0.5 1.0 1.5 2.0 2.5 3.0 3.5 4.0
She
ar S
tress
(psi
)
0
2
4
6
8
10
12
14
(c) 14.5 psi normal stress
Displacement (in)0.0 0.5 1.0 1.5 2.0 2.5 3.0 3.5 4.0
She
ar S
tress
(psi
)
0
2
4
6
8
10
12
14
Legend for all plots

30
FIGURE 19. Relationship between shear strength and RAP content.
One approach for quantifying the stiffness of a material is to examine the ratio of stress to strain, or in the case of a direct shear test, the ratio of shear stress to lateral displacement. This ratio is commonly called a modulus. The initial slope of the stress-strain curve is termed the tangent modulus, while the slope at a selected value of deformation is termed a secant modulus. For each direct shear test conducted in this study, secant moduli were calculated at 1% and 10% strains, corresponding to a displacement of 0.12 in and 1.2 in, respectively. Values at 1% strain are considered representative of the strength and stiffness at small deformations. Values at 10% strain are considered representative of the strength and stiffness at failure. A summary of the secant moduli for each test is shown in Table 7. An illustration of the approach used to calculate the secant modulus for CBC #3 with 50% RAP (at a confining pressure of 3.6 psi) is provided in Figure 20.
Test numbers 1, 2, and 3 in Table 7 were conducted at normal stresses of 3.63, 7.25, and 14.50 psi, respectively. The modulus (at both 1% and 10% deflections) for each material increased with increasing normal pressure. As would be expected of a frictional material, these measurements indicate the response to loading (shear) becomes stiffer as the confining pressure increases.
As was observed in Figures 17 and 18, increasing the RAP content results in a softer response. As shown in Figure 21, the modulus decreased as the RAP content increased. The modulus decreased an average of 56.0% when the RAP content was increased from 0 to 75% for CBC #3. The modulus decreased an average of 48.5% when the RAP content was increased from 0 to 75% for the pit run blends. In addition, as the percentage of RAP increased, the total deflection required to reach shear failure also increased. The largest decreases in moduli were observed at the lower confining pressures. Normal confining pressures for highway pavement sections are relatively small; consequently, this decrease in measured stiffness may have an
Percent RAP (%)
0 10 20 30 40 50 60 70 80
Shea
r Stre
ngth
(psi
)
0
1
2
3
4
5
CBC #3
Pit Run
Note: Shear strength computed at 3.6 psi confining pressure.

31
impact on the long-term performance of pavement sections constructed using blends with high RAP contents. The implications of this should be further investigated by evaluating projects in which RAP mixtures have already been used, and by constructing and evaluating the performance of controlled test sections.
In summary, the observations and measurements from shear strength tests indicate that the addition of asphalt millings to a granular soil results in a more ductile or softer response to loading than exhibited by virgin aggregate, and the ductility increases as the percentage of RAP in the sample increases. The relative effect of RAP was more pronounced for the crushed material (CBC #3) than the pit run; however, the overall or absolute moduli values of the crushed aggregate were greater than the pit run. Initially, the unblended crushed aggregate provides a much stiffer response than the unblended pit run because of the difference in particle shape and surface roughness characteristics of the two materials. But as the RAP content is increased, the stiffness of the two materials become more similar and appears to converge as the RAP content approaches about 75%. At these higher levels of RAP, the characteristics of the asphalt millings begin to control the behavior of the blend.
TABLE 7. Summary of Secant Moduli from Large Direct Shear Box Tests Secant Modulus (psi)
Material 1% Strain (ε) 10% Strain (ε) Identification Test 1 Test 2 Test 3 Test 1 Test 2 Test 3 CBC # 3 (0% RAP) 222.2 429.9 557.1 41.67 80.2 119.8
20% RAP 187.4 290.3 468.3 29.0 52.1 79.1
50% RAP 158.3 239.5 393.5 27.9 45.8 74.4
75% RAP 111.9 184.8 215.8 26.4 42.2 55.7 Pit Run (0% RAP) 224.1 318.5 435.7 32.6 56.3 76.0
20% RAP 210.6 331.2 368.2 30.5 41.5 64.9
50% RAP 164.7 212.8 241.4 28.9 41.1 59.4
75% RAP 114.6 164.4 225.4 29.8 39.2 60.0

32
FIGURE 20. Secant moduli for CBC #3 with 50% RAP, at 1% and 10% lateral strain.
0.00
50.00
100.00
150.00
200.00
250.00
300.00
350.00
400.00
450.00
0 0.5 1 1.5 2 2.5
Displacement (in)
Load
(lb)
CBC # 3 with 50% RAP (confiningpressure = 3.62 psi)
228 lb
displacement = 0.12 in (ε = 1%) displacement = 1.2 in (ε = 10%)
402 lb
E1% = 158 psiE10% = 28 psi

33
FIGURE 21. Relationship between modulus and RAP content: (a) CBC #3, (b) Pit Run.
Stress-displacement curves produced in the large direct shear tests were used to develop Mohr-Coulomb failure envelopes for each material. Shear failure was defined as the peak of the stress-displacement curve, or as a displacement of 3.6 inches, whichever occurred first. A quadratic function was chosen as the best-fit equation for the failure envelopes, which are shown in Figures 22 through 29. A curved failure envelope was used for these tests rather than a linear envelope because the curved envelope most closely represented the testing data. This is supported by the findings of Duncan et al. (1980) regarding the Mohr-Coulomb constitutive model. Duncan concluded that Mohr-Coulomb failure envelopes for nearly all soils are curved to some extent, and that the amount of curvature is based on the range of confining pressures involved. The virgin samples tested in this study are predominately cohesionless materials. However, it can be seen from the shear stress plots that curved Mohr-Coulomb failure envelopes most accurately depict the shear strength results obtained for the eight RAP/aggregate
(a) CBC #3
0 10 20 30 40 50 60 70 80
Mod
ulus
at 1
% s
train
(psi
)
0
100
200
300
400
500
600
(b) Pit Run
Percent RAP (%)
0 10 20 30 40 50 60 70 80
Mod
ulus
at 1
% s
train
(psi
)
0
100
200
300
400
500
600
normal pressure = 3.63 psinormal pressure = 7.25 psinormal pressure = 14.50 psi

34
combinations tested in this study. Consequently, the following equation was used for determining the drained angle of internal friction, as a function of normal stress (Duncan et al. 1980).
(2)
Where ∆φ is the change in friction angle over one log cycle of normalized confining pressure; φο is the equivalent of the friction angle at a confining pressure of 3.6 psi; σn is the normal load; and pa is atmospheric pressure (14.7 psi).
Figures 30 and 31 and Tables 8 and 9 show the results of friction angle variations over normalized confining pressures for the CBC #3 and the pit run blends. Notice that the friction angles of all the materials decrease with increasing confining pressure. This is further evidence to support the application of curved failure envelopes. The variation is approximately linear when plotted on a semi-log scale.
Shear strength parameters for each of the materials tested are summarized in Table 10. The last two columns in this table show the friction angle (φ’) and the shear strength (τ) of each soil at a normal pressure of 3.6 psi, which was the lowest normal pressure used in this study. This normal pressure corresponds to a stress that would be typical of about 3.5 feet of soil overburden.
A study by Hanks and Magni (1989) indicates that base course and subbase course materials containing recycled asphalt may experience strength gains during the weeks following placement. To minimize any time-rate effects, care was taken to ensure that shear strength testing was performed immediately after compaction. It was anticipated that mixing crushed aggregates with a recycled material (like RAP) containing worn, weathered, and asphalt-coated particles would result in a decrease in strength when compared to the virgin material. Thus, the shear strength drop in CBC #3 of about 2 psi (at a confining pressure of 3.6 psi) after the addition of 75% RAP was an expected outcome. This drop in shear strength does not seem to be substantial enough to merit the exclusion of RAP as a base course material. Especially considering that minor strength gains may occur during the first weeks after placement.
The shear strength of the virgin pit run was noticeably lower than that of the CBC #3. The addition of RAP did not substantially alter the shear strength of the pit run material. This is somewhat dichotomous to the results for CBC #3 blends, in which the addition of RAP reduced both the shear strength and the friction angle. The modest shear strength increase in the pit run material after adding RAP was most likely caused by the lack of angular material in the virgin sample. It is postulated that the crushed angular materials in the RAP increased particle interlock and possibly (to a lesser extent) interparticle sliding friction resulting in slightly higher shear strength values. This effect was most noticeable at low confining pressures.
⎟⎟⎠
⎞⎜⎜⎝
⎛∆−=
a
no p
σφφφ log'

35
FIGURE 22. Shear strength failure envelope for CBC #3 (no RAP).
Normal Stress, σn (psi)
0 2 4 6 8 10 12 14 16
Shea
r Stre
ss, τ
(psi
)
0
2
4
6
8
10
12
14
16
Shear DataFailure Envelope
NOTES:1) Shear failure defined at peak of stress-strain curve or 3.6 inches, whichever occured first. 2) Shearing rate is 0.05 in/min.3) Atmosperic pressure (pa) is assumed to be 14.7 psi.4) φ1 is equivalent to the friction angle from the origin to the data point with a confining pressure of 3.6 psi.5) φ0 is equivalent to the friction angle from the origin to the data point with a confining pressure of 14.7 psi.
⎟⎟⎠
⎞⎜⎜⎝
⎛∆−=
a
n
pσφφφ log' 0
c' = 0φ1 = 51.3o
φο = 41.1o
∆φ = 20.4o

36
FIGURE 23. Shear strength failure envelope for CBC #3 with 20% RAP.
Normal Stress, σn (psi)
0 2 4 6 8 10 12 14 16
Shea
r Stre
ss, τ
(psi
)
0
2
4
6
8
10
12
14
16
Shear DataFailure Envelope
NOTES:1) Shear failure defined at peak of stress-strain curve or 3.6 inches, whichever occured first. 2) Shearing rate is 0.05 in/min.3) Atmosperic pressure (pa) is assumed to be 14.7 psi.4) φ1 is equivalent to the friction angle from the origin to the data point with a confining pressure of 3.6 psi.5) φ0 is equivalent to the friction angle from the origin to the data point with a confining pressure of 14.7 psi.
⎟⎟⎠
⎞⎜⎜⎝
⎛∆−=
a
n
pσφφφ log' 0
c' = 0φ1 = 39.9o
φο = 32.7o
∆φ = 11.3o

37
FIGURE 24. Shear strength failure envelope for CBC #3 with 50% RAP.
Normal Stress, σn (psi)
0 2 4 6 8 10 12 14 16
Shea
r Stre
ss, τ
(psi
)
0
2
4
6
8
10
12
14
16
Shear DataFailure Envelope
NOTES:1) Shear failure defined at peak of stress-strain curve or 3.6 inches, whichever occured first. 2) Shearing rate is 0.05 in/min.3) Atmosperic pressure (pa) is assumed to be 14.7 psi.4) φ1 is equivalent to the friction angle from the origin to the data point with a confining pressure of 3.6 psi.5) φ0 is equivalent to the friction angle from the origin to the data point with a confining pressure of 14.7 psi.
⎟⎟⎠
⎞⎜⎜⎝
⎛∆−=
a
n
pσφφφ log' 0
c' = 0φ1 = 37.9o
φο = 32.4o
∆φ = 8.6o

38
FIGURE 25. Shear strength failure envelope for CBC #3 with 75% RAP.
Normal Stress, σn (psi)
0 2 4 6 8 10 12 14 16
Shea
r Stre
ss, τ
(psi
)
0
2
4
6
8
10
12
14
16
Shear DataFailure Envelope
NOTES:1) Shear failure defined at peak of stress-strain curve or 3.6 inches, whichever occured first. 2) Shearing rate is 0.05 in/min.3) Atmosperic pressure (pa) is assumed to be 14.7 psi.4) φ1 is equivalent to the friction angle from the origin to the data point with a confining pressure of 3.6 psi.5) φ0 is equivalent to the friction angle from the origin to the data point with a confining pressure of 14.7 psi.
⎟⎟⎠
⎞⎜⎜⎝
⎛∆−=
a
n
pσφφφ log' 0
c' = 0φ1 = 38.1o
φο = 25.2o
∆φ = 21.8o

39
FIGURE 26. Shear strength failure envelope for pit run (no RAP).
Normal Stress, σn (psi)
0 2 4 6 8 10 12 14 16
Shea
r Stre
ss, τ
(psi
)
0
2
4
6
8
10
12
14
16
Shear DataFailure Envelope
NOTES:1) Shear failure defined at peak of stress-strain curve or 3.6 inches, whichever occured first. 2) Shearing rate is 0.05 in/min.3) Atmosperic pressure (pa) is assumed to be 14.7 psi.4) φ1 is equivalent to the friction angle from the origin to the data point with a confining pressure of 3.6 psi.5) φ0 is equivalent to the friction angle from the origin to the data point with a confining pressure of 14.7 psi.
⎟⎟⎠
⎞⎜⎜⎝
⎛∆−=
a
n
pσφφφ log' 0
c' = 0φ1 = 42.0o
φο = 33.5o
∆φ = 14.0o

40
FIGURE 27. Shear strength failure envelope for pit run with 20% RAP.
Normal Stress, σn (psi)
0 2 4 6 8 10 12 14 16
Shea
r Stre
ss, τ
(psi
)
0
2
4
6
8
10
12
14
16
Shear DataFailure Envelope
NOTES:1) Shear failure defined at peak of stress-strain curve or 3.6 inches, whichever occured first. 2) Shearing rate is 0.05 in/min.3) Atmosperic pressure (pa) is assumed to be 14.7 psi.4) φ1 is equivalent to the friction angle from the origin to the data point with a confining pressure of 3.6 psi.5) φ0 is equivalent to the friction angle from the origin to the data point with a confining pressure of 14.7 psi.
⎟⎟⎠
⎞⎜⎜⎝
⎛∆−=
a
n
pσφφφ log' 0
c' = 0φ1 = 46.3o
φο = 28.9o
∆φ = 28.0o

41
FIGURE 28. Shear strength failure envelope for pit run with 50% RAP.
Normal Stress, σn (psi)
0 2 4 6 8 10 12 14 16
Shea
r Stre
ss, τ
(psi
)
0
2
4
6
8
10
12
14
16
Shear DataFailure Envelope
NOTES:1) Shear failure defined at peak of stress-strain curve or 3.6 inches, whichever occured first. 2) Shearing rate is 0.05 in/min.3) Atmosperic pressure (pa) is assumed to be 14.7 psi.4) φ1 is equivalent to the friction angle from the origin to the data point with a confining pressure of 3.6 psi.5) φ0 is equivalent to the friction angle from the origin to the data point with a confining pressure of 14.7 psi.
⎟⎟⎠
⎞⎜⎜⎝
⎛∆−=
a
n
pσφφφ log' 0
c' = 0φ1 = 42.9o
φο = 27.0o
∆φ = 26.0o

42
FIGURE 29. Shear strength failure envelope for pit run with 75% RAP.
Normal Stress, σn (psi)
0 2 4 6 8 10 12 14 16
Shea
r Stre
ss, τ
(psi
)
0
2
4
6
8
10
12
14
16
Shear DataFailure Envelope
NOTES:1) Shear failure defined at peak of stress-strain curve or 3.6 inches, whichever occured first. 2) Shearing rate is 0.05 in/min.3) Atmosperic pressure (pa) is assumed to be 14.7 psi.4) φ1 is equivalent to the friction angle from the origin to the data point with a confining pressure of 3.6 psi.5) φ0 is equivalent to the friction angle from the origin to the data point with a confining pressure of 14.7 psi.
⎟⎟⎠
⎞⎜⎜⎝
⎛∆−=
a
n
pσφφφ log' 0
c' = 0φ1 = 45.9o
φο = 27.2o
∆φ = 29.0o

43
FIGURE 30. Variation of friction angle with confining pressure for CBC #3 blends.
Material Identification
Difference in Angle Per Log Cycle
oφ Friction Angle at 1 Atms.
CBC # 3 20.4o 41.1o
20% RAP 11.3o 32.7o
50% RAP 8.6o 32.4o
75% RAP 21.8o 25.2o
TABLE 8. Relationship Between Friction Angle and Normalized Confining Pressure for CBC #3 Blends
Normalized Confining Pressure, σn/pa
0.1 1 10
Ffric
tion
Ang
le, φ
0
10
20
30
40
50
60
70
CBC # 3CBC # 3 with 20% RAPCBC # 3 with 50% RAPCBC # 3 with 75% RAP

44
FIGURE 31. Variation of friction angle with confining pressure for pit run blends.
Material Identification
Difference in Angle Per Log Cycle
oφ Friction Angle at 1 Atms.
Pit Run 14.0o 33.5o
20% RAP 28.0o 28.9o
50% RAP 26.0o 27.0o
75% RAP 29.0o 27.2o
TABLE 9. Relationship Between Friction Angle and Normalized Confining Pressure for Pit Run Blends
Normalized Confining Pressure, σn/pa
0.1 1 10
Ffric
tion
Angl
e, φ
0
10
20
30
40
50
60
70
Pit RunPit Run with 20% RAPPit Run with 50% RAPPit Run with 75% RAP

45
TABLE 10. Summary of Strength Parameters from Large Direct Shear Tests
4.07 Permeability Tests A minimum of three constant head permeability tests were conducted on each sample
using the large permeameter manufactured by Trautwein Soil Testing Equipment Company, as described in Section 3.07. The average hydraulic conductivities (permeabilities) for each material are plotted in Figure 32 as a function of percent RAP. Theses trends clearly indicate that permeability increases as the percentage of RAP in the mix is increased. A similar trend was observed in the laboratory testing conducted by Hanks and Magni (1989) for the Ministry of Transportation in Ontario, and by Highter et al. (1997). Hanks and Magni found that the permeability of granular materials increased by at least an order of magnitude when more than 50% RAP was added. Highter’s (1997) tests showed that the permeability of a crushed base course and a natural-occurring gravel borrow material increased by slightly over 100% when blended with 50% RAP.
Permeability in granular soils is directly related to the percentage of fines (particles passing the #200 sieve) present in the material. Throughout the course of this research it was noted that fine materials in the virgin aggregates adhered to RAP particles during mixing, processing, and compacting. The reduction of finer material was measured during gradation testing, as discussed in Section 4.01. Results from the multiple constant head permeability tests are summarized in Table 11. The samples were rod tamped and vibrated into the permeameter mold to relative compaction values ranging from about 92 to 97 percent of the maximum dry density based on the modified Proctor test. Table 12 summarizes the average dry unit weights of the materials as measured in the permeameters prior to testing. The average density of all the test samples was about 94% of the modified Proctor maximum dry density.
Average permeabilities measured in this study versus the percentage of asphalt millings (RAP) are plotted in Figure 32. From this plot it is apparent that the permeability of a material generally increases as the percentage of RAP in the blend is increased. The same trend can be observed in Figure 33 in which results from laboratory constant head permeability tests by Hanks
Material Identification
φ1 φ at 3.6 psi
(deg)
φo φ at 14.7 psi
(deg)
∆φ per log cycle
(deg)
φ’ at σn = 3.6 psi
(deg)
τ at 3.6 psi
(psi) CBC # 3 (0% RAP) 53.5 41.1 20.4 53.5 4.90
20% RAP 39.9 32.7 11.3 39.6 3.00
50% RAP 37.9 32.4 8.6 37.6 2.79
75% RAP 38.1 25.2 21.8 38.5 2.88 Pit Run (0% RAP) 42.0 33.5 14.0 42.0 3.26
20% RAP 46.3 28.9 28.0 45.9 3.74
50% RAP 42.9 27.0 26.0 42.8 3.36
75% RAP 45.9 27.2 29.0 44.8 3.60

46
and Magni (1989) and Highter et al. (1997) are incorporated with the test results from this study. The samples tested by Highter et al. (1997) were compacted to relative compaction values ranging from 89 to 96 percent of standard Proctor maximum dry density. Hanks and Magni (1989) do not report the method that was used to conduct the tests in their study, nor the relative compaction of the samples
These laboratory test results indicate there is a direct relationship between the percentage of asphalt millings in a granular material and permeability. Without substantially more testing, this relationship cannot be quantified because of the many variables inherent in permeability testing. Nonetheless, based on our observations of the behavior of RAP blends, this relationship between percent RAP and permeability appears logical. Our testing and observations showed that the percentage of fines decreases when RAP is added to soil because of the binding or cementing effect between the finer soil particles and the viscous asphalt. This binding effect is further escalated by the addition of heat (as previously noted in the discussion of the gradation and specific gravity). In addition, because asphalt is a petroleum based compound it has a natural aversion to water. It is believed that the combination of these factors results in an increase in permeability of soils mixed with RAP, which is considered a desirable outcome for material used to support an asphaltic pavement surface.
There is some variability of the permeability results in this study and the referenced studies that partially could be attributed to the relative compaction of the samples prior to testing. Every effort was made in this study to employ consistent measures for preparing and compacting the samples in the permeameters. However, because of the large size of the permeameter and because the maximum dry density and gradation changed with changes in RAP content, equivalent relative compaction values could not accurately be obtained for all of the samples. Nonetheless, from the laboratory results evaluated in this study, it can be concluded that adding as much as 50% asphalt millings to aggregate does not reduce the permeability of the blend, and all indications are that adding millings to aggregate may increase the permeability. It is recommended that the long-term relationship between percent RAP and permeability be evaluated by conducting measurements on carefully controlled field test sections.
FIGURE 32. Permeability test results for RAP/aggregate blends.
Percent RAP (%)
0 10 20 30 40 50 60
Perm
eabi
lity
(ft/d
ay)
1
10
100
1000
CBC #1 CBC #2CBC #3Pit Run
Note: Lines shown are based on best fit linear regression.

47
TABLE 11. Summary of Permeability Test Results Material Identification
k1 (cm/s)
k2 (cm/s)
k3 (cm/s)
avg. k (cm/s)
avg. k (ft/day)
CBC #1 0% RAP 0.0059 0.0022 0.0008 0.0030 8.50
20% RAP 0.0063 0.0061 0.0131 0.0085 24.1 50% RAP 0.0151 0.0193 0.0199 0.0181 51.3
CBC #2
0% RAP 0.0029 0.0054 0.0049 0.0044 12.5 20% RAP 0.0070 0.0097 0.0126 0.0098 27.8 50% RAP 0.0650 0.0519 0.0495 0.0555 157.3
CBC #3
0% RAP 0.0029 0.0040 0.0015 0.0028 7.9 20% RAP 0.0122 0.0125 0.0102 0.0116 32.9 50% RAP 0.0730 0.1160 0.2600 0.1496 424.1
Pit Run
0% RAP 0.0018 0.0016 0.0027 0.0021 5.9 20% RAP 0.0006 0.0005 0.0004 0.0005 1.4 50% RAP 0.0087 0.0084 0.0099 0.0090 25.5
Note: k = soil permeability or hydraulic conductivity.
TABLE 12. Summary of Dry Unit Weights and Relative Densities for Permeability Samples
0% RAP 20% RAP 50% RAP Material Identification
Unit Weight1 (pcf)
RC2 (%)
Unit Weight1 (pcf)
RC2 (%)
Unit Weight1 (pcf)
RC2 (%)
CBC # 1 137.8 97.1 131.7 92.6 130.0 96.5
CBC # 2 133.0 93.0 135.4 95.3 128.7 92.4
CBC # 3 137.4 96.4 130.4 92.8 126.2 92.6
Pit Run 133.3 92.1 134.6 93.1 129.6 92.1
Notes: 1) Average unit weight of permeameter specimens. 2) RC = Relative compaction based on modified Proctor test.

48
FIGURE 33. Permeability versus percent RAP.
4.08 R-Value Tests The strength, stiffness, compressibility, and moisture characteristics of the material
underlying the asphalt surface can have a significant influence on pavement performance and long-term maintenance. The subgrade and base layers must be strong enough to resist shear failure and have adequate stiffness to limit significant vertical deflection. Stronger and stiffer materials provide a more effective foundation for the riding surface, and will be more resistant to stresses from repeated loadings and environmental conditions.
R-Values are directly related to a soil’s resilient modulus and play a key role in highway design. MDT historically uses the R-value approach for designing the thickness of each layer in an asphalt concrete pavement section. High R-values correspond to high stiffness. Stiffer soils have relatively higher resilient moduli, which indicates less potential for differential settlement and rutting. Therefore, the required thickness of the base course and subbase course layers underlying the riding surface can be reduced as their R-values are increased.
Duplicate R-value tests were conducted on samples of CBC #3 and pit run at blend percentages of 0, 20, 50, and 75% RAP. Results from the tests, which were conducted in the MDT Helena materials lab, are summarized in Table 13. Based on these tests, it appears that the effect of adding RAP depends on the characteristics of the virgin material. As shown in Figure 34, the addition of asphalt millings had little effect, if any, on the R-value of the crushed aggregate (CBC #3). However, the R-value for the pit run clearly increased when mixed with RAP. These are both positive outcomes. The test results suggest that the addition of asphalt millings to crushed angular aggregate will have only minor effects on stiffness, while the
Percent RAP (%)
0 10 20 30 40 50 60 70 80 90 100
Perm
eabi
lity
(ft/d
ay)
0.1
1
10
100
1000
10000
CBC #1, Mokwa (2005)CBC #2, Mokwa (2005)CBC #3, Mokwa (2005)Pit Run, Mokwa (2005)Crushed Stone, Highter (1997) Gravel Borrow, Highter (1997)Crushed Stone, Hanks (1989)

49
addition of RAP to natural pit run soil may result in an R-value increase. The relationship between percent RAP and R-value is primarily dependent upon the properties of the virgin material. For the materials tested in this study, it appears that adding RAP to cohesionless, predominately coarse-grained material will not adversely affect the R-value of the blended mix. The test results also indicate there is little to no difference between the R-values of the 50% and 75% RAP mixes.
These results are supported by the resilient modulus tests that were conducted by Highter et al. (1997) that showed the resilient modulus of a crushed aggregate and a granular borrow increased with an increase in the percentage of RAP. Hanks and Magni (1989) conducted CBR tests on crushed aggregate blended with recovered bituminous material (RBM) and measured CBR values greater than 100% for blend ratios of up to 60% RBM, if the materials were allowed to age for up to 14 days prior to testing. According to the authors of the study, this strength gain was attributed partly to drying of the sample and partly to the re-cementing effects of the asphalt from the millings.
In contrast to the trends observed from the R-value tests in this study and the resilient modulus tests conducted by Highter et al. (1997), the CBR test results from Hanks and Magni (1989) show an overall decrease in CBR values as the percentage of RBM was increased. This may be partially attributed to the quality of RBM that was used in their testing. They described the RBM as bituminous pavement that was recovered by milling and “may consist of hot mix, mulch, surface treatment, or any combination of these”.
In summary, there appears to be some inconsistencies between the R-value, CBR, resilient modulus, and shear strength tests. These inconsistencies are largely attributed to differences in the testing methods, and differences in the characteristics of the virgin materials and asphalt millings. Until a much larger database of strength and stiffness parameters for blended materials becomes available, it is recommended that R-value tests be conducted on a project specific basis using the same materials and blend percentages that will be used during construction. Whenever possible, the tests should be conducted at a range of RAP percentages, similar to the process used in this study. This would provide the project engineer/construction manager with some leeway in working with the contractor, and would also provide additional information that could be used to enhance the database of strength and stiffness test results.

50
TABLE 13. Summary of R-Value Test Results
FIGURE 34. Average R-Value as a function of percent RAP.
4.09 X-Ray Computed Tomography Scans X-Ray CT scanning provides another means of evaluating the seepage and drainage
characteristics of RAP blended material (in addition to permeability testing). CT scanning is a newly emerging technology that can be used to nondestructively measure the void ratio, density, porosity, and grain size distribution of two-dimensional cross-section images of soil samples (Nielsen 2004). Advanced CT techniques can be used to measure the pore size distribution, pore
Material Identification
Test 1 R-Value
Test 2 R-Value
Average R-Value
CBC # 3 (0% RAP) 69.0 76.0 72.5
20% RAP 68.0 71.0 69.5
50% RAP 72.0 74.0 73.0
75% RAP 72.0 75.0 73.5 Pit Run (0% RAP) 39.0 46.0 42.5
20% RAP 61.0 57.0 59.0
50% RAP 77.0 73.0 75.0
75% RAP 74.0 76.0 75.0
Note: R-values measured at an exudation pressure of 300 psi.
% RAP
0 10 20 30 40 50 60 70 80 90 100
R-V
alue
40
45
50
55
60
65
70
75
80
CBC # 3Pit Run

51
connectivity, and pore tortuosity of three-dimensional images. These properties are directly related to the permeability, seepage, and drainage characteristics of a particulate material (Mitchell 1993). The technique has great promise because of the difficulties inherent in traditional methods of measuring permeability in the lab. CT technology may one day represent a viable alternative to traditional destructive laboratory tests that often introduce bias as part of the mechanical testing process.
As described in Section 3.09, 2-in-diameter samples of the pit run soil were scanned using the MSU Civil Engineering Department’s CT apparatus. X-Ray CT scans were conducted at four different depths through cylindrical samples of the virgin pit run sandy gravel and the 50/50 pit run blend. Each CT scan consisted of 1,440 x-ray exposures using a ¼-degree rotation increment over a full 360 degrees of rotation. For each scan, the 1,440 images were processed, digitized, and reconstructed to obtain two-dimensional digital images through the sample at the cut (scan) location. Photos of the images are provided in Appendix D.
Soil porosity values were calculated using the digitized images by comparing the computed area of void space between particles to the computed total area using stereology and granulometry techniques (Alshibli 2000). The results of the porosity calculations are shown in Figure 35. The average porosity was 21.5% for the unblended pit run specimen, and 19.75% for the 50/50 blend. The standard deviations were 5.7% and 8.7% for the unblended pit run specimen and the 50/50 blend, respectively. Because the two samples had similar average values and relatively high standard deviations, no conclusion s can be made regarding potential changes in porosity as a result of adding RAP to the pit run soil. Based on this limited amount of CT testing, it appears there is no measurable difference. Additional testing would be necessary to determine if the deviation between the individual CT scans and the calculated porosities were a result of CT image resolution issues or a result of the natural heterogeneity of the soils within the sample container. Based on a qualitative evaluation of the images shown in Appendix D, it appears that both factors contributed to the scatter in porosity results shown in Figure 35.
FIGURE 35. Porosity results from x-ray computed tomography scans.
Por
osity
(%)
0
5
10
15
20
25
30
35
40
45
50
Pit run: no RAP Pit run with 50% RAP

52
5.0 RESULTS AND RECOMMENDATIONS
5.01 Summary of Results This research study was structured to evaluate the suitability of RAP blends in terms of
significant changes observed in relatively easily measured and quantifiable properties. The laboratory testing program consisted of grain size analyses, specific gravity tests, modified Proctor compaction tests, relative density tests, Los Angeles abrasion tests, direct shear tests, permeability tests, R-value tests, and x-ray CT scans. Following is a brief overview of major findings.
1. The addition of RAP to three different crushed base aggregates and one sample of
pit run sandy gravel resulted in an increase in the amount of particles passing the upper sieves, and a decrease in the percentage of particles passing the lower sieves. Soil classifications, if altered at all by the addition of RAP, simply changed from A-1-a (MT 6A) to A-1-a (MT 5A) for the crushed aggregate. According to the MDT standard specifications (MDT 1995), the pit run classified as a special borrow, both before and after it was blended with asphalt millings.
2. The specific gravity of RAP blended samples decreased as the percentage of RAP was increased.
3. Results from Proctor laboratory compaction tests indicate that maximum dry unit weights and optimum water contents decrease upon the addition of reclaimed asphalt. It is believed that the overall relative density of the RAP/aggregate blends is comparable to that of the virgin soils, and that the decrease in maximum dry unit weights is due in large part to the lower specific gravity attributes of the RAP.
4. The modified Proctor impact test caused a small amount of particle degradation in each of the soil samples. The particle breakdown effects were most noticeable in the lower (finer) portions of the gradation curve; generally particles smaller than the #4 sieve. In general, the impact compaction procedure had only minor effects on the overall particle size distributions.
5. The combination of added water for compaction testing, the residual oil in the asphalt, and the dynamic impact of the compaction hammer created a binding or cementing effect between the finer soil particles and the viscous asphalt. Smaller soil particles adhered to RAP pieces during compaction, and were not completely broken into their individual parts by the sieve shaker. It is hypothesized that this same effect would occur during construction in the field. Additional testing and monitoring of full-scale field test sections is recommended to verify this effect, which plays a significant role in the behavior of RAP blends.
6. Relative density testing is likely a poor method of density determination for soils containing RAP. Asphalt millings contain large and irregularly shaped conglomerates that cause nesting within testing containers, resulting in inaccurate void ratio measurements, especially when using standard methods for measuring

53
the maximum void ratio. Relative compaction using the Proctor test is the preferred approach for evaluating compaction.
7. The addition of RAP did not alter the degradation properties of any of the tested materials to the extent that they would be unacceptable for use as base course or subbase course materials.
8. Results from shear strength tests indicate that the addition of asphalt millings to a granular soil results in a more ductile or softer response to loading than exhibited by the virgin (unblended) soil. The ductility increased, and the secant modulus at low strains decreased as the percentage of RAP in the sample was increased.
9. Unblended crushed aggregate provides a much stiffer response to loading than the unblended pit run because of the difference in particle shape and surface roughness characteristics of the two materials. But as the RAP content is increased, the stiffness of the two materials decrease and appear to converge as the RAP content approaches about 75%. At higher levels of RAP, the characteristics of the asphalt millings begin to control the behavior of the blend, resulting in a decreased modulus.
10. Based on results from large direct shear tests, the addition of asphalt millings to a crushed aggregate and to a pit run gravel caused a decrease in shear strength. The shear strength decreased upon the addition of relatively small amounts of RAP (20%), and appeared to level off with no significant changes occurring as the RAP content was increased to 75%. Overall, the shear strength decrease was relatively small and does not seem to be substantial enough to warrant the exclusion of RAP in road base materials, especially when the potential for strength gains over time is taken into account.
11. Constant head permeability tests indicate that the permeability of a granular soil increases as the percentage of RAP increases. In some cases, permeability increased by as much as one order of magnitude.
12. Based on testing conducted during this study, it appears that the addition of asphalt millings to crushed angular aggregate will have only minor effects on the R-value, while the addition of RAP to natural pit run soil may result in an R-value increase. The relationship between percent RAP and R-value is primarily dependent upon the properties of the virgin material, and only secondarily influenced by the percent of asphalt millings.
5.02 Conclusions and Recommendations The outlook for the continued implementation of RAP as an additive to granular base and
subbase materials for use in highway construction looks promising. Laboratory testing conducted during this study indicates that blending asphalt millings with granular cohesionless material like crushed aggregate or pit run gravel results in only minor changes to the engineering properties of the virgin material. The specific gravity and maximum dry density of the blend decreases as the percentage of RAP is increased. It is not conclusive whether RAP has a predictable trend or affect on the optimum water content. No significant changes were observed in the resistance to degradation.

54
Small changes in strength and compressibility were observed. The RAP blends exhibited decreased shear strength and decreased stiffness as the quantity of asphalt millings was increased. Measured R-values for two different virgin aggregates were acceptable even when as much as 75% millings were used to create the RAP blends. Because shear strength and stiffness are highly particle dependent, it is recommended that these parameters be evaluated on a project-by-project basis as necessary, until enough data becomes available to statistically evaluate any trends that may exist. It is recommended that these important parameters be further investigated by conducting field measurements on control sections to evaluate any changes that may occur after long-term exposure to repeated traffic loads and the extreme environmental conditions that are common to Montana.
Based on this laboratory study, supplemented with data from other published research, it appears that the permeability of RAP blends increases as the percentage of asphalt millings in the blend is increased. This is attributed to minor changes in particle gradation that occur upon the addition of RAP. In comparison to the virgin aggregates, the RAP blends used in this study showed an increase in the amount of particles passing the upper sieves, indicating the blended material contained a larger percentage of coarse particles (plus the #4 sieve) than the virgin aggregate. In contrast, the blends exhibited a decrease in the percentage of particles passing the lower sieves because of the binding or cementing effect between the finer soil particles and the viscous asphalt. Overall, the changes in gradation were not significant enough to result in changes to the soil classification; however, the net result of adding RAP is believed to have a positive influence (increase) on the permeability. In terms of construction, the age of the milled asphaltic surface, the quantity and viscosity of oil in the mix, and the type of milling operation used on a project will influence the blended material’s gradation curve, and consequently the permeability of the compacted layer.
This laboratory study should be regarded as the first step towards full-scale adaptation of RAP/aggregate blends in highway pavement sections. Supplemental field testing and highway test sections should be considered to evaluate how regional soil, weather, and traffic loading conditions affect the use of recycled materials. The long-term performance of RAP blends is likely to be highly dependent on the methods used during construction and the quality control/quality assurance testing that occurs during material placement. It is recommended that future studies include an investigation and evaluation of these practices.
In conclusion, the implications of this study should be further investigated by evaluating projects in which RAP mixtures have already been used, and by constructing and evaluating the performance of controlled test sections. The long-term performance of RAP mixtures used as base and subbase courses should be evaluated, and if viable, limits should be established on the maximum amount of RAP allowed in the mixture.

55
6.0 REFERENCES
AASHTO (2002). Standard Specifications for Transportation Materials and Methods of Sampling and Testing, Part I - Specifications, Part II – Tests, 22nd Edition. American Association for State Highway and Transportation Officials, Washington, D.C.
Alshibli, K. A. (2000). “Quantifying Void Ratio in Sand Using Computed Tomography.” Geotechnical Measurements – Lab and Field: Proceedings of GeoDenver 2000 Specialty Conference.” August 5-8, Denver, CO: p. 30-43.
Asphalt Pavement Alliance, (2004). “Asphalt Pavement is America’s Most Recycled Product.” by APA, http://www.asphaltalliance.com.
ASTM (2002). American Society for Testing and Materials Natural Building Stones, Soil, and Rock, Annual Book of ASTM Standards, Part 19, Philadelphia, pp. 634.
Ayers, S. (1992). “California Town Rolls Out Pavement Recycling.” Report of City Engineer, Brawley, California.
Bushmeyer, B. (2004). “RAP – the Benefits.” Roads and Bridges, May 2004, p. 44-45.
Collins, R. J. and Ciesielski, S. K. (1994). “Recycling and Use of Waste Materials and By-Products in Highway Construction.” National Cooperative Highway Research Program Synthesis of Highway Practice 199, Transportation Research Board, Washington, D. C. (1994) pp. 36, 43-46.
Duncan, J. M., Byrne, P., Wong, K. S., and Mabry, P. (1980). “Strength, Stress-Strain and Bulk Modulus Parameters for Finite Element Analyses of Stresses and Movements in Soil Masses.” Report No. UCB/GT/80-01, Office of Research Services, University of California, Berkeley, CA. pp. 68.
FHWA (1993). “Engineering and Environmental Aspects of Recycling Materials for Highway Construction.” Federal Highway Administration and U.S. Environmental Protection Agency, Report No. FHWA-RD-93-008, Washington, DC, May 1993.
Garg, N. and Thompson, M. R. (1996). “Lincoln Avenue Reclaimed Asphalt Pavement Base Project.” Transportation Research Record 1547, TRB, National Research Council, Washington, D.C. p. 89-95.
Hanks, A. J. and Magni, E. R. (1989). “The Use of Recovered Bituminous and Concrete Materials in Granular and Earth.” Report for the Ministry of Transportation, Ontario Engineering Materials Office, Report No. MI-137, p. 1-87.
Highter, W. H., Clary, J. A., and DeGroot, D. J. (1997). “Structural Numbers for Reclaimed Asphalt Pavement Base and Subbase Course Mixes.” Technical Report for the Massachusetts Highway Department, Report No. UMTC-95-2, pp. 111.
Maher, M.H. (1997). “Recycled Asphalt Pavement as a Base and Sub-base Material.” Associate Professor, Rutgers University, New Jersey, p. 42.
MDT (1988). Montana Materials Manual of Test Procedures. by the Montana Department of Transportation, (1988 with updates).

56
MDT (1995). Standard Specifications for Road and Bridge Construction. Adopted by the Montana Department of Transportation and the Montana Transportation Commission.
Mitchell, J. K. (1993). “Fundamentals of Soil Behavior, 2nd Ed.” John Wiley and Sons, New York.
Nielsen, B.D. (2004). “Non-Destructive Soil Testing Using X-ray Computed Tomography.” Masters of Science Thesis for the Department of Civil Engineering, Montana State University, Montana, pp. 126.
Simanski, R. E. (1979). “Asphalt Recycling is Here to Stay.” The Asphalt Institute. Information Series No. 172 (IS-172), March 1979, p. 1-3.
Taha, R. (2001). “Evaluation of Cement Kiln Dust-Stabilized Reclaimed Asphalt Pavement Aggregate Systems in Road Bases.” Transportation Research Record: Journal of the Transportation Research Board, No. 1819, TRB, National Research Council, Washington, D.C. p. 11-17.

57
Appendix A Grain Size Distribution Curves
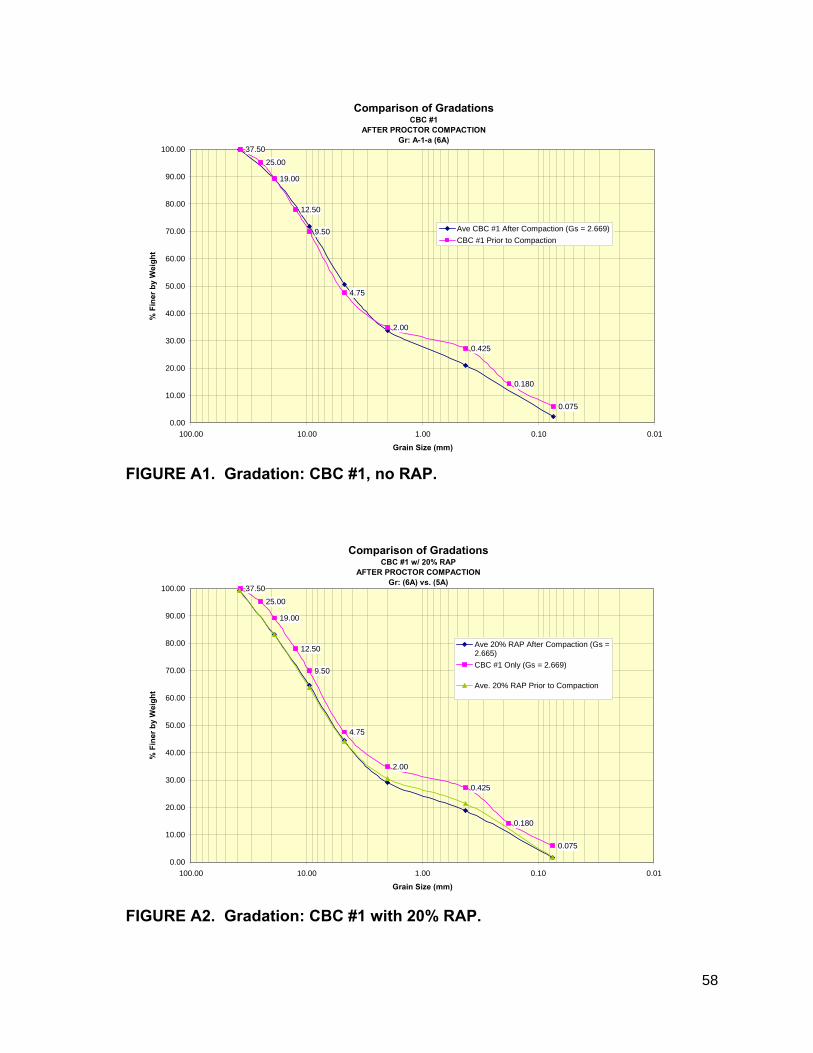
58
Comparison of GradationsCBC #1
AFTER PROCTOR COMPACTIONGr: A-1-a (6A)
37.50
25.00
19.00
12.50
9.50
4.75
2.00
0.425
0.180
0.075
0.00
10.00
20.00
30.00
40.00
50.00
60.00
70.00
80.00
90.00
100.00
0.010.101.0010.00100.00
Grain Size (mm)
% F
iner
by
Wei
ght
Ave CBC #1 After Compaction (Gs = 2.669)CBC #1 Prior to Compaction
FIGURE A1. Gradation: CBC #1, no RAP.
Comparison of GradationsCBC #1 w/ 20% RAP
AFTER PROCTOR COMPACTIONGr: (6A) vs. (5A)
37.50
25.00
19.00
12.50
9.50
4.75
2.00
0.425
0.180
0.075
0.00
10.00
20.00
30.00
40.00
50.00
60.00
70.00
80.00
90.00
100.00
0.010.101.0010.00100.00
Grain Size (mm)
% F
iner
by
Wei
ght
Ave 20% RAP After Compaction (Gs =2.665)CBC #1 Only (Gs = 2.669)
Ave. 20% RAP Prior to Compaction
FIGURE A2. Gradation: CBC #1 with 20% RAP.

59
Comparison of GradationsCBC # 1 w/ 50% RAP
AFTER PROCTOR COMPACTIONGr: (6A) vs. (5A)
37.5025.00
19.00
12.50
9.50
4.75
2.00
0.425
0.180
0.075
0.00
10.00
20.00
30.00
40.00
50.00
60.00
70.00
80.00
90.00
100.00
0.010.101.0010.00100.00
Grain Size (mm)
% F
iner
by
Wei
ght
Ave 50% RAP After Compaction (Gs =2.593)CBC #1 Only (Gs = 2.669)
50% RAP Prior to Compaction
FIGURE A3. Gradation: CBC #1 with 50% RAP.
Comparison of GradationsCBC # 2
AFTER PROCTOR COMPACTIONGr: A-1-a (6A)
38.10
19.10
9.52
4.75
2.00
0.425
0.0750.00
10.00
20.00
30.00
40.00
50.00
60.00
70.00
80.00
90.00
100.00
0.010.101.0010.00100.00
Grain Size (mm)
% F
iner
by
Wei
ght
Ave CBC # 2 After Compaction (Gs = 2.697)CBC # 2 Prior to Compaction
FIGURE A4. Gradation: CBC #2, no RAP.

60
Comparison of GradationsCBC #2 w/ 20% RAP
AFTER PROCTOR COMPACTIONBoth Gr: A-1-a (6A)
37.50
25.00
19.00
9.50
4.75
2.00
0.425
0.180
0.0750.00
10.00
20.00
30.00
40.00
50.00
60.00
70.00
80.00
90.00
100.00
0.010.101.0010.00100.00
Grain Size (mm)
% F
iner
by
Wei
ght
Ave 20% RAP After Compaction
CBC #2 Only (Gs = 2.697)
Ave. 20% RAP Prior to Compaction (Gs = 2.656)
FIGURE A5. Gradation: CBC #2 with 20% RAP.
Comparison of GradationsCBC #2 w/ 50%
AFTER PROCTOR COMPACTION Gr: A-1-a (6A) vs. (5A)
37.50
25.00
19.00
9.50
4.75
2.00
0.425
0.180
0.0750.00
10.00
20.00
30.00
40.00
50.00
60.00
70.00
80.00
90.00
100.00
0.010.101.0010.00100.00
Grain Size (mm)
% F
iner
by
Wei
ght
Ave 50% RAP After Compaction
CBC #2 Only (Gs = 2.697)
Ave. 50% RAP Prior to Compaction (Gs = 2.588)
FIGURE A6. Gradation: CBC #2 with 50% RAP.

61
Comparison of GradationsCBC #3
AFTER PROCTOR COMPACTIONGr: A-1-a (5A)
38.10
19.10
9.52
4.75
2.00
0.425
0.075
0.00
10.00
20.00
30.00
40.00
50.00
60.00
70.00
80.00
90.00
100.00
0.010.101.0010.00100.00
Grain Size (mm)
% F
iner
by
Wei
ght
Ave CBC #3 After Compaction (Gs = 2.680)CBC #3 Prior to Compaction
FIGURE A7. Gradation: CBC #3, no RAP.
Comparison of GradationsCBC 3# w/ 20% RAP
AFTER PROCTOR COMPACTION Gr: Both A-1-a (6A)
37.50
25.00
19.00
9.50
4.75
2.00
0.425
0.180
0.0750.00
10.00
20.00
30.00
40.00
50.00
60.00
70.00
80.00
90.00
100.00
0.010.101.0010.00100.00
Grain Size (mm)
% F
iner
by
Wei
ght
Ave 20% RAP After Compaction
CBC #3 Only (Gs = 2.691)
Ave. 20% RAP Prior to Compaction (Gs = 2.656)
FIGURE A8. Gradation: CBC #3 with 20% RAP.

62
Comparison of GradationsCBC #3 w/ 50% RAP
AFTER PROCTOR COMPACTION Gr: A-1-a (6A)
37.50
25.00
19.00
9.50
4.75
2.00
0.425
0.180
0.0750.00
10.00
20.00
30.00
40.00
50.00
60.00
70.00
80.00
90.00
100.00
0.010.101.0010.00100.00
Grain Size (mm)
% F
iner
by
Wei
ght
Ave 50% RAP After Compaction
CBC #3 Only (Gs =2.680)
Ave. 50% RAP Prior to Compaction (Gs = 2.592)
FIGURE A9. Gradation: CBC #3 with 50% RAP.
Comparison of Gradations(2"-) Pit Run
AFTER PROCTOR COMPACTIONSpecial Borrow
0.00
10.00
20.00
30.00
40.00
50.00
60.00
70.00
80.00
90.00
100.00
0.010.101.0010.00100.00
Grain Size (mm)
% F
iner
by
Wei
ght
Pit Run After Compaction (Gs = 2.723)
Pit Run Prior to Compaction
FIGURE A10. Gradation: Pit Run, no RAP.

63
Comparison of GradationsPit Run w/ 20% RAP
AFTER PROCTOR COMPACTIONGr: Special Borrow
38.10
19.10
9.52
4.75
2.00
0.425
0.0750.00
10.00
20.00
30.00
40.00
50.00
60.00
70.00
80.00
90.00
100.00
0.010.101.0010.00100.00
Grain Size (mm)
% F
iner
by
Wei
ght
Pit Run After Compaction (Gs = 2.627)Pit Run Prior to CompactionPit Run Only (Gs = 2.723)
FIGURE A11. Gradation: Pit Run with 20% RAP.
Comparison of Gradations
Pit Run w/ 50% RAPAFTER PROCTOR COMPACTION
Gr: Special Borrow
38.10
19.10
9.52
4.75
2.00
0.425
0.0750.00
10.00
20.00
30.00
40.00
50.00
60.00
70.00
80.00
90.00
100.00
0.010.101.0010.00100.00
Grain Size (mm)
% F
iner
by
Wei
ght
Pit Run After Compaction (Gs = 2.611)Pit Run Prior to CompactionPit Run Only (Gs = 2.723)
FIGURE A12. Gradation: Pit Run with 50% RAP.

64
Appendix B Direct Shear Stress-Displacement Curves
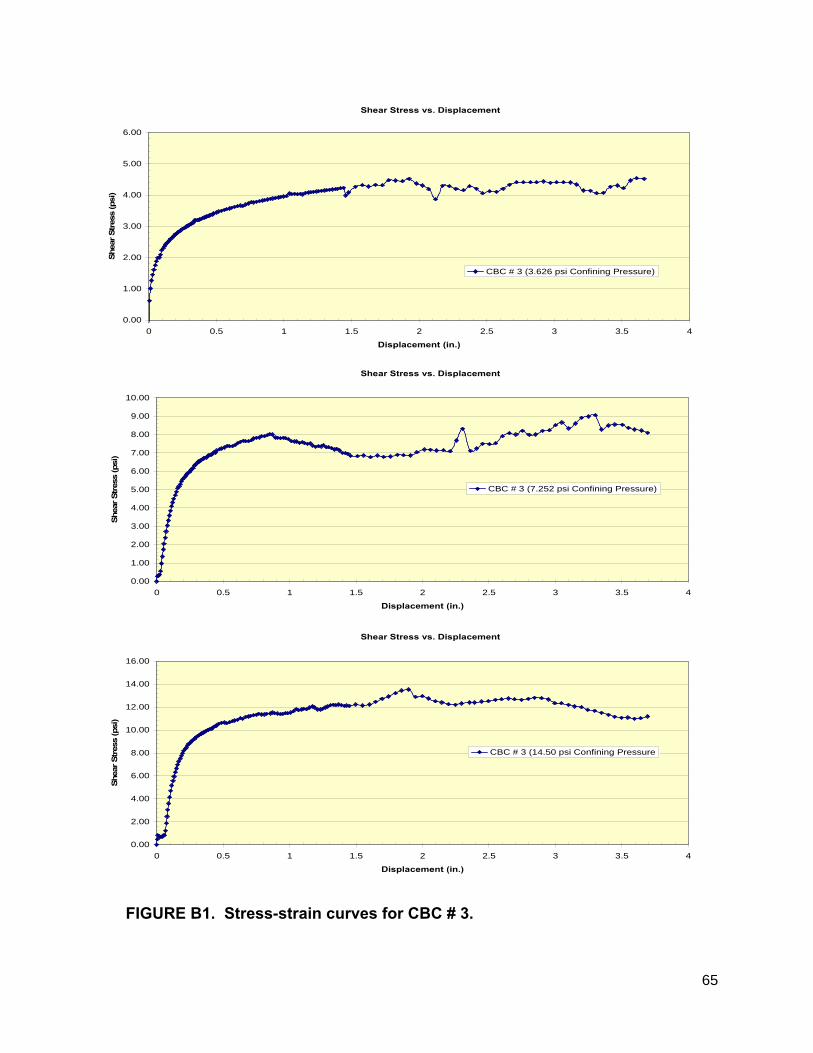
65
Shear Stress vs. Displacement
0.00
1.00
2.00
3.00
4.00
5.00
6.00
0 0.5 1 1.5 2 2.5 3 3.5 4
Displacement (in.)
Shea
r Str
ess
(psi
)
CBC # 3 (3.626 psi Confining Pressure)
Shear Stress vs. Displacement
0.00
1.00
2.00
3.00
4.00
5.00
6.00
7.00
8.00
9.00
10.00
0 0.5 1 1.5 2 2.5 3 3.5 4
Displacement (in.)
Shea
r Str
ess
(psi
)
CBC # 3 (7.252 psi Confining Pressure)
Shear Stress vs. Displacement
0.00
2.00
4.00
6.00
8.00
10.00
12.00
14.00
16.00
0 0.5 1 1.5 2 2.5 3 3.5 4
Displacement (in.)
Shea
r Str
ess
(psi
)
CBC # 3 (14.50 psi Confining Pressure
FIGURE B1. Stress-strain curves for CBC # 3.

66
Shear Stress vs. Displacement
0.00
0.50
1.00
1.50
2.00
2.50
3.00
3.50
0 0.5 1 1.5 2 2.5 3 3.5 4
Displacement (in.)
Shea
r Str
ess
(psi
)
Pit Run (2"-) with 3.626 psi ConfiningPressure
Shear Stress vs. Displacement
0.00
1.00
2.00
3.00
4.00
5.00
6.00
7.00
0 0.5 1 1.5 2 2.5 3 3.5 4
Displacement (in.)
Shea
r Str
ess
(psi
)
Pit Run (2"-) with 7.252 psi ConfiningPressure
Shear Stress vs. Displacement
0.00
2.00
4.00
6.00
8.00
10.00
12.00
0 0.5 1 1.5 2 2.5 3 3.5 4
Displacement (in.)
Shea
r Str
ess
(psi
)
Pit Run (2"-) with 14.504 psi ConfiningPressure
FIGURE B2. Stress-strain curves for Pit Run.

67
Shear Stress vs. Displacement
0.00
0.50
1.00
1.50
2.00
2.50
3.00
3.50
0 0.5 1 1.5 2 2.5 3 3.5 4
Displacement (in.)
Shea
r Str
ess
(psi
)
CBC # 3 with 20% RAP (3.62 psi ConfiningPressure)
Shear Stress vs. Displacement
0.00
1.00
2.00
3.00
4.00
5.00
6.00
7.00
0 0.5 1 1.5 2 2.5 3 3.5 4
Displacement (in.)
Shea
r Str
ess
(psi
)
CBC # 3 with 20% RAP (7.25 psi ConfiningPressure)
Shear Stress vs. Displacement
0.00
2.00
4.00
6.00
8.00
10.00
12.00
0 0.5 1 1.5 2 2.5 3 3.5 4
Displacement (in.)
Shea
r Str
ess
(psi
)
CBC # 3 with 20% RAP (14.50 psiConfining Pressure)
FIGURE B3. Stress-strain curves for CBC # 3 with 20% RAP.

68
Shear Stress vs. Displacement
0.00
0.50
1.00
1.50
2.00
2.50
3.00
0 0.5 1 1.5 2 2.5 3 3.5 4
Displacement (in.)
Shea
r Str
ess
(psi
)
CBC # 3 with 50% RAP (3.62 psi ConfiningPressure)
Shear Stress vs. Displacement
0.00
1.00
2.00
3.00
4.00
5.00
6.00
0 0.5 1 1.5 2 2.5 3 3.5 4
Displacement (in.)
Shea
r Str
ess
(psi
)
CBC # 3 with 50% RAP (7.25 psi ConfiningPressure)
Shear Stress vs. Displacement
0.00
1.00
2.00
3.00
4.00
5.00
6.00
7.00
8.00
9.00
10.00
0 0.5 1 1.5 2 2.5 3 3.5 4
Displacement (in.)
Shea
r Str
ess
(psi
)
CBC # 3 with 50% RAP (14.50 psiConfining Pressure)
FIGURE B4. Stress-strain curves for CBC # 3 with 50% RAP.

69
Shear Stress vs. Displacement
0.00
0.50
1.00
1.50
2.00
2.50
3.00
3.50
0 0.5 1 1.5 2 2.5 3 3.5 4
Displacement (in.)
Shea
r Str
ess
(psi
)
CBC # 3 with 75% RAP (3.62 psi ConfiningPressure)
Shear Stress vs. Displacement
0.00
0.50
1.00
1.50
2.00
2.50
3.00
3.50
4.00
4.50
5.00
0 0.5 1 1.5 2 2.5 3 3.5 4
Displacement (in.)
Shea
r Str
ess
(psi
)
CBC # 3 with 75% RAP (7.25 psi ConfiningPressure)
Shear Stress vs. Displacement
0.00
1.00
2.00
3.00
4.00
5.00
6.00
7.00
8.00
0 0.5 1 1.5 2 2.5 3 3.5 4
Displacement (in.)
Shea
r Str
ess
(psi
)
CBC # 3 with 75% RAP (14.50 psiConfining Pressure)
FIGURE B5. Stress-strain curves for CBC # 3 with 75% RAP.

70
Shear Stress vs. Displacement
0.00
0.50
1.00
1.50
2.00
2.50
3.00
3.50
4.00
4.50
0 0.5 1 1.5 2 2.5 3 3.5 4
Displacement (in.)
Shea
r Str
ess
(psi
)
Pit Run with 20% RAP (3.626 psi ConfiningPressure
Shear Stress vs. Displacement
0.00
1.00
2.00
3.00
4.00
5.00
6.00
0 0.5 1 1.5 2 2.5 3 3.5 4
Displacement (in.)
Shea
r Str
ess
(psi
)
Pit Run with 20% RAP (7.252 psi ConfiningPressure)
Shear Stress vs. Displacement
0.00
1.00
2.00
3.00
4.00
5.00
6.00
7.00
8.00
9.00
0 0.5 1 1.5 2 2.5 3 3.5 4
Displacement (in.)
Shea
r Str
ess
(psi
)
Pit Run with 20% RAP (14.504 psiConfining Pressure)
FIGURE B6. Stress-strain curves for Pit Run with 20% RAP.

71
Shear Stress vs. Displacement
0.00
0.50
1.00
1.50
2.00
2.50
3.00
3.50
4.00
0 0.5 1 1.5 2 2.5 3 3.5 4
Displacement (in.)
Shea
r Str
ess
(psi
)
Pit Run with 50% RAP (3.626 psi ConfiningPressure
Shear Stress vs. Displacement
0.00
1.00
2.00
3.00
4.00
5.00
6.00
0 0.5 1 1.5 2 2.5 3 3.5 4
Displacement (in.)
Shea
r Str
ess
(psi
)
Pit Run with 50% RAP (7.252 psi ConfiningPressure)
Shear Stress vs. Displacement
0.00
1.00
2.00
3.00
4.00
5.00
6.00
7.00
8.00
0 0.5 1 1.5 2 2.5 3 3.5 4
Displacement (in.)
Shea
r Str
ess
(psi
)
Pit Run with 50% RAP (14.504 psiConfining Pressure
FIGURE B7. Stress-strain curves for Pit Run with 50% RAP.

72
Shear Stress vs. Displacement
0.00
0.50
1.00
1.50
2.00
2.50
3.00
3.50
4.00
0 0.5 1 1.5 2 2.5 3 3.5 4
Displacement (in.)
Shea
r Str
ess
(psi
)
Pit Run with 75% RAP (3.626 psi ConfiningPressure)
Shear Stress vs. Displacement
0.00
0.50
1.00
1.50
2.00
2.50
3.00
3.50
4.00
4.50
5.00
0 0.5 1 1.5 2 2.5 3 3.5 4
Displacement (in.)
Shea
r Str
ess
(psi
)
Pit Run with 75% RAP (7.252 ConfiningPressure)
Shear Stress vs. Displacement
0.00
1.00
2.00
3.00
4.00
5.00
6.00
7.00
8.00
0 0.5 1 1.5 2 2.5 3 3.5 4
Displacement (in.)
Shea
r Str
ess
(psi
)
Pit Run with 75% RAP (14.504 psiConfining Pressure)
FIGURE B8. Stress-strain curves for Pit Run with 75% RAP.

73
Appendix C R-Value Test Reports

74
FIGURE C1. R-Value test report for CBC # 3 (test 1).

75
FIGURE C2. R-Value test report for CBC # 3 (test 2).

76
FIGURE C3. R-Value test report for CBC # 3 with 20% RAP (test 1).

77
FIGURE C4. R-Value test report for CBC # 3 with 20% RAP (test 2).

78
FIGURE C5. R-Value test report for CBC # 3 with 50% RAP (test 1).

79
FIGURE C6. R-Value test report for CBC # 3 with 50% RAP (test 2).

80
FIGURE C7. R-Value test report for CBC # 3 with 75% RAP (test 1).

81
FIGURE C8. R-Value test report for CBC # 3 with 75% RAP (test 2).

82
FIGURE C9. R-Value test report for Pit Run (test 1).

83
FIGURE C10. R-Value test report for Pit Run (test 2).

84
FIGURE C11. R-Value test report for Pit Run with 20% RAP (test 1).
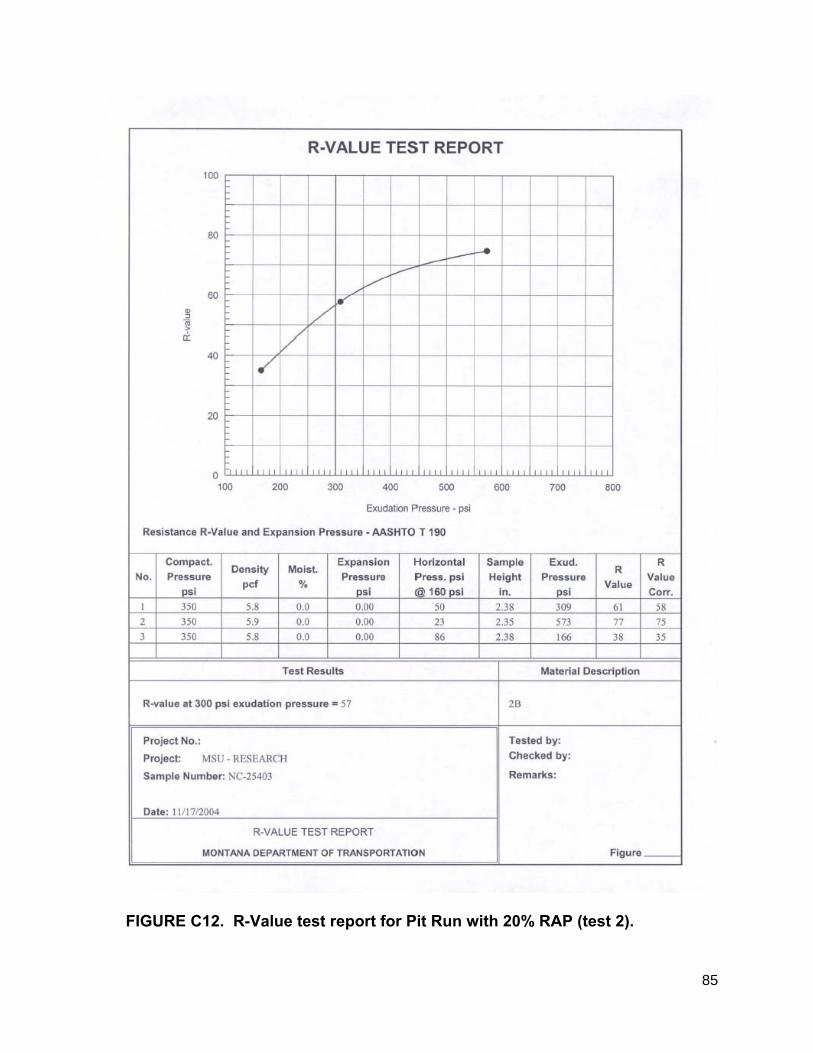
85
FIGURE C12. R-Value test report for Pit Run with 20% RAP (test 2).

86
FIGURE C13. R-Value test report for Pit Run with 50% RAP (test 1).

87
FIGURE C14. R-Value test report for Pit Run with 50% RAP (test 2).

88
FIGURE C15. R-Value test report for Pit Run with 75% RAP (test 1).

89
FIGURE C16. R-Value test report for Pit Run with 75% RAP (test 2).

90
Appendix D X-Ray Computed Tomography Scans

91
FIGURE D1. CT scans for Pit Run.

92
FIGURE D2. CT scans for Pit Run with 50% RAP.

150 copies of this public document were produced at an
estimated cost of 2.08 each, for a total cost of $312.58. This includes $139.05 for postage and $173.53 for printing.