research papers debye–waller coefficient of heavily...
TRANSCRIPT
research papers
508 https://doi.org/10.1107/S160057671700022X J. Appl. Cryst. (2017). 50, 508–518
Received 1 December 2016
Accepted 5 January 2017
Edited by V. Holy, Charles University, Prague,
Czech Republic
1This article will form part of a virtual special
issue of the journal, presenting some highlights
of the 13th Biennial Conference on High-
Resolution X-ray Diffraction and Imaging
(XTOP2016).
Keywords: nanocrystalline materials; Debye–
Waller coefficient; plastically deformed
materials; temperature diffuse scattering;
synchrotron radiation X-ray diffraction; EXAFS;
molecular dynamics.
Supporting information: this article has
supporting information at journals.iucr.org/j
Debye–Waller coefficient of heavily deformednanocrystalline iron1
P. Scardi,a* L. Rebuffi,b M. Abdellatief,c A. Flora and A. Leonardid
aDepartment of Civil, Environmental and Mechanical Engineering, University of Trento, Trento, Italy, bElettra-Sincrotrone
Trieste S.C.p.A., Trieste, Italy, cSynchrotron Light for Experimental Science and Applications in the Middle East – SESAME,
Allan, Jordan, and dDepartment of Geological Sciences, Indiana University, Bloomington, Indiana, USA. *Correspon-
dence e-mail: [email protected]
Synchrotron radiation X-ray diffraction (XRD) patterns from an extensively
ball-milled iron alloy powder were collected at 100, 200 and 300 K. The results
were analysed together with those using extended X-ray absorption fine
structure, measured on the same sample at liquid nitrogen temperature (77 K)
and at room temperature (300 K), to assess the contribution of static disorder to
the Debye–Waller coefficient (Biso). Both techniques give an increase of �20%
with respect to bulk reference iron, a noticeably smaller difference than
reported by most of the literature for similar systems. Besides good quality XRD
patterns, proper consideration of the temperature diffuse scattering seems to be
the key to accurate values of the Debye–Waller coefficient. Molecular dynamics
simulations of nanocrystalline iron aggregates, mapped on the evidence
provided by XRD in terms of domain size distribution, shed light on the origin
of the observed Biso increase. The main contribution to the static disorder is
given by the grain boundary, while line and point defects have a much smaller
effect.
1. Introduction
The Debye–Waller coefficient (B) provides a measure of the
structural disorder in a material, directly related to the static
and dynamic components of the atomic mean-square
displacement (MSD, hu2i) (Krivoglaz, 1969; Kuhs, 2006). Like
most properties, the MSD depends on the size of the crystal-
line domain (Clark et al., 1965; Allen & De Wette, 1969).
However, there are no simple and general rules to predict the
MSD in nanocrystals. Besides domain size and shape, devia-
tions from bulk MSD values depend on lattice defects and the
environment surrounding the nanocrystals, i.e. whether they
are embedded in a matrix or isolated, or are capped by
contaminants or by suitable organic phases.
Free or weakly constrained metal nanoparticles often show
a larger MSD, with a corresponding decrease in the average
Debye temperature (�D) (Valiev et al., 2000; Lu & Zhao,
1999). In simple monoatomic solids like cubic metal nano-
crystals, the following relation holds between the MSD and
�D at sufficiently high temperatures (T > �D) to render
quantum effects (zero-point vibrations) negligible (Willis &
Pryor, 1975):
Biso ¼8�2
3hu2i /
T
�2D
: ð1Þ
The MSD increase (and corresponding �D decrease) is often
attributed to a surface softening, as atoms on surfaces and at
interfaces are under-coordinated. Low-energy electron
diffraction (LEED) measurements on metals have shown that
ISSN 1600-5767

the surface Debye temperature is about 50% lower than the
bulk value (Inagaki et al., 1983; Clark et al., 1965; Van Hove et
al., 1986), with a corresponding increase in Biso. This surface
effect is responsible for the increase in the average MSD
(decrease in the average �D), which in nanocrystals scales
approximately as the surface/volume ratio, i.e. as 1/D (Inagaki
et al., 1983), where D is the diameter or any characteristic
length of the crystalline domain. Mossbauer spectroscopy has
shown a similar core/shell effect in both free iron nanocrystals
(Von Eynatten & Bommel, 1977) and ball-milled Cr–Fe alloy
nanocrystalline powders, where the Debye temperature of the
grain boundary region was found to be 100 K lower (i.e. about14 lower) than the bulk value (Kuwano et al., 1992). Beyond the
simplistic view of a sharp core(bulk)/shell(surface) model,
molecular dynamics (MD) has shown quite clearly that the
MSD is not constant across a metal nanoparticle. Rather than
undergoing a sharp change from core to surface, the MSD
increases steeply but continuously toward the surface layers,
where the low coordination has an effect on the atomic
displacement and vibrational properties (Gelisio et al., 2013;
Beyerlein et al., 2012).
Besides the specific effect on the vibration dynamics of
nanocrystals, the MSD increase is also related to a corre-
sponding increase both in the thermal expansion coefficient
(Yang et al., 2006) and in the heat capacity at low temperature,
where surface vibration modes are important (Michailov &
Avramov, 2012; Bai et al., 1996). The Debye–Waller (DW)
coefficient of nanocrystals can therefore deviate considerably
from the corresponding bulk perfect-crystal values and, in
addition to the above-mentioned effects, different types of
static disorder can be responsible for values in excess of the
expected ones (Krivoglaz, 1969; Londsdale, 1968). More
recently, coupled MD and X-ray powder diffraction (XRPD)
simulations have suggested that static disorder in grain
boundary regions contributes to both coherent and diffuse
scattering (Leonardi et al., 2013; Leonardi, Leoni, Li & Scardi,
2012), the latter resulting in a thermal-like step in the back-
ground of Warren plot profiles [Fig. 3 in the paper by Warren
& Averbach (1950)]. Experimental measurements of the DW
coefficient are therefore indispensable for assessing the
presence and extent of the different contributing effects.
Despite the interest in and generality of the problem, the
measured B values for nanocrystalline materials vary consid-
erably in the literature, sometimes showing huge increments
with respect to the reference values (Lu & Zhao, 1999). Values
for ball-milled iron, for example, have been reported to be
110% (Lu & Zhao, 1999; Zhao, 2001) or even 300% (Azzaza et
al., 2015) higher than the reference DW coefficient for bulk
iron (Butt et al., 1988). The interpretation of such large
increases in B is not always clear. Even if the role of surfaces
and grain boundaries is well established (Van Hove et al.,
1986), large B values in ball-milled nanocrystalline materials
have frequently been ascribed to some local strain (micro-
strain), a measure of which is obtained from diffraction line
broadening (Azzaza et al., 2015; Zhao, 2001; Sirdeshmukh et
al., 1993; Purushotham & Krishna, 2010), with no further
justification or proof of a real cause–effect linkage.
The present paper investigates the DW coefficient of an
extensively ball-milled iron alloy powder. The modelling of
the synchrotron radiation XRPD patterns collected at three
temperatures (100, 200 and 300 K), complemented by
extended X-ray absorption fine structure (EXAFS) results for
the same sample, provides values of the DW coefficient defi-
nitely smaller than those in the above-cited literature. With
the support of simulations of nanocrystalline iron clusters
made by MD, this work sheds light on the origin of the
increased B with respect to bulk values and on the role of the
correlated displacement of neighbouring atoms.
2. Experimental
The studied sample is an Astaloy Mo powder (Fe–
1.5 wt% Mo, FeMo), extensively ground (64 h) in a Fritsch P4
planetary ball mill. Details of the grinding process and the
resulting powder can be found in the paper by Rebuffi et al.
(2016) for the experimental part and electron microscopy,
whereas the work of Broseghini et al. (2016) deals with a
kinetic modelling of the mill used in the optimization of the
grinding process.
XRPD data were collected on 11-BM, the powder diffrac-
tion beamline at the Advanced Photon Source (Argonne
National Laboratory, Illinois, USA) based on the Debye–
Scherrer geometry. The X-ray beam of nominal energy 30 keV
(actual wavelength � = 0.0413679 nm) was diffracted by an
FeMo powder specimen loaded in a Kapton capillary (radius
R = 0.15 mm), using a detector assembly consisting of 12
independent Si(111) analysers and as many scintillation
counters. The 2� sampling step was 0.005�, over a 2� range
from 0 to 55�, with a counting time of 0.3 s per step.
The capillary mount is particularly convenient for collecting
reliable intensity values, provided that the absorption is
sufficiently low so that data corrections can be avoided. In
fact, expressions to correct the intensity for absorption are
known (Maslen, 2006) but they require information on the
density of the specimen, which is hardly known, especially in a
spinning capillary. Therefore, to limit absorption the powder
was diluted in carbon black and just lightly pushed into the
capillary, enough to remain steady on spinning but still low
density. Preliminary absorption measurements were made at
22.163 keV using X-rays from a sealed tube with an Ag anode
(see the supporting information). On the basis of direct
measurement of the linear absorption coefficient, �, we could
estimate �R < 0.1 for the 30 keV of 11-BM, a value suffi-
ciently low to make absorption corrections unnecessary.
XRPD data on the same sealed capillary were collected at 100,
200 and 300 K, in sequence, using an air blower to condition
the capillary temperature.
The instrumental profile (IP) was also evaluated experi-
mentally, collecting the pattern of NIST SRM660a (LaB6;
Cline et al., 2000) under comparable conditions. The IP was
parameterized in terms of the 2�-dependent trends in width
and shape of a pseudo-Voigt line profile fitting the experi-
mental data (see the supporting information). The contribu-
tion from the Kapton capillary and air scattering was also
research papers
J. Appl. Cryst. (2017). 50, 508–518 P. Scardi et al. � Debye–Waller coefficient of deformed iron 509
carefully evaluated: the pattern of a blank capillary was fitted
by seven pseudo-Voigt functions, enough to reproduce the
pattern empirically, and the resulting model was adapted as
background to the ball-milled FeMo data by means of a
refinable scaling factor. Further details are reported in the
supporting information.
The EXAFS measurements using the transmission mode
were performed on the XAS beamline at the Elettra
synchrotron in Trieste, Italy. The XAS beamline is installed on
a bending magnet source and it is dedicated to X-ray
absorption spectroscopy experiments between 2.4 and 27 keV
(Di Cicco et al., 2009). A homogenous pellet for the ground
FeMo sample was prepared by mixing a fixed amount of FeMo
together with poly(tetrafluoroethylene) membrane and then
the mixture was subjected to low applied pressure to prepare a
solid disc. The EXAFS measurements were carried out at the
K edge of Fe (i.e. E = 7112 eV) while the energy scan ranged
from 6912 to 8638 eV, with an energy step varying from 0.2 eV
at the near-edge region to 5 eV at the extremes of the spec-
trum. The incident and transmitted intensities were measured
by two ionization chambers, before and after the sample,
respectively. For better statistics, several scans were collected
on the sample at room temperature and at liquid nitrogen
temperature. Further details are reported in the supporting
information.
3. Numerical simulations
Atomistic simulations of a cluster of iron nanocrystals were
performed via MD using the software LAMMPS (Plimpton,
1995) and the embedded atom method (EAM; Daw & Baskes,
1983; 1984). An ideally crystallographic microstructure of 50
iron crystallites was generated by dividing the space within a
cubic box with periodic boundary conditions (PBCs) using a
modified Voronoi tessellation algorithm (Leonardi, Scardi &
Leoni, 2012) and filling each tessellation cell with a randomly
oriented periodic structure [i.e. body-centred cubic (b.c.c.),
2.86650 A unit-cell parameter]. The space tessellation was
allowed to evolve (Leonardi et al., 2013; Gross & Li, 2002; Xu
& Li, 2009) by constraining the cluster to follow the log-
normal distribution of diameters determined experimentally
by XRPD (Rebuffi et al., 2016). Thus, the ideal system was
energy-minimized by iteratively adjusting atom coordinates,
and then equilibrated with a 0.6 ns dynamics up to reaching a
steady state at constant pressure (0 Pa) and temperature
(300 K), using a Nose–Hoover style non-Hamiltonian
thermostat (Martyna et al., 1994; Parrinello & Rahman, 1981;
Shinoda et al., 2004; Tuckerman et al., 2006) with a 1 fs time
integration and Fe EAM pair potential (Mendelev et al., 2003).
Next, a set of uncorrelated arrangements of atomic positions
in space (i.e. frames) were recorded at 2 ps time intervals for a
0.2 ns long dynamics (i.e a time trajectory of 100 frames). The
time-average configuration was thus computed to cancel the
dynamic component out of the lattice distortion field
(Leonardi et al., 2011; Leonardi, Leoni, Li & Scardi, 2012).
The PBCs employed in MD simulations were removed,
recovering the continuity of the structure within the crystalline
domains. Furthermore, the crystallites were rigidly translated
by the PBC length so as to minimize the surface-to-volume
ratio of the resulting polycrystalline microstructure (i.e. an
average spherical shape). Next, XRPD patterns were simu-
lated using the Debye scattering equation (DSE) (Debye,
1915; Warren, 1990; Gelisio et al., 2010; Leonardi & Bish, 2016)
for all the frame configurations and their average over the
time trajectory. Finally, the profiles for the uncorrelated
frames were summed to obtain an experimental-like XRPD
pattern, accounting for an effective real-life measurement
time. Normalized by the numbers of frames and atoms,
respectively, the averaged positions (AP) and time-average
(TA) profiles therefore differed only in the dynamic contri-
bution to the line broadening (i.e. temperature diffuse scat-
tering, TDS). XRPD patterns for each single crystal were also
recorded while calculating the profiles for the whole micro-
structure. Thus, the XRD pattern for an ideal powder made of
monodisperse domains like a randomly chosen crystallite was
obtained, neglecting the contribution of inter-crystallite
interference to the observed XRPD profiles (Leonardi et al.,
2013; Leonardi, 2015).
The radial pair distribution function (RPDF) was calculated
over 100 frames along the MD trajectory, using the software
VMD (Humphrey et al., 1996; Levine et al., 2011).
4. Results and discussion
Diffraction data collected at the three temperatures (100, 200
and 300 K) were analysed by whole powder pattern modelling
(WPPM), following a procedure outlined by Rebuffi et al.
(2016). Line profiles of the b.c.c. FeMo phase [IhklðQÞ] were
modelled assuming their Fourier transform to be made up of
three contributions, namely the IP [AIPðLÞ], the finite domain
size [ASðLÞ], and the inhomogeneous strain or microstrain
[ADhklðLÞ] (Scardi, 2008):
IhklðQÞ /R
AIPðLÞASðLÞADhklðLÞ exp ðiQLÞ dL; ð2Þ
where hkl are the Miller indices of the modelled peak profile
[Q = (4�/�)sin(�/2), � being the scattering angle and � the
X-ray wavelength] and L is the Fourier length, the distance
between any two scattering centres along [hkl]. The propor-
tionality factor includes the usual trigonometric terms of the
Lorentz polarization factor with known constants and the
square modulus of the structure factor corrected for
temperature effects by the DW factor (Warren, 1990). Crys-
talline domains were assumed to be spherical, with diameters
distributed according to a log-normal distribution with the log-
normal mean (�) and standard deviation (�) as refinable
parameters.
The microstrain term can be expressed according to the
Krivoglaz–Wilkens theory of dislocation line broadening
(Krivoglaz, 1969; Wilkens, 1969, 1970), with the average
dislocation density � and the effective outer cut-off Re as
refinable parameters. Dislocations are expected in the primary
slip system of iron, {110}h111i (Burgers vector modulus jbj =
(a031/2)/2 with the unit-cell parameter a0), for which the
average contrast factor is known (D’Incau et al., 2007) for
research papers
510 P. Scardi et al. � Debye–Waller coefficient of deformed iron J. Appl. Cryst. (2017). 50, 508–518

edge- and screw-type dislocations, so that the fraction of edge-
type dislocations, fE , can also be refined. However, as pointed
out recently (Rebuffi et al., 2016), this model tends to over-
estimate the dislocation density, with 1.5–2 dislocations per
domain, well beyond the evidence of transmission electron
microscopy (TEM). In this specific sample, as is also probably
true of many ball-milled metals, the inhomogeneous strain
responsible for the anisotropic line broadening is only partly
research papers
J. Appl. Cryst. (2017). 50, 508–518 P. Scardi et al. � Debye–Waller coefficient of deformed iron 511
Figure 1X-ray diffraction patterns of ball-milled FeMo powder at (a) 100 K, (b) 200 K and (c) 300 K. Experimental data (circles) are shown together with themodelling (red lines) and their difference (residual, blue lines below each plot). WPPM details are shown in the left-hand insets on a log scale, whereasthe insets on the right show contributions from the capillary and f.c.c. minor fraction, and from the TDS.

caused by line defects in the crystalline domains, whereas a
large part of the effect is due to grain boundary regions, to
which dislocations migrate in the deformation process, and to
grain–grain interactions. It is therefore more appropriate to
express the strain broadening result in terms of a Warren plot
(Warren & Averbach, 1950), i.e. the r.m.s. displacement of
pairs of unit cells, h�L2i1=2½hkl� , for any given distance L in the
crystalline domain along the [hkl] scattering direction. This
provides a quantitative measurement but leaves open the
interpretation of the microstrain effect as resulting from one
or more sources (Rebuffi et al., 2016).
The main focus of this work is on the DW coefficient of the
ball-milled FeMo powder, so the role of MSD/B was consid-
ered in detail. The DW coefficient appears in the traditional
thermal factor depressing the Bragg intensity, which for a
monoatomic cubic phase reads (Warren, 1990; Guinier, 1963)
exp �q2Biso
8�2
� �¼ exp �
q2hu2i
3
� �¼ exp �q2hu2
s i� �
; ð3Þ
where hu2s i is the projection of hu2i along the [hkl] scattering
vector direction for the given diffraction peak. In addition to
this term, B also appears in the diffuse scattering component,
which can be included in WPPM following Warren’s theory
(Warren, 1990), as modified by Beyerlein et al. (2012) to
account for the phonon confinement effect enforced by the
finite (small) domain size. Including TDS in the WPPM is
important, as it gives more reliable B values as well as a more
accurate modelling of the line profiles, without increasing the
number of refined parameters.
Data modelling was done simultaneously on patterns
collected at different temperatures, sharing the same micro-
structural (size–strain) model, while independently refining
for each pattern the DW coefficient [Biso(T)] and the unit-cell
parameter [a0(T)]. WPPM also included a second phase, a
small fraction (�2%) of austenitic face-centred cubic (f.c.c.)
iron, undetected by previous studies. Besides a scaling factor,
only the unit-cell parameter of the austenitic phase was added
as a refinable parameter, all other microstructural and thermal
parameters being shared with the main b.c.c. phase so as to
limit the number of free parameters.
The XRPD patterns of the ball-milled FeMo sample are
displayed in Fig. 1 for the three studied temperatures [100, 200
and 300 K, respectively, in parts (a), (b) and (c)], together with
the WPPM results. The insets on the left-hand side highlight
details on a log scale, while the right-hand plots give a
comparison of the experimental data with the TDS and the
signal from the capillary, summed to the minor fraction of the
f.c.c. phase. Further details of the TDS and capillary contri-
butions are reported in the supporting information.
The results of WPPM are shown in Fig. 2(a) for the
temperature-dependent parameters Biso(T) and a0(T), while
the domain size distribution and Warren plot for three
significant directions ([h00], [hh0] and [hhh]) are shown in
Fig. 2(b). The mean domain size of 8.2 (2) nm is smaller than
the value given by Rebuffi et al. (2016) of 9.3 (8) nm, as the
present analysis includes the TDS, with the simultaneous
modelling of patterns collected at three different temperatures
with higher X-ray energy, and the austenitic phase. This minor
fraction of the f.c.c. phase was probably stabilized by nickel
contamination from the milling vial and could only be
detected for the high-quality counting statistics of the 11-BM
data. On the other hand, the r.m.s. displacement in the Warren
plot is nearly identical to the results of Rebuffi et al. (2016).
The Biso(T) values for the ball-milled sample are about 20%
higher than the reference values for bulk iron, which are
shown in Fig. 2(a) as a dashed line, together with the value for
pristine FeMo powder at ambient T: Biso(300 K) for pristine
FeMo powder is 0.358 (10) A2, whereas the literature value for
bulk Fe is 0.35 (1) A2 with �D = 431 (6) K (Butt et al., 1988),
against 0.417 (3) A2 for the ball-milled FeMo. It is worth
mentioning here that the 1.5 wt% Mo in the ball-milled
powder, equivalent to 0.88 at.% Mo, gives a negligible
contribution to the average DW factor [using the rule of
mixtures, Biso(300 K) = 0.349 A2 for the bulk FeMo phase], so
we refer to the pure iron data with no further specification in
the context of this work.
Both trends in Fig. 2(a), Biso(T) and a0(T), show the
expected nonlinearity towards the low-T limit, where quantum
effects, and zero-point energy in particular, become relevant.
Since the experimental evidence we could gather is limited to
three data points, the only modelling of Biso(T) that we can
research papers
512 P. Scardi et al. � Debye–Waller coefficient of deformed iron J. Appl. Cryst. (2017). 50, 508–518
Figure 2Temperature-dependent parameters from the modelling of Fig. 1. (a)Biso(T) (left-hand axis) and a0(T) (right-hand axis). The Biso(T) trendfrom the best fit to equation (4) (red line) is shown together with theliterature data for bulk Fe (Butt et al., 1988) (dashed line), whereas thea0(T) trend (blue line) is a parabolic function simply to guide the eye. (b)Domain diameter distribution (left-hand axis) and Warren plots (Warren,1990) (right-hand axis); see text for details.

credibly afford is with the Debye theory. In fact, MSD/B can
be modelled as (Warren, 1990; Willis & Pryor, 1975)
BðTÞ ¼BS þ B0 �Dð Þ þ BT �D;Tð Þ
¼BS þ6h2
mkB�D
1
4þ
6h2
mkB�D
T
�D
� �2 Z�D=T
0
�
expð�Þ � 1d�;
ð4Þ
where h is the Planck constant, kB the Boltzmann constant and
m the atomic mass, and with BS, the static component of the
DW coefficient, and �D as the parameters to be adjusted. The
best fit, shown in Fig. 2(a) as a solid line, gives BS = 0.02 and
�D = 420 K. It can be noted that the difference between the
bulk reference (dashed line) and the ball-milled sample (solid
line) tends to increase slightly towards higher (300 K)
temperature, which is a detail already mentioned in the cited
works based on LEED and Mossbauer spectroscopy. This is a
consequence of the surface softening effect, which determines
the lower Debye temperature with respect to the bulk refer-
ence.
Similar evidence is provided by EXAFS measurements
made on the same capillary with ball-milled FeMo powder
and, for comparison, on a pure Fe thin foil used as standard.
As shown in Fig. 3, the absorption was measured around the
Fe K edge at 7.11 keV. The same measurement confirms the
presence of Ni contamination from the mill (jar), which is
deemed responsible for the formation of a minor fraction of
austenitic phase.
EXAFS data were analysed considering the first coordina-
tion shell, using an Fe foil as standard material with known
structural parameters (Sevillano et al., 1979). According to the
ratio method (Schnohr & Ridgway, 2015), the amplitude of the
Fourier transform of the normalized EXAFS function (k)
(Fig. 3b) for the first shell of the ball-milled FeMo was divided
by the corresponding amplitude for the foil; the result is a
linear function of the square of the wavenumber vector
modulus (k), the slope of which gives the difference in DW
factors (see the supporting information for details).
The DW coefficients from EXAFS and XRPD have quite
different meanings (Sevillano et al., 1979; Fornasini, 2014;
Dalba & Fornasini, 1997), the main difference arising from the
different averages involved in the corresponding definitions.
While the EXAFS value of our study refers to the first co-
ordination shell (eight neighbours in ideal b.c.c. Fe), the
XRPD value is an average over the whole system, which
according to Debye’s model involves all 3N vibration modes in
a b.c.c. domain with N iron atoms.
The DW coefficient from EXAFS is the parallel mean-
square relative displacement (MSRD), h�u2jji, defined as the
variance of the distribution of distances between absorbing
and backscattering atoms (Calvin, 2013). For totally un-
correlated atomic displacements (Einstein oscillators), the
MSRD is equal to twice the MSD component projected along
the direction joining absorbing and backscattering atoms,
which is equivalent, to a good level of approximation, to hu2s i,
the DW coefficient provided by XRPD. In the general case
where atomic displacements are correlated, the MSRD can be
written as (Calvin, 2013; Fornasini, 2014)
h�u2jji ¼ MSRD ¼ 2h�u2
s i �DCF: ð5Þ
Here, the difference between twice the MSD and the MSRD
defines the displacement correlation function (DCF).
Experimentally determined 2h�u2s i, from Biso values and
equation (1), and the MSRD for the Fe first shell are shown in
Fig. 4 as a function of temperature. While the first-shell MSRD
is weakly affected by temperature, 2h�u2s i increases quite
steeply, the difference between the two quantities being
caused by the strong correlation of atomic displacements in
the first coordination shell.
As shown by Jeong et al. (2003), the atomic vibrations of
bulk iron can be described by a Born–von Karman (BvK)
force model (Born & Huang, 1954). By solving the dynamic
matrix using up to the fifth nearest-neighbour interatomic
force parameters, the DCF of the first shell is 42% of 2h�u2s i.
Then, according to equation (5), Butt’s value of hu2s i =
0.004408 A2 for reference bulk iron (Butt et al., 1988) corre-
sponds to a first-shell MRSD = 2 � 0.004408 � (1 � 0.42) =
0.00511 A2, in good agreement with the experimental EXAFS
results of Sevillano and co-workers (0.00506 A2; Sevillano et
al., 1979) and subsequent literature (Jimenez-Villacorta et al.,
2004).
research papers
J. Appl. Cryst. (2017). 50, 508–518 P. Scardi et al. � Debye–Waller coefficient of deformed iron 513
Figure 3(a) EXAFS measurements around the Fe K edge at 7110 eV, with detailof the additional edge due to the nickel contaminant. (b) The amplitudesignal of the back Fourier transform of k2(R) corresponding to the firstshell.

If the same argument is used for ball-milled FeMo, a similar
agreement is obtained between the first-shell MSRD values
from the BvK model and EXAFS experiments. In more detail,
the MSRD shows a 20% increment from the bulk reference
[Fig. 4, open square, 0.00504 (5) A2] to ball-milled FeMo
[filled square at 300 K, 0.00619 (1) A2], thus also confirming
the effect of the static disorder component according to
EXAFS, to the same extent shown by the XRPD results in
Fig. 2(a).
The XRPD and EXAFS results for the DW coefficient are
therefore in good agreement, pointing to a static disorder
component compatible with LEED and Mossbauer observa-
tions (Inagaki et al., 1983; Kuwano et al., 1992). Quite differ-
ently, the literature data for Biso appear overestimated (Zhao
et al., 2001; Azzaza et al., 2015), probably because of experi-
mental or modelling errors. XRD measurements of Biso
require a strict control of all factors – primarily absorption –
affecting the diffracted intensity; moreover, as pointed out by
Vetelino et al. (1972), accounting for the TDS in XRPD data
modelling is important, and failing to do so could be a further
reason for the quite high Biso values reported in the literature
(Lu & Zhao, 1999; Zhao et al., 2001; Azzaza et al., 2015;
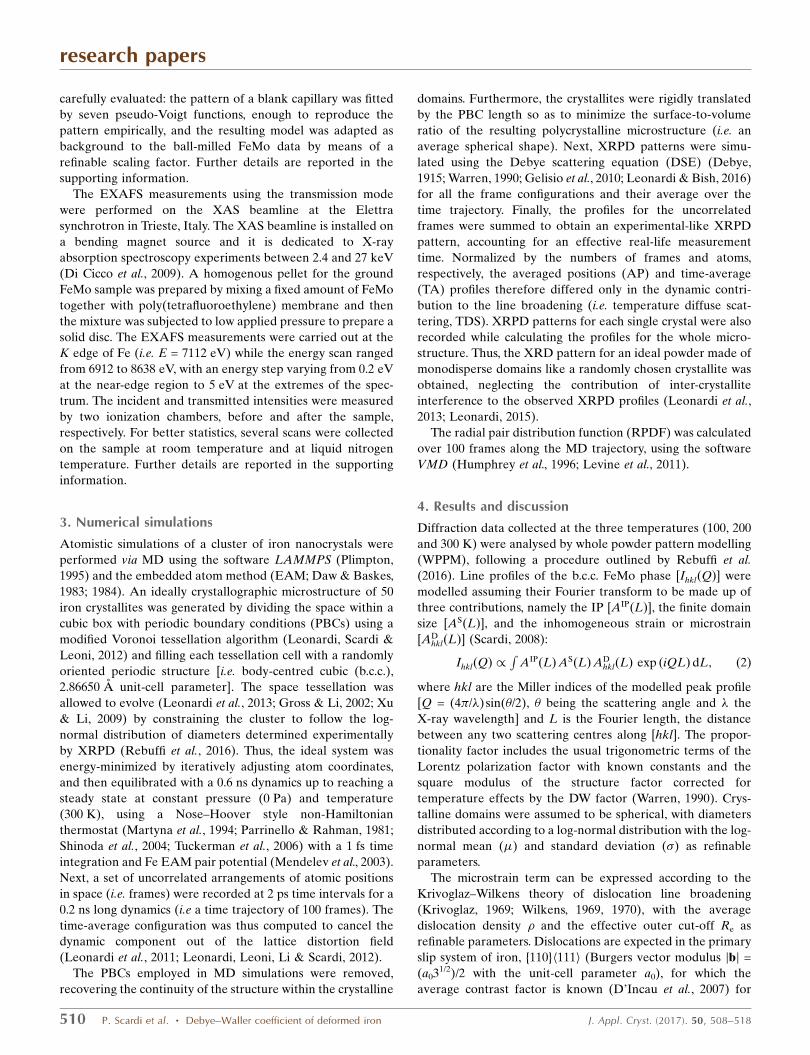
Sirdeshmukh et al., 1993; Purushotham & Krishna, 2010).
To add a further point of view and interpretation of the
experimental results, and to assess the origin of the observed
increase in the DW coefficient, a system similar to the ball-
milled FeMo was simulated by MD. As explained in x3, a
cluster of 50 grains was generated by a modified Voronoi
tessellation procedure (Leonardi et al., 2013). Atomistic
models of iron grains are polyhedra with the same volume as
the spherical grains of the distribution of Fig. 2(b) refined by
WPPM. Grain number 5, highlighted in red in Fig. 5, is an
average-sized crystalline domain with 66 874 Fe atoms. The
50-grain cluster in Fig. 5 is shown with the detail of each grain,
but in the actual MD simulations PBCs were enforced, so that
each grain, and grain number 5 in particular, experienced an
environment similar to that of the real material.
To assess the effect of the microstructure on Biso/MSD, we
followed a procedure similar to that of Rebuffi et al. (2016).
The XRPD patterns of an ideal powder made up of crystalline
domains like those observed in high-resolution TEM images
for the ball-milled FeMo powder sample were simulated and
investigated. The simulated patterns were treated as ‘experi-
mental’ patterns and analysed by the same WPPM used for the
experimental data of the ball-milled FeMo powder. In this
case, however, the crystalline domain is known, so the domain
size effect can be modelled to perfection using the common
volume function (CVF) for the specific polyhedral shape of
the grain (Leonardi, Leoni, Siboni & Scardi, 2012). As an
example, Fig. 6(a) shows the ‘experimental’ pattern and
WPPM when only the size effect is present, i.e. for an isolated
(geometric) model of grain number 5, with atomic positions
matching a perfect b.c.c. lattice (no MD potential used yet).
The match between data and modelling is nearly perfect,
showing that the domain size/shape effect is correctly treated
by WPPM using the CVF of the studied grain. Fig. 6(b) shows
the modelling result after energy minimization and equili-
bration of the system free of line defects, e.g. after 0.6 ns of
MD trajectory, a time sufficient to drive the 50-grain cluster
into a steady state under the EAM potential at 300 K. The TA
powder pattern, obtained from the atomic coordinates of the
same grain sampled at several time steps along the MD time
trajectory, includes static and dynamic disorder, the former
being caused by the grain boundary and grain–grain inter-
actions, while the latter is the effect of temperature. Using
again the same modelling as for the experimental ball-milled
FeMo powder, the refined DW coefficient is Biso = 0.4513 A2.
This is slightly higher than the experimental value of Fig. 2(a)
and the discrepancy can be ascribed both to the model and to
the EAM potential, which is not specifically designed and
optimized for the thermal properties of iron (Mendelev, 2016).
However, the interesting point is that, when the procedure is
research papers
514 P. Scardi et al. � Debye–Waller coefficient of deformed iron J. Appl. Cryst. (2017). 50, 508–518
Figure 5MD model of the studied system, made up of 50 grains of Fe with a sizedistribution mapped on the experimental result of WPPM shown inFig. 2(b). On the right-hand side are shown detailed images of grainnumber 5, an average-size crystallite with 66 874 Fe atoms (top), and thesame grain with an edge dislocation (bottom). See text for details.
Figure 4MSRD of the first Fe coordination shell from EXAFS measurements at77 and 298 K (Figs. 2 and 3) (squares). The values of 2hu2
s i (circles) areobtained from the XRPD values of Biso in Fig. 2(a) using equation (1).Filled symbols denote data for ball-milled FeMo, while open symbolsdenote data for the pure iron foil (EXAFS, square) and the literaturevalue for bulk iron (circle) (Butt et al., 1988).

repeated on the AP powder pattern, simulated using average
atomic coordinates (i.e. by averaging coordinates of the same
grain sampled at different instants along the MD trajectory) so
as to average out all dynamic effects, Biso falls to 0.082 A2. This
refined value can be taken as an estimate of the static disorder
component of B/MSD, due to the effect of grain boundary and
grain–grain interactions in the 50-grain cluster. Biso for the
dynamic disorder can be estimated as 0.4513 � 0.082 =
0.369 A2, not far from the experimental value for bulk iron
(0.35; Butt et al., 1988). Therefore, Biso from the AP powder
pattern is about 20% of Biso for dynamic disorder only, in good
agreement with the experimentally observed increment of Biso
and MSRD of ball-milled FeMo with respect to reference bulk
Fe.
MD simulations also provide a direct measurement of the
MSRD, given by the variance of the distributions centred
about each shell in the RPDF of grain number 5.
As shown in Fig. 7, despite the anharmonicity of the EAM
potential, symmetrical Gaussians give an acceptably good fit.
As expected, the atomic vibrations of first neighbours are
strongly correlated, with the asymptotic value (horizontal line,
provided by the refined value of Biso = 8�2hu2s i = 0.4513 A2) far
from being approached by the MSRD of the nearest-
research papers
J. Appl. Cryst. (2017). 50, 508–518 P. Scardi et al. � Debye–Waller coefficient of deformed iron 515
Figure 7Left axis: the RPDF from MD simulation of grain number 5 (yellowcircles) and a fit with Gaussian distributions (red line) centred about theshell radii of neighbouring atoms at increasing distance (first 20neighbours); the difference (residual) is shown by the blue line below.Right axis: the corresponding MSRD values, given by the variance of theGaussian distributions (turquoise hexagons), and the asymptotic value,from the refined value of the DW coefficient, Biso = 8�2hu2
s i = 0.4513 A2
(green horizontal line).
Figure 6XRPD patterns generated by the Debye scattering equation using atomic coordinates of MD simulations (red circles) with the corresponding WPPMresult (blue lines) and their difference (residual, blue lines below each plot) for (a) the geometric (ideal perfect crystal) model of grain number 5, withdetails in the inset, (b) the same grain after energy minimization and MD trajectory, (c) the same grain as in part (b) but with an edge dislocation across it,and (d) the same as part (c) with a vacancy concentration cv = 10�3.

neighbour shells. This trend is in good agreement with that
reported by Jeong et al. (2003), with a first-shell DCF about
5% larger than reported by those authors. The discrepancy can
be attributed to the different models (MD with EAM poten-
tial versus the BvK model up to the fifth nearest neighbour)
and also to the finite dimensions of grain number 5, as
opposed to the perfect bulk Fe of Jeong et al. (2003).
These simulation results add credence to the interpretation
that the observed increase in Biso is due to grain boundary
under-coordination, as also indicated by LEED and Moss-
bauer experiments (Inagaki et al., 1983; Clark et al., 1965; Van
Hove et al., 1986; Von Eynatten & Bommel, 1977; Kuwano et
al., 1992) and other studies on plastically deformed materials
(Valiev et al., 2000). The MD approach described above is also
useful for assessing the effect of lattice defects of lower
dimensionality. Once the grain boundary effect is known, we
can repeat the procedure with an edge dislocation created and
stabilized by MD inside the same grain (Fig. 5c). The powder
pattern was simulated according to the procedure explained
above, to produce ‘experimental’ data now including thermal
effects, grain boundary and grain–grain interactions, and the
effect of an edge dislocation in the primary slip system of iron.
The WPPM result, shown in Fig. 6(c), gives a Biso increment of
just 2% for the presence of the dislocation.
The same procedure and refinement were then carried out
including vacancies in the cluster. With a vacancy formation
enthalpy �Hv = 1.41 eV for iron (Kim & Buyers, 1978), the
thermodynamically stable fraction at 300 K would be totally
negligible. Even at melting point (1808 K), the vacancy
concentration is just cv = 1.2 � 10�4, which corresponds to
only a few vacant sites in grain number 5. In order to give an
upper bound to the possible effect of vacancies on Biso,
simulations were done overestimating the concentration,
considering extrinsic contributions like the generation of
excess vacancies by the dislocation dynamics during plastic
deformation. A concentration cv = 10�3 was used, corre-
sponding to 75 vacant sites over the 66 874 atoms of grain
number 5. The result of the modelling of the powder pattern
including thermal effects, grain boundary and grain–grain
interactions, and the effect of the overestimated vacancy
fraction, are shown in Fig. 6(d). Vacancy effects on the
modelling were just minor, with no measurable increase in Biso
(<1%) with respect to the same powder pattern with no
vacancies at all.
These results clearly point out the dominant effect of
coordination on the value of the DW coefficient. In fact, the
experimentally observed increase in Biso from reference bulk
Fe to ball-milled FeMo matches quite well the static disorder
component that MD proved to be caused by a surface effect,
where 5642/66 874 atoms are involved in the surface (under-
coordinated Fe atoms on the surface of grain number 5).
When a full dislocation line is included in grain number 5, that
amounts to removing 999/66 874 atoms, with a much lower
under-coordination effect than a grain boundary, increasing
Biso by just 2%. Finally, when randomly removing atoms to
create point defects, even well above the equilibrium
concentration (75/66 874 atoms), the effects on Biso refined by
WPPM are below the sensitivity of the technique.
Therefore, there appears to be a hierarchy in the effect of
lattice defects on Biso, mostly determined by the different and
increasing number of under-coordinated atoms, following the
sequence point–line–surface defects. As shown in this work,
and in agreement with earlier research based on surface-
sensitive techniques like LEED and Mossbauer, the experi-
mentally observed increase in Biso/MSD in nanocrystals and
plastically deformed nanocrystalline aggregates should not be
directly related to a generic ‘microstrain’ effect. The correla-
tion between Biso and increased microstrain, frequently
proposed in the literature, appears to be just coincidental, as
the microstrain frequently increases in inverse proportion to
the domain size. The domain size and extension of the grain
boundary (or free surface) are indeed the real quantities
determining the static disorder for the under-coordination
effect of grain boundary or surface atoms.
As a further test to assess the contribution of the grain
boundary to static disorder and the increased DW coefficient,
research papers
516 P. Scardi et al. � Debye–Waller coefficient of deformed iron J. Appl. Cryst. (2017). 50, 508–518
Figure 8Biso values from WPPM of powder patterns generated by the DSE usingMD atomic coordinates for grain number 5 after removal of an increasingnumber of surface layers (from zero to three layers). (a) The results areshown for TA patterns (left axis) and AP patterns (right axis), with quitesimilar trends. The dashed line shows the reference value of Biso for bulkiron (Butt et al., 1988). (b) DSE simulated patterns for grain number 5and after progressive shell removal.

the powder pattern and WPPM analysis of Fig. 6(b) were
repeated after removing one, two or three layers of atoms
from the surface of grain number 5. As shown in Fig. 8, Biso
decreases quickly with removal of the surface layer, tending to
the asymptotic value for bulk Fe. The same decreasing trend is
obtained both with TA patterns (which include static and
dynamic disorder) and with AP patterns (where the dynamic
effect is averaged out). The layer removal procedure has a
peculiar effect on the powder pattern. If the patterns are
plotted on a log scale to highlight the low-counts region, it is
quite evident that removing atomic shells from the grain
boundary region inwards drastically reduces the TDS; in
addition to a slower decay of the Bragg scattering intensity
with Q, the patterns show a lower diffuse background when
atom layers are removed from the surface. This detail further
confirms the importance of a proper evaluation of the TDS if
reliable values of the DW coefficient are of interest.
5. Concluding remarks
Synchrotron radiation XRPD and EXAFS patterns from an
extensively ball-milled FeMo powder were collected at
different temperatures. Measurements and data analysis were
carried out paying special attention to all effects influencing
the scattered intensity as possible sources of error in the
determination of the DW coefficients. The main points of
interest are as follows:
(i) Despite the intrinsic differences between the DW co-
efficients from XRPD and EXAFS, both show an increase of
�20% between bulk reference iron and ball-milled FeMo
powder; this increment is compatible with experimental
observations made by LEED and Mossbauer spectroscopy,
which are more sensitive to the surface layers than XRPD and
EXAFS and which provide information based on the average
over the studied volume of crystalline domains.
(ii) The Biso/MSD values in our study are markedly lower
than those reported in many literature studies based on
XRPD; according to the evidence shown by this work, the
literature values of Biso for nanocrystalline iron appear to be
overestimated, either owing to experimental error (e.g.
because of unaccounted absorption effects) or owing to a lack
of consideration of the temperature diffuse scattering.
(iii) The present results, in agreement with the conclusions
of LEED and Mossbauer studies, support an interpretation
according to which the increased Biso/MSD in ball-milled
nanocrystalline FeMo is mostly caused by the under-
coordination of atoms in the grain boundary region. This
result is confirmed by atomistic modelling of the studied
system. A cluster of plastically deformed nanocrystalline
domains of mean size around 8–9 nm was treated by MD using
the embedded atom model; the analysis of powder diffraction
patterns simulated by the Debye scattering equation using
atomic coordinates from MD trajectories demonstrates the
main role of surface effects in determining the static disorder
contributions to Biso/MSD.
6. Related literature
For additional literature relating to the supporting informa-
tion, see Schoonjans et al. (2011) and Caglioti et al. (1958).
Acknowledgements
The authors wish to thank L. Gelisio and A. Amimi for useful
discussions and collaboration in the early stage of the work,
and M. D’Incau for technical assistance. AL was supported by
the Haydn Murray Applied Clay Mineralogy Endowment,
Indiana University. Supercomputer time for this research was
partly provided by the Lilly Endowment Inc., through its
support for the Indiana University Pervasive Technology
Institute, and in part by the Indiana META Cyt Initiative at
Indiana University, which is also supported by the Lilly
Endowment Inc. Use of the Advanced Photon Source at
Argonne National Laboratory was supported by the US
Department of Energy, Office of Science, Office of Basic
Energy Sciences, under contract No. DE-AC02-06CH11357.
We thank the MCX beamline staff at Elettra-Sincrotrone
Trieste for letting us use a significant amount of the in-house
research beamtime and technically supporting us.
References
Allen, R. E. & De Wette, F. W. (1969). Phys. Rev. 188, 1320–1323.Azzaza, S., Alleg, S. & Sunol, J.-J. (2015). J. Therm. Anal. Calorim.
119, 1037–1046.Bai, H. Y., Luo, J. L., Jin, D. & Sun, J. R. (1996). J. Appl. Phys. 79,
361–364.Beyerlein, K. R., Leoni, M. & Scardi, P. (2012). Acta Cryst. A68, 382–
392.Born, M. & Huang, K. (1954). Dynamical Theory of Crystal Lattices.
Oxford University Press.Broseghini, M., D’Incau, M., Gelisio, L., Pugno, N. M. & Scardi, P.
(2016). Mater. Des. 110, 365–374.Butt, N. M., Bashir, J., Willis, B. T. M. & Heger, G. (1988). Acta Cryst.
A44, 396–399.Caglioti, G., Paoletti, A. & Ricci, F. P. (1958). Nucl. Instrum. Methods,
3, 223–228Calvin, S. (2013). EXAFS for Everyone. Boca Raton: CRC Press.Cicco, A. D., Aquilanti, G., Minicucci, M., Principi, E., Novello, N.,
Cognigni, A. & Olivi, L. (2009). J. Phys. Conf. Ser. 190, 012043.Clark, B. C., Herman, R. & Wallis, R. F. (1965). Phys. Rev. 139, A860–
A867.Cline, J. P., Deslattes, R. D., Staudenmann, J.-L., Kessler, E. G.,
Hudson, L. T., Henins, A. & Cheary, R. W. (2000). Certificates SRM640c and SRM 660a. NIST, Gaithersburg, Maryland, USA.
Dalba, G. & Fornasini, P. (1997). J. Synchrotron Rad. 4, 243–255.Daw, M. S. & Baskes, M. I. (1983). Phys. Rev. Lett. 50, 1285–1288.Daw, M. S. & Baskes, M. I. (1984). Phys. Rev. B, 29, 6443–6453.Debye, P. J. W. (1915). Ann. Phys. 351, 809–823.D’Incau, M., Leoni, M. & Scardi, P. (2007). J. Mater. Res. 22, 1744–
1753.Eynatten, G. von & Bommel, H. E. (1977). Appl. Phys. 14, 415–421.Fornasini, P. (2014). Synchrotron Radiation: Introduction to X-ray
Absorption Spectroscopy, edited by S. Mobilio, F. Boscherini & C.Meneghini, ch. 6. Heidelberg: Springer.
Gelisio, L., Azanza Ricardo, C. L., Leoni, M. & Scardi, P. (2010). J.Appl. Cryst. 43, 647–653.
Gelisio, L., Beyerlein, K. R. & Scardi, P. (2013). Thin Solid Films, 530,35–39.
Gross, D. & Li, M. (2002). Appl. Phys. Lett. 80, 746–748.
research papers
J. Appl. Cryst. (2017). 50, 508–518 P. Scardi et al. � Debye–Waller coefficient of deformed iron 517

Guinier, A. (1963). Crystals, Imperfect Crystals, and AmorphousBodies: X-ray Diffraction. San Francisco: W. H. Freeman andCompany.
Humphrey, W., Dalke, A. & Schulten, K. (1996). J. Mol. Graph. 14,33–38.
Inagaki, M., Sasaki, Y. & Sakai, M. (1983). J. Mater. Sci. 18, 1803–1809.
Jeong, I.-K., Heffner, R. H., Graf, M. J. & Billinge, S. J. L. (2003).Phys. Rev. B, 67, 104301–104309.
Jimenez-Villacorta, F., Munoz-Martın, A. & Prieto, C. (2004). J. Appl.Phys. 96, 6224–6229.
Kim, S. M. & Buyers, W. J. L. (1978). J. Phys. F Met. Phys. 8, L103–L108.
Krivoglaz, M. (1969). Theory of X-ray and Thermal-NeutronScattering by Real Crystals. New York: Plenum Press.
Kuhs, W. F. (2006). International Tables for Crystallography, Vol. D,Physical Properties of Crystals, 1st online ed., edited by A. Authier,ch. 1.9, pp. 228–242. Chester: International Union of Crystal-lography.
Kuwano, H., Ouyang, H. & Fultz, B. (1992). Mater. Sci. Forum, 88–90,561–568.
Leonardi, A., Beyerlein, K., Xu, T., Li, M. & Scardi, P. (2011). Z.Kristallogr. Proc. 1, 37–42.
Leonardi, A. & Bish, D. L. (2016). J. Appl. Cryst. 49, 1593–1608.Leonardi, A., Leoni, M., Li, M. & Scardi, P. (2012). J. Nanosci.
Nanotechnol. 12, 8546–8553.Leonardi, A., Leoni, M. & Scardi, P. (2013). Comput. Mater. Sci. 67,
238–242.Leonardi, A., Leoni, M., Siboni, S. & Scardi, P. (2012). J. Appl. Cryst.
45, 1162–1172.Leonardi, A., Ryu, S., Pugno, S. N. & Scardi, P. (2015). J. Appl. Phys.
117, 164304.Leonardi, A., Scardi, P. & Leoni, M. (2012). Philos. Mag. 92, 986–
1005.Levine, B. G., Stone, J. E. & Kohlmeyer, A. (2011). J. Comput. Phys.
230, 3556–3569.Londsdale, K. (1968). International Tables for X-ray Crystallography,
Vol. III, Physical and Chemical Tables, 2nd ed., edited by C. H.MacGillavry & G. D. Rieck, pp. 243–244. Birmingham: KynochPress.
Lu, K. & Zhao, Y. H. (1999). Nanostruct. Mater. 12, 559–562.Martyna, G. J., Tobias, D. J. & Klein, M. L. (1994). J. Chem. Phys. 101,
4177–4189.Maslen, E. N. (2006). International Tables for Crystallography, Vol. C,
Mathematical, Physical and Chemical Tables, 1st online ed., editedby E. Prince, ch. 6.3, pp. 599–608. Chester: International Union ofCrystallography.
Mendelev, M. I. (2016). Personal communication.Mendelev, M. I., Han, S., Srolovitz, D. J., Ackland, G. J., Sun, D. Y. &
Asta, M. (2003). Philos. Mag. 83, 3977–3994.Michailov, M. & Avramov, I. (2012). J. Phys. Conf. Ser. 398, 012008.Parrinello, M. & Rahman, A. (1981). J. Appl. Phys. 52, 7182–7190.Plimpton, S. (1995). J. Comput. Phys. 117, 1–19.Purushotham, E. & Gopi Krishna, N. (2010). Indian J. Phys. 84, 887–
893.Rebuffi, L., Troian, A., Ciancio, R., Carlino, E., Amimi, A., Leonardi,
A. & Scardi, P. (2016). Sci. Rep. 6, 20712.Scardi, P. (2008). Powder Diffraction: Theory and Practice, edited by
R. E. Dinnebier & S. J. L. Billinge, ch. 13, pp. 376–413. Cambridge:Royal Society of Chemistry.
Schnohr, C. S. & Ridgway, M. C. (2015). Editors. X-ray AbsorptionSpectroscopy of Semiconductors, ch. 1. Berlin, Heidelberg:Springer-Verlag.
Schoonjans, T., Brunetti, A., Golosio, B., Sanchez del Rıo, M., Sole,V. A., Ferrero, C. & Vincze, L. (2011). Spectrochim. Acta Part B, 66,776–784.
Sevillano, E., Meuth, H. & Rehr, J. J. (1979). Phys. Rev. B, 20, 4908–4911.
Shinoda, W., Shiga, M. & Mikami, M. (2004). Phys. Rev. B, 69, 134103.Sirdeshmukh, D. B., Subhadra, G., Hussain, K. A., Krishna, N. G. &
Rao, B. R. (1993). Cryst. Res. Technol. 28, 15–18.Tuckerman, M. E., Alejandre, J., Lopez-Rendon, R., Jochim, A. L. &
Martyna, G. J. (2006). J. Phys. A, 39, 5629–5651.Valiev, R. Z. R. K., Islamgaliev, I. V. & Alexandrov, I. V. (2000). Prog.
Mater. Sci. 45, 103–189.Van Hove, M. A., Weinberg, W. H. & Chan, C.-M. (1986). Low-
Energy Electron Diffraction: Experiment, Theory and SurfaceStructure Determination, Springer Series in Surface Sciences, Vol. 6,p. 45. Berlin, Heidelberg: Springer-Verlag.
Vetelino, J. F., Gaur, S. P. & Mitra, S. S. (1972). Phys. Rev. B, 5, 2360–2366.
Warren, B. E. (1990). X-ray Diffraction. New York: Dover.Warren, B. E. & Averbach, B. L. (1950). J. Appl. Phys. 21, 595–
599.Wilkens, M. (1969). Fundamental Aspects of Dislocation Theory,
pp. 1195–1221. Washington, DC: US Government Printing Office.Wilkens, M. (1970). Phys. Status Solidi A, 2, 359–370.Willis, B. T. M. & Pryor, A. W. (1975). Thermal Vibrations in
Crystallography. Cambridge University Press.Xu, T. & Li, M. (2009). Philos. Mag. 89, 349–374.Yang, C. C., Xiao, M. X., Li, W. & Jiang, Q. (2006). Solid State
Commun. 139, 148–152.Zhao, Y. H., Sheng, H. W. & Lu, K. (2001). Acta Mater. 49, 365–
375.
research papers
518 P. Scardi et al. � Debye–Waller coefficient of deformed iron J. Appl. Cryst. (2017). 50, 508–518