research open access three-dimensional assessment … · the ideal occlusion of untreated patients...
TRANSCRIPT

Lombardo et al. Progress in Orthodontics (2015) 16:11 DOI 10.1186/s40510-015-0086-9
RESEARCH Open Access
Three-dimensional assessment of teethfirst-, second- and third-order position inCaucasian and African subjects with ideal occlusionLuca Lombardo*, Alessandro Perri, Angela Arreghini, Michele Latini and Giuseppe Siciliani
Abstract
Background: The aim of this study was to provide an updated version of Andrews’ seminal study by exploiting 3Dsoftware to analyse the tip, torque and in-out values of two groups of different racial and ethnic background.
Methods: The analysis was conducted on one Caucasian group (30 individuals) and one of African origin (29). Allsubjects were adult, in normal occlusion and had no previous history of orthodontic treatment. Rhinoceros™ 3Dmodelling software was used to identify anatomical reference points, planes and axes and to make the appropriatemeasurements.
Results: Compared to Andrews’ measurements, we found more positive coronal tip values in both African andCaucasian subjects, while the torque values we measured tended to be less negative in the posterior sectors thanthose reported by Andrews. We measured greater tip values in the lower jaw of Caucasian with respect to Africansubjects, particularly in the middle sectors.
Conclusions: Race and ethnicity have a strong influence on values of tip, torque and in-out. This is translated as amore positive tip in Caucasian subjects and a more positive torque in those of African descent (greater proclinationof the incisors). Finally, with respect to the values reported by Andrews, we found a tendency to more positive meantip (except for at the upper second molars and lower incisors) and less negative torque in the posterior sectors.
Keywords: Tip; Torque; In-out; Straight-wire prescription; Andrews
BackgroundAndrews was the first to put forward the hypothesis thatthe ideal occlusion of untreated patients could serve asthe target of orthodontic treatment [1]. However, despiteAndrews’ undeniable influence on orthodontics as weknow it today, several authors [1–6] have identifiedsources of bias in this seminal study, in both the methodAndrews adopted for making his measurements—ascribableto the instruments he used—and the sample he selected—North American subjects of Caucasian origin. Nevertheless,only Sebata [2], Watanabe [3], Currim [4] and Doodamani[5] have since replicated Andrews’ study using differentsamples (Japanese in the first two, Indians in the lattertwo) and a modified method. As could be expectedfrom the different approaches used and samples
* Correspondence: [email protected] of Orthodontics, University of Ferrara, Via montebello, 31, Ferrara44100, Italy
© 2015 Lombardo et al.; licensee Springer. ThisAttribution License (http://creativecommons.orin any medium, provided the original work is p
considered in these investigations, all four producedresults that were significantly different from those ofAndrews.In spite of the many advances in orthodontics since
Andrews’ proposed his pre-programmed appliance, themajority of devices on the market still feature prescrip-tions based on his measurements. This means that, gen-erally speaking, not enough attention is paid to theposition of the roots. In reality, there is a strong correl-ation between the tip and torque and the tooth root pos-ition, as there are variations in coronal morphology,incongruencies between the inclination of the roots andthe crown, and a disproportion between the height of thecrown and the length of the root of the same tooth [7].That being said, measurement of the angulation and in-
clination of the roots relies on 3D imaging, which has onlybeen available in recent years following the developmentof such diagnostic tool technology. In this regard, the
is an Open Access article distributed under the terms of the Creative Commonsg/licenses/by/4.0), which permits unrestricted use, distribution, and reproductionroperly credited.
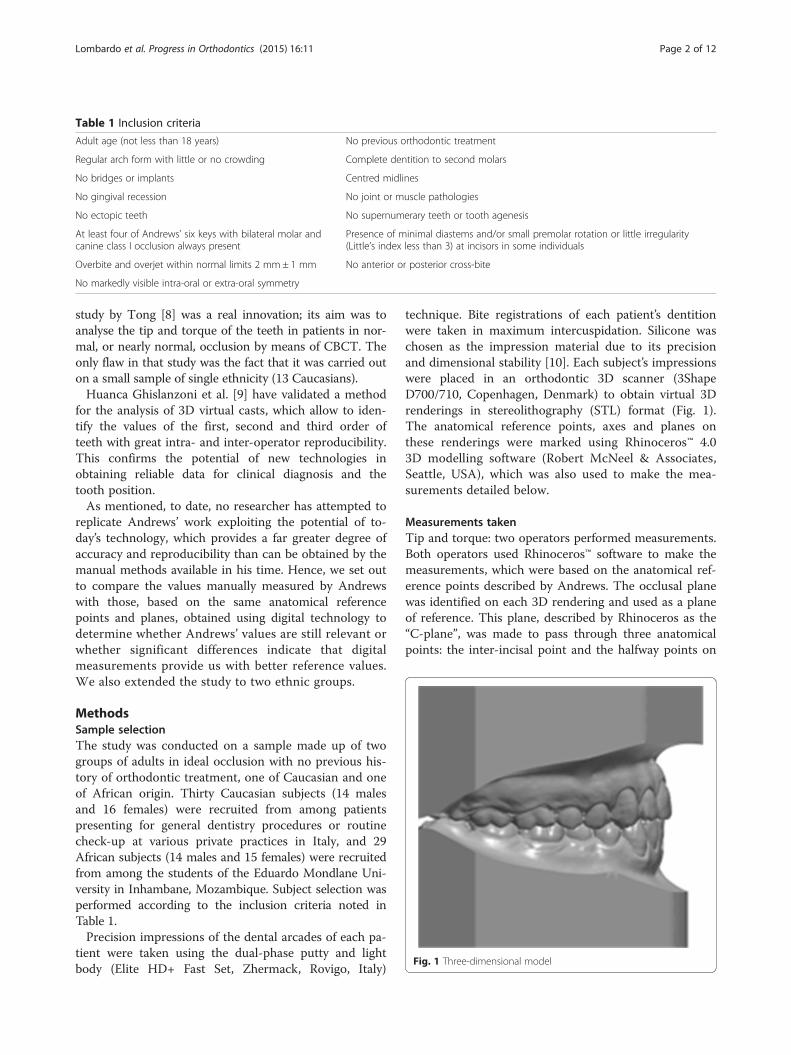
Table 1 Inclusion criteria
Adult age (not less than 18 years) No previous orthodontic treatment
Regular arch form with little or no crowding Complete dentition to second molars
No bridges or implants Centred midlines
No gingival recession No joint or muscle pathologies
No ectopic teeth No supernumerary teeth or tooth agenesis
At least four of Andrews’ six keys with bilateral molar andcanine class I occlusion always present
Presence of minimal diastems and/or small premolar rotation or little irregularity(Little’s index less than 3) at incisors in some individuals
Overbite and overjet within normal limits 2 mm ± 1 mm No anterior or posterior cross-bite
No markedly visible intra-oral or extra-oral symmetry
Fig. 1 Three-dimensional model
Lombardo et al. Progress in Orthodontics (2015) 16:11 Page 2 of 12
study by Tong [8] was a real innovation; its aim was toanalyse the tip and torque of the teeth in patients in nor-mal, or nearly normal, occlusion by means of CBCT. Theonly flaw in that study was the fact that it was carried outon a small sample of single ethnicity (13 Caucasians).Huanca Ghislanzoni et al. [9] have validated a method
for the analysis of 3D virtual casts, which allow to iden-tify the values of the first, second and third order ofteeth with great intra- and inter-operator reproducibility.This confirms the potential of new technologies inobtaining reliable data for clinical diagnosis and thetooth position.As mentioned, to date, no researcher has attempted to
replicate Andrews’ work exploiting the potential of to-day’s technology, which provides a far greater degree ofaccuracy and reproducibility than can be obtained by themanual methods available in his time. Hence, we set outto compare the values manually measured by Andrewswith those, based on the same anatomical referencepoints and planes, obtained using digital technology todetermine whether Andrews’ values are still relevant orwhether significant differences indicate that digitalmeasurements provide us with better reference values.We also extended the study to two ethnic groups.
MethodsSample selectionThe study was conducted on a sample made up of twogroups of adults in ideal occlusion with no previous his-tory of orthodontic treatment, one of Caucasian and oneof African origin. Thirty Caucasian subjects (14 malesand 16 females) were recruited from among patientspresenting for general dentistry procedures or routinecheck-up at various private practices in Italy, and 29African subjects (14 males and 15 females) were recruitedfrom among the students of the Eduardo Mondlane Uni-versity in Inhambane, Mozambique. Subject selection wasperformed according to the inclusion criteria noted inTable 1.Precision impressions of the dental arcades of each pa-
tient were taken using the dual-phase putty and lightbody (Elite HD+ Fast Set, Zhermack, Rovigo, Italy)
technique. Bite registrations of each patient’s dentitionwere taken in maximum intercuspidation. Silicone waschosen as the impression material due to its precisionand dimensional stability [10]. Each subject’s impressionswere placed in an orthodontic 3D scanner (3ShapeD700/710, Copenhagen, Denmark) to obtain virtual 3Drenderings in stereolithography (STL) format (Fig. 1).The anatomical reference points, axes and planes onthese renderings were marked using Rhinoceros™ 4.03D modelling software (Robert McNeel & Associates,Seattle, USA), which was also used to make the mea-surements detailed below.
Measurements takenTip and torque: two operators performed measurements.Both operators used Rhinoceros™ software to make themeasurements, which were based on the anatomical ref-erence points described by Andrews. The occlusal planewas identified on each 3D rendering and used as a planeof reference. This plane, described by Rhinoceros as the“C-plane”, was made to pass through three anatomicalpoints: the inter-incisal point and the halfway points on

Fig. 3 Creation of virtual spheres around FA points
Fig. 2 Measuring the FACC
Lombardo et al. Progress in Orthodontics (2015) 16:11 Page 3 of 12

Fig. 4 Calculating the upper central incisor tip
Fig. 5 Calculating the upper central incisor torque
Lombardo et al. Progress in Orthodontics (2015) 16:11 Page 4 of 12

Fig. 6 Determining contact points
Fig. 7 Calculating the in-out
Lombardo et al. Progress in Orthodontics (2015) 16:11 Page 5 of 12

Table 2 Comparison of tip values measured for the two groups
Africans—tip Caucasians—tip Comparison
n Mean Standard deviation n Mean Standard deviation t test p level
TIP U7 58 −3.06 6.78 60 −3.88 10.60 0.51 ns
TIP U6 58 9.48 3.53 60 10.26 5.54 −0.98 ns
TIP U5 58 5.96 5.84 60 9.64 4.16 −3.93 <0.001
TIP U4 58 3.29 4.45 60 7.67 4.28 −5.45 <0.001
TIP U3 58 8.23 5.20 60 9.96 4.81 −1.87 ns
TIP U2 58 9.23 3.87 60 9.99 3.69 −1.10 ns
TIP U1 58 3.68 3.55 60 4.53 2.84 −1.44 ns
TIP L7 58 12.65 5.83 60 14.20 6.47 −1.37 ns
TIP L6 58 6.30 5.36 60 10.99 2.78 −5.95 <0.001
TIP L5 58 3.60 4.02 60 6.90 3.09 −4.99 <0.001
TIP L4 58 2.95 3.89 60 6.06 3.36 −4.63 <0.001
TIP L3 58 3.478 4.850 60 5.91 3.98 −2.98 0.004
TIP L2 58 −0.26 3.01 60 0.14 4.46 −0.57 ns
TIP L1 58 −1.13 3.30 60 0.00 4.46 −1.57 ns
ns not significant.
Lombardo et al. Progress in Orthodontics (2015) 16:11 Page 6 of 12
the distal marginal crest of each second molar. Afterthe occlusal plane was aligned visually, the line perpen-dicular to it was traced. The facial axis of each toothcrown (FACC) was marked using the “section” tool, inall cases making sure that the C-plane was aligned cor-rectly. To make the facial axis (FA) point visible, thiswas placed in the centre of a virtual 1-mm spherewhose centre lay on the previously traced axis (Figs. 2and 3). Once these anatomical reference points hadbeen marked on the renderings, the tip and torque of
Table 3 Comparison of torque values measured for the two grou
Africans—torque Ca
n Mean Standard deviation n
TORQUE U7 58 −12.79 10.11 60
TORQUE U6 58 −10.98 9.75 60
TORQUE U5 58 −4.00 8.43 60
TORQUE U4 58 −4.49 8.38 60
TORQUE U3 58 −2.03 7.95 60
TORQUE U2 58 7.41 8.14 60
TORQUE U1 58 11.41 6.28 60
TORQUE L7 58 −32.51 10.93 60
TORQUE L6 58 −23.50 9.57 60
TORQUE L5 58 −11.39 8.52 60
TORQUE L4 58 −9.23 7.02 60
TORQUE L3 58 −1.95 7.49 60
TORQUE L2 58 5.50 8.26 60
TORQUE L1 58 9.68 9.18 60
ns not significant.
each tooth were measured. The tip was taken as theangle between the FACC and the line perpendicular tothe occlusal plane, using the “Evaluate/angle” function(Fig. 4). To calculate the torque, a tangent line wasdrawn perpendicular to the surface of each tooth, pass-ing through the FA point (i.e. the centre of the virtualsphere) on a mesiodistal view of each tooth (thereforepositioned at 90° with respect to the FACC), the anglebetween this line and the occlusal reference plane wascalculated (Fig. 5).
ps
ucasians—torque Comparison
Mean Standard deviation t test p level
−5.50 12.23 −3.54 <0.001
−6.26 10.24 −2.56 0.013
−3.54 6.42 −0.33 ns
−5.35 5.64 0.65 ns
−3.35 7.15 0.95 ns
6.23 6.31 0.88 ns
7.41 6.19 3.49 <0.001
−33.26 11.69 0.36 ns
−29.24 9.29 3.31 0.003
−17.43 7.98 3.97 <0.001
−14.96 7.69 4.23 <0.001
−9.01 5.74 5.73 <0.001
−1.36 6.89 4.90 <0.001
2.19 7.11 4.94 <0.001

Fig. 8 Comparing African and Caucasian tip and torque values for the upper jaw
Lombardo et al. Progress in Orthodontics (2015) 16:11 Page 7 of 12
In-out: a plane parallel to the occlusal plane, passingthrough the FA point of each tooth, was identified, andthe mesial, the distal and the most vestibular point ofevery tooth was selected (Fig. 6). These points werejoined together by a line whose perpendicular distancefrom the FA point (i.e. the centre of the virtual sphere)was taken as the in-out value of that crown. Thesevalues were calculated using the ‘“Evaluate/Distance” !?/“Evaluate/Length” ! ?’ software tool (Fig. 7).
Statistical analysisThe mean, standard deviation and standard error ofeach value obtained above were calculated. TheShapiro-Wilk test was performed to assess the normaldistribution of the studied samples. Student’s t test forindependent samples (significance level p < 0.05) wasused to compare the group mean values for everytooth. To verify the repeatability of the measurementsperformed, 10 renderings of the upper arcade and 10of the lower were selected at random from each ethnicsample. The measurements were then repeated by theother operator, and the second set of measurementswas compared with the first by means of measurementsystems analysis (MSA) conducted using the t test forpaired data.
Fig. 9 Comparing African and Caucasian tip and torque values for the low
ResultsAfrican sampleThe measurements taken of the upper jaw highlightpositive tip values for all the teeth except for the secondmolars (Table 2). The tip values in the lower jaw tendedto be more positive in an anteroposterior direction(Table 2), whereas the torque on both the upper andlower teeth tended to get more negative in an anteropos-terior direction (Table 3); only the central and lateral in-cisors displayed positive torque.
Caucasian sampleWith the exception of the second molar, tip values inthe upper jaw were all positive, displaying a tendency todecrease from the anterior to the posterior sectors(Table 2). The lower tip values were all positive, buttended to increase in an anteroposterior direction(Table 2). As for torque, in the upper jaw, this showed atendency to increase in negativity in an anteroposteriordirection, being positive at the incisors and negative inthe canines, premolars and molars (Table 3). In thelower jaw, increasingly negative torque values were mea-sured in an anteroposterior direction. Only the centralincisors had a positive torque while the most negativetorque was seen at the second molars (Table 3).
er jaw

Table 4 Comparison of our African tip values with those measured by Andrews
Africans—tip Andrews’ values Comparison
n Mean Standard deviation n Mean Standard deviation t test p level
TIP U7 58 −3.06 6.78 240 .39 5.69 −3.58 <0.001
TIP U6 58 9.43 3.53 240 5.73 1.90 7.71 <0.001
TIP U5 58 5.96 5.84 240 2.82 1.52 4.07 <0.001
TIP U4 58 3.29 4.45 240 2.65 1.69 1.07 ns
TIP U3 58 8.23 5.20 240 8.40 2.97 −.24 ns
TIP U2 58 9.23 3.87 240 8.04 2.80 2.20 0.031
TIP U1 58 3.68 3.55 240 3.59 1.65 .18 ns
TIP L7 58 12.65 5.83 240 2.94 2.05 12.50 <0.001
TIP L6 58 6.30 5.36 240 2.03 1.14 6.03 <0.001
TIP L5 58 3.60 4.02 240 1.54 1.35 3.84 <0.001
TIP L4 58 2.95 3.89 240 1.28 1.90 3.19 0.002
TIP L3 58 3.478 4.850 240 2.48 3.28 1.49 ns
TIP L2 58 −.26 3.01 240 .38 1.47 −1.57 ns
TIP L1 58 −1.13 3.30 240 .53 1.29 −3.77 <0.001
ns not significant.
Table 5 Comparison of our Caucasian tip values with thosemeasured by Andrews
Caucasians—tip Andrews’ values Comparison
n Mean Standarddeviation
n Mean Standarddeviation
t test p level
TIPU7
60 −3.88 10.60 240 .39 5.69 −3.02 0.004
TIPU6
60 10.26 5.54 240 5.73 1.90 6.24 <0.001
TIPU5
60 9.64 4.16 240 2.82 1.52 12.49 <0.001
TIPU4
60 7.67 4.28 240 2.65 1.69 8.91 <0.001
TIPU3
60 9.96 4.81 240 8.40 2.97 2.40 0.019
TIPU2
60 9.99 3.69 240 8.04 2.80 3.83 <0.001
TIPU1
60 4.53 2.84 240 3.59 1.65 2.46 0.017
TIPL7
60 14.20 6.47 240 2.94 2.05 13.32 <0.001
TIPL6
60 10.99 2.78 240 2.03 1.14 24.47 <0.001
TIPL5
60 6.90 3.09 240 1.54 1.35 13.12 <0.001
TIPL4
60 6.06 3.36 240 1.28 1.90 10.60 <0.001
TIPL3
60 5.913 3.980 240 2.48 3.28 6.18 <0.001
TIPL2
60 .14 4.46 240 .38 1.47 −.41 ns
TIPL1
60 .00 4.46 240 .53 1.29 −.90 ns
ns not significant.
Lombardo et al. Progress in Orthodontics (2015) 16:11 Page 8 of 12
Measurement system analysisFrom the analysis of the measurement method, in resultsthat there are no statistically significant differences (sig-nificance (two-tailed) <0.05) between the values of tipand torque measured by the two operators, both in theCaucasian and the African groups.
Comparison of tip and torque of African and CaucasiangroupsA comparison of the mean tip and torque values ob-tained for each ethnic sample was performed using Stu-dent’s t test for independent samples. This showed that,in terms of tip values in the upper teeth, there were onlysignificant differences between the two groups at thepremolars, whose mean tip in the Caucasian sampleswas roughly 4° more positive than that in the Africangroup. In the lower jaw, comparable values were onlyfound at the incisors, whereas the tip at the canines, pre-molars and molars was significantly more positive in theCaucasian sample, at 2.5°, 3° and 4° greater, respectively(Table 2).Statistically significant differences were also found in
the torque values measured for the upper arch, this timeat the central incisors and both sets of molars. In eachcase, absolute torque values were greater in the Africansubjects, with a torque 4° more positive at the central in-cisors and roughly 5° and 7°, respectively, at the first andsecond molars (Table 3). Among the lower teeth, onlythe second molar torque of the two groups was compar-able; all the other teeth displayed more positive torquein the African group, reaching statistical significance inthe canines, premolars and first molars. In particular, the

Table 6 Comparison of our African torque values with those measured by Andrews
Africans—torque Andrews’ values Comparison
n Mean Standard deviation n Mean Standard deviation t test p level
TORQUE U7 58 −12.79 10.11 240 −8.10 5.63 −3.41 0.001
TORQUE U6 58 −10.98 9.75 240 −11.53 3.91 .42 ns
TORQUE U5 58 −4.00 8.43 240 −8.78 4.13 4.20 <0.001
TORQUE U4 58 −4.49 8.38 240 −8.47 4.02 3.52 <0.001
TORQUE U3 58 −2.03 7.95 240 −7.25 4.21 4.84 <0.001
TORQUE U2 58 7.41 8.14 240 4.42 4.38 2.70 0.009
TORQUE U1 58 11.41 6.28 240 6.11 3.97 6.14 <0.001
TORQUE L7 58 −32.51 10.93 240 −36.03 6.57 2.35 0.030
TORQUE L6 58 −23.50 9.57 240 −30.67 5.90 5.46 <0.001
TORQUE L5 58 −11.39 8.52 240 −23.63 5.58 10.41 <0.001
TORQUE L4 58 −9.23 7.02 240 −18.95 4.96 9.96 <0.001
TORQUE L3 58 −1.95 7.49 240 −12.73 4.65 10.48 <0.001
TORQUE L2 58 5.50 8.26 240 −3.24 5.37 7.68 <0.001
TORQUE L1 58 9.68 9.18 240 −1.71 5.79 9.02 <0.001
ns not significant
Table 7 Comparison of our Caucasian torque values withthose measured by Andrews
Caucasians—torque Andrews’ values Comparison
n. Mean Standarddeviation
n Mean Standarddeviation
ttest
p level
TORQUEU7
60 −5.50 12.23 240 −8.10 5.63 1.60 ns
Lombardo et al. Progress in Orthodontics (2015) 16:11 Page 9 of 12
torque on the central and lateral incisors was, respect-ively, roughly 7° and 6° more positive in the Africansample. Analogously, the canines displayed roughly 7°less negative torque in the African sample, and approxi-mately 6° less negative torque was measured at the pre-molars and first molars (Table 3) (Figs. 8 and 9).
TORQUEU6
60 −6.26 10.24 240 −11.53 3.91 3.92 <0.001
TORQUEU5
60 −3.54 6.42 240 −8.78 4.13 6.02 <0.001
TORQUEU4
60 −5.35 5.64 240 −8.47 4.02 4.04 <0.001
TORQUEU3
60 −3.35 7.15 240 −7.25 4.21 4.05 <0.001
TORQUEU2
60 6.23 6.31 240 4.42 4.38 2.10 0.040
TORQUEU1
60 7.41 6.19 240 6.11 3.97 1.54 ns
TORQUEL7
60 −33.26 11.69 240 −36.03 6.57 1.77 ns
TORQUEL6
60 −29.24 9.29 240 −30.67 5.90 1.14 ns
TORQUEL5
60 −17.43 7.98 240 −23.63 5.58 5.68 <0.001
TORQUEL4
60 −14.96 7.69 240 −18.95 4.96 3.83 <0.001
TORQUEL3
60 −9.01 5.74 240 −12.73 4.65 4.66 <0.001
TORQUEL2
60 −1.36 6.89 240 −3.24 5.37 1.97 ns
TORQUEL1
60 2.19 7.11 240 −1.71 5.79 3.93 <0.001
ns not significant.
Comparison of tip and torque of African and Caucasiangroups with values reported by AndrewsStatistically significant differences with respect to valuesreported by Andrews were found in terms of the tipvalues measured in the upper jaw of both African andCaucasian subjects [10] (Tables 4 and 5). In the Africansample, only the tip measured at the upper central inci-sors, canines and first premolars was comparable withvalues reported by Andrews (differences of <1°) (Table 4).In the Caucasian subjects, all upper crowns had angula-tion values significantly different to those measured inAndrews’ original sample of North American subjects.The greatest differences were seen at the molars andpremolars, and in our Caucasian sample, only the sec-ond molars had a negative tip (Table 5). A similar dis-crepancy was found in the lower jaw (Table 4); in theAfrican group, substantial differences were noted at thelower incisors, which presented negative tip, at the firstand second premolars and in particular at the first andsecond molars, which both had considerably greater an-gulation values in our sample, the difference being asmuch as 10° at the second molars. Likewise, in our Cau-casian group, lower tip values were markedly different tothose reported by Andrews, especially in the posterior
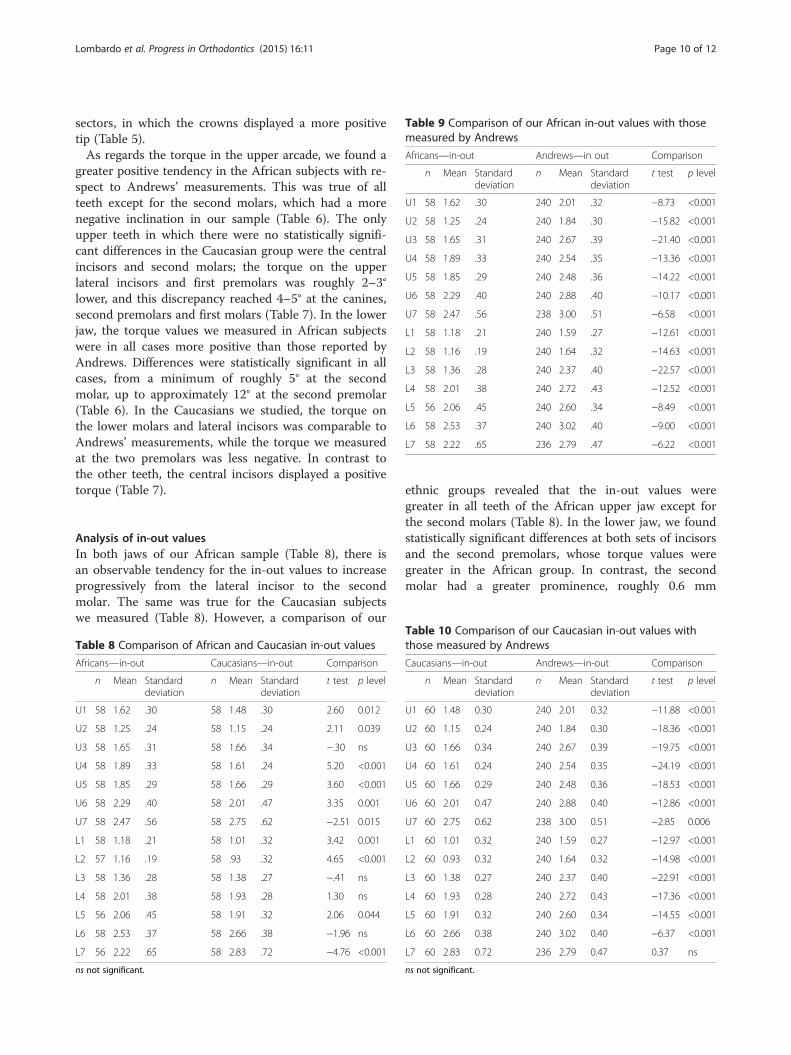
Table 9 Comparison of our African in-out values with thosemeasured by Andrews
Africans—in-out Andrews—in out Comparison
n Mean Standarddeviation
n Mean Standarddeviation
t test p level
U1 58 1.62 .30 240 2.01 .32 −8.73 <0.001
U2 58 1.25 .24 240 1.84 .30 −15.82 <0.001
U3 58 1.65 .31 240 2.67 .39 −21.40 <0.001
U4 58 1.89 .33 240 2.54 .35 −13.36 <0.001
U5 58 1.85 .29 240 2.48 .36 −14.22 <0.001
U6 58 2.29 .40 240 2.88 .40 −10.17 <0.001
U7 58 2.47 .56 238 3.00 .51 −6.58 <0.001
L1 58 1.18 .21 240 1.59 .27 −12.61 <0.001
L2 58 1.16 .19 240 1.64 .32 −14.63 <0.001
L3 58 1.36 .28 240 2.37 .40 −22.57 <0.001
L4 58 2.01 .38 240 2.72 .43 −12.52 <0.001
L5 56 2.06 .45 240 2.60 .34 −8.49 <0.001
L6 58 2.53 .37 240 3.02 .40 −9.00 <0.001
L7 58 2.22 .65 236 2.79 .47 −6.22 <0.001
Lombardo et al. Progress in Orthodontics (2015) 16:11 Page 10 of 12
sectors, in which the crowns displayed a more positivetip (Table 5).As regards the torque in the upper arcade, we found a
greater positive tendency in the African subjects with re-spect to Andrews’ measurements. This was true of allteeth except for the second molars, which had a morenegative inclination in our sample (Table 6). The onlyupper teeth in which there were no statistically signifi-cant differences in the Caucasian group were the centralincisors and second molars; the torque on the upperlateral incisors and first premolars was roughly 2–3°lower, and this discrepancy reached 4–5° at the canines,second premolars and first molars (Table 7). In the lowerjaw, the torque values we measured in African subjectswere in all cases more positive than those reported byAndrews. Differences were statistically significant in allcases, from a minimum of roughly 5° at the secondmolar, up to approximately 12° at the second premolar(Table 6). In the Caucasians we studied, the torque onthe lower molars and lateral incisors was comparable toAndrews’ measurements, while the torque we measuredat the two premolars was less negative. In contrast tothe other teeth, the central incisors displayed a positivetorque (Table 7).
Analysis of in-out valuesIn both jaws of our African sample (Table 8), there isan observable tendency for the in-out values to increaseprogressively from the lateral incisor to the secondmolar. The same was true for the Caucasian subjectswe measured (Table 8). However, a comparison of our
Table 8 Comparison of African and Caucasian in-out values
Africans—in-out Caucasians—in-out Comparison
n Mean Standarddeviation
n Mean Standarddeviation
t test p level
U1 58 1.62 .30 58 1.48 .30 2.60 0.012
U2 58 1.25 .24 58 1.15 .24 2.11 0.039
U3 58 1.65 .31 58 1.66 .34 −.30 ns
U4 58 1.89 .33 58 1.61 .24 5.20 <0.001
U5 58 1.85 .29 58 1.66 .29 3.60 <0.001
U6 58 2.29 .40 58 2.01 .47 3.35 0.001
U7 58 2.47 .56 58 2.75 .62 −2.51 0.015
L1 58 1.18 .21 58 1.01 .32 3.42 0.001
L2 57 1.16 .19 58 .93 .32 4.65 <0.001
L3 58 1.36 .28 58 1.38 .27 −.41 ns
L4 58 2.01 .38 58 1.93 .28 1.30 ns
L5 56 2.06 .45 58 1.91 .32 2.06 0.044
L6 58 2.53 .37 58 2.66 .38 −1.96 ns
L7 56 2.22 .65 58 2.83 .72 −4.76 <0.001
ns not significant.
ethnic groups revealed that the in-out values weregreater in all teeth of the African upper jaw except forthe second molars (Table 8). In the lower jaw, we foundstatistically significant differences at both sets of incisorsand the second premolars, whose torque values weregreater in the African group. In contrast, the secondmolar had a greater prominence, roughly 0.6 mm
Table 10 Comparison of our Caucasian in-out values withthose measured by Andrews
Caucasians—in-out Andrews—in-out Comparison
n Mean Standarddeviation
n Mean Standarddeviation
t test p level
U1 60 1.48 0.30 240 2.01 0.32 −11.88 <0.001
U2 60 1.15 0.24 240 1.84 0.30 −18.36 <0.001
U3 60 1.66 0.34 240 2.67 0.39 −19.75 <0.001
U4 60 1.61 0.24 240 2.54 0.35 −24.19 <0.001
U5 60 1.66 0.29 240 2.48 0.36 −18.53 <0.001
U6 60 2.01 0.47 240 2.88 0.40 −12.86 <0.001
U7 60 2.75 0.62 238 3.00 0.51 −2.85 0.006
L1 60 1.01 0.32 240 1.59 0.27 −12.97 <0.001
L2 60 0.93 0.32 240 1.64 0.32 −14.98 <0.001
L3 60 1.38 0.27 240 2.37 0.40 −22.91 <0.001
L4 60 1.93 0.28 240 2.72 0.43 −17.36 <0.001
L5 60 1.91 0.32 240 2.60 0.34 −14.55 <0.001
L6 60 2.66 0.38 240 3.02 0.40 −6.37 <0.001
L7 60 2.83 0.72 236 2.79 0.47 0.37 ns
ns not significant.

Fig. 10 A comparison of in-out values we measured with those of Andrews
Lombardo et al. Progress in Orthodontics (2015) 16:11 Page 11 of 12
(statistically significant), in our Italian Caucasian sample(Table 8).Both of our samples were significantly different from
that of Andrews in terms of in-out. In both of our sam-ples, the mean prominence was greater than in Andrews’North American group at all teeth (Tables 9 and 10).
DiscussionOn the whole, our findings from this part of the studyare in line with those previously reported in the litera-ture [2–5, 8], namely that ethnic background appears toplay a significant role in determining the angulation andinclination of the teeth in both arcades. In certain circum-stances, these ethnic differences can be great enough (i.e.greater than 3°) to take on clinical relevance.Indeed, although our sample size was relatively small,
if our measurements were taken as reference values,orthodontic bracket prescription would need to be al-tered or bends made in the wire to obtain optimal fin-ishing in the Mozambican population.When comparing the values we measured in our Italian
sample with those reported by Andrews, it became clearthat on the whole, their teeth had a more positive tip (i.e.a greater mesiodistal angulation). Similarly, torque valueswere larger on the whole in our sample. Hence, the resultsof this part of the study also agree with the literature,showing that individuals of the same race have differenttip and torque values, depending on their ethnic back-ground. Indeed, a similar picture was seen in two differentJapanese [2] and Indian [4] samples, as well as Andrews’North American Caucasians.As regards the in-out measurements, those taken on
our sample showed that the lateral incisors had thesmallest values, whereas the molars were the mostprominent. We also revealed a similar trend in bothsamples for the in-out values to progressively increase inan anteroposterior direction from the central incisor tothe second molar. The African sample generally (inci-sors, premolars and first molars) presented greater in-
out values than the Caucasian group in the upper jaw.In the lower jaw, the vestibular prominence of the toothcrowns was essentially similar in African and Caucasiansubjects. With respect to Andrews’ values, however, wedid notice a difference, as we revealed a tendency for thein-out values to increase towards the posterior sectors,where, according to the American author, there is none.Moreover, many of the values in our sample were smallerthan those measured by Andrews, which may suggest thatthe coronal prominence in an anteroposterior direction islower in Africans and Italian Caucasians than in NorthAmerican Caucasians (Fig. 10).Furthermore, the standard deviation values that emerged
in our statistical analysis of the two samples were signifi-cant in some cases, thereby demonstrating that there is aconsiderable dispersion around the mean measurementsfor each tooth, especially in terms of torque. This finding,in agreement with previous studies [1–4, 6, 11–13], mustbe interpreted as a consequence of the biological variationin the inclination and angulation of the teeth, the variationin profile of the clinical crown, and variations in the inclin-ation of the occlusal plane.
Conclusion
� The measurement system used on our sample isrepeatable.
� There is great dispersion around the mean valuesmeasured for each tooth (especially torque).
� Race and ethnicity greatly influence tip, torque andin-out values.
� Caucasians have more positive tip values andAfricans, more positive torque values, with greaterproclination of the incisors.
� In-out values were slightly greater in the Africansample than in the Caucasian group, especially inthe upper arch.
� Both Caucasian and African groups differ fromAndrews’ sample in tip, torque and in-out values.
Lombardo et al. Progress in Orthodontics (2015) 16:11 Page 12 of 12
Competing interestsThe authors declare that they have no competing interests.
Authors’ contributionsLL designed the research protocol, AP carried out the measurements, AAdrafted the manuscript, ML carried out the data processing and statisticalanalysis, GS supervised the research. All authors read and approved the finalmanuscript.
Received: 21 March 2015 Accepted: 30 April 2015
References1. Sebata E. An orthodontic study of teeth and dental arch form on the
Japanese normal occlusions. The Shikwa Gakuho. 1980;80:945–69.2. Watanabe K, Koga M, Yatabe K, Motegi E, Isshiki Y. A morphometric study
on setup models of Japanese malocclusions. The Shikwa Gakuho.1996;96:209–22.
3. Currim S, Wadkar PV. Objective assessment of occlusal and coronalcharacteristics of untreated normals: a measurement study. Am J OrthodDentofacial Orthop. 2004;125(5):582–8.
4. Doodamani GM, Khala AS, Manohar M, Umashankar. Assessment of crownangulations, crown inclinations, and tooth size discrepancies in a SouthIndian population. Contemp Clin Dent. 2011;2(3):176–81.
5. Ferrario VF, Sforza C, Colombo A, Ciusa V, Serrao G. Three-dimensionalinclination of the dental axes in healthy permanent dentitions—a crosssectional study in a normal population. Angle Orthod.2001;71(4):257–64.
6. Lombardo L, Fattori L, Mirabella D, Molinari C, Siciliani G. Dental andalveolar arch forms in a Caucasian population compared with commerciallyavailable archwires. Int Orthod. 2013;115:1–33.
7. Balut N, Klapper L, Sandrik J, Bowman D. Variations in bracket placement inthe preadjusted orthodontic appliance. Am J Orthod Dentofacial Orthop.1992;102:62–7.
8. Tong H, Kwon D, Shi J, Sakai N, Enciso R, Sameshima GT. Mesiodistalangulation and faciolingual inclination of each whole tooth in 3-dimensional space in patients with near-normal occlusion. Am J OrthodDentofacial Orthop. 2012;141(5):604–17.
9. Huanca Ghislanzoni LT, Lineberger M, Cevidanes LH, Mapelli A, Sforza C,McNamara Jr JA. Evaluation of tip and torque on virtual study models: avalidation study. Prog Orthod. 2013;14:19.
10. Caputi S, Varvara G. Dimensional accuracy of resultant casts made by amonophase, one-step and two-step, and a novel two-step putty/light-bodyimpression technique: an in vitro study. J Prosthet Dent. 2008;99(4):274–81.
11. Andrews LF 1993: Straight wire. Masson Spa Milano12. Vardimon AD, Lambertz W. Statistical evaluation of torque angles in
reference to straight-wire appliance (SWA) theories. Am J Orthod.1986;89:56–66.
13. Uğur T, Yukay F. Normal faciolingual inclinations of tooth crowns comparedwith treatment groups of standard and pretorqued brackets. Am J OrthodDentofacial Orthop. 1997;112(1):50–7.
Submit your manuscript to a journal and benefi t from:
7 Convenient online submission
7 Rigorous peer review
7 Immediate publication on acceptance
7 Open access: articles freely available online
7 High visibility within the fi eld
7 Retaining the copyright to your article
Submit your next manuscript at 7 springeropen.com