research open access behavioral signatures related to
TRANSCRIPT

Bruining et al. Molecular Autism 2014, 5:11http://www.molecularautism.com/content/5/1/11
RESEARCH Open Access
Behavioral signatures related to genetic disordersin autismHilgo Bruining1,2*, Marinus JC Eijkemans2,3, Martien JH Kas2, Sarah R Curran4, Jacob AS Vorstman1†
and Patrick F Bolton4†
Abstract
Background: Autism spectrum disorder (ASD) is well recognized to be genetically heterogeneous. It is assumedthat the genetic risk factors give rise to a broad spectrum of indistinguishable behavioral presentations.
Methods: We tested this assumption by analyzing the Autism Diagnostic Interview-Revised (ADI-R) symptomprofiles in samples comprising six genetic disorders that carry an increased risk for ASD (22q11.2 deletion, Down’ssyndrome, Prader-Willi, supernumerary marker chromosome 15, tuberous sclerosis complex and Klinefeltersyndrome; total n = 322 cases, groups ranging in sample sizes from 21 to 90 cases). We mined the data to test theexistence and specificity of ADI-R profiles using a multiclass extension of support vector machine (SVM) learning.We subsequently applied the SVM genetic disorder algorithm on idiopathic ASD profiles from the Autism GeneticsResource Exchange (AGRE).
Results: Genetic disorders were associated with behavioral specificity, indicated by the accuracy and certainty ofSVM predictions; one-by-one genetic disorder stratifications were highly accurate leading to 63% accuracy of correctgenotype prediction when all six genetic disorder groups were analyzed simultaneously. Application of the SVMalgorithm to AGRE cases indicated that the algorithm could detect similarity of genetic behavioral signatures inidiopathic ASD subjects. Also, affected sib pairs in the AGRE were behaviorally more similar when they had beenallocated to the same genetic disorder group.
Conclusions: Our findings provide evidence for genotype-phenotype correlations in relation to autisticsymptomatology. SVM algorithms may be used to stratify idiopathic cases of ASD according to behavioralsignature patterns associated with genetic disorders. Together, the results suggest a new approach fordisentangling the heterogeneity of ASD.
BackgroundAutism spectrum disorder (ASD) is a behaviorally de-fined syndrome characterized by variable abnormalitiesin social interactions and communication, in associationwith restricted interest patterns and unusual stereotypedbehaviors. There has been a concerted effort over thelast 20 years to identify causal genetic risk factors and asa result, an increasing number of rare, highly penetrantgenetic variants are being implicated [1]. When present,these rare variants are thought to account for a large
* Correspondence: [email protected]†Equal contributors1Brain Center Rudolf Magnus, Department of Psychiatry, University MedicalCenter, Postbus 85500, Heidelberglaan 100 3508 GA, Utrecht, The Netherlands2Brain Center Rudolf Magnus, Department of Translational Neuroscience,Utrecht, The NetherlandsFull list of author information is available at the end of the article
© 2014 Bruining et al.; licensee BioMed CentraCommons Attribution License (http://creativecreproduction in any medium, provided the orwaiver (http://creativecommons.org/publicdomstated.
proportion of an individual’s genetic liability to the con-dition. Currently, specific genetic etiologies, includingrare single nucleotide and copy number variants (CNVs)as well as larger chromosomal variations, can be identi-fied in around 15 to 20% of patients [2-5]. These find-ings highlight the complexity of the genetic architectureand heterogeneity of ASD and indicate that by usingstandard case–control designs, extremely large samplesizes will be required to unravel the heterogeneity andmap the dysregulated signaling pathways involved in thepathophysiology of ASD [4,6-9].The variability in phenotypic expression of autism ob-
served in monozygotic twin pairs, coupled with the evi-dence from molecular genetic studies supporting apolygenic multi-factorial liability model has led to therecognition that the many genetic risk factors for autism
l Ltd. This is an Open Access article distributed under the terms of the Creativeommons.org/licenses/by/2.0), which permits unrestricted use, distribution, andiginal work is properly cited. The Creative Commons Public Domain Dedicationain/zero/1.0/) applies to the data made available in this article, unless otherwise

Bruining et al. Molecular Autism 2014, 5:11 Page 2 of 12http://www.molecularautism.com/content/5/1/11
give rise to a broad spectrum of behavioral presentationsand hence the concept of autism as a spectrum disorder.The adoption of this model has led to an implicit as-sumption that specific genotype-phenotype correlationsare unlikely to exist. However, there is evidence thatASD symptoms may be dissociable at the genetic level.Different genetic linkage regions have been obtained forsocial interaction and repetitive behavioral domains inASD patients [10], and distinct developmental trajector-ies of social and repetitive behavior exist in the ASDpopulation [11]. Moreover, in recent years, a growinginterest has developed in the possibility that particulargenetic disorders may give rise to characteristic patternsof autistic symptomatology. This interest is based on theassumption that perturbations in associated pathophysio-logical pathways would lead to relatively constrained andmore specific phenotypic outcomes [12]. Indeed, a num-ber of recent studies, involving a variety of genetic condi-tions including 16p11.2 and 7q11.23 CNVs, Williamssyndrome, fragile X syndrome and neurofibromatosis,have indicated the existence of genetic disorder-specificbehavioral profiles that encourage further efforts in thisdirection [4,13-16]. Building on these findings, we postu-lated that well-defined genetic conditions could give riseto relatively distinct patterns of autistic symptomatology.The designation of these patterns may be relevant to dis-sect ASD heterogeneity as other risk factors that perturbconverging pathophysiological pathways, for example re-lated to the genetic conditions, might lead to similar pat-terns of autistic symptomatology.In the present study, we have undertaken a proof of
concept study to determine if these genotype-phenotypecorrelations exist and whether they could be useful todisentangle the heterogeneity of ASD and complementfuture genetic studies. Support vector machine (SVM)learning was used to analyze ‘signatures’ of autisticsymptomatology in six genetic developmental disordersassociated with an increased risk for ASD [17-20]. Basedon the premise that other risk factors which dysregulatethe same pathways may give rise to similar ‘signature’patterns of behavior, we aimed to apply the SVM algo-rithms derived from genetic disorders to cases of idio-pathic ASD. Finally, we investigated whether the SVMalgorithm would detect enhanced behavioral similarityin affected sib pairs from the Autism Genetics ResourceExchange (AGRE) multiplex families. Figure 1 providesan overview of the different steps involved in the study.
MethodsSubjectsThe six genetic disorders we included in the study were:22q11.2 deletion syndrome (22q11DS), Down’s syndrome(DS) [21], Prader-Willi syndrome (PWS), supernumerarymarker chromosome 15 (SMC15), tuberous sclerosis
complex (TSC) and Klinefelter syndrome (XXY); total n =322 cases, groups ranging in sample size from 21 to 90cases. Cases were recruited through patient associations/charities or centers for clinical genetics or pediatrics aspart of a collaborative effort between the Department ofPsychiatry of the University Medical Centre in Utrecht inthe Netherlands and the Institute of Psychiatry, King’sCollege London in the UK. Appropriate local ethical boardapproval was obtained (Medical Research Ethics Commit-tee, METC, of the University Medical Centre in Utrechtand the College Research Ethics Committee, CREC, inLondon). Informed consent for each participant in the co-horts was obtained and included the use of data for theanalysis we carried out for this paper. The genetic disor-ders had been diagnosed through clinical genetic centersand confirmed by routine molecular and cytogenetic ana-lysis. The total sample consisted of 322 verbal subjects.Each of the six genetic disorders has previously beenshown to be associated with an increased risk of ASD[6,7,22-25]. The cases were drawn from studies that hadoriginally been designed to elucidate the behavioral phe-notypes associated with each of the six genetic disorders[22-27]. As far as possible, the samples were ascertainedwithout reference to the presence of ASD. For more de-tails on recruitment procedures and inclusion criteria forthe genetic disorder subtypes please see previous publica-tions [22-26]. All subjects were included in the analyses,regardless of the presence of an ASD diagnosis, in orderto evaluate the widest range of symptom profiles. How-ever, for technical reasons concerning the measurement ofASD symptomatology, only verbal individuals were in-cluded in the analyses. Estimates of intellectual abilitieswere available for the majority of subjects (>80%) and hadbeen assessed by different standardized measures accord-ing to age and ability level [28-32]. Table 1 shows the sam-ple characteristics.The AGRE database was used for the selection of idio-
pathic subjects (http://www.agre.org) [33,34]. AGREcases were included in the analyses if they fulfilled Aut-ism Diagnostic Interview-Revised (ADI-R) criteria for anASD and complete ADI-R algorithm data were available(see criteria). All verbal simplex probands in the AGREcohort with complete ADI-R algorithm data and scoringabove the ASD threshold (n = 375) were assigned thelabel ‘AGRE0’. Among the multiplex families we identi-fied all verbal affected sib pairs. Within these affectedpairs one sib was allocated to ‘AGRE1’ while the otherwas allocated to ‘AGRE2’. Therefore, AGRE1 and AGRE2consisted of those verbal subjects with ASD with at leastone related verbal sibling with ASD (both n = 433).
MeasuresAutism symptom variables were extracted from theADI-R which was used to interview the parents of each

Figure 1 (See legend on next page.)
Bruining et al. Molecular Autism 2014, 5:11 Page 3 of 12http://www.molecularautism.com/content/5/1/11

(See figure on previous page.)Figure 1 Overview of the different steps undertaken in the study. Step 1: development of SVM classifier to assess the presence and strengthof behavioral signatures among genetic syndromes. Step 2: application of the classifier derived in step 1 to AGRE samples to test if similarity inbehavioral signatures can be detected among idiopathic ASD subjects. Step 3: application of classifier derived in step 1 to sibling pairs withidiopathic ASD (AGRE) to test relative familiality of behavioral signatures derived from genetic syndromes. AGRE, Autism Genetics ResourceExchange; ASD, autism spectrum disorder; SVM, support vector machine.
Bruining et al. Molecular Autism 2014, 5:11 Page 4 of 12http://www.molecularautism.com/content/5/1/11
subject [35]. The ADI-R is an established interviewschedule for assessing autism diagnoses but may also beused to assess profiles of autistic symptomatology[36,37], and as phenotype variables in large geneticpopulation studies of ASD [38-41]. The interview fo-cuses on identifying key symptoms that characterize thesyndrome [12,36,37]. A subset of 37 items from theADI-R is used to create a diagnostic algorithm, whichdocuments behaviors reported between the 4th and 5thbirthday, regarded as the optimal window to detectASD. As a consequence, the use of the diagnosticalgorithm data minimalizes the possible confound ofage-related developmental effects on symptomatology.ADI-R items are scored as: 0, no ASD behavioral symp-tom present; 1, specified behavior definitely present butnot clearly enough to warrant a code of 2; or 2, specifiedASD symptom definitely present. In addition, for someitems a code of 3 is given, if the behavior impacts mark-edly on or disrupts family life. Accordingly, when com-puting the algorithm scores, a code 3 is recoded as a 2.For this study, we used these algorithm scores, with arange of 0 to 2 instead of 0 to 3, to assign equal weightto all items entered in the analyses. Because certainsymptoms of the communication impairments charac-terizing ASD can only be observed in verbal individuals,there are separate scores for verbal and non-verbal indi-viduals. An overview of the description of the ADI-Ritems and the ADI-R domains of the algorithm is pro-vided in Table 2. The classification of an ASD in this
Table 1 Characteristics of the total genetic disorder sample
Geneticdisorder
N Age(months)
ASD
Total Female Male Yes No
22q11DS 90 42 48 162.5 ± 33.6 40 50
Down’s 21 16 5 169.1 ± 32.6 6 15
PWS 88 48 40 191.9 ± 141.0 20 68
SMC15 22 8 14 161.4 ± 103.6 19 3
TSC 50 31 19 126.2 ± 74.0 22 28
XXY 51 0 51 145.4 ± 41.4 16 35
Total 322 145 177 123 199
Average 162.7 ± 89.8
Data provided are mean values and, if applicable, standard error of the means. ADIqualitative abnormalities in communication; and III, restricted, repetitive and stereoDiagnostic Interview-Revised; ASD, autism spectrum disorder; Down’s, Down’s syndr15; TSC, tuberous sclerosis complex; XXY, Klinefelter syndrome.
study was based on ADI-R criteria used in genetic stud-ies and the AGRE collection: ASD is diagnosed whenscores in all domains are met or when scores are met intwo core symptom domains, in addition to the ‘age ofonset’ domain, but are one point away from meetingautism criteria in the one remaining core symptom do-main [35,42]. Reliability of the ADI-R in a populationwith mild to moderate mental retardation has beenestablished [43].
Statistical analysisStandard principal component analysis (PCA) of ADI-Ritem scores was used to investigate the extent of overlap be-tween the symptom profiles of the different genetic groups.The SVM method was used as a supervised learning
method (incorporating the knowledge of the genotype) toclassify genotype membership on the basis of ADI-R itemscores. SVM is currently one of the most popular machinelearning methods used in data mining, due to its firm the-oretical foundation and proven superiority in applications.With regards to SVM, a radial basis kernel function wasused, with optimal gamma and cost parameter values de-termined in a nested n-fold or, equivalently, leave-one-outcross-validation (LOOCV) procedure, n being the numberof observations in the sample. Each observation in turnwas left out of the sample, and an SVM classifier was opti-mized and built on the remaining n − 1 observations. Inthis way, an independent assessment of correctness of thepredicted class can be achieved for each observation in the
ADI-R scores per domain and total scores IQ
I II III Total
9.8 ± 6.4 7.7 ± 4.8 2.5 ± 2.2 20.0 ± 12.0 67.0 ± 14.1
7.2 ± 4.4 6.8 ± 3.8 3.2 ± 2.0 17.2 ± 8.6 49.5 ± 11.9
7.9 ± 5.1 5.7 ± 4.5 2.8 ± 2.0 16.3 ± 10.1 70.9 ± 16.3
15.6 ± 6.0 13.6 ± 5.5 6.5 ± 2.4 35.7 ± 12.2 51.0 ± 19.0
12.0 ± 9.0 9.6 ± 6.8 3.7 ± 3.3 25.2 ± 17.9 69.3 ± 27.4
8.5 ± 6.0 8.8 ± 5.4 2.3 ± 2.1 19.6 ± 12.0 80.4 ± 13.9
9.6 ± 6.7 8.0 ± 5.6 3.1 ± 2.5 20.6 ± 13.4 68.6 ± 19.2
-R domains: I, qualitative abnormalities in reciprocal social interaction; II,typed patterns of behavior. 22q11DS, 22q11.2 deletion syndrome; ADI-R, Autismome; PWS, Prader-Willi syndrome; SMC15, supernumerary marker chromosome

Table 2 Autism Diagnostic Interview-Revised (ADI-R)algorithm items sorted by number
Itemnumber
Item description ADI-Rdomain
31 Use of other’s body to communicate I
33 Stereotyped utterances and delayed echolalia III
34 Social verbalization/chat II
35 Reciprocal conversation II
36 Inappropriate questions or statements II
37 Pronominal reversal II
38 Neologisms/idiosyncratic language II
39 Verbal rituals III
42 Pointing to express interest II
43 Nodding II
44 Head shaking II
45 Conventional/instrumental gestures II
47 Spontaneous imitation of actions II
48 Imaginative play II
49 Imaginative play with peers I
50 Direct gaze I
51 Social smiling I
52 Showing and directing attention I
53 Offering to share I
54 Seeking to share enjoyment with others I
55 Offering comfort I
56 Quality of social overtures I
57 Range of facial expressions used to communicate I
58 Inappropriate facial expressions I
59 Appropriateness of social responses I
61 Imitative social play II
62 Interest in children I
63 Response to approaches of other children I
64 Group play with peers (age <10.0 years) I
65 Friendships (age >10.0 years) I
67 Unusual preoccupations III
68 Circumscribed interests III
69 Repetitive use of objects or interest in parts ofobjects
III
70 Compulsions/rituals III
71 Unusual sensory interests (highest score of 69/71) III
77 Hand and finger mannerisms (highest score of 77/78) III
78 Other complex mannerisms or stereotyped bodymovements
III
ADI-R, Autism Diagnostic Interview-Revised.
Bruining et al. Molecular Autism 2014, 5:11 Page 5 of 12http://www.molecularautism.com/content/5/1/11
sample, resulting in an independent estimate of the accur-acy of SVM on the whole sample. In each one of theremaining samples, the optimization with respect to thegamma and cost parameter was achieved by applying a
second LOOCV procedure, in which each of these n − 1observations in turn was left out of the sample and SVMmodels were fitted to the remaining n − 2 observations,using a grid of combinations of gamma and cost parametervalues. In a similar fashion as described above, accuracywas determined for every combination of gamma and costparameter values on the grid, and the optimal value ofgamma and cost parameter was determined as the one giv-ing the highest accuracy. Finally, an SVM model was fittedto the n − 1 observations remaining in the outer loop usingthese optimal values. SVM by nature is a method for binary(two group) classification, so a multiclass (k classes) exten-sion was used, based on the ‘one-against-one’ approach, inwhich k(k − 1)/2 binary classifiers are trained; the appropri-ate ‘predicted’ class is found by a voting scheme, choosingthe most frequently assigned class by the binary classifiers.Thus, the class assigned by SVM is the one with the
maximum votes from all one-versus-one (2-group) clas-sifications, based on the decision values of the 2-groupclassifiers. These decision values can also, post hoc, beused to obtain a predicted probability for each class,which can be used as outcome parameters to evaluatethe confidence of SVM predictions.The software used was the libSVM program, imple-
mented through the SVM function in the e1071 libraryin R [44].
ResultsIdentification of behavioral signatures relating to eachgenetic disorderAs a starting point, we explored the distribution of autismsymptom profiles in the genetic disorder sample by PCA.The PCA plot showed that, on average, some genetic dis-order profiles were overlapping where others were moreclearly separable (Figure 2). This picture indicated that un-supervised statistical analysis was not sufficiently sensitiveto optimally distinguish genetic disorder-related profiles.This notion was confirmed following cluster analysis(k-means clustering) of the ADI-R data in the genetic dis-order sample, which did not identify any relevant clusters(data not shown).To perform a more sophisticated pattern analysis, we
turned to machine learning analysis. We used SVM as asupervised learning method to investigate genotype-phenotype relationships between the six genetic disor-ders and the item scores from the ADI-R algorithm. Theessential difference with the unsupervised PCA or clus-tering analysis used above is that the SVM approachincorporates the knowledge of the genotype in the ana-lysis. The SVM allocations to genetic disorder groupsoccurred in two steps. First, the SVM analyzed 2-group,‘one-against-one’ comparisons. Subsequently, the multi-class extension was used to select the most appropriate‘predicted’ genetic disorder class for each subject on the

Figure 2 PCA plot of ADI-R profiles of subjects in the geneticdisorder sample. Colors/numbers denoting genetic disordersubgroups. 1, 22q11.2 deletion syndrome; 2, Down’s syndrome; 3,Prader-Willi syndrome; 4, supernumerary marker chromosome 15; 5,tuberous sclerosis complex; 6, Klinefelter syndrome. ADI-R, AutismDiagnostic Interview-Revised; PCA, principal component analysis.
Bruining et al. Molecular Autism 2014, 5:11 Page 6 of 12http://www.molecularautism.com/content/5/1/11
basis of the most frequently assigned class by the binaryclassifiers. The binary one-by-one comparisons showedhigh accuracies of up to 97% of correct genetic group al-locations (Table 3). As a result, a total of 63% of caseswas correctly allocated by the multiclass comparisonusing the LOOCV method, whereas random prediction(without prior knowledge of genetic group) would haveresulted in 21% accuracy (Table 4). Interestingly, in allgroups apart from DS, the averages of the post-hoc pre-dicted probabilities were highest for the correspondinggenetic disorder class, indicating that the SVM algorithmwas able to predict correct disorder classes with a highdegree of confidence (Table 4).To further evaluate the validity of the prediction model,
we investigated the correlation between the predicted
Table 3 One-by-one SVM comparisons in the geneticdisorder sample
Genotype SVM accuracy (%)
22q11DS Down’s PWS SMC15 TSC XXY
22q11DS NA 0.89 0.91 0.97 0.90 0.82
Down’s 0.89 NA 0.77 0.84 0.82 0.87
PWS 0.91 0.77 NA 0.84 0.86 0.86
SMC15 0.97 0.84 0.84 NA 0.94 0.88
TSC 0.90 0.82 0.86 0.94 NA 0.72
XXY 0.82 0.87 0.86 0.88 0.72 NA
22q11DS, 22q11.2 deletion syndrome; Down’s, Down’s syndrome; NA, notapplicable; PWS, Prader-Willi syndrome; SMC15, supernumerary markerchromosome 15; SVM, support vector machine; TSC, tuberous sclerosiscomplex; XXY, Klinefelter syndrome.
probabilities and the proportion of cases correctly assignedto each genetic group, based on LOOCV output. Thistests the expectation of the model that higher probabilitiesreflect greater confidence in prediction, as shown by in-creasing ‘correctness’ in classification. We observed a sig-nificant correlation (P = 0.002) between the predictedprobabilities and the likelihood of correct classification,which provides support for the robustness of the modeland encouraged us to test the classifier in further samples.We were interested to identify which behaviors con-
tributed most to the predictions by SVM. Therefore, theimportance (weight) of each of the ADI-R items to theSVM classifier was extracted. The result of this analysisshowed that four of the top five most influential itemspertained to ASD symptoms that related to the qualityof social interaction (Table 5). By contrast, the five leastinfluential items were more concerned with aberrantcommunication and repetitive behaviors.It was notable that the predicted probabilities in
SMC15 cases were also relatively high for prediction tothe PWS group. This seemed plausible, as both disordersare associated with differences in the ‘dosage’ of geneslocated in chromosome 15q11-13. By contrast, SMC15could be clearly discriminated from 22q11DS by SVM,which corresponded with a lack of overlap in the PCAbetween these two groups (Figure 2). Interestingly, SMC15and 22q11DS are both characterized by low averageintelligence, suggesting that the behavioral differencesare independent of general intellectual ability. To rule outthe influence of IQ on prediction accuracy, we re-analyzedthe data, including IQ as an additional predictor. Theaverage accuracy of the SVM predictions was essentiallyunchanged (63.0% versus 62.5%), indicating that IQ wasnot a confounding factor. The poor prediction for the DSgroup was due to a frequent misallocation to the PWSgroup; 17 of the DS cases were being incorrectly assignedto the PWS group. Indeed, an overlap between DS andPWS groups was also apparent in the PCA of the symp-tom profiles (Figure 2).We also tested the accuracy of SVM class assignment
among the subset of individuals who scored above theADI-R threshold for ASD (n = 123). This resulted insimilar assignment accuracies and predicted probabilities(data not shown). In subsequent analyses we used the al-gorithm derived from all patients from our genetic dis-order samples, irrespective of whether they met formalcriteria for ASD diagnosis, since from a clinical perspec-tive, we also wanted to include the profiles of subjectswho scored below ADI-R thresholds for ASD.
Testing the SVM classification algorithm in idiopathic ASDNext, we considered whether the genetic disorder algo-rithm could detect a degree of similarity in patterns ofautistic behavior in a sample of ‘idiopathic’ cases. To test

Table 4 Leave-one-out cross-validation (LOOCV) results for the SVM model on ADI-R items for the geneticdisorder sample
Geneticdisorder
SVM frequency of assigned class and predicted probabilities
22q11DS Down’s PWS SMC15 TSC XXY
Total
n Probability n Probability n Probability n Probability n Probability n Probability n
22q11DS 74 0.602 1 0.092 7 0.095 0 0.032 6 0.15 14 0.215 102
Down’s 0 0.027 1 0.166 1 0.103 0 0.097 0 0.03 0 0.047 2
PWS 7 0.099 18 0.485 68 0.537 9 0.301 7 0.12 6 0.167 115
SMC15 0 0.02 0 0.11 4 0.089 10 0.326 0 0.05 2 0.067 16
TSC 2 0.103 0 0.044 3 0.068 0 0.064 30 0.43 9 0.185 44
XXY 7 0.149 1 0.103 5 0.108 3 0.179 7 0.22 20 0.319 43
Total 90 21 88 22 50 51 322
Accuracy 74/90 (82%) 1/21 (10%) 68/88 (77%) 10/22 (45%) 30/50 (60%) 20/51 (39%) 203/322 (63%)
22q11DS, 22q11.2 deletion syndrome; ADI-R, Autism Diagnostic Interview-Revised; Down’s, Down’s syndrome; LOOCV, leave-one-out cross-validation; PWS,Prader-Willi syndrome; SMC15, supernumerary marker chromosome 15; SVM, support vector machine; TSC, tuberous sclerosis complex; XXY, Klinefelter syndrome.
Bruining et al. Molecular Autism 2014, 5:11 Page 7 of 12http://www.molecularautism.com/content/5/1/11
this hypothesis, we applied the algorithm to ADI-R dataobtained from the AGRE dataset in order. It should benoted that the AGRE sample functioned as a ‘blind’ sam-ple in this context, as we could not validate the outcomewith genetic labels. Therefore, we performed analyses toindicate if the algorithm would detect meaningful associ-ations or if these would not differ from random associa-tions, for example not informed by genetic disorderlabels. Thus, we generated randomly permuted ADI-Ritem data from the AGRE0 dataset and compared thedistribution of predicted probabilities in the real (AGRE0and genetic disorder sample) compared to the randomlygenerated data. The probabilities differed significantlybetween these groups. As expected, the highest pre-dicted probabilities were observed among the geneticdisorder cases. Indeed, the lowest probabilities were ob-served in the randomly generated AGRE subsample.There was also a significant difference between the gen-etic groups and AGRE0 (P = 0.0024), between the gen-etic groups and random data (P <0.001) and betweenAGRE0 and random data (Figure 3). Most importantly,
Table 5 ADI-R items that contributed most and least to the re
Lowest five ADI-R items
Item number Item description
70 Compulsions/rituals
38 Neologisms/idiosyncratic language
58 Inappropriate facial expressions
39 Verbal rituals
37 Pronominal reversal
ADI-R, Autism Diagnostic Interview-Revised; SVM, support vector machine.
the probabilities in AGRE0 were significantly higherthan those in the randomly configured data (P <0.001).This indicated that the algorithm derived from the gen-etic disorders detected non-random pattern information.Subsequently, we applied the genetic disorder classifier
to the AGRE0 sample to analyze the distribution of gen-etic disorder allocations in the blind AGRE subsamples.The genetic disorder algorithm assigned the highestprobabilities and most cases to the TSC group and thelowest probabilities and fewest cases to the DS and PWSgroups. We observed a similar distribution of SVM pre-dicted probabilities in the AGRE1 and AGRE2 samples,essentially replicating the result obtained for AGRE0.Again, TSC was by far the most commonly assignedclass, whereas DS and PWS were the least frequentlyassigned classes. The predicted probabilities and grouppredictions for AGRE0, AGRE1 and AGRE2 are summa-rized in Table 6. It should be noted that these predic-tions were achieved by forcing all individuals into one ofthe six categories, which means that frequent allocationshould be interpreted as indicative of relative phenotype
sult of the SVM analysis on the genetic syndrome sample
Top five ADI-R items
Item number Item description
63 Response to approaches of other children
49 Imaginative play with peers
64, 65 Group play with peers/friendships
56 Quality of social overtures
68 Circumscribed interests

Bruining et al. Molecular Autism 2014, 5:11 Page 8 of 12http://www.molecularautism.com/content/5/1/11
similarity. As such, the application of the genetic dis-order classifier to AGRE samples seemed to indicate en-hanced relative similarity of AGRE profiles to the TSCgroup. To support this notion, we plotted the AGRE0ADI-R profiles in the PCA plot of the genetic disordersample, which confirmed that, on average, the TSC groupdisplayed most similarity to AGRE0 (Figure 4). In addition,22q11DS, SMC15 and XXY groups also displayed somecloseness to AGRE0, which seems also reflected in theiroccasional allocation by the genetic disorder classifier.We contrasted these predictions in the AGRE sample
with random predictions; we generated SVM models byrandomly permuting the six labels relating to the geneticdisorders. Thus, random genetic labels were linked tothe existing symptom profiles, thereby destroying theoriginal relationship between ADI-R score profiles andthe genetic groups. By analyzing the allocations arisingfrom these random classifier algorithms, we could checkwhich distribution of allocation would arise by chance,that is not informed by existing genetic disorder profiles.We repeated this exercise 1,000 times in order to gain ro-bust results. The results showed that most were assignedto the 22q11DS and PWS groups. This result was mostlikely due to the fact that these disorders were the two lar-gest groups in the genetic disorder sample. It should benoted that this result was strikingly different than the allo-cation in AGRE by the randomly permuted genetic labels.Together, these analyses on blind AGRE samples indi-
cated that the algorithm of the genetic disorder samplecould detect an extent of relative similarity in ADI-Rprofile patterns among idiopathic subjects.
Figure 3 SVM predicted probabilities of the original geneticgroups, AGRE0 singleton dataset and randomly generatedscores for the AGRE0 singleton dataset. Mean SVM probabilitiesdiffered significantly between the genetic groups and AGRE0(P = 0.0024), between the genetic groups and random data(P <0.001) and between AGRE0 and random data (P <0.001). SVM,support vector machine.
Behavioral signatures in sibling pairs with idiopathic ASDTo test our expectation that the signature patterns derivedfrom the genetic disorders relate to genotype-phenotypeassociations, we hypothesized that the affected sib (sibling)would be significantly more often assigned to the samegenetic disorder class and be relatively more similar intheir behavioral profile than non-related subjects. To testthis, we examined the concurrence in class assignment (X-square) and correlation between affected sib pairs in theSVM assigned class and predicted probabilities.Significant dependence between the class assignment of
siblings in AGRE1 and the other sibling in AGRE2 was in-dicated (X-squared = 43, df = 25, P = 0.015). Furthermore,the predicted probabilities for the assigned class in AGRE1(sib1) were significantly correlated with the predicted prob-abilities of their affected sibling AGRE2 (sib2) (Pearson’scorrelation r = 0.20, P <0.001) (Figure 5). To exclude thepossibility that these correlations were driven by severityrather than specificity of ADI-R profiles, we found that theseverity of the proband symptom scores did not predict thepredicted probability of its sibling, while the predictedprobability scores did predict the probability score ofthe sibling (sibling 1 as predictor of sibling 2: meanitems score P = 0.18; probability score P = 1.5e-05; sibling2 as predictor of sibling 1: mean items score P = 0.86;probability score P = 7e-05).Interestingly, the correlation in prediction probabilities
was driven by a correlation (r = 0.35) between sib pairsassigned to the same class compared with ‘discordant’ sibs(r = −0.18), that is sibling pairs that had not been assignedto the same class. In addition, we found that the covari-ance in probabilities between sibs was greater when bothsibs were assigned to the same genetic disorder class (F-test for equality of variances of the difference in probabil-ity, P <0.001). To confirm the notion of enhanced behav-ioral similarity between siblings allocated to the samegenetic disorder class, we examined the ADI-R scores dir-ectly. We used the first principle component (PC1) of theADI-R scores as a summary measure. Overall (disregard-ing genetic disorder class), the PC1s of sibs were not sig-nificantly correlated (r = 0.081, P = 0.089), but when splitout for concordance of genetic disorder prediction, thecorrelations were 0.71 and −0.16 for concordant sibs anddiscordant sibs, respectively, with P <0.001 for ‘concord-ant’ versus ‘discordant’ sibs. Overall, the sibling analysis in-dicated that the familial liability to ASD may bepartitioned according to the relative likelihood of disturb-ance related to certain genetic disorders.
DiscussionThis study demonstrates that patterns of autistic symptom-atology can be associated with specific genetic disorders.There has been much speculation that such genotype-phenotype correlations exist but so far only limited evidence
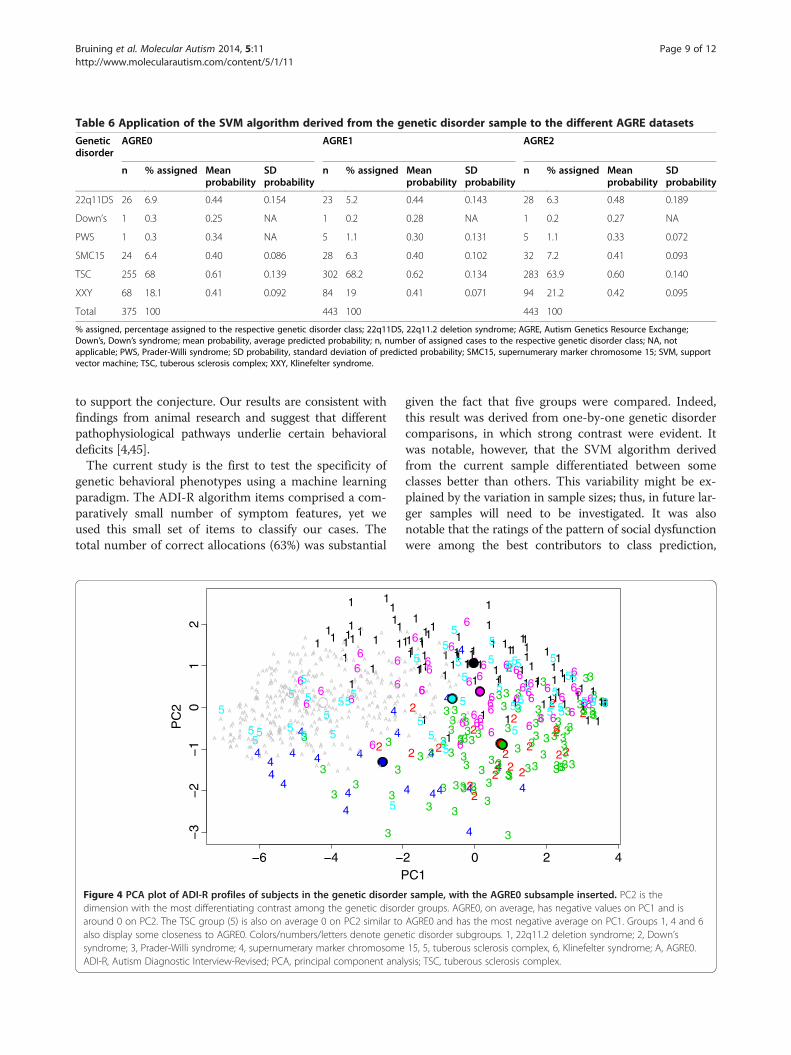
Table 6 Application of the SVM algorithm derived from the genetic disorder sample to the different AGRE datasets
Geneticdisorder
AGRE0 AGRE1 AGRE2
n % assigned Meanprobability
SDprobability
n % assigned Meanprobability
SDprobability
n % assigned Meanprobability
SDprobability
22q11DS 26 6.9 0.44 0.154 23 5.2 0.44 0.143 28 6.3 0.48 0.189
Down’s 1 0.3 0.25 NA 1 0.2 0.28 NA 1 0.2 0.27 NA
PWS 1 0.3 0.34 NA 5 1.1 0.30 0.131 5 1.1 0.33 0.072
SMC15 24 6.4 0.40 0.086 28 6.3 0.40 0.102 32 7.2 0.41 0.093
TSC 255 68 0.61 0.139 302 68.2 0.62 0.134 283 63.9 0.60 0.140
XXY 68 18.1 0.41 0.092 84 19 0.41 0.071 94 21.2 0.42 0.095
Total 375 100 443 100 443 100
% assigned, percentage assigned to the respective genetic disorder class; 22q11DS, 22q11.2 deletion syndrome; AGRE, Autism Genetics Resource Exchange;Down’s, Down’s syndrome; mean probability, average predicted probability; n, number of assigned cases to the respective genetic disorder class; NA, notapplicable; PWS, Prader-Willi syndrome; SD probability, standard deviation of predicted probability; SMC15, supernumerary marker chromosome 15; SVM, supportvector machine; TSC, tuberous sclerosis complex; XXY, Klinefelter syndrome.
Bruining et al. Molecular Autism 2014, 5:11 Page 9 of 12http://www.molecularautism.com/content/5/1/11
to support the conjecture. Our results are consistent withfindings from animal research and suggest that differentpathophysiological pathways underlie certain behavioraldeficits [4,45].The current study is the first to test the specificity of
genetic behavioral phenotypes using a machine learningparadigm. The ADI-R algorithm items comprised a com-paratively small number of symptom features, yet weused this small set of items to classify our cases. Thetotal number of correct allocations (63%) was substantial
4
4
4
4
4
4
4
4
4
4
4
4
2
3
3 3
33
3
3
3
6 6
6
6
6
6
66
6
1
1
1
1
11 1
11
11 111
1
1
1
1
5 5 5
55
5
5
5
5
5
55
5
5
5
−6 −4 −
−3
−2
−1
01
2
P
PC
2 A
A
A
A
A
A
A
A
A
A
A
AA
A
A
A
A
A
A
A
A
A
A
A
A
AA
AA
A
A
A
A
AAA
A
A
A
A
AA
A
A
A
A
A
A
A A
A
A
A
A
A
A
A
AA
A
A
A
A
A
A
A
A
A
A
AA
A
A
A
A
A
A
A
A
A
A
A
A
A A
A
A
A
A
A
A
A
A
A
A
A
A
A
A
A
A A
A
A
A
A
A
A
A
A
A
A
AA
AA
A
A
A
A
A
A
A
A
A
AA
A
A
A
A
A
AA
A
A
A
A
A
A
A
A
A
A
A
A
A
A
A
A
A
A
A
A
A
AA
AA
A
A
A
A
AA
A
A
A
A
A
A
AAA
A
A
A
A
A
A
A
A
A
A
A
A
A
A
A
AA
A
A
A
A
A
A
A
A A
A
A
A AA
A
A
A
A
A
A
A
A
A
A
AA
A
AA
A
AA
A
A
A
A
AA
A
A
A
A
A
A
A
A A
A
AA
A
A
A
A
A
A
A
A
A A
A
A
A
A
A
A
AA
A
A
A
A
A
A
A
A
A
A
A
A
A
A
AA
AA
A
A
A
A
A
A A
A
A
A
AA
A
A
A
A
AA
AAA
A
A
A
A
AA
A
A
A
A
A
A
A
A
A
AA
A
AA
A
A
A
A
A
A
AA
A
A
A
A
A
A
A
A
A
Figure 4 PCA plot of ADI-R profiles of subjects in the genetic disordedimension with the most differentiating contrast among the genetic disordaround 0 on PC2. The TSC group (5) is also on average 0 on PC2 similar toalso display some closeness to AGRE0. Colors/numbers/letters denote genesyndrome; 3, Prader-Willi syndrome; 4, supernumerary marker chromosomeADI-R, Autism Diagnostic Interview-Revised; PCA, principal component ana
given the fact that five groups were compared. Indeed,this result was derived from one-by-one genetic disordercomparisons, in which strong contrast were evident. Itwas notable, however, that the SVM algorithm derivedfrom the current sample differentiated between someclasses better than others. This variability might be ex-plained by the variation in sample sizes; thus, in future lar-ger samples will need to be investigated. It was alsonotable that the ratings of the pattern of social dysfunctionwere among the best contributors to class prediction,
4
4
4
4 4
4
4
4 4
4
2
2
2 2
2
2
2
2
2
2
2
2
2
222
2
2
2
23
3
3
33
3
3
3
33 333
3
33 3
3
3
3
3 3
3
3
3
3
3
3
3
3
3
3
3
3333 33
3
3
3
33
3
3
3
3
3
3
33
33
3
33
3
3
3
3
3
3
33
3
33
3
33
3
3
3
3
3
3
3 3
36
66
666
66
66
6
6
6
6
6
66
66
6
6
6
66
66 6
6
6
6
66
6
6
6
66
6
666
6
1
1
11
11
111
1 1
11
1
1 11
1
1
1
1
1
1
1
1 1
1
11111
1
1
11
1 1
1
11
1
11
1
1
1
1
1
11
1
11
1
1
1
1 1111
1
1
11
11
1
1
1 15
5
5 5
55 55
5
5
5
5
5
5
5
5 5
5
55
55
5
5
55
55
55
5
55
5
5
2 0 2 4C1
A
AA
A
A
A
A
A
A
A
A
A
A
A
A
A
A
A
A
A
A
A
A
A
A
A
AA
A
A
A
A
A
AA
A
A
A
A
A
A
r sample, with the AGRE0 subsample inserted. PC2 is theer groups. AGRE0, on average, has negative values on PC1 and isAGRE0 and has the most negative average on PC1. Groups 1, 4 and 6tic disorder subgroups. 1, 22q11.2 deletion syndrome; 2, Down’s15, 5, tuberous sclerosis complex, 6, Klinefelter syndrome; A, AGRE0.
lysis; TSC, tuberous sclerosis complex.

0.0 0.2 0.4 0.6 0.8 1.0
0.0
0.2
0.4
0.6
0.8
1.0
Sib 1: SVM predicted probability of assigned class
Sib
2: S
VM
pre
dict
ed p
roba
bilit
y of
ass
igne
d cl
ass r = 0.20, P < 0.001
Figure 5 Correlation of SVM predicted probabilities betweenAGRE siblings. AGRE, Autism Genetics Resource Exchange; SVM,support vector machine.
Bruining et al. Molecular Autism 2014, 5:11 Page 10 of 12http://www.molecularautism.com/content/5/1/11
raising the possibility that particular styles of social im-pairment may be related to particular genetic risk factors.Although differences in the typology of social impairmentshave been noted in ASD [46], differences in the types ofsocial impairment have not been studied in detail and areonly partially captured by the ADI-R items. For instance,social avoidance is commonly reported in fragile X syn-drome, as another example of social behavioral specificitywithin a genetic disorder associated with ASD [47,48]. Itseems likely that with the incorporation of more symp-toms and other phenotypic features, such as the presenceof comorbid behavioral problems like those associatedwith ADHD [49], the ability to assign cases to specificclasses of genetic disorder may be improved. The inclu-sion of other conditions such as fragile X syndrome mayalso help further map the patterns of genotype-phenotypecorrelations. Together, these extensions may reveal furthercontrasts or overlaps between genetic disorders that arebiologically meaningful. For instance, it was already inter-esting that the prediction probabilities for SMC15 weresimilar to those for PWS. Both disorders are associatedwith abnormalities in the dosage of genes located in the15q11-13 region and likely lead to perturbations in similarpathophysiological pathways.The subjects of this study were included because they
were ascertained for the presence of a genetic disorderand were assessed regardless of the presence or absenceof behavioral concerns. Although this approach is likelyto have minimized ascertainment biases, some bias can-not be ruled out. However, any enrichment of behavioralabnormalities in these cohorts is unlikely to give rise tothe specific patterns of associations identified here. Itwas reassuring in this respect that the algorithm derived
from all cases in the genetic disorder samples gave com-parable results to the analyses that included only thesubjects who scored above the ADI-R threshold forASD. Analysis confirmed that IQ did not seem to act asa confounding factor in the SVM predictions. Also, theinfluence of age and medication as cofounds could beruled out, as the ADI-R algorithm codes behaviors be-tween 4 and 5 years old [35].The application of the genetic disorder algorithm to
AGRE samples indicated that the behavioral patterns ob-served in cases of idiopathic autism were not random.Therefore, these results could be used to estimate rela-tive similarity to behavioral profiles designated fromthe genetic disorders. In addition, the sibling analysisshowed correlation of SVM predictions between affectedsib pairs. These findings indicate the feasibility to parti-tion familiality into components according to patterns ofautistic symptomatology, for example concordance inrelative similarity to behavioral profiles related to thegenetic disorders. This notion should be followed up bystudies that incorporate genetic or pathway informationto ascertain the behavior-based stratification in idio-pathic samples. For instance, our allocation in idiopathicASD to TSC-derived patterns may be supported by mo-lecular data showing mammalian target of rapamycin(mTOR) pathway deregulation. Such a result would sup-port the view that perturbation of the mTOR signalingcascade is a common pathophysiological feature of hu-man neurological disorders, including mental retardationsyndromes and ASDs [49]. If confirmed, such resultscould complement future gene searches, since stratifica-tion on the basis of behavioral profile may significantlyincrease the power to detect which (combination of )genetic disorder related pathways are most prominentlyinvolved. Indeed, the notion that pathophysiological pro-cesses are shared in syndromic and idiopathic cases ofASD is supported by a recent study that showed conver-ging synaptic pathophysiology between syndromic (forexample as a cause of a defined genetic disorder) andnon-syndromic rodent models of autism [50]. Moreover,genotype stratification may also have important treat-ment implications, as other animal studies suggest thatthe best treatment approaches for some genetic disor-ders (for example fragile X syndrome) may be unsuitablefor others (for example tuberous sclerosis) [49].
ConclusionOur proof of concept study indicates the existence of‘signature’ autistic behavioral profiles that index under-lying genetic risk processes. These signatures may behelpful in disentangling the etiological and phenotypicheterogeneity evident in ASD, but warrant replication inlarger and independent samples. The approach pre-sented in this study could hold promise as a means of

Bruining et al. Molecular Autism 2014, 5:11 Page 11 of 12http://www.molecularautism.com/content/5/1/11
stratifying patients who may benefit from treatments tar-geted at specific pathways and as a way of identifyingthose patients in whom interventions may have un-wanted effects.
Abbreviations22q11DS: 22q11.2 deletion syndrome; ADI-R: Autism Diagnostic Interview-Revised; AGRE: Autism Genetics Resource Exchange; ASD: Autism spectrumdisorder; CNV: Copy number variant; CREC: College Research EthicsCommittee; DS: Down’s syndrome; IQ: Intelligence quotient; LOOCV:Leave-one-out cross-validation; METC: Medical Research Ethics Committee;mTOR: Mammalian target of rapamycin; PCA: Principal component analysis;PWS: Prader-Willi syndrome; SMC15: Supernumerary marker chromosome 15;SVM: Support vector machine; TSC: Tuberous sclerosis complex;XXY: Klinefelter syndrome.
Competing interestsThe authors declare no conflicts of interest.
Authors’ contributionsHB designed the study, analyzed and interpreted the data, and drafted andrevised the manuscript. ME designed the study, analyzed and interpretedthe data, and drafted and revised the manuscript. MK undertook datainterpretation, and drafted and revised the manuscript. SC analyzed andinterpreted the data, and drafted and revised the manuscript. JV designedthe study, analyzed and interpreted the data, and drafted and revised themanuscript. PB designed the study, analyzed and interpreted the data, anddrafted and revised the manuscript. All authors read and approved the finalmanuscript.
AcknowledgementsPatrick Bolton is supported by a National Institute of Health Research SeniorInvestigator Award and the Biomedical Research Centre in Mental Health atthe South London & Maudsley Hospital. The Uk component of the researchwas supported by grants to Patrick Bolton from the UK Medical ResearchCouncil, The UK Tuberous Sclerosis Association and the US CharityAutism Speaks.JV is supported by a 2010 Fellowship from the Dutch Brain Foundation(F2010(1)-20).
Author details1Brain Center Rudolf Magnus, Department of Psychiatry, University MedicalCenter, Postbus 85500, Heidelberglaan 100 3508 GA, Utrecht, The Netherlands.2Brain Center Rudolf Magnus, Department of Translational Neuroscience,Utrecht, The Netherlands. 3Julius Center for Health Sciences and Primary Care,University Medical Center, Utrecht, The Netherlands. 4King’s College London,Institute of Psychiatry, De Crespigny Park, London, UK.
Received: 3 November 2013 Accepted: 2 January 2014Published: 11 February 2014
References1. Betancur C: Etiological heterogeneity in autism spectrum disorders: more
than 100 genetic and genomic disorders and still counting. Brain Res2011, 1380:42–77.
2. Abrahams BS, Geschwind DH: Advances in autism genetics: on thethreshold of a new neurobiology. Nat Rev Genet 2008, 9(5):341–355.
3. Pinto D, Pagnamenta AT, Klei L, Anney R, Merico D, Regan R, Conroy J,Magalhaes TR, Correia C, Abrahams BS, Almeida J, Bacchelli E, Bader GD,Bailey AJ, Baird G, Battaglia A, Berney T, Bolshakova N, Bölte S, Bolton PF,Bourgeron T, Brennan S, Brian J, Bryson SE, Carson AR, Casallo G, Casey J,Chung BH, Cochrane L, Corsello C, et al: Functional impact of global rarecopy number variation in autism spectrum disorders. Nature 2010,466(7304):368–372.
4. Sanders SJ, Ercan-Sencicek AG, Hus V, Luo R, Murtha MT, Moreno-De-LucaD, Chu SH, Moreau MP, Gupta AR, Thomson SA, Mason CE, Bilguvar K,Celestino-Soper PB, Choi M, Crawford EL, Davis L, Wright NR, DhodapkarRM, DiCola M, DiLullo NM, Fernandez TV, Fielding-Singh V, Fishman DO,Frahm S, Garagaloyan R, Goh GS, Kammela S, Klei L, Lowe JK, Lund SC, et al:Multiple recurrent de novo CNVs, including duplications of the 7q11.23
Williams syndrome region, are strongly associated with autism. Neuron2011, 70(5):863–885.
5. Scherer SW, Dawson G: Risk factors for autism: translating genomicdiscoveries into diagnostics. Hum Genet 2011, 130(1):123–148.
6. Cook EH Jr, Scherer SW: Copy-number variations associated withneuropsychiatric conditions. Nature 2008, 455(7215):919–923.
7. Freitag CM: The genetics of autistic disorders and its clinical relevance:a review of the literature. Mol Psychiatry 2007, 12(1):2–22.
8. Levy D, Ronemus M, Yamrom B, Lee YH, Leotta A, Kendall J, Marks S,Lakshmi B, Pai D, Ye K, Buja A, Krieger A, Yoon S, Troge J, Rodgers L,Iossifov I, Wigler M: Rare de novo and transmitted copy-number variationin autistic spectrum disorders. Neuron 2011, 70(5):886–897.
9. Toro R, Konyukh M, Delorme R, Leblond C, Chaste P, Fauchereau F,Coleman M, Leboyer M, Gillberg C, Bourgeron T: Key role for gene dosageand synaptic homeostasis in autism spectrum disorders. Trends Genet2010, 26(8):363–372.
10. Liu XQ, Paterson AD, Szatmari P: Genome-wide linkage analyses ofquantitative and categorical autism subphenotypes. Biol Psychiatry 2008,64(7):561–570.
11. Fountain C, Winter AS, Bearman PS: Six developmental trajectoriescharacterize children with autism. Pediatrics 2012, 129(5):e1112–1120.
12. Bruining H, de Sonneville L, Swaab H, de Jonge M, Kas M, van Engeland H,Vorstman J: Dissecting the clinical heterogeneity of autism spectrumdisorders through defined genotypes. PLoS One 2010, 5(5):e10887.
13. Hall SS, Lightbody AA, Hirt M, Rezvani A, Reiss AL: Autism in fragile Xsyndrome: a category mistake? J Am Acad Child Adolesc Psychiatry 2010,49(9):921–933.
14. Smith LE, Barker ET, Seltzer MM, Abbeduto L, Greenberg JS: Behavioralphenotype of fragile X syndrome in adolescence and adulthood.Am J Intellect Dev Disabil 2012, 117(1):1–17.
15. Lincoln AJ, Searcy YM, Jones W, Lord C: Social interaction behaviorsdiscriminate young children with autism and Williams syndrome.J Am Acad Child Adolesc Psychiatry 2007, 46(3):323–331.
16. Pride NA, Payne JM, North KN: The impact of ADHD on the cognitive andacademic functioning of children with NF1. Dev Neuropsychol 2012,37(7):590–600.
17. Flores CG, Valcante G, Guter S, Zaytoun A, Wray E, Bell L, Jacob S, Lewis MH,Driscoll DJ, Cook EH Jr, Kim SJ: Repetitive behavior profiles: consistencyacross autism spectrum disorder cohorts and divergence fromPrader-Willi syndrome. J Neurodev Disord 2011, 3(4):316–324.
18. Oliver C, Berg K, Moss J, Arron K, Burbidge C: Delineation of behavioralphenotypes in genetic syndromes: characteristics of autism spectrumdisorder, affect and hyperactivity. J Autism Dev Disord 2011, 41(8):1019–1032.
19. Moss J, Howlin P: Autism spectrum disorders in genetic syndromes:implications for diagnosis, intervention and understanding the widerautism spectrum disorder population. J Intellect Disabil Res 2009,53(10):852–873.
20. Siegel MS, Smith WE: Psychiatric features in children with genetic syndromes:toward functional phenotypes. Pediatr Clin North Am 2011, 58(4):833–864.
21. Li H, Fertuzinhos S, Mohns E, Hnasko TS, Verhage M, Edwards R, Sestan N,Crair MC: Laminar and columnar development of barrel cortex relies onthalamocortical neurotransmission. Neuron 2013, 79(5):970–986.
22. Bruining H, Swaab H, Kas M, van Engeland H: Psychiatric characteristics ina self-selected sample of boys with Klinefelter syndrome. Pediatrics 2009,123(5):e865–870.
23. Dennis NR, Veltman MW, Thompson R, Craig E, Bolton PF, Thomas NS:Clinical findings in 33 subjects with large supernumerary marker(15)chromosomes and 3 subjects with triplication of 15q11-q13. Am J MedGenet A 2006, 140(5):434–441.
24. Milner KM, Craig EE, Thompson RJ, Veltman MW, Thomas NS, Roberts S,Bellamy M, Curran SR, Sporikou CM, Bolton PF: Prader-Willi syndrome:intellectual abilities and behavioural features by genetic subtype.J Child Psychol Psychiatry 2005, 46(10):1089–1096.
25. Vorstman JA, Morcus ME, Duijff SN, Klaassen PW, Heineman-de Boer JA,Beemer FA, Swaab H, Kahn RS, van Engeland H: The 22q11.2 deletionin children: high rate of autistic disorders and early onset ofpsychotic symptoms. J Am Acad Child Adolesc Psychiatry 2006,45(9):1104–1113.
26. Bolton PF, Park RJ, Higgins JN, Griffiths PD, Pickles A: Neuro-epilepticdeterminants of autism spectrum disorders in tuberous sclerosiscomplex. Brain 2002, 125(Pt 6):1247–1255.

Bruining et al. Molecular Autism 2014, 5:11 Page 12 of 12http://www.molecularautism.com/content/5/1/11
27. Roach ES, Gomez MR, Northrup H: Tuberous sclerosis complex consensusconference: revised clinical diagnostic criteria. J Child Neurol 1998,13(12):624–628.
28. Mullen EM: Mullen Scales of Early Learning. AGSth edition. AmericanGuidance Service Inc: Circle Pines, MN; 1995.
29. Raven JC: Colored Progressive Matrices Sets I and II. Oxford: OxfordPsychologists Press Ltd; 1995.
30. Wechsler D: Wechsler Preschool and Primary Scale of Intelligence-Revised. NewYork, NY: Psychological Corporation; 1989.
31. Wechsler D: Wechsler Adult Intelligence Scale-Third Edition. San Antonio, TX:Psychological Corporation; 1997.
32. Snijders JT, Tellegen PJ, Winkel M, Laros JA: SON-R 2, 5–7 Niet-verbaleIntelligentietest-Revisie [SON-R 2, 5–7 Snijders-Oomen Non-verbalIntelligence Test-Revised]. Lisse: Swets & Zeitlinger; 2009.
33. Lajonchere CM: Changing the landscape of autism research: the autismgenetic resource exchange. Neuron 2010, 68(2):187–191.
34. Bucan M, Abrahams BS, Wang K, Glessner JT, Herman EI, Sonnenblick LI,Alvarez Retuerto AI, Imielinski M, Hadley D, Bradfield JP, Kim C, Gidaya NB,Lindquist I, Hutman T, Sigman M, Kustanovich V, Lajonchere CM, Singleton A,Kim J, Wassink TH, McMahon WM, Owley T, Sweeney JA, Coon H, Nurnberger JI,Li M, Cantor RM, Minshew NJ, Sutcliffe JS, Cook EH, et al: Genome-wideanalyses of exonic copy number variants in a family-based study point tonovel autism susceptibility genes. PLoS Genet 2009, 5(6):e1000536.
35. Lord C, Rutter M, Le Couteur A: Autism diagnostic interview-revised:a revised version of a diagnostic interview for caregivers of individualswith possible pervasive developmental disorders. J Autism Dev Disord1994, 24(5):659–685.
36. Brune CW, Kim SJ, Salt J, Leventhal BL, Lord C, Cook EH Jr: 5-HTTLPRgenotype-specific phenotype in children and adolescents with autism.Am J Psychiatry 2006, 163(12):2148–2156.
37. Kates WR, Antshel KM, Fremont WP, Shprintzen RJ, Strunge LA, Burnette CP,Higgins AM: Comparing phenotypes in patients with idiopathic autism topatients with velocardiofacial syndrome (22q11 DS) with and withoutautism. Am J Med Genet A 2007, 143A(22):2642–2650.
38. Szatmari P, Liu XQ, Goldberg J, Zwaigenbaum L, Paterson AD, Woodbury-Smith M,Georgiades S, Duku E, Thompson A: Sex differences in repetitive stereotypedbehaviors in autism: implications for genetic liability. Am J Med Genet BNeuropsychiatr Genet 2012, 159B(1):5–12.
39. Liu XQ, Georgiades S, Duku E, Thompson A, Devlin B, Cook EH, Wijsman EM,Paterson AD, Szatmari P: Identification of genetic loci underlying thephenotypic constructs of autism spectrum disorders. J Am Acad ChildAdolesc Psychiatry 2011, 50(7):687–696.
40. Molloy CA, Keddache M, Martin LJ: Evidence for linkage on 21q and 7qin a subset of autism characterized by developmental regression.Mol Psychiatry 2005, 10(8):741–746.
41. Flax JF, Hare A, Azaro MA, Vieland VJ, Brzustowicz LM: Combined linkageand linkage disequilibrium analysis of a motor speech phenotypewithin families ascertained for autism risk loci. J Neurodev Disord 2010,2(4):210–223.
42. Buitelaar JK, Van der Gaag R, Klin A, Volkmar F: Exploring the boundaries ofpervasive developmental disorder not otherwise specified: analyses ofdata from the DSM-IV Autistic Disorder Field Trial. J Autism Dev Disord1999, 29(1):33–43.
43. de Bildt A, Sytema S, Ketelaars C, Kraijer D, Mulder E, Volkmar F, Minderaa R:Interrelationship between autism diagnostic observation schedule-generic(ADOS-G), autism diagnostic interview-revised (ADI-R), and the diagnosticand statistical manual of mental disorders (DSM-IV-TR) classification inchildren and adolescents with mental retardation. J Autism Dev Disord 2004,34(2):129–137.
44. R Development Core Team: R: A Language and Environment for StatisticalComputing. Vienna: R Foundation for Statistical Computing; 2005.
45. Kas MJ, Fernandes C, Schalkwyk LC, Collier DA: Genetics of behaviouraldomains across the neuropsychiatric spectrum; of mice and men.Mol Psychiatry 2007, 12(4):324–330.
46. Wing L, Gould J: Severe impairments of social interaction and associatedabnormalities in children: epidemiology and classification. J Autism Dev Disord1979, 9(1):11–29.
47. Budimirovic DB, Bukelis I, Cox C, Gray RM, Tierney E, Kaufmann WE: Autismspectrum disorder in Fragile X syndrome: differential contribution ofadaptive socialization and social withdrawal. Am J Med Genet A 2006,140A(17):1814–1826.
48. Kau AS, Tierney E, Bukelis I, Stump MH, Kates WR, Trescher WH, KaufmannWE: Social behavior profile in young males with fragile X syndrome:characteristics and specificity. Am J Med Genet A 2004, 126A(1):9–17.
49. Auerbach BD, Osterweil EK, Bear MF: Mutations causing syndromic autismdefine an axis of synaptic pathophysiology. Nature 2011, 480(7375):63–68.
50. Baudouin SJ, Gaudias J, Gerharz S, Hatstatt L, Zhou K, Punnakkal P, TanakaKF, Spooren W, Hen R, De Zeeuw CI, Vogt K, Scheiffele P: Shared synapticpathophysiology in syndromic and nonsyndromic rodent models ofautism. Science 2012, 338(6103):128–132.
doi:10.1186/2040-2392-5-11Cite this article as: Bruining et al.: Behavioral signatures related togenetic disorders in autism. Molecular Autism 2014 5:11.
Submit your next manuscript to BioMed Centraland take full advantage of:
• Convenient online submission
• Thorough peer review
• No space constraints or color figure charges
• Immediate publication on acceptance
• Inclusion in PubMed, CAS, Scopus and Google Scholar
• Research which is freely available for redistribution
Submit your manuscript at www.biomedcentral.com/submit