research of materials for membranes and … and membrane- electrode assembly for application in fuel...
TRANSCRIPT

UNIVERSITY OF LATVIAFACULTY OF PHYSICS AND MATHEMATICS
Jūlija Hodakovska
RESEARCH OF MATERIALS FOR MEMBRANES AND MEMBRANE-
ELECTRODE ASSEMBLY FOR APPLICATION IN FUEL CELLS
Summary of the Doctoral Thesis
Promotion to the Degree of Doctor of PhysicsSubbranch: Solid State Physics
Rīga, 2011

The dissertation work was carried out at the Institute of Solid State Physics, University of Latvia, in the time period from year 2005 to 2010.
Type of work: Dissertation
Scientific advisor:
Dr. phys. JĀNIS KLEPERIS, senior researcher, Institute of Solid State Physics, University of Latvia.
Dissertation reviewers:
Dr. phys. Oskars Krievs, Technical University of Riga
Dr. chem. prof. Arturs Vīksna, Faculty of chemistry, University of Latvia
Dr. habil. phys. Donāts Millers, the Institute of Solid State Physics, University of Latvia
The dissertation defence will take place in the open session of the Physics, Astronomy and Mechanics dissertation commission of the University of Latvia to be held on March 1, 2011 at 14:00 in the conference hall of the Institute of Solid State Physics, University of Latvia at Kengeraga street 8.
The dissertation and its summary are available at the University of Latvia Library (Kalpaka blvd. 4) and at the Latvian Academic Library (Rupniecibas street 10).
The dissertation was supported by European Social fund.
Chairperson of specialized dissertation commission of University of Latvia in Physics, Astronomy and Mechanics
Dr. habil. phys. prof. Ivars Tāle
© Jūlija Hodakovska, 2011© Latvijas Universitāte, 2011
ISBN 978-9984-45-309-5

Contents
Annotation ...................................................................................................................... 41. Introduction ............................................................................................................ 5
1.1. Motivation ........................................................................................................ 51.2. Main goal and tasks of the work ................................................................. 61.3. Novelty of this work ...................................................................................... 61.4. Author contribution ....................................................................................... 7
2. Literature overview ................................................................................................ 82.1. History of fuel cell ........................................................................................ 82.2. Parts of fuel cell .............................................................................................. 82.3. Proton conductivity in membranes ............................................................ 92.4. Current limiting factors in fuel cells .......................................................... 12
3. Sample synthesis and experimental methods ................................................... 153.1. Materials ........................................................................................................... 153.2. Sample synthesis ............................................................................................. 163.3. Experimental analysis .................................................................................... 18
4. Results ...................................................................................................................... 264.1. Research on a new materials for proton conductive membrane ........... 26
4.1.1. Water absorption ................................................................................ 274.1.2. Chemical stability ............................................................................... 294.1.3. Proton conductivity ........................................................................... 294.1.4. DSC analysis ........................................................................................ 324.1.5. Microscopy of the surfaces ............................................................... 334.1.6. IR spectroscopic measurements to determine sulfonation of
polymer ................................................................................................. 374.1.7. Determining sulfonation degree with the help
of elemental analysis .......................................................................... 384.1.8. Conclusions .......................................................................................... 38
4.2. Research on a new electrode material for membrane-electrode assembly ........................................................................................................... 394.2.1. SPEEK and polyaniline polymerization in-situ ............................ 394.2.2. SPEEK and polyaniline without oxidant. ...................................... 424.2.3. SPEEK and aniline with oxidant ..................................................... 424.2.4. Conclusions .......................................................................................... 45
5. Thesis ....................................................................................................................... 476. References ................................................................................................................ 487. Publications ............................................................................................................. 50
List of publications ................................................................................................. 50List of conferences .................................................................................................. 50
Acknowledgements ....................................................................................................... 52

4
Annotation
Polymer membranes and polymer electrode for membrane-electrode-assembly are synthesized and studied for usage in hydrogen fuel cell (a device that converts chemical energy into electrical). Of the studied proton exchange membrane materials the modified sulphonated poly(ether-ether-ketone) SPEEK polymer best suited for membrane and composite polymer electrode production. Method is proposed to make the electron and proton conductive electrode material from two polymers: SPEEK and polyaniline. Different methods were used to study synthesized composite polymer materials, consisting of one, two or three separate polymers - water absorption, Fenton test, morphology by SEM and AFM, conductivity temperature dependence, impedance spectroscopy and infrared spectra. Synthesized polymer electrode material has a mixed electron – proton conduction.
Key words: proton exchange membrane, the membrane - electrode assembly, electron conducting polymer

5
1. Introduction
1.1. Motivation
Development of our civilization is highly connected with energy. Main energy resources used nowadays are oil and radioactivity, both non-renewable and environmentally unfriendly due to poisonous emissions while in use or radioactive waste. The trivial way to solve this situation would be to switch to renewable resources; the main problem in this case is their availability in time and exact place, for example, the number of sunny days. Due to this fact a new task arises: how to store energy when it is available for the usage when it is needed. The best way to solve the situation is to use hydrogen as energy carrier, which has highest heating value [1]. Another reason to use hydrogen is it’s availability on Earth in the form of different substances and in the Universe.
To switch to hydrogen energetics it is necessary to use rare and expensive materials and complicate technologies. Extensive studies and large financial investments are necessary to make them available for large segments of society. One example is fuel cell (FC).
Membrane is one from the most important parts of fuel cell, because it makes possible for device to functionalize. Based on working conditions inside the fuel cell, following conditions have been set for potentially new membrane materials: (1) proton conductivity; (2) dielectric for electrons; (3) thermal stability; (4) chemical stability; (5) mechanical stability; (6) non-permeable for gases and liquids. First two criteria from this list are making possible to divide positive from negative charges and provide electricity in electric circuit. Next four requirements are necessary for stable work of the system. Fifth criterion also is important due to increasing geometrical size due to water absorption, which is influencing contact between electrode, gas diffusion layer with catalyst and membrane. A sixth criterion is important to exclude the contact between reactants – fuel and oxidant – before reactions on electrodes.
Some of the properties necessary for electrode material are the same as for membrane material. Other specific characteristics of electrode material are related with it functionality, e.g. electron conductivity and catalytic activity (generally an electrode is catalyst carrier). Both mentioned characteristics of an electrode on an interface between fuel/electrode/membrane provide necessary core actions of the fuel cell – reformation of fuel and separation protons from electrons. As seen, important criterion for an electrode material is good contact with membrane material to transfer protons from electrode/catalyst centres to a membrane.

6
Nowadays the carbon cloth is most used material for making membrane-electrode assembly (MEA) of fuel cell. In typical procedure it is coated with catalyst ink and hot-pressed to polymer membrane. Due to mechanical pressure the membrane in such prepared MEA has irregular thickness due to irreversible changes in material structure. As shown by theoretical models, the irregularities in thickness and pressure caused deformations are main reason for uneven current distribution in MEA volume and faster degradation of the fuel cell [2].
During last years several publications and patents [3] were published, proposing other methods for making membrane-electrode assembly without hot pressing. But still question of good contact and chemical compatibility between membrane material and electrode-catalyst material is vital and has great impact on the life length of fuel cell.
1.2. Main goal and tasks of the workMain goal:
To optimize membrane and membrane-electrode system for hydrogen fuel cell by synthesizing and investigating both proton and mixed conducting (electron and proton) composite materials made from several polymers with appropriate properties.
To reach this goal next tasks were set:1. To synthesize and investigate proton conductive material for membranes
on base of two polymers: sulfonated poly(ether-ether-ketone) (SPEEK) and sulfonated poly(ether-ketone-ketone) (SPEKK);
2. To synthesize and investigate proton and electron conductive material for an electrode in MEA on the base of polymer used in membrane material.
1.3. Novelty of this work
The main innovation of this work is new proton and electron conductive polymer membrane material on the base of polymer material used in hydrogen technologies, e.g. fuel cells, electrolysers and other devices. Three different synthesis methods were tested and optimal technology chosen to synthesize electron and proton conductive material.
For the first time the polymer material for an electrode in MEA is made from polyaniline - electron conductive polymer, and proton conductive material, which is suitable for membrane in fuel cell: modified sulfonated poly(ether-ether-ketone).

7
1.4. Author contribution
All synthesis procedures of the single and composite polymer membrane samples, their analysis on water absorption and Fenton tests, research with thermogravimetric and atomic force microscope methods, conductivity measurements, also literature review and result analysis are made by author.
All FTIR light reflection and transmition measurements and Raman spectra analysis are made by Dr. phys. George Chikvaidze. Scanning electron microscope and differential scanning calorimetry measurements were made in GKSS Polymer Institute, Germany. Elemental analysis for several samples was made in Portugal for GKSS Polymer Institute, Germany.
8
2. Literature overview
2.1. History of fuel cell
Fuel cell is a device, which can convert one type of energy – chemical – to another – electrical. First “gaseous battery” or working device, which could be described as fuel cell, was demonstrated in year 1839 by William Grouve, and its working principle was explained by Friedrich Wilhelm Ostwald. There were a lot of scientists interested in one or other aspect of fuel cell technology [4-7], but development was very slow during next 100 years. Only during 1930s scientists returned to the topic, mainly, due to space conquest, hydrogen energy and global ecological situation on Earth.
During development of fuel cell technology several types of fuel cell emerged, each having own field of applications with appropriate advantages over other types.
First polymer electrolyte membrane FC (PEMFC) was demonstrated in 1960 by General Electrics (USA). Ten years later E.I. du Pont de Nemours & Company – nowadays DuPont, ASV – company’s worker Walther Grot presented his new polymer [8, 9], but in 1975 it was patented as Nafion© , which is even now one of the best polymer for low temperature fuel cells. Because this company dominates market, developing or buying patents, it uses it’s nearly monopoly to keep price for the Nafion© at around 1500 USD per 1 m2 [10], and together with cost of some other parts it makes energy cost from PEMFC quite high.
2.2. Parts of fuel cell
Fuel cell working principle allows to avoide the limitations put by heat and mechanical work, e.g. according Carnot cycle. Another advantage is reaction product (clean water), which are not poisoning environment. FC schematically is commonly represented by its membrane-electrode assembly (MEA) and gas diffusion layer cross-section (Fig. 2.1). Real size of such an element typically is below few millimetres, but due to active surface’s area size resulting power density can reach 1 W/cm2 and open chain voltage up to 0.7 Volts.
Simplified explanation of the working principles of fuel cell is following: fuel (hydrogen) is brought to anode side, where is decomposed into proton and electron on catalyst. Membrane is insulator for electrons, but conductive for protons, this makes it possible to divide charges and voltage difference between electrodes arise.

9
Fig. 2.1. The cross-section of fuel cell [11].
When electrical circuit connects anode and cathode, electrons are moving to cathode performing particular job. On the cathode side oxidant (oxygen), protons and electrons produce water; these processes are described by following reactions:
Anode (2.1)
Cathode (2.2)
This and some other processes in fuel cell result in number of requirements for every part of the system, based on its functions, from which follow certain criteria to materials and construction of system. For the membrane in FC these criteria are:
o Proton conductivity;o Electron insulator;o Mechanical stability;o Chemical stability;o Thermal stability;o Water absorption.
2.3. Proton conductivity in membranes
It is necessary to understand proton transport mechanism in membranes to improve polymer electrolyte. This topic can be divided into two parts: proton conductivity/transport and influence of membrane`s structure on transport properties.

10
Proton conductivity mechanisms in liquid mediaIn acid water solution proton is bound to water molecule and exists as
hydroxonium ion H3O+. The proton mobility in such media is considerably
higher comparing with other ions in solution. Potasium ion has the same size and same charge as hydroxonium, but,their mobility differ about 7 times at 298 °C. It mean that proton transport in water is based on other principles [12-15].
German chemist Grotthuss in 1806 proposed „proton chain transport mechanism“ to describe ion conductivity in water solutions [16,17]. His idea was that charge in solution is moving not like hydroxonium, but proton is jumping from one water molecule to another, when molecules collide. This transport mechanism explains why size of H3O
+ ion is not influencing the mobility of proton (Fig. 2.2) [16, 17].
Fig. 2.2. Schematic explanation of Grothuss proton transport mechanism in solution.
German chemist and physicist Huckel improved Grothuss mechanism in 1928 suggesting the dependence from orientation of water molecules [18]. It was already the basis to create diffusion theory.
Proton conductivity mechanisms in polymer membranesWater associated in membranes is divided in two types: molecules interacting
with sulfonic groups (SO3H) of polymer (e.g. Nafion), and molecules far enough from polymer side chains to behave like free bulk water [19-22]. Important is the number of water molecules around SO3H as it was shown during water absorption modelling in Nafion memebrane [23]. When there are 3 molecules of water, the proton has chance to spontaneously dissociate; when number of water molecules increases till 6, the full proton dissociation from sulfonic group is expected.
The surface water in polymer connected with sulfonic groups is described with higher proton activation energy, resulting in slower transfer rate. The density of sulfonic groups on the surface of pores in polymer and the structure and size of pores define proton transition from surface water to bulk water in pores [24]. Increasing the amount of absorbed water in polymer, the pore size also increases leading to dominating the proton transport in bulk water.

11
Polymer membrane’s structureIn 1960s the the first model appeared that at least partially explained proton
transport mechanisms in polymer membrane: Eisenberg model [25]. According to this theory two types of structures exist in polymer: in one case negatively charged ions are gathered in separate regions, in other case negatively charged ions are grouped in agglomerates or clusters (Fig. 2.3). In Year 1970 Eisenberg published extended explanation, introducing multiplets, where only several ion couples are; and clusters, with a lot of ion couples [25].
Fig. 2.3. Proton conductive polymer structures [25].
Eisenberg’s model later was developed by Gierke et all. (1977) suggesting the presence of liquid (water) in clusters with absorbed ions laying foundations of their cluster network model (Fig. 2.4) [26]. Later Gierke and Hsu (1985) described the dependence of variations in cluster sizes from the form of ion, equivalent mass and amount of absorbed water [27].
Fig. 2.4. Schematic inner structure of Nafion polymer according to Gierke [27].
New material research methods allowed creating other similar models for describing solvent (water) absorption and with this process connected changes in polymer structure, but these models have no great difference to previously described ones.
Water balance in fuel cellThere are two sources of water in fuel cells: one is reaction product, other –
from humidified fuel gases. Losses mainly are created on the cathode side, where water is carried away with non-reacting oxygen flow. Balancing processes are water transport between two electrodes [28, 29]. To describe partial pressure of water in FC the following equation is used:

12
, (3.1)
where P is water vapour partial pressure according to index, λ is stehiometric coefficient, which is bounding amount of used gas to needed amount on an input.
Using formula 3.1 one can evaluate when FC will work without additional humidification (only on water from reactions) by putting in appropriate values. According to this data FC working temperature till 60 °C allows system to function without additional fuel gas humidification by finding appropriate circumstances as shown in Fig. 2.5 [28].
Fig.2.5. Relative humidity of exit gases of fuel cell dependence on working temperature in case of stehiometric coeficient 2 and 4 and working pressure 100 kPa [28].
2.4. Current limiting factors in fuel cells
The basic function of fuel cell is to produce electrical current accordingly energy balance of fuel reactions on both electrodes. Classic model for simple exothermic reaction determines that there is a potential barrier to overcome for reactions to happen and resulting energy is depending from difference between energy levels of the system (Fig. 2.6). In case of small probability for gas molecule to get necessary activation energy the reaction rate is slow.
To increase reaction rate in FC following possibilities exist:• To use catalyst,• To increase temperature,• To increase electrode area.
13
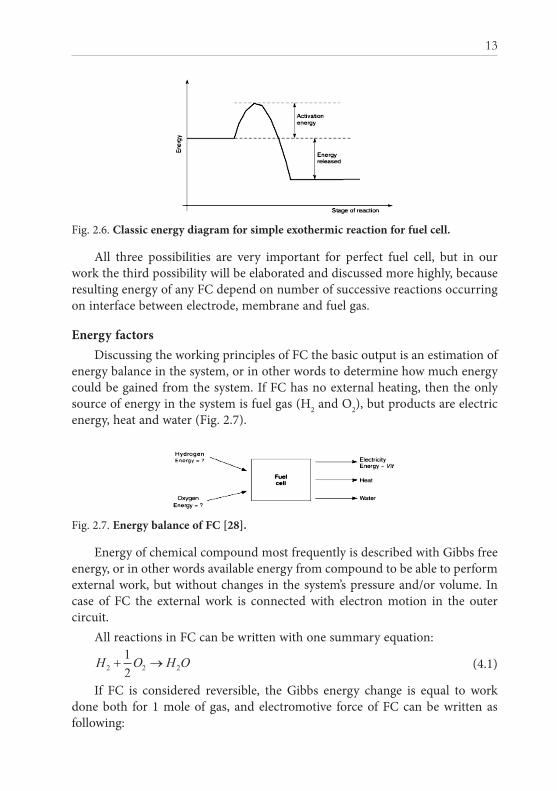
Fig. 2.6. Classic energy diagram for simple exothermic reaction for fuel cell.
All three possibilities are very important for perfect fuel cell, but in our work the third possibility will be elaborated and discussed more highly, because resulting energy of any FC depend on number of successive reactions occurring on interface between electrode, membrane and fuel gas.
Energy factorsDiscussing the working principles of FC the basic output is an estimation of
energy balance in the system, or in other words to determine how much energy could be gained from the system. If FC has no external heating, then the only source of energy in the system is fuel gas (H2 and O2), but products are electric energy, heat and water (Fig. 2.7).
Fig. 2.7. Energy balance of FC [28].
Energy of chemical compound most frequently is described with Gibbs free energy, or in other words available energy from compound to be able to perform external work, but without changes in the system’s pressure and/or volume. In case of FC the external work is connected with electron motion in the outer circuit.
All reactions in FC can be written with one summary equation: (4.1)
If FC is considered reversible, the Gibbs energy change is equal to work done both for 1 mole of gas, and electromotive force of FC can be written as following:

14
(4.4)
where E is electromotive force, – Gibbs free energy difference, F – Faraday constant, z – electron number, which are participating in reaction from 1 molecule (for hydrogen z=2).
In praxis system’s electromotive force is always smaller then theoretically possible, because of several processes in FC, which are not considered in theory: (1) activation loses; (2) fuel and electron transport through membrane; (3) Ohmic loses in outer circuit; (4) mass transport through membrane and concentration losses.
Activation losses are describing processes on electrodes, when part of the voltage is used for electron transport from/to electrode. Second point is reflecting possibility for part of the fuel to come through membrane during working of FC without reactions, or case when membrane has some very small electron conductivity. Ohmic losses are representing well-know phenomena of resistance towards transport of electrons or ions through crystal lattice and are described by Ohm law. Because on both electrodes the gas is used during functioning, it results in pressure drop, and this phenomena generates the above mentioned fourth type of losses.
15
3. Sample synthesis and experimental methods
3.1. Materials
Nowadays most commonly used polymers for hydrogen technologies (electrolizers, fuel cells) are Nafion’s family polymers with similar chemical structures, but they still have several disadvantages, making the search for new materials actual for scientists also today. The one problem for Nafion type polymers is dehydration, second - comparably low mechanical stability at working temperatures (80°C). The dehydration lead to decrease of proton conducting channels, but low mechanical stability enables possibility of direct connection between electrodes. As one of the possible alternatives to Nafion polymer is another class of sulfonated polymers with different skeleton structure but with same proton conducting mechanism.
Frequently polymers, submitted to sulfonation has one more advantage – they are commercially available and applied in other branches, what mean that they are available in sufficient quantities and the price is acceptable.
Poly(aril-ether-keton)s are polymer group with a benzene ring as repeating molecular unit. Benzene ring is chemically stable in acids allowing the sulfonation of polymer without structural degradation. This polymer class has excellent chemical stability, perfect mechanical and thermal propertiesy. Poly(ether-ether-ketone) (PEEK) has one more property, that contributes to using this polymer for sulfonation and creation proton conductive polymer: PEEK is hydrophobic. From large scale production point of view the PEEK has also advantage because has no fluorine,in his backbone like Nafion. In all conscience the lack of fluorine can’t be considered as disadvantage because the fluorine increases chemical stability of polymer.
Poly(ether-ketone-ketone) is comparably new polymer with good thermal stability and appropriate chemical and mechanical properties to be used in hydrogen technologies.
In this work several compounds were used, both as reagents in chemical reactions and as part of samples to be synthesized. All the reagents were purchased from Aldrich and used without additional processing, excepting poly(ether-ether-ketone) which was obtained from Victrex. Sulfonated poly(ether-ketone-ketone) (SPEKK) was synthesed in GKSS (Germany) and used in this research with their kindly permission, but sulfonated poly(ether-ether-ketone) (SPEKK) was sulfonated from PEEK by author. Next chemicals and compounds were used in this work:

16
• SPEEK – proton conducting polymer;• SPEKK – proton conducting polymer, synthesized in GKSS Polymer
Institute with sulfonation degree 63%;• Aniline hydrochloride;• PANI – polyaniline;• PVDF – polyvinilidenefluoride;• DBSA – dodecylbenzenesulfonacid;• Organic solvents:
o DMSO – dimethylsulfoxide;o DMAC – dimethylacetamide;o NMP – N,N-methylpirolidone;
• Sulfuric acid• Phosphorous acid;• Peroxide;• Iron.
3.2. Sample synthesis
We used most of polymers as purchased without any additional processing. But for several of them additional treatment was necessary to make desirable polymer samples. One of the reaction, which we used in this work, is sulfonation: addition of sulfon-groups to polymer chain. Another synthesis procedure is polymerization, when polymer is created from monomers. Sulfonation reaction allowed to make sulfonated form of poly(ether-ether-ketone) (Fig. 3.1.)
Fig. 3.1. Sulfonation reaction for PEEK polymer.
To produce sulfonated forms from aromatic compounds the different methods can be used, differing only with reagents used:
• Concentrated sulphuric acid;• Reagents based on sulphur trioxide;• Acetyl sulphate;• Chlorine-sulfonic acid. Sulfonation reaction is reversible (Ar – elementary unit of polymer chain):
Ar-H + H2SO4 ↔ Ar-SO3H + H2O

17
This means that in case when an equilibrium is moved to the right, the sulfonated polymer is loosing some sulfongroups. Such a change results in reduced proton conductivity because the number of sulfongroups determines the factor of proton conductivity mechanism. To control sulfonation degree, several methods are used:
• Temperature;• Acid concentration;• Time.Temperature determines the speed of reaction, what means that at higher
temperature more precise should be reaction timing to produce equal results each time. This is main disadvantage of sulfonation. In our case under “sulfonation result” we mean sulfonation degree (SD) – the number of repeating polymer chain units with sulfonic groups (SD = 100% when one sulfonic group belongs to each polymer chain unit).
According to experimental results published by Nunes group [29] for poly(ether-ether-ketone) to reach sulfonation degree 50%, the different temperatures result in different reaction time, for example the 8 hours at 50° and 40–48 hours at room temperature. In our work we made sulfonation with sulfuric acid because of reaction simplicity and small number of additional reagents. Acid concentration should be high, but not 100% (97 – 98%), in other case polymer is either too stable to react and products of reaction are without cross-linking. The same is in respect other method, e.g. when chlorsulfuric acid is used for sulfonation reaction. In our work it was decided to make sulfonation reaction at room temperature, when average difference in reaction time (till 1 hour) results in very small changes in polymer sulfonation degree. Method was next: raw polymer is put into sulphuric acid at chosen temperature and kept steering for required time with the help of magnetic steerer. Obtained solution is spilt over ice, decreasing the concentration of acid. Now it is possible to filter out sulfonated polymer because polymer is unsolvable in weak sulfonic acid,.The reaction product is rinsed in deionised water to get rid of acid excess and then dried. After all procedures the polymer is ready for preparation of sample.
The simplest method to prepare polymer membrane sample was used: casting onto glass substrate. The polymer is solved in apropriate solvent, heated and simultaneously mixed with the help of magnetic agitator. When homogeneous liquid is obtained, it is cast over clean smooth and horizontally positioned glass plate, which is kept at chosen temperature. It is recommended to make experiments ventilated box. After solvent has evaporated, the polymer layer is obtained on glass, which is rinsed in deionised water and left in it for 24 hours. Then sample is dried in vacuum oven.

18
From SPEKK polymer the next four series of samples were prepared with following composite compositions:
SPEKK:PVDF=100:0 w%; SPEKK:PVDF=95:5 w%; SPEKK:PVDF=80:20 w%; SPEKK:PVDF=0:100 w%.In each series the three composite polymer samples were synthesized with
same composition, for example SPEKK:PVDF):PBI= (80:20):1.Another aim of this work was to make the sample from composite
membrane, where in-situ polymerization of aniline was performed. In this work ammonium persulfate is used, and in this case the normalized relation between aniline and oxidant could be written as follow:
Relation can rewrite taking into account molar weights of both compounds (Maniline= 128,5 g/mol; Moxidant=228 g/mol). In this case amount of oxidant depending on mass of aniline is determined by formula:
Electron conductive or nonconductive forms of resulting polyaniline has different colours (green and blue accordingly), and composite polymer SPEEK with aniline has golden colour. It mean that the result of synthesis is clearly seen from the colour of a sample. To finalises the synthesis, the membrane was prepared from composite SPEEK + aniline, and placed in distilled water. Vessel with membrane and water was placed in ice water and steered with the help of magnetic steerer. Oxidant is slowly introduced to vessel with membrane. After definite time the membrane is taken out of vessel, rinsed in distilled water and dried. In case of successful synthesis the composite-membrane sample is obtained and characterized to get information on material’s structure, composition and other parameters.
3.3. Experimental analysisSpectroscopic structural analysis
Infrared spectroscopy is frequently used to analyze composition and structure of organic compounds, because it allows identifying molecular groups in compounds, allows to follow the concentration changes of them caused by changing parameters of synthesis. Because organic compounds consists mainly

19
from hydrogen and carbon atoms it is very important to identify not only composition, but also the positions of selected atoms in molecules. This makes infrared spectroscopy suitable for analyzing organic compounds: one can get information not only on molecule’s group rotation and vibration spectrum of a concrete bound between atoms, but also shows influence of neighbouring atoms, which are not directly participating in bound, thus giving information also about the places of atoms. Signal with and without sample is compared and sample’s spectrum obtained; it is analyzed to get all the needed information on compound, bounds and interaction using available information on different compound spectrums from data bases.
During sulfonation of PEEK the one hydrogen atom in -CHx is replaced with sulfonic group SO3H. When comparing spectra of PEEK and SPEEK, both the new peaks and changes in previously observed peaks are observed indicating the influence of SO3 group,. For SPEEK the most clearly observed changes in spectrum are:
• C-C bound’s peak at 1490 cm-1 decreases intensity and new peak appears at 1470 cm-1 as result of sulfonation of PEEK;
• Peak at 1020 cm-1 appears, indicating S=O bound;• Symmetrical and asymmetrical vibrations of O=S=O bounds’ peaks
appear at 1080, 250 un 950 cm-1.Furje transform infrared spectroscopy is a method, which is non-
destructive, with good sensitivity and quite fast. In this work Furje transform infrared spectroscopy is used to ascertain if sulfonation reaction was successful. Measurements were made at the Institute of Solid State Physics with Bruker Equinox 55 FTIR spectrometer. Both reflection and transparency methods were used, because raw polymer PEEK is non-transparent, but SPEEK membrane is transparent. Spectrum was analyzed to find peaks, connected with changes in structure caused by sulfonation reaction .
Determination of sulfonation degreeSulfonation degree is one of the most important parameters for polymers
conducting protons with the help of SO3H groups. Knowing it allows comparing polymers and results between different researchers.
Two methods: elemental analysis and thermogravimetric measurements were used in this work to determine the degree of sulfonation. First method was used for samples synthesized in Germany during my stay there, and were made in Portugal. Thermogravimetric analysis was done for SPEEK + polyaniline samples in the Institute of Solid State Physics.
With the help of elemental analysis it is possible to determine the weight of selected elements in compound. For this measurements the Perkin Elmer,

20
model 2400 CHN device was used, and concentrations of hydrogen, nitrogen, sulfur and carbon in samples determined. This device is based on Pregl-Dumas method, when sample is burned in pure oxygen till oxidises to CO2, H2O, N2 and SO2. Mixture of resulting gases is analyzed by chromatographic column with detector on it’s end to select gases in mixture. Oxygen amount in sample was determined using pyrolysis in helium and hydrogen (95%:5%) at 1000 °C temperature, when all the products containing oxygen are transformed into carbon monoxide CO allowing to calculate oxygen part in compound.
The following considerations were made to analyze above results and calculate sulfonation degree:
• Sample is pure with no additives, so all the elements are only from synthesis result (partially this assumption is proven by nitrogen concentration);
• 100% sulfonation degree means that there is only one sulfonic group on each repeating unit of polymer molecule.
After appropriate calculations it was concluded that 100% sulfonation degree results in 8.7 w% of sulphur. Taking it into account it is possible to determine the degree of sulfonation using simple equation:
8.7 → 100%a → x%where a is measured amount of sulphur in w%. Thermogravimetric analysis gives information on mass changes during
heating the sample. It is known, that at 300 °C due to degradation the SO3H groups are disappearing, this leads to possibility to determine sulfonation degree. Thermogravimetric analysis method will be described later.
Water absorbtion Water absorption is important parameter for membrane, because water
amount determines both proton conductivity and mechanical stability. For example, proton conductivity is explained with mechanism were proton hops between absorbed water molecules. Mechanical stability of membrane is connected with changes of geometrical size due absorbed water (swelling up). In the FC block the membrane is under pressure of fuel gas, therefore unstable geometrical size and lower mechanical stability are increasing possibility for membrane to break up.
The simple method is used to measure water absorption in membrane: a piece of membrane (typically around 1 cm2) is weighted and placed in distilled water for selected time (24 hours in scientific articles) at either room or close to working (60°C) temperatures. After 24 hours the sample is taken out of water,

21
sweep away excess (non absorbed) water from the surface with the help of paper towel and weighted once more. Water absorption is calculated accordingly formula:
Chemical stability or Fenton testMain reason for degradation of membranes in FC is two chemically active
radicals: peroxyl- (HOO•) and hydroxylradical (HO•). Another possible reason for degradation is hydrogen peroxide H2O2 arising near at catalyst during oxygen discharge on anode. When such active compounds are contacting with membrane, irreversible degradation can be initiated. These processes are the reason for necessity to test each new membrane material for its chemical stability against active oxygen compounds mentioned above.
One from most frequently used is Fenton test based on peroxide reaction on catalyst (iron Fe(II) or titanium Ti(III)):
During Fenton’s test the membrane is put into peroxide H2O2 and iron Fe water solution for 1 hour at 60°C temperature. The weight of sample is measured before and after and results are compared. If membrane lost weight or is broken into pieces, then its chemical stability is not very high in the presence of active oxygen.
Such compounds as SPEEK, which have no fluorine atoms in polymer chai, has greater risk to degrade because of active oxygen radicals, due to fact that C-H bound has lower energy then C-F bond. This reason has created opinion, that no-fluorine polymers are less stable in FC. But real tests in FC with a SPEEK membrane had shown excellent results that SPEEK membrane can work even for longer time compareing with Nafion. This one of the reasons, why conservative scientists are doubting Fenton’s test results as good criteria for determining the chemical stability of polymer membranes. But nowadays there is no alternative method to test membrane materials, and because of this Fenton’s test is still widely used to check chemical stability.
Thermoanalytical methodsThermogravimetric analysis (TGA) is widely used to determine compostion
and phase changes in different materials (metals, glass, ceramics, polymers and more):
o Thermal stability;o Composition;

22
o Degradation dependence on temperature and its kinetics;o Behaviour dependence in some gas atmosphere (e.g. in oxygen);o Water or amount of volatile compounds in sample;o and other.During TGA analysis the variation of mass change from temperature is
measured in controlled atmosphere. Typically TGA devices can work till 1000 °C, there is also possibility to work at temperatures below RT. it is possible to get more information on degradation,If exit gas could be analyzed (e.g. with gas chromatography, IR spectra registration device or other gas sensors), then e.g. what compounds are produced during degradation at certain temperature, that is frequently used during research of polymers. Changes in mass could appear for several reasons:Mass reduction:
o Degradation – bond between compounds and elements disappear;o Evaporation;o Chemical reaction of reduction type (e.g. in hydrogen atmosp-
here);o Desorbtion;
Mass increase:o Oxidation processes;o Absorbtion.
All this processes can be identified from TGA graphics and allow to determine material behavior at given temperatures.
Fig. 3.2. Sample DSC measurement result with glass transition, crystallization and melting processes.
Another widely used investigation method for determining material behavior dependence on temperature is differential scanning calorimetry (DSC). This method allows to define amount of energy needed to increase sample’s temperature till chosen value. Such analysis provides information on phase

23
transition and reactions in sample, and also helps to estimate sample’s components compatibility; all this properties are important for organic compounds. Typical processes in polymer are following: glass transition, crystallization and melting, all are shown on Fig. 3.2.
In this work TGA analysis was done in ISSP UL with SHIMADZU DTG-60 device in nitrogen atmosphere; DSC analysis was done in GKSS with DSC 204 Phoenix devise in argon atmosphere.
Surface analysisTo analyze surface microscopy was used: scanning electron microscope
(SEM) and atomic force microscope (AFM). First one was used for surface and cross-section relief analysis, second one for surface relief and potential measurements.
In this work I used LEO Gemini 1550 VP scanning electron microscope and MultiMode scanning atomic force microscope (one of the EFM types) with Nanoscope4 program from Veeco (now Bruker AXS). Samples for SEM measurements were prepared in nitrogen atmosphere. AFM measurements were made in room atmosphere without additional controlling of it for all measurements; also surface phase (PhaseImaging™) was determined during AFM measurements.
Conductivity measurementsProton conductivity can be measured with several different methods; in
my work I used alternating current impedance spectroscopy and four electrode method. First method allows to measure conductivity through-plane, which is also working direction. Second one is more simple in realization, but proton conductivity is determined parallel to surface (so called in-plane). On one side polymers are amorphous enough, so properties are typically isotropic in all directions. On the other side membrane proton conductivity is dependent on number of channels available for proton transport, and probability to create longer channel is lower, so shorter dimension could be favorable.
Alternating current or electrochemical impedance measurements were made with two electrodes, creating system, which is very similar to membrane-electrode system in FC (Fig.3.3). To measure membrane’s proton conductivity created system is connected to impedance spectrometer Zahner 1M6 (ZAHNER-Elektrik GmbH & Co.KG). Measurements were made in the interval of 10 to 106 Hz, impedance value was determined at phase angle φ equal to zero. Measurements results were processed with the help of PC, acquiring both proton conductivity dependence on temperature and impedance spectra for better describing of processes.

24
Fig.3.3. Cross-section of the two electrode cell for conductivity measurements.
Second method, which was used to determine conductivity of samples, was four electrode method using BekkTech cell (BekkTech LLC). Main advantage of this method is comparably easy technical realization: there is no need to secure good contact between parts’ surfaces, taking into account the fact that membrane could have some variations in thickness.
Fig.3.4. Four electrode method’s schema (left) and BekkTech cell (right).
Four electrode measurement’s cell’s body is made of thermostable material (PTFE), inside four platinum electrodes and platinum strainers are placed (Fig. 3.4). during measuremets electrochemical potentiostat Voltalab PGZ 301 (Radiometric Analytical) was used, which was providing necessary constant current, chosen by user via PC program for each concreate cycle. Voltage drop was determined by DVM850BL multimeter (Velleman Inc.) from the other

25
side of sample membrane. Results were treated according to known algoritm to calculate membranes conductivity or resistivity.
Both methods are determining sample’s conductivity dependence on temperature, which very well describes material potential in FC membrane branch. From this information with the help of Arrhenius coordinates it is possible to calculate charge transfer reaction’s activation energy.

26
4. Results
4.1. Research on a new materials for proton conductive membrane
During my intership at Polymer Institute at GKSS Forschungszentrum GmbH (Germany) idea occured to improve comparably unknown material poly(ether-ketone-ketone) (SPEKK) with adding polyvinylidene fluoride (PVDF). SPEKK polymer by its structure is similar to SPEEK, which already has shown itself as a possible Nafion polymer competitor because of the better chemical stability in FC due to the C=O bound influence. Because SPEKK is less mechanically stable compared to SPEEK, it was decided to add another polymer – polyvinylidene fluoride. PVDF has good chemical stability, small water absorbtion and high enough working temperature diapazone (at least till 100 °C, precize value depends on concreate variety). Chemical stability of PVDF is based on the fact that it is fluoropolymer with high energy C-F bound, making it stable in oxydants (e.g. oxygen). Results of the synthesis showed neccesity of the third polymer for stabilizing structure, and for this purpose polybenzimidazole (PBI) was added. Because SPEKK sulfonic groups are hydrophilic and PVDF is hydrophobic, which can cause not suffiecient interraction between polymers, PBI could improove interraction due to having both hydrophilic and hidrophobic parts. This could be illustrated by structure of the used polymers:
SPEKK polymer structural formula
PVDF polymer structural formula

27
PBI polymer structural formulaThere were 5 composite polymer composition series made at different
temperatures: SPEKK:PVDF=100:0; 95:5; 80:20; 0:100 w%; SPEKK:PVDF):PBI= (80:20):1.
As a possible polymer for proton conductive membrane in FC also modified poly(ether-ether-ketone) was investigated.
4.1.1. Water absorptionResults of water absorption for polymers and composite polymers
samples had some difference also in case of same composition due to different temperatures during casting, so both maximal and minimal value is presented (Fig. 4.1). Pure PVDF sample’s water absorption is below 3 w%, so it is not shown.
When samples without and with 5 w% PVDF are compared it is observed that in case of adding second polymer water absorption increases till about 1.5 times. At room temperature, when water amount is below 60 w%, the difference is not as dramatic as for 60 °C, which is closer to working temperatures in FC, when difference is much more significant reaching 40 w%. This means that addition of 5 w% PVDF to SPEKK polymer is increasing possibility to mechanical strains be high enough to damage membrane. Positive moment in this case is fact that casting temperature influence became smaller, so difference inside composition is not as high as it was.
Fig.4.1. Maximal and minimal absorbed water amount for membrane samples based on SPEKK composite polymer.

28
When SPEKK and SPEKK with 20 w% of PVDF samples are compared the opposite tendency is observed: amount of absorbed water has decreased in composite membrane. Also SPEKK with 20 w% of PVDF is absorbing maximal amount of water, which is not changing during furtherer time. Pure SPEKK is continuing absorbing water even after 4 – 6 days, but in slower rate compared to rate at the start. PBI adding has not caused significant water amount changes, keeping them inside error gap for the measurements.
Water absorption of SPEEK polymer was measured with the help of TGA and compared with Nafion (F-212) membrane (Fig. 4.2). Results of this investigation show that both membranes without placing in water just from atmosphere are able to absorb about 10 w% of water. When temperature is increased Nafion membrane is starting to lose water at lower temperatures compared with SPEEK sample. Increasing temperature further in was observed that Nafion membrane loses water at greater rate, so already at 100 – 120 °C it has very few water inside compared to SPEEK.
Fig.4.2. SPEEK and Nafion samples absorbed water amount results with thermogravimetric analysis.
From the results of water absorption of Nafion and SPEEK samples it can be concluded that membrane based on SPEEK polymer is able to work at higher temperatures while not loosing great amount of water compared with commercially produced Nafion membrane.
Materials suitable for working at higher temperature are allowing fuel cell system to work at better efficiency because of higher temperature. Cross-linking is creating additional bounds between molecules making material’s structure more stable and allows losing less bounded water.

29
4.1.2. Chemical stability
According to Fenton test samples’ mass has changed for both one polymer samples and composite polymer membranes (Fig. 4.3).
Fig. 4.3. Results of Fenton test for membranes based on SPEKK.
Taking into account all the typical errors for this method, the following conclusions could be declared: SPEEK membrane’s mass has not changed; PVDF and SPEKK membrane with 5 w% of PVDF has increased it’s weight, samples with 20 w% PVDF mass change is inside error gap, so no significant change were observed for this type of samples. Based on Fenton test from the two compositions one was chosen, with 20 w% PVDF polymer, to focus in further research, because it showed better results.
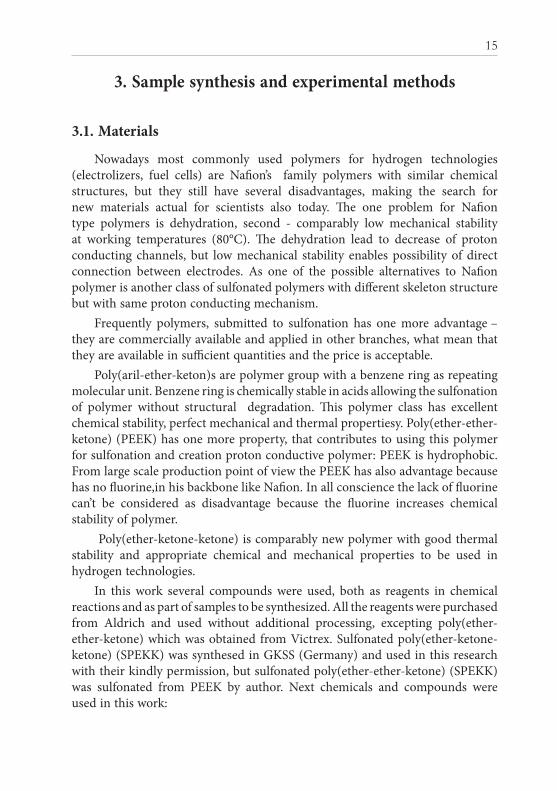
4.1.3. Proton conductivitySPEKK and SPEKK with 20 w% PVDF polymer proton conductivity was
determined in two-electrode system, using porous (gas permeable) electrodes, carbon cloth with catalyst on both sides. Result of the measurements show, that conductivity is below 20 mS/cm (Fig. 4.4).
Pure SPEKK polymer membrane’s conductivity at lower temperatures is smaller then composite membrane’s one, but it grows more slowly, and at 80 °C both membrane have about the same value of conductivity. Faster increase could be explained in different ways, e.g. taking into account water absorption’s dependence on temperature:
• Due to PVFD hydrophobia water is distributed in more optimal way;• Due to SPEKK and PVDF polymers weak interaction (this statement
is based on results from DSC analysis and microscopy from sections to follow) composite membrane has polymer grains, and around grain borders new water channels, increasing proton conductive channel number and thus proton conductivity.
30
Fig.4.4. Dependence of the proton conductivity on temperature for samples with composition SPEKK:PVDF=100:0; 80:20 w%.
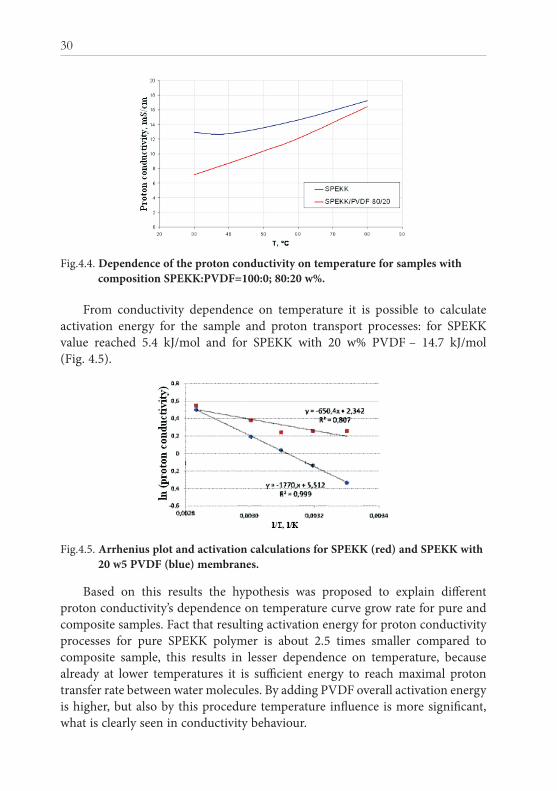
From conductivity dependence on temperature it is possible to calculate activation energy for the sample and proton transport processes: for SPEKK value reached 5.4 kJ/mol and for SPEKK with 20 w% PVDF – 14.7 kJ/mol (Fig. 4.5).
Fig.4.5. Arrhenius plot and activation calculations for SPEKK (red) and SPEKK with 20 w5 PVDF (blue) membranes.
Based on this results the hypothesis was proposed to explain different proton conductivity’s dependence on temperature curve grow rate for pure and composite samples. Fact that resulting activation energy for proton conductivity processes for pure SPEKK polymer is about 2.5 times smaller compared to composite sample, this results in lesser dependence on temperature, because already at lower temperatures it is sufficient energy to reach maximal proton transfer rate between water molecules. By adding PVDF overall activation energy is higher, but also by this procedure temperature influence is more significant, what is clearly seen in conductivity behaviour.

31
SPEEK polymer membrane’s proton conductivity was determined using both two electrode and four electrode conductivity measuring methods, which are giving information about properties perpendicular to surface and in its direction accordingly. Four electrode method has an easy way to secure temperature and relative humidity around sample. In case of two electrode method porous electrodes were used with carbon cloth with catalyst to ensure measurement possibility, e.g. relative humidity. In both cases during the experiments relative humidity in measurement chamber was kept at 100%.
In case of four electrode method conductivity is steadily increasing with temperature; using Arrhenius coordinates this sample could de described with activation energy of 7 kJ/mol (Fig.4.6).
Fig. 4.6. Cross-linked SPEEK membrane’s proton conductivity dependence on temperature in linear (up) and Arrhenius(middle) coordinates and results of 2 electrode method (down).

32
As it is seen from measurements’ results for SPEEK membrane both two electrode method with information on conductivity in perpendicular to surface direction and four electrode method with parallel to surface direction are providing similar results. Measured point divergence from value is inside device’s error (relative error smaller then 1 %) and to explain this also several points could be mentioned: membrane’s structure features, temperature’s, absorbed water amount’s minor fluctuation, e.g. due to evaporation. At lower temperatures smaller conductivity with four electrode method could be explained by the fact, that at these temperatures it is not sufficient water to create equal amount of proton conductive channels. Overall results are close enough to be convinced that it is possible to use four electrode method to determine proton conductivity in our membranes.
4.1.4. DSC analysis
Fig.4.7. Normalized results of the DSC analysis for polymer membrane samples for temperature from 100 to 250 °C.
Differential scanning calorimetry (DSC) analysis of synthesised samples was made in the temperature interval 100 - 250 oC, where both PVDF polymer crys-tallization (170 oC) and SPEKK polymer glass transition (169 oC) are happening. For easier comparison all the curves were normalized, because crystallization of PVDF polymer has higher energy compared to the observed one for samples with SPEKK polymer. From the curves following facts are noticed:Pure PVDF polymer sample has well-observed exothermic crystallization
maximum at 170 °C;

33
Pure SPEKK polymer sample has glass transition at 169 °C;Composite polymer membranes from SPEKK and 20 w% PVDF and
SPEEK with 5 w% PVDF prepared at 90 °C have both phase changes (crystallization and glass transition);
Composite membrane from SPEKK with 5 w% of PVDF prepared at 105 °C has more complicated behaviour representing processes in the sample.
4.1.5. Microscopy of the surfacesAccording to results of scanning electron microscope observed surface
of composite membranes has spherical objects, which are identified as PVDF polymer. At smaller concentration of PVDF (5 w%) these spherical objects have greater diameter, but its number is smaller. When 20 w% of PVDF polymer is added to SPEKK diameter is decreased, but number at surface is increased (Fig.4.8).
(a) (b) (c)Fig.4.8. Membranes’ surface (a) SPEKK:PVDF=100:0; (b) SPEKK:PVDF=95:5
(sintezēts pie 90 °C); (c) SPEKK:PVDF=0:100 w%. (Increased 5000)
When membrane samples’ cross-section was investigated by SEM (Fig.4.9) it was concluded that SPEKK has very small grains (about 0.05 μm) in its structure, PVDF at the same time is observed in grains with the diameter at least 0.5 μm. When samples with different amount of added PVDF polymer (5 and 20 w%) are compared, it was concluded that higher PVDF polymer content is resulting in more homogeneous distribution. Also differences of PVDF grains’ structure were noticed: closer to spherical ones are observed in samples with 5 w% of PVDF, but in case of 20 w% additive of PVDF form has larger dimension in one direction. This fact could be explained with different polymerization from solution. Also grain structure in case of 20 w% PVDF is more dense, which well corresponds with water uptake results.

34
Fig.4.9. Cross-section of a different membranes taken by SEM: (a) SPEKK:PVDF=100:0; (b) SPEKK:PVDF=95:5; (c) SPEKK:PVDF=80:20; (d) SPEKK:PVDF=0:100 w% (Increased 50 000).
For better understanding the influence of conditions during solvent evaporation on structure also composite SPEKK:PVDF=95:5 w% membrane synthesized at 105 oC was analyzed (Fig.4.10). Cross-section’s surface of these samples is less unified and less homogeneous, reflecting fast solvent evaporation which produced such structure. This allows to make a conclusion that temperature of 105 °C compared to 90 oC is too high to produce membrane of a good quality and solvent is evaporating too fast, not allowing polymers to get adopted to new situation.
Fig. 4.10. Surface (left) and cross-section (right) of SPEKK:PVDF=95:5 w% polymer
membrane’s sample, which is made at 105 °C (Increased 5000).

35
To improove composite samples quality and make it less dependent on producing conditions it was decided to make another serie by addind small ammount of third polymer – PBI, which due to its structure is a candidate to improve compatibility. Trhee polymer samples were synthesised at two different temperatures: 60 °C and 100 °C and morfology was investigated with the help of SEM. Results of this investigation for samples synthesised at 60 °C show the same structure as two polymer samples synthesised at temperature below 90 °C, but 100 °C are very close to two polymer samples synthesised at higher temperatures (till 120 °C).
Fig. 4.11. Results of SEM microscopy of a composite samples of a three component
sample prepared at 60 °C: surface (left) and cross-section (middle and right).
Results of this measurements show that adding PBI polymer is resulting in concentration of PVDF polymer near to the surface of the membrane (Fig. 4.11). Synthesis temperature (60 °C and 100 °C) has no significant influence on three polymer morfology, main difference is in fact that lower temperature is resulting in slightly bigger grains of PVDF and near surface this polymer has porous structure, but at higher temperatures segregation of composite membrane’s polymers in layers is more significant.
For analysis of the synthesised membrane’s surface also another type of microscopy was used – atomic force microscope. Theoretical advantage of this method is possibility to investigate surface at higher increase rate and provides more detailed information on different phases. AFM results of surface investigation for pure SPEKK show small fluctuation in highth and phase, in last one difference is about 5°, which means that material is homogeneous. For sample with PVDF changes in both diagrams are much more significant: for heighth it reaches 600 nm, but for phase – 20° (Fig.4.12). from the analysis of the results of measurements it can be concluded, that places with maximum heighth also have maximum phase difference and are assosiated with PVDF.

36
Fig.4.12. Surface images from AFM microscope for SPEKK (up) and composite membrane from SPEKK with 20 w% PVDF. Left side is relief, right phase.
Fig.4.13. AFM images of SPEKK with 20 w% of PVDF composite membrane: surface
profile (left), phase (middle) and surface potential distribution (right).
Investigating with the help of AFM surface potential of a composite polymer sample from SPEKK with 20 w% of PVDF on surface potential image (Fig.4.13, right) some areas are identified like SPEKK polymer, but on surface and phase images these places are identified like PVDF polymer. Main problem with measuring surface potential is that resulting image of the two polymers composite sample has comparably low contrast, typically reaching 0.1 – 0.2 V. This can be esplained with the fact that polymers dissipate charge, meaning that interraction between polymers is quite significant. But even with uch a contast

37
surface potential could be used to determine polymer structure in a layer near surface in case of lack of other methods.
4.1.6. IR spectroscopic measurements to determine sulfonation of polymerInfrared spectroscopy was used to determine if sulfonation reaction was
succesful for membrane material synthesised from PEEK polymer. For this purpose both polymers were investigated: PEEK polymer to have spectra berofe reaction and resulting SPEEK polymer to compare results. Because PEEK is solid untransparent polymer it was decided to use refraction method of infrared spectroscopy, and spectra were obtained with the help of collecting and avereging method. Sulfoanted form of PEEK was taken as membrane, that is transparent, allowing to use light signal transparency method. Due to different method relative spectra intensity can’t be compared and spectra were normalized for better interpritation (Fig. 4.14).
Fig.4.14. Refractive/transmittence infrared spectra of SPEEK and PEEK polymers.
In our work we observed several peaks, paying more attention to C-C bond and its spliting into two peaks due to the influence of S=O bond after sulfonation of PEEK. For PEEK polymer at 1092 cm-1 peak in oscilation spectra was observed most probably representing ketone structure, because at this wave length C-C-C bond defirmation and C-C or C-(CO)-C valence oscillations are observed for this type of compounds [30].
Also successful sulfonation could be identified by new peaks in oscillation spectra, which represent new bond, which were created during sulfonation process representing sulfonic group.

38
4.1.7. Determining sulfonation degree with the help of elemental analysisDegree of sulfonation is describing amount of repeating units of the polymer
have sulfonic group. Sulfonation degree was determined by elemental analysis, which is allowing determining amount of some elements in compound (Tab.4.1). Measurements were made for one SPEEK polymer sample in different places.
Tab.4.1. Distribution of the elements in samples (in percents).Sample Carbon (C) Hydrogen (H) Sulphur (S)
SPEEK 1 63.36 3.67 4.85
SPEEK 2 63.66 3.62 4.83
Average 63.51 3.64 4.84
Typically sulfonation degree is determined by using sulphur and carbon relation, because sulphur is the element, which is introduced into compound by sulfonation. For purpose of getting to proportion it is needed to calculate theoretical distribution of the elements in case of sample with 100% sulfonation degree. To do this number of the atoms of each type is calculated, then atomic mass for each type is taken and overall mass of an element in compound calculated, and then distribution in percents is calculated (Tab.4.2). Next step is to use simple proportion to calculate sample’s sulfonation degree:
Tab.4.2. Distribution of the elements in SPEEK polymer with 100% sulfonation degree.
Element 1 atom mass, g/mol Number of atoms Mass, g/mol Percent from overall
mass, %
H 1 12 12 3.26
C 12 19 228 61.96
O 16 6 96 26.09
S 32 1 32 8.70
Kopā 368
According to calculations it is clear, that our SPEEK polymer has sulfonation degree of 56%, which was also awaited for this method as it was previously published for this synthesis method.
4.1.8. ConclusionsIn research of membrane materials two proton conductive polymer
materials were in focus. Based on SPEKK a polymer membrane sample has shown significant diversity in results and its repeatability; during synthesis

39
conditions play great role, especially temperature. Several samples of SPEKK polymer membranes showed good results, but at the same time others had opposite results even though both were synthesized at same conditions, making us not to continue research of this polymer.
Some of the composite samples cross-section microscopy showed possible usage of this material as porous structure for filtering of the hydrogen from complicated gas mixtures, e.g. biogas, which would have great influence on further development of the hydrogen technologies.
SPEEK polymer membranes’ samples showed good repeatability and better proton conductivity, which made us to decide to continue research with polymer and synthesize electrode material with mixed conductivity (both electron and proton) to be used in fuel cells.
4.2. Research on a new electrode material for membrane-electrode assembly
For the electrode in fuel cell material is needed which partly has the same properties as material for proton conductive membrane, e.g. chemical stability, proton conductivity. Also some more properties are required, which are representing difference in functions between electrode and membrane: electron conductivity, influence on catalyst (because electrode also is catalyst – platinum or other – carrier). Both similar and different requirements are needed to divide protons and electrons in material for systems (fuel cell) functioning and well explaining its main functions. Another important criterion for electrode is good contact with membrane to secure proton transfer from electrode to membrane.
Innovation of this work is to produce electrode material on the base of the membrane’s one. This would create similar structure and could establish better contact between the two parts; also this would allow creating method of connecting both parts without pressing them together.
Based on the previously observed results of the investigation of proton conductive materials for membranes in was decided to choose SPEEK polymer as proton conductive material. Electron conductivity would be created by adding polyaniline (PANI), which has an electron conductive form and also reported to have good influence on catalyst properties. In this work 3 methods different methods were used to produce original electron and proton conductive material for electrodes to improve membrane-electrode system for fuel cells.
4.2.1. SPEEK and polyaniline polymerization in-situ One of the methods to produce proton and electron conductive material is
to make membrane from SPEEK and aniline hydrochloride and then polymerize

40
polyaniline in-situ in its electron conductive form. This method’s advantage is potential homogeneous distribution of polyaniline polymer in volume, because during making smaller molecules are used. This also can result in possible disadvantage: too few molecules in some region could prevent polymerization and no long-chain polymer would be created and electron conductivity in volume would be not well-distributed.
To create membrane for further investigation of its properties SPEEK and aniline hydrochloride were solved in DMF solvent, and then was casted on glass, letting solvent to evaporate for 3 days at 60°C. Sample was placed in distilled water for 24 hours to secure no solvent was left, then dried. To polymerize aniline hydrochloride in electron conductive form of polyaniline sample was placed in water and vessel with it was kept in ice basin; oxidant solution in water was slowly added to vessel; and whole system is left for 24 hours. Then membrane is rinsed in distilled water and dried. In case of successful reactions its colour is changed.
For this investigation 2 types of samples were created: with 15 and 20 w% of aniline hydrochloride. Water absorption was determined at room temperature and 60 °C. Adding polyaniline has decreased absorbed water amount approximately 2.5 times. Also less difference is observed in dependence on temperature for samples with polyaniline (Fig.4.15), which is explained with interaction between polymers.
Fig.4.15. Results of water absorption measurements for SPEEK with and without polyaniline samples at RT and 60 °C.
Conductivity of synthesized composite (with aniline chydrochloride/polyaniline) samples decreased greatly compared to pure SPEEK membrane; at lower temperatures it was not possible to measure conductivity with available method at all. At 60 °C samples with 20 w% aniline hydrochloride showed conductivity below 1 mS/cm, at 120 °C reaching 2.5 mS/cm.

41
Composite samples with 15 w% aniline hydrochloride showed better results at temperatures above 100 °C (Fig.4.16). Low conductivity is explained by interaction between SPEEK and PANI, which influences number of available for proton transport SO3H groups.
Fig.4.16. Contuctivity measurement results (after in-situ polymerization): SPEEK:aniline hydrocholoride (ANI)=100:0; 85:15; 80:20.
Fig.4.17. Nyquist’s plot (imaginary and real resistance relation dependence on frequencies) for pure SPEEK (left) and SPEEK with 15 w% of aniline hydrochloride (right).

42
In impedance spectra for pure SPEEK polymer sample 2 processes are observed: charge transport via proton overlapping mechanisms and via mass transport (diffusion). Same type of behavior was observed for material samples with aniline hydrochloride/polyaniline (Fig.4.17). Small influence on conductivity for composite material samples could be explained by polyaniline nitrogen atoms blocking part of SPEEK polymer sulfonic groups, resulting in both types of conductivity reduction both for “free” water (due to decrease of absorbed water amount) and “surface” mechanisms of proton transfer (due to “free” sulfonic group number reduction).
From the results it is clear that this method provide possibility to create electron and proton conductive material, bet also greatly decreases water absorption, resulting in dramatic decrease of proton conductivity.
4.2.2. SPEEK and polyaniline without oxidant.The second method investigated for making of electrode material in this
work was to add polyaniline in non-conductive form (which is available on the market) to SPEEK polymer. Since sulfonic groups can act as oxidant it is theoretically possible to create both proton and electron conductive material from these 2 polymers, reducing number of ingredients during synthesis. But in this case due to interaction between polymer and oxidation of polyaniline by sulfonic groups proton conductivity will be reduced. After investigation it was clear that SPEEK with sulfonation degree of 56% is not sulfonated enough to produce good results because:The colour of sample was blue, which means that polyaniline is in
nonconductive form;For composite membranes the proton conductivity is several times
lower compared to pure SPEEK.
4.2.3. SPEEK and aniline with oxidantThe third method was similar to the second one, but during sample
preparation polyaniline (PANI) was transferred to its electron conductive form and then introduced to SPEEK solution to prepare sample. In this way interaction between nitrogen atom of polyaniline and sulfonic group of SPEEK is reduced during formation, allowing lesser decrease of absorbed water amount, increasing chance to create electrode material with both required conductivities.
At first step of the synthesis solvents of SPEEK and PANI polymer with oxidant are made separately. This allows checking if polyaniline is in conductive form already at this stage, without interaction to sulfonic groups. During next step both solutions are mixed together and mixed with magnetic steerer till homogenious solution is produced. Then solution from 3 components is casted

43
on glass and kept at temperature of 60 °C for approximately 3 days till solvent is fully evaporated, then it is rinsed and dried. Several series were made for this type of synthesis: SPEEK:PANI=100:0; 90:10; 80:20; 0:100 w%. Samples consisting of both SPEEK and PANI during these procedures got green colour, indicating electron conductive PANI form. Samples with greater (20 w%) amount of PANI polymer were mainly inhomogeneous; using ultrasound bath didn’t improve polymers’ solvent quality.
Synthesised polymer samples were investigated for water absorption amount at room temperature and 60 °C using already described method (Fig.4.18).
Fig. 4.18. Water absorbtion results for polymer samples with composition SPEEK:PANI=100:0; 0:100; 90:10; 80:20 at different temperatures (RT and 60 °C).
Synthesized SPEEK with 10 w% of PANI samples are characterized with average water absorption and increase is observed depending on temperature. When 20 w% of PPANI are added then water absorption is greatly higher indicating possible electrode from this material instability in fuel cell system.
Due to synthesis and water absorption measurement results for conductivity investigation only samples with 10 w% of PANI were selected.
Electrode material with 10 w% of PANI sample’s conductivity is about 4 times smaller compared to samples from pure SPEEK (Fig.4.19). This is indicating smaller interaction between SPEEK polymer’s sulfonic groups and PANI polymer’s nitrogen atoms compared to samples with in-situ polymerization of aniline hydrochloride due to the impact of oxidant.

44
Fig.4.19. Conductivity measurements’ results for SPEEK:PANI=100:0; 90:10 samples.
Fig.4.20. Nyquist plot for synthesized electrode material samples at 100°C (top) and 70°C (bottom).
Impedance spectra for composite electrode material samples had differences depending on temperature. At higher temperatures two areas are observed: one is looking like greatly deformed semicircle (at higher frequencies, at left side of Nyquist plot), other one is typical for diffusion and influence of the measuring system (Fig.4.20, top). At lower temperatures in impedance plot 3 parts could be identified: at low frequencies diffusion type of transport, then at middle

45
frequencies deformed semicircle and at high frequencies some fragment for other process. The third part could be identified as indicating electron conductivity because:Process is placed in high-frequencies, which is typical to electron
transport;Process appears in case of lower temperatures, when proton transport is
less significant.Activation energy for pure SPEEK membrane is ~6.7 kJ/mol, but for
electrode material samples it reaches 11.8 kJ/mol. When two points at the lowest temperatures are not taking into account SPEEK polymer samples have activation energy ~4.1 kJ/mol. In plots of samples from SPEEK with 10 w% of polyaniline several parts could be identified. At lower temperatures activation energy is well-approximated with linear approximation with activation energy 23.2 kJ/mol, other points are described with activation energy 11.4 kJ/mol (Fig.4.21).
Fig.4.21. Conductivity dependence on temperature in Arrhenius coordinates for pure SPEEK (left) and synthesized electrode material with composition SPEEK:PANI=90:10 (left and separately right).
For the material consisting of SPEEK and PANI it is necessary to take into account interaction between groups of both polymers, which often results in available for proton transfer sulfonic group decrease and water pore size decrease. Using oxidant is improving situation: it is showed by several measurements, e.g. by decrease of activation energy from 77 kJ/mol to 11 kJ/mol just by adding oxidant.
4.2.4. ConclusionsStudies of synthesized composite electrode materials show that:Composite from SPEEK polymer with aniline hydrochloride:PANI is created in electron conductive form during polymerization
process;

46
Water absorption ability is greatly decreased and has very weak dependence on temperature;
Proton conductivity is greatly decreased, and only at temperatures above 100 °C the samples with 15 w% of aniline hydrochloride have some increase of conductivity;
No electron conductivity was not observed in impedance spectra.Composite from SPEEK and PANI polymers:SPEEK polymer with sulfonation degree of 56 % was not able to
convert PANI into electron conductive form during their co-polymerisation;
Following addition of oxidant (acid) to composite polymer didn’t transformed the PANI polymer fraction into electron conductive form;
Water absorption capability is decreased;Proton conductivity is greatly decreased and indicated high
activation energy.Composite from SPEEK polymer with 10 w% PANI polymer and
oxidant:Synthesis begin with transformation of PANI into electron
conductive form with oxidant;Homogeneous composite membrane is prepared from solution of
conductive PANI and SPEEK polymers;Water absorption capability is slightly increased compared to pure
SPEEK polymer;Conductivity of synthesized composite polymer samples is
decreased, but not as greatly as it was in previous series;From impedance spectra the mixed electron – proton conductivity
is established for synthesized composite polymer samples.From these results it can be concluded that to keep some proton conductivity
in composite polymer for an electrode in MEA, it is highly recommended to use oxidant for PANI polymer protonation before co-polymerisation reaction.
47
5. Thesis
The new proton and electron conductive material for electrode was recommended and created as polymer composite compound from sulfonated poly(ether-ether-ketone) and polyaniline polymers to improve FC`s membrane-electrode assembly: a. New polymer composite proton conductive materials were synthesised
and investigated (SPEKK, SPEKK/PVDF, SPEEK with proton conductivities 17 mS/cm, 16 mS/cm, 24 mS/cm accordingly and SPEKK/PVDF/PBI). On the basis of research the best material was chosen as a proton conductive compound for electrode material.
b. Original method is developed to synthesize the composite polymer material with both proton and electron conductivities from sulfonated poly(ether-ether-ketone) and polyaniline;
c. The presence of both proton and electron transport mechanisms in new synthesized composite polymers is shown by electrochemical impedance spectroscopy and visual observations (colour change).

48
6. References
1. Hydrogen Fuel Cell Engines and Related Technologies: College of Desert (USA), 2001: http://www1.eere.energy.gov/
2. G.Vaivars, Proc Korea – South Africa Hydrogen & Fuel cell Forum. June 25-26, 2007. Korea Institute of Energy Research, Daejeon, Korea
3. Hae-kyoung Kim, Ji-rae Kim, 2007. US Patent No. 7169500 4. Grove, W.R., Philosophical Magazine and Journal of Science, Series 3, 14, 127–
130, 1839 5. Schoenbein, C.F., The London and Edinburgh Philosophical Magazine and
Journal of Science, 14, 43–45, 1839 6. Rayleigh, L., Proceedings of the Cambridge Philosophical Society, 4, 198, 1882 7. Mond, L. and Langer, C., Proceedings of the Royal Society of London, 46, 296–
304, 1889 8. Grot, W., Perfluorierte, Chemie Ingenieur Technik, 44, 167–169, 1972. 9. Grot, W.G., Chemie Ingenieur Technik, 47, 617, 1975 10. http://www.nafionstore.com/ 11. Fuel Cell Technology Handbook, edited by G. Hoogers, CRC Press LLC, 2003 12. J. O’M. Bockris and A. K. N. Reddy, Modern Electrochemistry 1 Ionics, Plenum
Press, NY (1998) 13. B. E. Conway, Modern Aspect of Electrochemistry, Vol. 3, p. 43 (1964) 14. T. Erdey-Gruz and S. Lengyel, Modern Aspect of Electrochemistry, Vol. 12, p. 1
(1978) 15. K. D. Krener, Chem. Mat., 8, 610 (1996) 16. C. J. D. von Grotthuss, Ann. Chim., LVIII, 54 (1806) 17. N. Agmon, Chem. Phys. Lett., 244, 456 (1995) 18. E. Huckel, Z. Electrochem., 34, 546 (1928) 19. J. B. Hasted, D. M. Ritson, and C. H. Collie, J. Chem. Phys., 16, 1 (1948) 20. S. Paddison, D. W. Reagor, and T. A. Zawodzinski, J. Electroanal. Chem., 459,
91 (1998) 21. K. Lebedev, S. Mafe, A. Alcaraz, and P. Ramirez, Chem. Phys. Lett., 326, 87
(2000) 22. A. Vishnyakov and A. V. Neimark, J. Phys. Chem. B, 104, 4471 (2000) 23. S. J. Paddison, J. New Mat. Electrochem. Sys., 4, 197 (2001) 24. S. J. Paddison and R. Paul, Phys. Chem. Chem. Phys., 4, 1158 (2002) 25. A. Eisenberg, Macromolecules, 3, 147 (1970) 26. T. D. Gierke, 152nd Meeting of the Electrochemical Society Extended Abstracts,
Atlanta, Ga., Abstract No. 438. 1977 27. W. Y. Hsu and T. D. Gierke, Macromolecules, 15, 101 (1982)

49
28. James Larminie, AndrewDicks, Fuel Cell Systems Explained, JohnWiley & Sons Ltd, UK
29. S.P. Nunes, B.Ruffmann, E. Rikowski, S. Vetter, K. Richau - Journal of Mem-brane Science, 203
30. Наканиси „Инфракрасные спекрты и стрение органических веществ ”, «Мир», Москва, 1965

50
7. Publications
List of publications 1. L. Grinberga, J. Hodakovska, J. Kleperis, G. Vaivars, J. Klavins. Electrochemical
Hydrogen Storage and Usage Aspects: Nickel Electrode in Acidic Electrolyte // Russian Journal of Electrochemistry, 2007, Vol. 43, No. 5, pp. 598–602.
2. J. Hodakovska, J. Kleperis. Sulfonated poly(ether-ether-ketone) polymer mem-branes for fuel cells // Latvian Journal of Physics and Technical sciences 45, 6 (2008) pp 55-60
3. Journal is published in 2 languages: a. J. Hodakovska, J. Kleperis, L. Grinberga, G. Vaivars. Conductivity measure-
ment of different polymer membranes for fuel cells // Russian Journal of Electrochemistry, 2009, 45, № 6, pp 699–704
b. Ю.Ходаковска, Я.Клеперис, Л.Гринберга, Г.Вайварс. Измерение проводимости различных полимерных мембран для топливных элементов // Электрохимия, 2009, 45, № 6, стр. 699–704
4. J.Hodakovska, J.Kleperis. Polymer membranes for fuel cells // Conference of Young Scientists on Energy Issues (CD), ISSN 1822-7554
5. J.Hodakovska, G. Chikvaidze, J. Kleperis. Multilayered proton-electron conduc-tive polymer membrane for fuel cells. DVD un internetā www.whec2010.com. Paredzēta grāmatas izdošana.
6. J. Hodakovska, G. Chikvaidze, J. Kleperis. Electron and proton conductive polymer membranes for fuel cells // Conference of Young Scientists on Energy Issues (CD), ISSN 1822-7554
List of conferences 1. J.Hodakovska, Polymer membranes for fuel cells – synthesis and properties/
Polimēru membrānas degvielas šūnām – sintēze un īpašības CFI 24. zinātniskajā konferencē, 2008.g. 2. J. Hodakovska, G. Vaivars, G. Chikvaidze, J. Kleperis, Proon conductive mem-
branes for fuel cells. Abstracts of International Baltic Sea Region Conference “Functional materials
and nanotechnologies” FM&NT-2008, Riga, April 1-4, 2008 3. J.Hodakovska, H.Luo, G.Vaivars, G.Chikvaidze, J.Kleperis. Characterization of
sulfonated poly(ether-ether-ketone) polymer membranes for fuel cells. Abstracts of 5th Baltic Conference on Electrochemestry: Functional Materials
in Electrochemistry – from Fundamental Problems to Molecular Electronics and Modern Power Sources, Tartu, Igaunija, 30. aprīlis – 3. maijs, 2008.g., P-14
4. J.Hodakovska, J.Kleperis, L.Grinberga, G.Vaivars. Conductivity measurement of mixed polymer membranes for fuel cell.

51
Abstracts of 9th Conference ‘’Fundamental problems of solid state ionics’’, June 24-27, 2008, Chernogolovka, Russia
5. J. Hodakovska, J. Kleperis. Protonvadāmības noteikšana polimēru membrānām/ Polymer membrane protonconductivity measuring
CFI 25. zinātniskajā konferencē, 2009.g. 6. J. Hodakovska, J. Kleperis, Fuel cell working parameters’ dependence on work-
ing conditions Abstracts of International Baltic Sea Region Conference “Functional materials
and nanotechnologies” FM&NT-2008, Rīga, 2009 7. J. Hodakovska, J. Kleperis, Polymer membranes for fuel cells Conference of Young Scientists on Energy Issues (CD), ISSN 1822-7554 8. J. Hodakovska, G. Čikvaidze, J. Kleperis. Protonus un elektronus vadošas
polimēru membrānas degvielas šūnām/Proton and electron conductive mem-branes for fuel cells.
CFI 26. zinātniskajā konferencē, 2010.g. 9. J.Kleperis, M.Vanags, J.Hodakovska, J.Klavins. Oriented nanostructures for
solar-hydrogen technologies. Book of Abstracts of International Conference Functional materiāls and nano-
technologies, FM&NT, Rīga, 2010 10. J.Hodakovska, J.Kleperis. SPEEK and PANI based membranes for fuel cells Book of Abstracts of International Conference Functional materiāls and nano-
technologies, Rīga, 2010 11. J.Hodakovska, G. Chikvaidze, J.Kleperis. Multilayered proton-electron conduc-
tive polymer membrane for fuel cells World Hydrogen Energy Conference WHEC 2010 Abstracts, DVD.

Acknowledgements
Author acknowledges European Union’s European Social Fund, Latvian National Research Program in Energetics and Structural Funds for financial support. Author also acknowledges Deutsche Bundesstiftung Umwelt and GKSS Polymer Institute for providing a possibility to spend my time in Germany both useful and fun, especially to coordinator N. Redeker-Freyer and all workers in S.Nunes laboratory.
Author would like to thank ISSP workers and colleagues for support and constructive discussions during research time. Special thanks to Liga Grinberga for helping always, when it was needed.
Author also would like to thank supervisor Janis Kleperis for interesting ideas, new knowledge, strong support, unending patience and infinite optimisms.