research letter open access benetsofradar
TRANSCRIPT

Couvelard et al. Geosci. Lett. (2021) 8:5 https://doi.org/10.1186/s40562-021-00174-y
RESEARCH LETTER
Benefits of radar-derived surface current assimilation for South of Africa ocean circulationXavier Couvelard1* , Christophe Messager1, Pierrick Penven2, Sébastien Smet3 and Philippe Lattes4
Abstract
The oceanic circulation south of Africa is characterised by a complex dynamics with a strong variability due to the presence of the Agulhas current and numerous eddies. This area of interest is also the location of several natural gas fields under seafloor which are targeted for drilling and exploitation. The complex and powerful ocean currents induces significant issues for ship operations at the surface as well as under the surface for deep sea operations. Therefore, the knowledge of the state of the currents and the ability to forecast them in a realistic manners could greatly enforce the safety of various marine operation. Following this objective, an array of HF radar systems were deployed to allow a detailed knowledge of the Agulhas currents and its associated eddy activity. It is shown in this study that assimilation of HF radar allow to represent the surface circulation more realistically. Two kind of experi-ments have been performed, a one month analysis and nine consecutive forecast of two days each. The one month 4DVAR experiment have been compared to geostrophic currents issued from altimeters and highlight an important improvement of the geostrophic currents. Furthermore despite the restricted size of the area covered with HF radar, we show that the solution is improved almost in the whole domain, mainly upstream and downstream of the HF radar’s covered area. We also show that while benefits of the assimilation on the surface current intensity is signifi-cantly reduced during the second day of forecast, the correction in direction persists after 48 h.
Keywords: 4DVAR, Agulhas current, HF radar, ROMS, forecast
© The Author(s) 2021. This article is licensed under a Creative Commons Attribution 4.0 International License, which permits use, sharing, adaptation, distribution and reproduction in any medium or format, as long as you give appropriate credit to the original author(s) and the source, provide a link to the Creative Commons licence, and indicate if changes were made. The images or other third party material in this article are included in the article’s Creative Commons licence, unless indicated otherwise in a credit line to the material. If material is not included in the article’s Creative Commons licence and your intended use is not permitted by statutory regulation or exceeds the permitted use, you will need to obtain permission directly from the copyright holder. To view a copy of this licence, visit http://creat iveco mmons .org/licen ses/by/4.0/.
IntroductionThe oceanic circulation south of Africa is characterised by a complex dynamics with a strong variability due to the presence of the Agulhas current and numerous mes-oscale eddies from the Mozambique Channel (Penven et al. 2006; Halo et al. 2014). More recently, high resolu-tion modeling study by Tedesco et al. (2019) has high-lighted the existence of numerous submesoscale eddies along the Agulhas cyclonic front.
Lutjeharms et al. (2003) observed the presence of cyclonic eddies embedded in the landward border of the southern Agulhas Current. These eddies have a diameter of about 50 km and are associated with a surface warm signature. Simulations suggest that those eddies remain trapped in the Agulhas Bank shelf bight and that eddies
that travel downstream of the current represent leakages from the resident shear eddy. This occurs at a roughly 20 days occurrence frequency. The intensity of the meso-scale activity in this key region for the retro-flexion modulate the exchanges of heat and salt between oceans (Lutjeharms 1981; Reason et al. 2003; Van-Aken et al. 2013; Guerra et al. 2018) as well as towards the atmos-phere (Messager and Stuart 2016).
This region exhibits furthermore a dynamical upwelling induced by the Agulhas Currents (Arnone et al. 2017) as observed by Goschen et al. (2015) during Natal Pulses. This upwelling, as been shown by Lutje-harms et al. (2000) to occurs on the landward side of the Agulhas Current and have an effect on the nutri-ent availability, stratification and primary productivity in the eastern Agulhas Bank. It as also been shown by Meyer and Niekerk (2016) that implementing an ocean current power plant in this region would outperforms
Open Access
*Correspondence: [email protected] EXWEXs, 2 Rue de Keraliou, 29200 Brest, FranceFull list of author information is available at the end of the article
Page 2 of 11Couvelard et al. Geosci. Lett. (2021) 8:5
onshore wind power plants and could increase the load carrying capacity of the country.
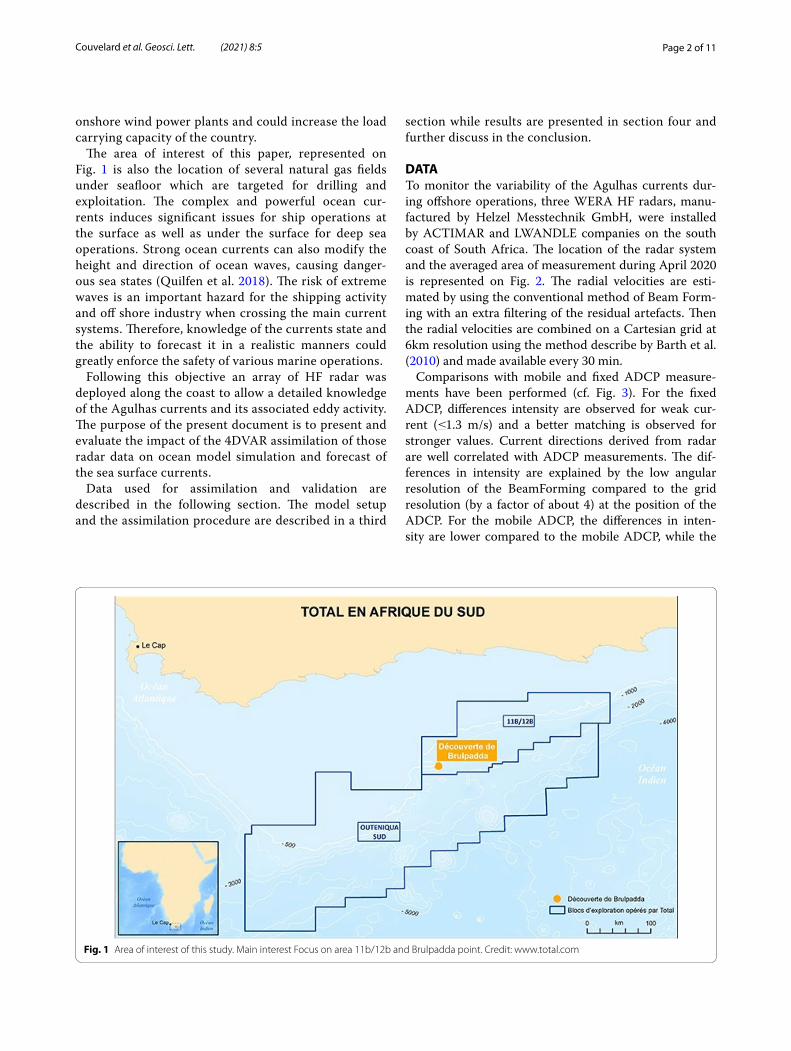
The area of interest of this paper, represented on Fig. 1 is also the location of several natural gas fields under seafloor which are targeted for drilling and exploitation. The complex and powerful ocean cur-rents induces significant issues for ship operations at the surface as well as under the surface for deep sea operations. Strong ocean currents can also modify the height and direction of ocean waves, causing danger-ous sea states (Quilfen et al. 2018). The risk of extreme waves is an important hazard for the shipping activity and off shore industry when crossing the main current systems. Therefore, knowledge of the currents state and the ability to forecast it in a realistic manners could greatly enforce the safety of various marine operations.
Following this objective an array of HF radar was deployed along the coast to allow a detailed knowledge of the Agulhas currents and its associated eddy activity. The purpose of the present document is to present and evaluate the impact of the 4DVAR assimilation of those radar data on ocean model simulation and forecast of the sea surface currents.
Data used for assimilation and validation are described in the following section. The model setup and the assimilation procedure are described in a third
section while results are presented in section four and further discuss in the conclusion.
DATA To monitor the variability of the Agulhas currents dur-ing offshore operations, three WERA HF radars, manu-factured by Helzel Messtechnik GmbH, were installed by ACTIMAR and LWANDLE companies on the south coast of South Africa. The location of the radar system and the averaged area of measurement during April 2020 is represented on Fig. 2. The radial velocities are esti-mated by using the conventional method of Beam Form-ing with an extra filtering of the residual artefacts. Then the radial velocities are combined on a Cartesian grid at 6km resolution using the method describe by Barth et al. (2010) and made available every 30 min.
Comparisons with mobile and fixed ADCP measure-ments have been performed (cf. Fig. 3). For the fixed ADCP, differences intensity are observed for weak cur-rent ( ≤1.3 m/s) and a better matching is observed for stronger values. Current directions derived from radar are well correlated with ADCP measurements. The dif-ferences in intensity are explained by the low angular resolution of the BeamForming compared to the grid resolution (by a factor of about 4) at the position of the ADCP. For the mobile ADCP, the differences in inten-sity are lower compared to the mobile ADCP, while the
Fig. 1 Area of interest of this study. Main interest Focus on area 11b/12b and Brulpadda point. Credit: www.total.com

Page 3 of 11Couvelard et al. Geosci. Lett. (2021) 8:5
differences in direction may be due to a poor calibration of the hull ADCP. Therefore, the currents provided with the Beam Forming method seems to be robust enough to be assimilated in ROMS simulations. Nevertheless, to overcome some inaccuracies, a hybrid Beam Form-ing/Direction Finding method developed by ACTIMAR called HYDDOA (cf. patent : FR 1562550) has been used for marine operations with better performances. Unfor-tunately, these data could not be used for this study.
In addition, Altimeters data were generated by a pro-cessing system including data from several altimeter mis-sions: Sentinel-3A/B, Jason-3, HY-2A, Saral[-DP]/AltiKa, Cryosat-2, OSTM/Jason-2, Jason-1, Topex/Poseidon, Envisat, GFO, ERS-1/2 and delivered by E.U. Copernicus Marine Service Information. Being at a significant lower resolution than both model experiment those data were excluded from the assimilation process (although there are somehow assimilated in the Mercator ocean simula-tion used as boundary forcing) and may be considered as an independent source of observations for our valida-tion process. Nonetheless an import bias in the represen-tation of the Agulhas current by the altimeters data has been highlighted by Rouault et al. (2010).
Model setup & assimilation method (4DVAR)The ocean circulation model used in this study was the Regional Oceanic Modeling System described in detail in Shchepetkin and McWilliams (2003, 2005). ROMS is a split-explicit, free-surface and terrain-following verti-cal coordinate oceanic model with 4DVAR capabilties (Moore et al. 2011c). Tracers momentum advection use
a third order upstream biased advection scheme with no additional explicit horizontal dissipation/diffusion while on the vertical a GLS scheme is used to deter-mine vertical mixing coefficients (Warner et al. 2005). The model grid, the atmospheric forcing, the initial and boundary conditions were all built using pyroms package freely available at http://www.myrom s.org (doi:https ://doi.org/10.5281/zenod o.37272 72). The bottom topography is derived from Etopo1 (doi:https ://doi.org/10.7289/V5C82 76M). To ensure an usefull resolution in the upper ocean, 35 vertical levels with stretched s-coordinates improved double stretching function (Shchepetkin and McWilliams 2005, 2009) were used, using surface and bottom stretching param-eters θs = 4, θb = 1 respectively. ROMS was initialized and forced at the lateral boundaries, by temperature, salinity and velocities profiles extracted from Merca-tor ocean global_analyses_forecast_phy_001_024 which provide weekly analyses and daily forecast. Atmos-pheric fluxes (heat and water) were extracted from ERA5 (fifth generation of ECMWF atmospheric reanal-yses of the global climate—Copernicus Climate Change Service (C3S) (2017)) and introduced in the ocean model through a bulk formulae (Fairall et al. 2003). The model domain extends from 21◦ E to 26◦ E and from −37
◦S to −33
◦S , on a 1.8 km regular grid. The ocean
model has been run without data assimilation from Jan-uary 2019 to April 2020 (called FREE experiment here-after) and 4DVAR data assimilation of HF radar surface currents was performed during April 2020 only and compared to April issued from FREE.
Detailed description and evaluation of the 4DVAR data assimilation can be found in Di Lorenzo et al. (2007); Powell et al. (2008); Powell and Moore (2009); Broquet et al. (2009, 2011); Moore et al. (2011a, 2011b, 2011c); Song et al. (2016). In the present work, the dual formu-lation approach (Moore et al. 2011b; Gürol et al. 2014; Levin et al. 2019) has been used with 6 inner-loops and 2 outer-loops where the inner-loop correspond to the iterative linear minimization of the cost function and the outer-loop correspond to an updated non linear estimate of the circulation (for a complete description refer to Moore et al. (2011a)).
This setting has been determined after several experi-ments to reach an optimum between accuracy of the results and computational time. It is furthermore coher-ent with Levin et al. (2019) who used 7 inner-loops and 2 outer-loops in their Mid-Atlantic Bight configuration. The data were assimilated using 1-day assimilation win-dows. The 4D-Var analysis produced at the end of each day was used as initial condition for the next assimilation cycle. Computational cost of this choice is around 90 min by days (using 224 cpus)
Fig. 2 Black squares represent the emplacement of the HF radar installed to monitor the area delimited by the black contour (cf Fig. 1). The colored area represents the intensity of the averaged current measured by the radar during April 2020 and the white arrows are representative of the averaged direction of the surface currents during the same period

Page 4 of 11Couvelard et al. Geosci. Lett. (2021) 8:5
ResultsHindcastAs detailed in “Model setup & assimilation method (4DVAR)” section, the 4DVAR simulation have been made for April 2020 and our analysis therefore target this periods. In the following the ROMS geostrophic veloci-ties have been derived from surface elevation following Eq. 1 (where g represent the acceleration due to gravity, f the coriolis parameter and η the surface elevation) for both 4DVAR and FREE simulations and are compared to altimeter derived geostrophic currents after being inter-polated on the ROMS grid.
Spatially averaged Root Mean Square Error (RMSE) between both simulations and altimeters derived geos-trophic currents are shown on Fig. 4. Top panel of Fig. 4 represents the spatial average of the RMSE over the whole domain (hereafter global area), while bottom panel rep-resents the RMSE averaged over the area corresponding to the HF radar observation zone (hereafter local area). Both panels show a significant decrease of the RMSE for the geostrophic currents with data assimilation, but while
(1)u = −g
f
∂η
∂yv =
g
f
∂η
∂x
Fig. 3 Quantile-Quantile plot of speed and direction for comparison with fixed ADCP (a, c) and mobile ADCP (b, d)

Page 5 of 11Couvelard et al. Geosci. Lett. (2021) 8:5
the local improvements are almost immediate it takes about 15 days to propagate them over the whole domain.
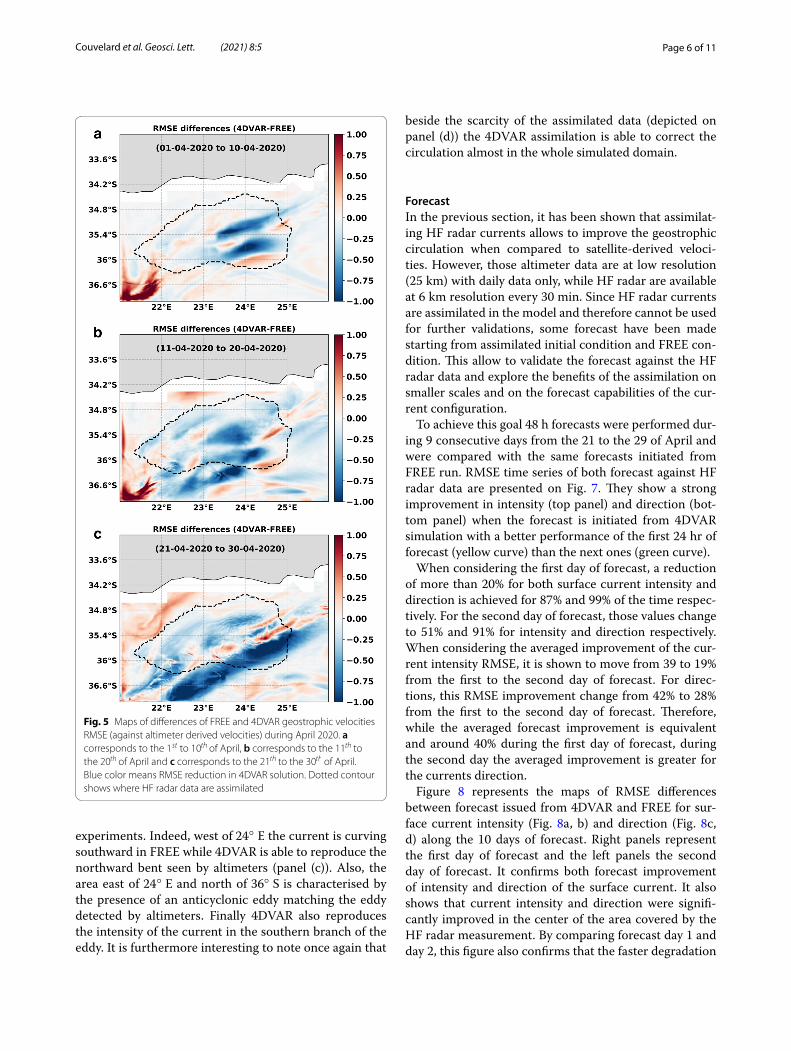
Figure 5 represents the temporal and spatial evolution of the RMSE’s differences between FREE, 4DVAR simula-tions during April 2020. April has been split in three peri-ods; days 1 to 10 (panel a), days 11 to 20 (panel b) and days 21 to 30 (panel c). As expected from Fig. 4, panel (a) shows an improvement (blue color) mostly located in the HF radar area. Panel (b) shows an extension of the RMSE decrease to the south west and to the east and panel (c) a strengthening of this improvement when compared to altimetry data and highlight the positive impact of the
data assimilation outside the area where HF radar data are assimilated.
While previous RMSE times series (Fig. 4) and maps (Fig. 5) illustrated a global improvement of the geo-strophic currents over the whole April month, Fig. 6 focuses on a daily averaged (23 of April 2020). Panels (a) and (b) show the daily averaged geostrophic currents for FREE and 4DVAR respectively. Panels (c) and (d) show the averaged geostrophic currents derived from altimeter data and the surface currents measured by the HF radar and assimilated in the model during this day. This figure illustrates the improvement between FREE and 4DVAR
Fig. 4 FREE and 4DVAR geostrophic velocities RMSE (against altimeter derived velocities) for the whole domain (a) and over the area of the HF radar observations (b)
Page 6 of 11Couvelard et al. Geosci. Lett. (2021) 8:5
experiments. Indeed, west of 24◦ E the current is curving southward in FREE while 4DVAR is able to reproduce the northward bent seen by altimeters (panel (c)). Also, the area east of 24◦ E and north of 36◦ S is characterised by the presence of an anticyclonic eddy matching the eddy detected by altimeters. Finally 4DVAR also reproduces the intensity of the current in the southern branch of the eddy. It is furthermore interesting to note once again that
beside the scarcity of the assimilated data (depicted on panel (d)) the 4DVAR assimilation is able to correct the circulation almost in the whole simulated domain.
ForecastIn the previous section, it has been shown that assimilat-ing HF radar currents allows to improve the geostrophic circulation when compared to satellite-derived veloci-ties. However, those altimeter data are at low resolution (25 km) with daily data only, while HF radar are available at 6 km resolution every 30 min. Since HF radar currents are assimilated in the model and therefore cannot be used for further validations, some forecast have been made starting from assimilated initial condition and FREE con-dition. This allow to validate the forecast against the HF radar data and explore the benefits of the assimilation on smaller scales and on the forecast capabilities of the cur-rent configuration.
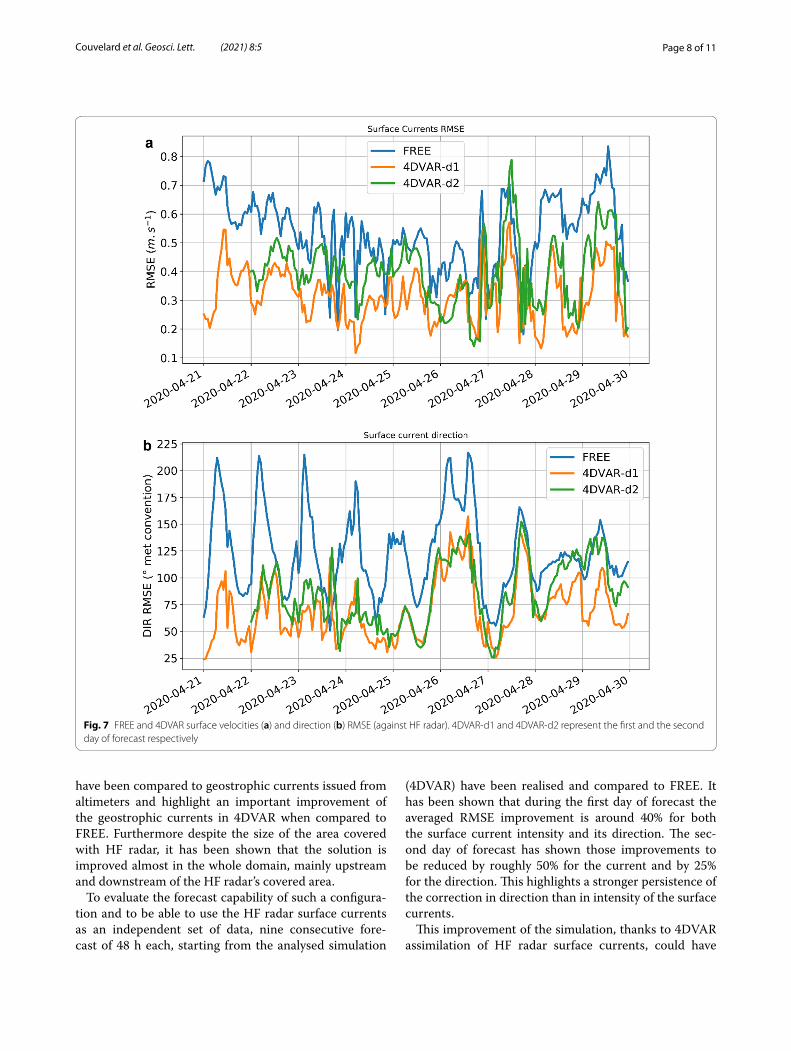
To achieve this goal 48 h forecasts were performed dur-ing 9 consecutive days from the 21 to the 29 of April and were compared with the same forecasts initiated from FREE run. RMSE time series of both forecast against HF radar data are presented on Fig. 7. They show a strong improvement in intensity (top panel) and direction (bot-tom panel) when the forecast is initiated from 4DVAR simulation with a better performance of the first 24 hr of forecast (yellow curve) than the next ones (green curve).
When considering the first day of forecast, a reduction of more than 20% for both surface current intensity and direction is achieved for 87% and 99% of the time respec-tively. For the second day of forecast, those values change to 51% and 91% for intensity and direction respectively. When considering the averaged improvement of the cur-rent intensity RMSE, it is shown to move from 39 to 19% from the first to the second day of forecast. For direc-tions, this RMSE improvement change from 42% to 28% from the first to the second day of forecast. Therefore, while the averaged forecast improvement is equivalent and around 40% during the first day of forecast, during the second day the averaged improvement is greater for the currents direction.
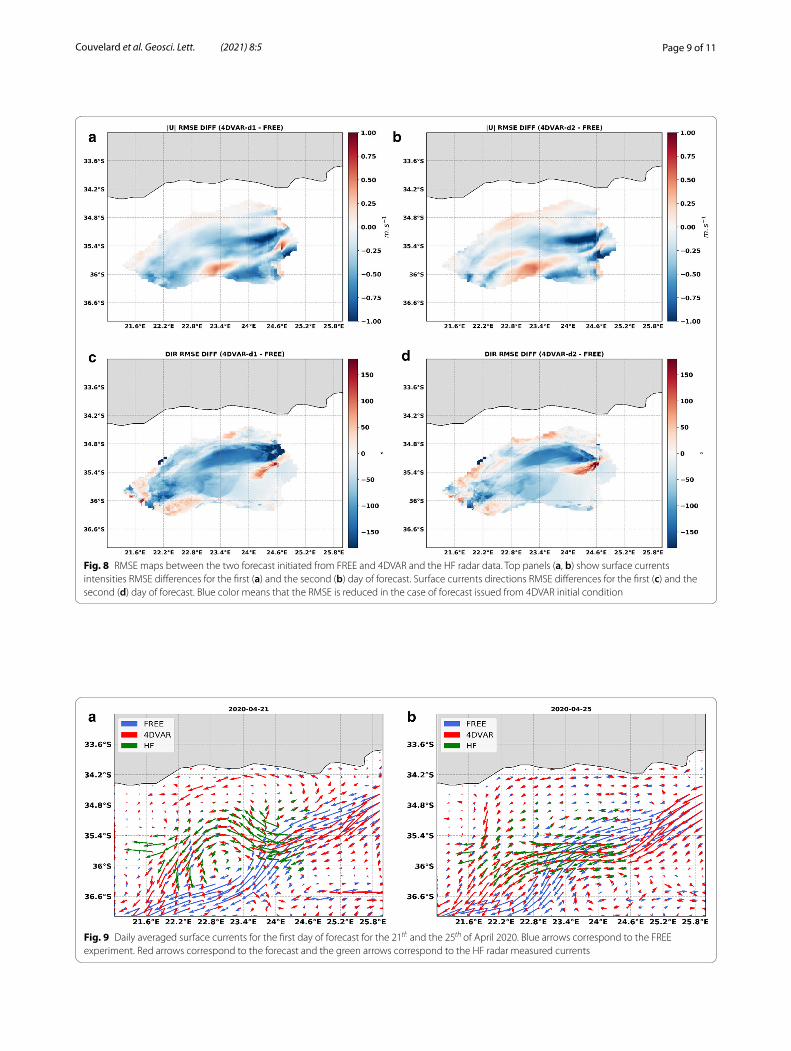
Figure 8 represents the maps of RMSE differences between forecast issued from 4DVAR and FREE for sur-face current intensity (Fig. 8a, b) and direction (Fig. 8c, d) along the 10 days of forecast. Right panels represent the first day of forecast and the left panels the second day of forecast. It confirms both forecast improvement of intensity and direction of the surface current. It also shows that current intensity and direction were signifi-cantly improved in the center of the area covered by the HF radar measurement. By comparing forecast day 1 and day 2, this figure also confirms that the faster degradation
Fig. 5 Maps of differences of FREE and 4DVAR geostrophic velocities RMSE (against altimeter derived velocities) during April 2020. a corresponds to the 1 st to 10th of April, b corresponds to the 11th to the 20th of April and c corresponds to the 21th to the 30th of April. Blue color means RMSE reduction in 4DVAR solution. Dotted contour shows where HF radar data are assimilated

Page 7 of 11Couvelard et al. Geosci. Lett. (2021) 8:5
of the forecast is related to the current intensity rather than the direction.
Figure 9 shows the surface circulation of FREE, 4DVAR and HF radar currents averaged for two distinct first day of forecast as a superposition of arrows. It illustrates that the use of an assimilated initial condition allows to dra-matically correct the path of the surface currents. Indeed on the forecast of the 21th april 2020 (Fig. 9, left panel) while the FREE forecast is characterized by a southward deviation and an cyclonic circulation between 23◦ E and 24
◦E , the 4DVAR forecast surface circulation is almost
the opposite. Indeed it is characterized by a northward shift inducing a anti-cyclonic circulation between 22◦ E and 24◦ E . While the whole eddy cannot be depicted by the HF radar measurement, the northward shift of the Agulhas corresponds to what it is observed by the HF radar. On the forecast of the 25th of april 2020 (Fig. 9, right panel) while the eddy previously depicted seems to be dissipating, the northward bending of the 4DVAR
forecast is once again coherent with the HF radar data and opposite to the southward bending of the FREE solu-tion. This southward shift, seen in the FREE forecast is therefore an artefact of the model which can be corrected by using an assimilated initial condition.
ConclusionIn this study, the benefits of the 4DVAR assimilation of surface currents issued from HF radar in one of the most highly dynamic region of the world is presented. While the intense dynamics of the region make difficult for most of the numerical oceanic models to realisti-cally reproduce the position and intensity of the Agulhas current and associated eddies, it has been shown that a 4DVAR assimilation of HF radar allow to represent the surface circulation more realistically. Two kind of experi-ments have been performed, a one month analyses (April 2020) and nine consecutive forecasts of 48 h each (21 to 29 of April 2020). The one month 4DVAR experiment
Fig. 6 Daily averaged geostrophic currents for the 23 April 2020 for: a the reference simulation, b the assimilated simulation, c from altimeters and d the assimilated HF radar data. white arrow represents current direction
Page 8 of 11Couvelard et al. Geosci. Lett. (2021) 8:5
have been compared to geostrophic currents issued from altimeters and highlight an important improvement of the geostrophic currents in 4DVAR when compared to FREE. Furthermore despite the size of the area covered with HF radar, it has been shown that the solution is improved almost in the whole domain, mainly upstream and downstream of the HF radar’s covered area.
To evaluate the forecast capability of such a configura-tion and to be able to use the HF radar surface currents as an independent set of data, nine consecutive fore-cast of 48 h each, starting from the analysed simulation
(4DVAR) have been realised and compared to FREE. It has been shown that during the first day of forecast the averaged RMSE improvement is around 40% for both the surface current intensity and its direction. The sec-ond day of forecast has shown those improvements to be reduced by roughly 50% for the current and by 25% for the direction. This highlights a stronger persistence of the correction in direction than in intensity of the surface currents.
This improvement of the simulation, thanks to 4DVAR assimilation of HF radar surface currents, could have
Fig. 7 FREE and 4DVAR surface velocities (a) and direction (b) RMSE (against HF radar). 4DVAR-d1 and 4DVAR-d2 represent the first and the second day of forecast respectively
Page 9 of 11Couvelard et al. Geosci. Lett. (2021) 8:5
Fig. 8 RMSE maps between the two forecast initiated from FREE and 4DVAR and the HF radar data. Top panels (a, b) show surface currents intensities RMSE differences for the first (a) and the second (b) day of forecast. Surface currents directions RMSE differences for the first (c) and the second (d) day of forecast. Blue color means that the RMSE is reduced in the case of forecast issued from 4DVAR initial condition
Fig. 9 Daily averaged surface currents for the first day of forecast for the 21th and the 25th of April 2020. Blue arrows correspond to the FREE experiment. Red arrows correspond to the forecast and the green arrows correspond to the HF radar measured currents

Page 10 of 11Couvelard et al. Geosci. Lett. (2021) 8:5
many impacts at all scales. Indeed long term reanalyses could provide better insight of the position of the Agulhas retro-flexion and the resulting ocean leakage between the Indian to the Atlantic ocean or the carbon uptake by the biological activity due to better representation of the up-welling areas and their variability. Furthermore, in this region of strong maritime activity, a realistic forecast of surface currents would increase marine safety and allow drilling campaign to be planed or suspended depending on the future surface current. Moreover although being out of the scope of this study, small scale currents hav-ing a strong impact on wave height variability (Ardhuin et al. 2017), the use of assimilated surface currents is also expected to improve wave forecast and therefore marine safety.
AcknowledgementsAuthors thank the two anonymous reviewers for their critics and suggestions which help produced an improved final version of this manuscript. All the sim-ulations have been performed on the Datarmor HPC facility at Ifremer (Brest, France). HF radar installation and data distribution was made by ACTIMAR and LWANDLE companies. This study has been conducted using E.U. Copernicus Marine Service Information
Open AccessThis article is distributed under the terms of the Creative Commons Attribu-tion 4.0 International License (http://creat iveco mmons .org/licen ses/by/4.0/), which permits unrestricted use, distribution, and reproduction in any medium, provided you give appropriate credit to the original author(s) and the source, provide a link to the Creative Commons license, and indicate if changes were made.
Authors’ contributionsXC built the numerical setup made the simulations the analyses and wrote this letter. CM and PP contributed to definition of the numerical setup and made substantial revision of the letter. SS made the evaluation of the HF radar accuracy and wrote the corresponding paragraph. PL contributed to the conception, design and motivations of the present work.
FundingThis work was Funded by both TOTAL and EXWEXs.
Availability of data and materialsERA5 data were downloaded from Copernicus Climate Change Service (C3S) (2017): ERA5: Fifth generation of ECMWF atmospheric reanalyses of the global climate . Copernicus Climate Change Service Climate Data Store (CDS), date of access. https ://cds.clima te.coper nicus .eu/cdsap p#!/homeMercator ocean GLOBAL_ANALYSES_FORECAST_PHY_001_024 where obtained from https ://resou rces.marin e.coper nicus .euAltimeters data SEALEVEL_GLO_PHY_L4_NRT_OBSERVATIONS_008_046 where obtained from https ://resou rces.marin e.coper nicus .euHF radar data that support the findings of this study are available from TOTAL but restrictions apply to the availability of these data, which were used under license for the current study, and so are not publicly available. Data are how-ever available from the authors upon reasonable request and with permission of TOTAL.
Compliance with ethical standards
Competing interestsThere is no competing interests.
Author details1 EXWEXs, 2 Rue de Keraliou, 29200 Brest, France. 2 Univ. Brest, CNRS, IRD, Ifremer, Laboratoire d’Océanographie Physique et Spatiale (LOPS), IUEM, Brest, France. 3 Actimar, 36 Quai de la Douane, 29200 Brest, France. 4 Total E&P South
Africa B.V., 27 Willie Van Schoor Avenue, Bellville 7530, Western Cape, South Africa.
Received: 5 October 2020 Accepted: 9 January 2021
ReferencesArdhuin F, Rascle N, Chapron B, Gula J, Molemaker J, Gille ST, Menemenlis D,
Rocha C (2017) Small scale currents have large effects on wind wave heights. J Geophys Res 122(C6):4500–4517. https ://doi.org/10.1002/2016J C0124 13
Arnone V, González-Dávila M, Santana-Casiano JM (2017) Co2 fluxes in the South African coastal region. Marine Chem 195:41–49. https ://doi.org/10.1016/j.march em.2017.07.008
Barth A, Alvera-Azcárate A, Gurgel KW, Staneva J, Port A, Beckers JM, Stanev EV (2010) Ensemble perturbation smoother for optimizing tidal boundary conditions by assimilation of high-frequency radar surface currents - application to the german bight. Ocean Sci 6(1):161–178. https ://doi.org/10.5194/os-6-161-2010
Broquet G, Edwards C, Moore A, Powell B, Veneziani M, Doyle J (2009) Application of 4d-variational data assimilation to the california current system. Dyn Atmos Oceans 48(1):69–92. https ://doi.org/10.1016/j.dynat moce.2009.03.001
Broquet G, Moore A, Arango H, Edwards C (2011) Corrections to ocean surface forcing in the california current system using 4d variational data assimila-tion. Ocean Modelling 36(1):116–132. https ://doi.org/10.1016/j.ocemo d.2010.10.005
Copernicus Climate Change Service (C3S) (2017) ERA5: fifth generation of ECMWF atmospheric reanalyses of the global climate. Copernicus Cli-mate Change Service Climate Data Store (CDS). https ://cds.clima te.coper nicus .eu/cdsap p#!/home
Di Lorenzo E, Moore AM, Arango HG, Cornuelle BD, Miller AJ, Powell B, Chua BS, Bennett AF (2007) Weak and strong constraint data assimilation in the inverse regional ocean modeling system (roms): Development and application for a baroclinic coastal upwelling system. Ocean Modelling 16(3):160–187. https ://doi.org/10.1016/j.ocemo d.2006.08.002
Fairall CW, Bradley EF, Hare JE, Grachev AA, Edson JB (2003) Bulk parameteriza-tion of air–sea fluxes: Updates and verification for the coare algorithm. J Climate 16(4):571–591
Goschen W, Bornman T, Deyzel S, Schumann E (2015) Coastal upwelling on the far eastern agulhas bank associated with large meanders in the agulhas current. Continental Shelf Res 101:34–46. https ://doi.org/10.1016/j.csr.2015.04.004
Guerra L, Paiva A, Chassignet E (2018) On the translation of agulhas rings to the western south atlantic ocean. Deep-Sea Res I 139:104–113. https ://doi.org/10.1016/j.dsr.2018.08.005
Gürol S, Weaver AT, Moore AM, Piacentini A, Arango HG, Gratton S (2014) B-preconditioned minimization algorithms for variational data assimila-tion with the dual formulation. Quart J R Meteorol Soc 140(679):539–556. https ://doi.org/10.1002/qj.2150
Halo I, Backeberg B, Penven P, Ansorge I, Reason C, Ullgren J (2014) Eddy prop-erties in the mozambique channel:a comparison between observations and two numerical ocean circulation models. Deep-Sea Res II 100:38–53. https ://doi.org/10.1016/j.dsr2.2013.10.015
Levin J, Arango HG, Laughlin B, Wilkin J, Moore AM (2019) The impact of remote sensing observations on cross-shelf transport estimates from 4d-var analyses of the mid-atlantic bight. Adv Space Res. https ://doi.org/10.1016/j.asr.2019.09.012
Lutjeharms J, Cooper J, Roberts M (2000) Upwelling at the inshore edge of the agulhas current. Continental Shelf Res 20(7):737–761. https ://doi.org/10.1016/S0278 -4343(99)00092 -8
Lutjeharms J, Penven P, Roy C (2003) Modelling the shear edge eddies of the southern agulhas current. Continental Shelf Res 23(11):1099–1115. https ://doi.org/10.1016/S0278 -4343(03)00106 -7
Lutjeharms JRE (1981) Spatial scales and intensities of circulation in the ocean areas adjacent to south africa. Deep-Sea Res 28A:1289–1302
Messager C, Stuart S (2016) Significant atmospheric boundary layer change observed above an agulhas current warm cored eddy. Adv Meteorol. https ://doi.org/10.1155/2016/36596 57

Page 11 of 11Couvelard et al. Geosci. Lett. (2021) 8:5
Meyer I, Niekerk JLV (2016) Towards a practical resource assessment of the extractable energy in the agulhas ocean current. Int J Mar Energy 16:116–132. https ://doi.org/10.1016/j.ijome .2016.05.010
Moore AM, Arango HG, Broquet G, Edwards C, Veneziani M, Powell B, Foley D, Doyle JD, Costa D, Robinson P (2011a) The regional ocean modeling system (roms) 4-dimensional variational data assimilation systems: Part ii - performance and application to the california current system. Progr Oceanogr 91(1):50–73. https ://doi.org/10.1016/j.pocea n.2011.05.003
Moore AM, Arango HG, Broquet G, Edwards C, Veneziani M, Powell B, Foley D, Doyle JD, Costa D, Robinson P (2011b) The regional ocean modeling system (roms) 4-dimensional variational data assimilation systems: Part iii - observation impact and observation sensitivity in the california current system. Progr Oceanogr 91(1):74–94. https ://doi.org/10.1016/j.pocea n.2011.05.005
Moore AM, Arango HG, Broquet G, Powell BS, Weaver AT, Zavala-Garay J (2011) The regional ocean modeling system (roms) 4-dimensional variational data assimilation systems: Part i - system overview and formulation. Progr Oceanogr 91(1):34–49. https ://doi.org/10.1016/j.pocea n.2011.05.004
Penven P, Lutjeharms JRE, Florenchie P (2006) Madagascar: A pacemaker for the agulhas current system? Geophys Res Lett. https ://doi.org/10.1029/2006G L0268 54
Powell B, Arango H, Moore A, Di Lorenzo E, Milliff R, Foley D (2008) 4dvar data assimilation in the intra-americas sea with the regional ocean modeling system (roms). Ocean Modelling 23(3):130–145. https ://doi.org/10.1016/j.ocemo d.2008.04.008
Powell BS, Moore AM (2009) Estimating the 4dvar analysis error of godae products. Ocean Dynamics 59(1):121–138
Quilfen Y, Yurovskaya M, Chapron B, Ardhuin F (2018) Storm waves focusing and steepening in the agulhas current: satellite observations and mod-eling. Rem Sens Environ 216:561–571. https ://doi.org/10.1016/j.march em.2017.07.0081
Reason C, Luthjeharms HJJRE, Biastoch A, Roman R (2003) Inter-ocean fluxes south of africa in an eddy-permitting model. Deep-Sea Res II 50:281–298
Rouault MJ, Mouche A, Collard F, Johannessen JA, Chapron B (2010) Map-ping the Agulhas Current from space: An assessment of ASAR surface current velocities. J Geophys Res. https ://doi.org/10.1016/j.march em.2017.07.0082
Shchepetkin AF, McWilliams JC (2003) A method for computing horizontal pressure-gradient force in an oceanic model with a nonaligned vertical coordinate. J Geophys Res Oceans. https ://doi.org/10.1029/2001J C0010 47
Shchepetkin AF, McWilliams JC (2005) The regional oceanic modeling system (roms): a split-explicit, free-surface, topography-following-coordinate oceanic model. Ocean Modelling 9(4):347–404. https ://doi.org/10.1016/j.march em.2017.07.0083
Shchepetkin AF, McWilliams JC (2009) Correction and commentary for “ocean forecasting in terrain-following coordinates: Formulation and skill assess-ment of the regional ocean modeling system” by haidvogel et al., j. comp. phys. 227, pp. 3595–3624. J Comput Phys 228(24):8985–9000. https ://doi.org/10.1016/j.jcp.2009.09.002
Song H, Edwards CA, Moore AM, Fiechter J (2016) Data assimilation in a coupled physical-biogeochemical model of the california current system using an incremental lognormal 4-dimensional variational approach: Part 1–model formulation and biological data assimilation twin experi-ments. Ocean Modelling 106:131–145. https ://doi.org/10.1016/j.march em.2017.07.0085
Tedesco P, Gula J, Ménesguen C, Penven P, Krug M (2019) Generation of sub-mesoscale frontal eddies in the agulhas current. J Geophys Res Oceans 124(11):7606–7625. https ://doi.org/10.1016/j.march em.2017.07.0086
Van-Aken H, Lutjeharms J, Rouault M, Whittle C, de Ruijter W (2013) Observa-tions of an early agulhas current retroflection event in 2001: a temporary cessation of inter-ocean exchange south of africa? Deep Sea Research Part I: Oceanogr Res Papers 72:1–8. https ://doi.org/10.1016/j.march em.2017.07.0087
Warner JC, Sherwood CR, Arango HG, Signell RP (2005) Performance of four turbulence closure models implemented using a generic length scale method. Ocean Modelling 8(1):81–113. https ://doi.org/10.1016/j.march em.2017.07.0088
Publisher’s NoteSpringer Nature remains neutral with regard to jurisdictional claims in pub-lished maps and institutional affiliations.