research investment idea 31 mar 2017 trent ltd. pcg... · pcg research private client group - pcg...
TRANSCRIPT

PCG RESEARCH INVESTMENT IDEA 31 Mar 2017
Trent Ltd.
Private Client Group - PCG RESEARCH P a g e | 1
Industry CMP Recommendation Add on Dips to band Target Time Horizon
Retail Rs 266 BUY Rs 235-266 Rs 305-350 3-4 Quarters
HDFC Scrip Code TRELTD
BSE Code 500251
NSE Code TRENT
Bloomberg TRENT
CMP as on 31 Mar 17 266
Equity Capital (Rs Cr) 33.23
Face Value (Rs) 1
Equity O/S (Cr) 33.23
Market Cap (Rs Cr) 8828
Book Value (Rs) 43.2
Avg. 52 Week Volumes
178927
52 Week High 270
52 Week Low 154
Shareholding Pattern (%)
Promoters 32.6
Institutions 41.9
Non Institutions 25.5
PCG Risk Rating* Yellow * Refer Rating explanation
Nisha Sankhala [email protected]
Trent Ltd owns and manages a number of retail chains in India. It primarily operates stores across three
formats: Westside, Star Bazaar and Landmark. A part of Tata Group, Trent was incorporated in 1998 and has
its headquarters in Mumbai.
Total of 95 Westside departmental stores are located in 58 cities offers menswear, women’s wear, kids’ wear,
footwear, cosmetics, perfumes and handbags, household furniture accessories, lingerie, and gifts. The
hypermarket business with Star Bazaar brand name provides staple foods, beverages, health and beauty
products, vegetables, fruits, dairy products, consumer electronics, and household items, at the most affordable
prices. In addition, Trent has also acquired 76% stake in Landmark, one of the largest books and music retail
chains in the country.
Currently stock is trading at 2x EV/Sales of FY19E and going forward we expect stock will trade at 2.3x and
2.6x EV/Sales, which brings the value of the stock at Rs 305 and 350. So we initiate Trent as a BUY at CMP
and add on decline at 235 for the targets of Rs 305 & 350 over the next 3-4 quarters.
INVESTMENT RATIONALE:
Favorable demographics, increasing urbanization, surge in discretionary spending, rising affluence amid
consumers, growing preference for branded products and higher aspirations are other factors which will drive
retail consumption in India.
GST will have a very positive impact going ahead on the retail sector. The implementation of GST would mean
an unhindered integration of goods and services transfer across the states. First of all, the procurement of
goods would become less cumbersome and this will open gates for vendors or suppliers to merge and have a
benefactor relation. The state boundary won’t be a hurdle anymore resulting in a low transportation cost and
better access. The simplified tax credits would mean fewer costs and profitable businesses.
Westside products are known for style and class amongst fashion conscious consumers. In recent years, the
chain has launched and refreshed a number of brands, available exclusively at Westside stores. Talking about
non-apparel businesses, Westside has brand like Footwear for Shoes Business, Studio west for fragrances,
Bath & Cosmetic business and Westside Home for Home Furnishing Industry.
Westside has slightly different business model format compared to peers. It has focused on Private labels and
In-house brand products for batter margins. Apparel contributes 80% of overall Westside revenues while the
overall 90% of the revenue comes from Private labels and In-house brand products. In-house brands offer
higher margins to retailers as they allow them to have complete control across the value chain. This also
enables them to give attractive discount offers to their customers.

PCG RESEARCH
Private Client Group - PCG RESEARCH P a g e | 2
Currently, Westside is operating through 95 stores across 58 Cities in India. Now Westside is planning to
accelerate expansion in the coming years by focusing broadly on two formats flagship stores - the prominent
full offer stores and the curated smaller stores in non-metros/ emerging micro-markets.
Average bill cycle of the company has seen 8% CAGR over FY12-16 and Walkins has increased from 20.36 mn
in FY12 to 25.15 mn in FY16 and going forward, we expect the trend to continue which would drive
performance of the company in the coming years.
RISK & CONCERNS:
Regulatory hurdles: Any regulatory change in the FDI policy will affect the growth of Hyper
City of Trent.
Highly price competitive business.
Threat form ever increasing trend of E-Commerce Business.
VIEW & VALUATION:
Favorable Indian Demographics, GST’s Favorable impact on whole Industry, Company’s expansion strategy and
continuously increasing Walkins & Avg. Bill Size puts Trent into sweet spot. Moreover, recent big listing of
DMart (One of the competitor) shows huge potential of the Retail Industry and this has led to re-rating of
Retail Sector. We believe Trent deserves higher multiple as being Tata Group Company, stable financials,
strong balance sheet as well as strong Brand pedigree.
Currently stock is trading at 2x EV/Sales of FY19 and going forward we expect stock will trade at EV/Sales of
2.3x and 2.6x which brings the value of the stock at Rs 305 and 350. Stock trades at ~19x EV/EBITDA and
based upon our target of Rs 350, we have implied ~25x EV/EBITDA on FY19E basis. So we initiate Trent a
strong BUY at CMP of Rs 266 and add on decline of 235 for the targets of Rs 305 & 350 for the period of 3-4
quarters.

PCG RESEARCH
Private Client Group - PCG RESEARCH P a g e | 3
BUSINESS BACKGROUND: The story began in 1998 when the Tata’s acquired Littlewoods a London based
retail chain by selling Lakme to Unilever. This acquisition was followed by the establishment of Trent Ltd.
With the headquarters in Mumbai it has presence in over 58 cities of India. Trent is a retail operations
company that owns and manages a number of retail chains in India. It primarily operates stores across three
formats: Westside, Star and Landmark.
Westside departmental stores: The Company has established 95 Westside departmental stores measuring
8000-34000 sq. ft. in floor space across 58 cities. The Westside stores have several departments to meet the
varied shopping needs of customers. These include menswear, women’s wear, kids’ wear, footwear,
cosmetics, perfumes and handbags, household furniture accessories, lingerie, and gifts.
Star Bazaar: Trent ventured into the hypermarket business in 2004 with Star Bazaar, providing an ample
assortment of products made available at the lowest prices. This store offers customers an eclectic array of
products that include staple foods, beverages, health and beauty products, vegetables, fruits, dairy products,
consumer electronics, and household items, at the most affordable prices. Star Bazaar also includes a large
range of fashionable in-house garments for men, women and children, exclusively available at the store.
Trent Hypermarket (THL) operates in a 50:50 JV between Trent Ltd & Tesco Plc UK.
Landmark: Trent has also acquired a 76% stake in Landmark, one of the largest books and music retail
chains in the country and began operations in 1987 with its first store in Chennai with a floor space of 5500
sqft.
ZARA: Zara is a leading global Spanish fashion apparel brand, focusing on customers at the premium end.
Trent operates Zara stores in a joint venture (JV) with the Inditex group of Spain with a shareholding of:
Inditex - 51% and Trent - 49%. Trent also has a JV with Inditex for the brand Massimo Dutti.
Trent History:
INVESTMENT RATIONALE:
1997 Tata sells
Lakme to Unilever &
acquires Littlewoods
1998 Launches first Westside
store in Bangalore
2004 Opens first Star Bazaar Store
in Ahmedabad
2005 Trent acquires
76% stake in Landmark
2014 Trent &
Tesco enter in a
50:50 JV for Trent Hypermarket Ltd
2008 Tesco enters India in
cash & carry business &
Ties-up with Star Bazaar
2009 Trent & Inditex form JV to bring Zara to India

PCG RESEARCH
Private Client Group - PCG RESEARCH P a g e | 4
Favorable Indian Demographics
India is a young nation with more than 50% of its population is in the working age group of 15-54 years. This
indicates significant influence wielded by this segment on consumption. The increasing desires to look good &
presentable, influenced by western culture and exposure to e-commerce and social media have boosted the
demand for more fashionable clothing and lifestyle products. Immense scope is seen for banners offering an
innovative product range to meet the aspirations of the brand conscious consumers with evolving
preferences.
Currently, 69% of India’s population lives in rural areas and this population contributes 54% to the total
retail consumption. Rapid urbanization in tier 2 and tier 3 cities is influencing the traction for organized retail
in these cities.
This has resulted in a surge in discretionary spending, which is expected to grow significantly from the
current 60% to ~72% of the overall spending by FY20E.
Market Size of Indian Retail Industry (US $ bn)
Source: BCG Retail 2020, HDFC sec Research
India - world’s youngest nation
Source: India Census 2011, HDFC sec Research
11 % CAGR

PCG RESEARCH
Private Client Group - PCG RESEARCH P a g e | 5
GST will be Game changer for the Retail Sector
GST will have a very positive impact going ahead on the retail sector. The implementation of GST would
mean an unhindered integration of goods and services transfer across the states. First of all, the
procurement of goods would become less cumbersome and this will open gates for vendors or suppliers to
merge and have a benefactor relation. The state boundary won’t be a hurdle anymore resulting in a low
transportation cost and better access. The simplified tax credits would mean fewer costs and profitable
businesses.
Strong Financials Compared to Peers
Where Majority of the players in the industry have been posting losses or minor profits barring one or two
players, Trent has managed to do turn around (Since 2015) on the back of strong management. Recently
also Trent has appointed Mr. Venu Nair, managing director (MD) of Marks & Spencer Reliance, India, as the
new chief commercial officer. Since FY15, Company has started making profits and proved itself among its
peers.
The revenue of the company in FY16 stood at Rs. 2464 Cr compared to previous Rs. 2381 Cr. While the
EBITDA came in at Rs. 204 Cr with margin of ~9%. However, bottom line dipped 50% on the back of higher
Finance costs. It is to be noted that FY15 included one off gain of Rs 115cr, so adjusted to the same, FY16
profits is up as compared to FY15.
Going further we expect robust growth in the financials of Trent because of its aggressive store addition
strategy, and major focus on in house brands and shift from unorganized to organized segment. We expect
revenue to post 22% CAGR in FY16-19, margin to improve from 8.5% in FY16 to 11% in FY19. This will lead
to a stellar growth in PAT. Consolidated PAT of Trent is expected to reach Rs.239 Cr by FY19E from Rs. 65 Cr
in FY16.
Higher emphasis on small box format stores and improved financials would lead to superior revenue growth
for Trent. We expect return ratios RoE, RoCE to surge sharply from c.4.4% and 8.5% to 13.6%, 18.9%,
respectively in FY19E.
Average bill cycle of the company has seen 8% CAGR over FY12-16 and Walkins has increased from 20.36
mn in FY12 to 25.15 mn in FY16 and going forward, we expect the trend to continue which would drive
performance of the company in the coming years.

PCG RESEARCH
Private Client Group - PCG RESEARCH P a g e | 6
Attractive Brand Portfolio
Westside products are known for style and class amongst fashion conscious consumers. In recent years, the
chain has launched and refreshed a number of brands, available exclusively at Westside stores.
Over the years, Westside has been sharpening its focus on fast moving value fashion targeted towards
women. Industry, per se kids wear and women’s wear apparel segment are expected to outperform overall
apparel growth (Technopak Analysis). With the evolving trend of western wear Westside has private label
brands like Wardrobe, Gia, Lov, Sassy and Soda.
India’s ethnic wear is dominated by unorganized players. But now this trend is also changing and People are
choosing branded clothes. So Westside, through its in house brands like Zuba, Bombay Paisley, Westside Mix
and Match & Westside SKD has endeavored to capture this opportunity.
Talking about non-apparel businesses, Westside has brand like Footwear for Shoes Business, Studio west for
fragrances, Bath & Cosmetic business and Westside Home for Home Furnishing Industry.
The below are few of many brand at Trent’s Westside store.
Source: Company, HDFC sec Research

PCG RESEARCH
Private Client Group - PCG RESEARCH P a g e | 7
Private labels and In-house brand format Brings in Higher Margin
Westside has slightly different business model format compared to peers. It has focused on Private labels
and In-house brand products for batter margins. Apparel contributes 80% of overall Westside revenues while
the overall 90% of the revenue comes from Private labels and In-house brand products.
In-house brands offer higher margins to retailers as they allow them to have complete control across the
value chain right from designing merchandise, branding, sourcing, logistics, distribution, promotion, display,
fixing price points and retail margins. Where in the Private label brand they can get a pretty good discounts
from the retailers the procure product from. This also enables them to give attractive discount offers to their
customers.
Foot Print Expansion strategy will be a key growth driver for Westside
A team of in-house property experts helps in identifying strategic locations for new stores. They are
supported by a well-defined set of processes for analyzing the potential market and catchment. This
ecosystem of people and processes, helps the company in identifying the right store and making it profitable
in a relatively short span of time.
Currently, Westside is operating through 95 stores in 58 Cities of India. Now Westside is planning to
accelerate expansion in the coming years by focusing broadly on two formats flagship stores- the prominent
full offer stores and the curated smaller stores in non-metros/ emerging micro-markets.
Increasing reach of Westside
Source: Company, HDFC sec Research

PCG RESEARCH
Private Client Group - PCG RESEARCH P a g e | 8
Restructuring of Landmark will bring change
Landmark, which was primarily a music & books retail format, had been undergoing constant restructuring
due to increased threats from the internet, which resulted in a decline in book sales. The music segment was
especially impacted by free digital downloads, which further gained momentum through growth of smart
phones.
The company has taken major steps for the restructuring in Landmark business like significant reduction in
store, change of product mix etc. this will make this business more profitable one.
VIEW & VALUATION:
Favorable Indian Demographics, GST’s Favorable impact on whole Industry, Company’s expansion strategy
and continuously increasing Walk-ins & Avg. Bill size puts Trent into sweet spot. Moreover, recent listing of
DMart (Avenues supermarts) has led to re-rating of Retail Sector. We believe Trent deserves higher multiple
as being Tata Group Company, stable financials, strong balance sheet as well as strong Brand recall.
Currently stock is trading at 2x EV/Sales of FY19 and going forward we expect stock will trade at EV/Sales of
2.3x and 2.6x which brings the value of the stock at Rs 305 and 350. Stock trades at ~19x EV/EBITDA and
based upon our target of Rs 350, we have implied ~25x EV/EBITDA on FY19E basis. So we initiate Trent a
strong BUY at CMP and add on decline of 266 for the targets of Rs 305 & 350 for the period of 3-4 quarters.

PCG RESEARCH
Private Client Group - PCG RESEARCH P a g e | 9
Debt has been reduced significantly
Source: Company, HDFC sec Research
Tremendous growth in PAT
Source: Company, HDFC sec Research
Revenue to witness CAGR of 22% over FY16-19E
Source: Company, HDFC sec Research
InHouse Brands to drive Higher margin in the Business
Source: Company, HDFC sec Research

PCG RESEARCH
Private Client Group - PCG RESEARCH P a g e | 10
Average bill size in increasing trend
Source: Company, HDFC sec Research
Walkins (No. In Millions)
Source: Company, HDFC sec Research

PCG RESEARCH
Private Client Group - PCG RESEARCH P a g e | 11
Income Statement (Cr)
Year ending March FY15 FY16 FY17E FY18E FY19E
Net Revenue 2284 2397 2949 3547 4311
Other Income 97.2 66.2 91.4 110.4 128.9
Total Income 2381 2464 3040 3658 4440
Growth (%) -0.5 3.4 23.4 20.3 21.4
Operating Expenses 2212 2260 2760 3291 3968
EBITDA 169 203 280 366 471
Growth (%) 139.1 19.9 38.0 30.6 28.7
EBITDA Margin (%) 7.4 8.5 9.5 10.3 10.9
Depreciation 74 67 74 82 92
EBIT 95 136 206 284 380
Interest 11 36 37 36 38
Exceptional Items 115 3 0 0 0
PBT 200 103 169 249 341
Tax 70 40 54 80 109
RPAT 129 63 115 169 232
Growth (%) LP -51.2 82.3 46.8 37.2
EPS 3.9 1.9 3.5 5.1 7.0
Source: Company, HDFC sec Research
Balance Sheet (Cr)
(Rs Cr) FY15 FY16 FY17E FY18E FY19E
SOURCE OF FUNDS
Share Capital 33.2 33.2 33.2 33.2 33.2
Reserves 1388.7 1404.9 1481.8 1594.0 1758.2
Minority Interest 2.6 10.3 10.0 10.0 10.0
Shareholders' Funds 1422.0 1438.1 1515.0 1627.2 1791.5
Total Debt 112.5 87.5 110.5 122.5 128.5
Long Term Provisions & Others 62.7 51.3 60.0 70.0 80.0
Total Source of Funds 1599.8 1587.2 1695.5 1829.7 2010.0
APPLICATION OF FUNDS
Net Block 734.4 806.9 883.0 921.0 1029.4
Investment 681.7 700.8 712.1 737.1 802.6
Long Term Loans & Advances 160.9 100.3 111.5 124.3 139.0
Total Non Current Assets 1576.9 1608.0 1706.5 1782.4 1971.0
Current Investments 58.0 25.8 53.8 63.8 98.8
Inventories 329.9 355.3 428.2 505.4 617.7
Trade Receivables 17.7 19.0 24.2 29.2 35.4
Short term Loans & Advances 160.5 222.3 233.4 245.1 257.3
Cash & Equivalents 55.5 63.0 77.8 154.6 114.7
Other Current Assets 8.0 5.6 3.5 3.7 3.9
Total Current Assets 629.7 690.9 821.0 1001.7 1127.8
Short-Term Borrowings 4.4 4.0 10.0 11.0 12.1
Trade Payables 221.3 241.6 306.3 379.2 461.2
Other Current Liab & Provisions 257.1 451.1 496.2 535.8 578.7
Short-Term Provisions 124.1 15.0 19.5 28.3 36.8
Total Current Liabilities 606.8 711.7 831.9 954.4 1088.8
Net Current Assets 22.9 -20.7 -11.0 47.4 39.0
Total Application of Funds 1599.8 1587.2 1695.6 1829.8 2010.0
Source: Company, HDFC sec Research

PCG RESEARCH
Private Client Group - PCG RESEARCH P a g e | 12
Cash Flow (Rs Cr)
Year ending March FY15 FY16 FY17E FY18E FY19E
Reported PBT 199.5 103.4 169.3 248.6 341.2
Non-operating & EO items 219.8 -83.3 -91.4 -110.4 -128.9
Interest Expenses 10.7 35.6 37.1 35.6 38.4
Depreciation 74.3 67.5 73.9 82.0 91.6
Working Capital Change 258.5 51.2 2.9 18.5 -31.6
Tax Paid -70.1 -40.3 -54.2 -79.6 -109.2
OPERATING CASH FLOW ( a ) 692.8 134.1 137.7 194.7 201.5
Capex -13.8 -140.0 -150.0 -120.0 -200.0
Free Cash Flow 678.9 -6.0 -12.3 74.7 1.5
Investments -440.7 41.3 -20.2 -37.9 -80.2
Non-operating income 97.2 66.2 91.4 110.4 128.9
INVESTING CASH FLOW ( b ) -357.4 -32.5 -78.8 -47.5 -151.3
Debt Issuance / (Repaid) -297.9 -36.4 31.7 22.0 16.0
Interest Expenses -10.7 -35.6 -37.1 -35.6 -38.4
FCFE 370.3 -77.9 -17.7 61.1 -20.8
Share Capital Issuance 0.0 7.7 -0.3 0.0 0.0
Dividend -33.2 -29.9 -38.2 -56.8 -67.8
FINANCING CASH FLOW ( c ) -341.8 -94.1 -44.0 -70.4 -90.2
NET CASH FLOW (a+b+c) -6.4 7.4 14.9 76.8 -39.9
Closing Cash 55.5 62.9 77.8 154.6 114.7
Source: Company, HDFC sec Research
Key Ratio %
FY15 FY16 FY17E FY18E FY19E
Profitability
EBITDA Margin 7.4 8.5 9.5 10.3 10.9
EBIT Margin 4.2 5.7 7.0 8.0 8.8
APAT Margin 5.7 2.6 3.9 4.8 5.4
RoE 10.7 4.4 7.8 10.8 13.6
RoCE 5.9 8.5 12.2 15.5 18.9
Solvency Ratio
Net Debt/EBITDA (x) 2.0 1.3 -4.0 -23.2 -15.5
D/E 0.1 0.1 0.1 0.1 0.1
Interest Coverage 8.9 3.8 5.6 8.0 9.9
PER SHARE DATA
EPS 3.9 1.9 3.5 5.1 7.0
CEPS 6.1 3.9 5.7 7.6 9.7
BV 42.8 43.3 45.6 49.0 53.9
Dividend 1.0 0.9 1.0 1.5 1.8
Turnover Ratios (days)
Debtor days 2.8 2.9 3.0 3.0 3.0
Inventory days 54.8 52.2 53.0 52.0 52.3
Creditors days 60.8 66.8 68.0 70.0 71.0
Working capital days -3.1 -11.8 -12.0 -15.0 -15.7
VALUATION (x)
P/E 68.3 140.4 76.8 52.3 38.1
P/BV 6.2 6.1 5.8 5.4 4.9
EV/EBITDA 52.3 43.6 31.6 24.2 18.8
EV / Revenues 3.9 3.7 3.0 2.5 2.1
Dividend Yield (%) 0.4 0.3 0.4 0.6 0.7
Source: Company, HDFC sec Research
PCG RESEARCH
Private Client Group - PCG RESEARCH P a g e | 13
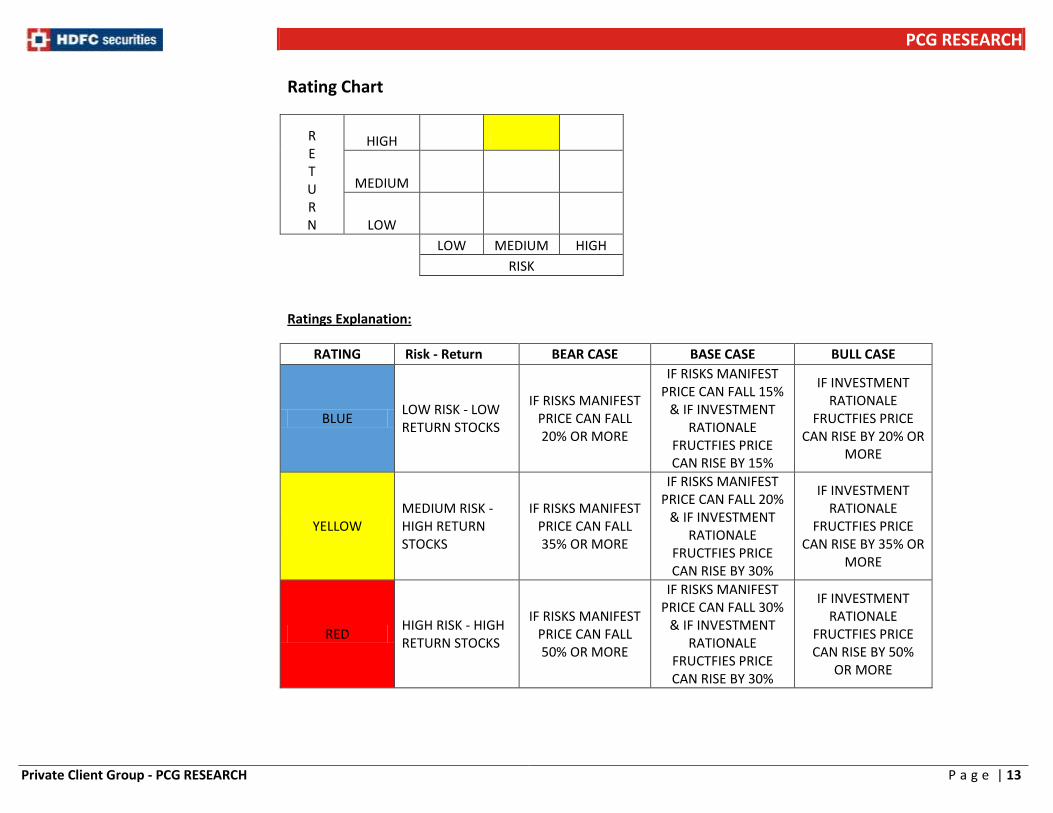
Rating Chart
R E T U R N
HIGH
MEDIUM
LOW
LOW MEDIUM HIGH
RISK
Ratings Explanation:
RATING Risk - Return BEAR CASE BASE CASE BULL CASE
BLUE LOW RISK - LOW RETURN STOCKS
IF RISKS MANIFEST PRICE CAN FALL 20% OR MORE
IF RISKS MANIFEST PRICE CAN FALL 15%
& IF INVESTMENT RATIONALE
FRUCTFIES PRICE CAN RISE BY 15%
IF INVESTMENT RATIONALE
FRUCTFIES PRICE CAN RISE BY 20% OR
MORE
YELLOW MEDIUM RISK - HIGH RETURN STOCKS
IF RISKS MANIFEST PRICE CAN FALL 35% OR MORE
IF RISKS MANIFEST PRICE CAN FALL 20%
& IF INVESTMENT RATIONALE
FRUCTFIES PRICE CAN RISE BY 30%
IF INVESTMENT RATIONALE
FRUCTFIES PRICE CAN RISE BY 35% OR
MORE
RED HIGH RISK - HIGH RETURN STOCKS
IF RISKS MANIFEST PRICE CAN FALL 50% OR MORE
IF RISKS MANIFEST PRICE CAN FALL 30%
& IF INVESTMENT RATIONALE
FRUCTFIES PRICE CAN RISE BY 30%
IF INVESTMENT RATIONALE
FRUCTFIES PRICE CAN RISE BY 50%
OR MORE

PCG RESEARCH
Private Client Group - PCG RESEARCH P a g e | 14
Rating Definition:
Buy: Stock is expected to gain by 10% or more in the next 1 Year. Sell: Stock is expected to decline by 10% or more in the next 1 Year.

PCG RESEARCH
Private Client Group - PCG RESEARCH P a g e | 15
I, Nisha Sankhala, MBA, author and the name subscribed to this report, hereby certify that all of the views expressed in this research report accurately reflect our views about the subject issuer(s) or securities. We also certify that no part of our compensation was, is, or will be directly or indirectly related to the specific recommendation(s) or view(s) in this report. Research Analyst or his/her relative or HDFC Securities Ltd. does not have any financial interest in the subject company. Also Research Analyst or his relative or HDFC Securities Ltd. or its Associate may have beneficial ownership of 1% or more in the subject company at the end of the month immediately preceding the date of publication of the Research Report. Further Research Analyst or her relative or HDFC Securities Ltd. or its associate does not have material conflict of interest. Any holding in stock – NO Disclaimer: This report has been prepared by HDFC Securities Ltd and is meant for sole use by the recipient and not for circulation. The information and opinions contained herein have been compiled or arrived at, based upon information obtained in good faith from sources believed to be reliable. Such information has not been independently verified and no guaranty, representation of warranty, express or implied, is made as to its accuracy, completeness or correctness. All such information and opinions are subject to change without notice. This document is for information purposes only. Descriptions of any company or companies or their securities mentioned herein are not intended to be complete and this document is not, and should not be construed as an offer or solicitation of an offer, to buy or sell any securities or other financial instruments. This report is not directed to, or intended for display, downloading, printing, reproducing or for distribution to or use by, any person or entity who is a citizen or resident or located in any locality, state, country or other jurisdiction where such distribution, publication, reproduction, availability or use would be contrary to law or regulation or what would subject HDFC Securities Ltd or its affiliates to any registration or licensing requirement within such jurisdiction. If this report is inadvertently send or has reached any individual in such country, especially, USA, the same may be ignored and brought to the attention of the sender. This document may not be reproduced, distributed or published for any purposes without prior written approval of HDFC Securities Ltd . Foreign currencies denominated securities, wherever mentioned, are subject to exchange rate fluctuations, which could have an adverse effect on their value or price, or the income derived from them. In addition, investors in securities such as ADRs, the values of which are influenced by foreign currencies effectively assume currency risk. It should not be considered to be taken as an offer to sell or a solicitation to buy any security. HDFC Securities Ltd may from time to time solicit from, or perform broking, or other services for, any company mentioned in this mail and/or its attachments. HDFC Securities and its affiliated company(ies), their directors and employees may; (a) from time to time, have a long or short position in, and buy or sell the securities of the company(ies) mentioned herein or (b) be engaged in any other transaction involving such securities and earn brokerage or other compensation or act as a market maker in the financial instruments of the company(ies) discussed herein or act as an advisor or lender/borrower to such company(ies) or may have any other potential conflict of interests with respect to any recommendation and other related information and opinions. HDFC Securities Ltd, its directors, analysts or employees do not take any responsibility, financial or otherwise, of the losses or the damages sustained due to the investments made or any action taken on basis of this report, including but not restricted to, fluctuation in the prices of shares and bonds, changes in the currency rates, diminution in the NAVs, reduction in the dividend or income, etc. HDFC Securities Ltd and other group companies, its directors, associates, employees may have various positions in any of the stocks, securities and financial instruments dealt in the report, or may make sell or purchase or other deals in these securities from time to time or may deal in other securities of the companies / organizations described in this report. HDFC Securities or its associates might have managed or co-managed public offering of securities for the subject company or might have been mandated by the subject company for any other assignment in the past twelve months. HDFC Securities or its associates might have received any compensation from the companies mentioned in the report during the period preceding twelve months from the date of this report for services in respect of managing or co-managing public offerings, corporate finance, investment banking or merchant banking, brokerage services or other advisory service in a merger or specific transaction in the normal course of business. HDFC Securities or its analysts did not receive any compensation or other benefits from the companies mentioned in the report or third party in connection with preparation of the research report. Accordingly, neither HDFC Securities nor Research Analysts have any material conflict of interest at the time of publication of this report. Compensation of our Research Analysts is not based on any specific merchant banking, investment banking or brokerage service transactions. HDFC Securities may have issued other reports that are inconsistent with and reach different conclusion from the information presented in this report. Research entity has not been engaged in market making activity for the subject company. Research analyst has not served as an officer, director or employee of the subject company. We have not received any compensation/benefits from the Subject Company or third party in connection with the Research Report. HDFC Securities Ltd. is a SEBI Registered Research Analyst having registration no. INH000002475 HDFC securities Limited, I Think Techno Campus, Building - B, "Alpha", Office Floor 8, Near Kanjurmarg Station, Opp. Crompton Greaves, Kanjurmarg (East), Mumbai 400 042
HDFC securities Limited, 4th Floor, Above HDFC Bank, Astral Tower, Nr. Mithakali 6 Road, Navrangpura, Ahmedabad-380009, Gujarat.
Website: www.hdfcsec.com Email: [email protected]