research ict solutions
TRANSCRIPT

OTT APPLICATIONS DRIVING DATA REVENUE GROWTH
Research ICT Solutions
25 JUNE 2018
ITS SEOUL

OTT’S AS A THREATREGULATORS • OTTs have had a “negative impact on the industry” (Council of African
Regulators) • MNO revenues are not growing, caused by declining voice and SMS revenues
and stagnant or slow-growing data revenues (Orange and Sonatel) • “OTT players [should] pay for the infrastructure use” (Kenya) • “OTTs should be blocked, like in the United Arab Emirates” (Benin). • Introduction of OTT tax in Uganda
ACADEMICS • Mobile revenues have stagnated or declined as a result of OTTs - Jayakar et al
(2014) and Barclay (2015) • OTTs represent a measurable threat to operator revenues - Sujata, et al (2015). • Regulation needs to be introduced to prevent the erosion of operator revenues
- Nandhiasa et al (2015)
RIS

SOURCES OF MNO REVENUES
• Number of subscribers, subscriber profiles, product design, retail prices, level of competition in the sector, regulation…
• Economic factors: population, GDP per capita, exchange rates;
• Regulatory environment: number of MNOs, fairness of competition and transparency and predictability of regulatory interventions;
• Operator strategies: product design, response to other operators and business model.
RIS

REGULATORY INTERVENTION
•Should a regulator protect mobile operators against technological change?
•Should an operator with declining revenues and market share be protected against those with increasing revenues and market share?
RIS

TRENDS TOWARDS “ACCESS” ONLY BUSINESS MODELS
RIS
2000 2005 2010 2015 2020
100%40%30%20%
60%70%
80%
100%Voice + SMS Data

DATA REVENUES WILL REPLACE VOICE AND SMS REVENUES
Mobile operators will eventually become “access” providers, distinguishing their products by speed and quality of service, and competing with other forms of access, such as Public WiFi and connectivity in places of work, study and home. Drivers of data usage • Competition • Smartphone penetration and 3G+ network coverage • User driven content (Facebook, Instagram)
RIS
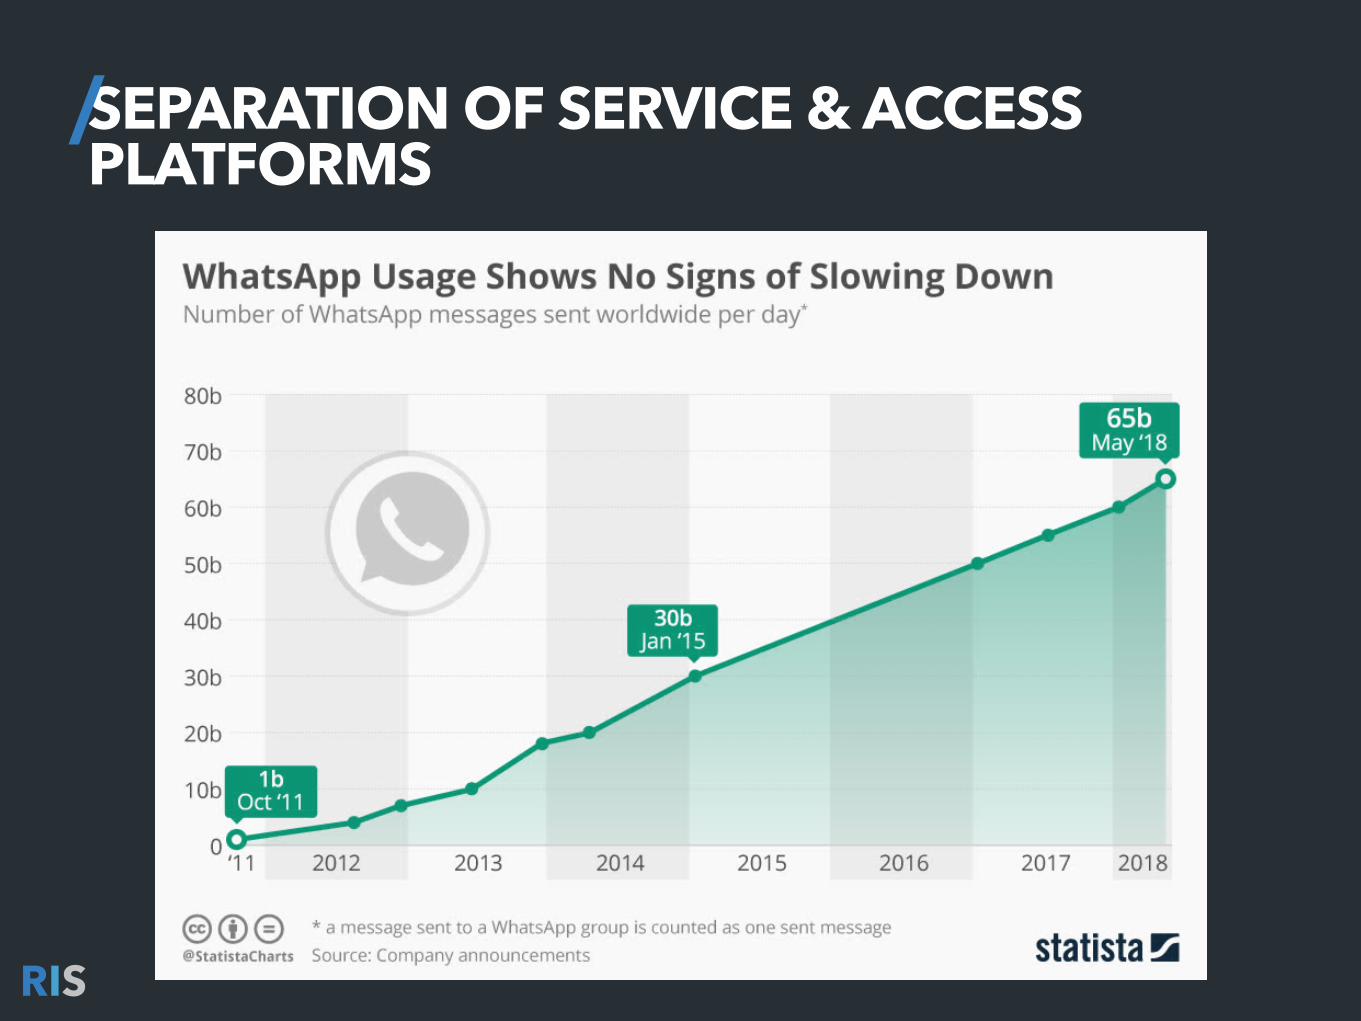
SEPARATION OF SERVICE & ACCESS PLATFORMS
RIS

MOBILE REVENUE TRENDS IN AFRICA - VODACOM GROUP
RIS

VODACOM
RIS
Service revenues 2016 2017 2018
TanzaniaTSH million 923,347 933,292 977,994
YoY 1.1% 4.8%
DRCUSD ‘000 429,605 407,413 428,169
YoY -5.2% 5.1%
MozambiqueMZN million 11,896 14,641 17,635
YoY 23.1% 20.4%
LesothoLSL millions 1,027 1,116 1255
YoY 8.7% 12.5%
Subs
crib
ers
in
1000
2013 2014 2015 2016 2017
10,4009,70211,21610,0087,706
Vodacom’s DRC subscriber numbers

VODACOM SOUTH AFRICA
RIS
2013 2014 2015 2016 2017 2018
data as % of service revenues 4G coverage 3G coverage99%99%99%96%92%
85%80.1%75.8%
58%
35% 43%40%35%
29%23%
18%18%23%
29%35%
40% 43%

VODACOM GROUP
• Overall revenues on group level increased for each year since 2013. There is no reason to suspect that Vodacom is adversely affected by OTTs.
RIS
Vodacom Service revenues
2013 2014 2015 2016 2017 2018
South Africa
R million 56,821 59,314 59,203 62,279 64,729 69,967
YoY 4.4% -0.2% 5.2% 3.9% 8.1%
GroupR million 68,131 73,219 74,500 80,077 81,278 86,370
YoY 7.5% 1.7% 7.5% 1.5% 6.3%

MOBILE REVENUE TRENDS IN AFRICA - ORANGE
RIS

RIS
Orange mobile revenues 2013 2014 2015 2016 2017
Cote d’Ivoire1Euro million 623 680 760 798 821
YoY 9.1% 11.8% 5.0% 2.9%
GuineaEuro million 133 216 249 246 280
YoY 62.4% 15.3% -1.2% 13.8%
MaliEuro million 347 415 456 494 569
YoY 19.6% 9.9% 8.3% 15.2%
NigerEuro million 91.0 104.0 103.0 94.0 88.0
YoY 14.3% -1.0% -8.7% -6.4%
Senegal2Euro million 439 442 454 464
YoY 0.7% 2.7% 2.2%
CameroonEuro million 287 285 284 278 281
YoY -0.7% -0.4% -2.1% 1.1%
Burkina FasoEuro million 195 246
YoY 26.2%
DRCEuro million 62 105 149 257 239
YoY 69.4% 41.9% 72.5% -7.0%
MTN saw decline

ORANGE CLAIMS
• If the claim that OTTs were negatively affecting revenues were true, then all Orange operators should have experienced consistently declining revenues.
• Of the eight operators, four had consistently increasing revenues, two were subject to revenue volatility.
• Only two had consistently declining revenues and had either macro-economic or sector specific challenges that rule out OTTs as the only explanation for declining revenues.
RIS

MOBILE REVENUE TRENDS IN AFRICA - AIRTEL
RIS

MINUTES AND MB ON AIRTEL’S AFRICA NETWORKS
RIS
17,500
35,000
52,500
70,000
Sep
2012
Dec
2012
Mar
201
3Ju
n-13
Sep-
13De
c-13
Mar
-14
Jun-
14Se
p-14
Dec-
14M
ar-1
5Ju
n-15
Sep-
15De
c-15
Mar
-16
Mar
-16
Jun-
16Se
p-16
Dec-
16M
ar-1
7Ju
n-17
Sep-
17
Minutes on the network Total MBs on the network

AIRTEL’S DATA AND SMS AS PERCENT OF MOBILE REVENUES
RIS
5%
9%
14%
18%
Mar
201
2 J
un 2
012
Sep
201
2 D
ec 2
012
Mar
201
3Ju
n-13
Sep-
13De
c-13
Mar
-14
Jun-
14Se
p-14
Dec-
14M
ar-1
5Ju
n-15
Sep-
15De
c-15
Mar
-16
Mar
-16
Jun-
16Se
p-16
Dec-
16M
ar-1
7
Messaging & VAS as % of mobile revenuesData as % of mobile revenues

MOBILE REVENUE TRENDS IN AFRICA - MAROC TELECOM
RIS

MAROC TELECOM GROUP
RIS
Q1
2015
Q2
2015
Q3
2015
Q4
2015
Q1
2016
Q2
2016
Q3
2016
Q4
2016
Q1
2017
Q2
2017
Q3
2017
3,7113,4793,3993,4423,4773,4313,4663,4213,332
3,173
2,663
Mobile service revenues (international) of Maroc Telecom in MAD million

MOBILE REVENUE TRENDS IN AFRICA - MTN
RIS

MTN’S REVENUE IN LOCAL CURRENCY EXPRESSED IN % OF Q1 2013 REVENUES
RIS
0%
50%
100%
150%
200%
250%
1Q13 3Q13 1Q14 3Q14 1Q15 3Q15 1Q16 3Q16 1Q17 3Q17
Benin Bissau Conakry Ghana Ivory Coast LiberiaNigeria South Africa Uganda

MTN LIBERIA ECONOMIC SHOCK AND DECLINING SUBSCRIBER NUMBERS
RIS

MTN LIBERIA - ECONOMIC SHOCK AND DECLINING SUBSCRIBER NUMBERS
RIS
2013 2014 2015 2016
-4.04-2.42-1.69
6.05
GDP per capita annual growth in %
425,000
850,000
1,275,000
1,700,000
1Q 2
016
2Q 2
016
3Q 2
016
4Q 2
016
1Q 2
017
2Q 2
017
3Q 2
017
4Q 2
017
MTN Orange
Subscriber numbers of MTN and Orange in Liberia (Source: annual reports)

GUINEA FOREIGN EXCHANGE AND COMPETITIVE FACTORS
RIS

MTN GUINEA - FOREIGN EXCHANGE AND COMPETITIVE FACTORS
RIS
MTN Guinea 2013 2014 2015 2016 2017
Total RevenuesR million 1,501 1,274 1,203 1,032 932
YoY -15% -6% -14% -10%
EBITDA R million 447 193 121 -169 39
EBITA Margin % 30% 15% 10% -16% 4%
Subscribers Q4 in 1000s 2,723 3,035 3,244 2,563 2,648
Cost R million 1,081 1,082 1,201 892
Orange recorded 13.5% increase

MTN GUINEA NOT JUST FX BUT ALSO CHURN TO ORANGE
RIS
Subs
crib
ers
in 1
000
900
1,800
2,700
3,600
Reve
nue
in G
uine
a Fr
anc
billio
n
22.5
45
67.5
90
1Q13
2Q13
3Q13
4Q13
1Q14
2Q14
3Q14
4Q14
1Q15
2Q15
3Q15
4Q15
1Q16
2Q16
3Q16
4Q16
1Q17
2Q17
3Q17
4Q17
Revenue in Guinea Franc billion Subscribers in 1000
* Revenues calculated by multiplying ARPUs by subscribers

SONATEL’S GUINEA KPIS
RIS
2014 2015 2016 2017
ARPU 29,570 25,500 26,006 26,448
Subscribers in 1000 4,506 5,276 6,033 6,783
Revenues (local) billion 133.2 134.5 156.9 179.4
YoY 1.0% 16.6% 14.4%
Source Sonatel Financial year 2017 presentation

MTN NIGERIA REVENUE IMPACT OF REGULATORY INTERVENTIONS
RIS

MTN NIGERIA - REVENUE IMPACT OF REGULATORY INTERVENTIONS
• SIM registration in a permanent building
• 330 billion Naira (USD 1.67 billion) fine for contravening SIM registration regulations
• Lost 8.8 million subscribers
• Implemented and withdrawn price floor regulations (twice)
RIS

RIS
MTN Nigeria 2013 2014 2015 2016 2017
Revenue
TotalR million 48,159 53,995 51,942 47,122 36,005
YoY 12% -4% -9% -24%
VoiceR million 39,177 42,405 40,845 36,430 26,756
% of total 81.3% 78.5% 78.6% 77.3% 74.3%
SMSR million 1,166 1,036 840 646 514
% of total 2.4% 1.9% 1.6% 1.4% 1.4%
Data
R million 7,285 10,047 10,113 9,943 8,249
% of total 15.1% 18.6% 19.5% 21.1% 22.9%
% of voice 18.6% 23.7% 24.8% 27.3% 30.8%
EBITDA R million 27,457 31,620 27,504 21,854 14,041
EBITA Margin % 57% 59% 53% 46% 39%
Subscribers Q4 in 1000s 56,766 59,893 61,252 61,970 52,273

MTN NIGERIA - REVENUES ESTIMATED BASED ON ARPU MULTIPLIED BY SUBSCRIBERS COMPARED TO SUBSCRIBERS
RIS
Subs
crib
ers
in 1
000
17,500
35,000
52,500
70,000
Reve
nue
in N
aira
milli
on
20,000
40,000
60,000
80,000
1Q13
2Q13
3Q13
4Q13
1Q14
2Q14
3Q14
4Q14
1Q15
2Q15
3Q15
4Q15
1Q16
2Q16
3Q16
4Q16
1Q17
2Q17
3Q17
4Q17
Revenue in Naira million Subscribers in 1000

MTN GHANA SUCCESS OF A DATA CENTRIC BUSINESS MODEL
RIS

MTN GHANA - SUCCESS OF A DATA CENTRIC BUSINESS MODEL
RIS
1H 12 2H 12 1H 13 2H 13 1H14 2H14 1H15 2H15 1H16 2H16 1H17 2H17
96%93%85%
64%
50%
38%
27%21%
14%8%6%7%
31%30%32%24%25%23%21%18%18%19%17%
13%
MTN Nigeria MTN Ghana
Data as % of voice and SMS

RIS
MTN Ghana 2013 2014 2015 2016 2017
Revenues
Total R million 8,269 7,149 7,903 10,291 10,382
YoY -14% 11% 30% 1%
VoiceR million 6,966 5,559 5,336 5,794 5,113
% of total 84% 78% 68% 56% 49%
SMSR million 324 82 78 86 86
% of total 4% 1% 1% 1% 1%
Data a)R million 801 1,343 2,418 4,337 4,924
% of total 10% 19% 31% 42% 47%
EBITDA R million 3,102 2,674 3,197 4,184 4,116
EBITA Margin % 38% 37% 40% 41% 40%
Subscribers Q4 in 1000s 12,930 13,852 16,255 19,296 15,667

CONCLUSION• Revenue growth = up • Data revenues = up • Voice and SMS = steady to gradually declining Small subset of operators where revenues are declining: • Insufficient 3G+ network coverage • excessive regulation • adverse operating conditions Operators with extensive 3/4G coverage are able to increase their data revenues, compensates for any losses in voice or SMS Policy makers and regulators should be more concerned with stimulating network investment into 4G+ and less with attempting to protect operators from the impact of OTTs
RIS

RIS
Research ICT Solutions
STEVE ESSELAAR PARTNER, RIS
MBA +1 778 865 5695
DR. CHRISTOPH STORK PARTNER, RIS
PHD, ECONOMICS +27 84 999 000 2
www.researchictsolutions.com