research fishing and fish health monitoring post-dredging ... · 09/03/2015 . dr lachlan barnes :...
TRANSCRIPT
Research Fishing and Fish Health Monitoring Post-dredging Report Season 1
Ichthys Nearshore Environmental Monitoring Program
Prepared for INPEX March 2015
Research Fishing and Fish Health Monitoring Post-dredging Report Season 1 Ichthys Nearshore Environmental Monitoring Program L384-AW-REP-10223

Research Fishing and Fish Health Monitoring Post-dredging Report Season 1 Ichthys Nearshore Environmental Monitoring Program
Document Information Prepared for INPEX Project Name Ichthys Nearshore Environmental Monitoring Program File Reference L384-AW-REP-10223_0_Research Fishing and Fish Health Post-dredging Report
Season 1.docm Job Reference L384-AW-REP-10223 Date March 2015
Contact Information Cardno (NSW/ACT) Pty Ltd Cardno (WA) Pty Ltd Cardno (NT) Pty Ltd Level 9, The Forum 11 Harvest Terrace Level 6, 93 Mitchell Street 203 Pacific Highway West Perth WA 6005 Darwin NT 0800 St Leonards NSW 2065 Telephone: 02 9496 7700 Telephone: 08 9273 3888 Telephone: 08 8942 8200 Facsimile: 02 9499 3902 Facsimile: 08 9486 8664 Facsimile: 08 8942 8211 International: +61 2 9496 7700 International: +61 8 9273 3888 International: +61 8 8942 8211 www.cardno.com.au www.cardno.com.au www.cardno.com.au
Document Control Version Date Author Author
Initials Reviewer Reviewer
Initials
A 15/01/2015 Dr Lachlan Barnes Blaise Bratter Dr Andrea Nicastro
LB BB AN
Dr Isabel Jimenez IJ
B 09/03/2015 Dr Lachlan Barnes LB Dr Isabel Jimenez IJ
0 26/03/2015 Dr Lachlan Barnes LB Christopher Holloway CGH
This document is produced by Cardno solely for the benefit and use by the client in accordance with the terms of the engagement for the performance of the Services. Cardno does not and shall not assume any responsibility or liability whatsoever to any third party arising out of any use or reliance by any third party on the content of this document.
Prepared for INPEX Cardno ii

Research Fishing and Fish Health Monitoring Post-dredging Report Season 1 Ichthys Nearshore Environmental Monitoring Program
Executive Summary A Recreational Fishing and Fish Health Monitoring Program has been developed to detect potential changes in patterns of recreational fishing and catch rates, and incidences of ill-health in key recreationally targeted fish species in order to assess whether any changes observed are a result of dredging activities associated with the Ichthys LNG Project (the Project) in Darwin Harbour. The program involves seasonal fishery-dependent recreational fishing surveys as well as fishery-independent standardised fish sampling and fish health assessments at two locations potentially affected by Project dredging and construction activities (Darwin Harbour – Inner (DI) and Darwin – Outer (DO)) and, when possible, at two Control locations (Bynoe Harbour (BH) and Adelaide River (AR)).
This report provides a description and interpretation of data collected during the Research Fishing and Fish Health Monitoring Program (RFFHMP) Post-dredging Season 1 (P1) (‘dry’ season sampling: 15 to 23 October 2014) component of the Recreational Fishing and Fish Health Monitoring Program at DI, DO and BH. The P1 sampling season was conducted approximatley four months and three months following the cessation of Project East Arm (EA) and Gas Export Pipeline (GEP) dredging operations in Darwin Harbour respectively. Sampling during P1 provided the first opportunity to examine potential short to medium-term changes in standardised measures of recreational fishing quality (e.g. catch rates, species composition and size-frequency distribution) and fish health since the completion of Project dredging activities. In addition, data collected during P1 was compared to climatically similar Baseline Phase (‘dry’ season: Baseline Survey 1 (B1); August/September 2012 and Baseline Survey 2 (B2); October 2012) and all previous Dredging Phase sampling seasons. Dredging Phase sampling occured near the start (Dredging Sampling Season 1 (D1) – November/December 2013) and the end (Dredging Sampling Season 2 (D2) – March 2013) of the 2012/2013 wet season (Season One EA dredging); during the 2013 dry season dredging hiatus (Dredging Sampling Season (D3) – October 2013) and during GEP dredging operations and Season Two EA dredging operations near the end of the 2013/2014 wet season (Dredging Sampling Season 4 (D4) – March 2014)). These comparisons facilitated the examination of potential longer-term trends in recreational fishing quality and fish health as well as the influence of natural processes on these parameters within the Darwin region.
Research Fishing during P1 involved standardised Research Angling (RA), Research Potting (RP) and supplementary fishing techniques (e.g. gillnetting) to catch finfish and crab species within the waters in the Darwin Harbour region and Bynoe Harbour. Standardised RA and RP approaches used typical angling and potting equipment at comparable fishing sites across multiple sampling seasons to facilitate temporal and spatial comparisons of standardised catch parameters. In addition, all sampling methods provided specimens for detailed external and internal examinations to collect information on parasitological and histopathological characteristics and any spatial and temporal differences in these health indicators.
During P1 golden snapper, blue tuskfish and Moses snapper were the most commonly caught finfish species at DI, DO and BH respectively, while mud crab and sand crabs were the most commonly caught crustacean species. Barramundi, queenfish and king threadfin were also sampled using supplementary sampling techniques. No introduced (pest) finfish or crab species were detected during P1 or as part of the Recreational Fishing and Fish Health Monitoring Program sampling (fishery-dependent and fishery-independent) activities completed to date.
The species composition of finfish catches at DI and BH was similar during P1, although significantly different at each of these locations from that recorded at DO. This difference resulted from higher catch rates of golden snapper and javelin fish at DI and BH compared to DO, while blue tuskfish and stripey snapper were more frequently caught at DO. Differences between these locations during P1 were also apparent during the Baseline and Dredging Phase sampling seasons and are likely associated with the disparate environmental and bathymetric characteristics of sites sampled between locations (DI and BH are estuarine dominated while DO are primarly open ocean). Significant temporal differences in finfish catch composition at each location was also detected which was primarily related to differences in catches between D4 (‘wet’) sampling season and B2, D1 and P1 (‘dry’) sampling seasons. Differences in catches between these climatic seasons were primarily driven by the absence of Moses snapper in D4 catches and differences in the frequency blue tuskfish, golden snapper and javelin fish were caught between wet (D4) compared to dry (B2, D1 and P1) sampling seasons. Seasonal changes in Moses snapper catchability are
Prepared for INPEX Cardno iii
Research Fishing and Fish Health Monitoring Post-dredging Report Season 1 Ichthys Nearshore Environmental Monitoring Program
likely related to differences in recruitment, growth, mortality as well as migratory patterns. Analysis of standardised species-specific catch rates and catch compositions during P1 provide no evidence to suggest Project dredging activities have affected finfish catches.
Significant differences in the diversity of animals caught and the catch rates of animals using RP sampling techniques were detected among locations during P1. These differences in catches among locations DI, DO and BH have however been generally consistent throughout the RFFHMP and variations in catches among sampling seasons have been generally consistent at DI, DO and BH. During P1, the mean catch rates (mean number per pot ± SE) of mud crabs pooled among sampling seasons was significantly higher at DO (0.4 ± 0.1) compared to DI and BH (both 0.2 ± 0.0). While the catch rates of mud crabs were significantly lower pooled among locations during P1 (0.1 ± <0.1) and D4 (0.2 ± <0.1) sampling seasons compared to during Baseline Phase (B2; 0.3 ± 0.1) and other Dredging Phase (D1; 0.3 ± <0.1, D2; 0.4 ± 0.1 and D3; 0.4 ± 0.1) sampling seasons. There is no evidence to suggest these results are related to Project dredging or construction activities rather they have likely been influenced by natural variability in mud crab abundances (or catchability) occurring at large spatial and temporal scales.
Of the 560 finfish and 99 crustaceans sampled, 183 and 60 respectively were subjected to intensive external and internal examinations in the laboratory. The suite of parasites and pathological infections identified during P1 in the laboratory were similar to those recorded during Baseline and Dredging Phase sampling seasons. The length (finfish: fork caudal length and crab: carapace width) to weight relationship of finfish and crabs frequently examined during P1 did not provided any evidence of chronic or acute weight loss potentially indicative of ill-health due to parasitological or bacterial infections. Similarly, the examination of trends in the prevalence and intensity of infections for a range of heteroxenous parasites (i.e. parasites with complex lifecycles including intermediate host/s and/or ecological pathways) such as metazoan parasites and monoxeneous parasites (i.e. parasites with a direct lifecycle in only one host) such as dactylogyrid monogenean worms provided no evidence of conspicuous immuno-suppression or ‘ill-health’ in the specimens examined. Spatial and temporal variability in the prevalence of dactylogyrid monogeneans infections in barramundi suggest that climatic variability in temperature and salinity alone may not explain differences recorded during P1 and throughout Baseline and Dredging Phase sampling seasons. On the balance of the available evidence, Project dredging activities do not appear to have affected the general health of the finfish and crabs sampled in the Darwin Harbour region during P1 or the Dredging Phase.
Prepared for INPEX Cardno iv

Research Fishing and Fish Health Monitoring Post-dredging Report Season 1 Ichthys Nearshore Environmental Monitoring Program
Glossary
Term or Acronym Definition
Access point survey (APS) An on-site, intercept/interview design that is used when fishers use defined access points to enter and leave the fishery (e.g. boat ramps)
Adelaide River (AR) Control location to the east of Darwin Harbour.
AFANT Amateur Fishing Association of Northern Territory
Baseline 1 (B1) First Baseline Phase sampling season; 3 August 2012 to 15 September 2012
Baseline 2 (B2) Second Dredging Phase sampling season; 7 October 2012 to 26 October 2012
Before-After-Control-Impact (‘BACI’) Analytical framework that incorporates sampling Before and After at multiple Control and Impact locations or sites
Bonferroni correction Method used to counteract the problem of multiple comparisons. It is considered the simplest and most conservative method to control the familywise error rate
BP Baseline Phase (B1 and B2 combined)
Bray-Curtis similarities A statistic used to quantify the compositional dissimilarity between two different sites, based on counts at each site
Bynoe Harbour (BH) Control location to the west of Darwin Harbour.
Carapace Hard, one-piece exoskeletal (shell) covering of the thorax (main body) of crustaceans
Catch Number (or weight) of all fish caught (retained and released combined)
Catch component Separate portions of the total catch, delineated by species (and/or defined groups of species), or size groupings within a species
Catch composition Abundance of individuals x species composition within a catch
Catch profile Size and species composition of fish caught
Prepared for INPEX Cardno v
Research Fishing and Fish Health Monitoring Post-dredging Report Season 1 Ichthys Nearshore Environmental Monitoring Program
Term or Acronym Definition
Catch rate (or Catch-Per-Unit-of-Effort, CPUE) Number of all fish caught (returned to the lab or released) for a given catch component per angler hour (Research Angling), or per pot (Research Potting)
Catch rate can be a good index of the quality of fishing and an indirect indicator of the state of the populations of target species in an area
Catchability Susceptability to capture. Commonly varies in time and space according to a range of biological influences (e.g. breeding aggregations)
Control location Location at which it is assumed there will be no direct environmental impact from dredging activities and which therefore can be used for the purpose of comparison with potentially ‘impacted’ locations
CW Width of the widest distance between two points on the carapace of a crustacean (cm)
Darwin Harbour – Inner (DI) Representing Darwin Harbour waters closest to dredging activities, within a seaward demarcation boundary extending approximately southwest across the harbour from Emery Point, Darwin.
Darwin – Outer (DO) Representing waters within the harbour but more remote from dredging, beyond the seaward demarcation boundary of DI and including areas that are in proximity to the spoil disposal ground (e.g. Lee Point and Shoal Bay)
Dredging 1 (D1) First Dredging Phase sampling season; 20 November 2012 to 10 December 2012
Dredging 2 (D2) Second Dredging Phase sampling season; 4 March to 13 March 2013
Dredging 3 (D3) Third Dredging Phase sampling season; 9 October 2013 to 17 October 2013
Dredging 4 (D4) Fourth Dredging Phase sampling season; 3 March 2014 to 10 March 2014
Degrees of freedom (df) The number of values in the final calculation of a statistic that are free to vary
DSDMP Dredging and Spoil Disposal Management Plan
EA East Arm
Effort See Fishing effort
Ectoparasite Parasites that connect themselves to the outside surface of their host organism
Prepared for INPEX Cardno vi
Research Fishing and Fish Health Monitoring Post-dredging Report Season 1 Ichthys Nearshore Environmental Monitoring Program
Term or Acronym Definition
Endoparasite Parasites inside the body of their host organism
Fishery-dependent sampling Direct sampling of recreational (or commercial) fishing activities and catches via a recreational fishing survey or other direct engagement of the fishing industry
Fishery-independent sampling Collection of data and samples independent of recreational (or commercial) fishing activities via custom-designed scientific sampling equipment and methodology
Fishing effort A measure of resource use by anglers or fishers. Typical units of effort include the number of trips on the water, angler hours, fishing party hours, boat hours, pots
Fish kills A localised die off of fish populations, usually attributed to environmental extremes or anthropogenic influences
Fishing quality Level of success fishing experienced during a fishing trip, usually measurable via catch rates of targeted species
GEP Gas Export Pipeline
Histopathology Study of the cytological and histological structure of abnormal or diseased tissue
Iki jime method Method of humanely euthanising finfish involving spiking of the brain
Immunosuppression Suppression of the immune system such that increasing vulnerability to infection may result
Impact A response by the environment or its inhabitants to a disturbance
Index (indices) Variable, measurement or number derived from several variables or measurements that serves as an indicator
Indirect impact An incidental, secondary effect caused by a disturbance (e.g. dredging) or activity (e.g. fishing) on a population or stock (e.g. transfer of fishing pressure to ‘undisturbed’ areas)
Intensity of infection Mean level of affliction within the proportion of a population exhibiting or afflicted with a given infection (i.e. number of parasites, grade of infection)
LCF Length measured from the mouth to the fork in the caudal fin (tail fin) of a fish.
Prepared for INPEX Cardno vii
Research Fishing and Fish Health Monitoring Post-dredging Report Season 1 Ichthys Nearshore Environmental Monitoring Program
Term or Acronym Definition
Lesion A localised pathological change (such as an infected or diseased area) in a bodily organ (including skin) or tissue
Ln-transformed data Data transformed to their natural logarithms – Ln(x + 1)
Macroscopic Visible to the naked eye
Mean squares (MS) A way to quantify the difference between values implied by an estimator and the true values of the quantity being estimated
Monoxenous parasite Species characterised by having only one host individual throughout its lifecycle
Neap tide Tides for which the difference between high and low tide is least (occurs approximately twice per month)
NEMP Nearshore Environmental Monitoring Plan
Nephelometric Turbidity Units (NTU) Units of turbidity – a measure of the degree to which water loses its transparency due to the presence of suspended particulates
NT Northern Territory
Opercula (finfish) Plural of operculum – bony covering of gills in bony finfish
Parasitology/parasite Study of organisms that live on (‘ectoparasite’) or in (‘endoparasite’) a host and, in doing so, gain some benefit
Pathology Study of the nature of disease and its causes, processes, development and consequences
PERMANOVA Analysis for testing the simultaneous response of one or many variables to one or more factors based on distance measures using permutation methods
Phase Temporal partitioning of Project activites
Post-dredging 1 (P1) Post-dreding Phase sampling season; 15 to 23 October 2014
Pseu-F The pseudo-F statistic is intended to capture the 'tightness' of clusters and is, in essence, a ratio of the mean sum of squares between groups to the mean sum of squares within groups
Precision Degree of variation around the mean value. A precise estimator has a small standard error (or variance)
Prepared for INPEX Cardno viii

Research Fishing and Fish Health Monitoring Post-dredging Report Season 1 Ichthys Nearshore Environmental Monitoring Program
Term or Acronym Definition
Prevalence of infection Proportion of a defined population exhibiting or afflicted with a given infection or condition
PSP Projected Sample Prevalence (PSP). Due to stratified sampling protocols, PSP is a corrected estimate of the prevalence of infection within the population
Quality assurance/quality control (QA/QC) A continual process of checks and refinements aimed at maximising data integrity and, hence, also improving the credibility of survey results
Recreational Fishing Recreational fishing activities include all forms of line fishing, bait collecting, and the setting of crab traps
Recreational Fishing and Fish Health Monitoring Program
Monitoring program that consists of the Recreational Fishing and Fish Health and Research Fishing and Fish Health monitoring programs which together aim to monitor the potential effects of dredging and spoil disposal on local ecosystems and vulnerable receptors including fish and crabs with respect to local recreational fisheries
Research Angling (RA) and Research Potting (RP)
Standardised, fishery-independent sampling using angling and crab potting as sampling tools
RF Research fishing including Research Angling (RA) and Research Potting (RP)
RFFHMP Research Fishing and Fish Health Monitoring Program
Sampling quota/priorities (laboratory fish health) Continuously refined prioritisation guide to selection of samples by field staff for return to the laboratory for detailed fish health examination
Updated and applied on a daily basis; dependent on the composition of what had altready been sampled (species and quantities)
Sampling unit Basic unit of sampling (e.g. an angler/fisher, a fishing party, a fishing day or a particular combination of space and time)
Sex ratio Proportion of males to females in a sample
SIMPER Similarity Percentage analysis (SIMPER) calculates the dissimilarity and discriminates between pairs and groups based on the contribution of variables associated with individual factors
Species diversity Number of species recorded per sampling unit
Prepared for INPEX Cardno ix

Research Fishing and Fish Health Monitoring Post-dredging Report Season 1 Ichthys Nearshore Environmental Monitoring Program
Term or Acronym Definition
Spring tides Tides for which the difference between high and low tide is greatest (occurs approximately twice per month)
Standard error (SE) Estimate of the precision of data around their mean; indicator of relative variability when comparing means
Standardised sampling Sampling of different areas and/or at different times using a purposely consistent sampling methodology (equipment and procedure) to minimise the effect of biases that potentially confound the interpretation of results
Stressor Agent or circumstance that causes physiological stress
Stretched mesh opening (SMO) Mesh size measurement – maximum distance between the inside of the diagonal knots of a mesh opening when stretched apart
Sums of squares (SS) The partitioning of sums of squared deviations or errors. When scaled for the number of degrees of freedom, it estimates the variance or spread of the observations about their mean value
Taxonomic grouping Grouping of relatively closely related species
Toxicology Study of the nature, effects and detection of toxins
Treatment(s) Level within univariate and multivariate analyses describing potential ‘Impact’ and ‘Control’ locations
Turbidity Measure of the level of suspended solids in water expressed as Nephelometric Turbidity Units (NTU)
Prepared for INPEX Cardno x

Research Fishing and Fish Health Monitoring Post-dredging Report Season 1 Ichthys Nearshore Environmental Monitoring Program
Table of Contents Executive Summary iii Glossary v
1 Introduction 1 Overview 1 1.1 Background 1 1.2 Summary of Baseline Phase Sampling Results 2 1.3 Summary of Dredging Phase Sampling Results 2 1.4 Objectives 3 1.5
2 Methodology 5 Overview of Sampling Design 5 2.1 Research Fishing 8 2.2
Research Angling 8 2.2.1 Research Potting 9 2.2.2 Presentation and Analysis of Data 10 2.2.3
Supplementary Sampling 13 2.3 Cast Netting 13 2.3.1 Gill Netting 13 2.3.2 Additional Angling 13 2.3.3
Fish Health 13 2.4 Sampling Priorities and Sample Sizes 14 2.4.1 Field-based Assessment 14 2.4.2 Laboratory-based Examination 14 2.4.3 Histopathology and Toxicology 15 2.4.4 Presentation and Analysis of Data 15 2.4.5
Quality Control 16 2.5 Field Data Collection 16 2.5.1 Laboratory Data and Sample Collection 16 2.5.2 Data Entry 16 2.5.3
3 Dredging Operations 17
4 Results 19 Research Fishing 19 4.1
Research Angling 19 4.1.1 Research Potting 32 4.1.2
Supplementary Sampling 37 4.2 Size-class Frequency 37 4.3
Finfish 37 4.3.1 Crabs 45 4.3.2
Fish and Crab Health 49 4.4 Field-based External Assessments 49 4.4.1 Laboratory-based Post-field Examinations 51 4.4.2
5 Discussion 68 Research Fishing 68 5.1
Research Angling 68 5.1.1 Research Potting 69 5.1.2
Size-class Frequency of Finfish and Crabs 69 5.2
Prepared for INPEX Cardno xi
Research Fishing and Fish Health Monitoring Post-dredging Report Season 1 Ichthys Nearshore Environmental Monitoring Program
Fish and Crab Health 70 5.3 Finfish Parasites and Other Infections 70 5.3.1 Crab Parasites and Other Infections 72 5.3.2 Length-weight relationships 72 5.3.3
6 Conclusions 74
7 Acknowledgements 75
8 References 76
Tables Table 2-1 Dates of sampling seasons completed for each component of the Recreational Fishing and Fish
Health Monitoring Program 5 Table 2-2 Locations sampled during each sampling season for each component of the Recreational
Fishing and Fish Health Monitoring Program 6 Table 2-3 Number of replicate fishing trips sampled during each Research Fishing and Fish Health
sampling season 8 Table 2-4 Summary of data collected and outputs associated with Research Fishing (Research Angling
(RA) and Research Potting (RP)) 11 Table 2-5 Definitions of fish health parameters for the RFFHMP component of the Recreational Fishing
and Fish Health Monitoring Program 16 Table 3-1 Dredge footprint summary 17 Table 4-1 Summary statistics for water depths recorded at RA sites sampled during P1 (October 2014) 19 Table 4-2 Total RA catches (species combined), weighted to average number of finfish caught per
replicate fishing trip, for each location sampled during each sampling season (rounded to nearest whole fish) 20
Table 4-3 Results of multivariate PERMANOVA testing for differences in RA catch composition among sampling seasons (B2 (October 2012), D1 (November/December 2012), D2 (March 2013), D3 (October 2013), D4 (March 2014) and P1 (October 2014)) and among locations (DI, DO and BH) 23
Table 4-4 Results of SIMPER analysis indicating taxa responsible for significant differences in catch composition between sampling seasons A) B2 and D4, B) D1 and D4, C) D4 and P1 (locations combined), and D) locations DI and DO and E) DO and BH (sampling seasons combined) 25
Table 4-5 Results of univariate PERMANOVA testing for differences in: mean species diversity of A) all fish and B) reef fish (per fishing trip); and mean CPUE (per hour) for C) all fish and D) reef fish; among RA sampling Seasons (B2 (October 2012, n = 6 fishing trips), D1 (November/December 2012, n = 6), D2 (March 2013, n = 3), D3 (October 2013, n = 6), D4 (March 2014, n = 4), and P1 (October 2014, (n = 4 at DI and DO, n = 3 at BH)) and among Locations (DI, DO and BH) 27
Table 4-6 Results of univariate PERMANOVA testing for differences in mean CPUE (per hour) for: A) golden snapper; B) stripey snapper; C) blue tuskfish; and D) Moses snapper; among RA sampling seasons (B2 (October 2012, n = 6 fishing trips), D1 (November/December 2012, n = 6), D2 (March 2013, n = 3), D3 (October 2013, n = 6), D4 (March 2014, n = 4) and P1 (October 2014, n = 4 at DI and DO, n = 3 at BH)) and among locations (DI, DO and BH) 30
Table 4-7 Total RP catches (mud crabs / sand crabs / finfish), weighted to average number caught per replicate fishing trip (i.e. per 20 crab pot deployments), for each location sampled during each sampling season (rounded to nearest whole animal) 32
Table 4-8 Results of univariate PERMANOVA testing for differences in mean: A) species diversity (no. of all species in pots per fishing trip), and CPUE (unit effort = pot) for: B) all animals; C) mud crabs; and D) sand crabs (* multiple species), among RA sampling seasons (B2 (October 2012, n = 6 fishing trips), D1 (November/December 2012, n = 6), D2 (March 2013, n = 3), D3 (October 2013, n = 6), D4 (March 2014, n = 4) and P1 (October 2014, n = 4 at DI and DO, n = 3 at BH) and among locations (DI, DO and BH) 35
Prepared for INPEX Cardno xii
Research Fishing and Fish Health Monitoring Post-dredging Report Season 1 Ichthys Nearshore Environmental Monitoring Program
Table 4-9 Results of KS tests comparing size-frequency distributions of frequently caught RA finfish species between P1, Baseline Phase seasons (B1 and/or B2) and Dredging Phase seasons (D1, D2, D3 and D4) 40
Table 4-10 Results of KS tests comparing size-frequency distributions of RP-sampled crabs between P1, Baseline Phase seasons (B1 and/or B2) and Dredging Phase seasons (D1, D2, D3 and D4) 46
Table 4-11 Percentage (%) of sampled individuals at DI, DO and BH during P1 and at each of the locations sampled during the Baseline Phase (BP; August/September2012 and October 2012), D1 (November/December 2012), D2 (March 2013), D3 (October 2013) and D4 (March 2014) sampling seasons exhibiting clearly visible signs of abnormality as determined by field-based external assessments (see Section 2.4.2) 50
Table 4-12 Description of disease category groupings used for assessment of finfish health 52 Table 4-13 Summary of estimates of prevalence^ − expressed as a proportion of the sampled population
(%) − and, where appropriate, average intensity (in parentheses) of selected disease categories in golden snapper sampled at DI, DO and BH during P1 (October 2014) and at each of the locations sampled during the Baseline Phase (BP; August/September 2012 and October 2012), D1 (November/December 2012), D2 (March 2013), D3 (October 2013) and D4 (March 2014) sampling seasons. AR was not sampled during D3, D4 or P1, and BH during D3 54
Table 4-14 Summary of estimates of prevalence^ − expressed as a proportion of the sampled population (%) – and, where appropriate, average intensity (in parentheses) of selected disease categories in barramundi sampled at DI, DO and BH during P1 (October 2014) and at each of the locations sampled during the Baseline Phase (BP; August/September 2012 and October 2012), D1 (November/December 2012), D2 (March 2013), D3 (October 2013) and D4 (March 2014) sampling seasons. AR was not sampled during D3, D4 or P1, and BH during D3 55
Table 4-15 Summary of estimates of prevalence^ − expressed as a proportion of the sampled population (%) – and, where appropriate, average intensity (grade in parentheses) of selected disease categories in goldspotted rockcod sampled at DI, DO and BH during P1 (October 2014) and at each of the locations sampled during the Baseline Phase (BP; August/September 2012 and October 2012), D1 (November/December 2012), D2 (March 2013), D3 (October 2013) and D4 (March 2014) sampling seasons. AR was not sampled during D3, D4 or P1, and BH during D356
Table 4-16 Description of disease category groupings used for assessment of crab health 61 Table 4-17 Summary of estimates of prevalence^ (expressed as a proportion of the sampled population –
%) and, where appropriate, average intensity (grade in parentheses) of selected disease categories in mud crabs sampled at DI, DO and BH during P1 (October 2014) and at each of the locations sampled during the Baseline Phase (BP; August/September 2012 and October 2012), D1 (November/December 2012), D2 (March 2013), D3 (October 2013) and D4 (March 2014) sampling seasons. AR was not sampled during D3, D4 or P1 and no sampling was conducted at BH during D3 63
Table 4-18 Summary of estimates of prevalence^ (expressed as a proportion of the sampled population – %) and, where appropriate, average intensity (grade in parentheses) of selected disease categories in sand crabs sampled at DI, DO and BH during P1 (October 2014) and at each of the locations sampled during the Baseline Phase (BP; August/September 2012 and October 2012), D1 (November/December 2012), D2 (March 2013), D3 (October 2013) and D4 (March 2014) sampling seasons. AR was not sampled during D3, D4 or P1 and no sampling was conducted at BH during D3 64
Figures Figure 2-1 Broad-scale spatial sampling design for the Research Fishing and Fish Health Monitoring
Program (RFFHMP) component of the Recreational Fishing and Fish Health Monitoring Program 7
Figure 3-1 EA dredging footprint and GEP route 18 Figure 4-1 Map of the B2 (October 2012) and P1 (October 2014) research angling sites within Darwin
Harbour – Inner (DI), Darwin – Outer (DO) and Bynoe Harbour (BH) 21
Prepared for INPEX Cardno xiii

Research Fishing and Fish Health Monitoring Post-dredging Report Season 1 Ichthys Nearshore Environmental Monitoring Program
Figure 4-2 Relative proportions of total RA catch (by number) comprised by golden snapper, stripey snapper, javelin, blue tuskfish, Moses snapper and other species combined for locations: A) DI; B) DO; and C) BH during sampling seasons B2 (October 2012), D1 (November/December 2012), D2 (March 2013), D3 (October 2013), D4 (March 2014) and P1 (October 2014) 22
Figure 4-3 Non-metric MDS ordinations illustrating relative similarities/dissimilarities in RA catch composition among A) sampling seasons (Baseline Phase (B2: October 2012), D1 (November/December 2012), D2 (March 2013), D3 (October 2013), D4 (March 2014) and P1 (October 2014)) and B) locations (DI, DO and Control location BH). Results of PERMANOVA post hoc pairwise comparisons are shown 24
Figure 4-4 Mean (±SE) for: A) number of all fish species caught; B) number of reef fish species caught; C) all fish CPUE (per hour); and D) all reef fish CPUE; sampled using standardised angling methods (RA) at DI, DO, BH and AR during B2 (October 2012), D1 (November/December 2012), D2 (March 2013), D3 (October 2013), D4 (March 2014) and P1 (October 2014) 28
Figure 4-5 Mean (±SE) CPUE (fish per hour) for: A) golden snapper; B) stripey snapper; C) blue tuskfish; and D) Moses snapper; sampled using standardised angling methods (RA) at DI, DO, BH and AR during B2 (October 2012fishing trips), D1 (November/December 2012), D2 (March 2013), D3 (October 2013), D4 (March 2014) and P1 (October 2014) 31
Figure 4-6 Map of B2 (October 2012) and P1 (October 2014) research potting sites within Darwin Harbour – Inner (DI), Darwin – Outer (DO) and Bynoe Harbour (BH) 33
Figure 4-7 Mean (±SE) for: A) number of all species caught; B) all animals CPUE (per pot); C) mud crab CPUE; and D) sand crab CPUE; sampled using standardised potting methods (RP) at DI, DO, BH and AR during B2 (October 2012fishing trips), D1 (November/December 2012), D2 (March 2013), D3 (October 2013), D4 (March 2014) and P1 (October 2014) 36
Figure 4-8 Size-class frequency distributions (expressed as proportions of total catch) of A) golden snapper and B) stripey snapper caught using standardised angling methods (RA) at DI, DO and BH during the Baseline Phase (BP – B1 (August/September 2012) and B2 (October 2012) combined) and Dredging Phase sampling seasons (D1 (November/December 2012), D2 (March 2013), D3 (October 2013), D4 (March 2014)) and Post-dredging Phase P1 (October 2014) 39
Figure 4-9 Size-class frequency distributions (expressed as proportions of total catch of A) javelin and B) goldspotted rockcod caught using standardised sampling methods (RA and RP) at DI, DO and BH during the Baseline Phase (BP – B1 (August/September 2012) and B2 (October 2012) combined) and Dredging Phase sampling seasons (D1 (November/December 2012), D2 (March 2013), D3 (October 2013), D4 (March 2014)) and Post-dredging Phase P1 (October 2014) 42
Figure 4-10 Size-class frequency distributions (expressed as proportions of total catch of A) blue tuskfish and B) Moses snapper caught using standardised sampling methods (RA and RP) at DI, DO and BH during the Baseline Phase (BP – B1 (August/September 2012) and B2 (October 2012) combined) and Dredging Phase sampling seasons (D1 (November/ December 2012), D2 (March 2013), D3 (October 2013), D4 (March 2014)) and Post-dredging Phase P1 (October 2014) 43
Figure 4-11 Size-class frequency distributions (expressed as proportions of total catch) of all gill netting and lure angling catches of barramundi, pooled across all locations for the Baseline Phase (BP – B1 (August/September 2012) and B2 (October 2012) combined) and Dredging Phase sampling seasons (D1 (November/December 2012), D2 (March 2013), D3 (October 2013), D4 (March 2014)) and Post-dredging Phase P1 (October 2014) 45
Figure 4-12 Size-class frequency distribution of A) mud crabs and B) sand crabs caught using standardised potting methods (RP) at DI, DO and BH during the Baseline Phase (BP – B1 (August/September 2012) and B2 (October 2012) combined) and Dredging Phase sampling seasons (D1 (November/December 2012), D2 (March 2013), D3 (October 2013), D4 (March 2014) and P1 (October 2014)) 47
Figure 4-13 Relative proportions of male and female mud crabs* in RP catches for locations A) DI, B) DO, C) BH and D) AR during sampling seasons B1 (August/September 2012), B2 (October 2012), D1 (November/December 2012), D2 (March 2013), D3 (October 2013), D4 (March 2014) and P1 (October 2014) 48
Figure 4-14 Prevalence of dactylogyrid monogeneans for: A) golden snapper; B) barramundi; and C) goldspotted rockcod at DI, DO and BH during P1 (October 2014) and at each of the locations sampled during the Baseline Phase (BP; August/September 2012 and October 2012), D1
Prepared for INPEX Cardno xiv
Research Fishing and Fish Health Monitoring Post-dredging Report Season 1 Ichthys Nearshore Environmental Monitoring Program
(November/December 2012), D2 (March 2013), D3 (October 2013), D4 (March 2014) sampling seasons 57
Figure 4-15 Prevalence of granulomas (pooled among organs) for: A) golden snapper; B) barramundi; and C) goldspotted rockcod at DI, DO and BH during P1 (October 2014) and at each of the locations sampled during the Baseline Phase (BP; August/September 2012 and October 2012), D1 (November/December 2012), D2 (March 2013), D3 (October 2013) and D4 (March 2014) sampling seasons 58
Figure 4-16 Prevalence of metazoa (pooled among organs) for: A) golden snapper; B) barramundi; and C) goldspotted rockcod at DI, DO and BH during P1 (October 2014) and at each of the locations sampled during the Baseline Phase (BP; August/September 2012 and October 2012), D1 (November/December 2012), D2 (March 2013), D3 (October 2013) and D4 (March 2014) sampling seasons 60
Figure 4-17 Prevalence of: A) Rust spot; and B) Loxothylacus/Sacculina in mud crabs examined at DI, DO and BH during P1 (October 2014) and at each of the four sampling locations during the Baseline Phase (BP; August/September 2012 and October 2012), D1 (November/December 2012) D2 (March 2013), D3 (October 2013) and D4 (March 2014) sampling seasons 65
Figure 4-18 Plots of length to caudal fork vs weight for: A) golden snapper; B) blue tuskfish; C) goldspotted rockcod; D) grass emperor; E) barramundi; and F) stripey snapper, sampled at DI, DO and BH during the Baseline Phase (BP; August/September 2012 and October 2012), Dredging Phase (DP; D1 (November/December 2012), D2 (March 2013), D3 (October 2013) and D4 (March 2014)) and Post-dredging Phase (P1; October 2014) 66
Figure 4-19 Plots of carapace width vs weight (raw data) for: A) male mud crabs; B) female mud crabs; and C) male sand crabs, sampled at DI, DO and BH during the Baseline Phase (BP; August/September 2012 and October 2012), Dredging Phase (DP; D1 (November/December 2012), D2 (March 2013), D3 (October 2013) and D4 (March 2014)) and Post-dredging Phase (P1; October 2014) 67
Appendices Appendix A Sampling Dates and GPS Coordinates
Appendix B Species Lists and Sample Sizes by Method
Appendix C Catch Rates During Research Fishing (Angling and Potting)
Appendix D Temporal Trends in Catch Rates
Appendix E Fish Size Data Summary
Appendix F Disease and Lesion Inventory
Appendix G Fish Health Data Summaries
Prepared for INPEX Cardno xv

Research Fishing and Fish Health Monitoring Post-dredging Report Season 1 Ichthys Nearshore Environmental Monitoring Program
1 Introduction
Overview 1.1INPEX is the operator of the Ichthys LNG Project (the Project). The Project comprises the development of offshore production facilities at the Ichthys Field in the Browse Basin, some 820 km west-south-west of Darwin, an 889 km long subsea gas export pipeline (GEP) and an onshore processing facility and product loading jetty at Bladin Point on Middle Arm Peninsula in Darwin Harbour. To support the nearshore infrastructure at Bladin Point, dredging works were carried out to extend safe shipping access from near East Arm Wharf to the new product loading facilities at Bladin Point, which are be supported by piles driven into the sediment. A trench was also dredged to seat and protect the GEP for the Darwin Harbour portion of its total length. Dredged material was disposed at the spoil ground located approximately 12 km north-west of Lee Point. A detailed description of the dredging and spoil disposal methodology is provided in Section 2 of the East Arm (EA) Dredging and Spoil Disposal Management Plan (DSDMP) (INPEX 2013a) and GEP DSDMP (INPEX 2014).
Background 1.2Following an Environmental Impact Assessment (INPEX 2011), the Project was approved, subject to conditions that included monitoring for potential effects of dredging or spoil disposal on local ecosystems and potentially vulnerable receptors including finfish and crab species that are important with respect to local recreational fisheries.
Recreational fishing is a significant activity undertaken in Darwin Harbour by local residents and visitors alike (Coleman 1998, 2004; West et al. 2012). A comprehensive recreational fishing survey published by Coleman (2004) indicated that waterways around Darwin account for 37% of recreational participation for the Northern Territory (NT) and that Darwin Harbour accounts for 29% of the total NT recreational catch. The activities required to construct the port facilities for the Project caused disturbance to some of the habitats in Darwin Harbour. This disturbance, along with changes to the environment above the waterline during construction activities, had the potential to directly and indirectly affect recreational fishing in Darwin Harbour in three ways:
1. Measurable changes to recreational catch profiles or catch rates that are temporally and spatially associated with construction activities in Darwin Harbour;
2. Changes to the incidence of ill-health in finfish and crabs that are temporally and spatially associated with construction activities; and
3. Construction activities, including increased vessel movements and exclusion zones associated with construction, may deter some recreational fishers from using Darwin Harbour, irrespective of any real changes to recreational fishing quality in terms of catch rates or fish health.
Changes in catch profiles, catch rates or the general health of fish populations can be investigated using two general, complementary approaches to collecting data: fishery-dependent sampling and fishery-independent sampling (Rotherham et al. 2011). In general, fishery-dependent sampling refers to the direct sampling of recreational fishing activities and catches, along with canvassing general fisher sentiment, via recreational fishing survey techniques such as Access Point (or boat ramp) Surveys (APS). In contrast, fishery-independent sampling of fish populations involves scientists collecting data and samples via prescribed and standardised scientific sampling methodology. The fishery-independent sampling approach provides the additional benefit of facilitating the controlled collection of biological data and samples from fish specifically for qualitative and quantitative health assessment and analysis. The results of previous fishery-dependent and fishery-independent monitoring events conducted within Darwin Harbour and surrounding waterways in association with Project dredging and construction activities are presented in detail in previous reports (Cardno 2013a-i, 2014a,b).
Prepared for INPEX Cardno 1
Research Fishing and Fish Health Monitoring Post-dredging Report Season 1 Ichthys Nearshore Environmental Monitoring Program
Summary of Baseline Phase Sampling Results 1.3Baseline Phase sampling associated with each of the two monitoring components (Recreational Fishing Monitoring Program (fishery-dependent (APS) and Research Fishing and Fish Health Monitoring Program (fishery-independent)(RFFHMP)) of the Recreational Fishing and Fish Health Monitoring Program was carried out prior to the commencement of Cutter Suction Dredger (CSD) operations in EA (4 November 2012) at two Darwin locations (Darwin Harbour – Inner (DI) and Darwin – Outer (DO)) and two Control locations (Bynoe Harbour (BH) and Adelaide River (AR)).
In general, results from Baseline Phase APS (Cardno 2013a,d) indicated that boat ramp utilisation and distribution of boat-based recreational fishing activities was not uniformly distributed among the four sampling locations (generally similar for the DI, DO and AR locations, but substantially lower levels at BH). In addition, as expected ramp utilisation was higher during weekend days than weekdays at all locations. Spatial and temporal patterns in ramp utilisation were similar between the two Baseline Phase APS sampling seasons (B1 APS – June 2012 to August 2012, and B2 APS – October/November 2012). Targeting of the iconic species of barramundi, golden snapper, black jewfish and mud crab, along with pelagic fish such as Spanish mackerel, dominated fishing behaviour in the waters around Darwin, with a seasonal component to patterns in targeting behaviour. Fishers specifically targeting iconic reef species, such as golden snapper, were likely to also catch and retain other common reef species such as grass emperor, javelin, bream and stripey snapper. For most species or species groupings, targeted catch rates in DI were lowest compared with other locations during B1 APS, but were some of the highest during B2 APS, indicating considerable temporal variability in these indicators among locations and between Baseline Phase seasons. Variability associated with each of those catch rate estimates was also quite high.
Results from Baseline Phase of RFFHMP generally concurred with those from the APS, with recreationally popular finfish such as golden snapper, Moses snapper, javelin, blue tuskfish, grass emperor, stripey snapper and goldspotted rockcod dominating angling catches (Cardno 2013b,c). Similarly, mud and sand crabs were commonly caught in pots. Species diversity did not significantly differ among locations or between the two Baseline Phase sampling seasons (B1 – August/September 2012, B2 – October 2012), while catch rates of ‘all fish’ (species combined) were significantly greater during B2 than during B1 at DI but not at the Control locations (BH and AR). Catch rates for individual species were highly variable among sampling days and there were no clear differences among locations in catch rates for most of the more frequently caught species. The health of fish and crabs within Darwin Harbour was generally good throughout the Baseline Phase with few, if any, parasitological or pathological abnormalities of any particular concern to fish health detected. In contrast, elevated levels of rust spot infection in crabs and isolated cases of very unhealthy finfish were recorded at Adelaide River (Control location).
Summary of Dredging Phase Sampling Results 1.4Research Fishing and Fish Health monitoring was undertaken periodically throughout the Dredging Phase of the Project and the data obtained compared to that collected prior to the commencement of dredging (Baseline Phase, 2012 dry season). Dredging phase monitoring comprised sampling during Season One of dredging near the beginning (Dredging Sampling Season 1 (D1): November/December 2012) and the end (Dredging Sampling Season 2 (D2): March 2013) of the 2012/2013 wet season (EA Season One dredging); during the 2013 dry season dredging hiatus (Dredging Sampling Season 3 (D3): October 2013); and finally, during Season Two EA and GEP dredging operations near the end of the 2013/2014 wet season (Dredging Sampling Season 4 (D4): March 2014). Due to accessibility restrictions, during D3 sampling was not undertaken at BH or AR, while no sampling at AR was completed during D4. Sampling effort during these Dredge Phase sampling seasons was subsequently redistributed to locations that were accessible.
Golden snapper, blue tuskfish, stripey snapper and javelin were generally the most commonly caught finfish species, while mud crab and sand crab were the most commonly caught crustacean species, across all Dredging Phase sampling seasons (Cardno 2013e,g,I, 2014b). Barramundi, queenfish and king threadfin were also sampled using supplementary sampling techniques such as gill netting. No introduced (pest) finfish or crab species were detected during the Dredging Phase of the RFFHMP.
Significant differences in catch composition detected between the Darwin locations DI and DO were generally consistent and persistent throughout the Dredging Phases and Baseline Phase sampling seasons of the RFFHMP. These differences are likely associated with the disparate environmental and bathymetric
Prepared for INPEX Cardno 2
Research Fishing and Fish Health Monitoring Post-dredging Report Season 1 Ichthys Nearshore Environmental Monitoring Program
characteristics of the two locations (i.e. estuarine and open-ocean). No significant differences in the species diversity of catches were detected among sampling seasons or among locations. Some seasonal and locational differences in catch rates for some species, or groups of species were, however, detected. In DO, the catch rates of ‘reef fish’ (reef fish species combined) were significantly lower during D2 than during D4, D3, D1 and the Baseline Phase. The reduced catchability of these reef fish species during D2 was likely heavily influenced by environmental effects caused by the transit of two tropical cyclones west of Darwin within a month prior to D2 sampling. Substantial daily and seasonal variability in the catch rates of reef fish such as golden snapper, stripey snapper and blue tuskfish were consistently recorded throughout the RFFHMP. Catch rates of mud crabs were consistently higher in DO compared to DI and BH, while catch rates of sand crabs were higher in DI compared to DO and BH. Overall, these results indicated that there has been no evidence to suggest that Project dredging activities had an identifiable influence on catch rate indicators monitored in DI and DO since the commencement of Project dredging activities.
The health of finfish and crabs sampled within DI, DO, BH and AR were generally good with no conspicuous evidence of ‘ill-health’ of particular concern apparent throughout Dredging Phase sampling seasons. All specimens caught were visually examined in the field for any signs of ‘abnormalities’ (i.e. the presence of external parasites, lesions or deformities). While two forktail catfish sampled from AR displayed signs of substantial abnormality, no other major instances of significant abnormality or conspicuous symptoms of immuno-suppression were found in specimens sampled from waters in the Darwin region. Overall, 35% of finfish and 51% of crabs sampled during Dredging Phase sampling seasons were subjected to intensive external and internal examinations in the laboratory. The prevalence and intensity of parasites and histopathological infections identified among the finfish and crabs during the RFFHMP did not indicate any area of particular concern in terms of abnormalities or health problems. The prevalence and intensity of infection of some parasites (i.e. dactylogyrid monogeneans in finfish and Rhizocephalan barnacles in crabs) appeared to be seasonally variable within and among Darwin and Control locations. Such seasonality is likely influenced by species-specific (finfish, crab and parasite) responses to natural environmental changes in factors such as temperature and salinity. Similar parasites and seasonal variability was also reported as part of the complementary fishery-dependent APS monitoring program component of the Recreational Fishing and Fish Health Monitoring Program during Dredging Phase sampling seasons (Cardno 2013f,h, 2014a). On the balance of the available evidence, Project dredging activities did not appear to affect the general health of the finfish and crabs sampled in and around Darwin Harbour during the Dredging Phase.
Objectives 1.5The aim of the RFFHMP is to monitor and report on the effects of the Project’s dredging activities on key recreationally targeted fish and crustacean species. Key objectives of the RFFHMP include:
> Monitor and report on impacts to key recreationally targeted fish species to determine if changes to recreational fishing and fish catch occur from Project construction activities;
> Implement and report on a monitoring program designed to determine if construction activities have caused an increase in the incidence of ill-health in fish compared with natural incidences, or potentially anthropogenic causes other than Project activities; and
> If significant ‘fish kills’ occur, document the extent of the incident (e.g. geographical extent, species involved and approximate abundance and/or biomass), collect specimens and examine them to attempt to identify the cause of death.
The RFFHMP was developed based on the general principles of Before After Control Impact (BACI) methodologies (Underwood 1992). The specific objectives of the RFFHMP Post-dredging Phase sampling are to:
> Collect data pertaining to recreational fishing activities, relative recreational fishing quality and fish health in Darwin Harbour and in Control locations following the Dredging Phase of the Project; and
> Compare results of Post-dredging Phase sampling with those from Baseline Phase and Dredging Phase sampling to detect and interpret any changes to indicators in Darwin Harbour and/or Control locations between phases.
This report details Post-dredging Season 1 (P1) Research Fishing and Fish Health Monitoring Program (RFFHMP) data collected at the end of the 2014 dry season (P1: 15 to 23 October 2014). Results from P1
Prepared for INPEX Cardno 3
Research Fishing and Fish Health Monitoring Post-dredging Report Season 1 Ichthys Nearshore Environmental Monitoring Program
were qualitatively and, where appropriate, quantitatively compared with all previous Baseline Phase and Dredging Phase sampling seasons to assess for any apparent patterns of change in relative recreational fishing quality (i.e. standardised catch rates) and indicators of fish and crustacean health in Darwin Harbour that may have been influenced by Project dredging activities. This is the first of two Post-dredging Phase RFFHMP sampling seasons and represents data collected approximately four and three months following the cessation of EA dredging operations on 11 June 2014 and GEP dredging on 12 July 2014 respectively.
Prepared for INPEX Cardno 4
Research Fishing and Fish Health Monitoring Post-dredging Report Season 1 Ichthys Nearshore Environmental Monitoring Program
2 Methodology
Overview of Sampling Design 2.1The general sampling design for the Recreational Fishing and Fish Health Monitoring Program is summarised below, with full details provided in Appendix G of the Nearshore Environmental Monitoring Program (NEMP; Cardno 2014c). The temporal sampling design and data analysis used for each component of the Recreational Fishing and Fish Health Monitoring Program were structured around three ‘Phases’:
> ‘Baseline’, which for the purposes of this scope is considered to extend until the commencement of CSD activities at the start of the wet season for Season One dredging (4 November 2012), based on the assumption that minimal impacts to recreational fishing and fish health would occur during the initial Backhoe Dredger (BHD) dredging activities (i.e. minor release of fine material);
> ‘Dredging’, which includes periods of active Project-related dredging as well as ‘dry’ season dredging hiatus period between Season One (2012/2013 wet season) and GEP and Season Two EA (2013/2014 wet season) dredging operations (see Section 3); and
> ‘Post-dredging’, following the completion of Project dredging activities (EA Dredging: 11 June 2014 and GEP Dredging: 12 July 2014 (see Section 3)).
For each of the above Phases, sampling has been partitioned into temporally distinct sampling events (sampling seasons). During the Baseline Phase two sampling seasons were completed for both the RFFHMP and recreational fishing Access Point Survey Monitoring Program (APSMP) components of the Recreational Fishing and Fish Health Monitoring Program (Table 2-1). During the Dredging Phase, three APSMP sampling seasons and four seasons of RFFHMP sampling seasons were completed. Over the course of the Dredging Phase, sampling seasons were correlated with ‘dry’ and ‘wet’, climatic seasons, characteristic of tropical northern Australia, with those climatic seasonal categories applied irrespective of the duration of the Phase (i.e. whether it is six months or two years).
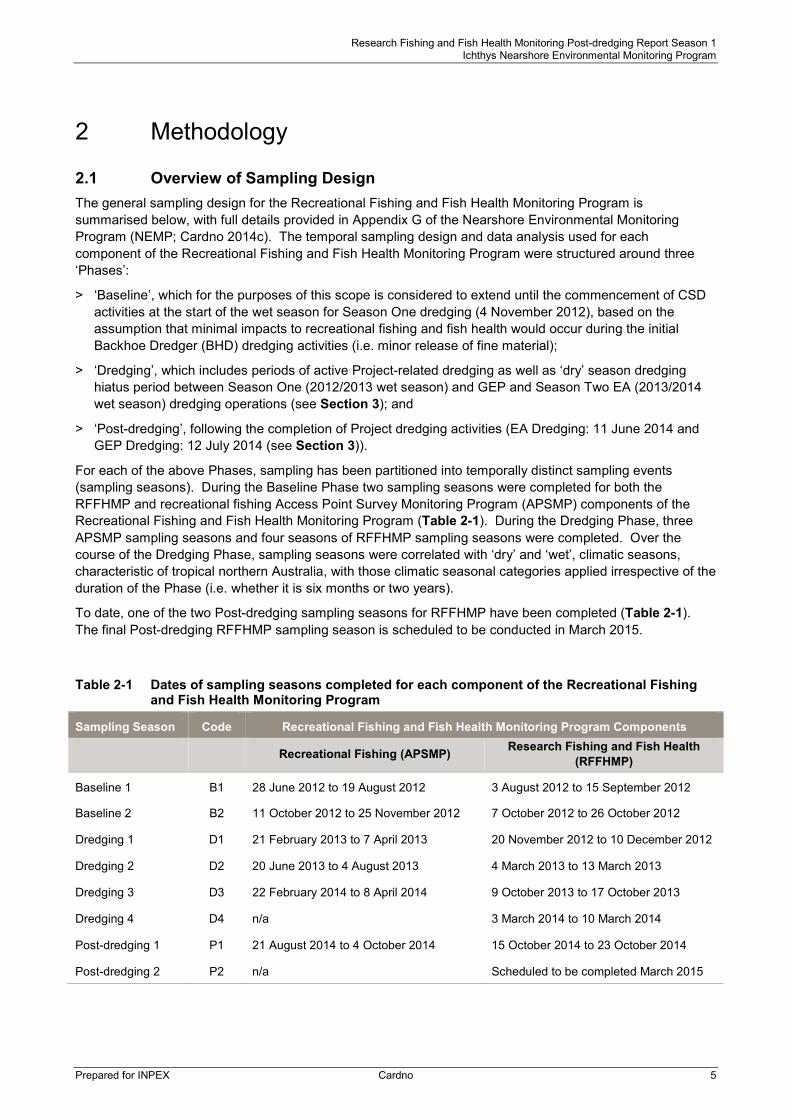
To date, one of the two Post-dredging sampling seasons for RFFHMP have been completed (Table 2-1). The final Post-dredging RFFHMP sampling season is scheduled to be conducted in March 2015.
Table 2-1 Dates of sampling seasons completed for each component of the Recreational Fishing and Fish Health Monitoring Program
Sampling Season Code Recreational Fishing and Fish Health Monitoring Program Components
Recreational Fishing (APSMP) Research Fishing and Fish Health (RFFHMP)
Baseline 1 B1 28 June 2012 to 19 August 2012 3 August 2012 to 15 September 2012
Baseline 2 B2 11 October 2012 to 25 November 2012 7 October 2012 to 26 October 2012
Dredging 1 D1 21 February 2013 to 7 April 2013 20 November 2012 to 10 December 2012
Dredging 2 D2 20 June 2013 to 4 August 2013 4 March 2013 to 13 March 2013
Dredging 3 D3 22 February 2014 to 8 April 2014 9 October 2013 to 17 October 2013
Dredging 4 D4 n/a 3 March 2014 to 10 March 2014
Post-dredging 1 P1 21 August 2014 to 4 October 2014 15 October 2014 to 23 October 2014
Post-dredging 2 P2 n/a Scheduled to be completed March 2015
Prepared for INPEX Cardno 5
Research Fishing and Fish Health Monitoring Post-dredging Report Season 1 Ichthys Nearshore Environmental Monitoring Program
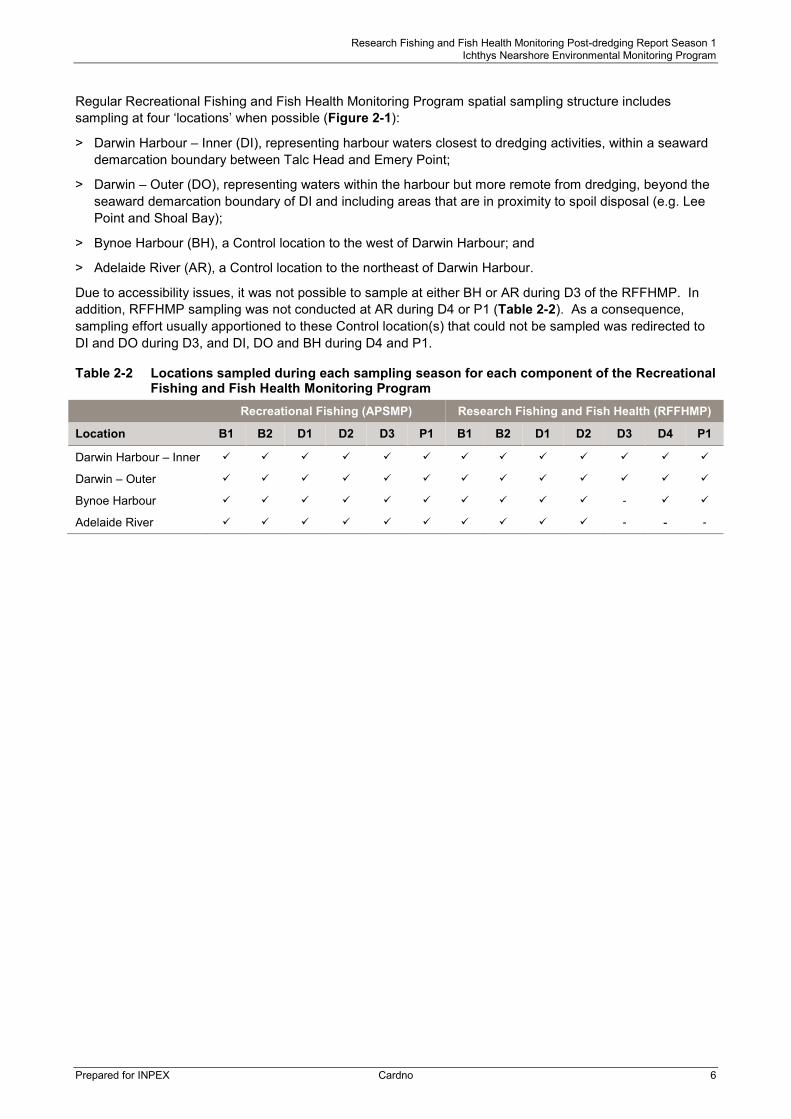
Regular Recreational Fishing and Fish Health Monitoring Program spatial sampling structure includes sampling at four ‘locations’ when possible (Figure 2-1):
> Darwin Harbour – Inner (DI), representing harbour waters closest to dredging activities, within a seaward demarcation boundary between Talc Head and Emery Point;
> Darwin – Outer (DO), representing waters within the harbour but more remote from dredging, beyond the seaward demarcation boundary of DI and including areas that are in proximity to spoil disposal (e.g. Lee Point and Shoal Bay);
> Bynoe Harbour (BH), a Control location to the west of Darwin Harbour; and
> Adelaide River (AR), a Control location to the northeast of Darwin Harbour.
Due to accessibility issues, it was not possible to sample at either BH or AR during D3 of the RFFHMP. In addition, RFFHMP sampling was not conducted at AR during D4 or P1 (Table 2-2). As a consequence, sampling effort usually apportioned to these Control location(s) that could not be sampled was redirected to DI and DO during D3, and DI, DO and BH during D4 and P1.
Table 2-2 Locations sampled during each sampling season for each component of the Recreational Fishing and Fish Health Monitoring Program
Recreational Fishing (APSMP) Research Fishing and Fish Health (RFFHMP)
Location B1 B2 D1 D2 D3 P1 B1 B2 D1 D2 D3 D4 P1
Darwin Harbour – Inner
Darwin – Outer
Bynoe Harbour -
Adelaide River - - -
Prepared for INPEX Cardno 6
Research Fishing and Fish Health Monitoring Post-dredging Report Season 1 Ichthys Nearshore Environmental Monitoring Program
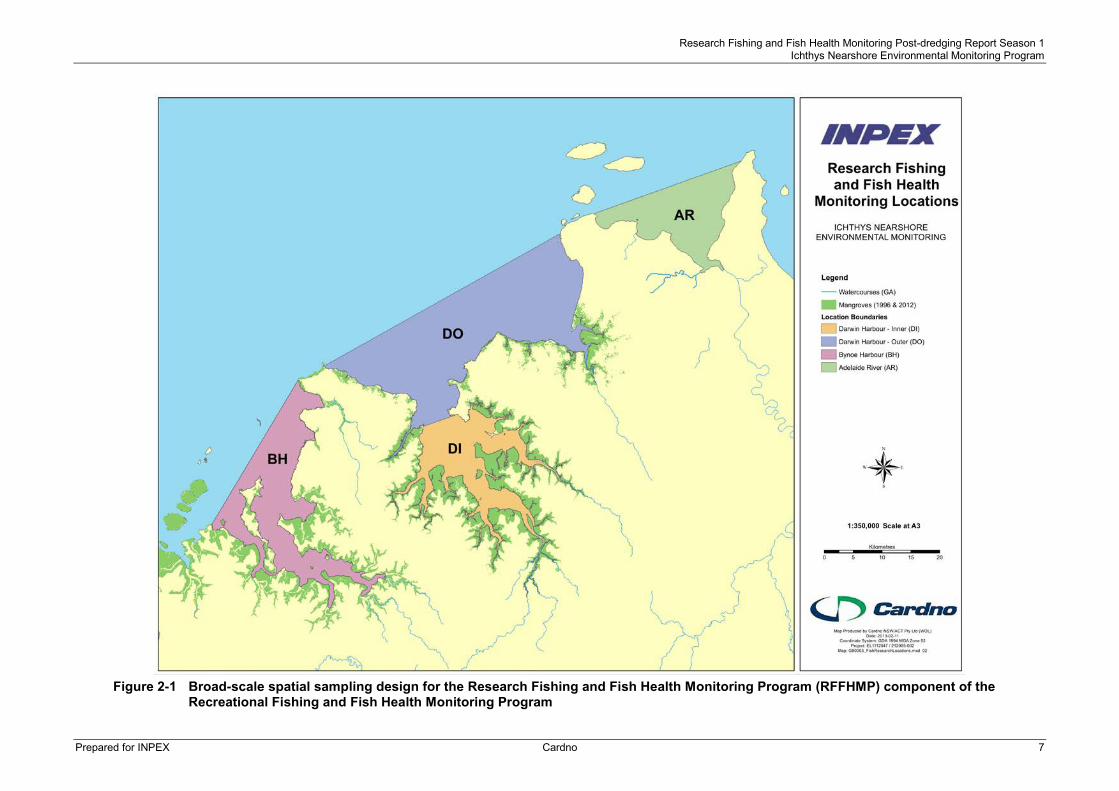
Figure 2-1 Broad-scale spatial sampling design for the Research Fishing and Fish Health Monitoring Program (RFFHMP) component of the
Recreational Fishing and Fish Health Monitoring Program
Prepared for INPEX Cardno 7
Research Fishing and Fish Health Monitoring Post-dredging Report Season 1 Ichthys Nearshore Environmental Monitoring Program
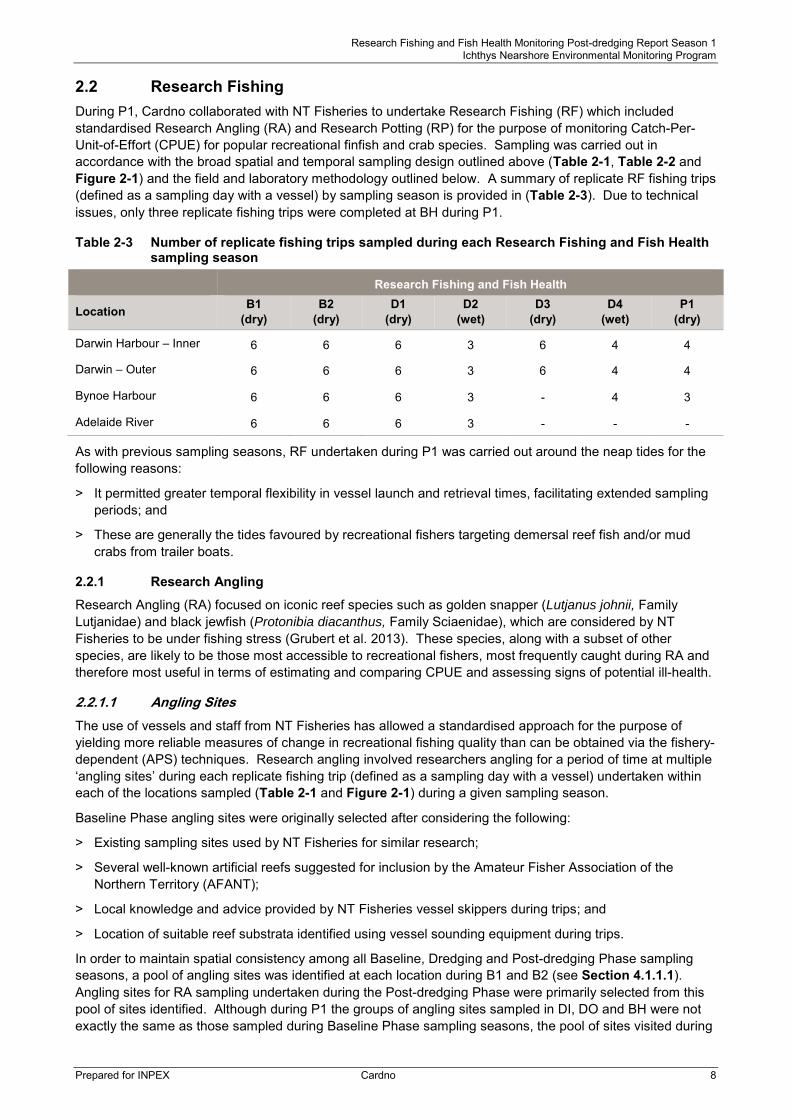
Research Fishing 2.2During P1, Cardno collaborated with NT Fisheries to undertake Research Fishing (RF) which included standardised Research Angling (RA) and Research Potting (RP) for the purpose of monitoring Catch-Per-Unit-of-Effort (CPUE) for popular recreational finfish and crab species. Sampling was carried out in accordance with the broad spatial and temporal sampling design outlined above (Table 2-1, Table 2-2 and Figure 2-1) and the field and laboratory methodology outlined below. A summary of replicate RF fishing trips (defined as a sampling day with a vessel) by sampling season is provided in (Table 2-3). Due to technical issues, only three replicate fishing trips were completed at BH during P1.
Table 2-3 Number of replicate fishing trips sampled during each Research Fishing and Fish Health sampling season
Research Fishing and Fish Health
Location B1 (dry)
B2 (dry)
D1 (dry)
D2 (wet)
D3 (dry)
D4 (wet)
P1 (dry)
Darwin Harbour – Inner 6 6 6 3 6 4 4
Darwin – Outer 6 6 6 3 6 4 4
Bynoe Harbour 6 6 6 3 - 4 3
Adelaide River 6 6 6 3 - - -
As with previous sampling seasons, RF undertaken during P1 was carried out around the neap tides for the following reasons:
> It permitted greater temporal flexibility in vessel launch and retrieval times, facilitating extended sampling periods; and
> These are generally the tides favoured by recreational fishers targeting demersal reef fish and/or mud crabs from trailer boats.
Research Angling 2.2.1
Research Angling (RA) focused on iconic reef species such as golden snapper (Lutjanus johnii, Family Lutjanidae) and black jewfish (Protonibia diacanthus, Family Sciaenidae), which are considered by NT Fisheries to be under fishing stress (Grubert et al. 2013). These species, along with a subset of other species, are likely to be those most accessible to recreational fishers, most frequently caught during RA and therefore most useful in terms of estimating and comparing CPUE and assessing signs of potential ill-health.
2.2.1.1 Angling Sites The use of vessels and staff from NT Fisheries has allowed a standardised approach for the purpose of yielding more reliable measures of change in recreational fishing quality than can be obtained via the fishery-dependent (APS) techniques. Research angling involved researchers angling for a period of time at multiple ‘angling sites’ during each replicate fishing trip (defined as a sampling day with a vessel) undertaken within each of the locations sampled (Table 2-1 and Figure 2-1) during a given sampling season.
Baseline Phase angling sites were originally selected after considering the following:
> Existing sampling sites used by NT Fisheries for similar research;
> Several well-known artificial reefs suggested for inclusion by the Amateur Fisher Association of the Northern Territory (AFANT);
> Local knowledge and advice provided by NT Fisheries vessel skippers during trips; and
> Location of suitable reef substrata identified using vessel sounding equipment during trips.
In order to maintain spatial consistency among all Baseline, Dredging and Post-dredging Phase sampling seasons, a pool of angling sites was identified at each location during B1 and B2 (see Section 4.1.1.1). Angling sites for RA sampling undertaken during the Post-dredging Phase were primarily selected from this pool of sites identified. Although during P1 the groups of angling sites sampled in DI, DO and BH were not exactly the same as those sampled during Baseline Phase sampling seasons, the pool of sites visited during
Prepared for INPEX Cardno 8

Research Fishing and Fish Health Monitoring Post-dredging Report Season 1 Ichthys Nearshore Environmental Monitoring Program
each fishing trip completed at each location during P1 was considered spatially representative of Baseline Phase angling sites.
2.2.1.2 Angling Methodology and Equipment Once the vessel had reached an identified RA sampling site, it was anchored and following recording of GPS position, water depth (in metres) and start time, standardised angling activity commenced. A finish time was subsequently recorded on completion of angling activities.
The angling equipment used and methodology applied was designed to represent ‘normal’ reef fishing activities by recreational trailer-boat fishing parties, while maintaining some standardisation in gears used and decision-making rules. For example, given most recreational anglers are likely to move on to a different angling site after a period of time of no ‘nibbling’ on the baited hook, angling sites in the current program where no sign of potential captures was evident were abandoned for new sites after 15 minutes. In addition, given recreational anglers are unlikely to abandon sites at which they are catching fish, angling sites that were productive were fished until a lull in capture rate triggered a collective decision by the anglers to move on and try a new site. As such lulls were common, resulting in many angling sites were visited during each fishing trip.
RA gear per fisher comprised of a Silstar Crystal Blue SP 601 fishing rod and a Shimano Stradil 8000 spinning reel fitted with a 22 kg braided line. Each line was rigged with a 20 kg monofilament trace with a sinker suitable (i.e. 70 g to 150 g) for the prevailing current speed and a squid-baited Mustad hook of a size 1/0 or 2/0 attached. At any given site, if hook-ups did not occur despite ample nibbles or strikes on the baited hook, a different hook size was used.
Where possible, captured fish were identified to species level and their caudal fork length measured (LCF to the nearest whole cm below). Each fish was then visually assessed immediately for external abnormality (refer to Section 2.4.2 for details). If a captured fish exhibited abnormality or was required as part of a sample of ‘normal’ (i.e. not considered abnormal) individuals of a priority species (see Section 2.4.1), it was euthanised humanely using the ‘iki jime method’ (i.e. brain-spiking), stored on ice in a sealable bag (to contain any attached parasites) and kept for laboratory examination (refer to Section 2.4.3 for details). If the fish did not show abnormality and was not required as part of a sample of normal fish, it was released as quickly as possible.
Research Potting 2.2.2
Research Potting (RP) specifically targeted mud crabs, which are the most popular non-finfish species targeted by recreational and commercial fishers in waters throughout NT. Given their widespread distribution and plentiful abundance throughout Darwin Harbour and all other NT estuaries, this species is considered to have good potential for comparing CPUE and signs of ill-health among locations and Phases.
2.2.2.1 Potting Sites On any given replicate fishing trip undertaken within each of the defined locations being sampled during a given sampling season (i.e. a sampling day with a vessel), 20 baited pots were deployed at a selected ‘potting site’ (Table 2-1 and Figure 2-1). During Baseline Phase sampling, a pool of potting sites were identified for each location (see Section 4.1.2.1). Potting sites were generally located near muddy banks on either side of tidal creeks or inlets and were selected after considering the following:
> Potting sites used by NT Fisheries for various research studies; and
> Local knowledge and advice provided by NT Fisheries vessel skippers during trips.
Potting sites for RP sampling undertaken during the Dredging Phase and Post-dredging Phase sampling seasons have been selected from this pool of sites.
2.2.2.2 Potting Methodology and Equipment Upon launching at the start of each fishing trip, the vessel travelled to a pre-determined ‘target’ creek or inlet to deploy the 20 pots. Baited pots were successively deployed approximately 30 m apart, generally in a line parallel to the bank, with GPS position of each pot, water depth and time of deployment recorded. Pots were retrieved on completion of the fishing trip en route to the boat ramp, with the resulting soak times varying from approximately 4 to 6 h.
Prepared for INPEX Cardno 9

Research Fishing and Fish Health Monitoring Post-dredging Report Season 1 Ichthys Nearshore Environmental Monitoring Program
The crab pots used were collapsible, wire-framed, circular pots of 0.72 m in diameter x 0.24 m in height incorporating two entrance funnels. Pots were covered in knotted netting made from twisted polyethylene twine with approximate mesh size of 45 mm to 50 mm (stretched-mesh-opening (SMO)), as measured using the technique described by Ferro and Xu (1996). Immediately prior to each pot deployment, the pot was baited with red meat and connected with a marked float via a sufficient length of negatively-buoyant rope and shark-clip.
Each crab and finfish captured was identified to species level where possible. Crab carapace width (CW) was measured using callipers and finfish length to LCF as per the RA methodology (see Section 2.2.1). Crabs were visually inspected for external abnormality (see Section 2.4.3), with abnormal crabs and samples of ‘normal’ crabs placed in holding containers and covered with mangrove branches for return to the laboratory for examination. Normal crabs not required to be returned to the laboratory were released as soon as practicable. The on-board processing procedure for visually examining all finfish caught was the same as for RA (see Section 2.4.2).
Presentation and Analysis of Data 2.2.3
A summary of outputs from Research Fishing is provided in Table 2-4.
2.2.3.1 Catch Variables and Taxonomy Where individuals could not be reliably identified to species level, they were categorised into logical taxonomic groupings. For example, ‘mud crabs’ can be considered to comprise two similar species, Scylla serrata and the less common Scylla olivacea; therefore, these species were combined and represented taxonomically as ‘Scylla spp.’. Similar situations exist for ‘sand crabs’, ‘queenfish’, ‘javelin’, ‘bream’, ‘forktail catfish’ and ‘mullet’, and therefore species conglomerates were grouped accordingly.
Two other species aggregations as catch variables were applied:
> ‘Reef species’ (all reef finfish species combined); and
> ‘All individuals’ (all animals combined).
These variables coincide taxonomically with the ‘Reef fish’ and ‘Anything’ catch variables applied to fisher-reported catches as part of APS sampling (Cardno 2013a).
Prepared for INPEX Cardno 10

Research Fishing and Fish Health Monitoring Post-dredging Report Season 1 Ichthys Nearshore Environmental Monitoring Program
Table 2-4 Summary of data collected and outputs associated with Research Fishing (Research Angling (RA) and Research Potting (RP))
Data/Information Description of Data Summaries and Analyses
Spatial sampling coverage Maps and GPS list of angling and potting sites sampled for each location
Catch composition Suite of species × catch rates of each species per fishing trip for RA Catch composition compared among locations and sampling seasons via multivariate analysis techniques (MDS ordination, SIMPER and PERMANOVA)
Species diversity Number of species caught per fishing trip for each sampling method Mean number of species compared among locations and sampling seasons via univariate PERMANOVA
Standardised catch rates (CPUE)
RA – Number of fish caught per angler hour RP – Number of animals caught per crab pot Mean CPUE compared among locations and sampling seasons for the most frequently caught species or relevant groupings of species via univariate PERMANOVA
Size-class frequencies Size-class frequency distributions for selected finfish (LCF – length to caudal fork to the nearest cm below) and crab (CW – carapace width) by species (where sample sizes permit) Size structure of catches compared among locations and sampling seasons for the most frequently caught species via Kolmogorov-Smirnov tests
2.2.3.2 Statistical Analyses The following analytical techniques were used to detect environmentally significant changes in catch composition, species diversity, catch rates and size-class frequency distributions among locations DI, DO and BH and among sampling seasons B2, D1, D2, D3, D4 and P1. No significant changes in these parameters were recorded at AR when sampled during B2, D1 and D2. As such results from AR have been removed from formal analyses while information has been included where applicable to aid in the interpretation of results.
The large disparity in mean catch rates between the two Baseline Phase sampling seasons detected for some of the important catch variables in Darwin Harbour (Cardno 2013b,c) led to a decision to include only data from the second season of Baseline Phase sampling (B2) to represent the Baseline Phase in analyses involving Dredging Phase and Post-dredging Phase sampling seasons. Furthermore, given the refinement of Research Fishing field sampling in B2 compared with B1, the former was assumed to be more comparable with data collected during the Dredging Phase and Post-dredging Phase sampling seasons. Despite B1 data being excluded from the formal analyses, they were considered when interpreting the results of statistical analyses.
2.2.3.2.1 Multivariate Analysis
Distance-based, two factor permutational multivariate analysis of variance (PERMANOVA; Anderson 2001) was used to test for differences in RA catch composition (expressed as catch rates – CPUE – by species) among sampling Seasons and among selected Locations (variable n, see Table 2-3). Multivariate analyses were undertaken using the software package PRIMER 6.0 with PERMANOVA+ add-on.
Given that no Research Fishing was possible in AR during D3, D4 and P1 (see Section 2.1), AR data collected during B2, D1 and D2 were excluded from the analysis. This exclusion was considered to be of negligible detriment to the analysis given that previous RFFHMP results indicated that during the Baseline Phase the composition of AR catches were generally more different from the composition of DI and DO catches than were the composition of BH catches (Cardno 2013b,c). Factors in the PERMANOVA were:
> Season (fixed, orthogonal) – 6 levels (B2, D1, D2, D3, D4 and P1); and
> Location (fixed, orthogonal) – 3 levels (DI, DO and BH).
Prepared for INPEX Cardno 11

Research Fishing and Fish Health Monitoring Post-dredging Report Season 1 Ichthys Nearshore Environmental Monitoring Program
For the purpose of data analysis, the Darwin locations DI and DO were considered separate for the following reasons:
> Differences in general cause(s) of environmental disturbance were likely to be associated with the construction phase of the Project (i.e. effects due to dredging activity versus those due to spoil disposal);
> Inherent differences in general catchment inputs, oceanography and habitat available to fish (i.e. highly tidal estuarine versus open sea); and
> Likely differences in the spatial and/or temporal pattern and extent of impacts to water quality and sedimentation (i.e. predicted ‘Zones of Moderate Impact and Influence’, INPEX 2013a).
As a consequence, it is highly likely that any potential impacts on recreational fishing quality and/or fish health would differ in nature and extent between DI and DO.
The two-factor PERMANOVA used Bray-Curtis similarities calculated using Ln(x+1)-transformed CPUE data (to model treatment effects as approximately multiplicative) with unrestricted data permutation methodology applied. While pooling of the ‘Season x Location’ interaction term with the ‘Residual’ term was done where appropriate (i.e. if p-perm of the interaction term was ≥ 0.25), results for both the pooled and the unpooled versions were presented where applicable. Where a term (main factor or interaction) was significant at p-perm < 0.05, pair-wise permutational tests were used in post hoc analyses where necessary to identify which pairs of levels of factors or interaction strata differed statistically.
The SIMPER routine (Clarke and Warwick 2001) was then used to identify taxa that best discriminated among significantly different pairs of levels of factors or interaction strata. Only species for which the ratio of mean Bray-Curtis dissimilarity to standard deviation was greater than or equal to 1 were considered good discriminators (Clarke and Warwick 2001).
2.2.3.2.2 Univariate Analysis
Univariate permutational analyses of variance using PRIMER 6.0 (PERMANOVA+) were used to test for environmentally significant differences in species diversity of catches, and in standardised catch rates (CPUE) for relevant species groupings and species caught frequently, among seasons and among selected locations (variable n, see Table 2-3). Factors in the univariate PERMANOVA were the same as those applied for the multivariate analysis.
The two-factor ANOVA used Euclidean dissimilarity matrices calculated using Ln(x+1)-transformed data (to model treatment effects as approximately multiplicative) with unrestricted data permutation methodology applied (Anderson et al. 2008). Pooling and post hoc analytical procedures were akin to those outlined for multivariate analyses (see Section 2.2.3.2.1).
2.2.3.3 Size Frequency Comparisons Kolmogorov-Smirnov (KS) tests were used to test for differences in size structure (i.e. size frequency distributions) of catches of golden snapper, Moses snapper, javelin, blue tuskfish, grass emperor, goldspotted rockcod, stripey snapper, barramundi, mud crabs and sand crabs among B1, B2 and P1 sampling seasons for sampling locations DI, DO and BH (pooled among replicate days).
For each species at sampling locations DI, DO and BH, KS tests were performed in a logical sequence. Where size structures of B1 and B2 catches were significantly different (at the appropriately corrected α level), the size structure of the P1 catch was compared with B1 and B2 separately. Where size structures of B1 and B2 catches were not significantly different, P1 was compared with the size structure of B1 and B2 combined (i.e. Baseline Phase). Additional comparisons were also made to determine if the size structure of samples collected during P1 differed to those collected during the Dredging Phase (all sampling seasons combined).
Raw size frequency data were categorised into size classes for selected species frequently caught during the Post-dredging Phase for the purpose of graphical presentation and visual comparison. The resultant size-class frequency distributions were plotted for each of these species during P1, the Baseline Phase and Dredging Phase for each location.
Prepared for INPEX Cardno 12

Research Fishing and Fish Health Monitoring Post-dredging Report Season 1 Ichthys Nearshore Environmental Monitoring Program
Supplementary Sampling 2.3During each sampling season, Cardno collaborated with NT Fisheries staff in the use of alternative sampling methods (cast netting, gill netting and/or lure angling) to supplement the quantity of fish health samples obtained via RA and RP where necessary. Supplementary sampling also facilitated the capture of important recreational species not commonly caught using the RA technique (i.e. barramundi, blue threadfin, king threadfin, queenfish, mullet and herring) and fish present that may not have been feeding due to ill-heath. These methods were intended only to provide supplementary samples for health assessments and not standardised data for catch and effort.
Cast Netting 2.3.1
Where required, cast netting was undertaken opportunistically using locally sourced nets and according to normal cast net deployment techniques in shallow water (up to 1 m deep) over sandy or muddy substrata. Cast nets used were approximately 2.8 m in diameter and made from netting of 19 mm SMO measured as described by Ferro and Xu (1996).
On retrieval of the nets, the catch was initially deposited into a container of freshly collected seawater to keep the animals alive and minimise stress prior to field-based health assessments. Finfish were then treated as per the RA field-based data collection (and on-board health assessment) protocols (see Section 2.4).
Gill Netting 2.3.2
Gill nets were deployed on separate days to the Research Fishing trips for the following reasons:
> Advice from NT Fisheries staff was that the likelihood of catching the main gill net target species (e.g. barramundi, blue threadfin, king threadfin and queenfish) was greater during spring tides (i.e. greater differences between low and high water level) rather than the neap tides preferred for RA and RP;
> In accordance with animal ethics permit conditions, gill nets must be supervised at all times when deployed, meaning that the time-management practicalities associated with using them concurrently with the Research Fishing methods were infeasible; and
> With crab pots and floats, personnel and all other equipment on board vessels at times during Research Fishing trips, there was no room available for gill netting equipment.
Gill netting involved a pair of vessels concurrently conducting sampling activities during one sampling day in each location. One vessel deployed, supervised and retrieved gill nets while the other vessel targeted barramundi, queenfish, blue threadfin and king threadfin via additional angling techniques using lures (see Section 2.3.3).
Each gill net was approximately 210 m in total length, 3.5 m in height and comprised of a mixture of mono-filament and multi-mono-filament panels with mesh sizes ranging between 95 mm and 140 mm SMO. During each fishing trip, gill nets were deployed at multiple sites within the sampling location prior to the bottom of the low tide and were retrieved from the water approximately four hours after the low tide. Each gill net was continuously monitored throughout the period of deployment. Throughout this period, fish and crabs caught by the gill net were extracted and immediately processed as per the field-based data collection (and on-board health assessment) protocols associated with the Research Fishing methods (see Sections 2.2.1 and 2.2.2).
Additional Angling 2.3.3
Angling using lures and bait was done during all gill netting days to supplement samples obtained using gill nets. Fish caught were processed as per the RA field-based sample collection protocols (Section 2.2.1).
Fish Health 2.4Assessments of the health of finfish and crabs were based on field-based observations and detailed laboratory examinations of samples of finfish and crabs caught via Research Fishing and supplementary sampling methods outlined in Sections 2.2.1 and 2.3. The general temporal and spatial design for fish health sampling is the same as for Research Fishing (see overview in Section 2.1).
Prepared for INPEX Cardno 13
Research Fishing and Fish Health Monitoring Post-dredging Report Season 1 Ichthys Nearshore Environmental Monitoring Program
Sampling Priorities and Sample Sizes 2.4.1
A visual external assessment was undertaken immediately upon capture for all finfish and crabs caught during all sampling activities to determine if they displayed signs of abnormality (see Section 2.4.2). All individuals exhibiting abnormality were returned to the laboratory for further examination (see Section 2.4.2). In addition, based on information regarding the Gladstone Harbour fish kills (Gladstone Fish Health Scientific Advisory Panel 2012), up to a total of 10 ‘normal’ individuals (i.e. displaying no signs of abnormality) per species per location per sampling season were kept for more detailed internal and external laboratory examination. Where possible, the types of ‘normal’ individuals retained for further laboratory assessment were:
> Popular or commonly caught recreational species such as barramundi, mud crab, golden snapper, queenfish, javelin, sand crab and goldspotted rockcod;
> Species of potential interest due to specific biological characteristics, such as habitat use or feeding preferences (e.g. mullet and forktail catfish are commonly muddy-bottom dwellers/feeders);
> Any other species that were being caught in sufficient numbers at one or more locations to warrant comparisons in health parameters among locations; and
> Any apparently healthy finfish that was gut-hooked or sustained serious damage to the mouth, eyes or gills as a result of the angling process. Any such specimen was immediately euthanised and processed as a sample of a healthy individual.
A tally of samples being returned to the laboratory (by species) was updated and re-assessed on a daily basis in order to prioritise species for retention for laboratory examination on subsequent sampling days, and to minimise the number of field assessed ‘normal’ individuals retained.
Field-based Assessment 2.4.2
Field-based external assessments involved careful visual examination of fish or crabs for any clearly visible abnormalities, such as disease, external lesions, deformities, irregular colorations and visible parasitic infections. The body, eyes, mouth, fins and gills of each finfish were assessed for signs of abnormality, with the pectoral fins lifted and gill opercula opened to inspect for parasites, disease or discoloration. Prior to assessment, the carapace of each crab was wiped down to remove any debris (e.g. mud and silt) that might obscure visual inspection. Any finfish or crab classified as ‘abnormal’ following the field assessment was retained, individually labelled, stored and transported to the laboratory for further detailed examination, with observed abnormalities recorded for laboratory-based review.
Laboratory-based Examination 2.4.3
Each retained finfish was kept in a sealed sample bag and on ice until it could be processed in the laboratory. All samples were assessed within 24 hours of capture. Live crabs were kept in holding containers (covered with mangrove leaves) until they could be processed. Each individual was weighed and then subjected to thorough external and internal examination by an experienced, qualified fish parasitologist/pathologist to ascertain its health status.
Internal organs selected for analyses (see Sections 2.4.3.1 and 2.4.3.2) were chosen because of their importance to critical physiological and/or biochemical processes and because they are known to undergo well-described pathological changes when exposed to toxicants or environmental stressors. Unidentified parasites were extracted, preserved in 10% formalin and returned to the NATA (National Association of Testing Authorities) accredited laboratories of DigsFish Services Pty Ltd in Queensland for further examination to determine species identification.
2.4.3.1 Finfish Examination and Dissection
Each fish was measured (LCF), weighed (to the nearest gram) and then examined externally for signs of disease, lesions, deformities, visible parasitic infections and other abnormalities. The paired fins (pectoral/pelvic), operculum and gill arches on the left side were examined under a dissecting microscope for parasites and lesions. The fish was then cut open and the internal organs examined, at which time sex was determined where possible and stomach contents noted. Samples of parasites found were fixed in 10% formalin for later examination and identification. The liver, spleen and kidney were excised and, together with a gill biopsy, fixed in 10% formalin for later examination for pathological lesions via histopathology, if
Prepared for INPEX Cardno 14

Research Fishing and Fish Health Monitoring Post-dredging Report Season 1 Ichthys Nearshore Environmental Monitoring Program
required. Samples of muscle and liver were frozen and archived at -20° C for later toxicological analysis, if required. Any parasites or lesions observed were described and the health status of the fish assessed based on this information.
2.4.3.2 Crab Examination and Dissection Crabs were placed in a freezer for 10 to 15 minutes to anesthetise them for safe handling. Each crab was measured (CW), sexed and weighed (to the nearest gram) and any loss of legs/claws or external parasitic infections (e.g. Loxothylacus or Sacculina) noted. The carapace was examined for shell lesions and infections, including rust spot and classic shell disease. The carapace was then removed and internal organs examined for parasites, infections or lesions. Samples of parasites found were fixed in 10% formalin for later examination and species identification. Samples of hepatopancreas, heart, gill and gonad were excised and fixed in 10% formalin for later examination for pathological lesions via histopathology, if required. A sample of hepatopancreas was frozen and archived at -20°C for later toxicological analysis, if required. Any parasites or lesions observed were described and the health status of the crab assessed based on this information.
Histopathology and Toxicology 2.4.4
More advanced parasitological assessments and histopathology work were carried out on samples from:
> All individuals classified as abnormal; and
> Up to five randomly chosen ‘normal’ individuals per location per sampling season for five of the most recreationally important and/or frequently caught species (i.e. golden snapper, barramundi, goldspotted rockcod, mud crab and sand crab).
This work involved sample fixation, sectioning, staining and microscopy procedures at the NATA accredited laboratories of DigsFish Services Pty Ltd in Queensland.
Presentation and Analysis of Data 2.4.5
The detailed laboratory analysis of parasite and histology samples to date (i.e. samples from B1, B2, D1, D2, D3, D4 and P1) has permitted estimation of prevalence and intensity of some common finfish and crab infections for many of the frequently caught and/or important recreational species. Such examinations have facilitated the temporal and spatial comparison of fish health parameters as part of the RFFHMP. Table 2-5 summarises the health parameters estimated and presented in this report.
2.4.5.1 Calculation of Prevalence Estimates All disease prevalence estimates for each location generated for this report are ‘Projected Sample Prevalence’ (PSP) (Table 2-5), but for brevity are referred to simply as ‘prevalence’ throughout the rest of this report. They are intended as a corrected estimate for the entire sample of individuals (for a given species) taken in the field as part of this monitoring program; not as an estimate for the entire population in a given location during a given season. This distinction is important, as the sampling methodologies do not provide samples representative of all size classes present at the time of sampling, and health issues may not be present at equal prevalence across all size classes.
The prevalence (i.e. PSP) estimates for any given species were produced using a stratified approach as there were two sampling strategies (or sampling fractions) applied during field sampling – one for individuals classified as abnormal (100% returned to the laboratory) and one for ‘normal’ individuals (a subsample returned to the laboratory). Similarly, there were two sampling strategies applied for assigning individuals for further histopathological microscopy – 100% of abnormal individuals and a subsample of laboratory-assessed ‘normal’ individuals. Estimating prevalence of a given pathogen or parasite for a given species therefore involved correcting for the sampling fractions applied for ‘normal’ individuals at each stage of the health assessment process. Prevalence was estimated in this way separately for each pathogen/parasite category (or grouping of categories where appropriate) for each fish species at each location and for locations combined.
Prepared for INPEX Cardno 15
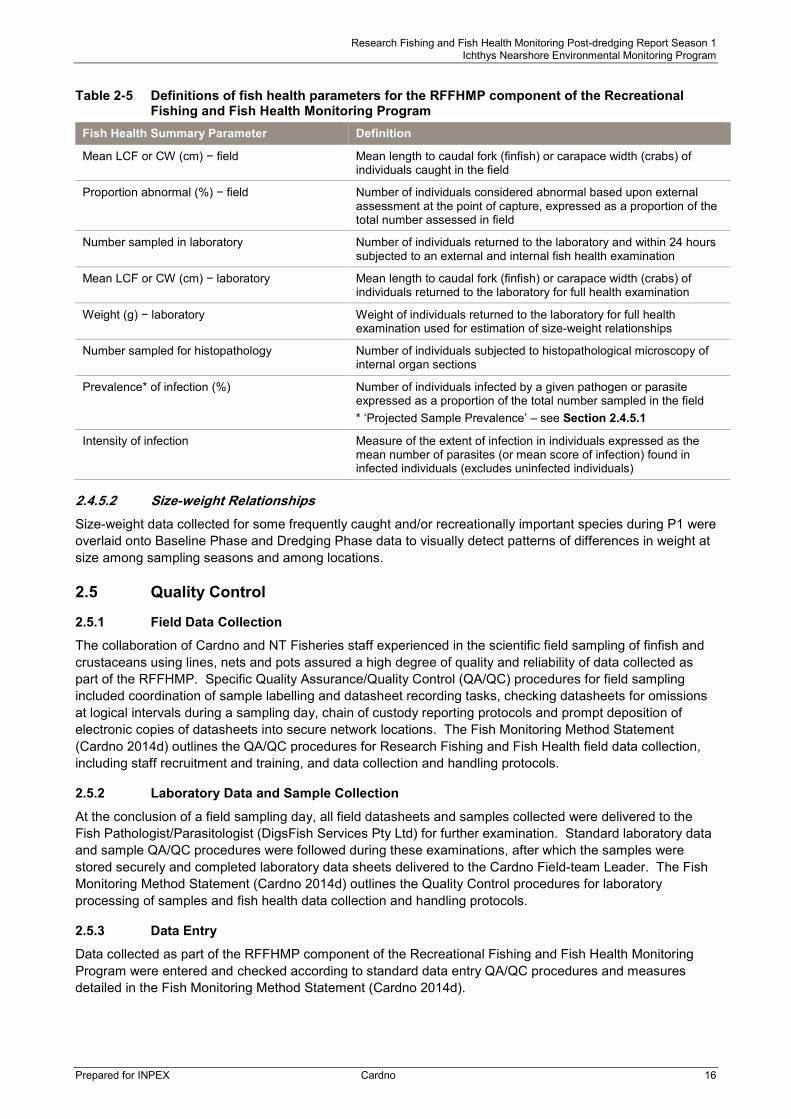
Research Fishing and Fish Health Monitoring Post-dredging Report Season 1 Ichthys Nearshore Environmental Monitoring Program
Table 2-5 Definitions of fish health parameters for the RFFHMP component of the Recreational Fishing and Fish Health Monitoring Program
Fish Health Summary Parameter Definition
Mean LCF or CW (cm) − field Mean length to caudal fork (finfish) or carapace width (crabs) of individuals caught in the field
Proportion abnormal (%) − field Number of individuals considered abnormal based upon external assessment at the point of capture, expressed as a proportion of the total number assessed in field
Number sampled in laboratory Number of individuals returned to the laboratory and within 24 hours subjected to an external and internal fish health examination
Mean LCF or CW (cm) − laboratory Mean length to caudal fork (finfish) or carapace width (crabs) of individuals returned to the laboratory for full health examination
Weight (g) − laboratory Weight of individuals returned to the laboratory for full health examination used for estimation of size-weight relationships
Number sampled for histopathology Number of individuals subjected to histopathological microscopy of internal organ sections
Prevalence* of infection (%) Number of individuals infected by a given pathogen or parasite expressed as a proportion of the total number sampled in the field * ‘Projected Sample Prevalence’ – see Section 2.4.5.1
Intensity of infection Measure of the extent of infection in individuals expressed as the mean number of parasites (or mean score of infection) found in infected individuals (excludes uninfected individuals)
2.4.5.2 Size-weight Relationships Size-weight data collected for some frequently caught and/or recreationally important species during P1 were overlaid onto Baseline Phase and Dredging Phase data to visually detect patterns of differences in weight at size among sampling seasons and among locations.
Quality Control 2.5
Field Data Collection 2.5.1
The collaboration of Cardno and NT Fisheries staff experienced in the scientific field sampling of finfish and crustaceans using lines, nets and pots assured a high degree of quality and reliability of data collected as part of the RFFHMP. Specific Quality Assurance/Quality Control (QA/QC) procedures for field sampling included coordination of sample labelling and datasheet recording tasks, checking datasheets for omissions at logical intervals during a sampling day, chain of custody reporting protocols and prompt deposition of electronic copies of datasheets into secure network locations. The Fish Monitoring Method Statement (Cardno 2014d) outlines the QA/QC procedures for Research Fishing and Fish Health field data collection, including staff recruitment and training, and data collection and handling protocols.
Laboratory Data and Sample Collection 2.5.2
At the conclusion of a field sampling day, all field datasheets and samples collected were delivered to the Fish Pathologist/Parasitologist (DigsFish Services Pty Ltd) for further examination. Standard laboratory data and sample QA/QC procedures were followed during these examinations, after which the samples were stored securely and completed laboratory data sheets delivered to the Cardno Field-team Leader. The Fish Monitoring Method Statement (Cardno 2014d) outlines the Quality Control procedures for laboratory processing of samples and fish health data collection and handling protocols.
Data Entry 2.5.3
Data collected as part of the RFFHMP component of the Recreational Fishing and Fish Health Monitoring Program were entered and checked according to standard data entry QA/QC procedures and measures detailed in the Fish Monitoring Method Statement (Cardno 2014d).
Prepared for INPEX Cardno 16

Research Fishing and Fish Health Monitoring Post-dredging Report Season 1 Ichthys Nearshore Environmental Monitoring Program
3 Dredging Operations
The dredging program involved a number of dredge vessels including backhoe dredgers (BHDs), cutter suction dredger (CSD) and trailing suction hopper dredgers (TSHDs) operating in different areas depending on water depths, bed material characteristics and the volume of material to be removed.
The EA dredging campaign was divided into five dredging footprint separable portions (SP1 to SP5), which refer to the location and duration of specific dredging activities. The SPs are summarised in Table 3-1 and presented in Figure 3-1.
Season One of the EA dredging campaign commenced on 27 August 2012 with BHDs, with the CSD commencing on 4 November 2012, with all Season One dredging operations ceasing on 30 April 2013. The ‘dry season’ dredging hiatus extended from 1 May 2013 to 31 October 2013. Season Two of the EA dredging campaign commenced on 1 November 2013 and ceased on 11 June 2014, while the GEP dredging program commenced on 23 October 2013 and concluded on 12 July 2014.
Table 3-1 Dredge footprint summary ID Separable Portion
SP1 Separable Portion 1 − Module Offloading Facility (MOF)
SP2 Separable Portion 2 − Jetty Pocket
SP3 Separable Portion 3 − Berth Area
SP4 Separable Portion 4 − Approach Channel, Berth Approach and Turning Area
SP5 Separable Portion 5 − Walker Shoal
Prepared for INPEX Cardno 17
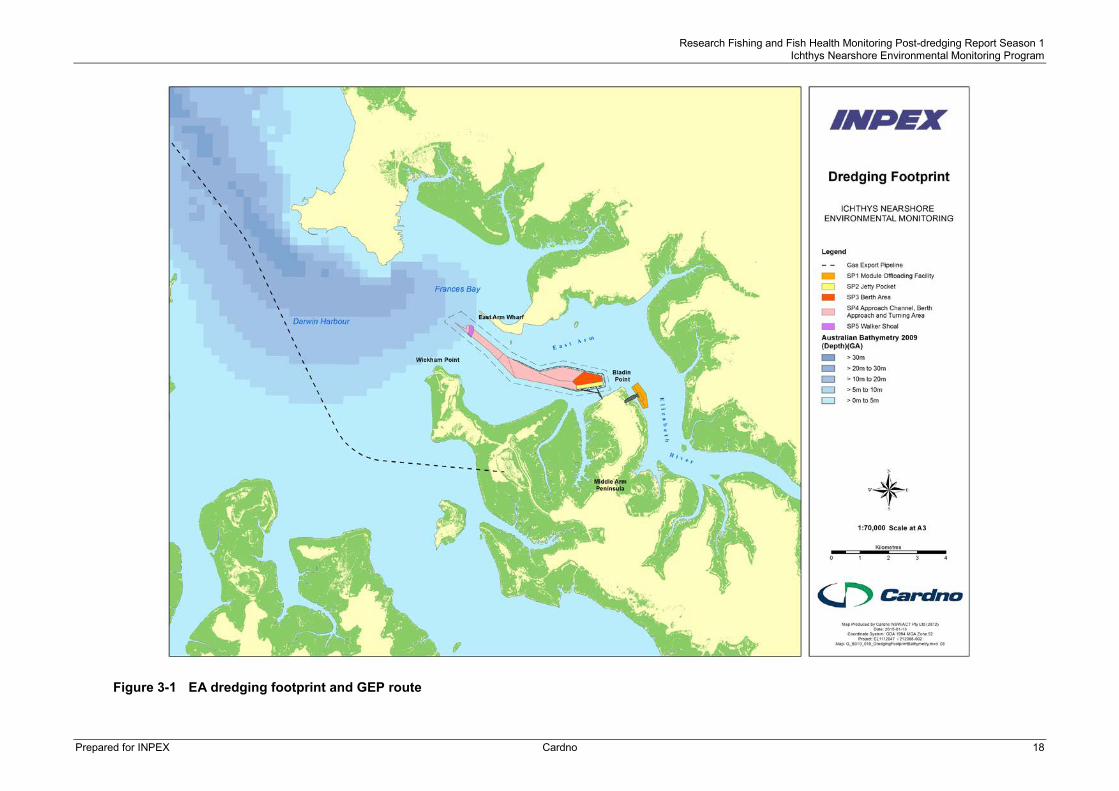
Research Fishing and Fish Health Monitoring Post-dredging Report Season 1 Ichthys Nearshore Environmental Monitoring Program
Figure 3-1 EA dredging footprint and GEP route
Prepared for INPEX Cardno 18
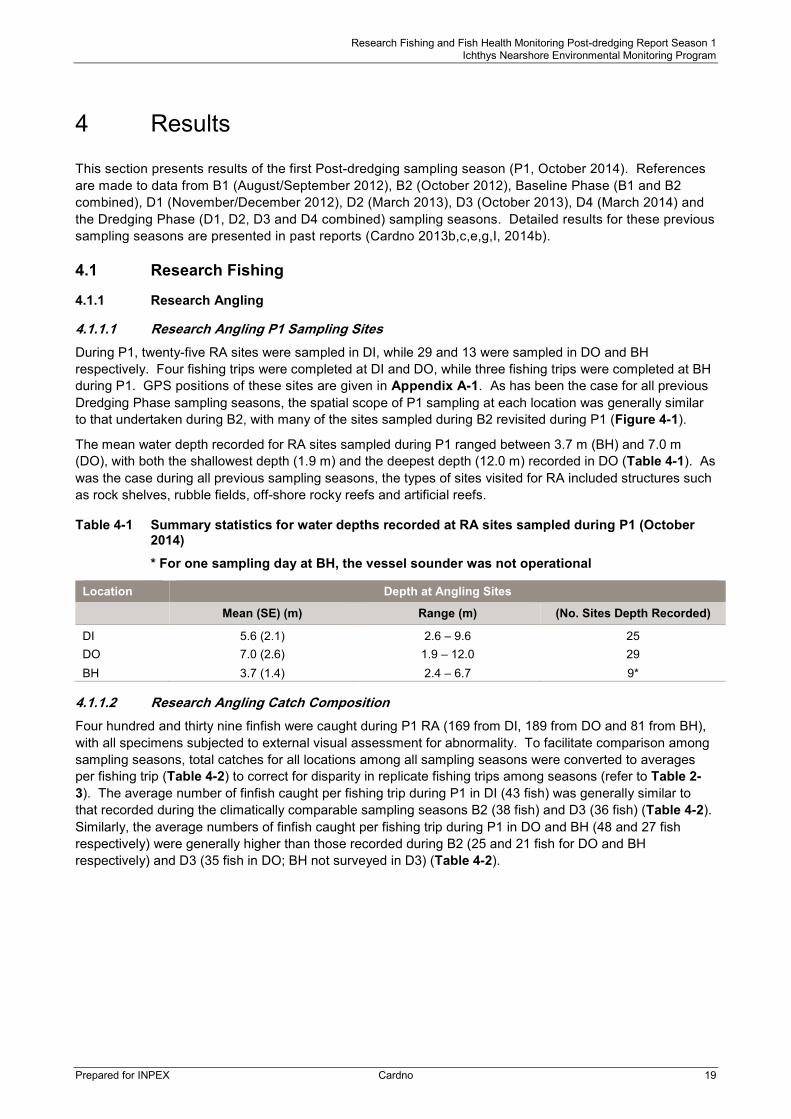
Research Fishing and Fish Health Monitoring Post-dredging Report Season 1 Ichthys Nearshore Environmental Monitoring Program
4 Results
This section presents results of the first Post-dredging sampling season (P1, October 2014). References are made to data from B1 (August/September 2012), B2 (October 2012), Baseline Phase (B1 and B2 combined), D1 (November/December 2012), D2 (March 2013), D3 (October 2013), D4 (March 2014) and the Dredging Phase (D1, D2, D3 and D4 combined) sampling seasons. Detailed results for these previous sampling seasons are presented in past reports (Cardno 2013b,c,e,g,I, 2014b).
Research Fishing 4.1
Research Angling 4.1.1
4.1.1.1 Research Angling P1 Sampling Sites During P1, twenty-five RA sites were sampled in DI, while 29 and 13 were sampled in DO and BH respectively. Four fishing trips were completed at DI and DO, while three fishing trips were completed at BH during P1. GPS positions of these sites are given in Appendix A-1. As has been the case for all previous Dredging Phase sampling seasons, the spatial scope of P1 sampling at each location was generally similar to that undertaken during B2, with many of the sites sampled during B2 revisited during P1 (Figure 4-1).
The mean water depth recorded for RA sites sampled during P1 ranged between 3.7 m (BH) and 7.0 m (DO), with both the shallowest depth (1.9 m) and the deepest depth (12.0 m) recorded in DO (Table 4-1). As was the case during all previous sampling seasons, the types of sites visited for RA included structures such as rock shelves, rubble fields, off-shore rocky reefs and artificial reefs.
Table 4-1 Summary statistics for water depths recorded at RA sites sampled during P1 (October 2014)
* For one sampling day at BH, the vessel sounder was not operational
Location Depth at Angling Sites
Mean (SE) (m) Range (m) (No. Sites Depth Recorded)
DI 5.6 (2.1) 2.6 – 9.6 25 DO 7.0 (2.6) 1.9 – 12.0 29 BH 3.7 (1.4) 2.4 – 6.7 9*
4.1.1.2 Research Angling Catch Composition Four hundred and thirty nine finfish were caught during P1 RA (169 from DI, 189 from DO and 81 from BH), with all specimens subjected to external visual assessment for abnormality. To facilitate comparison among sampling seasons, total catches for all locations among all sampling seasons were converted to averages per fishing trip (Table 4-2) to correct for disparity in replicate fishing trips among seasons (refer to Table 2-3). The average number of finfish caught per fishing trip during P1 in DI (43 fish) was generally similar to that recorded during the climatically comparable sampling seasons B2 (38 fish) and D3 (36 fish) (Table 4-2). Similarly, the average numbers of finfish caught per fishing trip during P1 in DO and BH (48 and 27 fish respectively) were generally higher than those recorded during B2 (25 and 21 fish for DO and BH respectively) and D3 (35 fish in DO; BH not surveyed in D3) (Table 4-2).
Prepared for INPEX Cardno 19

Research Fishing and Fish Health Monitoring Post-dredging Report Season 1 Ichthys Nearshore Environmental Monitoring Program
Table 4-2 Total RA catches (species combined), weighted to average number of finfish caught per replicate fishing trip, for each location sampled during each sampling season (rounded to nearest whole fish)
x = not sampled
Location Sampling Season
B2 (dry)
D1 (dry)
D2 (wet)
D3 (dry)
D4 (wet)
P1 (dry)
DI 38 39 25 36 17 43 DO 25 20 9 35 25 48 BH 21 36 30 x 29 27 AR 21 24 16 x x x
Prepared for INPEX Cardno 20

Research Fishing and Fish Health Monitoring Post-dredging Report Season 1 Ichthys Nearshore Environmental Monitoring Program
Figure 4-1 Map of the B2 (October 2012) and P1 (October 2014) research angling sites within Darwin Harbour – Inner (DI), Darwin – Outer (DO) and
Bynoe Harbour (BH)
Prepared for INPEX Cardno 21

Research Fishing and Fish Health Monitoring Post-dredging Report Season 1 Ichthys Nearshore Environmental Monitoring Program
During P1 golden snapper was the most frequently caught finfish species at DI (49% of captures), while blue tuskfish (25% of captures) and Moses snapper (16% of captures) were the most frequently caught species at DO and BH respectively. The suites of most frequently caught species across the three locations during P1 (i.e. including golden snapper, Moses snapper, stripey snapper, javelin and blue tuskfish) were generally similar to those recorded for previous Dredging Phase sampling seasons and for B2 although the relative proportions each species contributed to the overall catch varied between sampling seasons and locations (Figure 4-2). Moses snapper, which was not captured at DI, DO and BH during D4, was recorded in moderate quantities (9% to 16% of captures across DI, DO and BH) during P1. No target marine pest finfish species (Cardno 2014e) were caught during P1. Summary data, including numbers of individuals caught by species (or group) and by location for P1 RA, are presented in Appendix B-1.
Figure 4-2 Relative proportions of total RA catch (by number) comprised by golden snapper, stripey
snapper, javelin, blue tuskfish, Moses snapper and other species combined for locations: A) DI; B) DO; and C) BH during sampling seasons B2 (October 2012), D1 (November/December 2012), D2 (March 2013), D3 (October 2013), D4 (March 2014) and P1 (October 2014) * Multiple species
A) DI B) DO C) BH
Baseline 2(dry)
n = 229 n = 147 n = 128
n = 235 n = 122 n = 216
n = 74 n = 27 n = 90
n = 215 n = 212
n = 68 n = 101 n = 114
Golden snapperStripey snapperJavelin*Blue tuskfishMoses snapperOther species
Dredging 1(dry)
Dredging 2(wet)
Dredging 3(dry)
Dredging 4(wet)
n = 169 n = 189 n = 81
Post-Dredging 1
(dry)
Prepared for INPEX Cardno 22
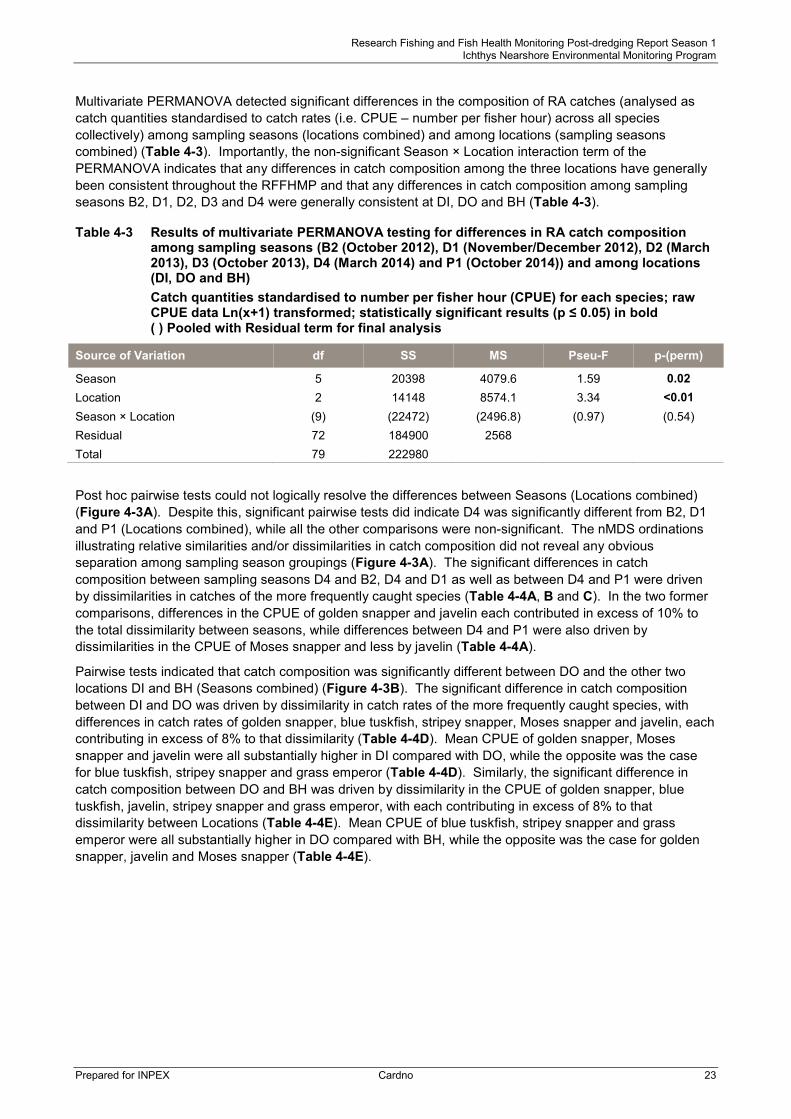
Research Fishing and Fish Health Monitoring Post-dredging Report Season 1 Ichthys Nearshore Environmental Monitoring Program
Multivariate PERMANOVA detected significant differences in the composition of RA catches (analysed as catch quantities standardised to catch rates (i.e. CPUE – number per fisher hour) across all species collectively) among sampling seasons (locations combined) and among locations (sampling seasons combined) (Table 4-3). Importantly, the non-significant Season × Location interaction term of the PERMANOVA indicates that any differences in catch composition among the three locations have generally been consistent throughout the RFFHMP and that any differences in catch composition among sampling seasons B2, D1, D2, D3 and D4 were generally consistent at DI, DO and BH (Table 4-3).
Table 4-3 Results of multivariate PERMANOVA testing for differences in RA catch composition among sampling seasons (B2 (October 2012), D1 (November/December 2012), D2 (March 2013), D3 (October 2013), D4 (March 2014) and P1 (October 2014)) and among locations (DI, DO and BH) Catch quantities standardised to number per fisher hour (CPUE) for each species; raw CPUE data Ln(x+1) transformed; statistically significant results (p ≤ 0.05) in bold ( ) Pooled with Residual term for final analysis
Source of Variation df SS MS Pseu-F p-(perm)
Season 5 20398 4079.6 1.59 0.02 Location 2 14148 8574.1 3.34 <0.01 Season × Location (9) (22472) (2496.8) (0.97) (0.54) Residual 72 184900 2568 Total 79 222980
Post hoc pairwise tests could not logically resolve the differences between Seasons (Locations combined) (Figure 4-3A). Despite this, significant pairwise tests did indicate D4 was significantly different from B2, D1 and P1 (Locations combined), while all the other comparisons were non-significant. The nMDS ordinations illustrating relative similarities and/or dissimilarities in catch composition did not reveal any obvious separation among sampling season groupings (Figure 4-3A). The significant differences in catch composition between sampling seasons D4 and B2, D4 and D1 as well as between D4 and P1 were driven by dissimilarities in catches of the more frequently caught species (Table 4-4A, B and C). In the two former comparisons, differences in the CPUE of golden snapper and javelin each contributed in excess of 10% to the total dissimilarity between seasons, while differences between D4 and P1 were also driven by dissimilarities in the CPUE of Moses snapper and less by javelin (Table 4-4A).
Pairwise tests indicated that catch composition was significantly different between DO and the other two locations DI and BH (Seasons combined) (Figure 4-3B). The significant difference in catch composition between DI and DO was driven by dissimilarity in catch rates of the more frequently caught species, with differences in catch rates of golden snapper, blue tuskfish, stripey snapper, Moses snapper and javelin, each contributing in excess of 8% to that dissimilarity (Table 4-4D). Mean CPUE of golden snapper, Moses snapper and javelin were all substantially higher in DI compared with DO, while the opposite was the case for blue tuskfish, stripey snapper and grass emperor (Table 4-4D). Similarly, the significant difference in catch composition between DO and BH was driven by dissimilarity in the CPUE of golden snapper, blue tuskfish, javelin, stripey snapper and grass emperor, with each contributing in excess of 8% to that dissimilarity between Locations (Table 4-4E). Mean CPUE of blue tuskfish, stripey snapper and grass emperor were all substantially higher in DO compared with BH, while the opposite was the case for golden snapper, javelin and Moses snapper (Table 4-4E).
Prepared for INPEX Cardno 23

Research Fishing and Fish Health Monitoring Post-dredging Report Season 1 Ichthys Nearshore Environmental Monitoring Program
Figure 4-3 Non-metric MDS ordinations illustrating relative similarities/dissimilarities in RA catch
composition among A) sampling seasons (Baseline Phase (B2: October 2012), D1 (November/December 2012), D2 (March 2013), D3 (October 2013), D4 (March 2014) and P1 (October 2014)) and B) locations (DI, DO and Control location BH). Results of PERMANOVA post hoc pairwise comparisons are shown
Catch quantities standardised to number per fisher hour (CPUE) for each species; raw CPUE data Ln(x+1) transformed
2D Stress: 0.19
B2
D1
D2
D3
D4
P1
SamplingSeason
PermanovaPost hoc t-tests
P1 = B2P1 = D1P1 = D2P1 = D3P1 ≠ D4D4 ≠ B2D4 ≠ D1D4 = D2D4 = D3D3 = B2D3 = D1D3 = D2D2 = B1D2 = D1D1 = B2
DI
DO
BH
SamplingLocation
PermanovaPost hoc t-tests
DI ≠ DODI = BHDO ≠ BH
A) Sampling Seasons
B) Locations
2D Stress: 0.19
Prepared for INPEX Cardno 24
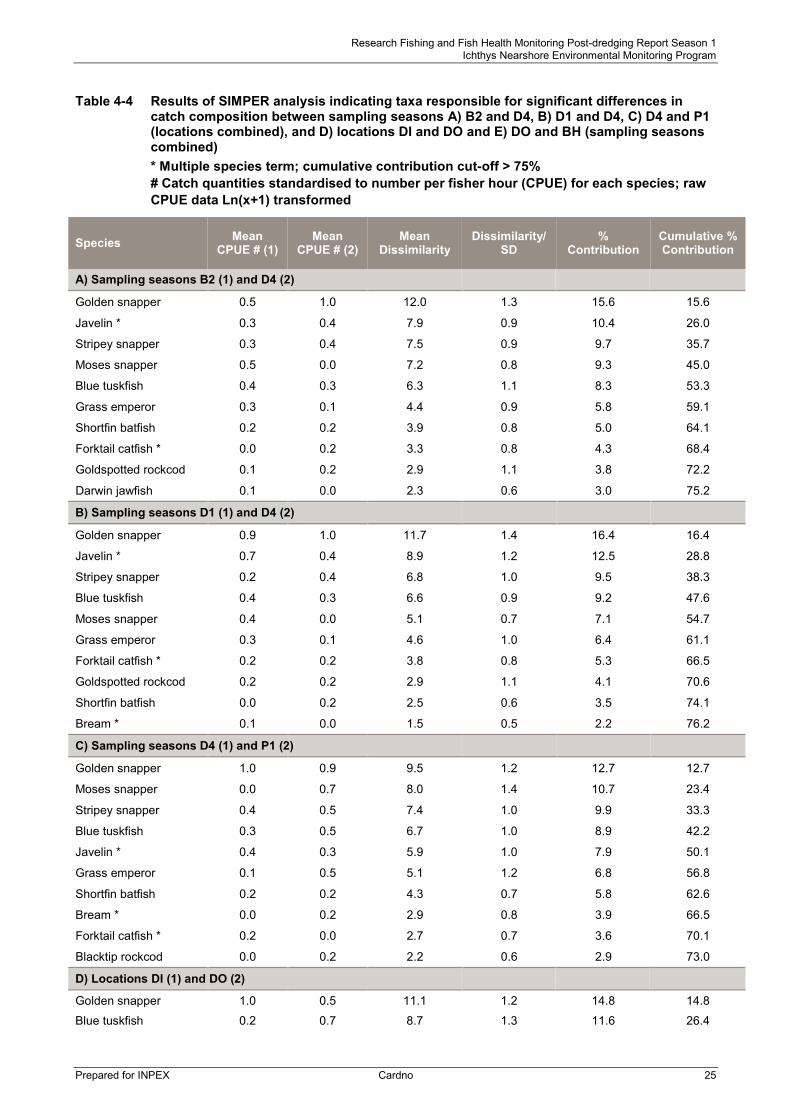
Research Fishing and Fish Health Monitoring Post-dredging Report Season 1 Ichthys Nearshore Environmental Monitoring Program
Table 4-4 Results of SIMPER analysis indicating taxa responsible for significant differences in catch composition between sampling seasons A) B2 and D4, B) D1 and D4, C) D4 and P1 (locations combined), and D) locations DI and DO and E) DO and BH (sampling seasons combined) * Multiple species term; cumulative contribution cut-off > 75% # Catch quantities standardised to number per fisher hour (CPUE) for each species; raw CPUE data Ln(x+1) transformed
Species Mean CPUE # (1)
Mean CPUE # (2)
Mean Dissimilarity
Dissimilarity/ SD
% Contribution
Cumulative % Contribution
A) Sampling seasons B2 (1) and D4 (2)
Golden snapper 0.5 1.0 12.0 1.3 15.6 15.6
Javelin * 0.3 0.4 7.9 0.9 10.4 26.0
Stripey snapper 0.3 0.4 7.5 0.9 9.7 35.7
Moses snapper 0.5 0.0 7.2 0.8 9.3 45.0
Blue tuskfish 0.4 0.3 6.3 1.1 8.3 53.3
Grass emperor 0.3 0.1 4.4 0.9 5.8 59.1
Shortfin batfish 0.2 0.2 3.9 0.8 5.0 64.1
Forktail catfish * 0.0 0.2 3.3 0.8 4.3 68.4
Goldspotted rockcod 0.1 0.2 2.9 1.1 3.8 72.2
Darwin jawfish 0.1 0.0 2.3 0.6 3.0 75.2
B) Sampling seasons D1 (1) and D4 (2)
Golden snapper 0.9 1.0 11.7 1.4 16.4 16.4
Javelin * 0.7 0.4 8.9 1.2 12.5 28.8
Stripey snapper 0.2 0.4 6.8 1.0 9.5 38.3
Blue tuskfish 0.4 0.3 6.6 0.9 9.2 47.6
Moses snapper 0.4 0.0 5.1 0.7 7.1 54.7
Grass emperor 0.3 0.1 4.6 1.0 6.4 61.1
Forktail catfish * 0.2 0.2 3.8 0.8 5.3 66.5
Goldspotted rockcod 0.2 0.2 2.9 1.1 4.1 70.6
Shortfin batfish 0.0 0.2 2.5 0.6 3.5 74.1
Bream * 0.1 0.0 1.5 0.5 2.2 76.2
C) Sampling seasons D4 (1) and P1 (2)
Golden snapper 1.0 0.9 9.5 1.2 12.7 12.7
Moses snapper 0.0 0.7 8.0 1.4 10.7 23.4
Stripey snapper 0.4 0.5 7.4 1.0 9.9 33.3
Blue tuskfish 0.3 0.5 6.7 1.0 8.9 42.2
Javelin * 0.4 0.3 5.9 1.0 7.9 50.1
Grass emperor 0.1 0.5 5.1 1.2 6.8 56.8
Shortfin batfish 0.2 0.2 4.3 0.7 5.8 62.6
Bream * 0.0 0.2 2.9 0.8 3.9 66.5
Forktail catfish * 0.2 0.0 2.7 0.7 3.6 70.1
Blacktip rockcod 0.0 0.2 2.2 0.6 2.9 73.0
D) Locations DI (1) and DO (2)
Golden snapper 1.0 0.5 11.1 1.2 14.8 14.8
Blue tuskfish 0.2 0.7 8.7 1.3 11.6 26.4
Prepared for INPEX Cardno 25

Research Fishing and Fish Health Monitoring Post-dredging Report Season 1 Ichthys Nearshore Environmental Monitoring Program
Species Mean CPUE # (1)
Mean CPUE # (2)
Mean Dissimilarity
Dissimilarity/ SD
% Contribution
Cumulative % Contribution
Stripey snapper 0.3 0.5 7.5 1.1 10.1 36.5
Moses snapper 0.4 0.2 6.7 0.8 8.9 45.4
Javelin * 0.4 0.2 6.0 0.9 8.0 53.4
Grass emperor 0.2 0.4 5.6 1.2 7.5 60.9
Shortfin batfish 0.1 0.1 2.6 0.6 3.5 64.4
Goldspotted rockcod 0.2 0.1 2.3 1.0 3.1 67.5
Bream * 0.1 0.0 2.1 0.6 2.9 70.3
Darwin jawfish 0.1 0.1 2.0 0.6 2.7 73.0
Brown-barred rockcod 0.0 0.1 1.6 0.5 2.1 75.1
E) Locations DO (1) and BH (2)
Golden snapper 0.5 0.7 9.6 1.1 12.8 12.8
Blue tuskfish 0.7 0.2 8.1 1.2 10.8 23.7
Javelin * 0.2 0.6 8.0 1.0 10.7 34.3
Stripey snapper 0.5 0.3 6.6 1.1 8.7 43.1
Grass emperor 0.4 0.3 6.2 1.2 8.2 51.3
Moses snapper 0.2 0.4 5.4 1.0 7.2 58.5
Shortfin batfish 0.1 0.2 3.5 0.7 4.7 63.2
Goldspotted rockcod 0.1 0.2 2.7 0.9 3.5 66.7
Forktail catfish * 0.1 0.2 2.6 0.7 3.5 70.2
Darwin jawfish 0.1 0.1 2.1 0.6 2.9 73.1
Brown-barred rockcod 0.1 0.0 1.6 0.5 2.2 75.3
4.1.1.3 Research Angling Species Diversity The list of all species (or species conglomerates) recorded during P1 RA is presented in Appendix B-1. There was no significant interaction detected with respect to the mean number of ‘all fish species’ and mean number of ‘reef fish species’ recorded per fishing trip between sampling Season (B2, D1, D2, D3, D4 and P1) and Locations (DI, DO and Control location BH) (Table 4-5A and B; Figure 4-4A and B). There were also no significant differences detected among sampling Seasons (Locations combined) or among the three Locations (sampling Seasons combined).
Prepared for INPEX Cardno 26

Research Fishing and Fish Health Monitoring Post-dredging Report Season 1 Ichthys Nearshore Environmental Monitoring Program
Table 4-5 Results of univariate PERMANOVA testing for differences in: mean species diversity of A) all fish and B) reef fish (per fishing trip); and mean CPUE (per hour) for C) all fish and D) reef fish; among RA sampling Seasons (B2 (October 2012, n = 6 fishing trips), D1 (November/December 2012, n = 6), D2 (March 2013, n = 3), D3 (October 2013, n = 6), D4 (March 2014, n = 4), and P1 (October 2014, (n = 4 at DI and DO, n = 3 at BH)) and among Locations (DI, DO and BH) Data Ln(x+1) transformed; statistically significant results (p ≤ 0.05) in bold RED – Redundant p-(perm) due to significant interaction
Source of Variation df MS Pseu-F p-(perm) df MS Pseu-F p-(perm)
A) No. all fish species B) No. reef fish species
Season 5 6.54 0.78 0.56 5 5.27 0.91 0.48 Location 2 4.99 0.60 0.60 2 5.94 1.02 0.36 Season × Location 9 6.80 0.81 0.62 9 9.89 1.70 0.10 Residual 63 8.36 63 5.82 Total 79 79
C) All fish – CPUE D) Reef fish – CPUE
Season 5 0.56 2.23 RED 5 0.79 2.76 RED Location 2 0.17 0.66 RED 2 0.26 0.90 RED Season × Location 9 0.54 2.13 0.04 9 0.72 2.53 0.02 Residual 63 0.25 63 0.29 Total 79 79
Pairwise comparisons (ranked from largest (left) to smallest (right))
Seasons within locations: DI: P1 = D1 = B2 = D3 = D2 = D4 DO: P1 = D3 = D4 = B2 = D1 = D2; P1 > D1; D3 > D2; P1 > D2 BH: D2 = D1 = P1 = D4 = B2 Locations within seasons: B2: DI = DO = BH D1: BH = DI = DO D2: BH = DI = DO D3: DO = DI D4: DO = BH = DI P1: DO = DI = BH
Seasons within locations: DI: P1 = D1 = B2 = D3 = D2 = D4 DO: (P1 = D3 = D4 = B2 = D1) > D2 BH: D1 = D2 = P1 = D4 = B2 Locations within seasons: B2: DI = DO = BH D1: BH = DI = DO D2: BH = DI = DO D3: DO = DI D4: DO = BH = DI P1: DO = DI = BH
Prepared for INPEX Cardno 27
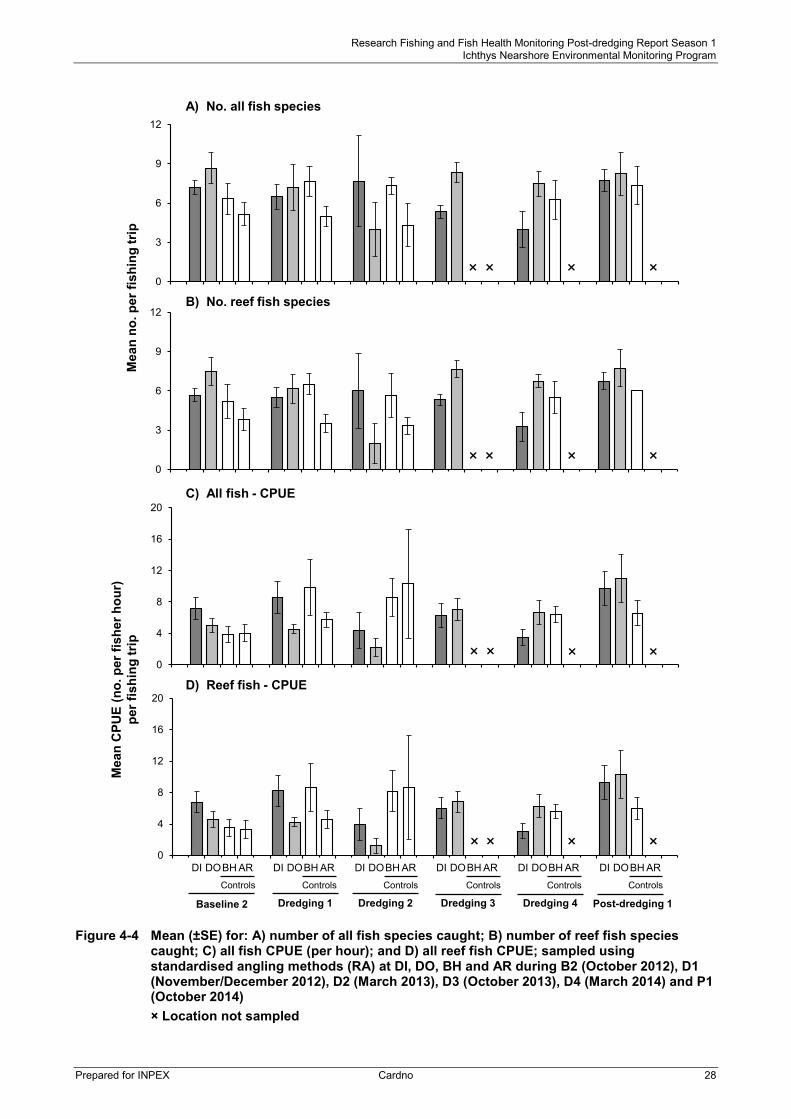
Research Fishing and Fish Health Monitoring Post-dredging Report Season 1 Ichthys Nearshore Environmental Monitoring Program
Figure 4-4 Mean (±SE) for: A) number of all fish species caught; B) number of reef fish species
caught; C) all fish CPUE (per hour); and D) all reef fish CPUE; sampled using standardised angling methods (RA) at DI, DO, BH and AR during B2 (October 2012), D1 (November/December 2012), D2 (March 2013), D3 (October 2013), D4 (March 2014) and P1 (October 2014) × Location not sampled
0
4
8
12
16
20
DI DOBH AR DI DOBH AR DI DOBH AR DI DOBH AR DI DOBH AR DI DOBH AR
0
4
8
12
16
20
0
3
6
9
12
0
3
6
9
12M
ean
CPU
E(n
o. p
er fi
sher
hou
r)
per f
ishi
ng tr
ip
B) No. reef fish species
Mea
n no
. per
fish
ing
trip
A) No. all fish species
C) All fish - CPUE
Controls
Baseline 2
D) Reef fish - CPUE
Dredging 4Dredging 3Dredging 2Dredging 1
× × ×
× × ×
× × ×
×× × ×
×
×
×
Controls Controls Controls Controls Controls
Post-dredging 1
Prepared for INPEX Cardno 28

Research Fishing and Fish Health Monitoring Post-dredging Report Season 1 Ichthys Nearshore Environmental Monitoring Program
4.1.1.4 Research Angling Catch Rates (CPUE) Mean RA catch rates (i.e. mean CPUE = mean number of fish per fisher hour across fishing trips) recorded for DI, DO and BH during P1 are presented for all species (or species conglomerates) in Appendix C-1. Figures displaying trends in mean RA catch rates among locations and among seasons are presented for golden snapper, stripey snapper, blue tuskfish and Moses snapper in Figure 4-5, and for javelin, goldspotted rockcod, grass emperor and forktail catfish in Appendix D-1.
A significant interaction between sampling Season (B2, D1, D2, D3, D4 and P1) and Location (DI, DO and Control location BH) was detected for mean catch rates of ‘all fish’ (individuals of all finfish species combined) and ‘reef fish’ (individuals of all reef fish species combined) (Table 4-5C, D). In the case of ‘all fish’, pairwise comparisons could not detect any significant differences in catch rates at DI and BH among seasons or during each Season among locations (Table 4-5C). In addition, pairwise comparisons could not logically resolve any clear patterns of significant differences in the catch rate of ‘all fish’ at DO among sampling seasons (B2, D1, D2, D3, D4 and P1) (Table 4-5C). These differences provided no indication of an affect due to Project dredging or construction activities. At DO, mean catch rates (±SE) of ‘all fish’ were higher during P1 (11.0 ± 3.1 fish per hour) when compared to B2 (5.0 ± 0.9 fish per hour) and all Dredging Phase sampling seasons (D1: 4.5 ± 0.6, D2: 2.2 ± 1.2, D3: 7.0 ± 1.4 and D4: 6.6 ± 1.5 fish per hour) (Figure 4-4C). For ‘reef fish’, post hoc pairwise comparisons revealed there was a significantly lower mean catch rate at DO during D2 (1.2 ± 1.0 fish per hour) compared with means for all other sampling seasons, which ranged between 4.2 (± 0.7) and 10.4 (± 3.0) fish per hour and were not considered to significantly differ from one another (Table 4-5D, Figure 4-4D).
Significant differences in mean catch rates of golden snapper among locations (sampling seasons combined) and for Moses snapper among sampling seasons (locations combined) were detected (Table 4-6A and D). Pairwise comparisons could not logically resolve the clear pattern of significant differences in the catch rate of golden snapper among locations or for Moses snapper among sampling seasons (Table 4-6A and D). Mean catch rates of golden snapper (sampling seasons combined) were however significantly higher at DI (2.7 ± 0.6 fish per hour) compared to at DO (0.9 ± 0.2). Mean catch rates of Moses snapper during D4 (0 fish per hour) were significantly lower compared to B2 (0.8 ± 0.3), D1 (0.8 ± 0.4), D3 (0.4 ± 0.3) and P1 (1.1 ± 0.3). Similarly, the mean catch rate of Moses snapper was significantly lower during D2 (0.4 ± 0.3) compared to during P1 (1.1 ± 0.3).
A significant interaction between sampling Season and Location was detected for mean catch rates of blue tuskfish (Table 4-6C). Pairwise comparisons revealed that the mean catch rate of blue tuskfish during D3 was significantly higher at DO (1.7 ± 0.5) compared to at DI (0.1 ± 0.1). Although a substantial difference in the catch rate of blue tuskfish was evident between DO and DI as well as BH during P1 (Figure 4-5C), this was not significant. In the case of stripey snapper, there were no significant differences in mean catch rates among sampling seasons (B2, D1, D2, D3, D4 and P1) for any of the three locations analysed (DI, DO and BH) separately, nor for those locations combined (Table 4-6C). Similarly to all previous sampling seasons, mean catch rates for the more frequently caught finfish species during P1 were generally characterised by substantial variability among fishing trips, as indicated by the large SEs (Figure 4-5).
There were no significant differences in mean catch rates of javelin, goldspotted rockcod, grass emperor and forktail catfish among sampling seasons (B2, D1, D2, D3, D4 and P1) for any of the three locations analysed (DI, DO and Control location BH) separately, nor for those locations combined (Appendix D-2). As has been the case for the more frequently caught species presented in Figure 4-5, there has been inherently large variability in daily catches of these four species, along with variability (although not significant) among sampling seasons and among locations (Appendix D-1).
Prepared for INPEX Cardno 29

Research Fishing and Fish Health Monitoring Post-dredging Report Season 1 Ichthys Nearshore Environmental Monitoring Program
Table 4-6 Results of univariate PERMANOVA testing for differences in mean CPUE (per hour) for: A) golden snapper; B) stripey snapper; C) blue tuskfish; and D) Moses snapper; among RA sampling seasons (B2 (October 2012, n = 6 fishing trips), D1 (November/December 2012, n = 6), D2 (March 2013, n = 3), D3 (October 2013, n = 6), D4 (March 2014, n = 4) and P1 (October 2014, n = 4 at DI and DO, n = 3 at BH)) and among locations (DI, DO and BH)
Data Ln(x+1) transformed; statistically significant results (p ≤ 0.05) in bold ( ) Pooled with Residual term for final analysis RED – Redundant p-(perm) due to significant interaction
Source of Variation df MS Pseu-F p-(perm) df MS Pseu-F p-(perm)
A) Golden snapper – CPUE B) Stripey snapper – CPUE
Season 5 0.49 1.09 0.37 5 0.15 0.62 0.69 Location 2 1.66 3.72 0.03 2 0.56 2.37 0.10 Season × Location (9) (0.39) (0.85) (0.57) (9) (0.24) (0.99) (0.46) Residual 72 0.45 72 0.24 Total 79 79
Pairwise comparisons (ranked from largest (left) to smallest (right))
Locations (Seasons combined): DI > DO DI = BH BH = DO
C) Blue tuskfish – CPUE D) Moses snapper – CPUE
Season 5 0.10 0.65 RED 5 0.60 2.82 0.02 Location 2 1.63 10.58
RED 2 0.38 1.80 0.18
Season × Location 9 0.33 2.12 0.04 (9) (0.20) (0.94) (0.49) Residual 63 0.15 72 0.21 Total 79 79
Pairwise comparisons (ranked from largest (left) to smallest (right))
Seasons within Locations: DI: B2 = D4 = D2 = P1 = D1 = D3 DO: P1 = D3 = D1 = B2 = D4 = D2 BH: D2 = D1 = D4 = B2 = P1 Locations within seasons: B2: DO = DI = BH D1: DO = BH = DI D2: BH = DI = DO D3: DO > DI D4: DO = DI = BH P1: DO = DI = BH
Seasons (Locations combined): B2 = D1 B2 = D2 B2 = D3 B2 > D4 P1 = B2 D1 = D2 D1 = D3 D1 > D4 P1 = D1 D2 = D3 D2 = D4 P1 > D2 D3 > D4 P1 = D2 P1 > D4
Prepared for INPEX Cardno 30

Research Fishing and Fish Health Monitoring Post-dredging Report Season 1 Ichthys Nearshore Environmental Monitoring Program
Figure 4-5 Mean (±SE) CPUE (fish per hour) for: A) golden snapper; B) stripey snapper; C) blue
tuskfish; and D) Moses snapper; sampled using standardised angling methods (RA) at DI, DO, BH and AR during B2 (October 2012fishing trips), D1 (November/December 2012), D2 (March 2013), D3 (October 2013), D4 (March 2014) and P1 (October 2014)
× Location not sampled
0
1
2
3
DI DOBH AR DI DOBH AR DI DOBH AR DI DOBH AR DI DOBH AR DI DOBH AR
0
1
2
3
4
5
0
1
2
3
4
0
2
4
6
8
B) Stripey snapper
A) Golden snapper
C) Blue tuskfish
Controls
Baseline 2
D) Moses snapper
Dredging 4Dredging 3Dredging 2Dredging 1
× × ×
× × ×
× × ×
×× × ×
×
×
×
Controls Controls Controls Controls Controls
Post-dredging 1
Mea
n C
PUE
(no.
per
fish
er h
our)
per
fish
ing
trip
Prepared for INPEX Cardno 31

Research Fishing and Fish Health Monitoring Post-dredging Report Season 1 Ichthys Nearshore Environmental Monitoring Program
Research Potting 4.1.2
4.1.2.1 Research Potting P1 Sampling Sites During P1 four RP sites were sampled at DI and DO, while three sites were sampled at BH. GPS positions of these sites are given in Appendix A-2. The spatial distribution of potting sites during P1 was generally similar to that sampled in those locations during B2 and throughout the Dredging Phase (Figure 4-6).
4.1.2.2 Research Potting Catch Composition One hundred and forty six (crabs and finfish combined) were caught during P1 RP (48 in DI, 75 in DO and 23 in BH), with all specimens subjected to visual external assessment for abnormality. To facilitate comparison among sampling seasons and to correct for disparity in replicate RP fishing trips among seasons, the total catches of mud crab, sand crab and finfish (species combined) during each sampling season at each location were converted to averages per fishing trip (i.e. per 20 crab pot deployments; Table 4-7) (refer to Table 2-3).
The average numbers of mud crabs caught per RP fishing trip during P1 at DI (three crabs), DO (five crabs) and BH (two crabs) were around half the numbers recorded for the climatically comparable sampling seasons B2 (October 2012) and D3 (October 2013) (Table 4-7). A similar reduction in the average number of crab catches was recorded at DO and BH between D4 and D2 (during wet season sampling) (Table 4-7).
Average catches of sand crabs per RP fishing trip during P1 (seven in DI, two in DO and three in BH) were generally comparable at each location to that previously recorded during dry sampling seasons (B2, D1 and D3). The average number of sand crabs caught at DI was however higher during P1 than during D3 (Table 4-7). Total RP finfish catches per fishing day at DI during P1 were also generally similar compared with B2 and D3 (Table 4-7). A notable exception to this pattern was an increase in average finfish catches at DO and BH during P1 (DO: 10 and BH: 10) compared to previous Baseline Phase and Dredging Phase sampling seasons (range at DO: 2 to 7, range at BH: 0 to 1) (Table 4-7). No target marine pest crab species (Cardno 2014e) were encountered during P1. Summary data, including numbers of individuals caught by species (or group) and by location for P1 RP, are presented in Appendix B-2.
Table 4-7 Total RP catches (mud crabs / sand crabs / finfish), weighted to average number caught per replicate fishing trip (i.e. per 20 crab pot deployments), for each location sampled during each sampling season (rounded to nearest whole animal)
x = not sampled
Location Sampling season B2
(dry) D1
(dry) D2
(wet) D3
(dry) D4
(wet) P1
(dry) DI 5 / 8 / 2 5 / 6 / 1 4 / 20 / 2 5 / 3 / < 1 3 / 5 / 3 3 / 7 / 2 DO 9 / 2 / 2 6 / 2 / 7 13 / 2 / 5 10 / 2 / 2 4 / 7 / 5 5 / 2 / 10 BH 4 / 5 / < 1 6 / 4 / 1 4 / 6 / 1 x 2 / 1 / 0 2 / 3 / 10 AR 6 / 1 / 7 11 / 0 / 4 7 / 0 / 11 x x x
Prepared for INPEX Cardno 32
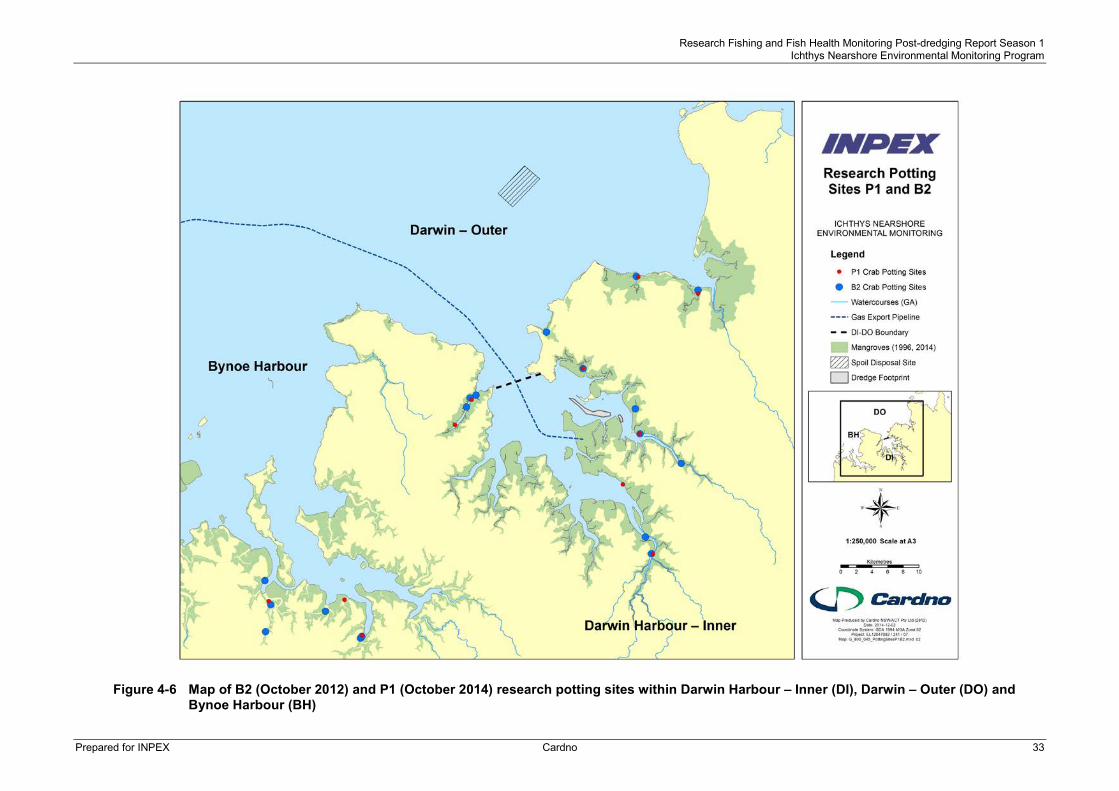
Research Fishing and Fish Health Monitoring Post-dredging Report Season 1 Ichthys Nearshore Environmental Monitoring Program
Figure 4-6 Map of B2 (October 2012) and P1 (October 2014) research potting sites within Darwin Harbour – Inner (DI), Darwin – Outer (DO) and
Bynoe Harbour (BH)
Prepared for INPEX Cardno 33

Research Fishing and Fish Health Monitoring Post-dredging Report Season 1 Ichthys Nearshore Environmental Monitoring Program
4.1.2.3 Research Potting Species Diversity A list of all species (or species conglomerates) recorded during P1 RP is presented in Appendix B-2. There was no significant Season × Location interaction in mean number of species associated with RP catches (Table 4-8A), indicating that the differences in species diversity of RP catches among locations DI, DO and BH have generally been consistent throughout the RFFHMP and that any variations among sampling seasons B2, D1, D2, D3, D4 and P1 were generally consistent for Darwin locations and Control location BH (Figure 4-7A). Significant differences in mean species diversity among sampling seasons (locations combined) and among locations (sampling seasons combined) were detected. Pairwise comparisons indicated that the mean number of species (± SE) was, irrespective of sampling season, significantly lower for BH catches (2.6 ± 0.2 species) than for catches at DI (3.3 ± 0.2) and DO (3.5 ± 0.3), which did not significantly differ from each other (Figure 4-7A, Table 4-8A). Moreover, results of pairwise tests indicated that the mean number of species (± SE) was, irrespective of location, lower during B2 (2.7 ± 0.2) and D3 (2.8 ± 0.2) (dry season) compared to D2 (3.4 ± 0.3) and D4 (3.8 ± 0.4) (wet season) (Figure 4-7A, Table 4-8A).
Prepared for INPEX Cardno 34

Research Fishing and Fish Health Monitoring Post-dredging Report Season 1 Ichthys Nearshore Environmental Monitoring Program
Table 4-8 Results of univariate PERMANOVA testing for differences in mean: A) species diversity (no. of all species in pots per fishing trip), and CPUE (unit effort = pot) for: B) all animals; C) mud crabs; and D) sand crabs (* multiple species), among RA sampling seasons (B2 (October 2012, n = 6 fishing trips), D1 (November/December 2012, n = 6), D2 (March 2013, n = 3), D3 (October 2013, n = 6), D4 (March 2014, n = 4) and P1 (October 2014, n = 4 at DI and DO, n = 3 at BH) and among locations (DI, DO and BH) Data Ln(x+1) transformed; statistically significant results (p ≤ 0.05) in bold ( ) Pooled with Residual term for final analysis
Source of Variation df MS Pseu-F p-(perm) df MS Pseu-F p-(perm)
A) No. all species B) All animals – CPUE
Season 5 3.57 2.71 0.03 5 0.09 2.44 0.04 Location 2 6.89 5.23 <0.01 2 0.53 15.17 <0.01 Season × Location (9) (1.00) (0.73) (0.68) (9) (0.04) (1.18) (0.32) Residual 72 1.32 72 0.03 Total 79 79 Pairwise comparisons (ranked from largest (left) to smallest (right))
Seasons (Locations combined): B2 = D1 B2 ≠ D2 B2 = D3 B2 ≠ D4 B2 = P1 D1 = D2 D3 = D1 D1 = D4 D1 = P1 D3 ≠ D2 D2 = D4 D2 = P1 D3 ≠ D4 D3 = P1 D4 = P1 Locations (seasons combined): (DO = DI) > BH
Seasons (Locations combined): D1 = B2 D2 = B2 B2 = D3 B2 = D4 B2 = P1 D2 = D1 D1 = D3 D1 = D4 D1 = P1 D2 ≠ D3 D2 = D4 D2 = P1 D4 = D3 P1 = D3 D4 = P1 Locations (seasons combined): DO > DI > BH
C) Mud crabs* – CPUE D) Sand crabs* – CPUE
Season 5 0.05 2.87 0.02 5 0.07 2.00 0.09 Location 2 0.15 7.92 <0.01 2 0.26 7.50 <0.01 Season × Location (9) (0.02) (0.96) (0.48) 9 0.06 1.71 0.11 Residual 72 0.02 63 0.03 Total 79 79
Pairwise comparisons (ranked from largest (left) to smallest (right))
Seasons (Locations combined): (D3 = D2 = B2 = D1) > (D4 = P1) Locations (Seasons combined): DO > (DI = BH)
Locations (Seasons combined): DI > (BH = DO)
Prepared for INPEX Cardno 35

Research Fishing and Fish Health Monitoring Post-dredging Report Season 1 Ichthys Nearshore Environmental Monitoring Program
Figure 4-7 Mean (±SE) for: A) number of all species caught; B) all animals CPUE (per pot); C) mud
crab CPUE; and D) sand crab CPUE; sampled using standardised potting methods (RP) at DI, DO, BH and AR during B2 (October 2012fishing trips), D1 (November/December 2012), D2 (March 2013), D3 (October 2013), D4 (March 2014) and P1 (October 2014)
* Multiple species; × Location not sampled
Post-dredging 1
ControlsControlsControlsControls
0.0
0.2
0.4
0.6
0.8
1.0
1.2
DI DOBH AR DI DOBH AR DI DOBH AR DI DOBH AR DI DOBH AR DI DOBH AR
0.0
0.2
0.4
0.6
0.8
1.0
1.2
0.0
0.5
1.0
1.5
2.0
0.0
2.0
4.0
6.0
B) All animals - CPUE
A) No. all species
C) Mud crab * - CPUE
Controls
Baseline 2
D) Sand crab * - CPUE
Dredging 4Dredging 3Dredging 2Dredging 1
× × ×
× × ×
× × ×
×× × ×
×
×
×
Controls
Mea
n C
PUE
(no.
per
pot
) per
fish
ing
trip
Mea
n no
. per
fish
ing
trip
Prepared for INPEX Cardno 36
Research Fishing and Fish Health Monitoring Post-dredging Report Season 1 Ichthys Nearshore Environmental Monitoring Program
4.1.2.4 Research Potting Catch Rates (CPUE) Mean catch rates (i.e. mean CPUE = mean number of individuals per pot across fishing trips) for all species (or species conglomerates) recorded during P1 RP are presented in Appendix C-2. There was no significant Season × Location interaction in mean catch rates of all animals (individuals of all species combined) in RP catches (Table 4-8B), indicating that the differences in catch rates of animals among locations DI, DO and BH have generally been consistent throughout the RFFHMP, and that any variations among sampling seasons B2, D1, D2, D3, D4 and P1 were generally consistent across locations (Figure 4-7B). Significant differences in mean catch rates of all animals among sampling seasons (locations combined) and among locations (sampling seasons combined) were detected. Pairwise comparisons indicated that the mean catch rate (± SE) during D2 (1.0 ± 0.2) was higher than during D3 (0.6 ± 0.3) (irrespective of location), with all the other comparisons among sampling surveys being non-significant (Table 4-8B, Figure 4-7B). Furthermore, pairwise comparisons indicated that the mean catch rate of all animals was, irrespective of sampling season, significantly higher at DO (0.9 ± 0.1 animals) than at DI (0.7 ± 0.1), which was in turn significantly higher than at BH (0.5 ± 0.1) (Table 4-8B, Figure 4-7B).
There was no significant Season × Location interaction in mean catch rate across fishing trips of mud crabs per pot (Table 4-8C). The mean catch rate per pot (± SE) of mud crabs was, however, found to be significantly higher at DO (0.4 ± 0.1) than at DI and BH (both 0.2 ± 0.0) (sampling seasons combined). There were also significant differences among sampling seasons detected with comparable mean catch rates of mud crabs being recorded during B2 (0.3 ± 0.1), D1 (0.3 ± <0.1), D2 (0.4 ± 0.1) and D3 (0.4 ± 0.1) sampling seasons and similarly between D4 (0.2 ± <0.1) and P1 (0.1 ± <0.1) while the catch rates of each sampling seasons within the former group were higher than the later pair (Table 4-8C, Figure 4-7C).
Similarly, there was no significant Season × Location interaction in mean catch rate across fishing trips of sand crabs per pot, although there was a significant difference in mean catch rates of sand crabs detected among locations (sampling seasons combined) (Table 4-8D). Pairwise comparisons determined that mean catch rate of sand crabs was significantly higher at DI (0.4 ± 0.1 crabs) than at BH (0.2 ± 0.0) and DO (0.1 ± 0.0), which did not significantly differ from each other (Table 4-8D, Figure 4-7D).
Supplementary Sampling 4.2Gill nets were deployed at a number of sites within DI, DO and BH during P1 (Appendix A-3), providing samples of barramundi (nine from DI, 14 from DO and five from BH) and queenfish (eight from DI, three from DO and six from BH) for field-based visual assessments and subsequent laboratory examinations. Smaller numbers of specimens across a range of other species were also sampled, including blue threadfin, king threadfin, Oxeye herring and golden snapper (Appendix B-3).
No cast netting or targeted angling using lures or baits was undertaken during P1.
Size-class Frequency 4.3Appendix E contains a summary of size structure statistics (i.e. mean size ± SE and size range) for the Baseline Phase (B1 and B2 combined), Dredging Phase sampling surveys (D1, D2, D3 and D4) and P1 catches by location for the following:
> Main finfish species frequently-caught via RA;
> Main crab species caught via RP; and
> Main species caught in gill nets.
Finfish 4.3.1
4.3.1.1 Golden Snapper
The overall size structure of the golden snapper caught at DI during P1 was similar to that for the Baseline Phase (B1 and B2 sampling seasons combined) (mean fork length (± SE) of 20.8 ± 0.4 cm and 21.0 ± 0.5 cm respectively; Appendix E-1) but significantly different from that for the Dredging Phase sampling seasons (D1, D2, D3 and D4 combined; 22.7 ± 0.3 cm) (Figure 4-8A, Table 4-9, Appendix E-1). In the case of DO, the size structure of the golden snapper catch during P1 was significantly different from that
Prepared for INPEX Cardno 37

Research Fishing and Fish Health Monitoring Post-dredging Report Season 1 Ichthys Nearshore Environmental Monitoring Program
during B1 (p = 0.01), but not during B2 (p = 0.23) and similar to that during the Dredging Phase (p = 0.06) (Table 4-9). The mean size of golden snapper caught at DO during P1 (23.5 ± 1.8 cm) was smaller than that recorded during B1 (29.3 ± 1.0 cm) and during the Dredging Phase (26.4 ± 0.7 cm) and similar to that recorded during B2 (21.0 ± 1.7 cm). At BH, the mean size of golden snapper caught during P1 (28.4 ± 1.3 cm) was larger than that for the Baseline Phase (seasons combined) (22.2 ± 1.3 cm) and Dredging Phase (24.8 ± 0.4 cm) sampling seasons (Figure 4-8A, Appendix E-1). At BH the size structure of golden snapper was significantly different between P1 and B2 (p < 0.01) although similar between P1 and B1 (p = 1.00) as well as between P1 and the Dredging Phase (p = 0.06). The apparent shift in size structure towards larger fish at BH, from earlier sampling seasons, especially evident when comparing Baseline Phase to P1 (Figure 4-8B), should be considered with caution given the small sample sizes involved (i.e. n ≤ 13).
4.3.1.2 Stripey Snapper There were no significant differences in the overall size structure of stripey snapper catches between P1 (means (±SE) of 18.0 ± 0.9 cm (DI), 19.3 ± 0.5 cm (DO) and 18.9 ± 0.0 cm (BH)) and the Baseline Phase (B1 and B2 combined) at DI, DO or BH (DI: 20.5 ± 0.7 cm, DO: 19.3 ± 0.5 cm and BH: 19.5 ± 1.0 cm; Table 4-9, Appendix E-1). At DO, there was however a significant difference (p = 0.01) in the size structure of stripey snapper caught during P1 (19.3 ± 0.5 cm) and during Dredging Phase sampling seasons (20.9 ± 0.3 cm, seasons combined) (Table 4-9, Figure 4-8B). Despite a shift toward slightly smaller sizes classes during P1 compared to during the Dredging Phase at DI and DO, there are no clear temporal patterns of change in size structure of stripey snapper catches from the Baseline Phase to P1 in the Darwin locations (Figure 4-8B).
Prepared for INPEX Cardno 38

Research Fishing and Fish Health Monitoring Post-dredging Report Season 1 Ichthys Nearshore Environmental Monitoring Program
Figure 4-8 Size-class frequency distributions (expressed as proportions of total catch) of A) golden
snapper and B) stripey snapper caught using standardised angling methods (RA) at DI, DO and BH during the Baseline Phase (BP – B1 (August/September 2012) and B2 (October 2012) combined) and Dredging Phase sampling seasons (D1 (November/December 2012), D2 (March 2013), D3 (October 2013), D4 (March 2014)) and Post-dredging Phase P1 (October 2014)
Darwin Harbour – Outer
Bynoe Harbour
Darwin Harbour – Inner
A) Golden snapper B) Stripey snapperP
ropo
rtion
Length to caudal fork (cm)
0
0.25
0.5
0.75
1 BP (n = 80)D1 (n = 114)D2 (n = 20)D3 (n = 101)D4 (n = 18)P1 (n = 86)
0
0.25
0.5
0.75
1 BP (n = 21)D1 (n = 9)D2 (n = 6)D3 (n = 12)D4 (n = 17)P1 (n = 5)
0
0.25
0.5
0.75
1 BP (n = 25)D1 (n = 17)D2 (n = 1)D3 (n = 26)D4 (n = 30)P1 (n = 12)
0
0.25
0.5
0.75
1 BP (n = 21)D1 (n = 11)D2 (n = 9)D3 (n = 33)D4 (n = 11)P1 (n = 43)
0
0.25
0.5
0.75
1
10-14 15-19 20-24 25-29 30-34 35-39
BP (n = 16)D1 (n = 52)D2 (n = 29)Not sampledD4 (n = 61)P1 (n = 13)
0
0.25
0.5
0.75
1
10-14 15-19 20-24 25-29
BP (n = 11)D1 (n = 7)D2 (n = 7)Not sampledD4 (n = 11)P1 (n = 1)
Prepared for INPEX Cardno 39
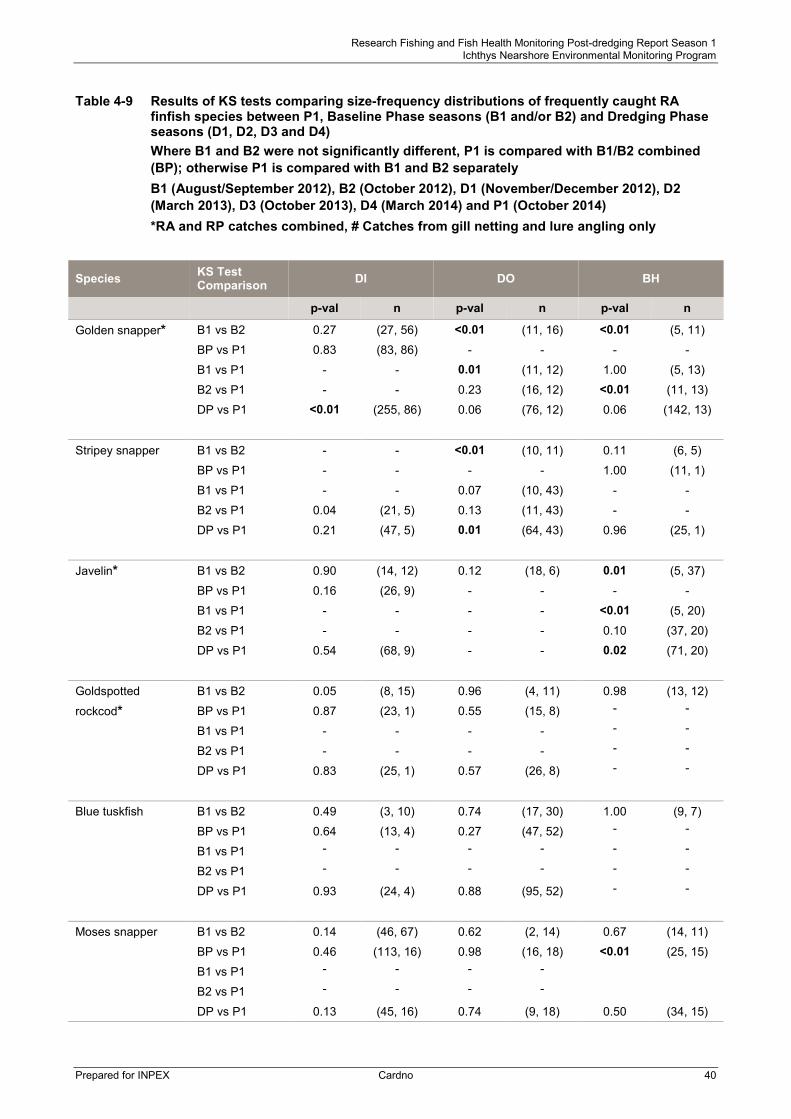
Research Fishing and Fish Health Monitoring Post-dredging Report Season 1 Ichthys Nearshore Environmental Monitoring Program
Table 4-9 Results of KS tests comparing size-frequency distributions of frequently caught RA finfish species between P1, Baseline Phase seasons (B1 and/or B2) and Dredging Phase seasons (D1, D2, D3 and D4) Where B1 and B2 were not significantly different, P1 is compared with B1/B2 combined (BP); otherwise P1 is compared with B1 and B2 separately B1 (August/September 2012), B2 (October 2012), D1 (November/December 2012), D2 (March 2013), D3 (October 2013), D4 (March 2014) and P1 (October 2014) *RA and RP catches combined, # Catches from gill netting and lure angling only
Species KS Test Comparison DI DO BH
p-val n p-val n p-val n
Golden snapper* B1 vs B2 0.27 (27, 56) <0.01 (11, 16) <0.01 (5, 11)
BP vs P1 0.83 (83, 86) - - - -
B1 vs P1 - - 0.01 (11, 12) 1.00 (5, 13)
B2 vs P1 - - 0.23 (16, 12) <0.01 (11, 13)
DP vs P1 <0.01 (255, 86) 0.06 (76, 12) 0.06 (142, 13)
Stripey snapper B1 vs B2 - - <0.01 (10, 11) 0.11 (6, 5)
BP vs P1 - - - - 1.00 (11, 1)
B1 vs P1 - - 0.07 (10, 43) - -
B2 vs P1 0.04 (21, 5) 0.13 (11, 43) - -
DP vs P1 0.21 (47, 5) 0.01 (64, 43) 0.96 (25, 1)
Javelin* B1 vs B2 0.90 (14, 12) 0.12 (18, 6) 0.01 (5, 37)
BP vs P1 0.16 (26, 9) - - - -
B1 vs P1 - - - - <0.01 (5, 20)
B2 vs P1 - - - - 0.10 (37, 20)
DP vs P1 0.54 (68, 9) - - 0.02 (71, 20)
Goldspotted B1 vs B2 0.05 (8, 15) 0.96 (4, 11) 0.98 (13, 12)
rockcod* BP vs P1 0.87 (23, 1) 0.55 (15, 8) - -
B1 vs P1 - - - - - -
B2 vs P1 - - - - - -
DP vs P1 0.83 (25, 1) 0.57 (26, 8) - -
Blue tuskfish B1 vs B2 0.49 (3, 10) 0.74 (17, 30) 1.00 (9, 7)
BP vs P1 0.64 (13, 4) 0.27 (47, 52) - -
B1 vs P1 - - - - - -
B2 vs P1 - - - - - -
DP vs P1 0.93 (24, 4) 0.88 (95, 52) - -
Moses snapper B1 vs B2 0.14 (46, 67) 0.62 (2, 14) 0.67 (14, 11)
BP vs P1 0.46 (113, 16) 0.98 (16, 18) <0.01 (25, 15)
B1 vs P1 - - - -
B2 vs P1 - - - -
DP vs P1 0.13 (45, 16) 0.74 (9, 18) 0.50 (34, 15)
Prepared for INPEX Cardno 40

Research Fishing and Fish Health Monitoring Post-dredging Report Season 1 Ichthys Nearshore Environmental Monitoring Program
Species KS Test Comparison DI DO BH
p-val n p-val n p-val n
Grass emperor B1 vs B2 0.35 (4, 10) 0.01 (8, 10) 0.17 (19, 13)
BP vs P1 0.89 (14, 9) 0.35 (32, 3)
B1 vs P1 0.03 (8, 20)
B2 vs P1 0.39 (10, 20)
DP vs P1 0.21 (27, 9) 0.90 (61, 20) <0.05 (29, 3)
Barramundi # B1 vs B2 0.61 (3, 7) - - - -
BP vs P1 0.02 (10, 9) - - - -
B1 vs P1 - - - - - -
B2 vs P1 - - 0.16 (8, 14) 0.08 (5, 5)
DP vs P1 <0.05 (46, 9) 0.20 (52, 14) 0.02 (11, 5)
4.3.1.3 Javelin At DI, there was no significant difference in the overall size structure of javelin catches between P1 and both the Baseline (p = 0.16) and Dredging Phases (p = 0.54) sampling seasons (Table 4-9, Figure 4-9A). It should be noted, however, that only nine javelin were caught during P1 so these results should be considered with caution. In BH, no significant difference in the size structure of javelin was detected between P1 and B2 (p = 0.10) (Table 4-9). The size structure of javelin at BH during P1 (mean 26.0 ± 2.4 cm) was, however, significantly different from that during B1 (p <0.01, mean 27.2 ± 1.3 cm cm) and the Dredging Phase (p = 0.02, mean19.3 ± 0.5 cm) (Table 4-9, Figure 4-9A). No javelin were caught at DO during P1, therefore no size class comparison with previous sampling seasons was possible (Table 4-9, Figure 4-9A).
4.3.1.4 Goldspotted Rockcod In the cases of both DI and DO, there was no significant difference in the overall size structure of goldspotted rockcod catches between P1 and the Baseline or Dredging Phase sampling seasons (Table 4-9, Figure 4-9B). Goldspotted rockcod sample sizes during P1 were very small (n = 1 for DI and n = 8 for DO) indicating these results should be considered with caution. No goldspotted rockcod were caught at BH during P1. At DO, the mean goldspotted rockcod size during P1 (29.5 ± 1.6 cm) was slightly larger than that recorded during the Baseline Phase (27.7 ± 1.7 cm) and Dredging Phase (28.6 ± 1.0 cm) sampling seasons (Appendix E-1).
4.3.1.5 Blue Tuskfish There was no significant difference in the overall size structure of blue tuskfish caught at DI and DO during P1 and the Baseline Phase (p = 0.64 and p = 0.27 respectively) (Table 4-9, Figure 4-10A). Similarly, the size structure of blue tuskfish caught at DI and DO during P1 did not significantly differ to that sampled during the Dredging Phase (seasons combined, p = 0.93 and p = 0.88 respectively). In addition, the mean size of blue tuskfish sampled at DI during P1 (20.0 ± 1.2 cm) was similar to that sampled during the Baseline Phase (21.9 ± 1.1 cm) and Dredging Phase (20.5 ± 0.8 cm) sampling seasons. Furthermore the mean size of blue tuskfish sampled at DO during P1 (21.0 ± 0.3 cm) was similar to that sampled during the Baseline Phase (21.9 ± 0.5 cm) and Dredging Phase (21.1 ± 0.3 cm) sampling seasons. No blue tuskfish were caught at BH during P1 (Figure 4-10A). During P1 and throughout the RFFHMP, few blue tuskfish smaller than 15 cm and larger than 24 cm have been sampled at any location (Figure 4-10A).
4.3.1.6 Moses Snapper In the cases of both DI and DO, there was no significant difference in the overall size structure of Moses snapper catches between P1 and the Baseline or Dredging Phase sampling seasons (Table 4-9, Figure 4-10B). There were, however, significant differences (p <0.01) in the size structure of Moses snapper sampled
Prepared for INPEX Cardno 41

Research Fishing and Fish Health Monitoring Post-dredging Report Season 1 Ichthys Nearshore Environmental Monitoring Program
at BH between P1 (mean (±SE) of 18.1 ± 0.4 cm) and the Baseline Phase (15.8 ± 0.4) (Table 4-9). Throughout the RFFHMP, Moses snapper sampled have been generally small (i.e. < 25 cm) with a higher proportion of larger individuals consistently sampled at DO compared to DI and BH.
Figure 4-9 Size-class frequency distributions (expressed as proportions of total catch of A) javelin
and B) goldspotted rockcod caught using standardised sampling methods (RA and RP) at DI, DO and BH during the Baseline Phase (BP – B1 (August/September 2012) and B2 (October 2012) combined) and Dredging Phase sampling seasons (D1 (November/December 2012), D2 (March 2013), D3 (October 2013), D4 (March 2014)) and Post-dredging Phase P1 (October 2014)
Darwin Harbour – Outer
Bynoe Harbour
Darwin Harbour – Inner
A) Javelin* B) Goldspotted rockcod
Pro
porti
on
Length to caudal fork (cm)
0
0.25
0.5
0.75
1 BP (n = 23)D1 (n = 12)D2 (n = 2)D3 (n = 9)D4 (n = 2)P1 (n = 1)
0
0.25
0.5
0.75
1 BP (n = 26)D1 (n = 33)D2 (n = 10)D3 (n = 19)D4 (n = 5)P1 (n = 9)
0
0.25
0.5
0.75
1 BP (n = 15)D1 (n = 7)D2 (n = 5)D3 (n = 8)D4 (n = 6)P1 (n = 8)
0
0.25
0.5
0.75
1 BP (n = 24)D1 (n = 14)D2 (n = 0)D3 (n = 0)D4 (n = 18)P1 (n = 0)
0
0.25
0.5
0.75
10-14 15-19 20-24 25-29 30-34 35-39
BP (n = 37)D1 (n = 47)D2 (n = 11)Not sampledD4 (n = 6)P1 (n = 17)
0
0.25
0.5
0.75
10-14 15-19 20-24 25-29 30-34 35-39 40-44
BP (n = 25)D1 (n = 10)D2 (n = 3)Not sampledD4 (n = 6)P1 (n = 0)
Prepared for INPEX Cardno 42

Research Fishing and Fish Health Monitoring Post-dredging Report Season 1 Ichthys Nearshore Environmental Monitoring Program
Figure 4-10 Size-class frequency distributions (expressed as proportions of total catch of A) blue
tuskfish and B) Moses snapper caught using standardised sampling methods (RA and RP) at DI, DO and BH during the Baseline Phase (BP – B1 (August/September 2012) and B2 (October 2012) combined) and Dredging Phase sampling seasons (D1 (November/ December 2012), D2 (March 2013), D3 (October 2013), D4 (March 2014)) and Post-dredging Phase P1 (October 2014)
Darwin Harbour – Outer
Bynoe Harbour
Darwin Harbour – InnerA) Blue tuskfish B) Moses snapper
Pro
porti
on
Length to caudal fork (cm)
0
0.25
0.5
0.75
1 BP (n = 13)D1 (n = 5)D2 (n = 6)D3 (n = 3)D4 (n = 10)P1 (n = 4)
0
0.25
0.5
0.75
1 BP (n = 101)D1 (n = 19)D2 (n = 1)D3 (n = 17)D4 (n = 0)P1 (n = 16)
0
0.25
0.5
0.75 BP (n = 46)D1 (n = 33)D2 (n = 0)D3 (n = 51)D4 (n = 11)P1 (n = 52)
0
0.25
0.5
0.75 BP (n = 15)D1 (n = 6)D2 (n = 0)D3 (n = 2)D4 (n = 0)P1 (n = 14)
0
0.25
0.5
0.75
1
10-14 15-19 20-24
BP (n = 19)D1 (n = 24)D2 (n = 5)Not sampledD4 (n = 0)P1 (n = 14)
0
0.25
0.5
0.75
1
10-14 15-19 20-24 25-29 30-34
BP (n = 16)D1 (n = 9)D2 (n = 3)Not sampledD4 (n = 4)P1 (n = 0)
Prepared for INPEX Cardno 43

Research Fishing and Fish Health Monitoring Post-dredging Report Season 1 Ichthys Nearshore Environmental Monitoring Program
4.3.1.7 Barramundi The size structure of barramundi sampled using gill nets at DI during P1 was significantly different (p = 0.02) from the one sampled during the Baseline Phase (Table 4-9). Specifically, this difference was the consequence of fewer small barramundi fish being caught during P1 compared to during the Baseline Phase (Baseline Phase range: 33 cm to 63 cm, P1 range: 55 cm to 65 cm) (Appendix E-2). There was also a significant difference in the size class distribution of barramundi sampled at DI during P1 (mean 58.5 ± 1.2 cm) and the Dredging Phase (seasons combined, mean 56.3 ± 1.1 cm) (Table 4-9, Appendix E-2). In the case of DO and BH there were no significant differences in the size class distribution of barramundi caught during P1 and B2. In addition, the size class distribution of barramundi caught at DO during P1 was not significantly different to that sampled during the Dredging Phase sampling seasons (Table 4-9). In contrast, at BH the size class distribution of barramundi sampled during P1 (mean 62.4 ± 4.4 cm, range: 47 to 74 cm) was significantly different (p = 0.02) from the Dredging Phase sampling seasons (seasons combined) (mean 50.1 ± 1.6 cm, range: 40 to 55 cm) (Table 4-9).
The size range of barramundi sampled during P1 among locations (42 cm to 74 cm) was relatively narrow in comparison to that sampled during the Baseline Phase (33 cm to 99 cm). The mean LCF during P1 (56.1 ± 1.4 cm) was, nonetheless, very similar to the mean LCF recorded during the Baseline Phase (56.2 ± 2.8 cm) (Figure 4-11, Appendix E-2). All of the relatively large barramundi (i.e. > 75 cm LCF) sampled during previous sampling seasons came from AR and certain gill netting sites at DO which were not sampled during P1 or during recently completed Dredging Phase sampling seasons (D3 and D4). Overall, the size-class frequency distribution of barramundi catches (all locations combined) sampled during P1 was generally very similar to that recorded during Baseline Phase and Dredging Phase sampling seasons (Figure 4-11).
4.3.1.8 Other Species The size structure of grass emperor sampled at DI and BH during P1 was similar to that sampled during the Baseline Phase (Table 4-9). Similarly, no difference in the size structure of grass emperor at DI was detected between samples collected during P1 and the Dredging Phase. Moreover, no significant differences in the size structure of grass emperor sampled at DO during P1 and B2 or the Dredging Phase were detected (Table 4-9). In contrast, at DO a significant difference (p = <0.05) in the size structure of grass emperor sampled during B1 (mean 19.9 ± 0.7 cm) and individuals sampled during P1 (23.4 ± 1.0 cm) was detected (Table 4-9, Appendix E-1). A significant difference in the size structure of grass emperor at BH during P1 and the Dredging Phase was detected although due to the small number of individuals sampled during P1 (three) this result should be treated with caution (Table 4-9).
The mean size (± SE) of queenfish caught during P1 were broadly similar among locations (DI: 51.4 ± 6.0 cm; DO: 46.1 ± 9.8 cm; and BH: 40.7 ± 2.6 cm) and are generally similar to the corresponding mean sizes recorded during the Baseline Phase and Dredging Phase sampling seasons (Appendix E-1).
The three king threadfin sampled during P1 (all from DO) ranged in size between 41 cm and 44 cm LCF and were generally smaller than individuals caught during the Baseline Phase and Dredging Phase sampling seasons (Appendix E-2).
No black jewfish were caught during P1 at any location (Appendix E-1). Black jewfish have been sampled infrequently throughout the RFFHMP with a total of 20 individuals sampled to date.
Prepared for INPEX Cardno 44
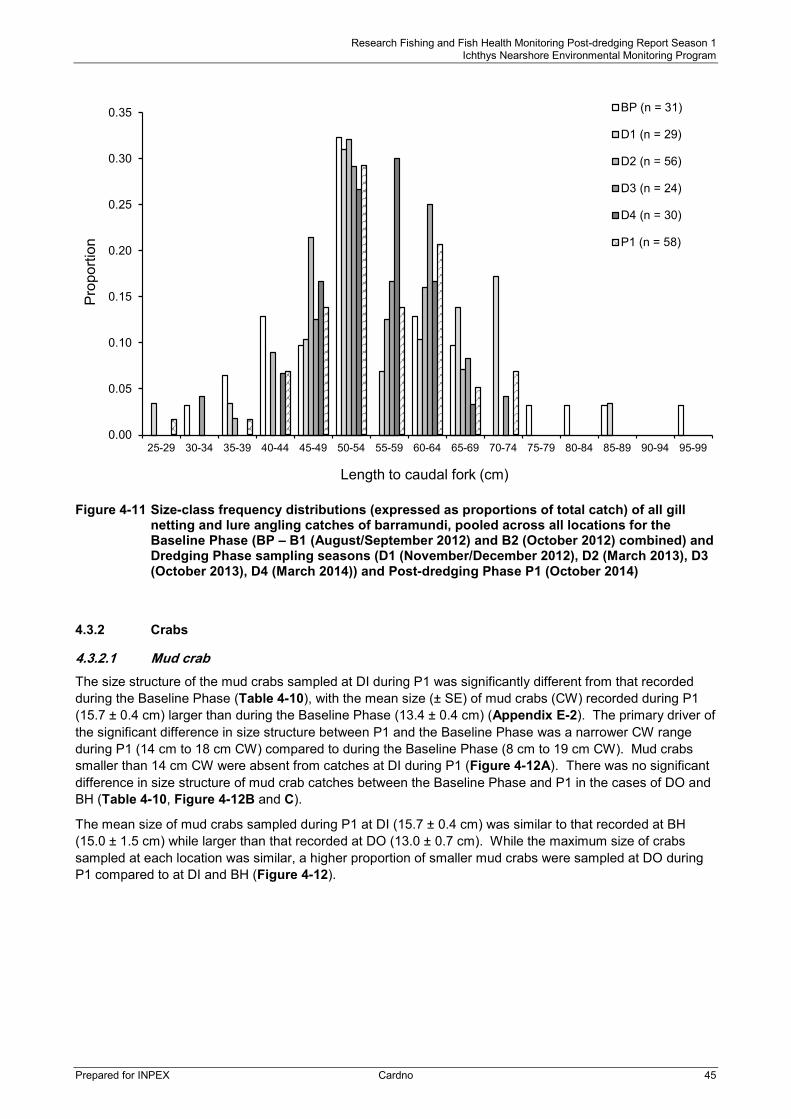
Research Fishing and Fish Health Monitoring Post-dredging Report Season 1 Ichthys Nearshore Environmental Monitoring Program
Figure 4-11 Size-class frequency distributions (expressed as proportions of total catch) of all gill
netting and lure angling catches of barramundi, pooled across all locations for the Baseline Phase (BP – B1 (August/September 2012) and B2 (October 2012) combined) and Dredging Phase sampling seasons (D1 (November/December 2012), D2 (March 2013), D3 (October 2013), D4 (March 2014)) and Post-dredging Phase P1 (October 2014)
Crabs 4.3.2
4.3.2.1 Mud crab The size structure of the mud crabs sampled at DI during P1 was significantly different from that recorded during the Baseline Phase (Table 4-10), with the mean size (± SE) of mud crabs (CW) recorded during P1 (15.7 ± 0.4 cm) larger than during the Baseline Phase (13.4 ± 0.4 cm) (Appendix E-2). The primary driver of the significant difference in size structure between P1 and the Baseline Phase was a narrower CW range during P1 (14 cm to 18 cm CW) compared to during the Baseline Phase (8 cm to 19 cm CW). Mud crabs smaller than 14 cm CW were absent from catches at DI during P1 (Figure 4-12A). There was no significant difference in size structure of mud crab catches between the Baseline Phase and P1 in the cases of DO and BH (Table 4-10, Figure 4-12B and C).
The mean size of mud crabs sampled during P1 at DI (15.7 ± 0.4 cm) was similar to that recorded at BH (15.0 ± 1.5 cm) while larger than that recorded at DO (13.0 ± 0.7 cm). While the maximum size of crabs sampled at each location was similar, a higher proportion of smaller mud crabs were sampled at DO during P1 compared to at DI and BH (Figure 4-12).
Length to caudal fork (cm)
Pro
porti
on
0.00
0.05
0.10
0.15
0.20
0.25
0.30
0.35
25-29 30-34 35-39 40-44 45-49 50-54 55-59 60-64 65-69 70-74 75-79 80-84 85-89 90-94 95-99
BP (n = 31)
D1 (n = 29)
D2 (n = 56)
D3 (n = 24)
D4 (n = 30)
P1 (n = 58)
Prepared for INPEX Cardno 45

Research Fishing and Fish Health Monitoring Post-dredging Report Season 1 Ichthys Nearshore Environmental Monitoring Program
Table 4-10 Results of KS tests comparing size-frequency distributions of RP-sampled crabs between P1, Baseline Phase seasons (B1 and/or B2) and Dredging Phase seasons (D1, D2, D3 and D4) Where B1 and B2 were not significantly different, P1 is compared with B1/B2 combined (BP); otherwise P1 is compared with B1 and B2 separately B1 (August/September 2012), B2 (October 2012), D1 (November/December 2012), D2 (March 2013), D3 (October 2013), D4 (March 2014) and P1 (October 2014) * Multiple species
Species KS Test Comparison DI DO BH
p-val n p-val n p-val n
Mud crab* B1 vs B2 0.91 (20, 29) <0.01 (84, 56) 0.55 (32, 25)
BP vs P1 0.02 (49, 9) - - 0.94 (57, 6)
B1 vs P1 - - 0.99 (84, 17) - -
B2 vs P1 - - 0.15 (56, 17) - -
DP vs P1 0.15 (83, 9) 0.17 (151, 17) 1.00 (56, 6)
Sand crab* B1 vs B2 <0.01 (42, 46) 0.81 (11, 11) 0.76 (7, 30)
BP vs P1 - - 0.66 (22, 7) 0.96 (37, 8)
B1 vs P1 0.11 (42, 27) - - - -
B2 vs P1 0.37 (46, 27) - - - -
DP vs P1 0.83 (130, 27) 0.92 (63, 7) 0.64 (41, 8)
4.3.2.1.2 Mud crab sex ratio
During P1, mud crab catches at DI were dominated by females with an overall male to female sex ratio of 1:2 (Figure 4-13). The sex ratios of mud crabs sampled during P1 at DO (1:1.1) and BH (1:1.3) were however closer to parity. The sex ratio recorded at each location during P1 was similar to those observed during climatically comparable ‘dry season’ sampling seasons B2, D1 and D3 (Figure 4-13). During ‘wet season’ sampling seasons (i.e. D2 and D4) mud crab catches have been dominated by male crabs with few females sampled. Despite clear seasonality in the sex ratio of mud crab catches, small-scale temporal and spatial variability in the recorded sex ratio of catches is evident (Figure 4-13).
4.3.2.2 Sand crab The size range and mean size (± SE) (CW) of sand crabs caught during P1 at DI (range: 11 cm to 15 cm, mean: 13.2 ± 0.2 cm) was similar to that caught at DO (range: 12 cm to 14 cm, mean: 12.8 ± 0.3 cm) and BH (range: 9 cm to 15 cm, mean: 13.2 ± 0.7 cm) (Figure 4-12B, Appendix E-2). At each of the three locations, there were no significant differences in the size structure of sand crab catches between P1 and the Baseline Phase or the Dredging Phase sampling seasons (Table 4-10). The size-class frequency distribution of sand crab catches was generally similar among locations DI, DO and BH and from the Baseline Phase and through Dredging Phase sampling seasons (Figure 4-12B).
Seven of the 42 sand crabs sampled during P1 (locations combined) were female. Throughout the RFFHMP males have dominated catches of sand crab at each of the sample locations with the resulting male to female sex ratio ranging between 1:0.03 and 1:0.2. No seasonal changes in the sex ratio of sand crabs have been recorded within Darwin Harbour or surrounding waters.
Prepared for INPEX Cardno 46
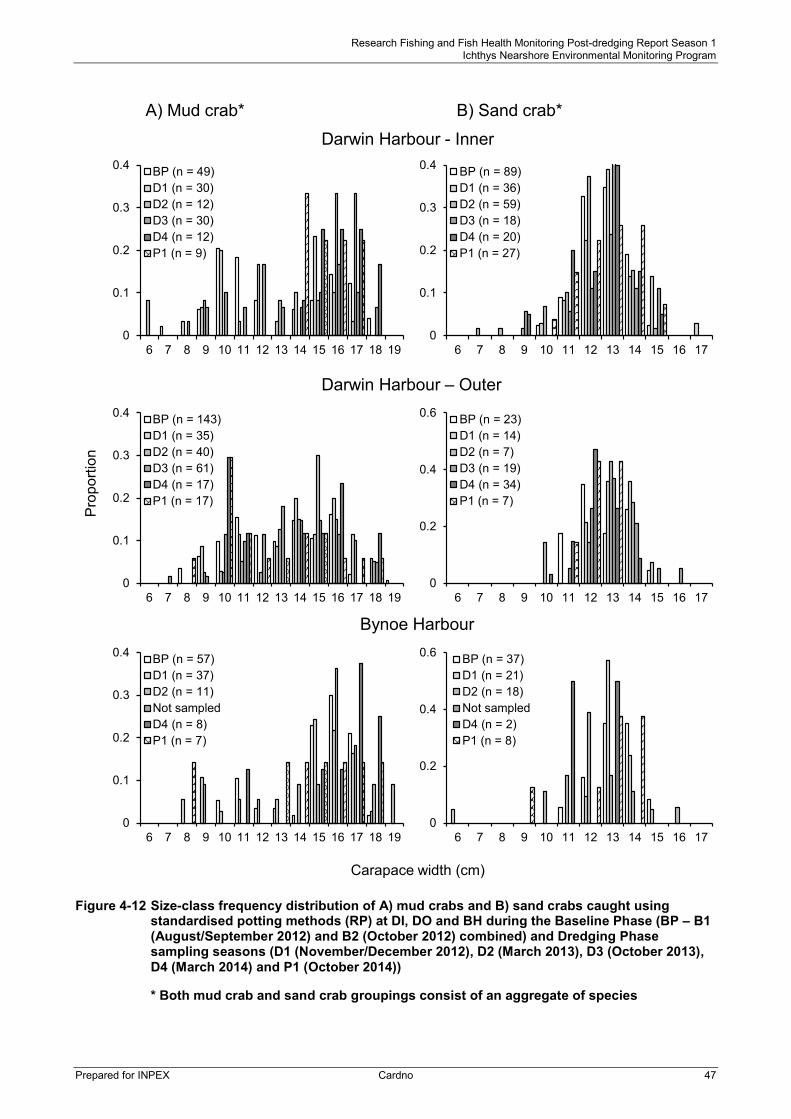
Research Fishing and Fish Health Monitoring Post-dredging Report Season 1 Ichthys Nearshore Environmental Monitoring Program
Figure 4-12 Size-class frequency distribution of A) mud crabs and B) sand crabs caught using
standardised potting methods (RP) at DI, DO and BH during the Baseline Phase (BP – B1 (August/September 2012) and B2 (October 2012) combined) and Dredging Phase sampling seasons (D1 (November/December 2012), D2 (March 2013), D3 (October 2013), D4 (March 2014) and P1 (October 2014))
* Both mud crab and sand crab groupings consist of an aggregate of species
Darwin Harbour – Outer
Bynoe Harbour
Darwin Harbour - Inner
A) Mud crab* B) Sand crab*P
ropo
rtion
Carapace width (cm)
0
0.1
0.2
0.3
0.4
6 7 8 9 10 11 12 13 14 15 16 17 18 19
BP (n = 49)D1 (n = 30)D2 (n = 12)D3 (n = 30)D4 (n = 12)P1 (n = 9)
0
0.1
0.2
0.3
0.4
6 7 8 9 10 11 12 13 14 15 16 17
BP (n = 89)D1 (n = 36)D2 (n = 59)D3 (n = 18)D4 (n = 20)P1 (n = 27)
0
0.1
0.2
0.3
0.4
6 7 8 9 10 11 12 13 14 15 16 17 18 19
BP (n = 143)D1 (n = 35)D2 (n = 40)D3 (n = 61)D4 (n = 17)P1 (n = 17)
0
0.2
0.4
0.6
6 7 8 9 10 11 12 13 14 15 16 17
BP (n = 23)D1 (n = 14)D2 (n = 7)D3 (n = 19)D4 (n = 34)P1 (n = 7)
0
0.1
0.2
0.3
0.4
6 7 8 9 10 11 12 13 14 15 16 17 18 19
BP (n = 57)D1 (n = 37)D2 (n = 11)Not sampledD4 (n = 8)P1 (n = 7)
0
0.2
0.4
0.6
6 7 8 9 10 11 12 13 14 15 16 17
BP (n = 37)D1 (n = 21)D2 (n = 18)Not sampledD4 (n = 2)P1 (n = 8)
Prepared for INPEX Cardno 47
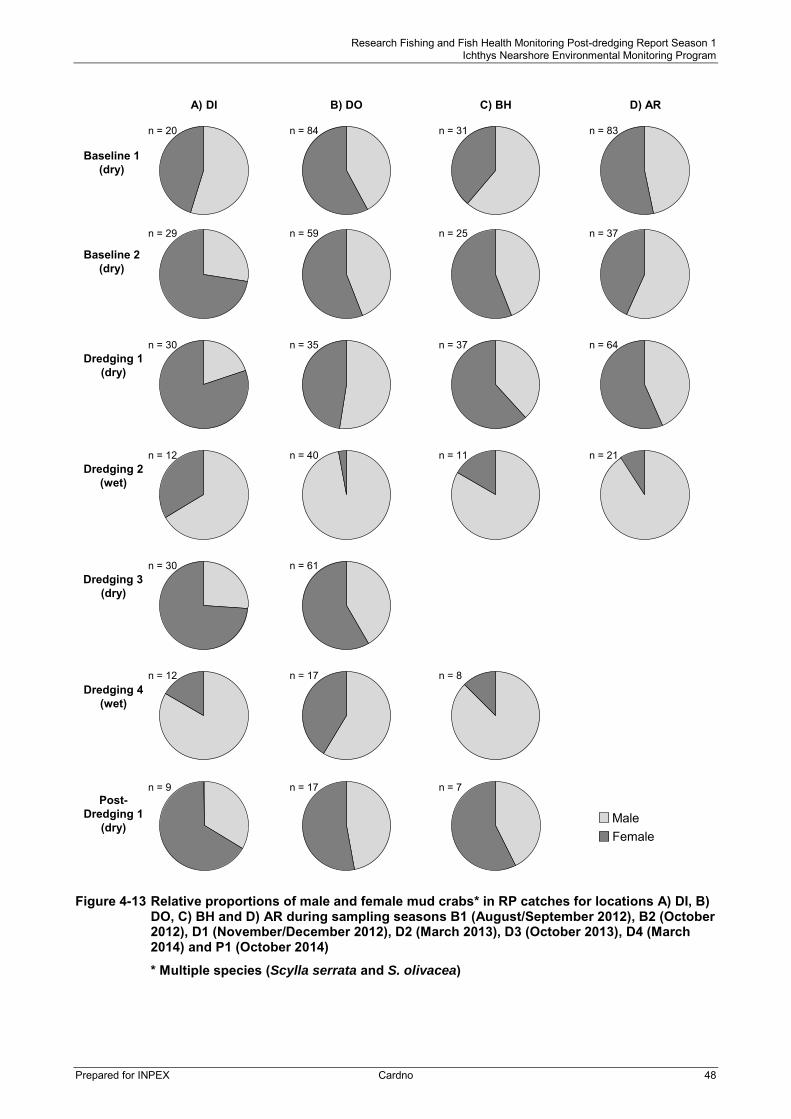
Research Fishing and Fish Health Monitoring Post-dredging Report Season 1 Ichthys Nearshore Environmental Monitoring Program
Figure 4-13 Relative proportions of male and female mud crabs* in RP catches for locations A) DI, B)
DO, C) BH and D) AR during sampling seasons B1 (August/September 2012), B2 (October 2012), D1 (November/December 2012), D2 (March 2013), D3 (October 2013), D4 (March 2014) and P1 (October 2014)
* Multiple species (Scylla serrata and S. olivacea)
Baseline 1(dry)
Baseline 2(dry)
Dredging 1(dry)
Dredging 2(wet)
Dredging 3(dry)
Dredging 4(wet)
Post-Dredging 1
(dry)
n = 20 n = 84 n = 31 n = 83
n = 29
n = 30
n = 12
n = 30
n = 12
n = 9
n = 59
n = 35
n = 40
n = 61
n = 17
n = 17
n = 25
n = 37
n = 11
n = 8
n = 7
n = 37
n = 64
n = 21
A) DI B) DO C) BH D) AR
MaleFemale
Prepared for INPEX Cardno 48

Research Fishing and Fish Health Monitoring Post-dredging Report Season 1 Ichthys Nearshore Environmental Monitoring Program
Fish and Crab Health 4.4Tables summarising the numbers of individuals sampled at each location during P1 subjected to a field-based external health assessment and/or a detailed laboratory examination, by species (or group) and by sampling method, are presented in Appendix B. As part of the RFFHMP a diverse suite of parasites, diseases and lesions have been recorded (Appendix F). Sampling during the Baseline Phase, Dredging Phase and P1 has resulted in 292 host parasite records from a variety of finfish and crab species being compiled. From this inventory, 11 finfish parasites have been formally identified and described and an additional 90 parasites or lesions are likely to be new to the scientific community (Appendix F).
Field-based External Assessments 4.4.1
Ten (1.8%) of the 560 finfish subjected to a field-based external health assessment (across all methods and sampling locations) during P1 were judged to be ‘abnormal’ (Table 4-11). These ten finfish comprised seven species: blackspot tuskfish, blacktip rockcod, blue tuskfish, golden snapper, goldspotted rockcod and tea leaf trevally. During P1 the proportion of field-identified abnormal finfish in catches (species combined) was slightly higher in DO (2.7%) than at BH (1.9%) while few abnormalities were reported at DI (0.5%). At DI and DO these proportions were similar to those reported during the Baseline Phase (DI: 1.4% and DO: 1.8%) as well as during D1 (DI: 0% and DO: 3.0%) while lower than those reported at these locations during other Dredging Phase sampling seasons (DI: 2.7% to 7.5% and DO: 4.1% to 6.1%). The proportion of field-identified abnormal finfish at BH during P1 (1.9%) was similar to that recorded during the Baseline Phase (2.0%), D1 (1.2%) and D4 (2.2%) although lower than during D2 (4.3%) (Table 4-11). One redfish (Lutjanus spp.) was the only fish sampled from DI during P1 that was assessed to be abnormal. During field examination this fish was recorded to have a cut operculum (hard bony flap covering and protecting the gills) which was subsequently (during laboratory examination) attributed to a previous trauma injury rather than symptoms associated with systemic health concerns. Histological examination of the tissue surrounding the trauma site indicated that the healing process had commenced. The types of finfish abnormalities observed in the field during P1 were generally consistent with those recorded during the Baseline Phase and Dredging Phase sampling seasons and included the presence of external isopods, fin damage, and philometrid nematodes within pectoral fins (Appendices F and G-1).
Twenty (20.2%) of the 99 crabs (all crab species combined) subjected to field-based external health assessment during P1 were judged to be ‘abnormal’ (Table 4-11). The proportion of crabs identified in the field as abnormal during P1 was higher for DO (35.3%) compared with DI (14.3%) and BH (8.7%). At DO, the proportion of abnormal individuals was higher during P1 than Baseline Phase (17.0%) and Dredging Phase (12.2% to 25.9%) sampling seasons. In contrast, the proportion of abnormal crabs at BH during P1 was lower than all previous sampling seasons (14.1% to 23.8%) (Table 4-11). At DI during P1 the proportion of abnormal crabs (14.3%) was similar to that reported during D2 (11.1%) and D4 (13.5%) although lower than during the Baseline Phase (20.5%), D1 (21.9%) and D3 (33.9%).
At DI the proportion of abnormal mud crabs during P1 (44.4%) was similar to that reported during the Baseline Phase (40.8%), D1 (40.0%) and D2 (41.7%) although lower and higher than D3 (59.7%) and D4 (16.7%) respectively (Table 4-11). The proportion of mud crabs identified in the field as abnormal during P1 was higher for DO (70.6%) compared with DI (44.4%) and BH (14.3%). The proportion of abnormal mud crabs sampled at DO during P1 (70.6%) was substantially higher than during the Baseline Phase (19.6%) and Dredging Phase sampling seasons (28.6% to 41.2%). In contrast, fewer mud crabs at BH (14.3%) were classified as abnormal during P1 compared to all previous sampling seasons (24.6% to 50.0%) (Table 4-11).
The proportion of field-identified ‘abnormal’ crabs in sand crab catches during P1 at DI (7.1%) and DO (0%) was lower than that recorded during the Baseline Phase (DI: 11.2% and DO:13.0%). The proportion of abnormalities recorded at DI and DO during P1 were also generally lower than recorded during the Dredging Phase at each location (Table 4-11). In contrast, at BH the proportion of abnormal sand crabs in catches was higher during P1 (12.5%) than previous sampling seasons (0% to 11.1%). The visually apparent signs of abnormality observed on mud crabs and sand crabs during P1 such as rust spot, classic shell disease and the presence of the parasitic barnacle Loxothylacus/Sacculina were similar to those previously reported as part of RFFHMP (Appendices F and G-2).
Prepared for INPEX Cardno 49

Research Fishing and Fish Health Monitoring Post-dredging Report Season 1 Ichthys Nearshore Environmental Monitoring Program
Table 4-11 Percentage (%) of sampled individuals at DI, DO and BH during P1 and at each of the locations sampled during the Baseline Phase (BP; August/September2012 and October 2012), D1 (November/December 2012), D2 (March 2013), D3 (October 2013) and D4 (March 2014) sampling seasons exhibiting clearly visible signs of abnormality as determined by field-based external assessments (see Section 2.4.2) Data are presented for species for which at least one ‘abnormal’ individual was recorded during the RFFHMP (n = sampled individuals, in parentheses); * Multiple species; x Location not sampled
Location Darwin Harbour – Inner Darwin – Outer Bynoe Harbour Adelaide River
Season BP D1 D2 D3 D4 P1 BP D1 D2 D3 D4 P1 BP D1 D2 D3 D4 P1 BP D1 D2 D3 D4 P1
Areolate rockcod 0% (2) - - - - - - 0%
(1) - - - 0% (1)
100% (1) - - x - - - - x x x
Barramundi 10.0% (10)
0% (7)
6.7% (15)
0% (9)
5.6% (18)
0% (9)
0% (10)
0% (6)
15.8% (19)
6.7% (15)
8.3% (12)
0% (14)
0% (5)
0% (6)
0% (5) x - 0%
(5) 0% (8)
0% (13)
23.5% (17) x x x
Black jewfish 0% (2)
0% (7) - - - - - - - - 0%
(1) - - - - x - - - 0% (9)
100% (1) x x x
Blackspot tuskfish - - - - - - - 0% (1) - 33.3%
(3) - 50.0% (2) - 0%
(2) - x - - - 0% (1) - x x x
Blacktip reef shark 0% (2)
0% (2) - - 0%
(1) - 0% (2)
0% (2)
100% (1) - - - - - - x - - - - - x x x
Blue threadfin 9.1% (11) - - - - - 0%
(5) 0% (1)
0% (3) - - - 100%
(1) 0% (2)
0% (7) x - 0%
(4) 0% (2)
0% (1) - x x x
Blue tuskfish 0% (15)
0% (5)
16.7% (6)
33.3% (3)
20.0% (10)
0% (4)
0% (48)
6.1% (33) - 7.7%
(52) 27.3% (11)
3.8% (52)
0% (16)
11.1% (9)
20.0% (5) x 0%
(4) - 0% (18)
4.8% (21) - x x x
Bream * 5.3% (19)
0% (2)
0% (3)
0% (4)
0% (3)
0% (11)
0% (5)
0% (2) - 0%
(2) 0% (3)
0% (0)
0% (10)
0% (8)
0% (2) x - 0%
(4) 0% (2)
0% (2) - x x x
Brown-barred rockcod 0% (1)
0% (3) - - - 0%
(2) 3.7% (27) - - 0%
(12) 0% (2)
0% (18)
0% (2)
0% (1) - x 0%
(1) - - - - x x x
Croaker * 0% (2)
0% (6)
0% (1)
0% (7) - - - - - - - - - 0%
(1) - x - - 8.3% (24)
4.3% (23)
2.4% (42) x x x
Darwin toadfish 0% (8)
0% (11) - 0%
(1) 0% (3)
0% (1)
5.3% (19)
0% (31)
0% (6)
0% (8) - - - 0%
(1) - x - - 0% (12)
0% (3)
0% (1) x x x
Forktail catfish * 0% (2)
0% (3)
0% (5) - 0%
(6) 0% (2)
16.7% (6)
0% (3)
0% (1) - 0%
(6) - 0% (8)
0% (19) - x 0%
(6) 0% (1)
2.2% (46)
3.4% (29)
9.3% (43) x x x
Giant trevally 0% (3)
0% (1) - - - - - - - - 0%
(1) 0% (2)
25.0% (4)
0% (6) - x - 0%
(1) 0% (1)
0% (4) - x x x
Golden snapper 1.2% (84)
0% (114)
0% (20)
3.0% (101)
9.5% (21)
0% (86)
0% (27)
11.1% (18)
0% (2)
7.4% (27)
16.1% (31)
0% (12)
0% (16)
3.8% (53)
0% (30) x 1.6%
(61) 7.7% (13)
1.4% (73)
5.0% (40)
17.9% (28) x x x
Goldspotted rockcod 8.7% (23)
0% (12)
50.0% (2)
22.2% (9)
50.0% (2)
0% (1)
6.3% (16)
0% (7)
0% (5)
25.0% (8)
0% (7)
37.5% (8)
4.0% (25)
0% (10)
66.7% (3) x 33.3%
(6) - 14.3% (28)
25.0% (4) - x x x
Grass emperor 0% (17)
0% (9)
0% (7)
0% (11) - 0%
(9) 5.6% (18)
0% (16)
0% (4)
0% (38)
0% (3)
0% (20)
3.1% (32)
0% (13)
0% (15) x 0%
(1) 0% (3) - - - x x x
Javelin * 0% (28)
0% (33)
0% (11)
0% (19)
20.0% (5)
0% (9)
4.2% (24)
6.7% (15)
0% (5) - 0%
(27) - 2.4% (42)
0% (54)
9.1% (11) x 0%
(6) 0% (20)
2.9% (35)
0% (12)
0% (5) x x x
Moses snapper 0% (114)
0% (23)
0% (1)
4.3% (23) - 0%
(16) 0% (16)
0% (6) - 0%
(4) - 0% (18)
0% (25)
0% (25)
0% (9) x - 0%
(15) - - - x x x
Mullet * 4.0% (25)
0% (6) - 0%
(1) - - 0% (23)
0% (19)
0% (5) - - - 0%
(14) 0% (2) - x 0%
(1) - 0% (12)
0% (6) - x x x
Queenfish * 11.1% (9)
0% (9)
0% (7)
0% (16)
25.0% (4)
0% (8)
0% (10)
0% (6)
0% (16)
0% (3)
0% (5)
0% (3)
0% (4)
0% (5)
0% (4) x 0%
(12) 0% (6) - 0%
(1) 100%
(1) x x x
Redfish * - - - - - 7.7% (13) - - - - - - - - - x - 0%
(1) - - - x x x
Stripey snapper 0% (21)
0% (9)
0% (9)
0% (12)
0% (17)
0% (5)
4.5% (22)
9.1% (11)
0% (9)
0% (33)
0% (13)
0% (43)
0% (11)
0% (7)
14.3% (7) x 0%
(11) 0% (1)
0% (6)
0% (3) - x x x
Tea leaf trevally - - - - - - - - - - - - - - - x - 100% (1) - - - x x x
Mud crab * 40.8% (49)
40.0% (30)
41.7% (12)
56.7% (30)
16.7% (12)
44.4% (9)
19.6% (148)
28.6% (35)
35.0% (40)
29.0% (62)
41.2% (17)
70.6% (17)
24.6% (57)
37.8% (37)
27.3% (11) x 50.0%
(8) 14.3%
(7) 22.8% (123)
26.6% (64)
23.8% (21) x x x
Sand crab * 11.2% (89)
10.5% (38)
5.1% (59)
11.1% (18)
15.0% (20)
7.1% (28)
13.0% (23)
14.3% (14)
0% (7)
5.3% (19)
8.8% (34)
0% (7)
0% (37)
4.8% (21)
11.1% (18) x 0%
(2) 12.5%
(8) 21.1% (19) - - x x x
Mangrove crab * 0% (7)
0% (5)
0% (1)
0% (8)
0% (5)
0% (5)
9.7% (31)
0% (15)
0% (7)
0% (4)
0% (31)
0% (10)
0% (5)
0% (5)
0% (3) x 0%
(10) 0% (8) - 0%
(2) 0% (1) x x x
All finfish 1.4% (553)
0% (278)
2.7% (113)
2.9% (244)
7.5% (106)
0.5% (193)
1.8% (388)
3.0% (202)
4.3% (93)
4.1% (244)
6.1% (147)
2.7% (262)
2.0% (293)
1.2% (243)
4.3% (117) x 2.2%
(134) 1.9% (105)
2.5% (364)
3.0% (203)
10.3% (156) x x x
All crabs 20.5% (146)
21.9% (73)
11.1% (72)
33.9% (56)
13.5% (37)
14.3% (42)
17.0% (206)
18.8% (64)
25.9% (54)
22.4% (85)
12.2% (82)
35.3% (34)
14.1% (99)
23.8% (63)
15.6% (32) x 20.0%
(20) 8.7% (23)
22.2% (144)
25.8% (66)
22.7% (22) x x x
Prepared for INPEX Cardno 50
Research Fishing and Fish Health Monitoring Post-dredging Report Season 1 Ichthys Nearshore Environmental Monitoring Program
Laboratory-based Post-field Examinations 4.4.2
During P1, 183 finfish and 60 crabs were subjected to detailed post-field external and internal health examinations (Appendix B). Of these, 112 finfish and 59 crabs were subjected to further histopathological examination. No notifiable finfish or crab diseases were detected during P1. The diverse range of parasites and pathological infections found in association with the finfish and crabs examined in the laboratory during P1 were consistent with those previously recorded during the Baseline Phase and Dredging Phase sampling seasons (Appendices F and G). The prevalence and intensity of infection for each health category examined are presented for the frequently sampled finfish and crab species in Appendix G. For the purpose of summary for reporting of results, health categories were combined into logical groupings defined in Table 4-12 (finfish) and Table 4-16 (crabs).
4.4.2.1 Finfish Golden snapper, barramundi, javelin, queenfish, Moses snapper, grass emperor, blue threadfin, blue tuskfish, stripey snapper and goldspotted rockcod were the ten finfish species most frequently examined within the laboratory during P1. Moreover, these species have, in general, been the most frequently examined finfish species within the laboratory during Baseline Phase and Dredging Phase sampling seasons.
During P1, as part of the laboratory examinations, considerable variability in the prevalence and intensity of the majority of parasites and other infections identified was observed (Appendix G-1). Variability in the prevalence and intensity of these infections has been evident for most of the finfish species frequently caught in Darwin and in Control locations as part of the RFFHMP (Appendix G-1). Summarised results of the detailed external and internal health examination and subsequent histopathological examination for golden snapper (Table 4-13), barramundi (Table 4-14) and goldspotted rockcod (Table 4-15) sampled during the Baseline Phase (B1 and B2 combined), Dredging Phase (D1 to D4) and P1 sampling seasons are presented below.
The prevalence of dactylogyrid monogeneans (parasitic worms found on the gills (Table 4-12)) in golden snapper, barramundi and goldspotted rockcod was higher during P1 compared to the Baseline Phase although no goldspotted rockcod were sampled at BH during P1 (Appendix G-1). The prevalence of dactylogyrid monogeneans in these three finfish species was however similar to that recorded throughout the Dredging Phase and not considered likely to influence fish health or be of particular concern. The prevalence of dactylogyrid monogeneans in golden snapper had increased from 74.0% at DI and 70.0% at BH during the Baseline Phase to 100% at DI and BH during P1 (Table 4-13, Figure 4-14A). There was however little change in the prevalence of dactylogyrid monogeneans at DO between Baseline Phase (68.8%) and P1 (70.0%) sampling seasons. The mean intensity of dactylogyrid monogenean infection (parasite count) in golden snapper at DI (34.0) and BH (41.4) was higher than during the Baseline Phase (DI: 7.4 and BH: 11.0). In contrast, at DO the mean intensity of dactylogyrid monogenean infection was lower during P1 (18.3) compared to the Baseline Phase (26.1) (Table 4-13). The mean intensity of infection at DI was, however, lower during P1 (34.0) compared to during D2 (70.6) while comparable to during D1, D3 and D4 (15.6, 27.7 and 39.5 respectively) (Table 4-13, Appendix G-1).
In barramundi, the prevalence of dactylogyrid monogeneans during P1 at DI and DO (87.5% and 100% respectively) was within the range recorded during the Dredging Phase (DI: 50.0% to 100% and DO: 33.3% to 100%) although higher than that recorded during the Baseline Phase (DI: 22.5% and DO: 9.1%) (Table 4-14, Figure 4-14B). The prevalence of dactylogyrid monogeneans at BH during P1 (100%) was the same as during D2 (100%) and higher than during the Baseline Phase (20.0%). The mean intensity of infection of dactylogyrid monogeneans in barramundi during P1 was similar among locations (DI: 53.4, DO: 57.3 and BH: 61.2) though higher at each location than during the Baseline Phase (DI: 9.0, DO: 5.0 and BH: 25.0). At DI during P1, the mean intensity of infection (53.4) was generally lower than that recorded during the Dredging Phase (71.8 to 100) with the exception of during D2 (27.7) (Table 4-14). The prevalence of dactylogyrid monogeneans in goldspotted rockcod increased from Baseline Phase levels to P1 from 54.4% to 100% in DI (based on one individual) and 33.3% to 75.0% at DO (Table 4-15, Figure 4-14C). No goldspotted rockcod were sampled at BH during P1 although the prevalence of dactylogyrid monogeneans increased from 71.0% during the Baseline Phase to 100% during the Dredging Phase at this location. The mean intensity of dactylogyrid monogeneans infection in goldspotted rockcod at DI was lower during P1 (2.0) compared to during the Baseline Phase (38.9). Although higher than during the Baseline Phase (5.2), the
Prepared for INPEX Cardno 51
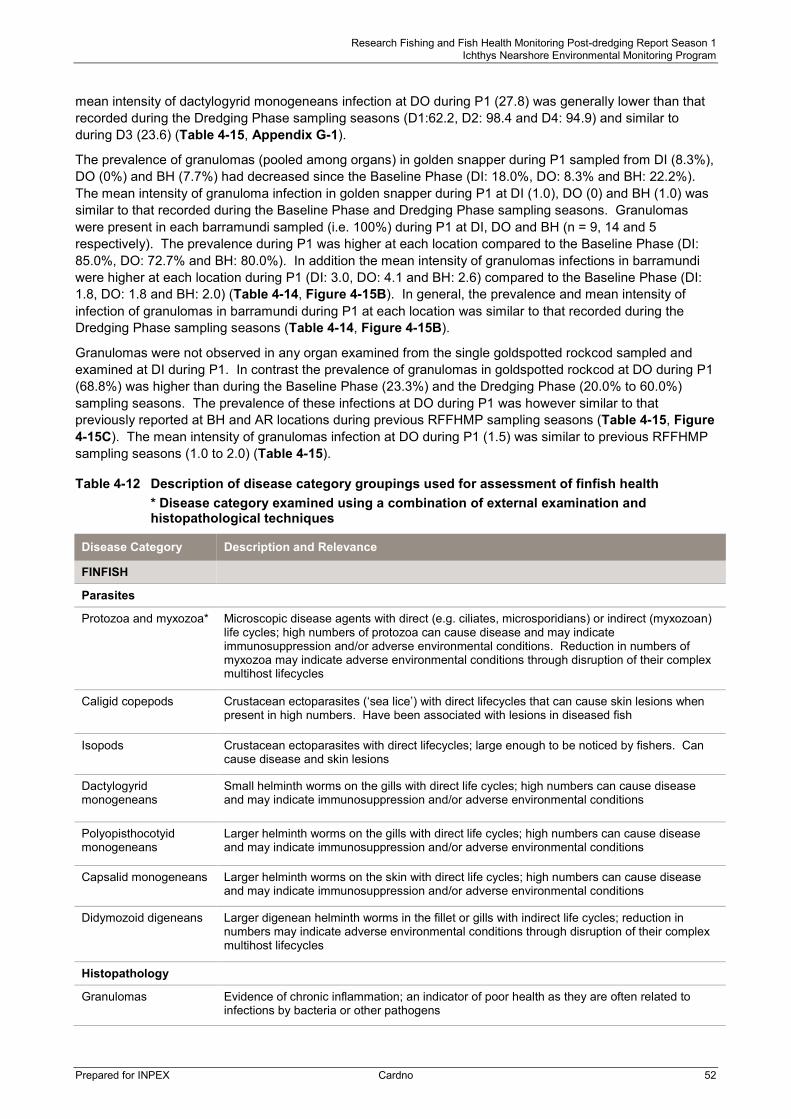
Research Fishing and Fish Health Monitoring Post-dredging Report Season 1 Ichthys Nearshore Environmental Monitoring Program
mean intensity of dactylogyrid monogeneans infection at DO during P1 (27.8) was generally lower than that recorded during the Dredging Phase sampling seasons (D1:62.2, D2: 98.4 and D4: 94.9) and similar to during D3 (23.6) (Table 4-15, Appendix G-1).
The prevalence of granulomas (pooled among organs) in golden snapper during P1 sampled from DI (8.3%), DO (0%) and BH (7.7%) had decreased since the Baseline Phase (DI: 18.0%, DO: 8.3% and BH: 22.2%). The mean intensity of granuloma infection in golden snapper during P1 at DI (1.0), DO (0) and BH (1.0) was similar to that recorded during the Baseline Phase and Dredging Phase sampling seasons. Granulomas were present in each barramundi sampled (i.e. 100%) during P1 at DI, DO and BH (n = 9, 14 and 5 respectively). The prevalence during P1 was higher at each location compared to the Baseline Phase (DI: 85.0%, DO: 72.7% and BH: 80.0%). In addition the mean intensity of granulomas infections in barramundi were higher at each location during P1 (DI: 3.0, DO: 4.1 and BH: 2.6) compared to the Baseline Phase (DI: 1.8, DO: 1.8 and BH: 2.0) (Table 4-14, Figure 4-15B). In general, the prevalence and mean intensity of infection of granulomas in barramundi during P1 at each location was similar to that recorded during the Dredging Phase sampling seasons (Table 4-14, Figure 4-15B).
Granulomas were not observed in any organ examined from the single goldspotted rockcod sampled and examined at DI during P1. In contrast the prevalence of granulomas in goldspotted rockcod at DO during P1 (68.8%) was higher than during the Baseline Phase (23.3%) and the Dredging Phase (20.0% to 60.0%) sampling seasons. The prevalence of these infections at DO during P1 was however similar to that previously reported at BH and AR locations during previous RFFHMP sampling seasons (Table 4-15, Figure 4-15C). The mean intensity of granulomas infection at DO during P1 (1.5) was similar to previous RFFHMP sampling seasons (1.0 to 2.0) (Table 4-15).
Table 4-12 Description of disease category groupings used for assessment of finfish health * Disease category examined using a combination of external examination and histopathological techniques
Disease Category Description and Relevance
FINFISH
Parasites
Protozoa and myxozoa* Microscopic disease agents with direct (e.g. ciliates, microsporidians) or indirect (myxozoan) life cycles; high numbers of protozoa can cause disease and may indicate immunosuppression and/or adverse environmental conditions. Reduction in numbers of myxozoa may indicate adverse environmental conditions through disruption of their complex multihost lifecycles
Caligid copepods Crustacean ectoparasites (‘sea lice’) with direct lifecycles that can cause skin lesions when present in high numbers. Have been associated with lesions in diseased fish
Isopods Crustacean ectoparasites with direct lifecycles; large enough to be noticed by fishers. Can cause disease and skin lesions
Dactylogyrid monogeneans
Small helminth worms on the gills with direct life cycles; high numbers can cause disease and may indicate immunosuppression and/or adverse environmental conditions
Polyopisthocotyid monogeneans
Larger helminth worms on the gills with direct life cycles; high numbers can cause disease and may indicate immunosuppression and/or adverse environmental conditions
Capsalid monogeneans Larger helminth worms on the skin with direct life cycles; high numbers can cause disease and may indicate immunosuppression and/or adverse environmental conditions
Didymozoid digeneans Larger digenean helminth worms in the fillet or gills with indirect life cycles; reduction in numbers may indicate adverse environmental conditions through disruption of their complex multihost lifecycles
Histopathology
Granulomas Evidence of chronic inflammation; an indicator of poor health as they are often related to infections by bacteria or other pathogens
Prepared for INPEX Cardno 52
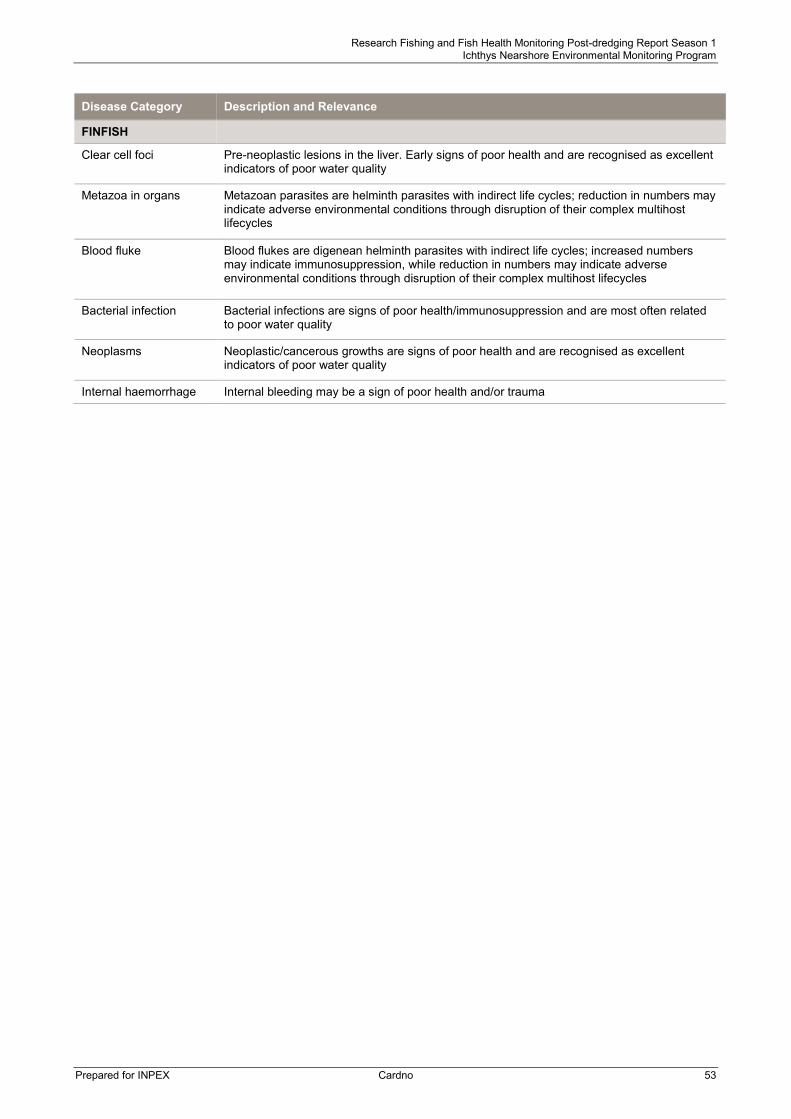
Research Fishing and Fish Health Monitoring Post-dredging Report Season 1 Ichthys Nearshore Environmental Monitoring Program
Disease Category Description and Relevance
FINFISH
Clear cell foci Pre-neoplastic lesions in the liver. Early signs of poor health and are recognised as excellent indicators of poor water quality
Metazoa in organs Metazoan parasites are helminth parasites with indirect life cycles; reduction in numbers may indicate adverse environmental conditions through disruption of their complex multihost lifecycles
Blood fluke Blood flukes are digenean helminth parasites with indirect life cycles; increased numbers may indicate immunosuppression, while reduction in numbers may indicate adverse environmental conditions through disruption of their complex multihost lifecycles
Bacterial infection Bacterial infections are signs of poor health/immunosuppression and are most often related to poor water quality
Neoplasms Neoplastic/cancerous growths are signs of poor health and are recognised as excellent indicators of poor water quality
Internal haemorrhage Internal bleeding may be a sign of poor health and/or trauma
Prepared for INPEX Cardno 53

Research Fishing and Fish Health Monitoring Post-dredging Report Season 1 Ichthys Nearshore Environmental Monitoring Program
Table 4-13 Summary of estimates of prevalence^ − expressed as a proportion of the sampled population (%) − and, where appropriate, average intensity (in parentheses) of selected disease categories in golden snapper sampled at DI, DO and BH during P1 (October 2014) and at each of the locations sampled during the Baseline Phase (BP; August/September 2012 and October 2012), D1 (November/December 2012), D2 (March 2013), D3 (October 2013) and D4 (March 2014) sampling seasons. AR was not sampled during D3, D4 or P1, and BH during D3 Refer to Table 4-12 for disease category explanations and Appendix G-1 for more details ^ Projected Sample Prevalence – see Section 2.4.5.1 for definition; x Location not sampled
Location Darwin Harbour – Inner Darwin – Outer Bynoe Harbour Adelaide River
Season BP D1 D2 D3 D4 P1 BP D1 D2 D3 D4 P1 BP D1 D2 D3 D4 P1 BP D1 D2
Number sampled in the field 84 114 20 101 21 86 27 18 2 27 31 12 16 53 30 x 61 13 73 40 28
Number identified as ‘abnormal’ (field) 1 0 0 3 2 0 0 2 0 2 5 0 0 2 0 x 1 1 1 2 5
Parasites Number examined in the laboratory 20 6 9 15 11 12 16 7 2 12 13 10 10 6 7 x 12 10 24 6 12
Protozoa/Myxozoa (Internal and External Pooled)
82.0 (1.0)
16. 7 (1.0)
11.1 (1.0)
24.3 (1.0)
0 (0)
0 (0)
8.3 (1.0)
55.6 (1.0)
50.0 (1.0)
40.7 (1.2)
0 (0)
0 (0)
33.3 (1.0)
0 (0)
42.9 (1.0) x 0
(0) 0
(0) 17.4 (1.0)
19.0 (1.0)
11.7 (1.0)
Caligid copepods (Pooled) 0 (0)
0 (0)
0 (0)
16.2 (1.0)
9.5 (3.0)
16.7 (2.0)
6.3 (2.0)
17.8 (1.0)
0 (0)
46.3 (1.4)
41.1 (1.6)
70.0 (2.0)
20.0 (1.0)
16.0 (2.0)
0 (0) x 35.8
(2.5) 30.8 (1)
17.2 (1.0)
43.0 (1.0)
18.9 (1.0)
Isopods 0 (0)
16.7 (1.0)
11.1 (1.0)
0 (0)
0 (0)
0 (0)
0 (0)
0 (0)
0 (0)
0 (0)
10.5 (1.0)
10.0 (1.0)
0 (0)
0 (0)
0 (0) x 0
(0) 0
(0) 5.7
(1.3) 5.0
(1.0) 0
(0) Gill – Dactylogyrid monogeneans
74.0 (7.41)
83.3 (15.6)
100 (70.6)
100 (27.7)
100 (39.5)
100 (34.0)
68.8 (26.1)
94.4 (51.0)
100 (37.5)
81.5 (41.8)
83.1 (47.5)
70.0 (18.3)
70.0 (11.0)
80.2 (14.6)
71.4 (20.8) x 100
(44.2) 100
(41.4) 70.0
(15.4) 81.0 (7.2)
54.1 (3.9)
Polyopisthocotyid monogeneans
0 (0)
0 (0)
0 (0)
0 (0)
0 (0)
0 (0)
0 (0)
0 (0)
0 (0)
0 (0)
0 (0)
0 (0)
0 (0)
0 (0)
0 (0) x 0
(0) 0
(0) 0
(0) 0
(0) 0
(0)
Capsalid monogeneans 5.2 (1.0)
16.7 (2.0)
0 (0)
0 (0)
0 (0)
0 (0)
0 (0)
0 (0)
0 (0)
0 (0)
0 (0)
20.0 (1.0)
0 (0)
0 (0)
0 (0) x 0
(0) 0
(0) 0
(0) 0
(0) 0
(0)
Didymozoid digeneans 0 (0)
0 (0)
0 (0)
0 (0)
0 (0)
16.7 (3.5)
12.5 (1.0)
0 (0)
0 (0)
18.5 (6.5)
24.2 (3.1)
10.0 (3.0)
10.0 (2.0)
0 (0)
0 (0) x 17.9
(3.0) 18.0 (2.1)
0 (0)
0 (0)
0 (0)
Histopathology Number examined by histopathology 12 6 5 11 11 12 12 5 2 10 13 7 9 5 5 x 12 9 18 6 6
Granulomas (Pooled) 18.0 (1.0)
16.7 (1.0)
20.0 (1.0)
14.1 (1.0)
0 (0)
8.3 (1.0)
8.3 (2.0)
0 (0)
0 (0)
11.6 (1.0)
3.2 (1.0)
0 (0)
22.2 (1.0)
0 (0)
0 (0) x 0
(0) 7.7
(1.0) 17.4 (1.3)
0 (0)
6.0 (1.0)
Metazoa (Pooled) 44.9 (1.0)
33.3 (1.0)
40.0 (1.0)
49.5 (1.0)
65.1 (1.3)
66.7 (1.1)
0 (0)
100 (1.3)
50.0 (1.0)
26.9 (1.43)
48.4 (1.0)
42.9 (1.0)
11.1 (1.0)
19.3 (1.0)
40.0 (1.0) x 55.3
(1.4) 57.7 (1.0)
17.4 (1.0)
0 (0)
27.4 (1.0)
Haemorrhage (Pooled) 37.1 (1.0)
83.3 (1.4)
40.0 (1.0)
38.4 (1.3)
90.0 (1.8)
41.7 (1.2)
41.7 (1.0)
77.8 (1.31)
0 (0)
61.6 (1.4)
62.1 (1.3)
28.6 (1.0)
33.3 (1.0)
77.0 (1.3)
60.0 (1.0) x 80.5
(1.4) 57.7 (1.0)
42.0 (1.0)
38.0 (1.0)
27.4 (1.0)
Bacteria (Pooled) 9.0 (1.0)
0 (0)
0 (0)
0 (0)
0 (0)
0 (0)
0 (0)
0 (0)
0 (0)
0 (0)
0 (0)
0 (0)
11.1 (1.0)
0 (0)
0 (0) x 17.9
(1.0) 0
(0) 5.8
(1.0) 0
(0) 0
(0)
Blood fluke (Pooled) 0 (0)
0 (0)
0 (0)
0 (0)
0 (0)
0 (0)
0 (0)
0 (0)
0 (0)
0 (0)
0 (0)
0 (0)
11.1 (1.0)
0 (0)
0 (0) x 0
(0) 0
(0) 0
(0) 0
(0) 0
(0)
Liver – Clear cell foci 0 (0)
0 (0)
0 (0)
12.1 (1.0)
0 (0)
0 (0)
0 (0)
0 (0)
0 (0)
0 (0)
0 (0)
0 (0)
11.1 (1.0)
0 (0)
0 (0) x 0
(0) 0
(0) 0
(0) 0
(0) 0
(0)
Prepared for INPEX Cardno 54

Research Fishing and Fish Health Monitoring Post-dredging Report Season 1 Ichthys Nearshore Environmental Monitoring Program
Table 4-14 Summary of estimates of prevalence^ − expressed as a proportion of the sampled population (%) – and, where appropriate, average intensity (in parentheses) of selected disease categories in barramundi sampled at DI, DO and BH during P1 (October 2014) and at each of the locations sampled during the Baseline Phase (BP; August/September 2012 and October 2012), D1 (November/December 2012), D2 (March 2013), D3 (October 2013) and D4 (March 2014) sampling seasons. AR was not sampled during D3, D4 or P1, and BH during D3 Refer to Table 4-12 for disease category explanations and Appendix G-1 for more details ^ Projected Sample Prevalence – see Section 2.4.5.1 for definition; x Location not sampled
Location Darwin Harbour – Inner Darwin – Outer Bynoe Harbour Adelaide River
Season BP D1 D2 D3 D4 P1 BP D1 D2 D3 D4 P1 BP D1 D2 D3 D4 P1 BP D1 D2
Number sampled in the field 10 7 15 9 18 9 11 6 19 15 12 14 5 6 5 x 0 5 8 14 17
Number identified as ‘abnormal’ (field) 1 0 1 0 1 0 0 0 3 1 1 0 0 0 0 x 0 0 0 0 4
Parasites Number examined in the laboratory 9 6 9 9 11 8 11 6 6 13 11 10 5 6 5 x 0 5 8 12 10
Protozoa/Myxozoa (Internal and External Pooled)
52.8 (1.3)
20.0 (1.0)
70.0 (1.6)
88.9 (1.6)
33.9 (2.6)
62.5 (1.0)
45.5 (1.0)
0 (0)
66.3 (1.1)
50.3 (1.1)
45.0 (1.0)
40.0 (1.0)
20.0 (1.0)
40.0 (1.0)
80.0 (1.5) x - 60.0
(1.0) 34.4
(15.5) 40.0 (1.0)
30.4 (1.4)
Caligid copepods (Pooled) 66.3 (3.3)
16.7 (1.0)
41.7 (2.3)
22.2 (3.0)
47.2 (1.2)
12.5 (1.0)
18.2 (8.0)
33.3 (2.0)
16.8 (4.0)
28.7 (1.3)
26.7 (1.3)
20.0 (1.0)
80.0 (2.25)
16.7 (1.0)
100 (1.6) x - 40.0
(1.5) 12.5 (1.0)
0 (0)
5.9 (1.0)
Isopods 0 (0)
0 (0)
0 (0)
11.1 (1.0)
5.6 (2.0)
0 (0)
0 (0)
0 (0)
0 (0)
0 (0)
0 (0)
0 (0)
20.0 (2.0)
0 (0)
0 (0) x - 0
(0) 0
(0) 0
(0) 0
(0)
Gill – Dactylogyrid monogeneans 22.5 (9.0)
50.0 (27.7)
100 (71.8)
100 (77.1)
100 (109.6)
87.5 (53.4)
9.1 (5.0)
33.3 (31.0)
100 (75.0)
93.3 (38.9)
90.8 (57.3)
100 (57.3)
20.0 (25.0)
0 (0)
100 (15.6) x - 100
(61.2) 12.5
(25.0) 8.3
(5.0) 87.3
(55.3)
Polyopisthocotyid monogeneans 0 (0)
0 (0)
0 (0)
0 (0)
0 (0)
0 (0)
0 (0)
0 (0)
0 (0)
0 (0)
0 (0)
0 (0)
0 (0)
0 (0)
0 (0) x - 0
(0) 0
(0) 0
(0) 0
(0)
Capsalid monogeneans 0 (0)
0 (0)
0 (0)
0 (0)
0 (0)
0 (0)
0 (0)
0 (0)
0 (0)
0 (0)
0 (0)
0 (0)
0 (0)
0 (0)
0 (0) x - 0
(0) 0
(0) 0
(0) 0
(0)
Didymozoid digeneans 0 (0)
0 (0)
0 (0)
0 (0)
0 (0)
0 (0)
0 (0)
0 (0)
0 (0)
0 (0)
0 (0)
0 (0)
0 (0)
0 (0)
0 (0) x - 0
(0) 0
(0) 0
(0) 5.9
(1.0)
Histopathology -
Number examined by histopathology 7 5 6 9 11 8 11 5 5 11 11 9 5 5 5 x - 5 5 5 9
Granulomas (Pooled) 85.0 (1.8)
100 (1.8)
62.7 (1.6)
100 (2.3)
100 (3.5)
100 (3.0)
72.7 (1.8)
40.0 (1.0)
84.2 (2.0)
84.9 (3.0)
100 (2.4)
100 (4.1)
80.0 (2.0)
60.0 (1.7)
80.0 (1.3) x - 100
(2.6) 80.0 (2.5)
80.0 (1.8)
100 (3.2)
Metazoa (Pooled) 55.0 (1.6)
40.0 (1.0)
100 (1.3)
11.1 (1.0)
56.7 (1.0)
50.0 (1.3)
54.6 (1.3)
20.0 (1.0)
84.2 (2.0)
17.0 (1.0)
27.5 (1.0)
44.4 (1.0)
80.0 (2.3)
0 (0)
80.0 (1.5) x - 40.0
(1.0) 80.0 (2.3)
0 (0)
100 (1.8)
Haemorrhage (Pooled) 100 (1.5)
20.0 (1.0)
18.7 (1.0)
44.4 (1.8)
81.1 (2.1)
0 (0)
45.5 (1.6)
0 (0)
0 (0)
84.9 (2.1)
90.8 (1.2)
22.2 (1.5)
60.0 (1.0)
80.0 (1.3)
20.0 (1.0) x - 20.0
(1.0) 60.0 (1.0)
20.0 (2.0)
42.4 (1.0)
Bacteria (Pooled) 0 (0)
0 (0)
0 (0)
22.2 (1.0)
18.9 (1.0)
0 (0)
36.4 (1.3)
0 (0)
0 (0)
8.5 (1.0)
9.2 (1.0)
0 (0)
20.0 (1.0)
0 (0)
0 (0) x - 0
(0) 20.0 (1.0)
20.0 (1.0)
5.9 (1.0)
Blood fluke (Pooled) 30.0 (1.5)
100 (2.4)
100 (2.5)
100 (3.1)
100 (4.3)
100 (2.9)
27.3 (1.3)
40.0 (2.0)
84.2 (1.6)
84.9 (3.1)
100 (3.0)
100 (2.8)
80.0 (1.8)
60.0 (1.0)
100 (1.6) x - 80
(2.8) 80.0 (2.5)
80.0 (1.8)
100 (2.4)
Liver – Clear cell foci 0 (0)
0 (0)
0 (0)
0 (0)
0 (0)
0 (0)
0 (0)
0 (0)
0 (0)
0 (0)
0 (0)
0 (0)
20.0 (1.0)
0 (0)
0 (0) x - 0
(0) 0
(0) 0
(0) 0
(0)
Prepared for INPEX Cardno 55

Research Fishing and Fish Health Monitoring Post-dredging Report Season 1 Ichthys Nearshore Environmental Monitoring Program
Table 4-15 Summary of estimates of prevalence^ − expressed as a proportion of the sampled population (%) – and, where appropriate, average intensity (grade in parentheses) of selected disease categories in goldspotted rockcod sampled at DI, DO and BH during P1 (October 2014) and at each of the locations sampled during the Baseline Phase (BP; August/September 2012 and October 2012), D1 (November/December 2012), D2 (March 2013), D3 (October 2013) and D4 (March 2014) sampling seasons. AR was not sampled during D3, D4 or P1, and BH during D3 Refer to Table 4-12 for disease category explanations and Appendix G-1 for more details ^ Projected Sample Prevalence – see Section 2.4.5.1 for definition; x Location not sampled
Location Darwin Harbour – Inner Darwin – Outer Bynoe Harbour Adelaide River
Season BP D1 D2 D3 D4 P1 BP D1 D2 D3 D4 P1 BP D1 D2 D3 D4 P1 BP D1 D2
Number sampled in the field 23 12 2 9 2 1 15 7 5 8 7 8 26 10 3 x 6 0 28 4 0
Number identified as ‘abnormal’ (field) 2 0 1 2 1 0 1 0 0 2 0 3 2 0 2 x 2 0 4 1 0
Parasites Number examined in the laboratory 10 7 2 6 2 1 8 6 5 7 7 8 13 5 3 x 6 0 11 4 0
Protozoa/Myxozoa (Internal and External Pooled)
30.4 (1.0)
0 (0)
0 (0)
19. 4 (1.0)
0 (0)
0 (0)
23.3 (1.0)
0 (0)
0 (0)
0 (0)
0 (0)
0 (0)
9.2 (1.0)
25.0 (1.0)
0 (0) x 0
(0) - 0
(0) 0
(0) -
Caligid copepods (Pooled) 34.3 (2.0)
0 (0)
0 (0)
0 (0)
0 (0)
0 (0)
0 (0)
0 (0)
0 (0)
0 (0)
0 (0)
12.5 (1.0)
8.4 (3.0)
0 (0)
0 (0) x 0
(0) - 0
(0) 0
(0) -
Isopods 27.2 (1.2)
0 (0)
50.0 (4.0)
0 (0)
50.0 (2.0)
0 (0)
26.7 (1.5)
33.3 (1.0)
0 (0)
40.0 (1.0)
0 (0)
37.5 (1.7)
0 (0)
0 (0)
33.3 (9.0) x 33.3
(1.5) - 12.2
(1.0) 0
(0) -
Gill – Dactylogyrid monogeneans
54.4 (38.9)
100 (31.7)
100 (83.0)
80.6 (38.5)
100 (84.5)
100 (2.0)
33.3 (5.2)
100 (62.2)
100 (98.4)
100 (23.6)
100 (94.9)
75.0 (27.8)
71.0 (13.2)
100 (23.4)
100 (55.7) x 100
(32.7) - 68.4
(13.5) 75.0
(19.0) -
Polyopisthocotyid monogeneans 0 (0)
0 (0)
0 (0)
0 (0)
0 (0)
0 (0)
0 (0)
0 (0)
0 (0)
0 (0)
0 (0)
0 (0)
0 (0)
0 (0)
0 (0) x 0
(0) - 0
(0) 0
(0) -
Capsalid monogeneans 0 (0)
0 (0)
0 (0)
0 (0)
0 (0)
0 (0)
0 (0)
0 (0)
0 (0)
0 (0)
0 (0)
0 (0)
0 (0)
0 (0)
0 (0) x 0
(0) - 0
(0) 0
(0) -
Didymozoid digeneans 31.5 (1.5)
14.3 (1.0)
50.0 (2.0)
61.1 (1.6)
0 (0)
0 (0)
6.7 (1.0)
33.3 (1.0)
0 (0)
45.0 (2.3)
14.3 (1.0)
12.5 (1.0)
25.2 (2.7)
0 (0)
66.7 (3.0) x 66.7
(1.3) - 0
(0) 0
(0) -
Histopathology -
-
Number examined by histopathology 8 6 2 6 2 1 4 5 5 7 7 6 12 4 3 x 6 - 9 4 -
Granulomas (Pooled) 30.4 (1.0)
16.7 (1.0)
50.0 (1.0)
38.9 (1.5)
50.0 (1.0)
0 (0)
23.3 (1.0)
20.0 (2.0)
60.0 (1.7)
12.5 (1.0)
28.6 (1.0)
68.8 (1.5)
18.5 (2.0)
25.0 (1.0)
66.7 (2.0) x 83.3
(1.4) - 14.3
(1.0) 75.0 (1.3)
-
Metazoa (Pooled) 39.1 (1.0)
33.3 (1.0)
50.0 (1.0)
38.9 (1.0)
50.0 (1.0)
100 (1.0)
23.3 (1.0)
40.0 (1.0)
80.0 (1.0)
15.0 (1.0)
0 (0)
50.0 (1.0)
36.9 (1.0)
100 (1.0)
33.3 (1.0) x 16.7
(1.0) - 0
(0) 25.0 (1.0)
-
Haemorrhage (Pooled) 34.8 (1.4)
0 (0)
0 (0)
38.9 (1.5)
50.0 (1.0)
0 (0)
70.0 (1.3)
0 (0)
20.0 (1.0)
12.5 (1.0)
42.9 (1.3)
0 (0)
26.2 (1.0)
0 (0)
0 (0) x 66.7
(1.5) - 42.9
(1.0) 0
(0) -
Bacteria (Pooled) 0 (0)
0 (0)
0 (0)
0 (0)
0 (0)
0 (0)
0 (0)
0 (0)
20.0 (1.0)
0 (0)
14.3 (1.0)
0 (0)
0 (0)
0 (0)
0 (0) x 16.7
(1.0) - 0
(0) 0
(0) -
Blood fluke (Pooled) 0 (0)
0 (0)
0 (0)
0 (0)
0 (0)
0 (0)
0 (0)
0 (0)
0 (0)
0 (0)
0 (0)
0 (0)
0 (0)
0 (0)
0 (0) x 0
(0) - 0
(0) 0
(0) -
Liver – Clear cell foci 0 (0)
0 (0)
0 (0)
0 (0)
0 (0)
0 (0)
0 (0)
0 (0)
0 (0)
0 (0)
0 (0)
0 (0)
0 (0)
0 (0)
0 (0) x 0
(0) - 0
(0) 0
(0) -
Prepared for INPEX Cardno 56

Research Fishing and Fish Health Monitoring Post-dredging Report Season 1 Ichthys Nearshore Environmental Monitoring Program
Figure 4-14 Prevalence of dactylogyrid monogeneans for: A) golden snapper; B) barramundi; and C)
goldspotted rockcod at DI, DO and BH during P1 (October 2014) and at each of the locations sampled during the Baseline Phase (BP; August/September 2012 and October 2012), D1 (November/December 2012), D2 (March 2013), D3 (October 2013), D4 (March 2014) sampling seasons
The number of samples examined at each location during each survey is presented along the x-axis. x Location not sampled
0
25
50
75
100
0
25
50
75
100
0
25
50
75
100
C) Goldspotted rockcod
Control Locations
B) Barramundi
A) Golden snapperPr
eval
ence
20 6 9 15 11 12 10 6 7 x 12 10 24 6 12 x x x
9 6 9 9 11 8 11 6 6 13 11 10 5 6 5 x 0 5 8 12 10 x x x
DI DO BH AR
10 7 2 6 2 1 8 6 5 7 7 8 13 5 3 x 6 0 11 4 0 x x x
16 7 2 12 13 10
BP (n = 70)
D1 (n = 25)
D2 (n = 30)
D3 (n = 27)
D4 (n = 36)P1 (n = 32)
BP (n = 33)
D1 (n = 30)
D2 (n = 30)
D3 (n = 22)
D4 (n = 22)P1 (n = 23)
BP (n = 42)
D1 (n = 22)
D2 (n = 10)
D3 (n = 13)
D4 (n = 15)P1 (n = 9)
Prepared for INPEX Cardno 57

Research Fishing and Fish Health Monitoring Post-dredging Report Season 1 Ichthys Nearshore Environmental Monitoring Program
Figure 4-15 Prevalence of granulomas (pooled among organs) for: A) golden snapper;
B) barramundi; and C) goldspotted rockcod at DI, DO and BH during P1 (October 2014) and at each of the locations sampled during the Baseline Phase (BP; August/September 2012 and October 2012), D1 (November/December 2012), D2 (March 2013), D3 (October 2013) and D4 (March 2014) sampling seasons
The number of samples examined at each location during each survey is presented along the x-axis. x Location not sampled
0
25
50
75
100
C) Goldspotted rockcod
Control Locations
B) Barramundi
A) Golden snapperPr
eval
ence
12 6 5 11 11 12 9 5 5 x 12 9 18 6 6 x x x
7 5 6 9 11 8 11 5 5 11 11 9 5 5 5 x 0 5 5 5 9 x x x
DI DO BH AR
8 6 2 6 2 1 4 5 5 7 7 6 12 4 3 x 6 0 9 4 0 x x x
12 5 2 10 13 7
BP (n = 51)
D1 (n = 22)
D2 (n = 18)
D3 (n = 21)
D4 (n = 36)P1 (n = 28)
BP (n = 28)
D1 (n = 20)
D2 (n = 25)
D3 (n = 20)
D4 (n = 22)P1 (n = 22)
BP (n = 42)
D1 (n = 22)
D2 (n = 10)
D3 (n = 13)
D4 (n = 15)P1 (n = 9)
0
25
50
75
100
0
25
50
75
100
Prepared for INPEX Cardno 58

Research Fishing and Fish Health Monitoring Post-dredging Report Season 1 Ichthys Nearshore Environmental Monitoring Program
The prevalence of metazoa (pooled among organs) in golden snapper at DI and BH during P1 (66.7% and 57.7% respectively) was higher than that recorded during the Baseline Phase (DI: 44.9% and BH 11.1%) and all Dredging Phase sampling seasons (DI: 33.3% to 65.1% and BH: 19.3% to 55.3%) (Table 4-13, Figure 4-16A, Appendix G-1). While the prevalence of metazoa in golden snapper at DO during P1 (42.9%) was higher than during the Baseline Phase (0%), it was lower than during Dredging Phase sampling seasons D1 (100%), D2 (50.0%) and D4 (48.4%). The mean intensity of metazoa infections in golden snapper during P1 at each location (DI: 1.1, DO: 1.0 and BH: 1.0) was similar to all previous sampling seasons (Table 4-13). The prevalence of metazoa recorded in barramundi sampled at each location during P1 (DI: 50.0%, DO: 44.4% and BH: 40.0%) was lower than during the Baseline Phase (DI: 55.0%, DO: 54.6% and BH: 80.0%). At each location the prevalence of metazoa in barramundi has been variable among Dredging Phase sampling seasons (e.g. at DI during D1: 40.0%, D2: 100%, D3: 11.1% and D4 56.7%) (Figure 4-16B). The mean intensity of metazoa infections in barramundi during P1 at each location (DI: 1.3 and DO: 1.0) was generally similar to all previous sampling seasons (Table 4-14). In contrast, the mean intensity of infection at BH (1.0) was lower than that recorded during the Baseline Phase (2.3) and D2 (1.5) though higher than during D1 (0). The prevalence of metazoa recorded in goldspotted rockcod at DI during P1 (100%) was higher than previous sampling seasons (33.3% to 50.0%), while the mean intensity of infection at DI has been consistent among sampling seasons (1.0). The prevalence of metazoa recorded in goldspotted rockcod at DO during P1 (50.0%) was lower than that recorded during D2 (80.0%) although higher than during D4 (0%), D3 (15.0%) the Baseline Phase (23.3%) and D1 (40.0%). The mean intensity of infection at DO during P1 (1.0) was the same as previous sampling seasons when metazoan were recorded (Table 4-15, Figure 4-16B). No goldspotted rockcod were sampled at BH during P1. In general, the prevalence of metazoa has been considerably variable among species and between locations during RFFHMP, while the intensity of infection has remained relatively consistent.
Despite some variability in the prevalence and intensity of infection in finfish sampled from Darwin Harbour, for the majority of the health categories monitored during the Post-dredging Phase, similar and comparable results have been evident at one or both of the Control locations sampled throughout the RFFHMP. At present, collectively these results do not indicate any areas of particular concern in terms of potential impacts on fish health from Project dredging and spoil disposal activities.
Prepared for INPEX Cardno 59

Research Fishing and Fish Health Monitoring Post-dredging Report Season 1 Ichthys Nearshore Environmental Monitoring Program
Figure 4-16 Prevalence of metazoa (pooled among organs) for: A) golden snapper; B) barramundi;
and C) goldspotted rockcod at DI, DO and BH during P1 (October 2014) and at each of the locations sampled during the Baseline Phase (BP; August/September 2012 and October 2012), D1 (November/December 2012), D2 (March 2013), D3 (October 2013) and D4 (March 2014) sampling seasons
The number of samples examined at each location during each survey is presented along the x-axis. x – Location not sampled
Control Locations
C) Goldspotted rockcod
B) Barramundi
A) Golden snapperPr
eval
ence
DI DO BH AR
BP (n = 51)
D1 (n = 22)
D2 (n = 18)
D3 (n = 21)
D4 (n = 36)P1 (n = 28)
BP (n = 28)
D1 (n = 20)
D2 (n = 25)
D3 (n = 20)
D4 (n = 22)P1 (n = 22)
BP (n = 42)
D1 (n = 22)
D2 (n = 10)
D3 (n = 13)
D4 (n = 15)P1 (n = 9)
0
25
50
75
100
0
25
50
75
100
0
25
50
75
100
12 6 5 11 11 12 9 5 5 x 12 9 18 6 6 x x x12 5 2 10 13 7
7 5 6 9 11 8 11 5 5 11 11 9 5 5 5 x 0 5 5 5 9 x x x
8 6 2 6 2 1 4 5 5 7 7 6 12 4 3 x 6 0 9 4 0 x x x
Prepared for INPEX Cardno 60
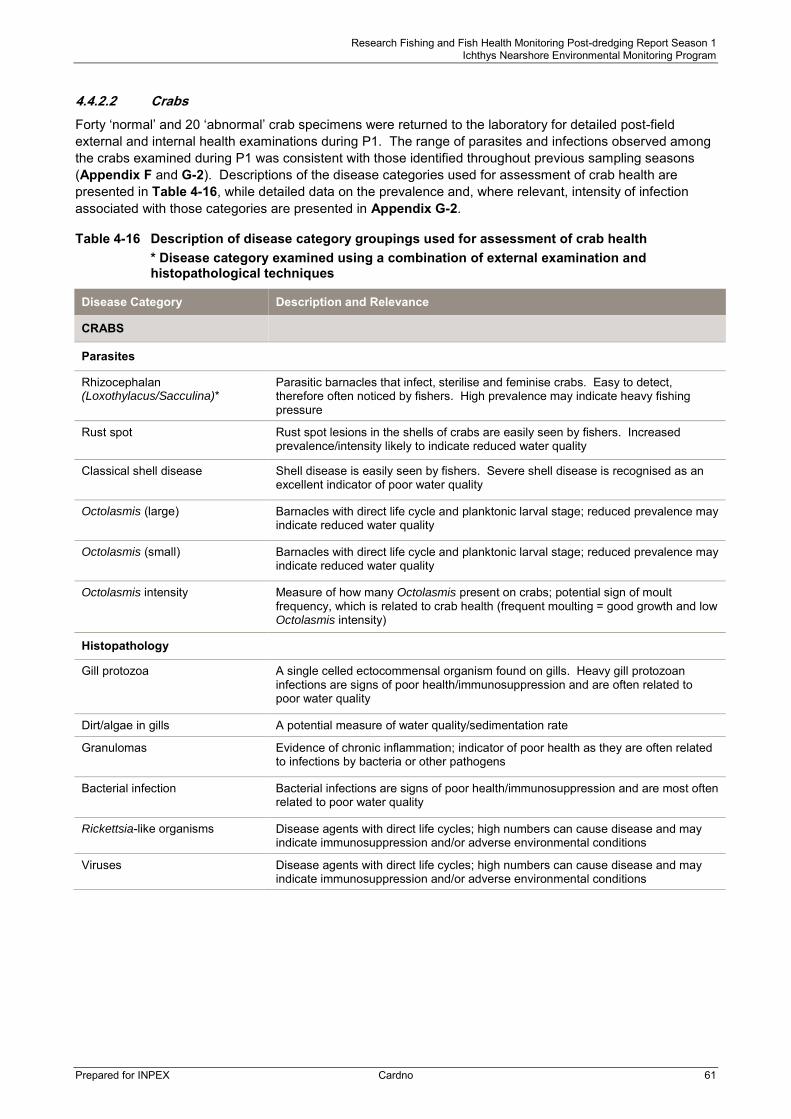
Research Fishing and Fish Health Monitoring Post-dredging Report Season 1 Ichthys Nearshore Environmental Monitoring Program
4.4.2.2 Crabs Forty ‘normal’ and 20 ‘abnormal’ crab specimens were returned to the laboratory for detailed post-field external and internal health examinations during P1. The range of parasites and infections observed among the crabs examined during P1 was consistent with those identified throughout previous sampling seasons (Appendix F and G-2). Descriptions of the disease categories used for assessment of crab health are presented in Table 4-16, while detailed data on the prevalence and, where relevant, intensity of infection associated with those categories are presented in Appendix G-2.
Table 4-16 Description of disease category groupings used for assessment of crab health * Disease category examined using a combination of external examination and histopathological techniques
Disease Category Description and Relevance
CRABS
Parasites
Rhizocephalan (Loxothylacus/Sacculina)*
Parasitic barnacles that infect, sterilise and feminise crabs. Easy to detect, therefore often noticed by fishers. High prevalence may indicate heavy fishing pressure
Rust spot Rust spot lesions in the shells of crabs are easily seen by fishers. Increased prevalence/intensity likely to indicate reduced water quality
Classical shell disease Shell disease is easily seen by fishers. Severe shell disease is recognised as an excellent indicator of poor water quality
Octolasmis (large) Barnacles with direct life cycle and planktonic larval stage; reduced prevalence may indicate reduced water quality
Octolasmis (small) Barnacles with direct life cycle and planktonic larval stage; reduced prevalence may indicate reduced water quality
Octolasmis intensity Measure of how many Octolasmis present on crabs; potential sign of moult frequency, which is related to crab health (frequent moulting = good growth and low Octolasmis intensity)
Histopathology
Gill protozoa A single celled ectocommensal organism found on gills. Heavy gill protozoan infections are signs of poor health/immunosuppression and are often related to poor water quality
Dirt/algae in gills A potential measure of water quality/sedimentation rate
Granulomas Evidence of chronic inflammation; indicator of poor health as they are often related to infections by bacteria or other pathogens
Bacterial infection Bacterial infections are signs of poor health/immunosuppression and are most often related to poor water quality
Rickettsia-like organisms Disease agents with direct life cycles; high numbers can cause disease and may indicate immunosuppression and/or adverse environmental conditions
Viruses Disease agents with direct life cycles; high numbers can cause disease and may indicate immunosuppression and/or adverse environmental conditions
Prepared for INPEX Cardno 61
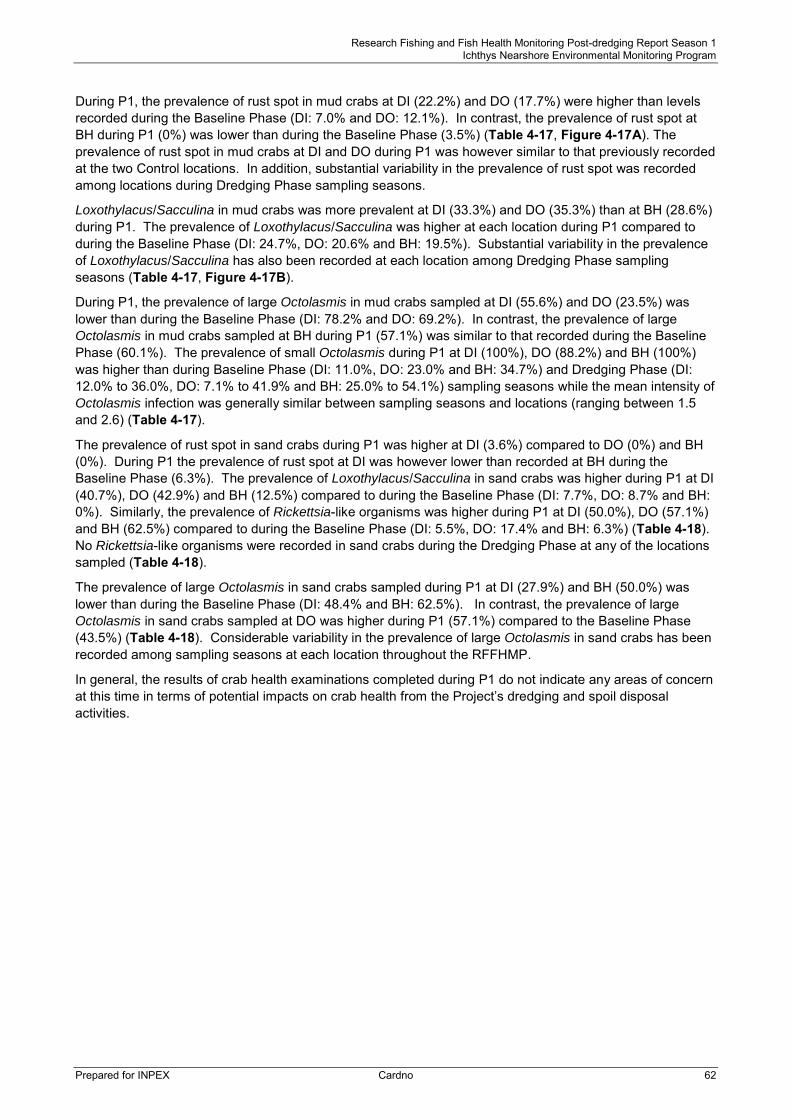
Research Fishing and Fish Health Monitoring Post-dredging Report Season 1 Ichthys Nearshore Environmental Monitoring Program
During P1, the prevalence of rust spot in mud crabs at DI (22.2%) and DO (17.7%) were higher than levels recorded during the Baseline Phase (DI: 7.0% and DO: 12.1%). In contrast, the prevalence of rust spot at BH during P1 (0%) was lower than during the Baseline Phase (3.5%) (Table 4-17, Figure 4-17A). The prevalence of rust spot in mud crabs at DI and DO during P1 was however similar to that previously recorded at the two Control locations. In addition, substantial variability in the prevalence of rust spot was recorded among locations during Dredging Phase sampling seasons.
Loxothylacus/Sacculina in mud crabs was more prevalent at DI (33.3%) and DO (35.3%) than at BH (28.6%) during P1. The prevalence of Loxothylacus/Sacculina was higher at each location during P1 compared to during the Baseline Phase (DI: 24.7%, DO: 20.6% and BH: 19.5%). Substantial variability in the prevalence of Loxothylacus/Sacculina has also been recorded at each location among Dredging Phase sampling seasons (Table 4-17, Figure 4-17B).
During P1, the prevalence of large Octolasmis in mud crabs sampled at DI (55.6%) and DO (23.5%) was lower than during the Baseline Phase (DI: 78.2% and DO: 69.2%). In contrast, the prevalence of large Octolasmis in mud crabs sampled at BH during P1 (57.1%) was similar to that recorded during the Baseline Phase (60.1%). The prevalence of small Octolasmis during P1 at DI (100%), DO (88.2%) and BH (100%) was higher than during Baseline Phase (DI: 11.0%, DO: 23.0% and BH: 34.7%) and Dredging Phase (DI: 12.0% to 36.0%, DO: 7.1% to 41.9% and BH: 25.0% to 54.1%) sampling seasons while the mean intensity of Octolasmis infection was generally similar between sampling seasons and locations (ranging between 1.5 and 2.6) (Table 4-17).
The prevalence of rust spot in sand crabs during P1 was higher at DI (3.6%) compared to DO (0%) and BH (0%). During P1 the prevalence of rust spot at DI was however lower than recorded at BH during the Baseline Phase (6.3%). The prevalence of Loxothylacus/Sacculina in sand crabs was higher during P1 at DI (40.7%), DO (42.9%) and BH (12.5%) compared to during the Baseline Phase (DI: 7.7%, DO: 8.7% and BH: 0%). Similarly, the prevalence of Rickettsia-like organisms was higher during P1 at DI (50.0%), DO (57.1%) and BH (62.5%) compared to during the Baseline Phase (DI: 5.5%, DO: 17.4% and BH: 6.3%) (Table 4-18). No Rickettsia-like organisms were recorded in sand crabs during the Dredging Phase at any of the locations sampled (Table 4-18).
The prevalence of large Octolasmis in sand crabs sampled during P1 at DI (27.9%) and BH (50.0%) was lower than during the Baseline Phase (DI: 48.4% and BH: 62.5%). In contrast, the prevalence of large Octolasmis in sand crabs sampled at DO was higher during P1 (57.1%) compared to the Baseline Phase (43.5%) (Table 4-18). Considerable variability in the prevalence of large Octolasmis in sand crabs has been recorded among sampling seasons at each location throughout the RFFHMP.
In general, the results of crab health examinations completed during P1 do not indicate any areas of concern at this time in terms of potential impacts on crab health from the Project’s dredging and spoil disposal activities.
Prepared for INPEX Cardno 62
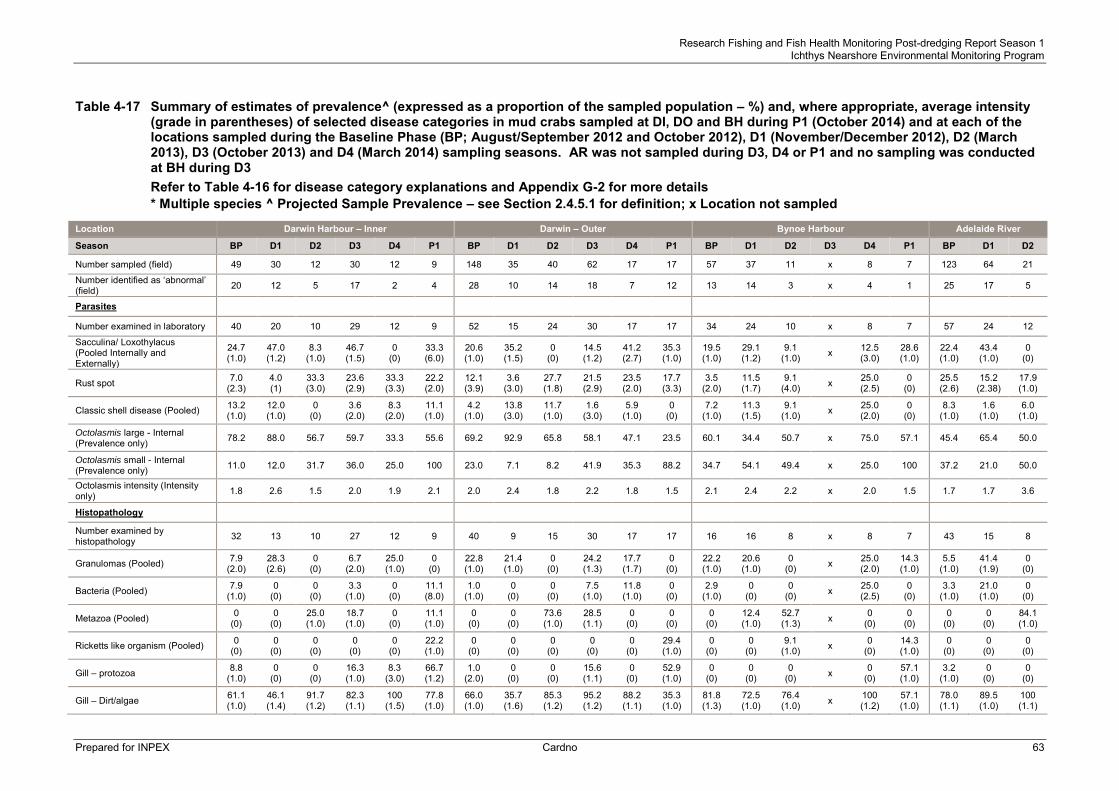
Research Fishing and Fish Health Monitoring Post-dredging Report Season 1 Ichthys Nearshore Environmental Monitoring Program
Table 4-17 Summary of estimates of prevalence^ (expressed as a proportion of the sampled population – %) and, where appropriate, average intensity (grade in parentheses) of selected disease categories in mud crabs sampled at DI, DO and BH during P1 (October 2014) and at each of the locations sampled during the Baseline Phase (BP; August/September 2012 and October 2012), D1 (November/December 2012), D2 (March 2013), D3 (October 2013) and D4 (March 2014) sampling seasons. AR was not sampled during D3, D4 or P1 and no sampling was conducted at BH during D3 Refer to Table 4-16 for disease category explanations and Appendix G-2 for more details * Multiple species ^ Projected Sample Prevalence – see Section 2.4.5.1 for definition; x Location not sampled
Location Darwin Harbour – Inner Darwin – Outer Bynoe Harbour Adelaide River
Season BP D1 D2 D3 D4 P1 BP D1 D2 D3 D4 P1 BP D1 D2 D3 D4 P1 BP D1 D2
Number sampled (field) 49 30 12 30 12 9 148 35 40 62 17 17 57 37 11 x 8 7 123 64 21
Number identified as ‘abnormal’ (field) 20 12 5 17 2 4 28 10 14 18 7 12 13 14 3 x 4 1 25 17 5
Parasites Number examined in laboratory 40 20 10 29 12 9 52 15 24 30 17 17 34 24 10 x 8 7 57 24 12
Sacculina/ Loxothylacus (Pooled Internally and Externally)
24.7 (1.0)
47.0 (1.2)
8.3 (1.0)
46.7 (1.5)
0 (0)
33.3 (6.0)
20.6 (1.0)
35.2 (1.5)
0 (0)
14.5 (1.2)
41.2 (2.7)
35.3 (1.0)
19.5 (1.0)
29.1 (1.2)
9.1 (1.0) x 12.5
(3.0) 28.6 (1.0)
22.4 (1.0)
43.4 (1.0)
0 (0)
Rust spot 7.0 (2.3)
4.0 (1)
33.3 (3.0)
23.6 (2.9)
33.3 (3.3)
22.2 (2.0)
12.1 (3.9)
3.6 (3.0)
27.7 (1.8)
21.5 (2.9)
23.5 (2.0)
17.7 (3.3)
3.5 (2.0)
11.5 (1.7)
9.1 (4.0) x 25.0
(2.5) 0
(0) 25.5 (2.6)
15.2 (2.38)
17.9 (1.0)
Classic shell disease (Pooled) 13.2 (1.0)
12.0 (1.0)
0 (0)
3.6 (2.0)
8.3 (2.0)
11.1 (1.0)
4.2 (1.0)
13.8 (3.0)
11.7 (1.0)
1.6 (3.0)
5.9 (1.0)
0 (0)
7.2 (1.0)
11.3 (1.5)
9.1 (1.0) x 25.0
(2.0) 0
(0) 8.3
(1.0) 1.6
(1.0) 6.0
(1.0)
Octolasmis large - Internal (Prevalence only) 78.2 88.0 56.7 59.7 33.3 55.6 69.2 92.9 65.8 58.1 47.1 23.5 60.1 34.4 50.7 x 75.0 57.1 45.4 65.4 50.0
Octolasmis small - Internal (Prevalence only) 11.0 12.0 31.7 36.0 25.0 100 23.0 7.1 8.2 41.9 35.3 88.2 34.7 54.1 49.4 x 25.0 100 37.2 21.0 50.0
Octolasmis intensity (Intensity only) 1.8 2.6 1.5 2.0 1.9 2.1 2.0 2.4 1.8 2.2 1.8 1.5 2.1 2.4 2.2 x 2.0 1.5 1.7 1.7 3.6
Histopathology Number examined by histopathology 32 13 10 27 12 9 40 9 15 30 17 17 16 16 8 x 8 7 43 15 8
Granulomas (Pooled) 7.9 (2.0)
28.3 (2.6)
0 (0)
6.7 (2.0)
25.0 (1.0)
0 (0)
22.8 (1.0)
21.4 (1.0)
0 (0)
24.2 (1.3)
17.7 (1.7)
0 (0)
22.2 (1.0)
20.6 (1.0)
0 (0) x 25.0
(2.0) 14.3 (1.0)
5.5 (1.0)
41.4 (1.9)
0 (0)
Bacteria (Pooled) 7.9 (1.0)
0 (0)
0 (0)
3.3 (1.0)
0 (0)
11.1 (8.0)
1.0 (1.0)
0 (0)
0 (0)
7.5 (1.0)
11.8 (1.0)
0 (0)
2.9 (1.0)
0 (0)
0 (0) x 25.0
(2.5) 0
(0) 3.3
(1.0) 21.0 (1.0)
0 (0)
Metazoa (Pooled) 0 (0)
0 (0)
25.0 (1.0)
18.7 (1.0)
0 (0)
11.1 (1.0)
0 (0)
0 (0)
73.6 (1.0)
28.5 (1.1)
0 (0)
0 (0)
0 (0)
12.4 (1.0)
52.7 (1.3) x 0
(0) 0
(0) 0
(0) 0
(0) 84.1 (1.0)
Ricketts like organism (Pooled) 0 (0)
0 (0)
0 (0)
0 (0)
0 (0)
22.2 (1.0)
0 (0)
0 (0)
0 (0)
0 (0)
0 (0)
29.4 (1.0)
0 (0)
0 (0)
9.1 (1.0) x 0
(0) 14.3 (1.0)
0 (0)
0 (0)
0 (0)
Gill – protozoa 8.8 (1.0)
0 (0)
0 (0)
16.3 (1.0)
8.3 (3.0)
66.7 (1.2)
1.0 (2.0)
0 (0)
0 (0)
15.6 (1.1)
0 (0)
52.9 (1.0)
0 (0)
0 (0)
0 (0) x 0
(0) 57.1 (1.0)
3.2 (1.0)
0 (0)
0 (0)
Gill – Dirt/algae 61.1 (1.0)
46.1 (1.4)
91.7 (1.2)
82.3 (1.1)
100 (1.5)
77.8 (1.0)
66.0 (1.0)
35.7 (1.6)
85.3 (1.2)
95.2 (1.2)
88.2 (1.1)
35.3 (1.0)
81.8 (1.3)
72.5 (1.0)
76.4 (1.0) x 100
(1.2) 57.1 (1.0)
78.0 (1.1)
89.5 (1.0)
100 (1.1)
Prepared for INPEX Cardno 63

Research Fishing and Fish Health Monitoring Post-dredging Report Season 1 Ichthys Nearshore Environmental Monitoring Program
Table 4-18 Summary of estimates of prevalence^ (expressed as a proportion of the sampled population – %) and, where appropriate, average intensity (grade in parentheses) of selected disease categories in sand crabs sampled at DI, DO and BH during P1 (October 2014) and at each of the locations sampled during the Baseline Phase (BP; August/September 2012 and October 2012), D1 (November/December 2012), D2 (March 2013), D3 (October 2013) and D4 (March 2014) sampling seasons. AR was not sampled during D3, D4 or P1 and no sampling was conducted at BH during D3 Refer to Table 4-16 for disease category explanations and Appendix G-2 for more details * Multiple species ^ Projected Sample Prevalence – see Section 2.4.5.1 for definition; x Location not sampled
Location Darwin Harbour – Inner Darwin – Outer Bynoe Harbour Adelaide River
Season BP D1 D2 D3 D4 P1 BP D1 D2 D3 D4 P1 BP D1 D2 D3 D4 P1 BP D1 D2
Number sampled (field) 89 38 59 18 20 28 23 14 7 19 34 7 37 21 18 x 2 8 19 0 0
Number identified as ‘abnormal’ (field) 6 4 3 2 3 2 3 2 0 1 3 0 0 1 2 x 0 1 2 0 0
Parasites Number examined in laboratory 20 7 20 17 20 12 13 6 7 15 34 7 16 8 13 x 2 8 9 0 0
Sacculina/ Loxothylacus (Pooled Internally and Externally)
7.7 (1.0)
2.6 (1.2)
0 (0)
0 (0)
0 (0)
40.7 (2.1)
8.7 (1.5)
14.3 (7.0)
0 (0)
0 (0)
0 (0)
42.9 (2.3)
0 (0)
13.6 (1.0)
0 (0) x 0
(0) 12.5 (1.0)
0 (0)
0 (0)
0 (0)
Rust spot 0 (0)
0 (0)
1.7 (1.0)
0 (0)
5.0 (1.0)
3.6 (2.0)
0 (0)
0 (0)
0 (0)
0 (0)
5.9 (1.0)
0 (0)
6.3 (3.0)
0 (0)
0 (0) x 0
(0) 0
(0) 0
(0) 0
(0) 0
(0)
Classic shell disease (Pooled) 24.2 (1.0)
8.0 (2.0)
25.7 (1.3)
11.5 (1.0)
10.0 (2.5)
3.6 (1.0)
0 (0)
31.4 (1.0)
0 (0)
6.8 (1.0)
5.9 (1.5)
0 (0)
18.8 (1.0)
59.2 (1.0)
13.6 (1.4) x 0
(0) 0
(0) 23.3 (1.0)
0 (0)
0 (0)
Octolasmis large - Internal (Prevalence only) 48.4 40.4 29.6 42.6 8.5 27.9 43.5 65.7 42.9 19.0 38.0 57.1 62.5 100 46.0 x 50.0 50 69.2 0 0
Octolasmis small - Internal (Prevalence only) 0 0 0 0 0 0 26.1 0 0 0 0 0 18.8 0 0 x 0 0 0 0 0
Octolasmis intensity (Intensity only) 1.1 1.1 1.0 1.0 1.0 1.8 1.0 1.3 1.0 1.0 1.0 1 1.2 1.1 1.0 x 1.0 1 1.2 0 0
Histopathology Number examined by histopathology 20 5 7 14 13 12 13 1 5 11 16 7 16 6 8 x 2 8 9 0 0
Granulomas (Pooled) 26.4 (1.0)
2.6 (1.0)
0 (0)
27.8 (1.3)
30.5 (1.3)
0 (0)
13.0 (1.0)
14.3 (1.0)
0 (0)
38.0 (1.5)
19.9 (1.0)
14.3 (1.0)
12.5 (1.0)
76.2 (1.3)
0 (0) x 0
(0) 0
(0) 5.3
(1.0) 0
(0) 0
(0)
Bacteria (Pooled) 11.0 (1.0)
0 (0)
1.7 (1.0)
0 (0)
18.5 (1.0)
0 (0)
0 (0)
0 (0)
20.0 (1.0)
9.5 (1.0)
7.0 (1.0)
0 (0)
6.3 (1.0)
23.8 (1.0)
0 (0) x 0
(0) 0
(0) 0
(0) 0
(0) 0
(0)
Metazoa (Pooled) 0 (0)
0 (0)
0 (0)
0 (0)
0 (0)
0 (0)
0 (0)
0 (0)
0 (0)
0 (0)
0 (0)
14.3 (1.0)
0 (0)
0 (0)
0 (0) x 0
(0) 0
(0) 0
(0) 0
(0) 0
(0)
Ricketts like organism (Pooled) 5.5 (1.0)
0 (0)
0 (0)
0 (0)
0 (0)
50 (1.7)
17.4 (2.0)
0 (0)
0 (0)
0 (0)
0 (0)
57.1 (2.0)
6.3 (1.0)
0 (0)
0 (0) x 0
(0) 62.5 (1.4)
0 (0)
0 (0)
0 (0)
Gill – protozoa 5.5 (1.0)
0 (0)
0 (0)
5.6 (1.0)
0 (0)
9.3 (1.0)
13.0 (1.0)
0 (0)
0 (0)
0 (0)
0 (0)
0 (0)
0 (0)
0 (0)
0 (0) x 0
(0) 12.5 (1.0)
0 (0)
0 (0)
0 (0)
Gill – Dirt/algae 0 (0)
5.3 (1.5)
1.7 (2.0)
7.4 (1.0)
25.5 (1.0)
90.7 (1.1)
4.4 (1.0)
0 (0)
0 (0)
0 (0)
10.0 (1.0)
85.7 (1.0)
0 (0)
0 (0)
14.8 (3.0) x 0
(0) 75
(1.0) 0
(0) 0
(0) 0
(0)
Prepared for INPEX Cardno 64

Research Fishing and Fish Health Monitoring Post-dredging Report Season 1 Ichthys Nearshore Environmental Monitoring Program
Figure 4-17 Prevalence of: A) Rust spot; and B) Loxothylacus/Sacculina in mud crabs examined at
DI, DO and BH during P1 (October 2014) and at each of the four sampling locations during the Baseline Phase (BP; August/September 2012 and October 2012), D1 (November/December 2012) D2 (March 2013), D3 (October 2013) and D4 (March 2014) sampling seasons
The number of samples examined at each location during each sampling season is presented along the x-axis. x Location not sampled
4.4.2.3 Size-Weight Relationships In the cases of blue tuskfish, goldspotted rockcod, grass emperor and barramundi sampled from DI, DO and BH during P1 there were no clear deviations from species-specific length-weight relationships derived from aggregated data collected from individuals retained for detailed post-field external and internal health examinations during Baseline Phase and Dredging Phase sampling seasons (Figure 4-18). Weight at length for the majority of golden snapper sampled during P1 was generally consistent with those recorded throughout the RFFHMP completed to date, with the exception being a single golden snapper from BH, which was heavy for its length (252 g at 19.4 cm LCF) and fell outside the general range of weights at length previously reported (Figure 4-18A). In addition, one stripey snapper at DO was light for its length (146 g at 26.2 cm LCF) and fell outside the general range previously reported (Figure 4-18F).
0
10
20
30
40
0
10
20
30
40
50
A) Rust spotBP (n = 377)
D1 (n = 166)
D2 (n = 84)
D3 (n = 92)
D4 (n = 37)
P1 (n = 33)
49 30 12 30 12 9 148 35 40 62 17 17 57 37 11 x 8 7 123 64 21 x x x
49 30 12 30 12 9 148 35 40 62 17 17 57 37 11 x 8 7 123 64 21 x x x
BP (n = 377)
D1 (n = 166)
D2 (n = 84)
D3 (n = 92)
D4 (n = 37)
P1 (n = 33)
B) Loxothylacus/Sacculina
DI DO BH AR
Control Locations
Prev
alen
ce
Prepared for INPEX Cardno 65
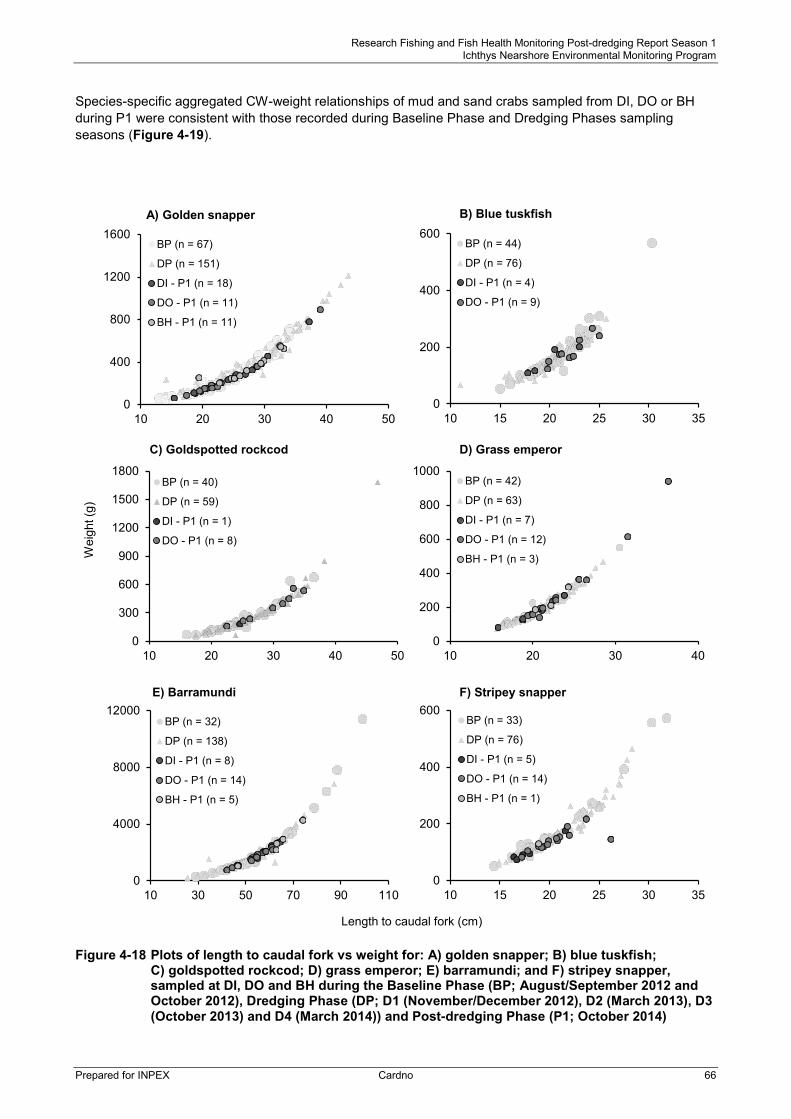
Research Fishing and Fish Health Monitoring Post-dredging Report Season 1 Ichthys Nearshore Environmental Monitoring Program
Species-specific aggregated CW-weight relationships of mud and sand crabs sampled from DI, DO or BH during P1 were consistent with those recorded during Baseline Phase and Dredging Phases sampling seasons (Figure 4-19).
Figure 4-18 Plots of length to caudal fork vs weight for: A) golden snapper; B) blue tuskfish;
C) goldspotted rockcod; D) grass emperor; E) barramundi; and F) stripey snapper, sampled at DI, DO and BH during the Baseline Phase (BP; August/September 2012 and October 2012), Dredging Phase (DP; D1 (November/December 2012), D2 (March 2013), D3 (October 2013) and D4 (March 2014)) and Post-dredging Phase (P1; October 2014)
Wei
ght (
g)
Length to caudal fork (cm)
A) Golden snapper
F) Stripey snapperE) Barramundi
D) Grass emperorC) Goldspotted rockcod
B) Blue tuskfish
0
400
800
1200
1600
10 20 30 40 50
BP (n = 67)
DP (n = 151)
DI - P1 (n = 18)
DO - P1 (n = 11)
BH - P1 (n = 11)
0
200
400
600
10 15 20 25 30 35
BP (n = 44)
DP (n = 76)
DI - P1 (n = 4)
DO - P1 (n = 9)
0
200
400
600
800
1000
10 20 30 40
BP (n = 42)
DP (n = 63)
DI - P1 (n = 7)
DO - P1 (n = 12)
BH - P1 (n = 3)
0
300
600
900
1200
1500
1800
10 20 30 40 50
BP (n = 40)
DP (n = 59)
DI - P1 (n = 1)
DO - P1 (n = 8)
0
200
400
600
10 15 20 25 30 35
BP (n = 33)
DP (n = 76)
DI - P1 (n = 5)
DO - P1 (n = 14)
BH - P1 (n = 1)
0
4000
8000
12000
10 30 50 70 90 110
BP (n = 32)
DP (n = 138)
DI - P1 (n = 8)
DO - P1 (n = 14)
BH - P1 (n = 5)
Prepared for INPEX Cardno 66

Research Fishing and Fish Health Monitoring Post-dredging Report Season 1 Ichthys Nearshore Environmental Monitoring Program
Figure 4-19 Plots of carapace width vs weight (raw data) for: A) male mud crabs; B) female mud
crabs; and C) male sand crabs, sampled at DI, DO and BH during the Baseline Phase (BP; August/September 2012 and October 2012), Dredging Phase (DP; D1 (November/December 2012), D2 (March 2013), D3 (October 2013) and D4 (March 2014)) and Post-dredging Phase (P1; October 2014)
Both mud crab and sand crab groupings consist of an aggregate of species
Wei
ght (
g)
Wei
ght (
g)
Carapace width (cm)
C) Sand crab - male
B) Mud crab - femaleA) Mud crab - male
0
300
600
900
1200
1500
1800
8 10 12 14 16 18 20
BP (n = 67)
DP (n = 119)
DI - P1 (n = 3)
DO - P1 (n = 8)
BH - P1 (n = 3)
0
300
600
900
1200
1500
1800
8 10 12 14 16 18 20
BP (n = 77)
DP (n = 107)
DI - P1 (n = 6)
DO - P1 (n = 9)
BH - P1 (n = 4)
0
100
200
300
400
8 9 10 11 12 13 14 15 16 17
BP (n = 49)
DP (n = 114)
DI - P1 (n = 18)
DO - P1 (n = 5)
BH - P1 (n = 6)
Prepared for INPEX Cardno 67

Research Fishing and Fish Health Monitoring Post-dredging Report Season 1 Ichthys Nearshore Environmental Monitoring Program
5 Discussion
As part of the Recreational Fishing and Fish Health Monitoring Program, the RFFHMP has been undertaken to investigate the potential for effects from Project dredging and construction activities on indicators of fish abundance (i.e. catch rates and compositions) as well as the health of finfish and crustaceans (prevalence and intensity of infections). Sampling activities associated with the RFFHMP have been undertaken at two locations within the Darwin region and when practicable at Bynoe Harbour and Adelaide River. RFFHMP sampling was conducted periodically during the Dredging Phase and to date once during the Post-dredging Phase of the Project, with data obtained compared with those collected during the Baseline Phase in August/September 2012 and October 2012 prior to the commencement of EA CSD activities (November 2012).
Dredging Phase monitoring included sampling during Season One dredging (November 2012 to April 2013) late-dry (D1 – November/December 2013) and the end of the 2012/2013 wet season (D2 – March 2013); during the 2013 dry season dredging hiatus (D3 – October 2013); and during Season Two EA and GEP dredging near the end of the 2013/2014 wet season (D4 – March 2014). Post-dredging sampling (P1: October 2014) commenced approximately four months and three months after the completion of Season Two EA dredging (11 June 2014) and GEP dredging (12 July 2014) activities respectively.
Monitoring during the Dredging Phase investigated the potential short- (D1), medium- (D2) and longer-term (D3 and D4) changes to research fishing and fish health indicators that could potentially be attributed to Project dredging and/or spoil disposal activities. Data collected during P1 provided a means to investigate potential short to medium-term changes in these research fishing and fish health indicators since the completion of dredging activities as well as a direct comparison to the Baseline Phase sampling seasons.
Research Fishing 5.1
Research Angling 5.1.1
Results of RA catches from the first Post-dredging sampling season undertaken approximately four months and three months following the cessation of Season Two EA dredging and GEP dredging activities respectively provided no evidence to indicate Project dredging or construction activities affected finfish species diversity, abundance or catchability. Spatial and temporal differences in the catch composition and abundance of fish caught (CPUE) among sampling seasons were however detected as part of the RFFHMP. The catch composition at DO across all the sampling seasons compared to date (B2, D1, D2, D3, D4 and P1) was significantly different from that recorded at DI and BH. This difference resulted from higher catch rates of golden snapper and javelin fish at DI and BH compared to DO while blue tuskfish and stripey snapper were more frequently caught at DO compared to at DI and BH. Differences in the catch rates of these species between locations are likely to reflect species-specific habitat preferences (e.g. depth) and/or other ecological factors such as food availability, migration patterns or physiological tolerances to changing environmental conditions (Stoner 2004). Furthermore, factors related to differences in the angling success rates caused by habitat dissimilarities among the sampling locations could also have contributed to these differences.
Temporal variability detected in catches pooled among locations was primarily related to differences in catches between D4 (‘wet’) sampling season and B2, D1 and P1 (‘dry’) sampling seasons. Differences in catches between these climatic seasons was primarily driven by the absence of Moses snapper in D4 catches and differences in the frequency blue tuskfish, golden snapper and javelin fish were caught between wet (D4) compared to dry (B2, D1 and P1) sampling seasons. Sheaves and Molony (2001) reported that seasonal changes in the probability of Moses snapper being captured in tropical estuaries on the east coast of Australia are probably related to recruitment, growth, mortality as well as migratory patterns. The processes influencing Moses snapper catches in the Darwin region remain unclear however it is likely that they would be influenced by similar factors to those reported on the east coast of Australia. It is likely that similar species specific processes influence the frequency blue tuskfish, golden snapper and javelin fish are caught. Differences in catch rates between the 2013 and 2014 wet season sampling seasons (i.e. D2 and D4) have also been detected as part of the RFFHMP (Cardno 2013g, 2014a). Differences in the catch rates
Prepared for INPEX Cardno 68

Research Fishing and Fish Health Monitoring Post-dredging Report Season 1 Ichthys Nearshore Environmental Monitoring Program
recorded between these wet seasons was attributed to differences in sampling conditions, which were poor during D2 following the transit of tropical cyclones Narelle and Rusty and favourable during D4. Additional wet season Post-dredging sampling will provide the opportunity to further examine the influence of climatic seasonality on catch compositions and catch rates within the Darwin region.
During P1 there was substantial variability in the catch rates of all finfish species among fishing trips within each location and among locations. The variability in catches during P1 was similar to that recorded during Baseline Phase and Dredging Phase sampling seasons. Furthermore, substantial variability in catches has consistently been reported by recreational fishers within the Darwin region (Cardno 2014f). Such findings highlight the inherent natural spatial and temporal variability in abundance and catchability of wild finfish.
Research Potting 5.1.2
Research potting conducted during P1 and previous sampling seasons has provided no evidence to suggest Project dredging or construction activities have had an effect on the catch rates of ‘all animals’, mud crabs, sand crabs or overall species diversity. During P1, significantly more species were caught using standardised crab potting equipment at DI and DO compared to BH, a result consistent with all previous sampling seasons. In addition, the catch rates of all animals have been significantly different among all locations with the highest catches being consistently recorded at DO while the lowest catches have been recorded at BH. These results indicate while disparate spatial catch characteristics exist, these differences appear to be stable through time. These differences in catches are likely influenced by the unique habitat characteristics at each location.
During P1 the catch rate of mud crabs was significantly higher at DO compared to at DI and BH. Such results are comparable with results during the Baseline Phase and Dredging Phase sampling seasons (Cardno 2013c, 2014b). A significant reduction in the catch rates of mud crabs at all locations was also evident during P1 and D4 compared with all previous Dredging Phase and Baseline Phase sampling seasons. Reported recreational fisher catches of mud crabs in Darwin and surrounding waters have also generally declined over the corresponding temporal period (Cardno 2014f). There is no evidence to suggest these results are related to Project dredging or construction activities rather they have likely been influenced by natural variability in mud crab abundances (or catchability) occurring at large spatial scales. Moreover, mud crabs are frequently targeted by recreational fishers in the Northern Territory (Coleman 1998, 2004; Cardno 2014a). As crab potting sites sampled during the RFFHMP are in close proximity to relatively heavily populated areas, the reduction in catches recorded during D4 and P1 compared to previous sampling seasons may also be associated with temporal changes in localised fishing pressure.
The catch rate of sand crabs during P1 and during previous Baseline Phase and Dredging Phase sampling seasons was significantly higher at DI compared to DO and BH. This spatial pattern may be the result of intrinsic differences between the sampling locations in biotic (e.g. predation, food availability) and abiotic (e.g. shelter, depth) factors. Furthermore, the general temporal stability of sand crab catches at each location indicates that dissimilar climatic seasons do not affect catch rates.
Size-class Frequency of Finfish and Crabs 5.2With the exceptions of barramundi and mud crab, the size structure of P1 catches in DI was generally similar to that of Baseline Phase catches for all finfish and crab species analysed indicating that there is no evidence to suggest Project dredging and construction activities have influenced the size structure of these species. Differences in the size structure of barramundi caught at DI was likely due to a greater proportion of smaller individuals being caught during P1 compared to during the Baseline Phase. During the Baseline Phase supplementary cast netting and targeted angling sampling techniques were used while no cast netting or targeted angling was conducted during P1. As such, the current significant difference in the size structure of barramundi sampled at DI during Baseline Phase and P1 was likely the result of gear selectivity rather than changes in the size structure of barramundi populations.
Significant differences in the size structure of mud crab catches at DI between P1 and the Baseline Phase were associated with the absence of individuals smaller than 14 cm CW during P1. Small crabs were also generally absent from mud crab catches at BH during P1. These results indicate that the size structure of mud crabs in the Darwin region has likely been influenced by large-scale processes and not Project related dredging activities. Dissimilarity in the size structure of mud crabs sampled at DI and BH compared to those
Prepared for INPEX Cardno 69

Research Fishing and Fish Health Monitoring Post-dredging Report Season 1 Ichthys Nearshore Environmental Monitoring Program
sampled at DO during P1 provide further evidence to suggest specific ecological factors such as food availability, migratory patterns, physiological tolerances and intrinsic habitat characteristics have likely influenced the abundance of smaller individuals.
In general, it is natural spatial and temporal variability in abundance, distribution and/or catchability of finfish and crabs rather than any potential effects of Project dredging that are driving the observed variability in size structures of RA and RP catches. This is supported by the lack of clear patterns of differences in the size-class frequency distributions of the main target species catches measured through time across all four locations.
Female mud crabs dominated catches of this species at all locations during P1 which is consistent to that recorded during previous climatically comparable ‘dry’ season sampling seasons (B2, D1 and D3). In contrast, during wet season sampling seasons (D2 and D4) male mud crabs have dominated catches. This pattern is expected given the well-known and documented natural seaward migration of female mud crabs during the wet season (Brick 1974; Hyland et al. 1984; Heasman et al. 1985; Moser et al. 2002; Grubert and Phelan 2007). These results indicate that Project dredging and construction activities have not influenced seasonally related shifts in the sex ratio of mud crabs within the Darwin region and by extension, the established migratory behaviours of this crab species.
Fish and Crab Health 5.3Field based observations and extensive laboratory examination of finfish and crab species during P1 did not reveal any areas of particular concern regarding the types of externally visible abnormalities or health problems associated with the prevalence and intensity of parasitic and histopathological infections. The types and frequency of visible abnormalities and the suite of parasites and histopathological infections recorded during P1 were consistent with those previously recorded during Baseline Phase and Dredging Phase sampling seasons. The most frequent abnormalities in finfish observed and recorded in the field during P1 were the presence of macroscopic parasites (ectoparasitic isopods and copepods, and philometrid nematodes) and external haemorrhages. In the cases of crabs, rust spot and the parasitic Loxothylacus/Sacculina barnacle (Rhizocephalan-infections) were the most frequent abnormalities observed and recorded in the field. The visually apparent abnormalities recorded during P1 and previous sampling seasons are similar to those reported by recreational fishers as part of the APS (fishery dependent) component of the Recreational Fishing and Fish Health Monitoring Program (Cardno 2014a,f). This indicates that the fishery-dependent and fishery-independent (RFFHMP) data collection methods have provided complementary means of monitoring aspects of fish and crab health within Darwin Harbour through time.
Finfish Parasites and Other Infections 5.3.1
During P1, the proportion of all finfish in catches (species combined) classified in the field as displaying signs of abnormality (i.e. the presence of macroscopic parasites, lesions and/or discolourations) was low ranging between 0.5% and 2.7% among the locations sampled. The proportion of fish classified as being ‘abnormal’ during P1 at each location was similar to that recorded during the Baseline Phase (Cardno 2013c) and generally lower than that recorded during Dredging Phase sampling seasons (Cardno 2014b). The types of abnormalities recorded in fish sampled from DI and DO during P1 (i.e. ectoparasitic isopods and copepods as well as philometrid nematodes) were not notably dissimilar from those previously recorded across all Darwin Harbour and Control locations during the Baseline Phase (Cardno 2013c). In addition, the intensity of external macroscopic parasite infections observed on fish in the field during P1 and throughout the Baseline Phase and Dredging Phase sampling seasons at each location has been relatively low (i.e. one or two parasites recorded per individual). Such low parasite loads indicate that the host is unlikely to have a reduced immuno-response and the parasites are unlikely to be having significant deleterious effects on the individual. These results suggest that the current observations likely represent natural processes and can therefore be considered within the normal natural range for finfish within the Darwin region.
Fish classified as ‘normal’ and ‘abnormal’ in the field and subsequently examined in the laboratory during P1 were all found to be host to a diverse range of internal and external parasites and infections (Appendix F and G). The suite of internal and external parasites and infections recorded during P1 was generally similar to those previously recorded during Baseline Phase and Dredging Phase sampling seasons with many samples collected to date likely to be new to science (Appendix F). Throughout the RFFHMP, trends in the
Prepared for INPEX Cardno 70

Research Fishing and Fish Health Monitoring Post-dredging Report Season 1 Ichthys Nearshore Environmental Monitoring Program
prevalence and intensity of infection for a range of heteroxenous parasites (i.e. parasites with complex lifecycles including intermediate host/s and/or ecological pathways), such as metazoan parasites in organs and monoxeneous parasites (i.e. parasites with a direct lifecycle in only one host), such as dactylogyrid monogenean worms, have been tracked as a means to monitor potential changes in fish health and associated multi-host ecological pathways.
For golden snapper, barramundi and goldspotted rockcod (finfish species frequently examined within the laboratory) the trends in the prevalence and intensity of infection of metazoan parasites have provided no evidence to indicate a disruption of natural complex multi-host lifecycles and subsequent health implications for these species. For example the prevalence and intensity of metazoa in golden snapper sampled from DI during P1 (prevalence: 66.7% and mean intensity: 1.1) were similar to that recorded during Baseline Phase sampling (prevalence: 44.9% and mean intensity: 1.0). In addition, the prevalence and intensity of metazoa in golden snapper sampled during P1 at BH (prevalence: 57.7% and mean intensity: 1.0) was similar to that recorded at DI. Moreover, despite some variability throughout the Dredging Phase sampling seasons, during P1 the prevalence and intensity of metazoa in sampled barramundi from DI (prevalence: 50.0% and mean intensity: 1.3) and DO (prevalence: 44.4% and mean intensity: 1.0) were comparable to levels recorded during the Baseline Phase (DI: prevalence: 55.0% and mean intensity: 1.6 and DO: prevalence: 54.6% and mean intensity: 1.3). Given the complex life-history characteristics of heteroxenous parasites, these results suggest that within Darwin Harbour and surrounding waters, the intermediate host/s and/or ecological pathways required to facilitate infection in a range of species have to date remained generally stable. Further sampling, scheduled for March 2015, will provide additional longer-term insight into stability or volatility of these parasite infections within the Darwin region.
The prevalence and intensity of infection of dactylogyrid monogeneans (monoxeneous parasite) in barramundi and golden snapper during P1 was similar between DI, DO and BH. Generally these levels were higher than those recorded during the Baseline Phase (with the exception of the intensity of infection for golden snapper at DO during P1 (18.3) which was lower than during the Baseline Phase (26.1)) however similar to those recorded at Control locations during the Dredging Phase. As has been reported during previous sampling seasons, during P1 the prevalence and intensity of dactylogyrid monogeneans infections in golden snapper and barramundi as well as the other finfish species examined with the laboratory (Appendix G-1) did not provide any evidence of conspicuous immuno-suppression or ‘ill-health’ and it is unlikely that the levels of infection intensity recorded are of particular concern.
During D4, the mean intensity of dactylogyrid monogeneans infections in barramundi at DI was 109.6, substantially higher than recorded during P1 (53.4) and previous sampling seasons at DI (ranging between 9.0 during the Baseline Phase to 77.1 during D3). The mean intensity of infection at DI was also higher than that recorded to date at DO (range: 5.0 to 75.0) and at Control locations (BH range: 0 to 61.2 and AR range: 5 to 55.3). Intensity of infections of parasites with direct modes of transmission such as dactylogyrid monogeneans can be strongly correlated to temperature and salinity (Landsberg et al. 1998; Bayoumy et al. 2008; Madanire-Moyo 2012) which are different between wet and dry season within the Darwin region. The influence of these two environmental factors alone does not however explain the high level of infection intensity observed during D4 at all sampled locations and differential levels of infection throughout the Dredging Phase sampling seasons. Such environmental factors may however partly explain the difference in this health parameter recorded between P1 and D4. It remains unclear however how environmental factors may influence the prevalence and intensity of dactylogyrid monogeneans infections in barramundi with the Darwin region. No conspicuous signs of ill-health were associated with the increased mean intensity of dactylogyrid monogeneans infections in barramundi at DI during D4 or P1. The scheduled Post-dredging survey during similar climatic seasons (i.e. wet season 2015) will provide an indication as to whether the high levels recorded during D4 at all sampled locations were an anomaly or if these levels persist during climatically similar seasons.
The prevalence of granulomas (usually associated with chronic inflammation and infection) has been considerably variable between frequently sampled species (golden snapper, barramundi and goldspotted rockcod) and all sampling seasons (P1, Baseline Phase and Dredging Phase). During the RFFHMP, the prevalence of granulomas in golden snapper has remained below 25.0% at all locations while for goldspotted rockcod the prevalence has ranged between 12.5% at DO during D3 and 83.3% at BH during D4. The prevalence of granulomas in barramundi has been consistently the highest of these three species ranging between 40.0% at DO during D1 and 100% at all locations (including Control locations) during various
Prepared for INPEX Cardno 71
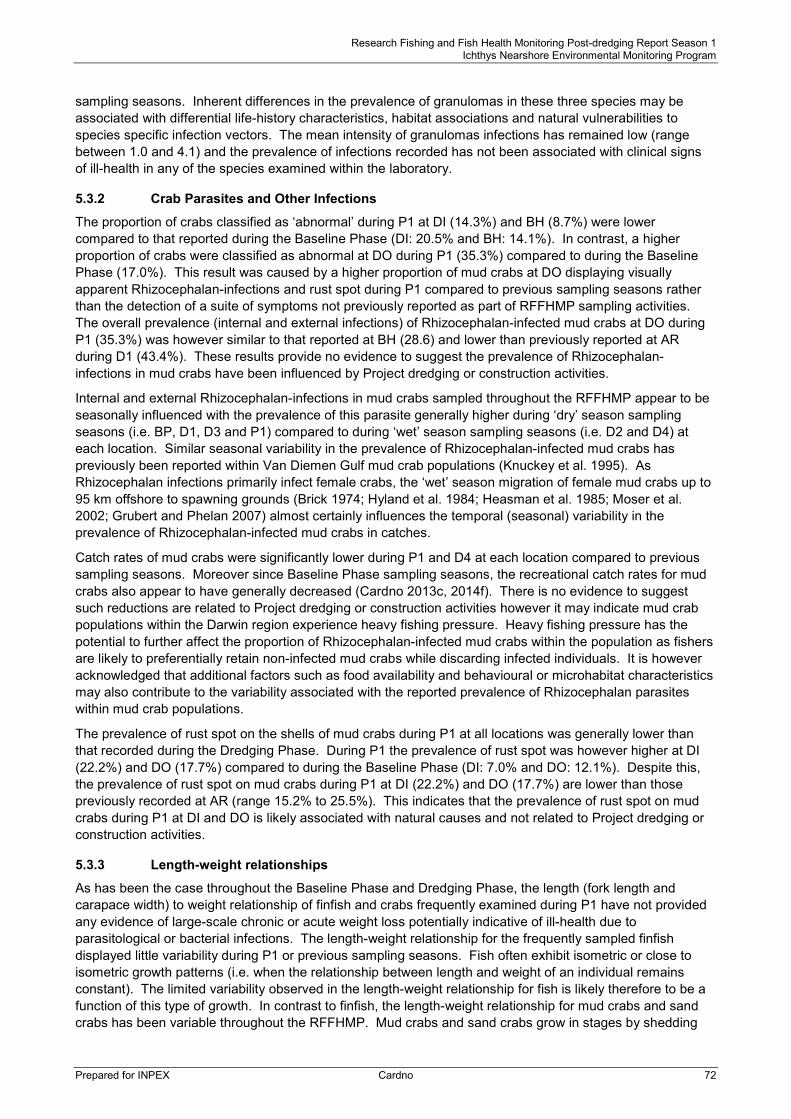
Research Fishing and Fish Health Monitoring Post-dredging Report Season 1 Ichthys Nearshore Environmental Monitoring Program
sampling seasons. Inherent differences in the prevalence of granulomas in these three species may be associated with differential life-history characteristics, habitat associations and natural vulnerabilities to species specific infection vectors. The mean intensity of granulomas infections has remained low (range between 1.0 and 4.1) and the prevalence of infections recorded has not been associated with clinical signs of ill-health in any of the species examined within the laboratory.
Crab Parasites and Other Infections 5.3.2
The proportion of crabs classified as ‘abnormal’ during P1 at DI (14.3%) and BH (8.7%) were lower compared to that reported during the Baseline Phase (DI: 20.5% and BH: 14.1%). In contrast, a higher proportion of crabs were classified as abnormal at DO during P1 (35.3%) compared to during the Baseline Phase (17.0%). This result was caused by a higher proportion of mud crabs at DO displaying visually apparent Rhizocephalan-infections and rust spot during P1 compared to previous sampling seasons rather than the detection of a suite of symptoms not previously reported as part of RFFHMP sampling activities. The overall prevalence (internal and external infections) of Rhizocephalan-infected mud crabs at DO during P1 (35.3%) was however similar to that reported at BH (28.6) and lower than previously reported at AR during D1 (43.4%). These results provide no evidence to suggest the prevalence of Rhizocephalan-infections in mud crabs have been influenced by Project dredging or construction activities.
Internal and external Rhizocephalan-infections in mud crabs sampled throughout the RFFHMP appear to be seasonally influenced with the prevalence of this parasite generally higher during ‘dry’ season sampling seasons (i.e. BP, D1, D3 and P1) compared to during ‘wet’ season sampling seasons (i.e. D2 and D4) at each location. Similar seasonal variability in the prevalence of Rhizocephalan-infected mud crabs has previously been reported within Van Diemen Gulf mud crab populations (Knuckey et al. 1995). As Rhizocephalan infections primarily infect female crabs, the ‘wet’ season migration of female mud crabs up to 95 km offshore to spawning grounds (Brick 1974; Hyland et al. 1984; Heasman et al. 1985; Moser et al. 2002; Grubert and Phelan 2007) almost certainly influences the temporal (seasonal) variability in the prevalence of Rhizocephalan-infected mud crabs in catches.
Catch rates of mud crabs were significantly lower during P1 and D4 at each location compared to previous sampling seasons. Moreover since Baseline Phase sampling seasons, the recreational catch rates for mud crabs also appear to have generally decreased (Cardno 2013c, 2014f). There is no evidence to suggest such reductions are related to Project dredging or construction activities however it may indicate mud crab populations within the Darwin region experience heavy fishing pressure. Heavy fishing pressure has the potential to further affect the proportion of Rhizocephalan-infected mud crabs within the population as fishers are likely to preferentially retain non-infected mud crabs while discarding infected individuals. It is however acknowledged that additional factors such as food availability and behavioural or microhabitat characteristics may also contribute to the variability associated with the reported prevalence of Rhizocephalan parasites within mud crab populations.
The prevalence of rust spot on the shells of mud crabs during P1 at all locations was generally lower than that recorded during the Dredging Phase. During P1 the prevalence of rust spot was however higher at DI (22.2%) and DO (17.7%) compared to during the Baseline Phase (DI: 7.0% and DO: 12.1%). Despite this, the prevalence of rust spot on mud crabs during P1 at DI (22.2%) and DO (17.7%) are lower than those previously recorded at AR (range 15.2% to 25.5%). This indicates that the prevalence of rust spot on mud crabs during P1 at DI and DO is likely associated with natural causes and not related to Project dredging or construction activities.
Length-weight relationships 5.3.3
As has been the case throughout the Baseline Phase and Dredging Phase, the length (fork length and carapace width) to weight relationship of finfish and crabs frequently examined during P1 have not provided any evidence of large-scale chronic or acute weight loss potentially indicative of ill-health due to parasitological or bacterial infections. The length-weight relationship for the frequently sampled finfish displayed little variability during P1 or previous sampling seasons. Fish often exhibit isometric or close to isometric growth patterns (i.e. when the relationship between length and weight of an individual remains constant). The limited variability observed in the length-weight relationship for fish is likely therefore to be a function of this type of growth. In contrast to finfish, the length-weight relationship for mud crabs and sand crabs has been variable throughout the RFFHMP. Mud crabs and sand crabs grow in stages by shedding
Prepared for INPEX Cardno 72
Research Fishing and Fish Health Monitoring Post-dredging Report Season 1 Ichthys Nearshore Environmental Monitoring Program
their external carapace and creating a new larger carapace (Brown 1993). Soft internal tissue subsequently grows and expands into the new larger carapace. During the process of internal soft tissue growth the weight of an individual can fluctuate without corresponding changes in carapace size. This life history characteristic of crabs has most likely resulted in the higher variability in the length-weight relationships recorded for crabs compared to the finfish species examined as part of the RFFHMP. Overall, there is no evidence to indicate that Project activities have detrimentally affected the general health of the finfish and crabs sampled in Darwin Harbour locations during P1 which is consistent with previous Baseline Phase and Dredging Phase sampling seasons.
Prepared for INPEX Cardno 73

Research Fishing and Fish Health Monitoring Post-dredging Report Season 1 Ichthys Nearshore Environmental Monitoring Program
6 Conclusions
The first RFFHMP sampling season completed approximately four months and three months after the cessation of EA and GEP dredging activities respectively found no evidence to suggest that dredging or construction activities associated with the Project has affected the quality of recreational fishing or fish health in Darwin Harbour. As per Baseline and Dredging Phase sampling seasons, substantial variability in catch rates of frequently caught species such as golden snapper, stripey snapper and blue tuskfish were recorded during P1. Moreover, spatial and temporal differences in the catch rates of some fish and crab species reported during previous sampling seasons were apparent during P1. Notwithstanding, P1 sampling provided additional evidence to suggest the catch rates of some finfish and crab species are influenced by climatic seasonality (e.g. ‘wet’ vs ‘dry’ season), habitat characteristics as well as large-scale oceanic processes.
The types and frequency of visible abnormalities and the suite of parasites and histopathological infections recorded during P1 were consistent with those previously recorded during Baseline and Dredging Phase sampling seasons. The most frequent abnormalities in finfish observed and recorded in the field during P1 were the presence of macroscopic parasites (ectoparasitic isopods and copepods, and philometrid nematodes) and external haemorrhages. In the cases of crabs, rust spot and the parasitic Loxothylacus/Sacculina barnacle (Rhizocephalan-infections) were the most frequent abnormalities observed and recorded in the field. During P1, the prevalence and intensity of infection of a range of heteroxenous parasites and monoxeneous parasites recorded coupled with the lack of conspicuous signs of ill-health or immuno-suppression provides no evidence to indicate Project dredging or construction activities have affected the health of finfish or crabs in and around Darwin waters.
Sampling as part of the RFFHMP at different stages throughout the Projects dredging activities provided a means to investigate potential short, medium and longer term impacts on fish health and the quality of recreational fishing in Darwin Harbour. Similarly, the first Post-dredging sampling season examined potential short term changes in these parameters following the cessation of Project dredging activities. Post-dredge monitoring scheduled for March 2015 (wet season) will provide a means to examine, compare and understand the characteristics of these parameters over a longer timescale and between different climatic seasons following the cessation of Project dredging activities.
Prepared for INPEX Cardno 74
Research Fishing and Fish Health Monitoring Post-dredging Report Season 1 Ichthys Nearshore Environmental Monitoring Program
7 Acknowledgements
This report was written by Dr Lachlan Barnes, Dr Andrea Nicastro and Blaise Bratter, with additional contributions from Dr Will Macbeth, Dr Ben Diggles and Dr Marcus Lincoln Smith. The report was reviewed by Dr Isabel Jimenez and produced by Freya Muller.
Figures, tables and appendices were prepared by Dr Lachlan Barnes, Blaise Bratter and Dr Andrea Nicastro. GIS support was provided by Shani Archer.
Fieldwork for the P1 sampling season was undertaken by Dr Lachlan Barnes, Blaise Bratter and Dr Ben Diggles. NT Fisheries staff Dr Thor Saunders, Quentin Allsop, Wayne Baldwin, Chris Errity, Jonathan Taylor, Jamie Alonso and Nathan Croft provided sampling vessels, skippers and expertise vital to the successful execution of the field sampling, as well as the Berrimah Farm laboratory to which samples were taken and preliminarily analysed. Fieldwork was assisted by Jane Melvin from INPEX in Darwin Harbour and Kenbi rangers Steve Brown, Rex Edmonds and Simon Moreen in Bynoe Harbour.
Fish Health laboratory work was carried out by Dr Ben Diggles (DigsFish Services Pty Ltd).
Logistical and communications support during P1 field sampling was provided by Erica Griffiths based in Sydney; Todd Sinclair and Tom Rees at the Cardno office in Darwin; and Skye Stevens based in Perth.
Prepared for INPEX Cardno 75

Research Fishing and Fish Health Monitoring Post-dredging Report Season 1 Ichthys Nearshore Environmental Monitoring Program
8 References Anderson, M.J. (2001). A new method for non-parametric multivariate analysis of variance. Austral Ecology 26, pp. 32-46.
Anderson, M. J., Gorley, R. N. and Clarke, K. R. (2008). PERMANOVA+ for PRIMER: Guide to Software and Statistical Methods. PRIMER-E: Plymouth, UK.
Bayoumy, E.M., Osman, H.A.M., El-Bana, L.F. and Hassanain, M.A. (2008). Monogenean parasites as bioindicators for heavy metals status in some Egyptian Red Sea fishes. Global Veterinaria 2(3), pp 117-122.
Brick, R.W. (1974). Effects of water quality, antibiotics, phytoplankton and food on survival and development of larvae of Scylla serrata (Crustacea: Portunidae). Aquaculture 3, pp 231-244.
Brown, I.W. (1993). Mangrove Crabs, pp 609-642 in A. Wright and L. Hill (eds). Nearshore Marine Resources of the South Pacific. Institute of Pacific Studies (Suva), Forum Fisheries Agency (Honiara) and the International Centre for Ocean Development (Canada), 710p.
Cardno (2013a). Recreational Fishing Monitoring Program Baseline Report Season 1, Ichthys Nearshore Environmental Monitoring Program. Prepared for INPEX by Cardno NSW/ACT.
Cardno (2013b). Research Fishing and Fish Health Monitoring Program Baseline Report Season 1, Ichthys Nearshore Environmental Monitoring Program. Prepared for INPEX by Cardno NSW/ACT.
Cardno (2013c). Research Fishing and Fish Health Monitoring Program Baseline Report Season 2, Ichthys Nearshore Environmental Monitoring Program. Prepared for INPEX by Cardno NSW/ACT.
Cardno (2013d). Recreational Fishing Monitoring Program Baseline Report Season 2, Ichthys Nearshore Environmental Monitoring Program. Prepared for INPEX by Cardno NSW/ACT.
Cardno (2013e). Research Fishing and Fish Health Monitoring Program Dredging Report Season 1, Ichthys Nearshore Environmental Monitoring Program. Prepared for INPEX by Cardno NSW/ACT.
Cardno (2013f). Recreational Fishing Monitoring Program Dredging Report Season 1, Ichthys Nearshore Environmental Monitoring Program. Prepared for INPEX by Cardno NSW/ACT.
Cardno (2013g). Research Fishing and Fish Health Monitoring Program Dredging Report Season 2, Ichthys Nearshore Environmental Monitoring Program. Prepared for INPEX by Cardno NSW/ACT.
Cardno (2013h). Recreational Fishing Monitoring Program Dredging Report Season 2, Ichthys Nearshore Environmental Monitoring Program. Prepared for INPEX by Cardno NSW/ACT.
Cardno (2013i). Research Fishing and Fish Health Monitoring Program Dredging Report Season 3, Ichthys Nearshore Environmental Monitoring Program. Prepared for INPEX by Cardno NSW/ACT.
Cardno (2014a). Recreational Fishing Monitoring Program End of Dredging Report, Ichthys Nearshore Environmental Monitoring Program. Prepared for INPEX by Cardno NSW/ACT.
Cardno (2014b). Research Fishing and Fish Health Monitoring Program End of Dredging Report, Ichthys Nearshore Environmental Monitoring Program. Prepared for INPEX by Cardno NSW/ACT.
Cardno (2014c). Nearshore Environmental Monitoring Plan (Rev 5). Cardno (NSW/ACT) Pty Ltd, Sydney.Cardno (2014d). Fish Monitoring Method Statement (Cardno internal document only).
Cardno (2014e). Routine Marine Pests Monitoring Report - Dredging Report 3, Ichthys Nearshore Environmental Monitoring Program. Prepared for INPEX by Cardno NSW/ACT.
Cardno (2014f). Recreational Fishing Monitoring Program Post - Dredging Report, Ichthys Nearshore Environmental Monitoring Program. Prepared for INPEX by Cardno NSW/ACT.
Clarke, K.R. and Warwick, R.M. (2001). Changes in marine communities: an approach to statistical analysis and interpretation. 2nd edition. PRIMER-E Ltd, Plymouth.
Coleman, A.P.M. (1998). FISHCOUNT: a survey of recreational fishing in the NT. Fishery Report No. 43, Northern Territory Government. August 1998.
Coleman, A.P.M. (2004). The National Recreational Fishing Survey: The Northern Territory. Fisheries Group, Industry and Resource Development, Darwin, NT. February 2004.
Ferro, R.S.T. and Xu, l. (1996). An investigation of three methods of mesh size measurement. Fisheries Research 25, pp. 175-190.
Gladstone Fish Health Scientific Advisory Panel (2012). Final report to Minister for Main Roads, Fisheries and Marine Infrastructure, Queensland Government, 5 January 2012. 47 pp.
Prepared for INPEX Cardno 76

Research Fishing and Fish Health Monitoring Post-dredging Report Season 1 Ichthys Nearshore Environmental Monitoring Program
Grubert, M. and Phelan, M. (2007). Muddled muddies. A look at the mud crab parasite Loxothylacus ihlei. Fishnote 13, Department of Primary Industry, Fisheries and Mines, NT Government.
Grubert, M., Saunders, T., Martin, J., Lee, H. and Walters, C. (2013). Stock Assessment of Selected Northern Territory Fishes. Department of Primary Industry and Fisheries, NT Government.
Heasman, M.P., Fielder, D.R. and Shepherd, R.K. (1985). Mating and spawning in mud crab Scylla serrata (Forskal) (Decapoda: Portunidae), in Morton Bay, Queensland. Australian Journal of Marine and Freshwater Research 36, pp 773-783.
Hyland, S.J., Hill, B.J. and Lee, C.P (1984). Movement within and between different habitats by the portunid crab Scylla serrata. Marine Biology 80, pp. 57-61.
INPEX (2011). Ichthys Gas Field Development Project- Draft Environmental Impact Statement. INPEX Operations Australia Pty Ltd.
INPEX (2013a). Dredging and Spoil Disposal Management Plan – East Arm (Rev 4). INPEX Operations Australia Pty Ltd.
INPEX (2014). Dredging and Spoil Disposal Management Plan – Gas Export Pipeline (Rev 7). INPEX Operations Australia Pty Ltd.
Knuckey, I.A., Davie, P.J.F. and Cannon, R.G. (1995). Loxothylacus ihlei Boschma, (Rhizocephala) and its effects on the mud crab, Scylla serrata (Forskal), in northern Australia. Journal of Fish Diseases 18, pp. 389-395.
Landsberg, J.H., Blakesley, B.A., Reese, R.O., McRae, G. and Forstchen, P.R. (1998). Parasites of fish as indicators of environmental stress. Environmental Monitoring and Assessment 51, pp 211-232
Moser, S.M., Macintosh, D.J., Pripanapong, S. and Tongdee, N. (2002). Estimated growth of mud crab Scylla olivacea in the Ranong mangrove ecosystem, Thailand, based on a tagging and recapture study. Marine and Freshwater Research 53, pp. 1083-1089.
Madanire-Moyo, G.N., Luus-Powell, W.J. and Oliver, P.A. (2012). Diversity of metazoan parasites of the Mozambique tilapia, Oreochromis mossambicus (Peters, 1852), as indicators of pollution in Limpopo and Olifants river systems. Onderstepoort Journal of Veterinary Research 79(1), Art. #362, 9 pages. http://dx.doi.org/10.4102/ojvr.v79i1.362
Rotherham, D., Macbeth, W.G., Kennelly, S.J. and Gray, C.A. (2011). Reducing uncertainty in the assessment and management of fisheries resources following an environmental impact. ICES Journal of Marine Science 68(8), pp. 1726-1733.
Sheaves, M., and Molony, B. (2001). Coherent patterns of abundance and size of tropical snapper in dynamic estuary systems. Wetlands Ecology and Management 9, pp 429-439.
Stoner, A.W. (2004). Effects of environmental variable on fish feeding ecology: implications for the performance of baited fishing gear and stock assessment. Journal of Fish Biology 65, pp 1445-1471.
Underwood, A.J. (1992). Beyond BACI: the detection of environmental impacts on populations in the real, but variable, world. Journal of Experimental Marine Biology and Ecology 161, pp. 145-178.
West, L.W., Lyle, J.M., Matthews, S.R., Stark, K.E. and Steffe, A.S. (2012). Survey of Recreational Fishing in the Northern Territory, 2009-10. Northern Territory Government, Australia. Fishery Report No. 109. December 2012.
Prepared for INPEX Cardno 77

Prepared for INPEX Cardno 1
Ichthys Nearshore Environmental Monitoring Program
APPENDIX A SAMPLING DATES AND GPS COORDINATES

Research Fishing and Fish Health Monitoring Program Post-dredging Report Season Ichthys Nearshore Environmental Monitoring Program
Prepared for INPEX Cardno 79
Appendix A-1. Sampling dates and GPS coordinates (WGS84) for Research Angling sites sampled during Research Fishing and Fish Health Monitoring Program Baseline Season 2 (October 2012) and Post-dredging Season 1 (October 2014). GPS coordinates expressed as degrees to five decimal places
Location Baseline Season 2 Post-dredging Season 1
Darwin Harbour – Inner Date Latitude Longitude Date Latitude Longitude
7/10/2012 -12.61825 130.94590 15/10/2014 -12.56728 131.01200
-12.68817 130.95968 -12.56517 131.00400
-12.69098 130.95807 -12.55172 130.98931
-12.69208 130.95777 -12.53061 130.94158
-12.50103 130.94538 16/10/2014 -12.69177 130.95778
-12.52508 130.93222 -12.68270 130.96288
-12.53073 130.94120 -12.67230 130.96497
8/10/2012 -12.56500 131.00383 -12.64990 130.96653
-12.56737 131.01222 -12.64835 130.96037
13/10/2012 -12.69188 130.95783 17/10/2014 -12.51692 130.82175
-12.69010 130.95857 -12.51645 130.81950
-12.68815 130.95960 -12.51493 130.81891
-12.67838 130.96392 -12.51475 130.81945
-12.64852 130.96030 -12.51450 130.81835
14/10/2012 -12.51270 130.81751 -12.50558 130.80880
-12.51370 130.81775 19/10/2014 -12.64983 130.95982
-12.51457 130.82047 -12.61713 130.91963
-12.55535 130.84897 -12.60962 130.92055
22/10/2012 -12.56750 131.01225 -12.60703 130.91975
-12.56510 131.00395 -12.59068 130.86720
-12.54630 130.98745 -12.57480 130.90123
-12.53052 130.94197 -12.56837 130.85597
-12.53072 130.94092 -12.52388 130.80308
-12.52605 130.93260 -12.51987 130.79052
-12.53037 130.94083 -12.50993 130.81863
Note: five decimal digits correspond to a precision of about 1.1 m for latitude and longitude

Research Fishing and Fish Health Monitoring Program Post-dredging Report Season Ichthys Nearshore Environmental Monitoring Program
Prepared for INPEX Cardno 80
Location Baseline Season 2 Post-dredging Season 1
Darwin – Outer Date Latitude Longitude Date Latitude Longitude
8/10/2012 -12.50485 130.74515 15/10/2014 -12.50490 130.74633
-12.41582 130.78348 -12.48788 130.75598
-12.41653 130.78428 -12.48780 130.75662
-12.40762 130.80682 -12.48775 130.75587
-12.47482 130.76238 -12.47935 130.75985
10/10/2012 -12.30237 130.86265 -12.47338 130.76425
-12.31458 130.87188 19/10/2014 -12.50488 130.74643
-12.31533 130.87293 -12.45487 130.76813
11/10/2012 -12.30242 130.86275 -12.40807 130.80650
-12.30662 130.81463 -12.40403 130.80620
-12.31405 130.96665 -12.40370 130.80908
14/10/2012 -12.50493 130.74647 -12.40190 130.81493
-12.48762 130.75628 20/10/2014 -12.32275 130.87570
-12.45553 130.76852 -12.31998 130.89913
-12.45443 130.76888 -12.31993 130.89948
-12.45577 130.76823 -12.31990 130.89888
-12.50490 130.74633 -12.31987 130.87258
24/10/2012 -12.36890 130.80093 -12.31970 130.88022
-12.37327 130.80355 -12.31898 130.89935
-12.40748 130.80717 -12.31888 130.89928
-12.41330 130.80260 -12.31385 130.86722
-12.40438 130.80627 -12.31260 130.87257
25/10/2012 -12.50487 130.74647 -12.30923 130.90195
-12.30680 130.81483 -12.30852 130.86972
-12.30655 130.81455 -12.30547 130.90127
-12.30798 130.81402 -12.30542 130.90052
-12.30538 130.90128
-12.30535 130.90077
-12.30140 130.85778
Note: five decimal digits correspond to a precision of about 1.1 m for latitude and longitude

Research Fishing and Fish Health Monitoring Program Post-dredging Report Season Ichthys Nearshore Environmental Monitoring Program
Prepared for INPEX Cardno 81
Location Baseline Season 2 Post-dredging Season 1
Bynoe Harbour Date Latitude Longitude Date Latitude Longitude
10/10/2012 -12.75343 130.62310 16/10/2014 -12.74197 130.70022
-12.70412 130.59338 -12.73960 130.69205
-12.73453 130.58347 -12.73408 130.58342
12/10/2012 -12.63555 130.49070 -12.70182 130.58787
-12.64025 130.49472 18/10/2014 -12.72665 130.69807
-12.67202 130.52213
-12.72278 130.72462
-12.69727 130.51910
-12.72160 130.60775
-12.70458 130.52240
-12.72040 130.52128
-12.70600 130.52370
-12.63567 130.53838
-12.75263 130.51973
-12.62633 130.53745
-12.75398 130.51720
-12.58703 130.54070
13/10/2012 -12.74853 130.70033
-12.57440 130.52490
-12.74763 130.70038
-12.57118 130.52410
-12.72303 130.72480
-12.72272 130.72478
-12.72702 130.72735
-12.72665 130.69795
-12.72152 130.60760
23/10/2012 -12.74840 130.70050
-12.74750 130.70042
-12.74372 130.69807
-12.72657 130.69698
-12.72220 130.72462
-12.72145 130.60763
24/10/2012 -12.56832 130.45512
-12.56542 130.45330
-12.51512 130.50978
-12.63265 130.54025
-12.65805 130.53223
-12.67912 130.54298
25/10/2012 -12.69930 130.55752
-12.69630 130.55457
-12.68153 130.54277
-12.67045 130.53663
-12.70272 130.59112 Note: five decimal digits correspond to a precision of about 1.1 m for latitude and longitude

Research Fishing and Fish Health Monitoring Program Post-dredging Report Season Ichthys Nearshore Environmental Monitoring Program
Prepared for INPEX Cardno 82
Appendix A-2. Sampling dates and GPS coordinates (WGS84) for Research Potting sites sampled during Research Fishing and Fish Health Monitoriong Program Baseline Season 2 (October 2012) and Post-dredging Season 1 (October 2014). GPS coordinates expressed as degrees to five decimal places
Location Baseline Season 2 Post-dredging Season 1
Date Latitude Longitude Date Latitude Longitude
Darwin Harbour – Inner 10/10/2012 -12.76895 130.62278 15/10/2014 -12.52983 130.95083
12/10/2012 -12.70288 130.50952 16/10/2014 -12.66900 130.96733
13/10/2012 -12.76218 130.51073 17/10/2014 -12.45467 130.88333
23/10/2012 -12.76687 130.62437 19/10/2014 -12.58883 130.93117
24/10/2012 -12.73065 130.51675 25/10/2012 -12.73802 130.58133
Darwin – Outer 7/10/2012 -12.64937 130.95832 15/10/2014 -12.52100 130.73267
7/10/2012 -12.50080 130.94530 19/10/2014 -12.49182 130.75210
8/10/2012 -12.56378 130.99992 20/10/2014 -12.36698 131.01812
9/10/2012 -12.66875 130.96558 20/10/2014 -12.34817 130.94767
10/10/2012 -12.45475 130.88333 11/10/2012 -12.52990 130.95107
Byone Harbour 12/10/2012 -12.50035 130.74627 16/10/2014 -12.76600 130.62483
13/10/2012 -12.36282 131.01825 18/10/2014 -12.72680 130.51428
14/10/2012 -12.34732 130.94540 18/10/2014 -12.72475 130.60363
15/10/2012 -12.48645 130.75742
16/10/2012 -12.41285 130.83997 17/10/2012 -12.48980 130.75040
Note: five decimal digits correspond to a precision of about 1.1 m for latitude and longitude
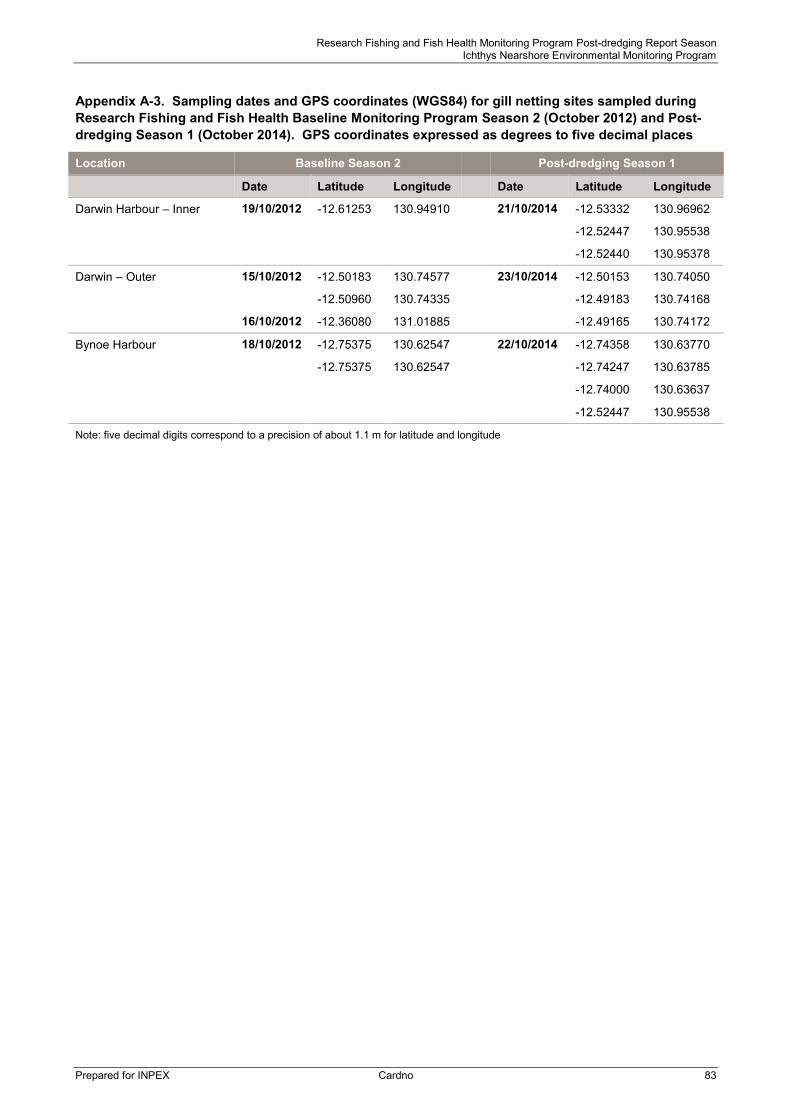
Research Fishing and Fish Health Monitoring Program Post-dredging Report Season Ichthys Nearshore Environmental Monitoring Program
Prepared for INPEX Cardno 83
Appendix A-3. Sampling dates and GPS coordinates (WGS84) for gill netting sites sampled during Research Fishing and Fish Health Baseline Monitoring Program Season 2 (October 2012) and Post-dredging Season 1 (October 2014). GPS coordinates expressed as degrees to five decimal places
Location Baseline Season 2 Post-dredging Season 1
Date Latitude Longitude Date Latitude Longitude
Darwin Harbour – Inner 19/10/2012 -12.61253 130.94910 21/10/2014 -12.53332 130.96962
-12.52447 130.95538
-12.52440 130.95378
Darwin – Outer 15/10/2012 -12.50183 130.74577 23/10/2014 -12.50153 130.74050
-12.50960 130.74335 -12.49183 130.74168
16/10/2012 -12.36080 131.01885 -12.49165 130.74172
Bynoe Harbour 18/10/2012 -12.75375 130.62547 22/10/2014 -12.74358 130.63770
-12.75375 130.62547 -12.74247 130.63785
-12.74000 130.63637
-12.52447 130.95538
Note: five decimal digits correspond to a precision of about 1.1 m for latitude and longitude

Research Fishing and Fish Health Monitoring Program Post-dredging Report Season Ichthys Nearshore Environmental Monitoring Program
Prepared for INPEX Cardno 84
Ichthys Nearshore Environmental Monitoring Program
APPENDIX B SPECIES LISTS AND SAMPLE SIZES BY METHOD
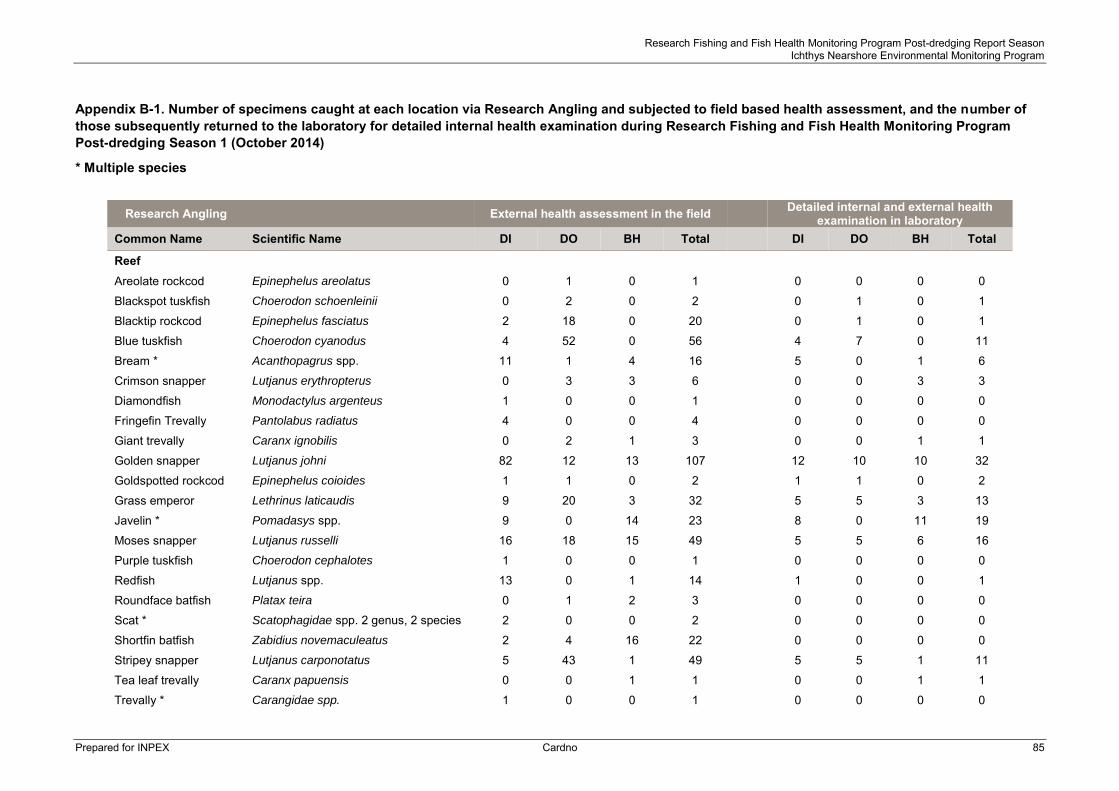
Research Fishing and Fish Health Monitoring Program Post-dredging Report Season Ichthys Nearshore Environmental Monitoring Program
Prepared for INPEX Cardno 85
Appendix B-1. Number of specimens caught at each location via Research Angling and subjected to field based health assessment, and the number of those subsequently returned to the laboratory for detailed internal health examination during Research Fishing and Fish Health Monitoring Program Post-dredging Season 1 (October 2014)
* Multiple species
Research Angling External health assessment in the field
Detailed internal and external health examination in laboratory
Common Name Scientific Name DI DO BH Total DI DO BH Total
Reef Areolate rockcod Epinephelus areolatus 0 1 0 1 0 0 0 0
Blackspot tuskfish Choerodon schoenleinii 0 2 0 2 0 1 0 1
Blacktip rockcod Epinephelus fasciatus 2 18 0 20 0 1 0 1
Blue tuskfish Choerodon cyanodus 4 52 0 56 4 7 0 11
Bream * Acanthopagrus spp. 11 1 4 16 5 0 1 6
Crimson snapper Lutjanus erythropterus 0 3 3 6 0 0 3 3
Diamondfish Monodactylus argenteus 1 0 0 1 0 0 0 0
Fringefin Trevally Pantolabus radiatus 4 0 0 4 0 0 0 0
Giant trevally Caranx ignobilis 0 2 1 3 0 0 1 1
Golden snapper Lutjanus johni 82 12 13 107 12 10 10 32
Goldspotted rockcod Epinephelus coioides 1 1 0 2 1 1 0 2
Grass emperor Lethrinus laticaudis 9 20 3 32 5 5 3 13
Javelin * Pomadasys spp. 9 0 14 23 8 0 11 19
Moses snapper Lutjanus russelli 16 18 15 49 5 5 6 16
Purple tuskfish Choerodon cephalotes 1 0 0 1 0 0 0 0
Redfish Lutjanus spp. 13 0 1 14 1 0 0 1
Roundface batfish Platax teira 0 1 2 3 0 0 0 0
Scat * Scatophagidae spp. 2 genus, 2 species 2 0 0 2 0 0 0 0
Shortfin batfish Zabidius novemaculeatus 2 4 16 22 0 0 0 0
Stripey snapper Lutjanus carponotatus 5 43 1 49 5 5 1 11
Tea leaf trevally Caranx papuensis 0 0 1 1 0 0 1 1
Trevally * Carangidae spp. 1 0 0 1 0 0 0 0

Research Fishing and Fish Health Monitoring Program Post-dredging Report Season Ichthys Nearshore Environmental Monitoring Program
Prepared for INPEX Cardno 86
Research Angling External health assessment in the field Detailed internal and external health
examination in laboratory Common Name Scientific Name DI DO BH Total DI DO BH Total
Non-Reef
Darwin jawfish Opistognathus darwiniensis 2 5 2 9 0 0 0 0
Forktail catfish * Ariidae spp. 1 0 1 2 0 0 0 0
Golden toadfish Odontidae sp. 1 1 0 2 0 0 0 0
Northern sand whiting Sillago sihama 0 0 1 1 0 0 0 0
Papuan jawfish Opistognathus papuensis 1 0 0 1 0 0 0 0
Remora * Remora spp. 0 0 1 1 0 0 0 0
Tawny Shark Nebruis ferrugineus 1 0 0 1 0 0 0 0
Yellowtail Scad Atule mate 0 5 2 7 0 0 0 0 All individuals 169 189 81 439 46 35 37 118
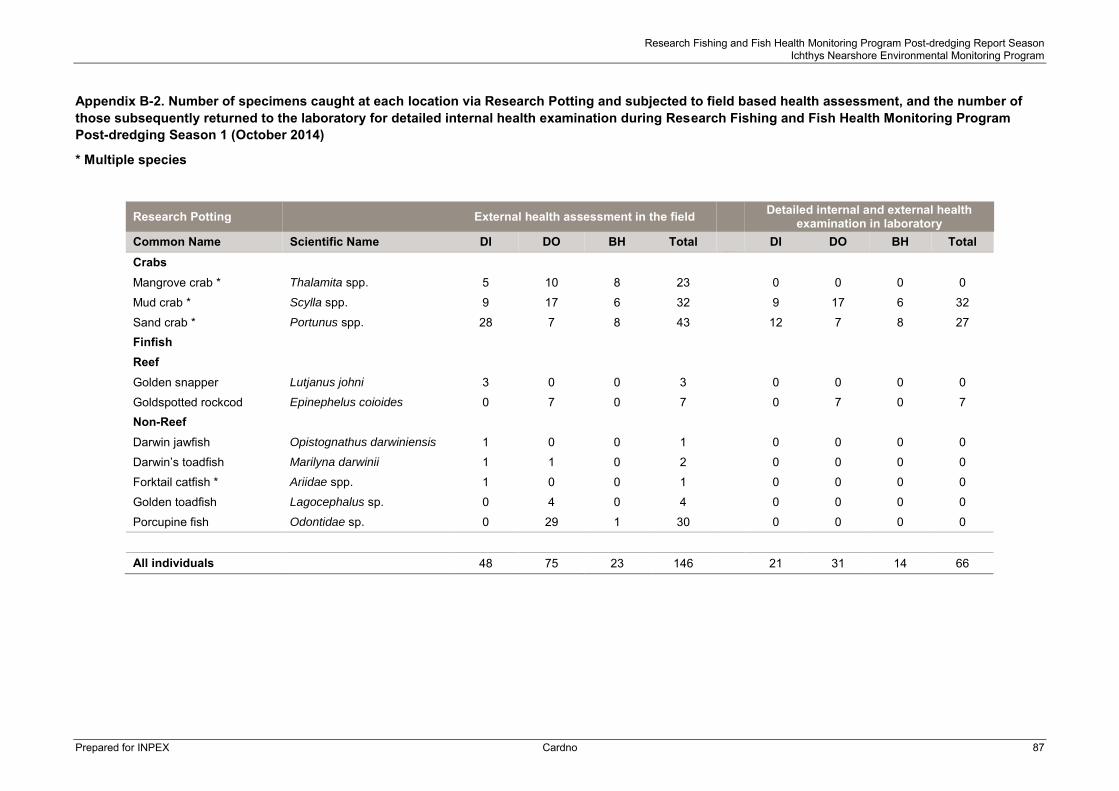
Research Fishing and Fish Health Monitoring Program Post-dredging Report Season Ichthys Nearshore Environmental Monitoring Program
Prepared for INPEX Cardno 87
Appendix B-2. Number of specimens caught at each location via Research Potting and subjected to field based health assessment, and the number of those subsequently returned to the laboratory for detailed internal health examination during Research Fishing and Fish Health Monitoring Program Post-dredging Season 1 (October 2014)
* Multiple species
Research Potting External health assessment in the field Detailed internal and external health
examination in laboratory Common Name Scientific Name DI DO BH Total DI DO BH Total Crabs Mangrove crab * Thalamita spp. 5 10 8 23 0 0 0 0
Mud crab * Scylla spp. 9 17 6 32 9 17 6 32
Sand crab * Portunus spp. 28 7 8 43 12 7 8 27 Finfish Reef Golden snapper Lutjanus johni 3 0 0 3 0 0 0 0
Goldspotted rockcod Epinephelus coioides 0 7 0 7 0 7 0 7 Non-Reef Darwin jawfish Opistognathus darwiniensis 1 0 0 1 0 0 0 0
Darwin’s toadfish Marilyna darwinii 1 1 0 2 0 0 0 0
Forktail catfish * Ariidae spp. 1 0 0 1 0 0 0 0
Golden toadfish Lagocephalus sp. 0 4 0 4 0 0 0 0
Porcupine fish Odontidae sp. 0 29 1 30 0 0 0 0
All individuals 48 75 23 146 21 31 14 66
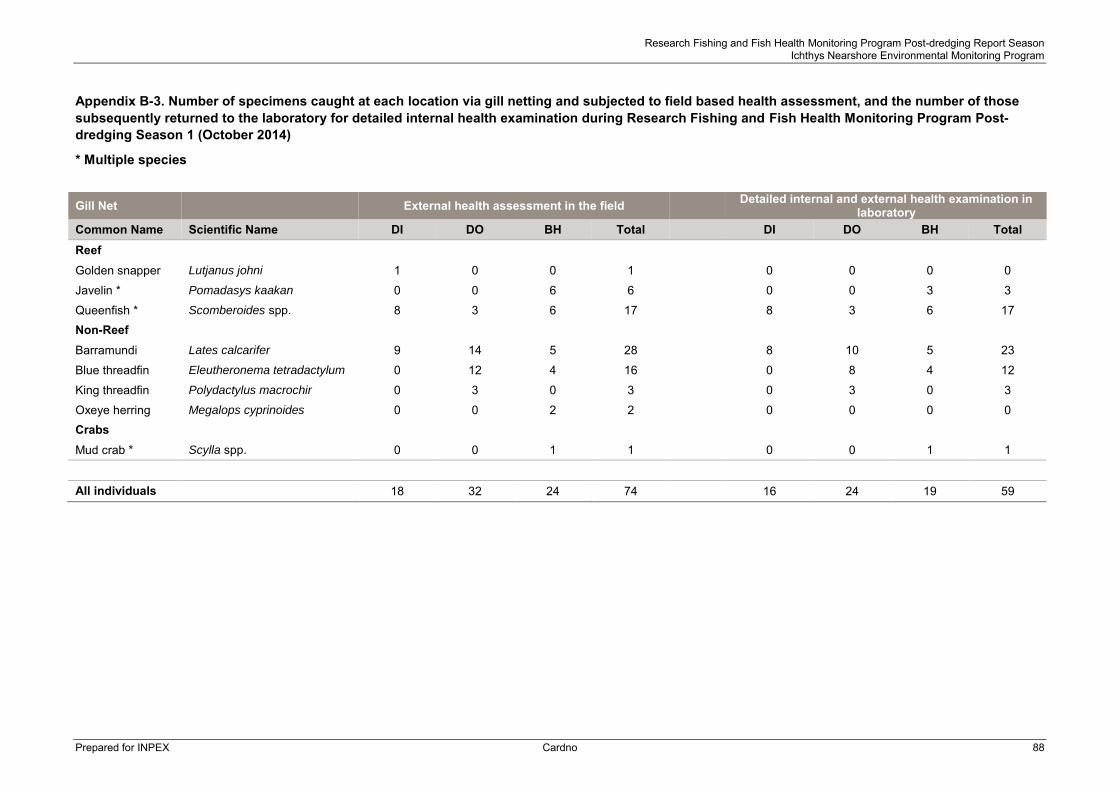
Research Fishing and Fish Health Monitoring Program Post-dredging Report Season Ichthys Nearshore Environmental Monitoring Program
Prepared for INPEX Cardno 88
Appendix B-3. Number of specimens caught at each location via gill netting and subjected to field based health assessment, and the number of those subsequently returned to the laboratory for detailed internal health examination during Research Fishing and Fish Health Monitoring Program Post-dredging Season 1 (October 2014)
* Multiple species
Gill Net External health assessment in the field
Detailed internal and external health examination in laboratory
Common Name Scientific Name DI DO BH Total DI DO BH Total Reef Golden snapper Lutjanus johni 1 0 0 1 0 0 0 0
Javelin * Pomadasys kaakan 0 0 6 6 0 0 3 3
Queenfish * Scomberoides spp. 8 3 6 17 8 3 6 17 Non-Reef
Barramundi Lates calcarifer 9 14 5 28 8 10 5 23
Blue threadfin Eleutheronema tetradactylum 0 12 4 16 0 8 4 12
King threadfin Polydactylus macrochir 0 3 0 3 0 3 0 3
Oxeye herring Megalops cyprinoides 0 0 2 2 0 0 0 0 Crabs
Mud crab * Scylla spp. 0 0 1 1 0 0 1 1
All individuals 18 32 24 74 16 24 19 59

Research Fishing and Fish Health Monitoring Program Post-dredging Report Season Ichthys Nearshore Environmental Monitoring Program
Prepared for INPEX Cardno 89
Ichthys Nearshore Environmental Monitoring Program
APPENDIX C CATCH RATES DURING RESEARCH FISHING (ANGLING AND POTTING)

Research Fishing and Fish Health Monitoring Program Post-dredging Report Season Ichthys Nearshore Environmental Monitoring Program
Prepared for INPEX Cardno 90
Appendix C-1. Catch-Per-Unit-of-Effort (CPUE) (SE) number caught per hour for reef fish species and other species of finfish species caught via Research Angling during Research Fishing and Fish Health Monitoring Program Baseline Season 2 (October 2012), Dredging Season 1 (November – December 2012), Dredging Season 2 (March 2013), Dredging Season 3 (October 2013), Dredging Season 4 (March 2014) and Post-dredging Season 1 (October 2014)
* Multiple species
Common Name Baseline 2 Dredging 1 Dredging 2 Dredging 3 Dredging 4 Post-dredging 1
Research Angling DI DO BH AR DI DO BH AR DI DO BH AR DI DO DI DO BH DI DO BH
Reef Species
Areolate rockcod 0.03
(0.03) 0.07
(0.07)
Black jewfish 0.06 (0.06)
0.29 (0.26)
0.36 (0.36)
0.06 (0.06)
0.11 (0.11)
Blackspot tuskfish
0.03 (0.03)
0.07 (0.05)
0.04 (0.04)
0.09 (0.06)
0.11 (0.06)
Blue trevally 0.14
(0.14)
Blue tuskfish 0.46 (0.44)
1.13 (0.41)
0.23 (0.16)
0.49 (0.39)
0.17 (0.11)
1.24 (0.4)
0.40 (0.24)
1.06 (0.63)
0.36 (0.36)
0.46 (0.31)
0.08 (0.06)
1.68 (0.52)
0.46 (0.46)
0.46 (0.23)
0.31 (0.24)
0.24 (0.13)
2.97 (1.14)
Blacktip rockcod 0.33
(0.31) 0.12
(0.12) 0.98
(0.56)
Bream * 0.29 (0.27)
0.07 (0.05)
0.05 (0.05)
0.22 (0.22)
0.05 (0.05)
0.23 (0.23)
0.13 (0.07)
0.08 (0.08)
0.06 (0.06)
0.65 (0.42)
0.04 (0.04)
0.3 (0.19)
Brown barred rockcod
0.05 (0.05)
0.22 (0.05)
0.07 (0.07)
0.10 (0.10)
0.02 (0.02)
Brownstripe snapper
0.04 (0.04)
Crimson snapper 0.02
(0.02) 0.05
(0.05) 0.18
(0.18) 0.25
(0.25)
Croaker * 0.03 (0.03)
0.22 (0.08)
0.23 (0.17)
0.08 (0.08)
0.85 (0.46)
0.06 (0.06)
4.37 (3.08)
0.2 (0.2)
Diamondfish 0.25
(0.16) 0.04
(0.04)
Fringefin Trevally 0.26
(0.21) 0.07
(0.07) 0.3
(0.3) 0.03
(0.03) 0.05
(0.05) 0.23
(0.23)
Giant trevally 0.07 (0.04)
0.09 (0.04)
0.02 (0.02)
0.03 (0.03)
0.27 (0.12)
0.16 (0.16)
0.11 (0.06)
0.08 (0.08)

Research Fishing and Fish Health Monitoring Program Post-dredging Report Season Ichthys Nearshore Environmental Monitoring Program
Prepared for INPEX Cardno 91
Common Name Baseline 2 Dredging 1 Dredging 2 Dredging 3 Dredging 4 Post-dredging 1
Research Angling DI DO BH AR DI DO BH AR DI DO BH AR DI DO DI DO BH DI DO BH
Golden snapper 1.59 (0.7)
0.64 (0.25)
0.27 (0.23)
1.45 (0.4)
4.2 (2.13)
0.71 (0.25)
2.4 (1.37)
1.5 (0.35)
1.21 (0.44)
0.08 (0.08)
2.47 (1.98)
3.44 (2.9)
2.99 (1.31)
1.01 (0.55)
1.09 (0.37)
2.08 (0.87)
3.08 (1.44)
4.19 (1.94)
0.71 (0.1)
1.06 (0.52)
Golden trevally 0.04
(0.04)
Goldspotted rockcod
0.22 (0.1)
0.03 (0.03)
0.22 (0.11)
0.10 (0.07)
0.30 (0.09)
0.09 (0.06)
0.28 (0.15)
0.03 (0.03)
0.06 (0.06)
0.34 (0.34)
0.23 (0.17)
0.18 (0.08)
0.06 (0.06)
0.16 (0.06)
0.31 (0.16)
0.06 (0.06)
0.05 (0.05)
Grass emperor 0.43 (0.29)
0.38 (0.12)
0.43 (0.27)
0.34 (0.23)
0.58 (0.24)
0.48 (0.24)
0.41 (0.26)
0.30 (0.3)
1.58 (1.00)
0.28 (0.18)
1.23 (0.37)
0.16 (0.06)
0.08 (0.08)
0.58 (0.21)
1.13 (0.51)
0.25 (0.25)
Indonesian snapper
0.09 (0.09)
0.07 (0.07)
Javelin * 0.36 (0.33)
0.24 (0.24)
1.1 (0.57)
0.3 (0.21)
1.11 (0.41)
0.52 (0.27)
2.68 (1.37)
0.42 (0.36)
0.59 (0.51)
0.79 (0.79)
0.62 (0.53)
0.52 (0.3) 0 (0) 0.18
(0.18) 2.12
(1.22) 0.18
(0.18) 0.49
(0.16) 1.14
(0.74)
Longfin rockcod 0.03
(0.03) 0.03
(0.03) 0.02
(0.02) 0.32
(0.11)
Moses snapper 1.75 (0.73)
0.43 (0.21)
0.33 (0.18)
0.89 (0.74)
0.22 (0.12)
1.3 (0.79)
0.05 (0.05)
0.99 (0.88)
0.79 (0.53)
0.1 (0.07)
1.07 (0.66)
1.04 (0.4)
1.26 (0.68)
Northwest threadfin bream
0.1 (0.1)
0.12 (0.06)
0.03 (0.03)
0.08 (0.05)
0.06 (0.06)
0.05 (0.05)
Painted sweetlip 0.05
(0.05) 0.07
(0.07)
Purple tuskfish 0.2
(0.07) 0.04
(0.04) 0.05
(0.05)
Redspot emperor 0.05 (0.05)
0.06 (0.06)
0.07 (0.05)
Redthroat emperor 0 (0) 0.2
(0.16)
Redstripe tuskfish
0.02 (0.02)
Roundface batfish
0.08 (0.08)
0.06 (0.06)
0.17 (0.17)
Redfish 0.97
(0.97) 0.08
(0.08)
Saddletail snapper
0.02 (0.02)
0.04 (0.04)
0.04 (0.04)
Sand bass 0.13
(0.13) 0.11
(0.11) 0.14
(0.14) 0.11
(0.11) 0.18
(0.07)

Research Fishing and Fish Health Monitoring Program Post-dredging Report Season Ichthys Nearshore Environmental Monitoring Program
Prepared for INPEX Cardno 92
Common Name Baseline 2 Dredging 1 Dredging 2 Dredging 3 Dredging 4 Post-dredging 1
Research Angling DI DO BH AR DI DO BH AR DI DO BH AR DI DO DI DO BH DI DO BH
Scat * 0.19 (0.13)
0.05 (0.05)
0.13 (0.09)
0.11 (0.07)
Shortfin batfish 0.04 (0.04)
0.32 (0.29)
0.29 (0.11)
0.34 (0.31)
0.06 (0.06)
0.08 (0.08)
0.06 (0.06)
0.08 (0.08)
0.28 (0.03)
0.44 (0.28)
0.08 (0.06)
0.32 (0.32)
0.05 (0.05)
0.28 (0.23)
0.11 (0.11)
0.25 (0.25)
1.17 (1.17)
Spotted mackeral 0 (0) 0.04 (0.04)
Stripey snapper 1.04 (1.04)
0.41 (0.16)
0.16 (0.13)
0.24 (0.19)
0.31 (0.31)
0.41 (0.15)
0.3 (0.14)
0.11 (0.11)
0.54 (0.54)
0.71 (0.47)
0.72 (0.4)
0.29 (0.26)
1.08 (0.63)
0.82 (0.7)
0.64 (0.42)
0.88 (0.83)
0.3 (0.3)
2.6 (0.8)
0.08 (0.08)
Tea leaf trevally 0.07
(0.07)
Trevally * 0.12
(0.12) 0.14 (0.1)
0.04 (0.04)
Yellowtail grunter 0.1
(0.1) 0.02
(0.02) 0.05
(0.05) 0.07
(0.07) 0.08
(0.08)
Reef fish (combined)
6.75 (1.35)
4.58 (0.99)
3.51 (1.06)
3.25 (1.17)
8.21 (1.96)
4.22 (0.55)
8.68 (3.03)
4.69 (1.02)
3.92 (2.06)
1.24 (0.98)
7.98 (2.37)
8.62 (6.61)
6.04 (1.34)
6.82 (1.38)
3.25 (1.11)
6.75 (0.48)
5.5 (1.19)
9.32 (2.15)
10.36 (3.04)
5.97 (1.4)
Non Reef Species
Archerfish 0.02
(0.02)
Blue threadfin 0.12
(0.08) 0.06
(0.06) 0.08
(0.08)
Darwin jawfish 0.14 (0.1)
0.23 (0.12)
0.11 (0.07)
0.15 (0.08)
0.07 (0.05)
0.11 (0.08)
0.15 (0.15)
0.09 (0.09)
0.02 (0.02)
0.02 (0.02)
0.12 (0.12)
0.26 (0.26)
0.17 (0.17)
Darwin’s toadfish 0.15 (0.06)
0.22 (0.09)
0.03 (0.03)
0.03 (0.03)
0.03 (0.03)
Eeltail catfish * 0.03
(0.03) 0.09
(0.09)
Eyebrow wedgefish
0.04 (0.04)
Forktail catfish * 0.02 (0.02)
0.06 (0.04)
0.04 (0.04)
0.55 (0.21)
0.03 (0.03)
0.87 (0.49)
1.22 (0.66)
0.13 (0.13)
0.10 (0.1)
1.51 (0.83)
0.24 (0.24)
0.23 (0.23)
0.43 (0.32)
0.07 (0.07)
0.08 (0.08)
Frogfish 0.02
(0.02) 0.03
(0.03)

Research Fishing and Fish Health Monitoring Program Post-dredging Report Season Ichthys Nearshore Environmental Monitoring Program
Prepared for INPEX Cardno 93
Common Name Baseline 2 Dredging 1 Dredging 2 Dredging 3 Dredging 4 Post-dredging 1
Research Angling DI DO BH AR DI DO BH AR DI DO BH AR DI DO DI DO BH DI DO BH
Golden toadfish 0.03
(0.03) 0.04
(0.04) 0.21
(0.21) 0.05
(0.05) 0.06
(0.06) 0.04
(0.04)
Grey carpetshark 0.05 (0.05)
0.03 (0.03)
0.03 (0.03)
0.02 (0.02)
0.07 (0.05)
0.11 (0.06)
0.18 (0.18)
0.17 (0.17)
0.06 (0.06)
0.06 (0.04)
0.04 (0.04)
Marbled catshark 0.27
(0.27) 0.14
(0.14)
Milk shark 0.07
(0.07) 0.09
(0.06) 0.09
(0.09) 0.05
(0.05)
Narrow lined toadfish
0.03 (0.03)
Northern sand whiting
0.04 (0.04)
0.04 (0.04)
0.15 (0.15)
0.08 (0.08)
Oxeye herring 0.08
(0.08)
Papuan jawfish 0.06
(0.06) 0.08
(0.08) 0.05
(0.05)
Stonefish 0.08
(0.08)
Toadfish * 0.03 (0.03)
Weasel shark 0.03
(0.03) 0.18
(0.18) 0.08
(0.08) 0.02
(0.02)
Remora * 0.08
(0.08)
Tawny shark 0.05
(0.05)
Yellowtail scad 0.31
(0.31) 0.17
(0.17)
All fish combined
7.14 (1.45)
5.02 (0.86)
3.86 (0.98)
3.98 (1.07)
8.58 (2.01)
4.55 (0.62)
9.82 (3.56)
6.15 (0.9)
4.40 (2.27)
2.17 (1.16)
8.40 (2.16)
10.32 (6.91)
6.30 (1.51)
7.00 (1.38)
3.51 (1.01)
6.61 (1.51)
6.35 (1.01)
9.70 (2.15)
10.99 (3.08)
6.57 (1.6)
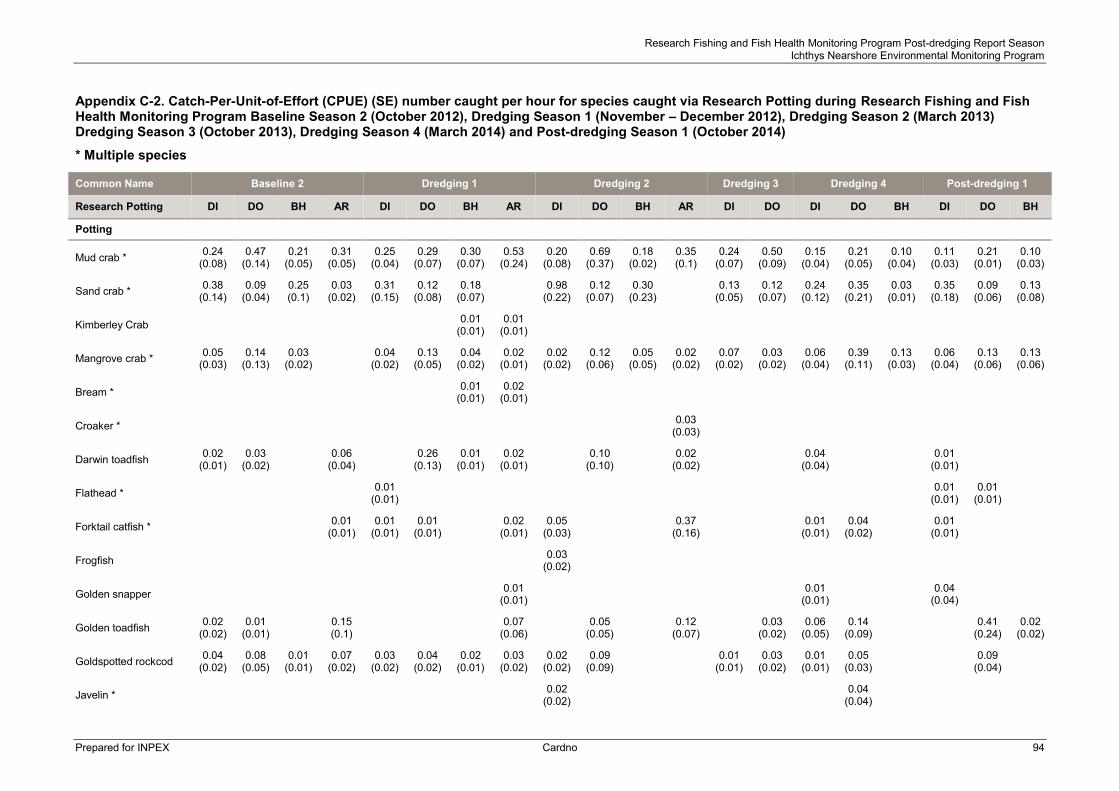
Research Fishing and Fish Health Monitoring Program Post-dredging Report Season Ichthys Nearshore Environmental Monitoring Program
Prepared for INPEX Cardno 94
Appendix C-2. Catch-Per-Unit-of-Effort (CPUE) (SE) number caught per hour for species caught via Research Potting during Research Fishing and Fish Health Monitoring Program Baseline Season 2 (October 2012), Dredging Season 1 (November – December 2012), Dredging Season 2 (March 2013) Dredging Season 3 (October 2013), Dredging Season 4 (March 2014) and Post-dredging Season 1 (October 2014)
* Multiple species
Common Name Baseline 2 Dredging 1 Dredging 2 Dredging 3 Dredging 4 Post-dredging 1
Research Potting DI DO BH AR DI DO BH AR DI DO BH AR DI DO DI DO BH DI DO BH
Potting
Mud crab * 0.24 (0.08)
0.47 (0.14)
0.21 (0.05)
0.31 (0.05)
0.25 (0.04)
0.29 (0.07)
0.30 (0.07)
0.53 (0.24)
0.20 (0.08)
0.69 (0.37)
0.18 (0.02)
0.35 (0.1)
0.24 (0.07)
0.50 (0.09)
0.15 (0.04)
0.21 (0.05)
0.10 (0.04)
0.11 (0.03)
0.21 (0.01)
0.10 (0.03)
Sand crab * 0.38 (0.14)
0.09 (0.04)
0.25 (0.1)
0.03 (0.02)
0.31 (0.15)
0.12 (0.08)
0.18 (0.07)
0.98 (0.22)
0.12 (0.07)
0.30 (0.23)
0.13 (0.05)
0.12 (0.07)
0.24 (0.12)
0.35 (0.21)
0.03 (0.01)
0.35 (0.18)
0.09 (0.06)
0.13 (0.08)
Kimberley Crab 0.01
(0.01) 0.01
(0.01)
Mangrove crab * 0.05 (0.03)
0.14 (0.13)
0.03 (0.02)
0.04 (0.02)
0.13 (0.05)
0.04 (0.02)
0.02 (0.01)
0.02 (0.02)
0.12 (0.06)
0.05 (0.05)
0.02 (0.02)
0.07 (0.02)
0.03 (0.02)
0.06 (0.04)
0.39 (0.11)
0.13 (0.03)
0.06 (0.04)
0.13 (0.06)
0.13 (0.06)
Bream * 0.01
(0.01) 0.02
(0.01)
Croaker * 0.03
(0.03)
Darwin toadfish 0.02 (0.01)
0.03 (0.02)
0.06 (0.04)
0.26 (0.13)
0.01 (0.01)
0.02 (0.01)
0.10 (0.10)
0.02 (0.02)
0.04 (0.04)
0.01 (0.01)
Flathead * 0.01
(0.01) 0.01
(0.01) 0.01
(0.01)
Forktail catfish * 0.01
(0.01) 0.01
(0.01) 0.01
(0.01) 0.02
(0.01) 0.05
(0.03) 0.37
(0.16) 0.01
(0.01) 0.04
(0.02) 0.01
(0.01)
Frogfish 0.03
(0.02)
Golden snapper 0.01
(0.01) 0.01
(0.01) 0.04
(0.04)
Golden toadfish 0.02 (0.02)
0.01 (0.01)
0.15 (0.1)
0.07 (0.06)
0.05 (0.05)
0.12 (0.07) 0.03
(0.02) 0.06
(0.05) 0.14
(0.09) 0.41
(0.24) 0.02
(0.02)
Goldspotted rockcod 0.04 (0.02)
0.08 (0.05)
0.01 (0.01)
0.07 (0.02)
0.03 (0.02)
0.04 (0.02)
0.02 (0.01)
0.03 (0.02)
0.02 (0.02)
0.09 (0.09)
0.01 (0.01)
0.03 (0.02)
0.01 (0.01)
0.05 (0.03)
0.09 (0.04)
Javelin * 0.02
(0.02) 0.04
(0.04)
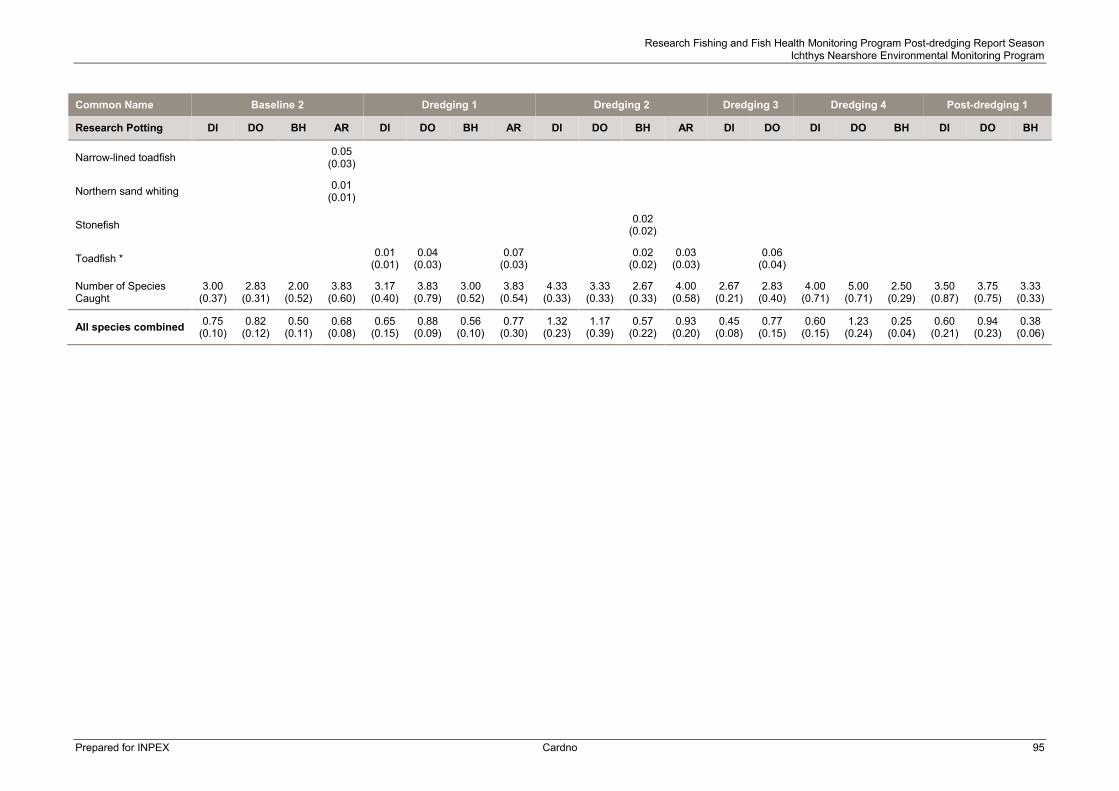
Research Fishing and Fish Health Monitoring Program Post-dredging Report Season Ichthys Nearshore Environmental Monitoring Program
Prepared for INPEX Cardno 95
Common Name Baseline 2 Dredging 1 Dredging 2 Dredging 3 Dredging 4 Post-dredging 1
Research Potting DI DO BH AR DI DO BH AR DI DO BH AR DI DO DI DO BH DI DO BH
Narrow-lined toadfish 0.05
(0.03)
Northern sand whiting 0.01
(0.01)
Stonefish 0.02
(0.02)
Toadfish * 0.01
(0.01) 0.04
(0.03) 0.07
(0.03) 0.02
(0.02) 0.03
(0.03) 0.06 (0.04)
Number of Species Caught
3.00 (0.37)
2.83 (0.31)
2.00 (0.52)
3.83 (0.60)
3.17 (0.40)
3.83 (0.79)
3.00 (0.52)
3.83 (0.54)
4.33 (0.33)
3.33 (0.33)
2.67 (0.33)
4.00 (0.58)
2.67 (0.21)
2.83 (0.40)
4.00 (0.71)
5.00 (0.71)
2.50 (0.29)
3.50 (0.87)
3.75 (0.75)
3.33 (0.33)
All species combined 0.75 (0.10)
0.82 (0.12)
0.50 (0.11)
0.68 (0.08)
0.65 (0.15)
0.88 (0.09)
0.56 (0.10)
0.77 (0.30)
1.32 (0.23)
1.17 (0.39)
0.57 (0.22)
0.93 (0.20)
0.45 (0.08)
0.77 (0.15)
0.60 (0.15)
1.23 (0.24)
0.25 (0.04)
0.60 (0.21)
0.94 (0.23)
0.38 (0.06)
Research Fishing and Fish Health Monitoring Program Post-dredging Report Season Ichthys Nearshore Environmental Monitoring Program
Prepared for INPEX Cardno 96
Ichthys Nearshore Environmental Monitoring Program
APPENDIX D ADDITIONAL CATCH RATE ANALYSES
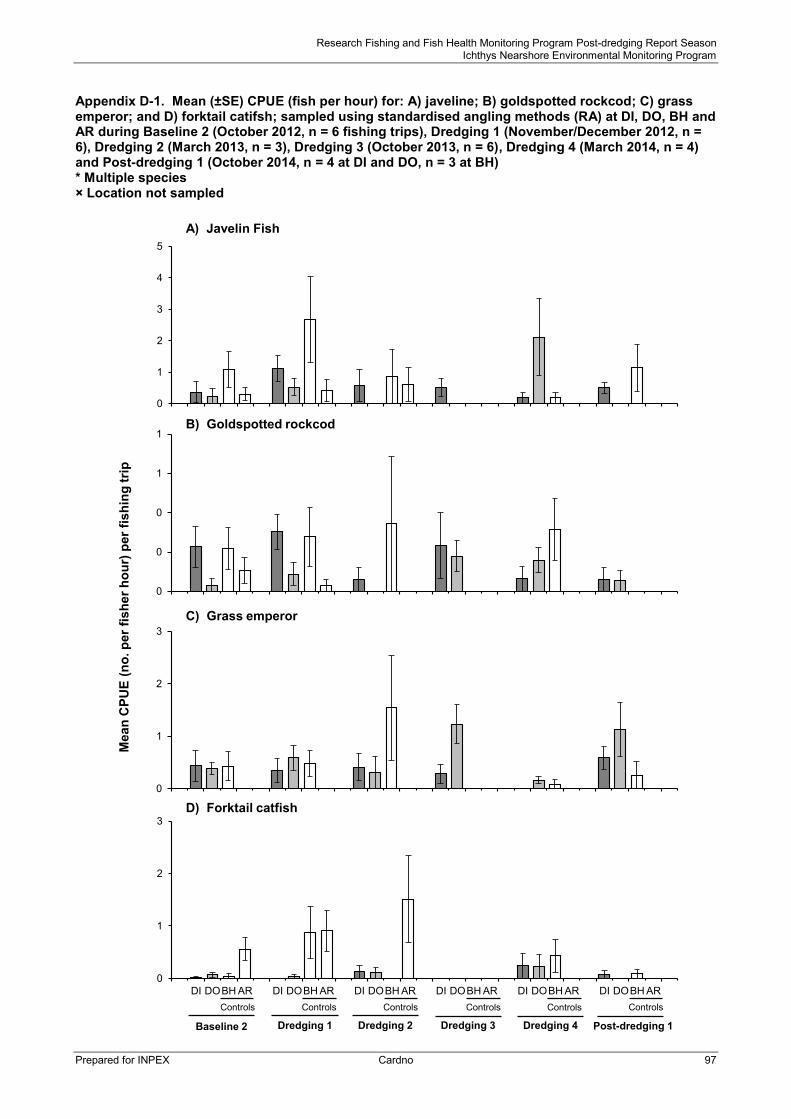
Research Fishing and Fish Health Monitoring Program Post-dredging Report Season Ichthys Nearshore Environmental Monitoring Program
Prepared for INPEX Cardno 97
Appendix D-1. Mean (±SE) CPUE (fish per hour) for: A) javeline; B) goldspotted rockcod; C) grass emperor; and D) forktail catifsh; sampled using standardised angling methods (RA) at DI, DO, BH and AR during Baseline 2 (October 2012, n = 6 fishing trips), Dredging 1 (November/December 2012, n = 6), Dredging 2 (March 2013, n = 3), Dredging 3 (October 2013, n = 6), Dredging 4 (March 2014, n = 4) and Post-dredging 1 (October 2014, n = 4 at DI and DO, n = 3 at BH) * Multiple species × Location not sampled
0
1
2
3
DI DOBH AR DI DOBH AR DI DOBH AR DI DOBH AR DI DOBH AR DI DOBH AR
0
1
2
3
0
0
0
1
1
0
1
2
3
4
5
B) Goldspotted rockcod
A) Javelin Fish
C) Grass emperor
Controls
Baseline 2
D) Forktail catfish
Dredging 4Dredging 3Dredging 2Dredging 1
Controls Controls Controls Controls Controls
Post-dredging 1
Mea
n C
PUE
(no.
per
fish
er h
our)
per
fish
ing
trip

Research Fishing and Fish Health Monitoring Program Post-dredging Report Season Ichthys Nearshore Environmental Monitoring Program
Prepared for INPEX Cardno 98
Appendix D-2. Results of univariate PERMANOVA testing for differences in mean CPUE (per hour) for: A) javelin*; B) goldspotted rockcod; C) grass emperor; and D) forktail catfish*; among RA sampling seasons (Baseline 2 (October 2012, n = 6 fishing trips), Dredging 1 (November/December 2012, n = 6), Dredging 2 (March 2013, n = 3), Dredging 3 (October 2013, n = 6), Dredging 4 (March 2014, n = 4) and Post-dredging 1 (n = 4 at DI and DO, n = 3 at BH)) and among locations (Darwin locations DI and DO, and Control location BH) Data Ln(x +1) transformed * Multiple species () Pooled with Residual term for final analysis
Source of Variation df MS Pseu-F p-(perm) df MS Pseu-F p-(perm)
A) Javelin* – CPUE B) Goldspotted rockcod – CPUE
Season 5 0.34 1.35 0.26 5 0.04 1.10 0.37 Location 2 0.44 1.74 0.19 2 0.08 2.42 0.09 Season × Location 9 0.38 1.51 0.16 (9) (0.02) (0.67) (0.73) Residual 63 0.25 72 0.03 Total 79 79
C) Grass emperor – CPUE D) Forktail catfish* – CPUE
Season 5 0.26 1.88 0.11 5 0.07 1.42 0.21 Location 2 0.26 1.95 0.15 2 0.08 1.44 0.25 Season × Location (9) (0.14) (1.07) (0.40) 9 0.07 1.32 0.23 Residual 72 0.14 63 0.05 Total 79 79

Research Fishing and Fish Health Monitoring Program Post-dredging Report Season Ichthys Nearshore Environmental Monitoring Program
Prepared for INPEX Cardno 99
Ichthys Nearshore Environmental Monitoring Program
APPENDIX E FISH SIZE DATA SUMMARY

Research Fishing and Fish Health Monitoring Program Post-dredging Report Season Ichthys Nearshore Environmental Monitoring Program
Prepared for INPEX Cardno 100
Appendix E-1. Summaries of fork length data for recreationally significant and/or frequently caught species sampled during Research Angling done as part of Research Fishing and Fish Health Monitoring Program Baseline Seasons 1 (August-September 2012) and 2 (October 2012) combined, Dredging Season 1 (November-December 2012), Dredging Season 2 (March 2013), Dredging Season 3 (October 2013), Dredging Season 4 (March 2014) and Post-dredging Season 1 (October 2014). * Multiple species # Summary parameters based on individuals caught during Research Angling and Research Potting activities
Species Location Baseline Phase Dredging 1 Dredging 2 Dredging 3 Dredging 4 Dredging Phase Post-dredging 1
Research Angling Mean (SE) LCF
Range LCF n
Mean (SE) LCF
Range LCF n
Mean (SE) LCF
Range LCF n
Mean (SE) LCF
Range LCF n
Mean (SE) LCF
Range LCF n
Mean (SE) LCF
Range LCF n
Mean (SE) LCF
Range LCF n
Golden snapper DI 21.0
(0.5) 13 - 35 83
22.9 (0.4) 16 - 37 114
21.4 (0.5) 18 - 28 20
22.6 (0.4) 16 - 38 101
23.8 (1.5) 11 - 37 20
22.7 (0.3) 11 - 38 255
20.8 (0.4) 15 - 37 86
DO 24.4
(1.3) 14 - 37 27
24.4 (1.3) 15 - 34 17
18.7 (0.0) 19 - 19 1
27.2 (1.2) 13 - 40 27
27.0 (1.0) 14 - 39 31
26.4 (0.7) 13 - 40 76
23.5 (1.8) 16 - 39 12
BH 22.2
(1.3) 16 - 34 16
21.5 (0.4) 16 - 32 52
25.2 (0.8) 17 - 36 29
- - -
27.4 (0.7) 19 - 42 61
24.8 (0.4) 16 - 42 142
28.4 (1.3) 19 - 34 13
AR 23.9 (0.7) 13 - 40 67
24.8 (0.9) 17 - 36 39
26.7 (1.1) 18 - 44 27 - - - - - -
- - -
Stripey snapper DI 20.5
(0.7) 18 - 30 21
20.2 (0.9) 17 - 25 9
17.3 (1.0) 15 - 24 9
20.6 (0.8) 17 - 25 12
22.0 (0.8) 15 - 27 17
20.4 (0.5) 15 - 27 47
18.0 (0.9) 16 - 22 5
DO 19.3
(0.5) 16 - 24 21
18.8 (0.4) 17 - 21 11
20.9 (1.1) 16 - 27 9
20.9 (0.4) 18 - 27 33
22.7 (0.9) 17 - 28 11
20.9 (0.3) 16 - 28 64
19.3 (0.5) 15 - 29 43
BH 19.5
(1.0) 16 - 25 11
18.4 (1.5) 16 - 27 7
17.9 (0.6) 16 - 21 7
- - -
22.4 (0.7) 19 - 26 11
20.0 (0.7) 16 - 27 25
18.9 (0.0) 19 - 19 1
AR 21.2
(2.8) 14 - 32 6
23.6 (2.6) 19 - 28 3
0
- - -
- - -
- - -
Javelin* DI 19.1 (0.6) 16 - 27 26
20.0 (0.6) 16 - 32 33
18.4 (1.5) 13 - 32 11
20.7 (1.2) 16 - 38 19
23.1 (3.3) 18 - 36 5
20.2 (0.5) 13 - 38 68
20.1 (0.7) 17 - 23 9
DO 23.8
(0.8) 15 - 31 24
20.5 (1.0) 13 - 27 15
0
- - 0
18.1 (1.0) 13 - 32 26
18.9 (0.7) 13 - 32 41
0
BH 21.5
(0.7) 13 - 32 42
18.2 (0.4) 11 - 25 54
21.4 (1.3) 17 - 31 11
- - -
25.1 (2.3) 20 - 36 6
19.3 (0.5) 11 - 36 71
26.0 (2.4) 13 - 45 20
AR 19.4 (0.6) 14 - 28 30
21.8 (2.7) 14 - 49 12
18.6 (1.5) 13 - 21 5 - - - - - -
- - -

Research Fishing and Fish Health Monitoring Program Post-dredging Report Season Ichthys Nearshore Environmental Monitoring Program
Prepared for INPEX Cardno 101
Species Location Baseline Phase Dredging 1 Dredging 2 Dredging 3 Dredging 4 Dredging Phase Post-dredging 1
Research Angling Mean (SE) LCF
Range LCF n
Mean (SE) LCF
Range LCF n
Mean (SE) LCF
Range LCF n
Mean (SE) LCF
Range LCF n
Mean (SE) LCF
Range LCF n
Mean (SE) LCF
Range LCF n
Mean (SE) LCF
Range LCF n
Goldspotted rockcod # DI 27.6
(1.3) 19 - 40 23
27.4 (1.8) 19 - 38 12
27.0 (4.5) 23 - 32 2
27.4
(2.00) 18 - 37 9
30.2 (4.8) 25 - 35 2
27.6 (1.2) 18 - 38 25
24.6 (0.0) 25 - 25 1
DO 27.7
(1.7) 18 - 42 15
27.8 (2.8) 19 - 38 7
28.5 (1.8) 26 - 35 5
28.3 (1.6) 24 - 39 8
29.9 (1.2) 25 - 33 6
28.6 (1.0) 19 - 39 26
29.5 (1.6) 23 - 35 8
BH 27.5
(1.5) 17 - 48 25
24.4 (1.7) 18 - 34 10
31.4 (7.7) 23 - 47 3
- - -
26.8 (2.6) 20 - 36 6
26.2 (1.7) 18 - 47 19
0
AR 26.8 (1.1) 15 - 37 27
26.1 (3.1) 20 - 33 4 0 - - - - - -
- - -
Blue tuskfish DI 21.9 (1.1) 18 - 30 13
21.3 (0.8) 19 - 24 5
20.3 (0.6) 19 - 23 6
24.9 (5.6) 17 - 36 3
18.8 (0.4) 16 - 21 10
20.5 (0.8) 16 - 36 24
20.0 (1.2) 18 - 23 4
DO 21.9
(0.5) 14 - 29 47
20.0 (0.4) 16 - 25 33
0
21.7 (0.4) 17 - 36 51
21.3 (0.6) 18 - 23 11
21.1 (0.3) 16 - 36 95
21.0 (0.3) 15 - 26 52
BH 21.0
(0.6) 16 - 25 16
19.9 (0.8) 16 - 23 9
21.0 (1.7) 18 - 23 3
- - -
21.4 (0.7) 20 - 23 4
20.5 (0.6) 16 - 23 16
0
AR 20.5
(0.6) 16 - 28 18
19.0 (0.6) 11 - 23 21
0
- - -
- - -
- - -
Moses snapper DI 17.3
(0.2) 12 - 21 113 17.5 (0.4) 13 - 21 23
18.6 (0.0) 19 - 19 1
16.7 (0.5) 13 - 21 21 0
17.2 (0.3) 13 - 21 45
17.9 (0.3) 15 - 20 16
DO 19.2
(0.6) 15 - 22 16
19.5 (0.8) 18 - 23 6
0
17.5 (3.1) 14 - 24 3
0
18.8 (1.1) 14 - 24 9
18.8 (0.8) 14 - 26 18
BH 15.8
(0.4) 13 - 19 25
18.0 (0.3) 14 - 21 25
15.8 (0.9) 12 - 19 9
- - -
0
17.4 (0.4) 12 - 21 34
18.1 (0.4) 14 - 20 15
AR 0 0 0 - - - - - -
- - -
Grass emperor DI 19.0
(0.8) 13 - 23 14
17.3 (0.6) 15 - 21 9
17.2 (0.4) 16 - 19 7
21.2 (0.8) 18 - 27 11
0
18.9 (0.5) 15 - 27 27
19.8 (0.8) 16 - 24 9
DO 22.3
(0.8) 17 - 31 18
20.1 (0.7) 14 - 25 16
23.7 (2.1) 18 - 28 4
22.9 (0.5) 13 - 32 38
20.6 (3.3) 16 - 27 3
22.1 (0.4) 13 - 32 61
23.4 (1.0) 15 - 36 20
BH 20.2
(0.4) 17 - 25 32
18.9 (0.8) 14 - 23 13
18.2 (0.2) 16 - 20 15
- - -
17.9 (0.0) 18 - 18 1
18.5 (0.4) 14 - 23 29
22.3 (1.2) 20 - 24 3
AR 0
0
0
- - -
- - -
- - -

Research Fishing and Fish Health Monitoring Program Post-dredging Report Season Ichthys Nearshore Environmental Monitoring Program
Prepared for INPEX Cardno 102
Species Location Baseline Phase Dredging 1 Dredging 2 Dredging 3 Dredging 4 Dredging Phase Post-dredging 1
Research Angling Mean (SE) LCF
Range LCF n
Mean (SE) LCF
Range LCF n
Mean (SE) LCF
Range LCF n
Mean (SE) LCF
Range LCF n
Mean (SE) LCF
Range LCF n
Mean (SE) LCF
Range LCF n
Mean (SE) LCF
Range LCF n
Black jewfish DI 39.4 (0.2) 39 - 40 2
39.9 (1.1) 36 - 45 7 0 0 0
39.9 (1.1) 36 - 45 7
0
DO 0
0 0
0
60.3 (0.0) 60 - 60 1
60.3 (0.0) 60 - 60 1
0
BH 0
0 0
- - -
0
0
0
AR 0 24.5 (0.4) 23 - 27 9
46.0 (0.0) 46 - 46 1 - - - - - -
- - -
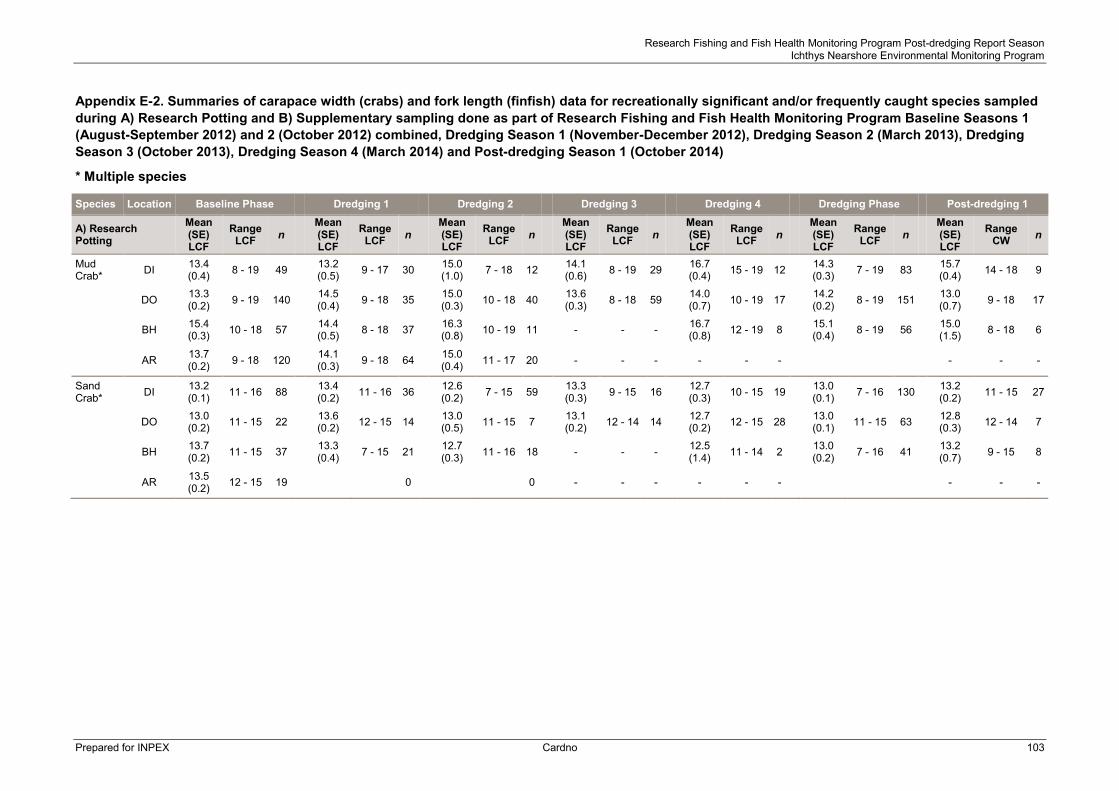
Research Fishing and Fish Health Monitoring Program Post-dredging Report Season Ichthys Nearshore Environmental Monitoring Program
Prepared for INPEX Cardno 103
Appendix E-2. Summaries of carapace width (crabs) and fork length (finfish) data for recreationally significant and/or frequently caught species sampled during A) Research Potting and B) Supplementary sampling done as part of Research Fishing and Fish Health Monitoring Program Baseline Seasons 1 (August-September 2012) and 2 (October 2012) combined, Dredging Season 1 (November-December 2012), Dredging Season 2 (March 2013), Dredging Season 3 (October 2013), Dredging Season 4 (March 2014) and Post-dredging Season 1 (October 2014)
* Multiple species
Species Location Baseline Phase Dredging 1 Dredging 2 Dredging 3 Dredging 4 Dredging Phase Post-dredging 1
A) Research Potting
Mean (SE) LCF
Range LCF n
Mean (SE) LCF
Range LCF n
Mean (SE) LCF
Range LCF n
Mean (SE) LCF
Range LCF n
Mean (SE) LCF
Range LCF n
Mean (SE) LCF
Range LCF n
Mean (SE) LCF
Range CW n
Mud Crab* DI 13.4
(0.4) 8 - 19 49 13.2 (0.5) 9 - 17 30
15.0 (1.0) 7 - 18 12
14.1 (0.6) 8 - 19 29
16.7 (0.4) 15 - 19 12
14.3 (0.3) 7 - 19 83
15.7 (0.4) 14 - 18 9
DO 13.3 (0.2) 9 - 19 140
14.5 (0.4) 9 - 18 35
15.0 (0.3) 10 - 18 40
13.6 (0.3) 8 - 18 59
14.0 (0.7) 10 - 19 17
14.2 (0.2) 8 - 19 151
13.0 (0.7) 9 - 18 17
BH 15.4 (0.3) 10 - 18 57
14.4 (0.5) 8 - 18 37
16.3 (0.8) 10 - 19 11 - - -
16.7 (0.8) 12 - 19 8
15.1 (0.4) 8 - 19 56
15.0 (1.5) 8 - 18 6
AR 13.7 (0.2) 9 - 18 120 14.1
(0.3) 9 - 18 64 15.0 (0.4) 11 - 17 20 - - - - - -
- - -
Sand Crab* DI 13.2
(0.1) 11 - 16 88 13.4 (0.2) 11 - 16 36
12.6 (0.2) 7 - 15 59
13.3 (0.3) 9 - 15 16
12.7 (0.3) 10 - 15 19
13.0 (0.1) 7 - 16 130
13.2 (0.2) 11 - 15 27
DO 13.0 (0.2) 11 - 15 22
13.6 (0.2) 12 - 15 14
13.0 (0.5) 11 - 15 7
13.1 (0.2) 12 - 14 14
12.7 (0.2) 12 - 15 28
13.0 (0.1) 11 - 15 63
12.8 (0.3) 12 - 14 7
BH 13.7 (0.2) 11 - 15 37
13.3 (0.4) 7 - 15 21
12.7 (0.3) 11 - 16 18 - - -
12.5 (1.4) 11 - 14 2
13.0 (0.2) 7 - 16 41
13.2 (0.7) 9 - 15 8
AR 13.5 (0.2) 12 - 15 19 0 0 - - - - - -
- - -
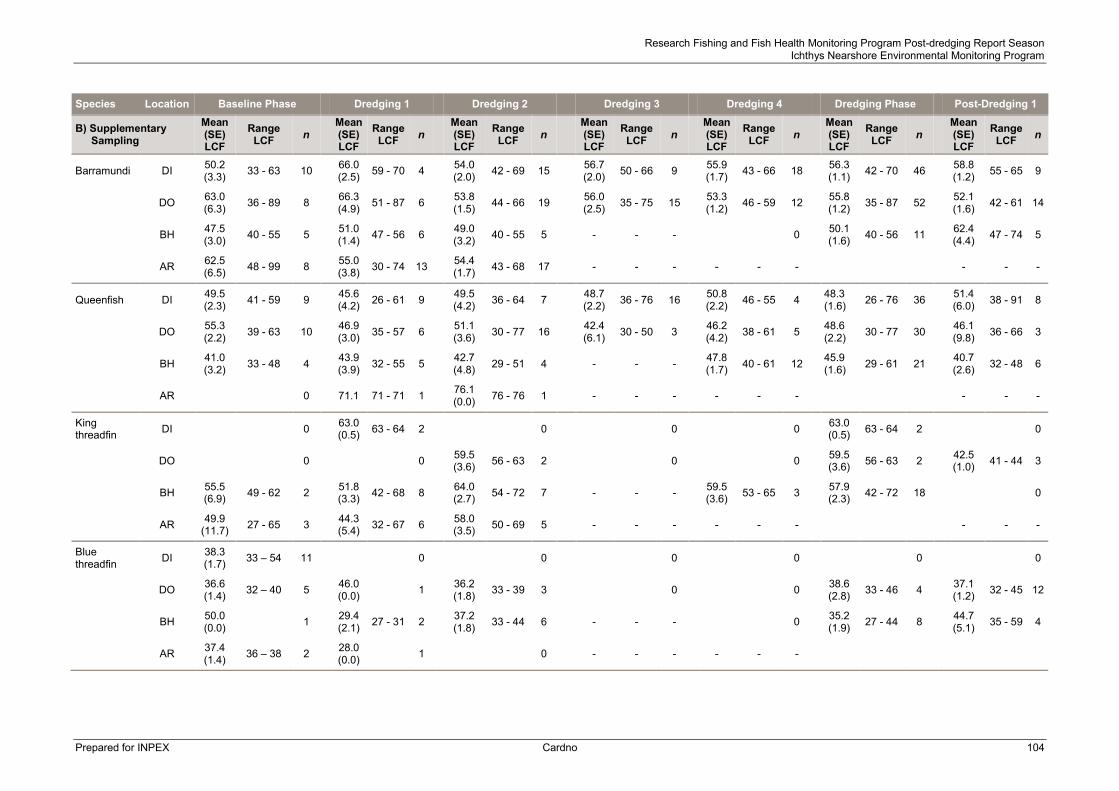
Research Fishing and Fish Health Monitoring Program Post-dredging Report Season Ichthys Nearshore Environmental Monitoring Program
Prepared for INPEX Cardno 104
Species Location Baseline Phase Dredging 1 Dredging 2 Dredging 3 Dredging 4 Dredging Phase Post-Dredging 1
B) Supplementary Sampling
Mean (SE) LCF
Range LCF n
Mean (SE) LCF
Range LCF n
Mean (SE) LCF
Range LCF n
Mean (SE) LCF
Range LCF n
Mean (SE) LCF
Range LCF n
Mean (SE) LCF
Range LCF n
Mean (SE) LCF
Range LCF n
Barramundi DI 50.2 (3.3) 33 - 63 10
66.0 (2.5) 59 - 70 4
54.0 (2.0) 42 - 69 15
56.7 (2.0) 50 - 66 9
55.9 (1.7) 43 - 66 18
56.3 (1.1) 42 - 70 46
58.8 (1.2) 55 - 65 9
DO 63.0
(6.3) 36 - 89 8
66.3 (4.9) 51 - 87 6
53.8 (1.5) 44 - 66 19
56.0 (2.5) 35 - 75 15
53.3 (1.2) 46 - 59 12
55.8 (1.2) 35 - 87 52
52.1 (1.6) 42 - 61 14
BH 47.5
(3.0) 40 - 55 5
51.0 (1.4) 47 - 56 6
49.0 (3.2) 40 - 55 5
- - -
0 50.1
(1.6) 40 - 56 11 62.4
(4.4) 47 - 74 5
AR 62.5
(6.5) 48 - 99 8
55.0 (3.8) 30 - 74 13
54.4 (1.7) 43 - 68 17
- - -
- - -
- - -
Queenfish DI 49.5 (2.3) 41 - 59 9
45.6 (4.2) 26 - 61 9
49.5 (4.2) 36 - 64 7
48.7 (2.2) 36 - 76 16
50.8 (2.2) 46 - 55 4
48.3 (1.6) 26 - 76 36
51.4 (6.0) 38 - 91 8
DO 55.3
(2.2) 39 - 63 10
46.9 (3.0) 35 - 57 6
51.1 (3.6) 30 - 77 16
42.4 (6.1) 30 - 50 3
46.2 (4.2) 38 - 61 5
48.6 (2.2) 30 - 77 30
46.1 (9.8) 36 - 66 3
BH 41.0
(3.2) 33 - 48 4
43.9 (3.9) 32 - 55 5
42.7 (4.8) 29 - 51 4
- - -
47.8 (1.7) 40 - 61 12
45.9 (1.6) 29 - 61 21
40.7 (2.6) 32 - 48 6
AR 0 71.1 71 - 71 1 76.1 (0.0) 76 - 76 1 - - - - - -
- - -
King threadfin DI 0
63.0 (0.5) 63 - 64 2 0 0 0
63.0 (0.5) 63 - 64 2
0
DO 0
0
59.5 (3.6) 56 - 63 2
0 0
59.5 (3.6) 56 - 63 2
42.5 (1.0) 41 - 44 3
BH 55.5
(6.9) 49 - 62 2
51.8 (3.3) 42 - 68 8
64.0 (2.7) 54 - 72 7
- - -
59.5 (3.6) 53 - 65 3
57.9 (2.3) 42 - 72 18
0
AR 49.9 (11.7) 27 - 65 3
44.3 (5.4) 32 - 67 6
58.0 (3.5) 50 - 69 5 - - - - - -
- - -
Blue threadfin
DI 38.3 (1.7) 33 – 54 11 0 0 0 0
0
0
DO 36.6 (1.4) 32 – 40 5
46.0 (0.0) 1
36.2 (1.8) 33 - 39 3 0 0
38.6 (2.8) 33 - 46 4
37.1 (1.2) 32 - 45 12
BH 50.0 (0.0) 1
29.4 (2.1) 27 - 31 2
37.2 (1.8) 33 - 44 6 - - - 0
35.2 (1.9) 27 - 44 8
44.7 (5.1) 35 - 59 4
AR 37.4 (1.4) 36 – 38 2
28.0 (0.0) 1 0 - - - - - -

Research Fishing and Fish Health Monitoring Program Post-dredging Report Season Ichthys Nearshore Environmental Monitoring Program
Prepared for INPEX Cardno 105
Ichthys Nearshore Environmental Monitoring Program
APPENDIX F DISEASE AND LESION INVENTORY
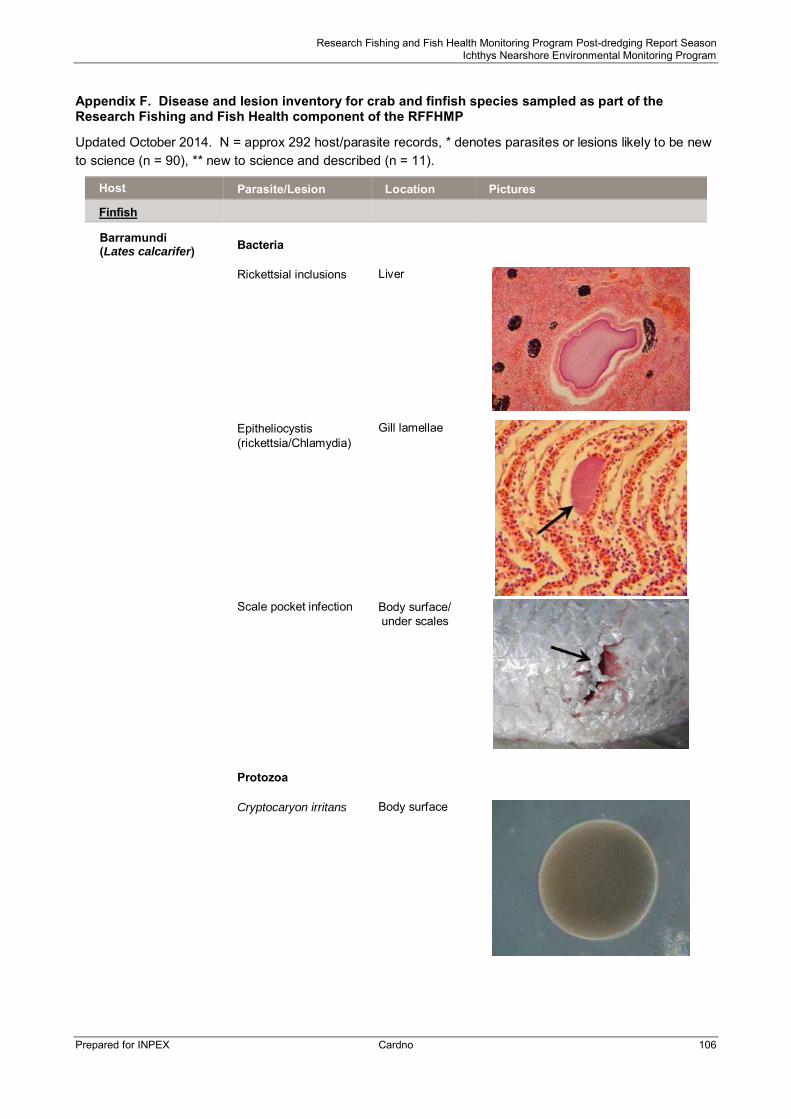
Research Fishing and Fish Health Monitoring Program Post-dredging Report Season Ichthys Nearshore Environmental Monitoring Program
Prepared for INPEX Cardno 106
Appendix F. Disease and lesion inventory for crab and finfish species sampled as part of the Research Fishing and Fish Health component of the RFFHMP
Updated October 2014. N = approx 292 host/parasite records, * denotes parasites or lesions likely to be new to science (n = 90), ** new to science and described (n = 11).
Host Parasite/Lesion Location Pictures
Finfish
Barramundi (Lates calcarifer) Bacteria
Rickettsial inclusions Liver
Epitheliocystis (rickettsia/Chlamydia)
Gill lamellae
Scale pocket infection Body surface/ under scales
Protozoa
Cryptocaryon irritans Body surface

Research Fishing and Fish Health Monitoring Program Post-dredging Report Season Ichthys Nearshore Environmental Monitoring Program
Prepared for INPEX Cardno 107
Host Parasite/Lesion Location Pictures
Finfish
Barramundi (Lates calcarifer)
Hennyguya sp. Gills
Liver protozoan* Liver
Trichodina sp. Gills
Metazoa
Copepoda
Lernanthropus latis Gills
Caligus epidemicus Body surface
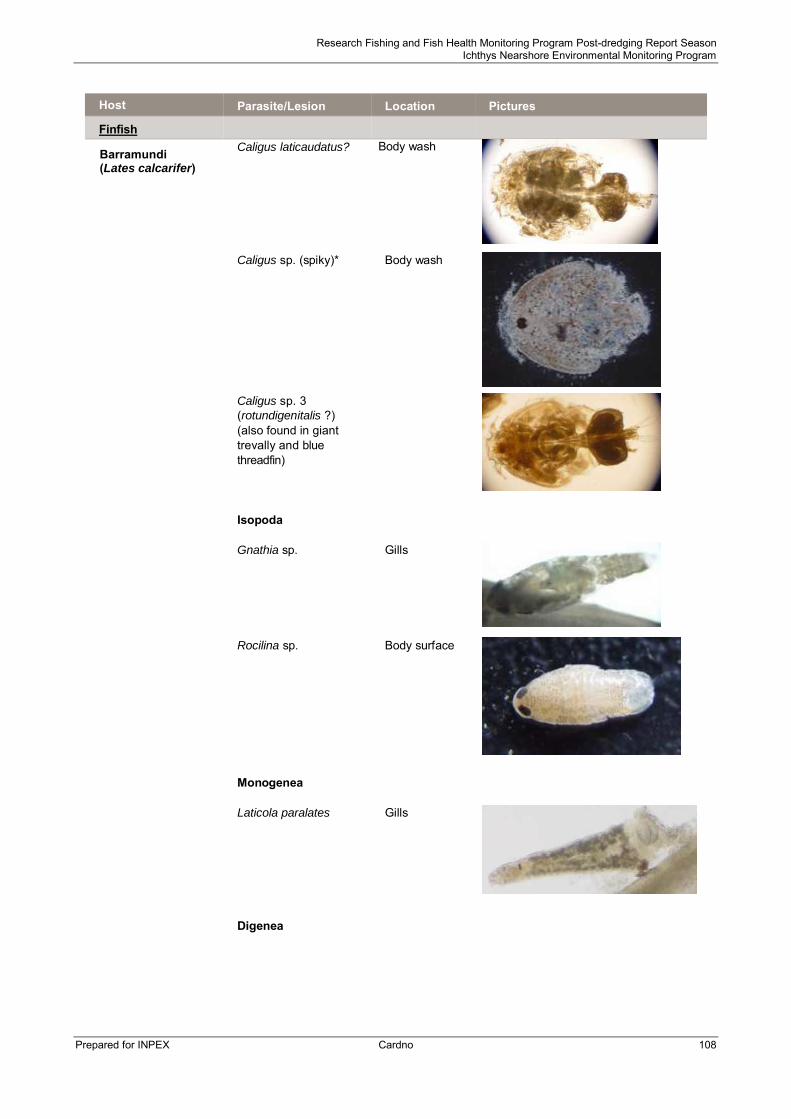
Research Fishing and Fish Health Monitoring Program Post-dredging Report Season Ichthys Nearshore Environmental Monitoring Program
Prepared for INPEX Cardno 108
Host Parasite/Lesion Location Pictures
Finfish
Barramundi (Lates calcarifer)
Caligus laticaudatus? Body wash
Caligus sp. (spiky)* Body wash
Caligus sp. 3 (rotundigenitalis ?) (also found in giant trevally and blue threadfin)
Isopoda
Gnathia sp. Gills
Rocilina sp. Body surface
Monogenea
Laticola paralates Gills
Digenea

Research Fishing and Fish Health Monitoring Program Post-dredging Report Season Ichthys Nearshore Environmental Monitoring Program
Prepared for INPEX Cardno 109
Host Parasite/Lesion Location Pictures
Finfish
Barramundi (Lates calcarifer)
Blood fluke eggs Blood vessels throughout internal organs
Nematoda
Anisakis spp. Mesenteries
Philometrid* Ovary/gonad
Cestoda
Trypanorhynch plerocercoid type 1 (small) Callitetrarhynchus sp. 1
Mesenteries
Trypanorhynch plerocercoid type 2 (large) Pterobothrium sp.
Mesenteries
Trypanorhynch plerocercoid type 3 (long) Callitetrarhynchus sp. 2
Mesenteries
Hirudinea
Zeylandicobdella arugamensis
Mouth
Bartailed flathead (Platycephalus indicus)
Metazoa
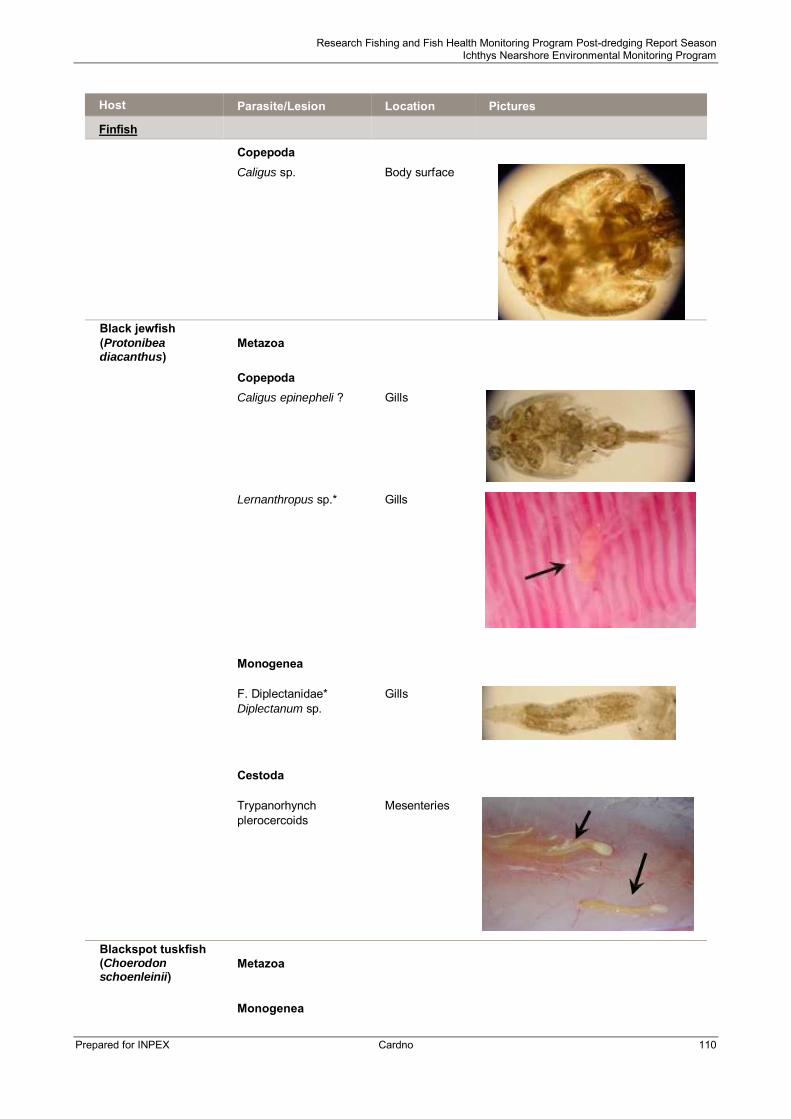
Research Fishing and Fish Health Monitoring Program Post-dredging Report Season Ichthys Nearshore Environmental Monitoring Program
Prepared for INPEX Cardno 110
Host Parasite/Lesion Location Pictures
Finfish
Copepoda
Caligus sp. Body surface
Black jewfish (Protonibea diacanthus)
Metazoa
Copepoda
Caligus epinepheli ? Gills
Lernanthropus sp.* Gills
Monogenea
F. Diplectanidae* Diplectanum sp.
Gills
Cestoda
Trypanorhynch plerocercoids
Mesenteries
Blackspot tuskfish (Choerodon schoenleinii)
Metazoa
Monogenea
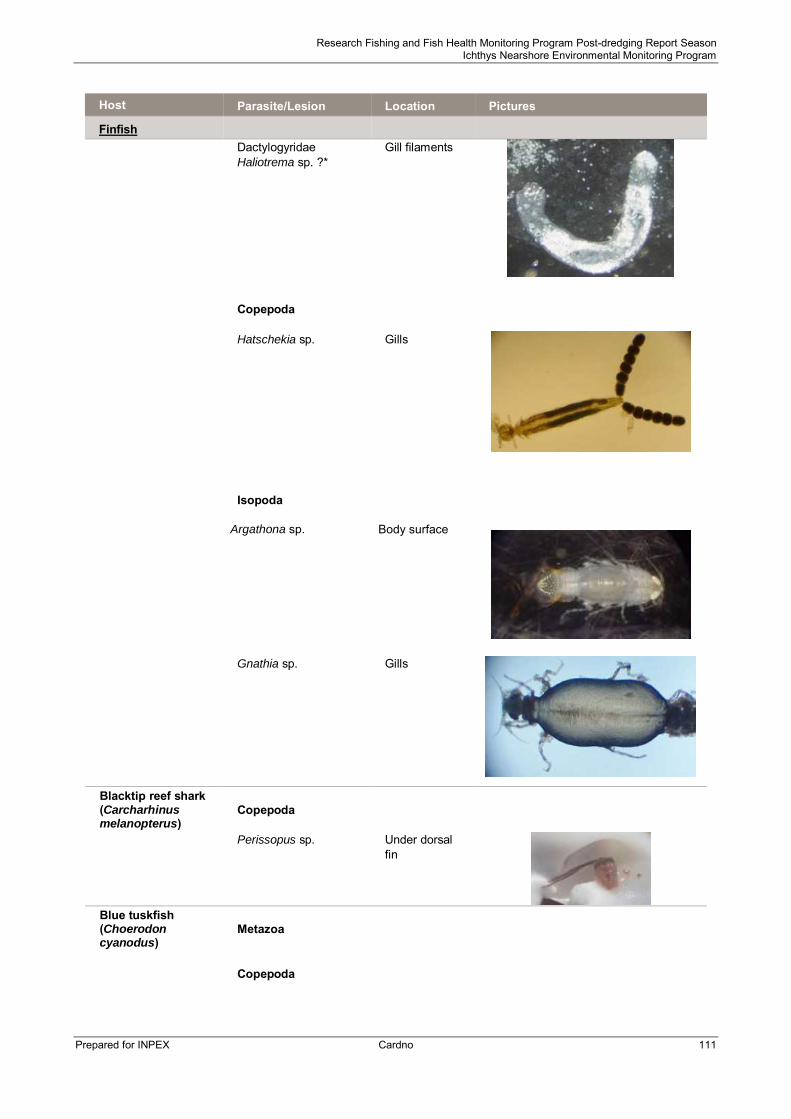
Research Fishing and Fish Health Monitoring Program Post-dredging Report Season Ichthys Nearshore Environmental Monitoring Program
Prepared for INPEX Cardno 111
Host Parasite/Lesion Location Pictures
Finfish
Dactylogyridae Haliotrema sp. ?*
Gill filaments
Copepoda
Hatschekia sp. Gills
Isopoda
Argathona sp. Body surface
Gnathia sp. Gills
Blacktip reef shark (Carcharhinus melanopterus)
Copepoda
Perissopus sp. Under dorsal fin
Blue tuskfish (Choerodon cyanodus)
Metazoa
Copepoda

Research Fishing and Fish Health Monitoring Program Post-dredging Report Season Ichthys Nearshore Environmental Monitoring Program
Prepared for INPEX Cardno 112
Host Parasite/Lesion Location Pictures
Finfish
Hatschekia sp. 1 Gills
Bomolochus sp. ? * Gills
Caligus sp. * Gills
Isopoda
Gnathia sp. A Gills
Gnathia sp. B Gills
Argathona sp. Body surface
Monogenea
Blue tuskfish (Choerodon cyanodus)
F. Dactylogyridae * Gill

Research Fishing and Fish Health Monitoring Program Post-dredging Report Season Ichthys Nearshore Environmental Monitoring Program
Prepared for INPEX Cardno 113
Host Parasite/Lesion Location Pictures
Finfish
Anoplodiscus-like *(= capsalid for data entry)
Pectoral fin
Benedenia sp.* Body surface
Blue threadfin (Eleutheronema tetradactylus)
Protozoa
Coccidian ? * Liver
Metazoa
Copepoda
Thysanote
eleutheronemi Operculum branchiostegal membranes
Caligus epinepheli ? Gills, gill arch
Caligus sp. 3 (rotundigenitalis ?) (also found in giant trevally and barramundi)
Gill arch
Blue threadfin (Eleutheronema tetradactylus)
Caligus sp. (big) * Body surface

Research Fishing and Fish Health Monitoring Program Post-dredging Report Season Ichthys Nearshore Environmental Monitoring Program
Prepared for INPEX Cardno 114
Host Parasite/Lesion Location Pictures
Finfish
Naobranchia cf. polynemi
Gills
Lernaeenicus polynemi Dorsal and anal fins
Isopoda
Gnathia sp. Gills
Monogenea
Diplectanum polynemus ?
Gills
Nematoda
Philometroides
eleutheronemae** Gonad
Blue threadfin (Eleutheronema
tetradactylus)
Anisakis sp. Viscera/ mesenteries
Cestoda

Research Fishing and Fish Health Monitoring Program Post-dredging Report Season Ichthys Nearshore Environmental Monitoring Program
Prepared for INPEX Cardno 115
Host Parasite/Lesion Location Pictures
Finfish
Trypanorhynch plerocercoids
Mesenteries
Bluespotted trevally (Caranx bucculentus)
Protozoa
Microsporidian
xenomas * Mesenteries and liver
Metazoa
Copepoda
Caligus sp. 1 Body surface
Caligus sp. 2 Gill arch
Cestoda
Bluespotted trevally (Caranx bucculentus)
Trypanorhynch plerocercoids *
Viscera/ mesenteries

Research Fishing and Fish Health Monitoring Program Post-dredging Report Season Ichthys Nearshore Environmental Monitoring Program
Prepared for INPEX Cardno 116
Host Parasite/Lesion Location Pictures
Finfish
Bream (Acanthopagrus berda)
Lesions
Kidney Cysts Kidney
Protozoa
Hennyguya sp. Gill arches
Myxosporea * Kidney
Metazoa
Copepoda
Lernanthropus sp. (atrox ?)
Gills
Ergasilus lizae Gills
Bream (Acanthopagrus berda)
Caligus epinepheli ? Gill arch

Research Fishing and Fish Health Monitoring Program Post-dredging Report Season Ichthys Nearshore Environmental Monitoring Program
Prepared for INPEX Cardno 117
Host Parasite/Lesion Location Pictures
Finfish
Caligus epidemicus Body surface
Neobrachiella sp. (Brachiella for data entry)
Mouth
Monogenea
Polylabroides
longispinosus
Gill
Digenea
Transversotrema sp. Pectoral fin
Nematoda
Anisakis sp. Mesenteries
Procamallanus sp. * Body wash
Brown banded rock cod (Cephalopholis boenak)
Copepoda

Research Fishing and Fish Health Monitoring Program Post-dredging Report Season Ichthys Nearshore Environmental Monitoring Program
Prepared for INPEX Cardno 118
Host Parasite/Lesion Location Pictures
Finfish
Lernaeid *(Thyansote like)
Gill arch
Caligus epinepheli ? Gill arch
Cestoda
Black plerocercoids Mesenteries
Brown sweetlip (Plectorhinchus
gibbosus) Monogenea
Dactylogyridae* Haliotrema sp. ?*
Gill filaments
Cat shark (Altelomycterus sp.) Copepoda
Hemigaleus sp. ? Under anal fin
Crimson snapper (Lutjanus erythropterus)
Metazoa
Copepoda
Caligus epinepheli ?
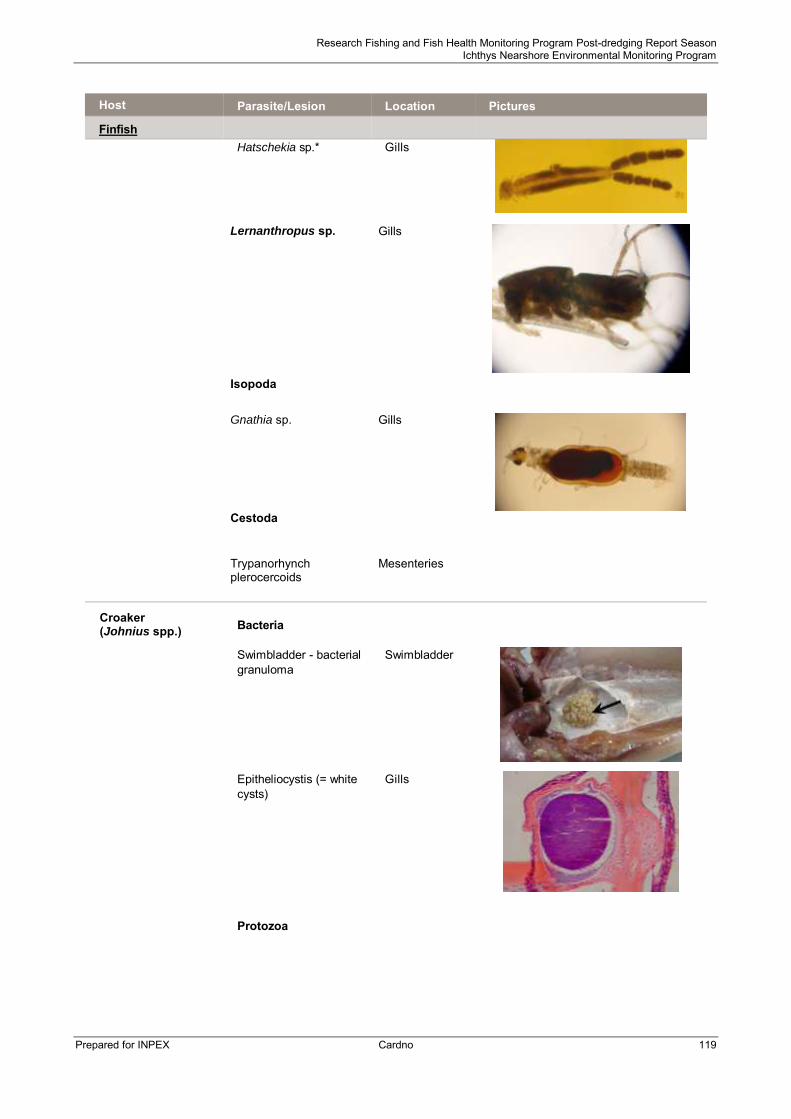
Research Fishing and Fish Health Monitoring Program Post-dredging Report Season Ichthys Nearshore Environmental Monitoring Program
Prepared for INPEX Cardno 119
Host Parasite/Lesion Location Pictures
Finfish
Hatschekia sp.* Gills
Lernanthropus sp. Gills
Isopoda
Gnathia sp. Gills
Cestoda
Trypanorhynch plerocercoids
Mesenteries
Croaker (Johnius spp.) Bacteria
Swimbladder - bacterial granuloma
Swimbladder
Epitheliocystis (= white cysts)
Gills
Protozoa

Research Fishing and Fish Health Monitoring Program Post-dredging Report Season Ichthys Nearshore Environmental Monitoring Program
Prepared for INPEX Cardno 120
Host Parasite/Lesion Location Pictures
Finfish Croaker (Johnius spp.)
Cryptocaryon irritans Body surface
Metazoa
Branchiura
Argulus sp.* Body surface
Isopoda
Rocinela sp. cf orientalis
Body surface
Monogenea
F. Dactylogyridae * Gills
Microcotyle sp. ? * Gills
Digenea
Didymozoid * Gill
arches/rakers

Research Fishing and Fish Health Monitoring Program Post-dredging Report Season Ichthys Nearshore Environmental Monitoring Program
Prepared for INPEX Cardno 121
Host Parasite/Lesion Location Pictures
Finfish Croaker (Johnius spp.)
Metercercaria Gill filaments
Cestoda
Trypanorhynch plerocercoids
Mesenteries
Nematoda
Anisakis sp. Mesenteries
Camallanus sp. ? Body wash
Philometrid nematode Gonad See Philometra johnii
Diamondfish (Monodactylus argenteus)
Copepoda
Caligus epidemicus Body surface
Diamondscale mullet (Liza vaigiensis)
Metazoa
Copepoda
Ergasilidae* Gill filaments
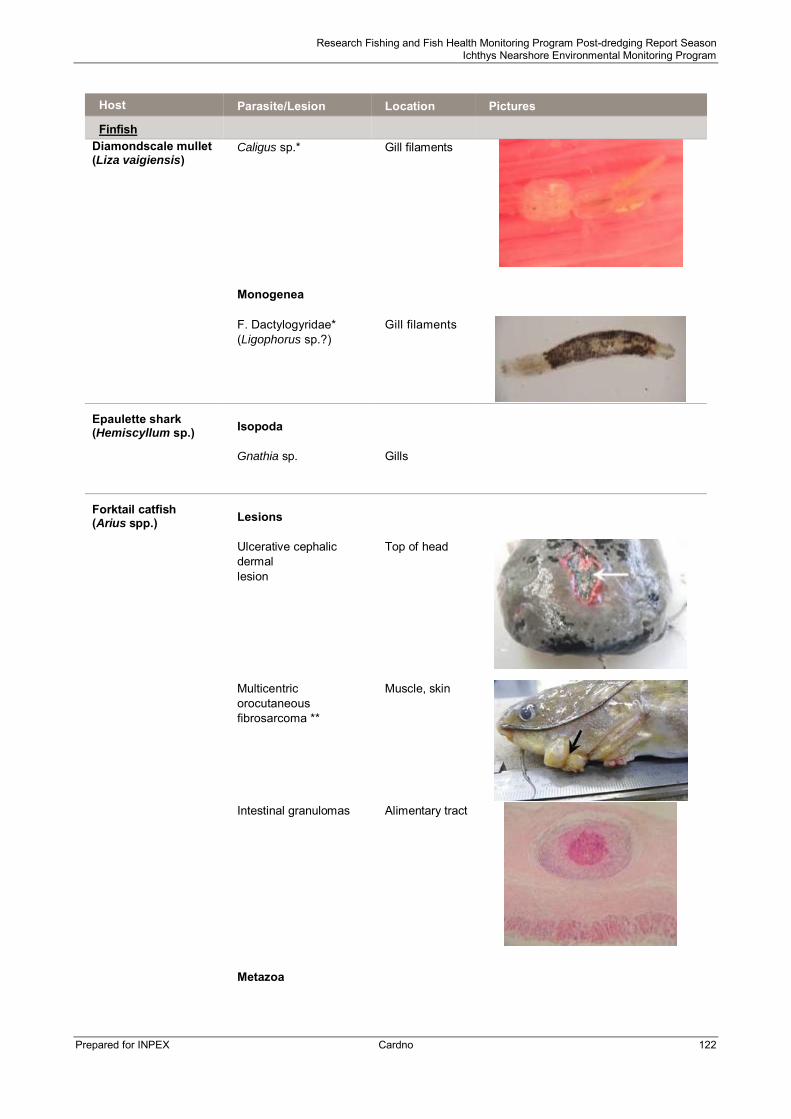
Research Fishing and Fish Health Monitoring Program Post-dredging Report Season Ichthys Nearshore Environmental Monitoring Program
Prepared for INPEX Cardno 122
Host Parasite/Lesion Location Pictures
Finfish Diamondscale mullet (Liza vaigiensis)
Caligus sp.* Gill filaments
Monogenea
F. Dactylogyridae* (Ligophorus sp.?)
Gill filaments
Epaulette shark (Hemiscyllum sp.) Isopoda
Gnathia sp. Gills
Forktail catfish (Arius spp.) Lesions
Ulcerative cephalic dermal lesion
Top of head
Multicentric orocutaneous fibrosarcoma **
Muscle, skin
Intestinal granulomas Alimentary tract
Metazoa

Research Fishing and Fish Health Monitoring Program Post-dredging Report Season Ichthys Nearshore Environmental Monitoring Program
Prepared for INPEX Cardno 123
Host Parasite/Lesion Location Pictures
Finfish
Forktail catfish (Arius spp.) Monogenea
F. Dactylogyridae * Gill filaments
Copepoda
Hermilius sp.
Caligus sp. Gills
Ergasilus sp. Gills
Isopoda
Rocilina spp. Body surface
Cestoda
Plerocercoids Mesenteries
Nematoda
Anisakis spp. Mesenteries
Giant herring (Elops hawaiensis) Copepoda
Caligus sp. Body surface

Research Fishing and Fish Health Monitoring Program Post-dredging Report Season Ichthys Nearshore Environmental Monitoring Program
Prepared for INPEX Cardno 124
Host Parasite/Lesion Location Pictures
Finfish
Golden snapper (Lutjanus johnii) Lesions
Clear cell focus Liver
Bacteria
Epitheliocystis (rickettsia/chlamydia)
Gill lamellae
Protozoa
Cryptocaryon irritans Body surface
Myxosporeans* Kidney
Metazoa
Copepoda

Research Fishing and Fish Health Monitoring Program Post-dredging Report Season Ichthys Nearshore Environmental Monitoring Program
Prepared for INPEX Cardno 125
Host Parasite/Lesion Location Pictures
Finfish Golden snapper (Lutjanus johnii)
Neobrachiella sp.* Inside mouth
Hatschekia sp. Gills
Ergasilus spp. Gills – base of primary gill filaments
Caligus epinepheli ? Gill arches
Lernanthropus sp.* Gills
Argulus sp.* Body surface
Isopoda
Rocinela cf. orientalis Body surface

Research Fishing and Fish Health Monitoring Program Post-dredging Report Season Ichthys Nearshore Environmental Monitoring Program
Prepared for INPEX Cardno 126
Host Parasite/Lesion Location Pictures
Finfish Golden snapper (Lutjanus johnii)
Argathona sp.* Gills
Hirudinea
Zeylanicobdella
arugamensis
Inside mouth
Monogenea
Euryhaliotrema johni Gill filaments
Euryhaliotrema lisae ** Gill filaments
Euryhaliotrema
longibaculoides ** Gill filaments
Benedenia sp.* Body wash
Digenea

Research Fishing and Fish Health Monitoring Program Post-dredging Report Season Ichthys Nearshore Environmental Monitoring Program
Prepared for INPEX Cardno 127
Host Parasite/Lesion Location Pictures
Finfish
Didymozoid sp. 1* Fillet, gills
Didymozoid sp. 2* Body wash
Didymozoid sp. 3* Pectoral fins
F. Hemiuridae (digenean)
Stomach
Cestoda
Trypanorhynch plerocercoids
Mesenteries
Nematoda
Philometra johnii ** Gills, gonad
Golden trevally (Gnathanodon speciosus)
Protozoa
Cryptocaryon irritans Body surface

Research Fishing and Fish Health Monitoring Program Post-dredging Report Season Ichthys Nearshore Environmental Monitoring Program
Prepared for INPEX Cardno 128
Host Parasite/Lesion Location Pictures
Finfish
Golden trevally (Gnathanodon speciosus)
Metazoa
Copepoda
Caligus sp. 3 (rotundigenitalis ?) (also found in giant trevally and blue threadfin)
Gill arches
Lepeoptheirus spinifer Body surface
Monogenea
Family Heteraxinidae* Gill filaments
Nematoda
Anisakis sp. Mesenteries
Cestoda
Trypanorhynch plerocercoids
Viscera/ mesenteries
Goldspotted rockcod (Epinephelus coioides)
Lesions
Cataract Eye

Research Fishing and Fish Health Monitoring Program Post-dredging Report Season Ichthys Nearshore Environmental Monitoring Program
Prepared for INPEX Cardno 129
Host Parasite/Lesion Location Pictures
Finfish
Goldspotted rockcod (Epinephelus coioides)
Bacteria
Epitheliocystis (rickettsia/chlamydia)
Gill lamellae
Metazoa
Copepoda
Ergasilus sp.* Gills, nauplii (N) on gill tips and gill arches, adults (A) on gill filaments
Lernanthropus sp.* Gills
Caligus sp.* (spiky) Body surface
Isopoda
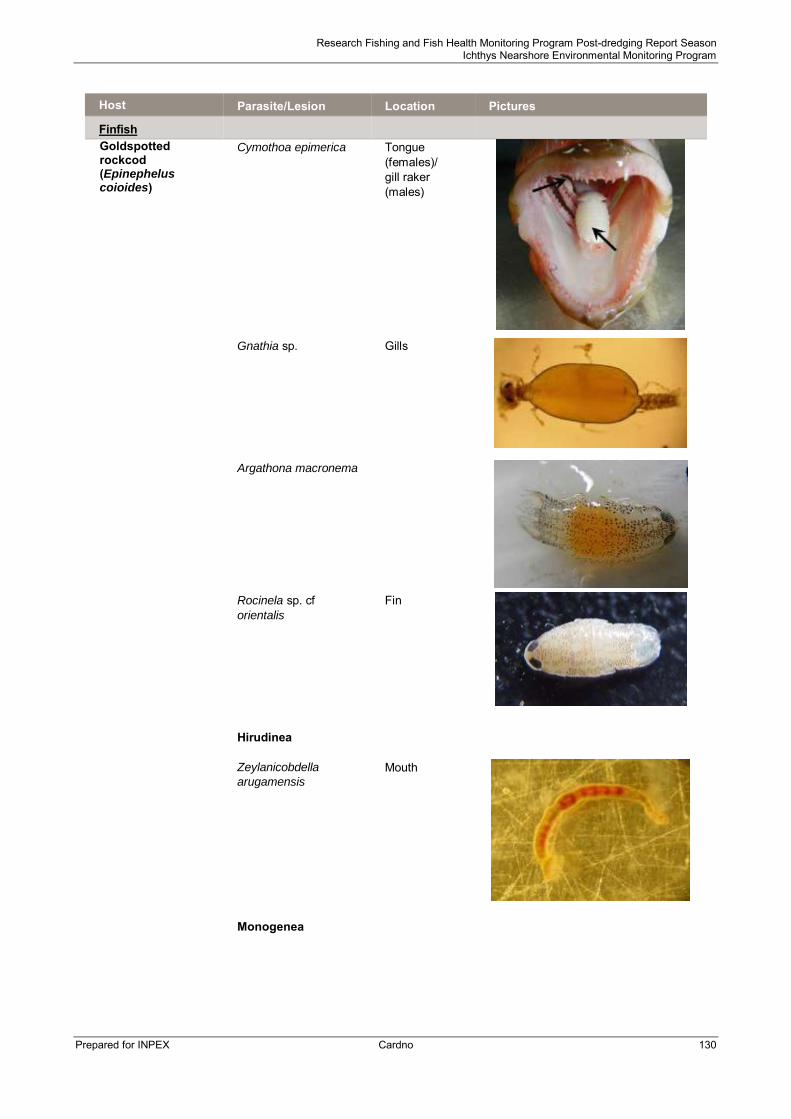
Research Fishing and Fish Health Monitoring Program Post-dredging Report Season Ichthys Nearshore Environmental Monitoring Program
Prepared for INPEX Cardno 130
Host Parasite/Lesion Location Pictures
Finfish Goldspotted rockcod (Epinephelus coioides)
Cymothoa epimerica Tongue (females)/ gill raker (males)
Gnathia sp. Gills
Argathona macronema
Rocinela sp. cf orientalis
Fin
Hirudinea
Zeylanicobdella
arugamensis Mouth
Monogenea

Research Fishing and Fish Health Monitoring Program Post-dredging Report Season Ichthys Nearshore Environmental Monitoring Program
Prepared for INPEX Cardno 131
Host Parasite/Lesion Location Pictures
Finfish Goldspotted rockcod (Epinephelus coioides)
Pseudorhabdosynochus
sp.* Gill (in pairs on primary gill filaments)
Digenea
Didymozoid * First gill arch
Nematoda
Spirophilometra
endangae Pectoral, caudal, dorsal fins
Philometra epinepheli Inner operculum
Grass emperor (Lethrinus laticaudatus)
Metazoa
Copepoda
Grass emperor (Lethrinus laticaudatus)
Hatschekia sp. 3 * Gills

Research Fishing and Fish Health Monitoring Program Post-dredging Report Season Ichthys Nearshore Environmental Monitoring Program
Prepared for INPEX Cardno 132
Host Parasite/Lesion Location Pictures
Finfish
Bomolochus sp.* Body wash
Isopoda
Gnathia sp. Gills
Monogenea
F. Dactylogyridae* Gills
Indonesian snapper (Lutjanus bitaeniatus)
Metazoa
Copepoda
Hatschekia sp. Gills
Isopoda
Unidentified isopod* Buccal cavity
Digenea
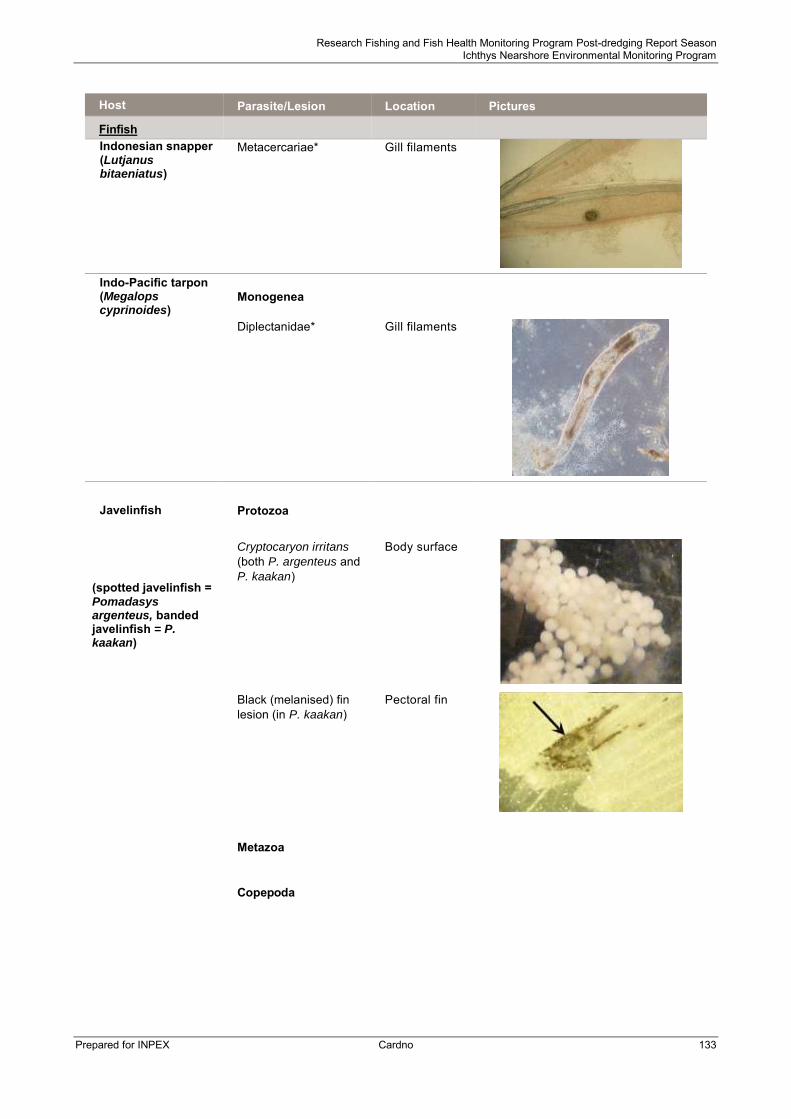
Research Fishing and Fish Health Monitoring Program Post-dredging Report Season Ichthys Nearshore Environmental Monitoring Program
Prepared for INPEX Cardno 133
Host Parasite/Lesion Location Pictures
Finfish Indonesian snapper (Lutjanus bitaeniatus)
Metacercariae* Gill filaments
Indo-Pacific tarpon (Megalops cyprinoides)
Monogenea
Diplectanidae* Gill filaments
Javelinfish Protozoa
(spotted javelinfish = Pomadasys argenteus, banded javelinfish = P. kaakan)
Cryptocaryon irritans
(both P. argenteus and P. kaakan)
Body surface
Black (melanised) fin lesion (in P. kaakan)
Pectoral fin
Metazoa
Copepoda

Research Fishing and Fish Health Monitoring Program Post-dredging Report Season Ichthys Nearshore Environmental Monitoring Program
Prepared for INPEX Cardno 134
Host Parasite/Lesion Location Pictures
Finfish Javelinfish (spotted javelinfish = Pomadasys argenteus, banded javelinfish = P. kaakan)
Lernanthropus sp. * (both P. argenteus and P. kaakan)
Gills
Ergasilid* (in P. kaakan)
Gill
Isopoda
Rocinela sp. cf orientalis (both P. argenteus and P. kaakan)
Body surface
Hirudinea
Zeylanicobdella
arugamensis (in P.
kaakan)
Inside mouth
Monogenea
F. Dactylogyridae n.g.* (Bravohollisae sp. ?) (P. argenteus and P.
kaakan)
Gill
F. Capsalidae* (in P. kaakan)
Body surface

Research Fishing and Fish Health Monitoring Program Post-dredging Report Season Ichthys Nearshore Environmental Monitoring Program
Prepared for INPEX Cardno 135
Host Parasite/Lesion Location Pictures
Finfish
Unidentified Monopisthocotylean* Dicrumenia spp.? (Calceostomatidae) (in P. argenteus)
gill
Digenea
Transversotrema sp. * (in P. argenteus)
Body surface
Cestoda
Trypanorhynch plerocercoids (both P.
argenteus and P.
kaakan)
Mesenteries
Nematoda
Philometrid nematode ** (Philometra spp. #2) (both P. argenteus and P. kaakan)
Gonad
King threadfin (Polydactylus macrochir)
Metazoa
Copepoda
Thysanote
eleutheronemi
Branchiostegal membranes
Ergasilus sp.* Gill filaments
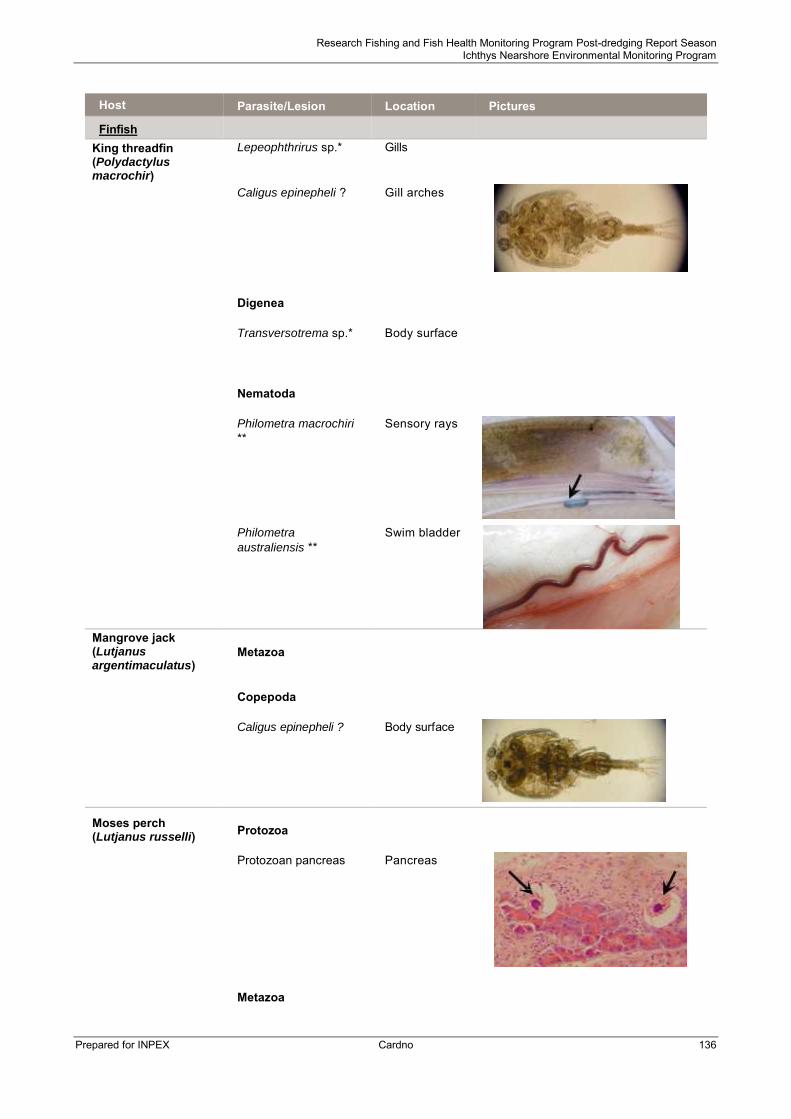
Research Fishing and Fish Health Monitoring Program Post-dredging Report Season Ichthys Nearshore Environmental Monitoring Program
Prepared for INPEX Cardno 136
Host Parasite/Lesion Location Pictures
Finfish
King threadfin (Polydactylus macrochir)
Lepeophthrirus sp.* Gills
Caligus epinepheli ? Gill arches
Digenea
Transversotrema sp.* Body surface
Nematoda
Philometra macrochiri **
Sensory rays
Philometra
australiensis ** Swim bladder
Mangrove jack (Lutjanus argentimaculatus)
Metazoa
Copepoda
Caligus epinepheli ? Body surface
Moses perch (Lutjanus russelli) Protozoa
Protozoan pancreas Pancreas
Metazoa

Research Fishing and Fish Health Monitoring Program Post-dredging Report Season Ichthys Nearshore Environmental Monitoring Program
Prepared for INPEX Cardno 137
Host Parasite/Lesion Location Pictures
Finfish
Moses perch (Lutjanus russelli) Copepoda
Lernanthropus sp. Gill
Hatschekia sp.* Gill
Caligus epinepheli ? Gill
Isopoda
Gnathia sp. Gill
Monogenea
F. Dactylogyridae* Gill
Benedenia sp.* Body surface
Digenea
Didymozoid* Gill arch

Research Fishing and Fish Health Monitoring Program Post-dredging Report Season Ichthys Nearshore Environmental Monitoring Program
Prepared for INPEX Cardno 138
Host Parasite/Lesion Location Pictures
Finfish Moses perch (Lutjanus russelli)
Transversotrema sp.* Body surface
Cestoda
Trypanorhynch plerocercoids
Mesenteries
Nematoda
Contracaecum sp. Gut
Northern whiting (Sillago sihama) Copepoda
Caligus sp. Body surface
Monogenea
Diplectanum
sillagonum
Gill
Queenfish (Scomberoides commersonianus)
Bacteria
Epitheliocystis
(rickettsia/Chlamydia) Gill lamellae
Rickettsial inclusions Liver

Research Fishing and Fish Health Monitoring Program Post-dredging Report Season Ichthys Nearshore Environmental Monitoring Program
Prepared for INPEX Cardno 139
Host Parasite/Lesion Location Pictures
Finfish
Queenfish (Scomberoides commersonianus)
Protozoa
Cryptocaryon irritans Gill filaments
Metazoa
Copepoda
Caligus epidemicus Body surface
Caligus epinepheli ? Gill arches
Caligus spp. 1 (also found in giant trevally and blue threadfin)
Body surface
Caligus spp. 4 * Body surface
Lernanthropus sp.* Gills
Ergasilus sp.* gills

Research Fishing and Fish Health Monitoring Program Post-dredging Report Season Ichthys Nearshore Environmental Monitoring Program
Prepared for INPEX Cardno 140
Host Parasite/Lesion Location Pictures
Finfish Queenfish (Scomberoides commersonianus)
Lepeoptheirus spinifer Body surface
Isopoda
Argathona sp. Body surface
Monogenea
Neobenedenia sp.* Body surface
Heterapta sp. cf heterapta
Gills
Cestoda
Cestode plerocercoids Mesenteries, viscera
Nematoda
Anisakis spp. Encysted on
liver

Research Fishing and Fish Health Monitoring Program Post-dredging Report Season Ichthys Nearshore Environmental Monitoring Program
Prepared for INPEX Cardno 141
Host Parasite/Lesion Location Pictures
Finfish Queenfish (Scomberoides commersonianus)
Buckleyella ornata ** (Philometridae)
Mesenteries
School mackerel (Scomberomorus queenslandicus)
Copepoda
Caligus sp. (chalimus stage)
Gill arches
Sea mullet (Mugil cephalus) Lesions
Granulomas Spleen
Protozoa
Myxobolus sp.* Gill arches, gill filaments, caudal fin
Metazoa
Copepoda
Caligus epinepheli ? Gill arches
Caligus epidemicus Body surface
Caligus sp. 2 * Operculum
Sea mullet (Mugil cephalus)
Ergasilus sp.* Gill filaments

Research Fishing and Fish Health Monitoring Program Post-dredging Report Season Ichthys Nearshore Environmental Monitoring Program
Prepared for INPEX Cardno 142
Host Parasite/Lesion Location Pictures
Finfish
Hirudinea
Zeylanicobdella
arugamensis
Gill arch
Monogenea
Ligophorus sp.* Gill filaments
Metamicrocotyla sp.? * Gill filaments
Shortfin batfish (Zabidius novaemaculeata)
Metazoa
Copepoda
Ergasilidae Gills
Monogenea
F. Dactylogyridae* Gills
Benedenia sp. * Skin
Digenea
F. Hemiuridae * Stomach
Shortfin batfish (Zabidius novaemaculeata)
Nematoda

Research Fishing and Fish Health Monitoring Program Post-dredging Report Season Ichthys Nearshore Environmental Monitoring Program
Prepared for INPEX Cardno 143
Host Parasite/Lesion Location Pictures
Finfish
Anisakis sp. Mesenteries
Philometra zabidii ** Gonads
Cestoda
Plerocercoids Mesenteries
Silver scat (Scatophagus spp.) Metazoa
Copepoda
Ergasilidae Gills
Lernanthropus sp. Gills
Caligus epinepheli ? Gill arch
Monogenea
F. Dactylogyridae * Gill
Sliteye shark (Loxodon spp.) Copepoda
Perissopus sp. In nostril
Snubnosed garfish (Arrhamphus sclerolepis)
Metazoa

Research Fishing and Fish Health Monitoring Program Post-dredging Report Season Ichthys Nearshore Environmental Monitoring Program
Prepared for INPEX Cardno 144
Host Parasite/Lesion Location Pictures
Finfish
Copepoda
Caligus epinepheli ? Buccal cavity
Sombre sweetlip (Plectorhinchus unicolor)
Metazoa
Copepoda
Caligus sp. 2 Body wash
F. Bomolochidae ? * Gills
Monogenea
Capsalid * Body surface
Spotted mackerel (Scomberomorus munroi)
Metazoa
Monogenea
Polyopisthocotylean Gill filaments
Cestoda
Cestode plerocercoids Mesenteries,
viscera
Spotty cod (Epinephelus areolatus)
Metazoa
Nematoda

Research Fishing and Fish Health Monitoring Program Post-dredging Report Season Ichthys Nearshore Environmental Monitoring Program
Prepared for INPEX Cardno 145
Host Parasite/Lesion Location Pictures
Finfish Spotty cod (Epinephelus areolatus)
Spirophilometra
endangae
Pectoral fins
Stripey snapper (Lutjanus carponotatus)
Metazoa
Copepoda
Hatschekia sp.* Gills
Lernanthropus sp. Gills
Caligus epinepheli ? Gill arch
Caligus sp. (spiky)* Body surface
Isopoda
Gnathia sp. Gills

Research Fishing and Fish Health Monitoring Program Post-dredging Report Season Ichthys Nearshore Environmental Monitoring Program
Prepared for INPEX Cardno 146
Host Parasite/Lesion Location Pictures
Finfish Stripey snapper (Lutjanus carponotatus)
Argathona sp.* Gills
Monogenea
F. Dactylogyridae* Gill
Benedenia lutjani Fins, gills
Digenea
Transversotrema sp. Body surface
Nematoda
Philometrid nematode ** (Philometra spp. #1)
Gonad
Trevally (Giant trevally – Caranx ignoblis, Brassy Trevally Caranx papuensis)
Protozoa
Gill cysts
Metazoa
Copepoda

Research Fishing and Fish Health Monitoring Program Post-dredging Report Season Ichthys Nearshore Environmental Monitoring Program
Prepared for INPEX Cardno 147
Host Parasite/Lesion Location Pictures
Finfish
Trevally (Giant trevally – Caranx ignoblis, Brassy Trevally Caranx papuensis)
Caligus spp. 1 Body surface
Caligus spp. 2 Gill arches
Caligus sp. 3 (rotundigenitalis ?) (also found in barramundi and blue threadfin)
Gill arches
Lernanthropus sp. Gills
Isopoda
Argathona sp. Body surface
Monogenea
Protomicrocotyle sp. Gills
Heteraxine sp.* Gills
Heteromicrocotyloides sp.
Gills
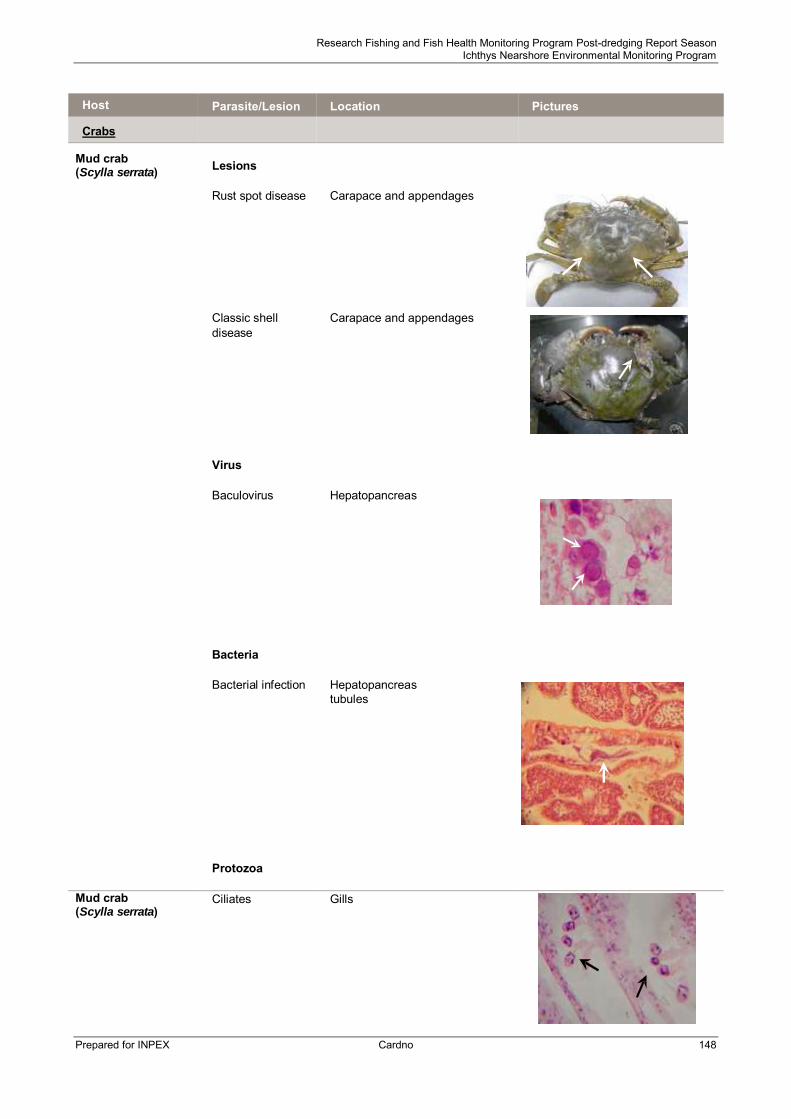
Research Fishing and Fish Health Monitoring Program Post-dredging Report Season Ichthys Nearshore Environmental Monitoring Program
Prepared for INPEX Cardno 148
Host Parasite/Lesion Location Pictures
Crabs
Mud crab (Scylla serrata) Lesions
Rust spot disease Carapace and appendages
Classic shell disease
Carapace and appendages
Virus
Baculovirus Hepatopancreas
Bacteria
Bacterial infection Hepatopancreas tubules
Protozoa
Mud crab (Scylla serrata)
Ciliates Gills

Research Fishing and Fish Health Monitoring Program Post-dredging Report Season Ichthys Nearshore Environmental Monitoring Program
Prepared for INPEX Cardno 149
Host Parasite/Lesion Location Pictures
Crabs
Metazoa
Cirripedia
Octolasmis spp. A (large)
Gills
Octolasmis spp. B (small)
Gills
Chelonibia spp. (barnacle)
Carapace
Loxothylacus ihlei External
Olive mud crab (Scylla olivaceous) Lesions
Classic shell disease
Carapace As for Scylla serrata
Olive mud crab (Scylla olivaceous) Metazoa

Research Fishing and Fish Health Monitoring Program Post-dredging Report Season Ichthys Nearshore Environmental Monitoring Program
Prepared for INPEX Cardno 150
Host Parasite/Lesion Location Pictures
Crabs
Cirripedia
Octolasmis spp. A (large)
Gills As for Scylla serrata
Octolasmis spp. B (large)
Gills As for Scylla serrata
Sand crabs (Portunus pelagicus and P. armatus)
Lesions
Rust spot disease Carapace and appendages
Classic shell disease
Carapace and appendages
Granulomas Digestive gland
Virus
Virus-like inclusions*
Cuticular epithelium
Bacteria

Research Fishing and Fish Health Monitoring Program Post-dredging Report Season Ichthys Nearshore Environmental Monitoring Program
Prepared for INPEX Cardno 151
Host Parasite/Lesion Location Pictures
Crabs
Sand crabs (Portunus pelagicus and P. armatus)
Rickettsia/ Chlamydia* (P.
pelagicus only)
Digestive gland
Digestive gland bacteria
Digestive gland
Protozoa
Ciliates Gills
Metazoa
Cirripedia
Octolasmis spp. A (large)
Gills
Octolasmis spp. B (small)
Gills
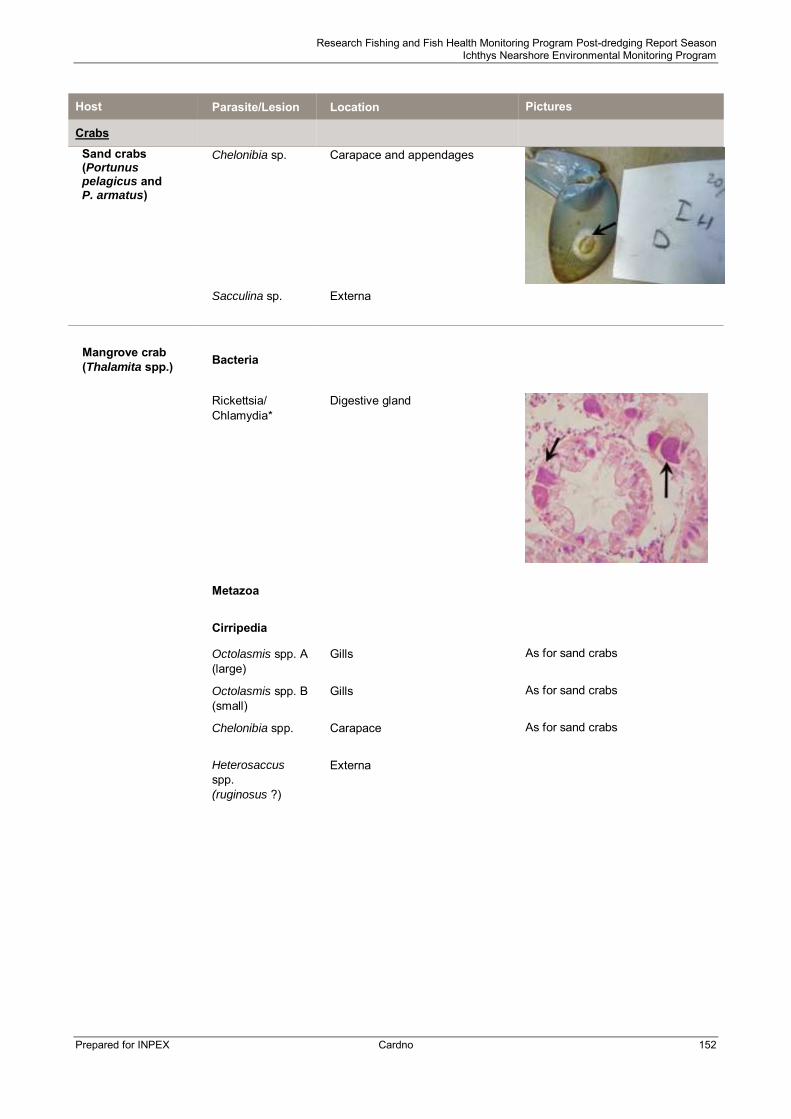
Research Fishing and Fish Health Monitoring Program Post-dredging Report Season Ichthys Nearshore Environmental Monitoring Program
Prepared for INPEX Cardno 152
Host Parasite/Lesion Location Pictures
Crabs
Sand crabs (Portunus pelagicus and P. armatus)
Chelonibia sp. Carapace and appendages
Sacculina sp. Externa
Mangrove crab (Thalamita spp.) Bacteria
Rickettsia/ Chlamydia*
Digestive gland
Metazoa
Cirripedia
Octolasmis spp. A (large)
Gills As for sand crabs
Octolasmis spp. B (small)
Gills As for sand crabs
Chelonibia spp. Carapace As for sand crabs
Heterosaccus
spp. (ruginosus ?)
Externa

Research Fishing and Fish Health Monitoring Program Post-dredging Report Season Ichthys Nearshore Environmental Monitoring Program
Prepared for INPEX Cardno 153
Ichthys Nearshore Environmental Monitoring Program
APPENDIX G FISH AND CRAB HEALTH DATA SUMMARIES
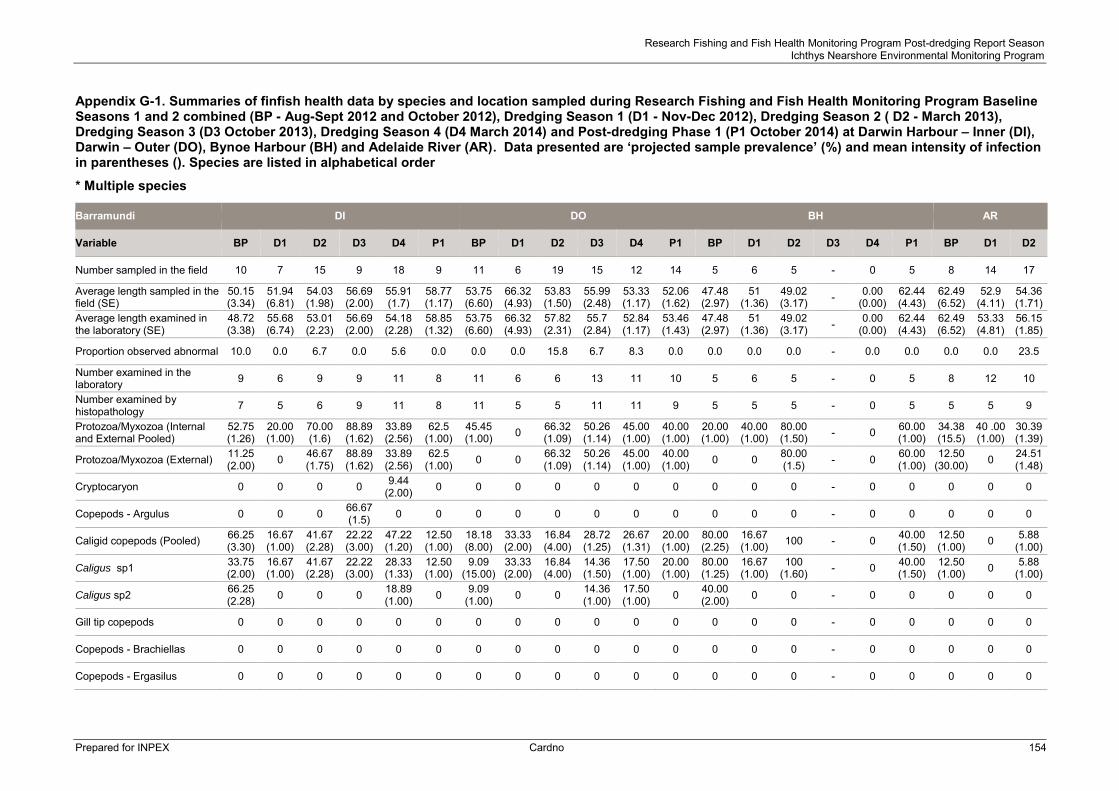
Research Fishing and Fish Health Monitoring Program Post-dredging Report Season Ichthys Nearshore Environmental Monitoring Program
Prepared for INPEX Cardno 154
Appendix G-1. Summaries of finfish health data by species and location sampled during Research Fishing and Fish Health Monitoring Program Baseline Seasons 1 and 2 combined (BP - Aug-Sept 2012 and October 2012), Dredging Season 1 (D1 - Nov-Dec 2012), Dredging Season 2 ( D2 - March 2013), Dredging Season 3 (D3 October 2013), Dredging Season 4 (D4 March 2014) and Post-dredging Phase 1 (P1 October 2014) at Darwin Harbour – Inner (DI), Darwin – Outer (DO), Bynoe Harbour (BH) and Adelaide River (AR). Data presented are ‘projected sample prevalence’ (%) and mean intensity of infection in parentheses (). Species are listed in alphabetical order
* Multiple species
Barramundi DI DO BH AR
Variable BP D1 D2 D3 D4 P1 BP D1 D2 D3 D4 P1 BP D1 D2 D3 D4 P1 BP D1 D2
Number sampled in the field 10 7 15 9 18 9 11 6 19 15 12 14 5 6 5 - 0 5 8 14 17
Average length sampled in the field (SE)
50.15 (3.34)
51.94 (6.81)
54.03 (1.98)
56.69 (2.00)
55.91 (1.7)
58.77 (1.17)
53.75 (6.60)
66.32 (4.93)
53.83 (1.50)
55.99 (2.48)
53.33 (1.17)
52.06 (1.62)
47.48 (2.97)
51 (1.36)
49.02 (3.17) - 0.00
(0.00) 62.44 (4.43)
62.49 (6.52)
52.9 (4.11)
54.36 (1.71)
Average length examined in the laboratory (SE)
48.72 (3.38)
55.68 (6.74)
53.01 (2.23)
56.69 (2.00)
54.18 (2.28)
58.85 (1.32)
53.75 (6.60)
66.32 (4.93)
57.82 (2.31)
55.7 (2.84)
52.84 (1.17)
53.46 (1.43)
47.48 (2.97)
51 (1.36)
49.02 (3.17) - 0.00
(0.00) 62.44 (4.43)
62.49 (6.52)
53.33 (4.81)
56.15 (1.85)
Proportion observed abnormal 10.0 0.0 6.7 0.0 5.6 0.0 0.0 0.0 15.8 6.7 8.3 0.0 0.0 0.0 0.0 - 0.0 0.0 0.0 0.0 23.5
Number examined in the laboratory 9 6 9 9 11 8 11 6 6 13 11 10 5 6 5 - 0 5 8 12 10
Number examined by histopathology 7 5 6 9 11 8 11 5 5 11 11 9 5 5 5 - 0 5 5 5 9
Protozoa/Myxozoa (Internal and External Pooled)
52.75 (1.26)
20.00 (1.00)
70.00 (1.6)
88.89 (1.62)
33.89 (2.56)
62.5 (1.00)
45.45 (1.00) 0 66.32
(1.09) 50.26 (1.14)
45.00 (1.00)
40.00 (1.00)
20.00 (1.00)
40.00 (1.00)
80.00 (1.50) - 0 60.00
(1.00) 34.38 (15.5)
40 .00 (1.00)
30.39 (1.39)
Protozoa/Myxozoa (External) 11.25 (2.00) 0 46.67
(1.75) 88.89 (1.62)
33.89 (2.56)
62.5 (1.00) 0 0 66.32
(1.09) 50.26 (1.14)
45.00 (1.00)
40.00 (1.00) 0 0 80.00
(1.5) - 0 60.00 (1.00)
12.50 (30.00) 0 24.51
(1.48)
Cryptocaryon 0 0 0 0 9.44 (2.00) 0 0 0 0 0 0 0 0 0 0 - 0 0 0 0 0
Copepods - Argulus 0 0 0 66.67 (1.5) 0 0 0 0 0 0 0 0 0 0 0 - 0 0 0 0 0
Caligid copepods (Pooled) 66.25 (3.30)
16.67 (1.00)
41.67 (2.28)
22.22 (3.00)
47.22 (1.20)
12.50 (1.00)
18.18 (8.00)
33.33 (2.00)
16.84 (4.00)
28.72 (1.25)
26.67 (1.31)
20.00 (1.00)
80.00 (2.25)
16.67 (1.00) 100 - 0 40.00
(1.50) 12.50 (1.00) 0 5.88
(1.00)
Caligus sp1 33.75 (2.00)
16.67 (1.00)
41.67 (2.28)
22.22 (3.00)
28.33 (1.33)
12.50 (1.00)
9.09 (15.00)
33.33 (2.00)
16.84 (4.00)
14.36 (1.50)
17.50 (1.00)
20.00 (1.00)
80.00 (1.25)
16.67 (1.00)
100 (1.60) - 0 40.00
(1.50) 12.50 (1.00) 0 5.88
(1.00)
Caligus sp2 66.25 (2.28) 0 0 0 18.89
(1.00) 0 9.09 (1.00) 0 0 14.36
(1.00) 17.50 (1.00) 0 40.00
(2.00) 0 0 - 0 0 0 0 0
Gill tip copepods 0 0 0 0 0 0 0 0 0 0 0 0 0 0 0 - 0 0 0 0 0
Copepods - Brachiellas 0 0 0 0 0 0 0 0 0 0 0 0 0 0 0 - 0 0 0 0 0
Copepods - Ergasilus 0 0 0 0 0 0 0 0 0 0 0 0 0 0 0 - 0 0 0 0 0
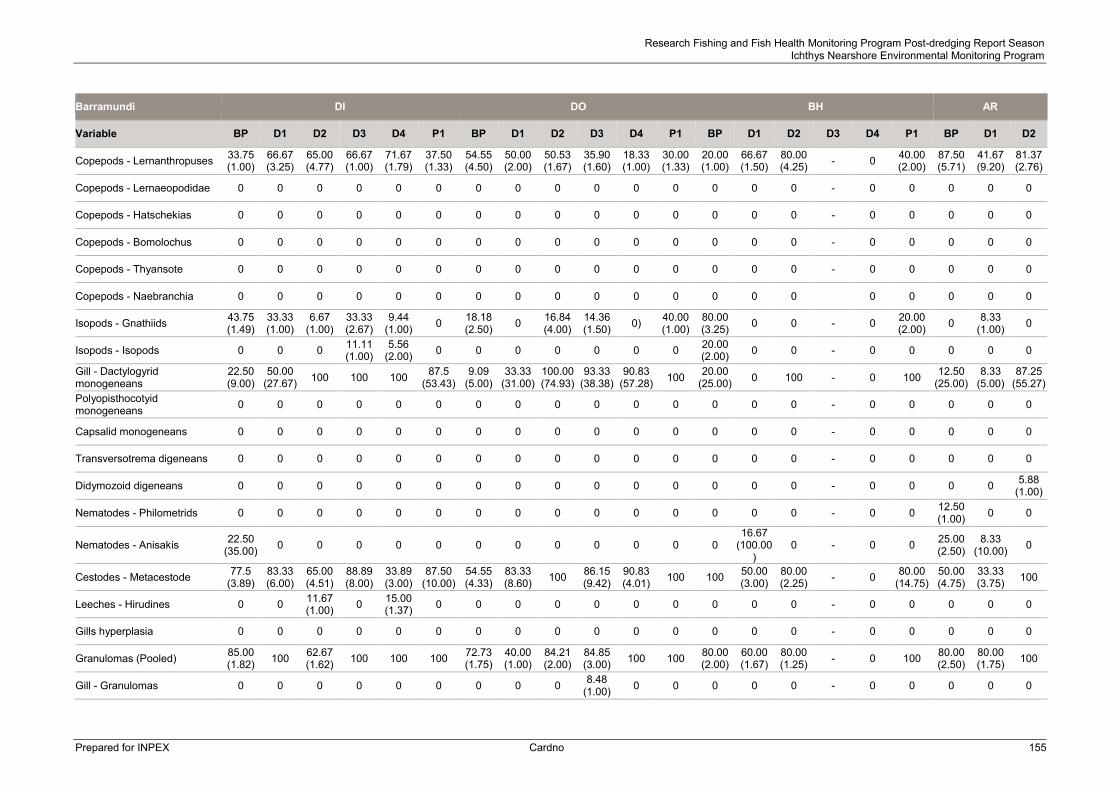
Research Fishing and Fish Health Monitoring Program Post-dredging Report Season Ichthys Nearshore Environmental Monitoring Program
Prepared for INPEX Cardno 155
Barramundi DI DO BH AR
Variable BP D1 D2 D3 D4 P1 BP D1 D2 D3 D4 P1 BP D1 D2 D3 D4 P1 BP D1 D2
Copepods - Lernanthropuses 33.75 (1.00)
66.67 (3.25)
65.00 (4.77)
66.67 (1.00)
71.67 (1.79)
37.50 (1.33)
54.55 (4.50)
50.00 (2.00)
50.53 (1.67)
35.90 (1.60)
18.33 (1.00)
30.00 (1.33)
20.00 (1.00)
66.67 (1.50)
80.00 (4.25) - 0 40.00
(2.00) 87.50 (5.71)
41.67 (9.20)
81.37 (2.76)
Copepods - Lernaeopodidae 0 0 0 0 0 0 0 0 0 0 0 0 0 0 0 - 0 0 0 0 0
Copepods - Hatschekias 0 0 0 0 0 0 0 0 0 0 0 0 0 0 0 - 0 0 0 0 0
Copepods - Bomolochus 0 0 0 0 0 0 0 0 0 0 0 0 0 0 0 - 0 0 0 0 0
Copepods - Thyansote 0 0 0 0 0 0 0 0 0 0 0 0 0 0 0 - 0 0 0 0 0
Copepods - Naebranchia 0 0 0 0 0 0 0 0 0 0 0 0 0 0 0 0 0 0 0 0
Isopods - Gnathiids 43.75 (1.49)
33.33 (1.00)
6.67 (1.00)
33.33 (2.67)
9.44 (1.00) 0 18.18
(2.50) 0 16.84 (4.00)
14.36 (1.50) 0) 40.00
(1.00) 80.00 (3.25) 0 0 - 0 20.00
(2.00) 0 8.33 (1.00) 0
Isopods - Isopods 0 0 0 11.11 (1.00)
5.56 (2.00) 0 0 0 0 0 0 0 20.00
(2.00) 0 0 - 0 0 0 0 0
Gill - Dactylogyrid monogeneans
22.50 (9.00)
50.00 (27.67) 100 100 100 87.5
(53.43) 9.09
(5.00) 33.33
(31.00) 100.00 (74.93)
93.33 (38.38)
90.83 (57.28) 100 20.00
(25.00) 0 100 - 0 100 12.50 (25.00)
8.33 (5.00)
87.25 (55.27)
Polyopisthocotyid monogeneans 0 0 0 0 0 0 0 0 0 0 0 0 0 0 0 - 0 0 0 0 0
Capsalid monogeneans 0 0 0 0 0 0 0 0 0 0 0 0 0 0 0 - 0 0 0 0 0
Transversotrema digeneans 0 0 0 0 0 0 0 0 0 0 0 0 0 0 0 - 0 0 0 0 0
Didymozoid digeneans 0 0 0 0 0 0 0 0 0 0 0 0 0 0 0 - 0 0 0 0 5.88 (1.00)
Nematodes - Philometrids 0 0 0 0 0 0 0 0 0 0 0 0 0 0 0 - 0 0 12.50 (1.00) 0 0
Nematodes - Anisakis 22.50 (35.00) 0 0 0 0 0 0 0 0 0 0 0 0
16.67 (100.00
) 0 - 0 0 25.00
(2.50) 8.33
(10.00) 0
Cestodes - Metacestode 77.5 (3.89)
83.33 (6.00)
65.00 (4.51)
88.89 (8.00)
33.89 (3.00)
87.50 (10.00)
54.55 (4.33)
83.33 (8.60) 100 86.15
(9.42) 90.83 (4.01) 100 100 50.00
(3.00) 80.00 (2.25) - 0 80.00
(14.75) 50.00 (4.75)
33.33 (3.75) 100
Leeches - Hirudines 0 0 11.67 (1.00) 0 15.00
(1.37) 0 0 0 0 0 0 0 0 0 0 - 0 0 0 0 0
Gills hyperplasia 0 0 0 0 0 0 0 0 0 0 0 0 0 0 0 - 0 0 0 0 0
Granulomas (Pooled) 85.00 (1.82) 100 62.67
(1.62) 100 100 100 72.73 (1.75)
40.00 (1.00)
84.21 (2.00)
84.85 (3.00) 100 100 80.00
(2.00) 60.00 (1.67)
80.00 (1.25) - 0 100 80.00
(2.50) 80.00 (1.75) 100
Gill - Granulomas 0 0 0 0 0 0 0 0 0 8.48 (1.00) 0 0 0 0 0 - 0 0 0 0 0

Research Fishing and Fish Health Monitoring Program Post-dredging Report Season Ichthys Nearshore Environmental Monitoring Program
Prepared for INPEX Cardno 156
Barramundi DI DO BH AR
Variable BP D1 D2 D3 D4 P1 BP D1 D2 D3 D4 P1 BP D1 D2 D3 D4 P1 BP D1 D2
Liver - Granulomas 55.00 (1.00)
60.00 (1.00)
44.00 (1.00)
66.67 (1.00) 100 50.00
(1.50) 36.36 (1.00) 0 84.21
(1.00) 84.85 (1.00)
72.50 (1.00)
44.40 (1.25)
40.00 (1.00)
40.00 (1.00)
20.00 (1.00) - 0 60.00
(1.33) 60.00 (1.67)
80.00 (1.00)
100.00 (1.21)
Kidney - Granulomas 85.00 (1.00)
80.00 (1.25)
44.00 (1.30)
88.89 (1.62) 100 87.50
(2.14) 54.55 (1.00)
40.00 (1.00)
63.16 (1.33)
84.85 (1.60) 100 88.90
(2.50) 60.00 (1.00)
40.00 (1.50)
80.00 (1.00) - 0 100.00
(1.06) 60.00 (1.67)
20.00 (3.00)
84.71 (1.50)
Spleen - Granulomas 15.00 (1.00)
20.00 (1.00) 0 22.22
(1.00) 18.89 (1.00)
25.00 (1.50)
36.36 (1.00) 0 0 25.45
(1.00) 17.50 (1.00)
66.70 (2.00)
60.00 (1.00) 0 0 - 0 20.00
(1.00) 0 0 51.76 (1.30)
Metazoa (Pooled) 55.00 (1.64)
40.00 (1.00) 100 11.11
(1.00) 56.67 (1.00)
50.00 (1.25)
54.55 (1.33)
20.00 (1.00)
84.21 (2.00)
16.97 (1.00)
27.50 (1.00)
44.40 (1.00)
80.00 (2.25) 0 80.00
(1.50) - 0 40.00 (1.00)
80.00 (2.25) 0 100.00
(1.81)
Gill - Metazoa 10.00 (1.00)
20.00 (1.00)
6.67 (1.00)
11.11 (1.00)
56.67 (1.00)
50.00 (1.00)
27.27 (1.00)
20.00 (1.00)
84.21 (1.00)
16.97 (1.00)
27.50 (1.00)
44.40 (1.00)
40.00 (1.00) 0 40.00
(1.00) - 0 40.00 (1.00)
60.00 (1.00) 0 57.65
(1.00)
Liver - Metazoa 40.00 (1.00)
20.00 (1.00)
100 (1.00) 0 0 12.50
(1.00) 27.27 (1.00) 0 84.21
(1.00) 0 0 0 80.00 (1.00) 0 80.00
(1.00) - 0 0 60.00 (1.00) 0 100
Kidney - Metazoa 40.00 (1.00) 0 6.67
(3.00) 0 0 0 18.18 (1.00) 0 0 0 0 0 60.00
(1.00) 0 0 - 0 0 60.00 (1.00) 0 23.53
(1.00)
Spleen - Metazoa 0 0 0 0 0 0 0 0 0 0 0 0 0 0 0 - 0 0 0 0 0
Myxos (Pooled) 55.00 (1.27)
20.00 (3.00)
37.33 (1.50)
55.56 (1.60)
71.67 (1.26)
87.50 (1.29)
45.45 (1.60) 0 0 25.45
(1.33) 55.00 (1.00)
66.70 (1.33)
20.00 (1.00)
40.00 (1.00)
60.00 (1.67) - 0 80.00
(1.5) 20.00 (3.00)
40.00 (1.00)
5.88 (1.00)
Gill - Myxos 55.00 (1.27)
20.00 (3.00)
37.33 (1.50)
44.44 (1.75)
52.78 (1.36)
87.50 (1.29)
18.18 (1.00) 0 0 16.97
(1.50) 55.00 (1.00)
66.70 (1.33) 0 40.00
(1.00) 60.00 (1.67) - 0 80.00
(1.50) 20.00 (3.00)
40.00 (1.00)
5.88 (1.00)
Liver - Protozoa/Myxos 0 0 0 11.11 (1.00)
18.89 (1.00) 0 27.27
(1.00) 0 0 0 0 0 20.00 (1.00) 0 0 - 0 0 0 0 0
Kidney - Protozoa/Myxos 0 0 0 0 0 0 18.18 (1.00) 0 0 0 0 0 0 0 0 - 0 0 0 0 0
Spleen - Protozoa/Myxos 0 0 0 0 0 0 9.09 (1.00) 0 0 8.48
(1.00) 0 0 0 0 0 - 0 0 0 0 0
Cysts/Spheres (Pooled) 0 20.00 (1.00)
56.00 (1.00)
22.22 (1.00)
9.44 (1.00)
37.50 (1.00)
18.18 (1.00)
20.00 (1.00)
21.05 (2.00) 0 9.17
(1.00) 0 20.00 (1.00) 0 20.00
(1.00) - 0 40.00 (1.00) 0 0 42.35
(4.61)
Gill - Cysts 0 0 37.33 (1.00)
22.22 (1.00)
9.44 (1.00)
12.50 (1.00) 0 0 21.05
(2.00) 0 9.17 (1.00) 0 20.00
(1.00) 0 20.00 (1.00) - 0 20.00
(1.00) 0 0 36.47 (5.19)
Kidney - Spheres 0 20.00 (1.00)
18.67 (1.00) 0 0 25.00
(1.00) 18.18 (1.00)
20.00 (1.00) 0 0 0 0 0 0 0 - 0 20.00
(1.00) 0 0 5.88 (1.00)
Spleen - Cysts 0 0 0 0 0 0 0 0 0 0 0 0 0 0 0 - 0 0 0 0 0
Haemorrage (Pooled) 100 20.00 (1.00)
18.67 (1.00)
44.44 (1.75)
81.11 (2.05) 0 45.45
(1.60) 0 0 84.85 (2.10)
90.83 (1.20)
22.20 (1.50)
60.00 (1.00)
80.00 (1.25)
20.00 (1.00) - 0 20.00
(1.00) 60.00 (1.00)
20.00 (2.00)
42.35 (1.00)
Liver - Haemorrhage 45.00 (1.00)
20.00 (1.00)
18.67 (1.00)
11.11 (1.00)
52.78 (1.72) 0 27.27
(1.00) 0 0 67.88 (1.50)
54.17 (1.00)
22.20 (1.50)
60.000 (1.00)
40.00 (1.00)
20.00 (1.00) - 0 20.00
(1.00) 20.00 (1.00) 0 36.47
(1.00)
Kidney - Haemorrhage 100 0 0 44.44 (1.25)
37.78 (1.00) 0 45.45
(1.00) 0 0 50.91 (1.33)
36.67 (1.00) 0 0 20.00
(1.00) 0 - 0 0 40.00 (1.00) 0 0

Research Fishing and Fish Health Monitoring Program Post-dredging Report Season Ichthys Nearshore Environmental Monitoring Program
Prepared for INPEX Cardno 157
Barramundi DI DO BH AR
Variable BP D1 D2 D3 D4 P1 BP D1 D2 D3 D4 P1 BP D1 D2 D3 D4 P1 BP D1 D2
Spleen - Haemorrhage 0 0 0 11.11 (1.00)
37.78 (1.00) 0 0 0 0 8.48
(1.00) 18.33 (1.00) 0 0 40.00
(1.00) 0 - 0 0 0 20.00 (2.00)
5.88 (1.00)
Bacteria (Pooled) 0 0 0 22.22
(1.00) 18.89 (1.00) 0 36.36
(1.25) 0 0 8.48 (1.00)
9.17 (1.00) 0 20.00
(1.00) 0 0 - 0 0 20.00 (1.00)
20.00 (1.00)
5.88 (1.00)
Liver - Bacteria 0 0 0 0 9.44 (1.00) 0 18.18
(1.00) 0 0 0 0 0 20.00 (1.00) 0 0 - 0 0 0 0 0
Kidney - Bacteria 0 0 0 0 0 0 27.27 (1.00) 0 0 0 9.17
(1.00) 0 0 0 0 - 0 0 20.00 (1.00)
20.00 (1.00)
5.88 (1.00)
Spleen – Bacteria rickettsia 0 0 0 22.22 (1.00)
9.44 (1.00) 0 0 0 0 8.48
(1.00) 0 0 0 0 0 - 0 0 0 0 0
Blood fluke (Pooled)
30.00 (1.50) 100 100 100 100 100 27.27
(1.33) 40.00 (2.00)
84.21 (1.75)
84.85 (3.10) 100 100 80.00
(1.75) 60.00 (1.00) 100 - 0 80.00
(2.75) 80.00 (2.50)
80.00 (1.75) 100
Gill - Blood fluke eggs 0 0 0 11.11 (1.00)
75.56 (1.00)
12.50 (1.00) 0 0 0 0 63.33
(1.00) 0 0 0 20.00 (1.00) - 0 0 0 0 11.76
(1.00)
Liver - Blood fluke 30.00 (1.00)
60.00 (1.67) 100 88.89
(1.25) 100 62.50 (1.40)
27.27 (1.00)
40.00 (1.00)
84.21 (1.00)
84.85 (1.10)
81.67 (1.00)
44.4 (1.25)
80.00 (1.00)
60.00 (1.00)
80.00 (1.00) - 0 60.00
(1.33) 60.00 (1.67)
60.00 (1.00) 100
Kidney - Blood fluke 15.00 (1.00) 100 100 88.89
(2.12) 100 100 9.09 (1.00)
40.00 (1.00)
63.16 (1.00)
84.85 (2.00)
90.83 (1.71)
88.90 (2.50)
40.00 (1.50) 0 60.00
(1.00) - 0 80.00 (1.75)
60.00 (1.67)
60.00 (1.33)
84.71 (1.36)
Pigment deposition (Pooled) 100 100 100 100 100 100 54.55 (2.50) 100 84.21
(3.50) 84.85 (5.20) 100 100 100 100 100 - 0 100 100 100 100
Liver - Pigment 15.00 (1.00) 0 0 11.11
(1.00) 66.11 (1.00) 0 0 40.00
(1.00) 0 8.48 (1.00)
45.00 (1.00) 0 0 0 0 - 0 0 40.00
(2.00) 0 0
Kidney - Pigment 90.00 (1.00) 100 100 100 100 87.50
(3.00) 45.45 (1.80)
80.00 (2.00)
84.21 (2.25)
84.85 (3.00) 100 88.90
(2.62) 100 100 80.00 (2.00) - 0 100 80.00
(1.00) 100 100
Spleen - Pigment 100 100 100 100 100 75.00 (1.83)
54.55 (1.00) 100 84.21
(1.25) 84.85 (2.1) 100 100 80.00
(1.00) 100 100 - 0 80.00 (2.00) 100 100 100
Gill - Epitheliocystis 0 0 0 0 0 0 0 0 0 0 9.17 (1.00) 0 0 0 0 - 0 0 0 0 0
Liver - Clear cell foci 0 0 0 0 0 0 0 0 0 0 0 0 20.00 (1.00) 0 0 - 0 0 0 0 0
Spleen - Vacuoles 0 80.00 (1.50)
62.67 (1.00)
66.67 (1.33)
33.89 (1.28)
12.50 (1.00) 0 100.00
(1.60) 84.21 (1.00)
67.88 (2.12)
18.33 (1.00) 0 0 100 60.00
(1.00) - 0 20.00 (1.00) 0 80.00
(1.00) 21.18 (1.00)
Spleen - Scar tissue 0 40.00 (1.00)
18.67 (1.00) 0 66.11
(1.00) 0 0 0 0 33.94 (1.25)
35.83 (1.00) 0 0 0 0 - 0 0 0 0 15.29
(1.00)
Internal Myxos/Protozoa 55.00 (1.27)
20.00 (3.00)
37.33 (1.5) 0 0 0 45.45
(1.60) 0 0 0 0 0 20.00 (1.00)
40.00 (1.00)
60.00 (1.67) - 0 0 20.00
(3.00) 40.00 (1.00)
5.88 (1.00)
Gill - Normal 0 0 0 0 0 0 0 0 0 0 0 0 0 0 0 - 0 0 0 0 0
Gill - Post mortem autolysis 0 100 100 100 100 100 0 0 84.21 (1.00)
84.85 (1.00) 100 100 0 0 0 - 0 100 0 0 100

Research Fishing and Fish Health Monitoring Program Post-dredging Report Season Ichthys Nearshore Environmental Monitoring Program
Prepared for INPEX Cardno 158
Barramundi DI DO BH AR
Variable BP D1 D2 D3 D4 P1 BP D1 D2 D3 D4 P1 BP D1 D2 D3 D4 P1 BP D1 D2
Gill - Congestion 0 20.00 (1.00)
74.67 (1.00)
66.67 (1.00) 100 0 0 0 0 84.85
(1.00) 100 0 0 0 20.00 (1.00) - 0 0 0 0 61.18
(1.00)
Liver - Normal 0 0 0 0 0 12.50 (1.00) 0 0 0 0 9.17
(1.00) 55.6
(1.00) 0 0 0 - 0 0 0 0 0
Liver - Post mortem autolysis/necrosis 0 60.00
(1.00) 62.67 (1.00)
44.44 (1.00)
37.78 (1.00)
25.00 (1.00) 0 60.00
(1.00) 63.16 (1.00)
59.39 (1.00)
18.33 (1.00)
33.30 (1.33) 0 100 100 - 0 40.00
(1.00) 0 100 100
Kidney - Normal 0 0 0 0 0 0 0 0 0 0 0 0 0 0 0 - 0 0 0 0 0
Kidney - Post mortem autolysis 0 80.00
(1.00) 100 100 81.11 (1.00)
62.50 (1.60) 0 100 84.21
(1.00) 84.85 (1.00)
72.50 (1.00)
77.80 (1.14) 0 100 60.00
(1.00) - 0 100 0 80.00 (1.00) 100
Spleen - Normal 0 0 0 0 0 25.00 (1.00) 0 0 0 0 0 11.10
(1.00) 0 0 0 - 0 0 0 0 0
Spleen - Post mortem autolysis 0 20.00
(1.00) 56.00 (1.00)
55.56 (1.00)
62.22 (1.00)
25.00 (1.00) 0 40.00
(1.00) 0 76.36 (1.00)
36.67 (1.00)
11.10 (1.00) 0 100 60.00
(1.00) - 0 40.00 (1.00) 0 40.00
(1.00) 5.88
(1.00)

Research Fishing and Fish Health Monitoring Program Post-dredging Report Season Ichthys Nearshore Environmental Monitoring Program
Prepared for INPEX Cardno 159
Blue threadfin DI DO BH AR
Variable BP D1 D2 D3 D4 P1 BP D1 D2 D3 D4 P1 BP D1 D2 D3 D4 P1 BP D1 D2
Number sampled in the field 11 0 0 0 0 0 5 1 3 0 0 12 1 2 7 - 0 4 2 1 0
Average length sampled in the field (SE)
38.28 (1.75) 0 0 0 0 0 36.60
(1.43) 46.00 (NA)
36.17 (1.82) 0 0 37.06
(1.22) 50.00 (NA)
29.35 (2.15)
37.26 (1.54) - 0 44.65
(5.13) 37.35 (1.35)
28.50 (NA) 0
Average length examined in the laboratory (SE)
38.28 (1.75) 0 0 0 0 0 36.60
(1.43) 46.00 (NA)
36.17 (1.82) 0 0 38.19
(1.52) 50.00 (NA)
27.20 (NA)
37.60 (2.16) - 0 44.65
(5.13) 37.35 (1.35)
28.50 (NA) 0
Proportion observed abnormal 9.1 0.0 0.0 0.0 0.0 0.0 0.0 0.0 0.0 0.0 0.0 0.0 100 0.0 0.0 - 0.0 0.0 0.0 0.0 0.0
Number examined in the laboratory 11 0 0 0 0 0 5 1 3 0 0 8 1 1 5 - 0 4 2 1 0
Number examined by histopathology 11 0 0 0 0 0 5 0 0 0 0 8 1 0 0 - 0 3 2 0 0
Protozoa/Myxozoa (Internal and External Pooled)
9.09 (1.00) 0 0 0 0 0 20.00
(1.00) 0 0 0 0 0 0 0 0 0 0 25.00 (2.00) 0 0 0
Protozoa/Myxozoa (External) 0 0 0 0 0 0 0 0 0 0 0 0 0 0 0 - 0 25.00
(2.00) 0 0 0
Cryptocaryon 0 0 0 0 0 0 0 0 0 0 0 0 0 0 0 - 0 0 0 0 0
Copepods - Argulus 0 0 0 0 0 0 0 0 0 0 0 0 0 0 0 - 0 0 0 0 0
Caligid copepods (Pooled) 54.55 (2.00) 0 0 0 0 0 20.00
(1.00) 0 0 0 0 12.50 (1.00) 100 0 60.00
(1.00) - 0 50.00 (1.00)
50.00 (3.00) 0 0
Caligus sp1 36.36 (2.00) 0 0 0 0 0 20.00
(1.00) 0 0 0 0 12.50 (1.00) 100 0 60.00
(1.00) - 0 50.00 (1.00)
50.00 (2.00) 0 0
Caligus sp2 27.27 (1.33) 0 0 0 0 0 0 0 0 0 0 0 100 0 0 - 0 0 50.00
(1.00) 0 0
Gill tip copepods 0 0 0 0 0 0 0 0 0 0 0 0 0 0 0 - 0 0 0 0 0
Copepods - Brachiellas 0 0 0 0 0 0 0 0 0 0 0 0 0 0 0 - 0 0 0 0 0
Copepods - Ergasilus 0 0 0 0 0 0 0 0 0 0 0 0 0 0 0 - 0 0 0 0 0
Copepods - Lernanthropuses 0 0 0 0 0 0 40.00 (1.50) 0 0 0 0 0 0 0 0 - 0 0 0 0 0
Copepods - Lernaeopodidae 0 0 0 0 0 0 0 0 0 0 0 25.00 (1.50) 0 0 40.00
(1.00) - 0 25.00 (1.00) 0 0 0
Copepods - Hatschekias 0 0 0 0 0 0 0 0 0 0 0 0 0 0 0 - 0 0 0 0 0
Copepods - Bomolochus 0 0 0 0 0 0 0 0 0 0 0 0 0 0 0 - 0 0 0 0 0
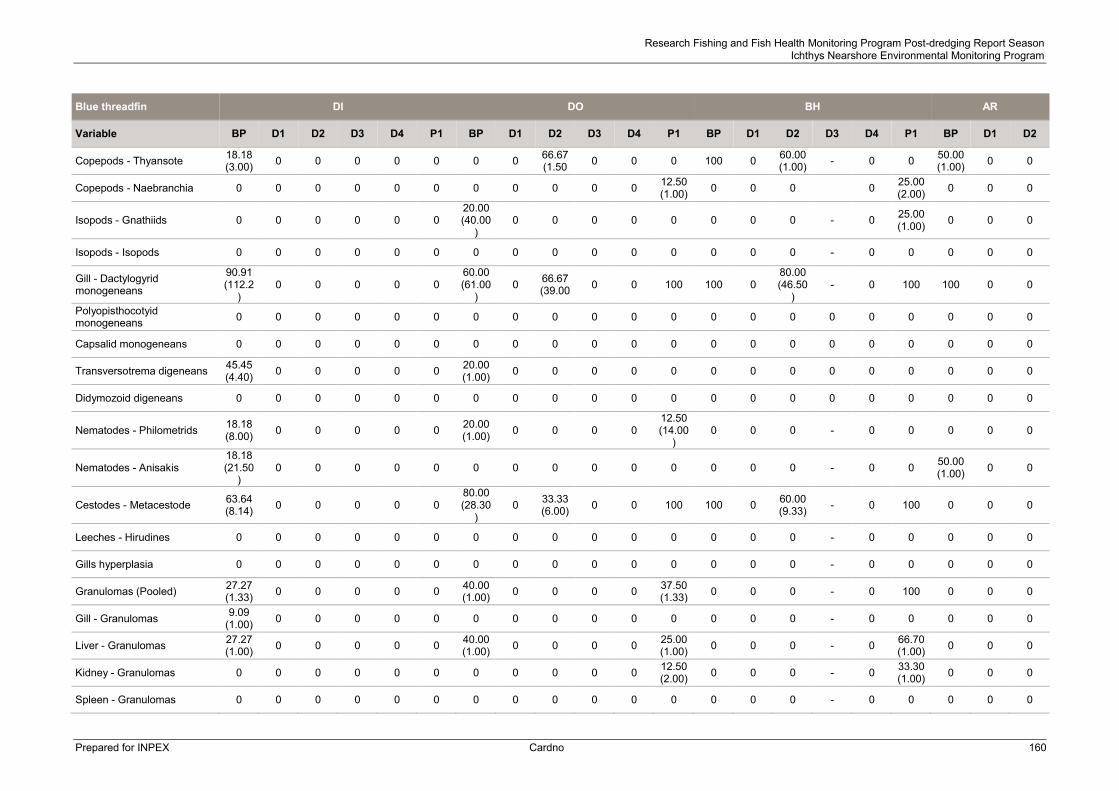
Research Fishing and Fish Health Monitoring Program Post-dredging Report Season Ichthys Nearshore Environmental Monitoring Program
Prepared for INPEX Cardno 160
Blue threadfin DI DO BH AR
Variable BP D1 D2 D3 D4 P1 BP D1 D2 D3 D4 P1 BP D1 D2 D3 D4 P1 BP D1 D2
Copepods - Thyansote 18.18 (3.00) 0 0 0 0 0 0 0 66.67
(1.50 0 0 0 100 0 60.00 (1.00) - 0 0 50.00
(1.00) 0 0
Copepods - Naebranchia 0 0 0 0 0 0 0 0 0 0 0 12.50 (1.00) 0 0 0 0 25.00
(2.00) 0 0 0
Isopods - Gnathiids 0 0 0 0 0 0 20.00 (40.00
) 0 0 0 0 0 0 0 0 - 0 25.00
(1.00) 0 0 0
Isopods - Isopods 0 0 0 0 0 0 0 0 0 0 0 0 0 0 0 - 0 0 0 0 0
Gill - Dactylogyrid monogeneans
90.91 (112.2
) 0 0 0 0 0
60.00 (61.00
) 0 66.67
(39.00 0 0 100 100 0 80.00 (46.50
) - 0 100 100 0 0
Polyopisthocotyid monogeneans 0 0 0 0 0 0 0 0 0 0 0 0 0 0 0 0 0 0 0 0 0
Capsalid monogeneans 0 0 0 0 0 0 0 0 0 0 0 0 0 0 0 0 0 0 0 0 0
Transversotrema digeneans 45.45 (4.40) 0 0 0 0 0 20.00
(1.00) 0 0 0 0 0 0 0 0 0 0 0 0 0 0
Didymozoid digeneans 0 0 0 0 0 0 0 0 0 0 0 0 0 0 0 0 0 0 0 0 0
Nematodes - Philometrids 18.18 (8.00) 0 0 0 0 0 20.00
(1.00) 0 0 0 0 12.50 (14.00
) 0 0 0 - 0 0 0 0 0
Nematodes - Anisakis 18.18 (21.50
) 0 0 0 0 0 0 0 0 0 0 0 0 0 0 - 0 0 50.00
(1.00) 0 0
Cestodes - Metacestode 63.64 (8.14) 0 0 0 0 0
80.00 (28.30
) 0 33.33
(6.00) 0 0 100 100 0 60.00 (9.33) - 0 100 0 0 0
Leeches - Hirudines 0 0 0 0 0 0 0 0 0 0 0 0 0 0 0 - 0 0 0 0 0
Gills hyperplasia 0 0 0 0 0 0 0 0 0 0 0 0 0 0 0 - 0 0 0 0 0
Granulomas (Pooled) 27.27 (1.33) 0 0 0 0 0 40.00
(1.00) 0 0 0 0 37.50 (1.33) 0 0 0 - 0 100 0 0 0
Gill - Granulomas 9.09 (1.00) 0 0 0 0 0 0 0 0 0 0 0 0 0 0 - 0 0 0 0 0
Liver - Granulomas 27.27 (1.00) 0 0 0 0 0 40.00
(1.00) 0 0 0 0 25.00 (1.00) 0 0 0 - 0 66.70
(1.00) 0 0 0
Kidney - Granulomas 0 0 0 0 0 0 0 0 0 0 0 12.50 (2.00) 0 0 0 - 0 33.30
(1.00) 0 0 0
Spleen - Granulomas 0 0 0 0 0 0 0 0 0 0 0 0 0 0 0 - 0 0 0 0 0

Research Fishing and Fish Health Monitoring Program Post-dredging Report Season Ichthys Nearshore Environmental Monitoring Program
Prepared for INPEX Cardno 161
Blue threadfin DI DO BH AR
Variable BP D1 D2 D3 D4 P1 BP D1 D2 D3 D4 P1 BP D1 D2 D3 D4 P1 BP D1 D2
Metazoa (Pooled) 36.36 (1.75) 0 0 0 0 0 40.00
(1.00) 0 0 0 0 87.50 (1.43) 0 0 0 - 0 66.70
(1.50) 50.00 (2.00) 0 0
Gill - Metazoa 18.18 (1.00) 0 0 0 0 0 20.00
(1.00) 0 0 0 0 75.00 (1.17) 0 0 0 - 0 33.30
(1.00) 50.00 (1.00) 0 0
Liver - Metazoa 36.36 (1.00) 0 0 0 0 0 20.00
(1.00) 0 0 0 0 25.00 (1.00) 0 0 0 - 0 66.70
(1.00) 0 0 0
Kidney - Metazoa 9.09 (1.00) 0 0 0 0 0 0 0 0 0 0 12.50
(1.00) 0 0 0 - 0 0 50.00 (1.00) 0 0
Spleen - Metazoa 0 0 0 0 0 0 0 0 0 0 0 0 0 0 0 - 0 0 0 0 0
Myxos (Pooled) 9.09 (1.00) 0 0 0 0 0 20.00
(1.00) 0 0 0 0 37.50 (1.00) 0 0 0 - 0 0 0 0 0
Gill - Myxos 9.09 (1.00) 0 0 0 0 0 0 0 0 0 0 0 0 0 0 - 0 0 0 0 0
Liver - Protozoa/Myxos 0 0 0 0 0 0 20.00 (1.00) 0 0 0 0 25.00
(1.00) 0 0 0 - 0 0 0 0 0
Kidney - Protozoa/Myxos 0 0 0 0 0 0 0 0 0 0 0 12.50 (1.00) 0 0 0 - 0 0 0 0 0
Spleen - Protozoa/Myxos 0 0 0 0 0 0 0 0 0 0 0 0 0 0 0 - 0 0 0 0 0
Cysts/Spheres (Pooled) 9.09 (1.00) 0 0 0 0 0 20.00
(1.00) 0 0 0 0 0 0 0 0 - 0 0 0 0 0
Gill - Cysts 0 0 0 0 0 0 0 0 0 0 0 0 0 0 0 - 0 0 0 0 0
Kidney - Spheres 9.09 (1.00) 0 0 0 0 0 20.00
(1.00) 0 0 0 0 0 0 0 0 - 0 0 0 0 0
Spleen - Cysts 0 0 0 0 0 0 0 0 0 0 0 0 0 0 0 - 0 0 0 0 0
Haemorrage (Pooled) 90.91 (2.00) 0 0 0 0 0 100 0 0 0 0 75.00
(2.17) 0 0 0 - 0 66.70 (1.50) 100 0 0
Liver - Haemorrhage 72.73 (1.00) 0 0 0 0 0 100 0 0 0 0 75.00
(1.67) 0 0 0 - 0 66.70 (1.50) 100 0 0
Kidney - Haemorrhage 63.64 (1.00) 0 0 0 0 0 40.00
(1.00) 0 0 0 0 0 0 0 0 - 0 0 0 0 0
Spleen - Haemorrhage 45.45 (1.00) 0 0 0 0 0 40.00
(1.00) 0 0 0 0 37.50 (1.00) 0 0 0 - 0 0 0 0 0
Bacteria (Pooled) 0 0 0 0 0 0 0 0 0 0 0 12.50 (1.00) 0 0 0 - 0 33.30
(1.00) 0 0 0
Liver - Bacteria 0 0 0 0 0 0 0 0 0 0 0 12.50 (1.00) 0 0 0 - 0 33.30
(1.00) 0 0 0
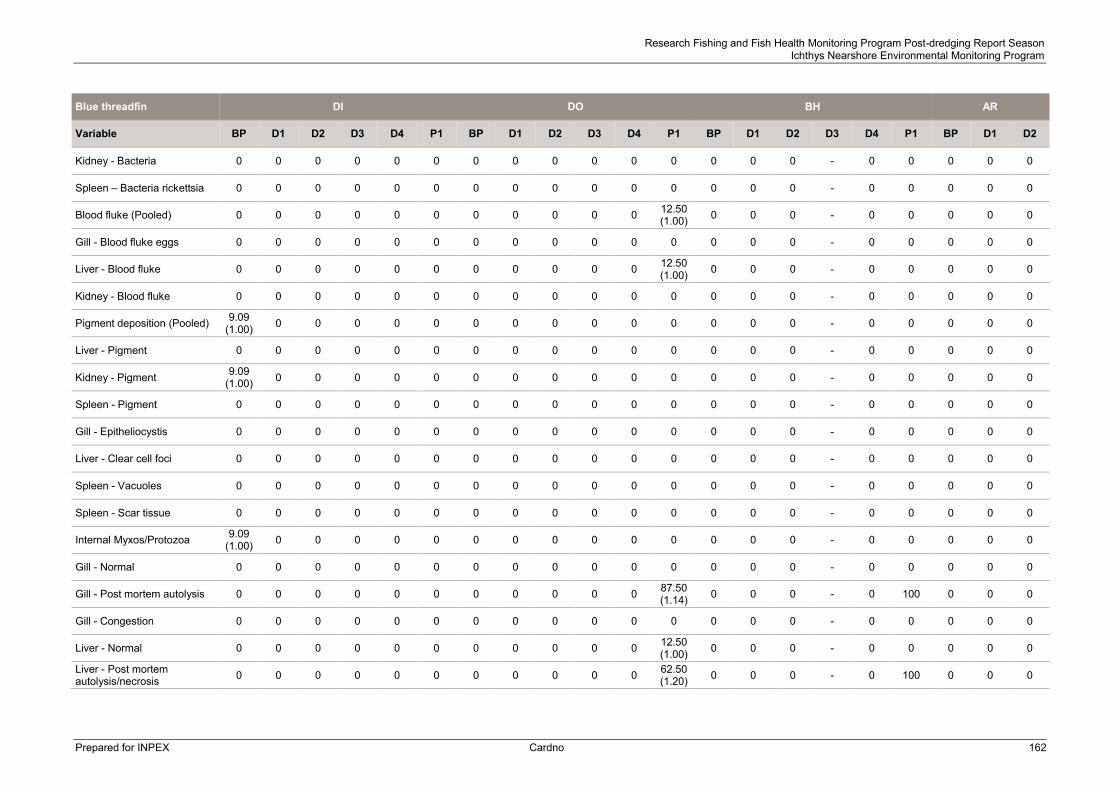
Research Fishing and Fish Health Monitoring Program Post-dredging Report Season Ichthys Nearshore Environmental Monitoring Program
Prepared for INPEX Cardno 162
Blue threadfin DI DO BH AR
Variable BP D1 D2 D3 D4 P1 BP D1 D2 D3 D4 P1 BP D1 D2 D3 D4 P1 BP D1 D2
Kidney - Bacteria 0 0 0 0 0 0 0 0 0 0 0 0 0 0 0 - 0 0 0 0 0
Spleen – Bacteria rickettsia 0 0 0 0 0 0 0 0 0 0 0 0 0 0 0 - 0 0 0 0 0
Blood fluke (Pooled) 0 0 0 0 0 0 0 0 0 0 0 12.50 (1.00) 0 0 0 - 0 0 0 0 0
Gill - Blood fluke eggs 0 0 0 0 0 0 0 0 0 0 0 0 0 0 0 - 0 0 0 0 0
Liver - Blood fluke 0 0 0 0 0 0 0 0 0 0 0 12.50 (1.00) 0 0 0 - 0 0 0 0 0
Kidney - Blood fluke 0 0 0 0 0 0 0 0 0 0 0 0 0 0 0 - 0 0 0 0 0
Pigment deposition (Pooled) 9.09 (1.00) 0 0 0 0 0 0 0 0 0 0 0 0 0 0 - 0 0 0 0 0
Liver - Pigment 0 0 0 0 0 0 0 0 0 0 0 0 0 0 0 - 0 0 0 0 0
Kidney - Pigment 9.09 (1.00) 0 0 0 0 0 0 0 0 0 0 0 0 0 0 - 0 0 0 0 0
Spleen - Pigment 0 0 0 0 0 0 0 0 0 0 0 0 0 0 0 - 0 0 0 0 0
Gill - Epitheliocystis 0 0 0 0 0 0 0 0 0 0 0 0 0 0 0 - 0 0 0 0 0
Liver - Clear cell foci 0 0 0 0 0 0 0 0 0 0 0 0 0 0 0 - 0 0 0 0 0
Spleen - Vacuoles 0 0 0 0 0 0 0 0 0 0 0 0 0 0 0 - 0 0 0 0 0
Spleen - Scar tissue 0 0 0 0 0 0 0 0 0 0 0 0 0 0 0 - 0 0 0 0 0
Internal Myxos/Protozoa 9.09 (1.00) 0 0 0 0 0 0 0 0 0 0 0 0 0 0 - 0 0 0 0 0
Gill - Normal 0 0 0 0 0 0 0 0 0 0 0 0 0 0 0 - 0 0 0 0 0
Gill - Post mortem autolysis 0 0 0 0 0 0 0 0 0 0 0 87.50 (1.14) 0 0 0 - 0 100 0 0 0
Gill - Congestion 0 0 0 0 0 0 0 0 0 0 0 0 0 0 0 - 0 0 0 0 0
Liver - Normal 0 0 0 0 0 0 0 0 0 0 0 12.50 (1.00) 0 0 0 - 0 0 0 0 0
Liver - Post mortem autolysis/necrosis 0 0 0 0 0 0 0 0 0 0 0 62.50
(1.20) 0 0 0 - 0 100 0 0 0
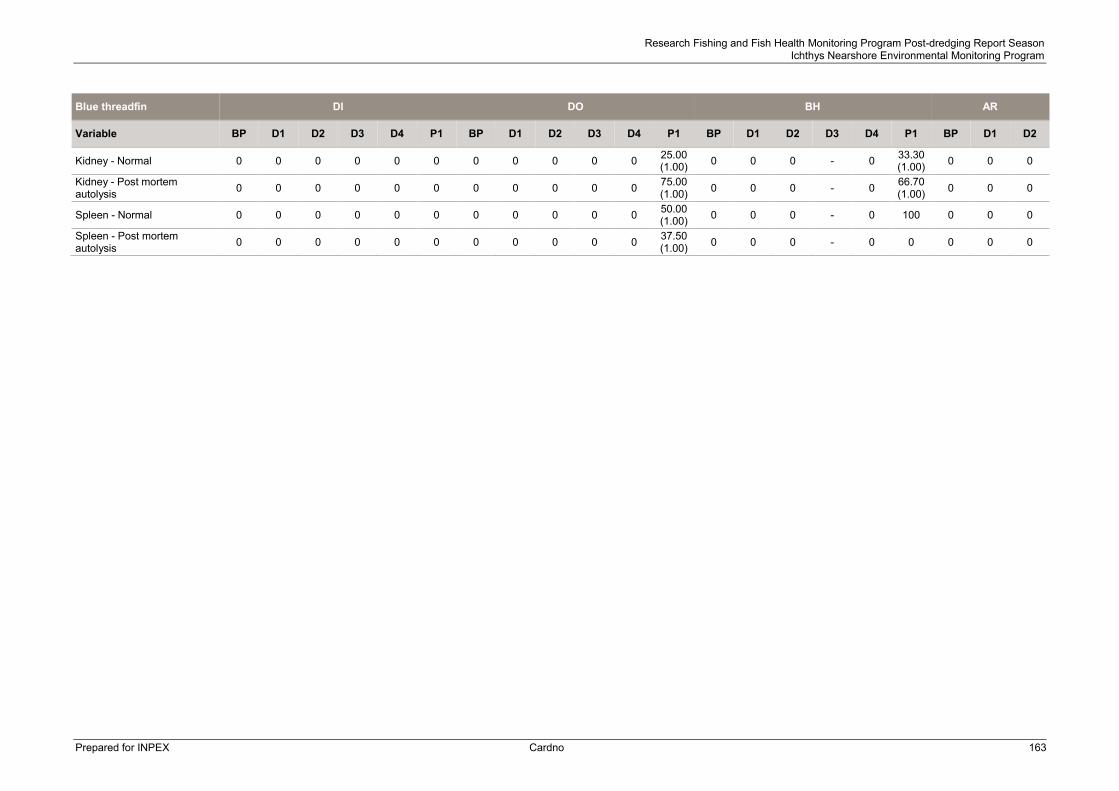
Research Fishing and Fish Health Monitoring Program Post-dredging Report Season Ichthys Nearshore Environmental Monitoring Program
Prepared for INPEX Cardno 163
Blue threadfin DI DO BH AR
Variable BP D1 D2 D3 D4 P1 BP D1 D2 D3 D4 P1 BP D1 D2 D3 D4 P1 BP D1 D2
Kidney - Normal 0 0 0 0 0 0 0 0 0 0 0 25.00 (1.00) 0 0 0 - 0 33.30
(1.00) 0 0 0
Kidney - Post mortem autolysis 0 0 0 0 0 0 0 0 0 0 0 75.00
(1.00) 0 0 0 - 0 66.70 (1.00) 0 0 0
Spleen - Normal 0 0 0 0 0 0 0 0 0 0 0 50.00 (1.00) 0 0 0 - 0 100 0 0 0
Spleen - Post mortem autolysis 0 0 0 0 0 0 0 0 0 0 0 37.50
(1.00) 0 0 0 - 0 0 0 0 0
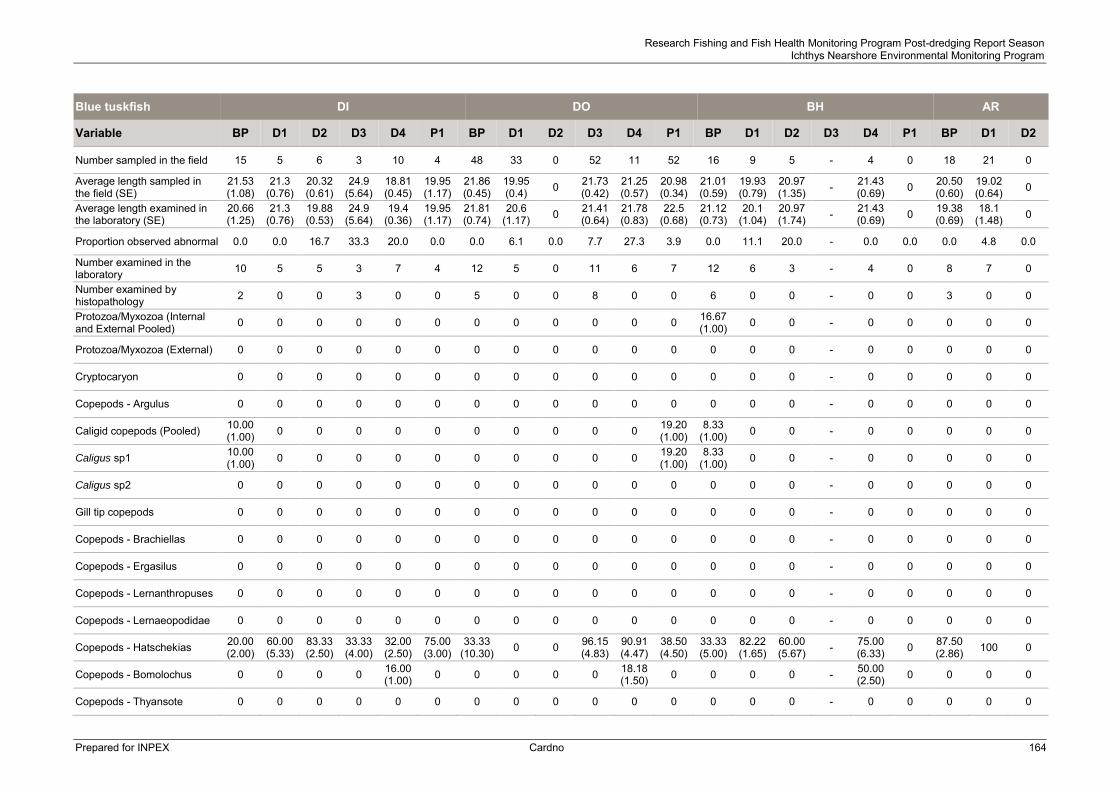
Research Fishing and Fish Health Monitoring Program Post-dredging Report Season Ichthys Nearshore Environmental Monitoring Program
Prepared for INPEX Cardno 164
Blue tuskfish DI DO BH AR
Variable BP D1 D2 D3 D4 P1 BP D1 D2 D3 D4 P1 BP D1 D2 D3 D4 P1 BP D1 D2
Number sampled in the field 15 5 6 3 10 4 48 33 0 52 11 52 16 9 5 - 4 0 18 21 0
Average length sampled in the field (SE)
21.53 (1.08)
21.3 (0.76)
20.32 (0.61)
24.9 (5.64)
18.81 (0.45)
19.95 (1.17)
21.86 (0.45)
19.95 (0.4) 0 21.73
(0.42) 21.25 (0.57)
20.98 (0.34)
21.01 (0.59)
19.93 (0.79)
20.97 (1.35) - 21.43
(0.69) 0 20.50 (0.60)
19.02 (0.64) 0
Average length examined in the laboratory (SE)
20.66 (1.25)
21.3 (0.76)
19.88 (0.53)
24.9 (5.64)
19.4 (0.36)
19.95 (1.17)
21.81 (0.74)
20.6 (1.17) 0 21.41
(0.64) 21.78 (0.83)
22.5 (0.68)
21.12 (0.73)
20.1 (1.04)
20.97 (1.74) - 21.43
(0.69) 0 19.38 (0.69)
18.1 (1.48) 0
Proportion observed abnormal 0.0 0.0 16.7 33.3 20.0 0.0 0.0 6.1 0.0 7.7 27.3 3.9 0.0 11.1 20.0 - 0.0 0.0 0.0 4.8 0.0
Number examined in the laboratory 10 5 5 3 7 4 12 5 0 11 6 7 12 6 3 - 4 0 8 7 0
Number examined by histopathology 2 0 0 3 0 0 5 0 0 8 0 0 6 0 0 - 0 0 3 0 0
Protozoa/Myxozoa (Internal and External Pooled) 0 0 0 0 0 0 0 0 0 0 0 0 16.67
(1.00) 0 0 - 0 0 0 0 0
Protozoa/Myxozoa (External) 0 0 0 0 0 0 0 0 0 0 0 0 0 0 0 - 0 0 0 0 0
Cryptocaryon 0 0 0 0 0 0 0 0 0 0 0 0 0 0 0 - 0 0 0 0 0
Copepods - Argulus 0 0 0 0 0 0 0 0 0 0 0 0 0 0 0 - 0 0 0 0 0
Caligid copepods (Pooled) 10.00 (1.00) 0 0 0 0 0 0 0 0 0 0 19.20
(1.00) 8.33
(1.00) 0 0 - 0 0 0 0 0
Caligus sp1 10.00 (1.00) 0 0 0 0 0 0 0 0 0 0 19.20
(1.00) 8.33
(1.00) 0 0 - 0 0 0 0 0
Caligus sp2 0 0 0 0 0 0 0 0 0 0 0 0 0 0 0 - 0 0 0 0 0
Gill tip copepods 0 0 0 0 0 0 0 0 0 0 0 0 0 0 0 - 0 0 0 0 0
Copepods - Brachiellas 0 0 0 0 0 0 0 0 0 0 0 0 0 0 0 - 0 0 0 0 0
Copepods - Ergasilus 0 0 0 0 0 0 0 0 0 0 0 0 0 0 0 - 0 0 0 0 0
Copepods - Lernanthropuses 0 0 0 0 0 0 0 0 0 0 0 0 0 0 0 - 0 0 0 0 0
Copepods - Lernaeopodidae 0 0 0 0 0 0 0 0 0 0 0 0 0 0 0 - 0 0 0 0 0
Copepods - Hatschekias 20.00 (2.00)
60.00 (5.33)
83.33 (2.50)
33.33 (4.00)
32.00 (2.50)
75.00 (3.00)
33.33 (10.30) 0 0 96.15
(4.83) 90.91 (4.47)
38.50 (4.50)
33.33 (5.00)
82.22 (1.65)
60.00 (5.67) - 75.00
(6.33) 0 87.50 (2.86) 100 0
Copepods - Bomolochus 0 0 0 0 16.00 (1.00) 0 0 0 0 0 18.18
(1.50) 0 0 0 0 - 50.00 (2.50) 0 0 0 0
Copepods - Thyansote 0 0 0 0 0 0 0 0 0 0 0 0 0 0 0 - 0 0 0 0 0
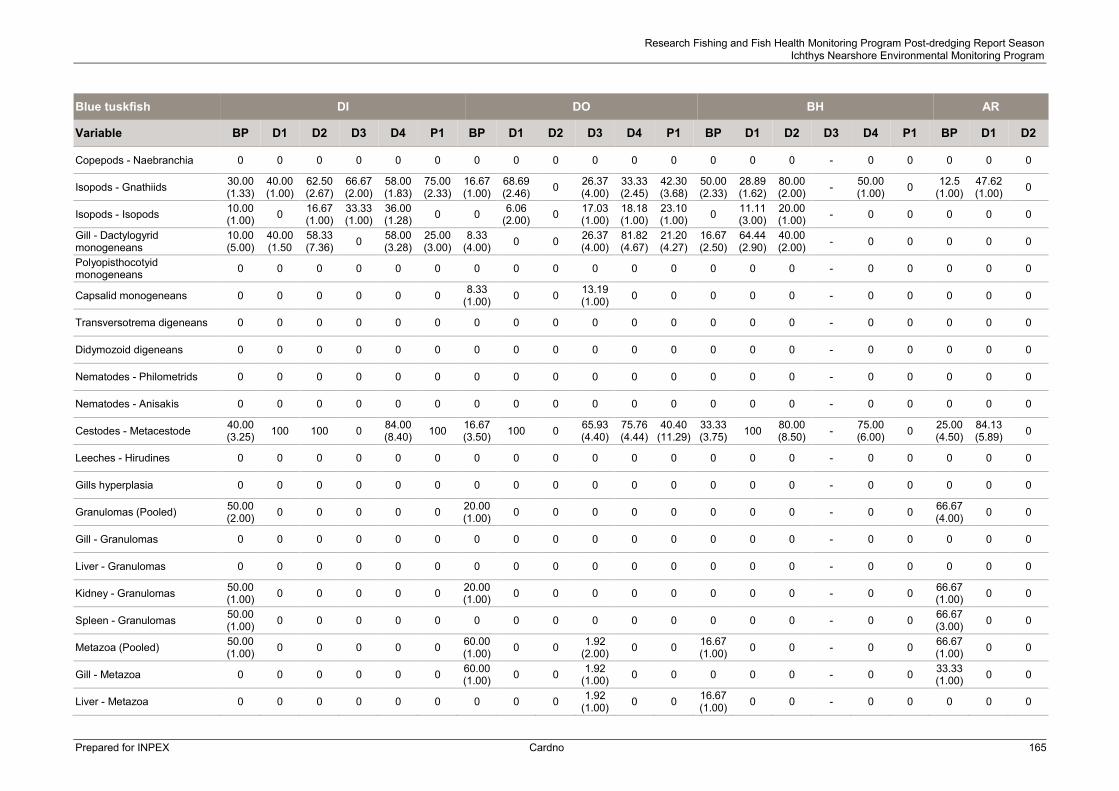
Research Fishing and Fish Health Monitoring Program Post-dredging Report Season Ichthys Nearshore Environmental Monitoring Program
Prepared for INPEX Cardno 165
Blue tuskfish DI DO BH AR
Variable BP D1 D2 D3 D4 P1 BP D1 D2 D3 D4 P1 BP D1 D2 D3 D4 P1 BP D1 D2
Copepods - Naebranchia 0 0 0 0 0 0 0 0 0 0 0 0 0 0 0 - 0 0 0 0 0
Isopods - Gnathiids 30.00 (1.33)
40.00 (1.00)
62.50 (2.67)
66.67 (2.00)
58.00 (1.83)
75.00 (2.33)
16.67 (1.00)
68.69 (2.46) 0 26.37
(4.00) 33.33 (2.45)
42.30 (3.68)
50.00 (2.33)
28.89 (1.62)
80.00 (2.00) - 50.00
(1.00) 0 12.5 (1.00)
47.62 (1.00) 0
Isopods - Isopods 10.00 (1.00) 0 16.67
(1.00) 33.33 (1.00)
36.00 (1.28) 0 0 6.06
(2.00) 0 17.03 (1.00)
18.18 (1.00)
23.10 (1.00) 0 11.11
(3.00) 20.00 (1.00) - 0 0 0 0 0
Gill - Dactylogyrid monogeneans
10.00 (5.00)
40.00 (1.50
58.33 (7.36) 0 58.00
(3.28) 25.00 (3.00)
8.33 (4.00) 0 0 26.37
(4.00) 81.82 (4.67)
21.20 (4.27)
16.67 (2.50)
64.44 (2.90)
40.00 (2.00) - 0 0 0 0 0
Polyopisthocotyid monogeneans 0 0 0 0 0 0 0 0 0 0 0 0 0 0 0 - 0 0 0 0 0
Capsalid monogeneans 0 0 0 0 0 0 8.33 (1.00) 0 0 13.19
(1.00) 0 0 0 0 0 - 0 0 0 0 0
Transversotrema digeneans 0 0 0 0 0 0 0 0 0 0 0 0 0 0 0 - 0 0 0 0 0
Didymozoid digeneans 0 0 0 0 0 0 0 0 0 0 0 0 0 0 0 - 0 0 0 0 0
Nematodes - Philometrids 0 0 0 0 0 0 0 0 0 0 0 0 0 0 0 - 0 0 0 0 0
Nematodes - Anisakis 0 0 0 0 0 0 0 0 0 0 0 0 0 0 0 - 0 0 0 0 0
Cestodes - Metacestode 40.00 (3.25) 100 100 0 84.00
(8.40) 100 16.67 (3.50) 100 0 65.93
(4.40) 75.76 (4.44)
40.40 (11.29)
33.33 (3.75) 100 80.00
(8.50) - 75.00 (6.00) 0 25.00
(4.50) 84.13 (5.89) 0
Leeches - Hirudines 0 0 0 0 0 0 0 0 0 0 0 0 0 0 0 - 0 0 0 0 0
Gills hyperplasia 0 0 0 0 0 0 0 0 0 0 0 0 0 0 0 - 0 0 0 0 0
Granulomas (Pooled) 50.00 (2.00) 0 0 0 0 0 20.00
(1.00) 0 0 0 0 0 0 0 0 - 0 0 66.67 (4.00) 0 0
Gill - Granulomas 0 0 0 0 0 0 0 0 0 0 0 0 0 0 0 - 0 0 0 0 0
Liver - Granulomas 0 0 0 0 0 0 0 0 0 0 0 0 0 0 0 - 0 0 0 0 0
Kidney - Granulomas 50.00 (1.00) 0 0 0 0 0 20.00
(1.00) 0 0 0 0 0 0 0 0 - 0 0 66.67 (1.00) 0 0
Spleen - Granulomas 50.00 (1.00) 0 0 0 0 0 0 0 0 0 0 0 0 0 0 - 0 0 66.67
(3.00) 0 0
Metazoa (Pooled) 50.00 (1.00) 0 0 0 0 0 60.00
(1.00) 0 0 1.92 (2.00) 0 0 16.67
(1.00) 0 0 - 0 0 66.67 (1.00) 0 0
Gill - Metazoa 0 0 0 0 0 0 60.00 (1.00) 0 0 1.92
(1.00) 0 0 0 0 0 - 0 0 33.33 (1.00) 0 0
Liver - Metazoa 0 0 0 0 0 0 0 0 0 1.92 (1.00) 0 0 16.67
(1.00) 0 0 - 0 0 0 0 0
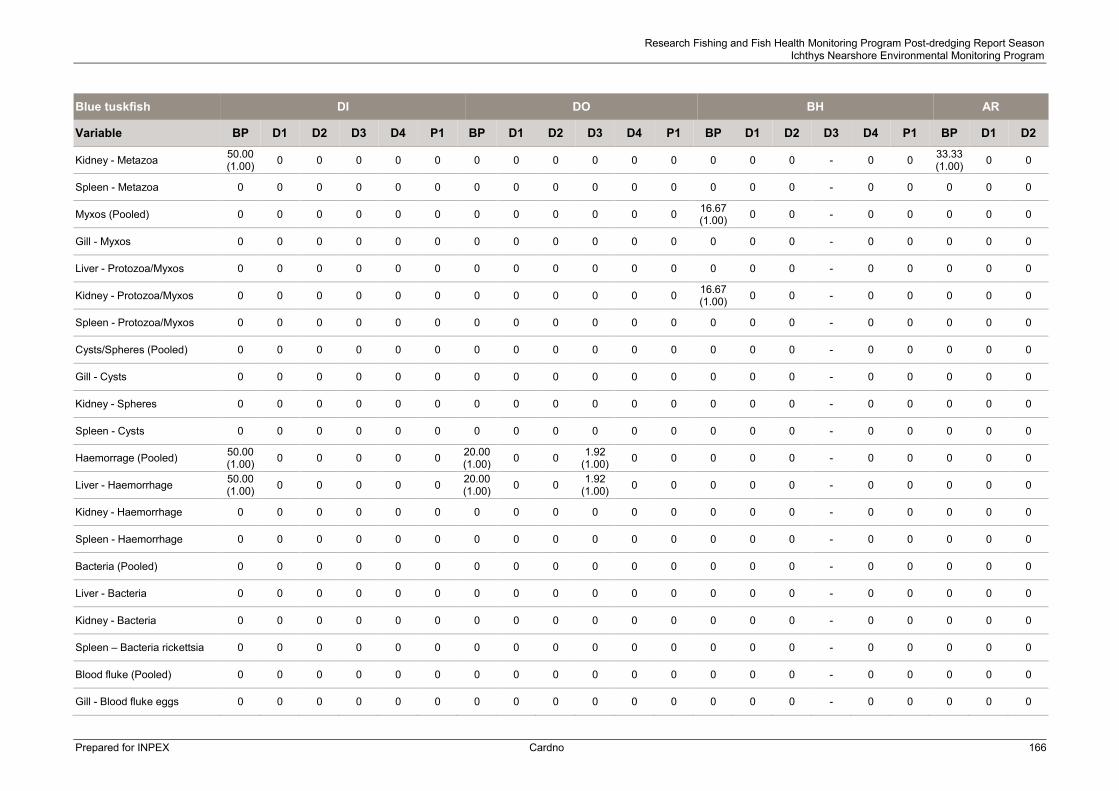
Research Fishing and Fish Health Monitoring Program Post-dredging Report Season Ichthys Nearshore Environmental Monitoring Program
Prepared for INPEX Cardno 166
Blue tuskfish DI DO BH AR
Variable BP D1 D2 D3 D4 P1 BP D1 D2 D3 D4 P1 BP D1 D2 D3 D4 P1 BP D1 D2
Kidney - Metazoa 50.00 (1.00) 0 0 0 0 0 0 0 0 0 0 0 0 0 0 - 0 0 33.33
(1.00) 0 0
Spleen - Metazoa 0 0 0 0 0 0 0 0 0 0 0 0 0 0 0 - 0 0 0 0 0
Myxos (Pooled) 0 0 0 0 0 0 0 0 0 0 0 0 16.67 (1.00) 0 0 - 0 0 0 0 0
Gill - Myxos 0 0 0 0 0 0 0 0 0 0 0 0 0 0 0 - 0 0 0 0 0
Liver - Protozoa/Myxos 0 0 0 0 0 0 0 0 0 0 0 0 0 0 0 - 0 0 0 0 0
Kidney - Protozoa/Myxos 0 0 0 0 0 0 0 0 0 0 0 0 16.67 (1.00) 0 0 - 0 0 0 0 0
Spleen - Protozoa/Myxos 0 0 0 0 0 0 0 0 0 0 0 0 0 0 0 - 0 0 0 0 0
Cysts/Spheres (Pooled) 0 0 0 0 0 0 0 0 0 0 0 0 0 0 0 - 0 0 0 0 0
Gill - Cysts 0 0 0 0 0 0 0 0 0 0 0 0 0 0 0 - 0 0 0 0 0
Kidney - Spheres 0 0 0 0 0 0 0 0 0 0 0 0 0 0 0 - 0 0 0 0 0
Spleen - Cysts 0 0 0 0 0 0 0 0 0 0 0 0 0 0 0 - 0 0 0 0 0
Haemorrage (Pooled) 50.00 (1.00) 0 0 0 0 0 20.00
(1.00) 0 0 1.92 (1.00) 0 0 0 0 0 - 0 0 0 0 0
Liver - Haemorrhage 50.00 (1.00) 0 0 0 0 0 20.00
(1.00) 0 0 1.92 (1.00) 0 0 0 0 0 - 0 0 0 0 0
Kidney - Haemorrhage 0 0 0 0 0 0 0 0 0 0 0 0 0 0 0 - 0 0 0 0 0
Spleen - Haemorrhage 0 0 0 0 0 0 0 0 0 0 0 0 0 0 0 - 0 0 0 0 0
Bacteria (Pooled) 0 0 0 0 0 0 0 0 0 0 0 0 0 0 0 - 0 0 0 0 0
Liver - Bacteria 0 0 0 0 0 0 0 0 0 0 0 0 0 0 0 - 0 0 0 0 0
Kidney - Bacteria 0 0 0 0 0 0 0 0 0 0 0 0 0 0 0 - 0 0 0 0 0
Spleen – Bacteria rickettsia 0 0 0 0 0 0 0 0 0 0 0 0 0 0 0 - 0 0 0 0 0
Blood fluke (Pooled) 0 0 0 0 0 0 0 0 0 0 0 0 0 0 0 - 0 0 0 0 0
Gill - Blood fluke eggs 0 0 0 0 0 0 0 0 0 0 0 0 0 0 0 - 0 0 0 0 0
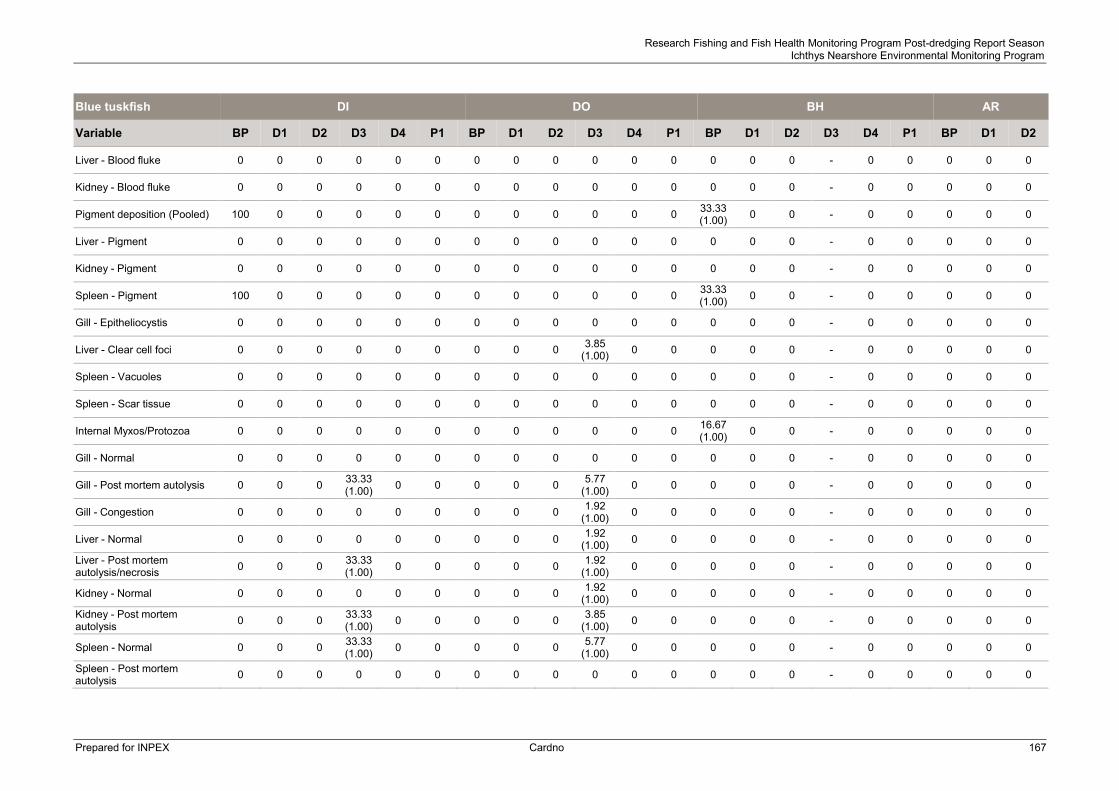
Research Fishing and Fish Health Monitoring Program Post-dredging Report Season Ichthys Nearshore Environmental Monitoring Program
Prepared for INPEX Cardno 167
Blue tuskfish DI DO BH AR
Variable BP D1 D2 D3 D4 P1 BP D1 D2 D3 D4 P1 BP D1 D2 D3 D4 P1 BP D1 D2
Liver - Blood fluke 0 0 0 0 0 0 0 0 0 0 0 0 0 0 0 - 0 0 0 0 0
Kidney - Blood fluke 0 0 0 0 0 0 0 0 0 0 0 0 0 0 0 - 0 0 0 0 0
Pigment deposition (Pooled) 100 0 0 0 0 0 0 0 0 0 0 0 33.33 (1.00) 0 0 - 0 0 0 0 0
Liver - Pigment 0 0 0 0 0 0 0 0 0 0 0 0 0 0 0 - 0 0 0 0 0
Kidney - Pigment 0 0 0 0 0 0 0 0 0 0 0 0 0 0 0 - 0 0 0 0 0
Spleen - Pigment 100 0 0 0 0 0 0 0 0 0 0 0 33.33 (1.00) 0 0 - 0 0 0 0 0
Gill - Epitheliocystis 0 0 0 0 0 0 0 0 0 0 0 0 0 0 0 - 0 0 0 0 0
Liver - Clear cell foci 0 0 0 0 0 0 0 0 0 3.85 (1.00) 0 0 0 0 0 - 0 0 0 0 0
Spleen - Vacuoles 0 0 0 0 0 0 0 0 0 0 0 0 0 0 0 - 0 0 0 0 0
Spleen - Scar tissue 0 0 0 0 0 0 0 0 0 0 0 0 0 0 0 - 0 0 0 0 0
Internal Myxos/Protozoa 0 0 0 0 0 0 0 0 0 0 0 0 16.67 (1.00) 0 0 - 0 0 0 0 0
Gill - Normal 0 0 0 0 0 0 0 0 0 0 0 0 0 0 0 - 0 0 0 0 0
Gill - Post mortem autolysis 0 0 0 33.33 (1.00) 0 0 0 0 0 5.77
(1.00) 0 0 0 0 0 - 0 0 0 0 0
Gill - Congestion 0 0 0 0 0 0 0 0 0 1.92 (1.00) 0 0 0 0 0 - 0 0 0 0 0
Liver - Normal 0 0 0 0 0 0 0 0 0 1.92 (1.00) 0 0 0 0 0 - 0 0 0 0 0
Liver - Post mortem autolysis/necrosis 0 0 0 33.33
(1.00) 0 0 0 0 0 1.92 (1.00) 0 0 0 0 0 - 0 0 0 0 0
Kidney - Normal 0 0 0 0 0 0 0 0 0 1.92 (1.00) 0 0 0 0 0 - 0 0 0 0 0
Kidney - Post mortem autolysis 0 0 0 33.33
(1.00) 0 0 0 0 0 3.85 (1.00) 0 0 0 0 0 - 0 0 0 0 0
Spleen - Normal 0 0 0 33.33 (1.00) 0 0 0 0 0 5.77
(1.00) 0 0 0 0 0 - 0 0 0 0 0
Spleen - Post mortem autolysis 0 0 0 0 0 0 0 0 0 0 0 0 0 0 0 - 0 0 0 0 0
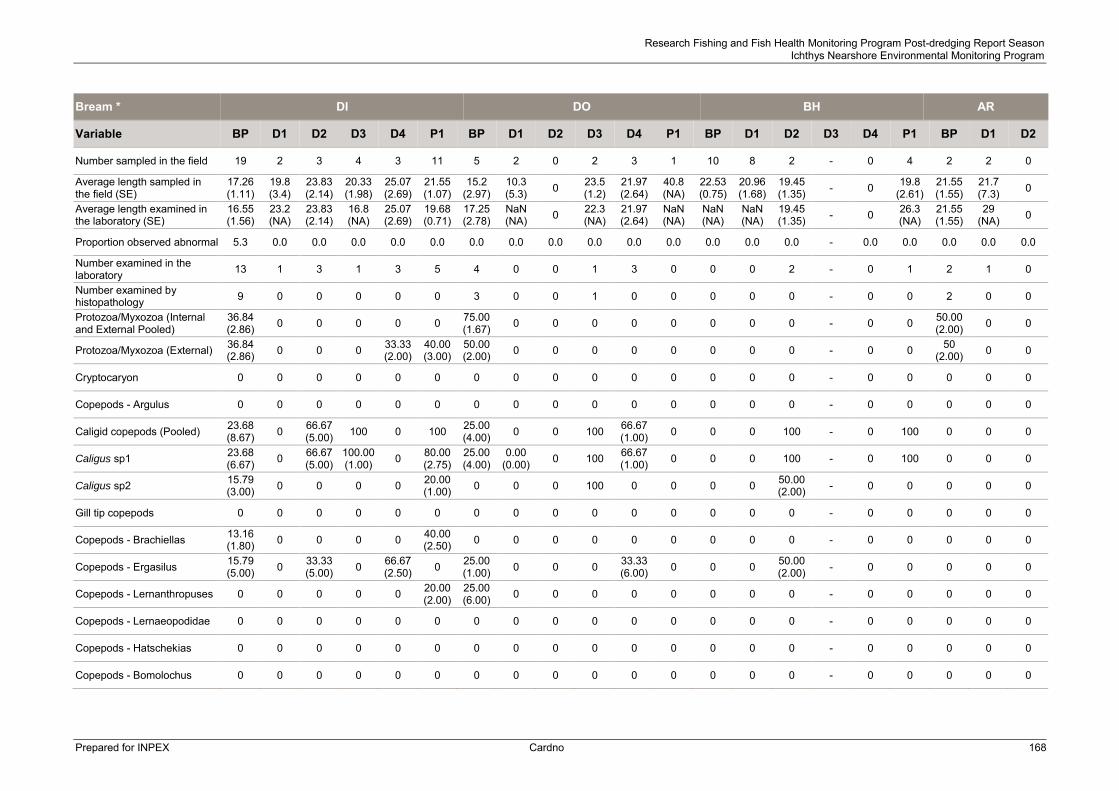
Research Fishing and Fish Health Monitoring Program Post-dredging Report Season Ichthys Nearshore Environmental Monitoring Program
Prepared for INPEX Cardno 168
Bream * DI DO BH AR
Variable BP D1 D2 D3 D4 P1 BP D1 D2 D3 D4 P1 BP D1 D2 D3 D4 P1 BP D1 D2
Number sampled in the field 19 2 3 4 3 11 5 2 0 2 3 1 10 8 2 - 0 4 2 2 0
Average length sampled in the field (SE)
17.26 (1.11)
19.8 (3.4)
23.83 (2.14)
20.33 (1.98)
25.07 (2.69)
21.55 (1.07)
15.2 (2.97)
10.3 (5.3) 0 23.5
(1.2) 21.97 (2.64)
40.8 (NA)
22.53 (0.75)
20.96 (1.68)
19.45 (1.35) - 0 19.8
(2.61) 21.55 (1.55)
21.7 (7.3) 0
Average length examined in the laboratory (SE)
16.55 (1.56)
23.2 (NA)
23.83 (2.14)
16.8 (NA)
25.07 (2.69)
19.68 (0.71)
17.25 (2.78)
NaN (NA) 0 22.3
(NA) 21.97 (2.64)
NaN (NA)
NaN (NA)
NaN (NA)
19.45 (1.35) - 0 26.3
(NA) 21.55 (1.55)
29 (NA) 0
Proportion observed abnormal 5.3 0.0 0.0 0.0 0.0 0.0 0.0 0.0 0.0 0.0 0.0 0.0 0.0 0.0 0.0 - 0.0 0.0 0.0 0.0 0.0
Number examined in the laboratory 13 1 3 1 3 5 4 0 0 1 3 0 0 0 2 - 0 1 2 1 0
Number examined by histopathology 9 0 0 0 0 0 3 0 0 1 0 0 0 0 0 - 0 0 2 0 0
Protozoa/Myxozoa (Internal and External Pooled)
36.84 (2.86) 0 0 0 0 0 75.00
(1.67) 0 0 0 0 0 0 0 0 - 0 0 50.00 (2.00) 0 0
Protozoa/Myxozoa (External) 36.84 (2.86) 0 0 0 33.33
(2.00) 40.00 (3.00)
50.00 (2.00) 0 0 0 0 0 0 0 0 - 0 0 50
(2.00) 0 0
Cryptocaryon 0 0 0 0 0 0 0 0 0 0 0 0 0 0 0 - 0 0 0 0 0
Copepods - Argulus 0 0 0 0 0 0 0 0 0 0 0 0 0 0 0 - 0 0 0 0 0
Caligid copepods (Pooled) 23.68 (8.67) 0 66.67
(5.00) 100 0 100 25.00 (4.00) 0 0 100 66.67
(1.00) 0 0 0 100 - 0 100 0 0 0
Caligus sp1 23.68 (6.67) 0 66.67
(5.00) 100.00 (1.00) 0 80.00
(2.75) 25.00 (4.00)
0.00 (0.00) 0 100 66.67
(1.00) 0 0 0 100 - 0 100 0 0 0
Caligus sp2 15.79 (3.00) 0 0 0 0 20.00
(1.00) 0 0 0 100 0 0 0 0 50.00 (2.00) - 0 0 0 0 0
Gill tip copepods 0 0 0 0 0 0 0 0 0 0 0 0 0 0 0 - 0 0 0 0 0
Copepods - Brachiellas 13.16 (1.80) 0 0 0 0 40.00
(2.50) 0 0 0 0 0 0 0 0 0 - 0 0 0 0 0
Copepods - Ergasilus 15.79 (5.00) 0 33.33
(5.00) 0 66.67 (2.50) 0 25.00
(1.00) 0 0 0 33.33 (6.00) 0 0 0 50.00
(2.00) - 0 0 0 0 0
Copepods - Lernanthropuses 0 0 0 0 0 20.00 (2.00)
25.00 (6.00) 0 0 0 0 0 0 0 0 - 0 0 0 0 0
Copepods - Lernaeopodidae 0 0 0 0 0 0 0 0 0 0 0 0 0 0 0 - 0 0 0 0 0
Copepods - Hatschekias 0 0 0 0 0 0 0 0 0 0 0 0 0 0 0 - 0 0 0 0 0
Copepods - Bomolochus 0 0 0 0 0 0 0 0 0 0 0 0 0 0 0 - 0 0 0 0 0

Research Fishing and Fish Health Monitoring Program Post-dredging Report Season Ichthys Nearshore Environmental Monitoring Program
Prepared for INPEX Cardno 169
Bream * DI DO BH AR
Variable BP D1 D2 D3 D4 P1 BP D1 D2 D3 D4 P1 BP D1 D2 D3 D4 P1 BP D1 D2
Copepods - Thyansote 0 0 0 0 0 0 0 0 0 0 0 0 0 0 0 - 0 0 0 0 0
Copepods - Naebranchia 0 0 0 0 0 0 0 0 0 0 0 0 0 0 0 - 0 0 0 0 0
Isopods - Gnathiids 0 0 0 0 0 0 0 0 0 0 0 0 0 0 0 - 0 0 0 0 0
Isopods - Isopods 0 0 0 0 0 0 0 0 0 0 0 0 0 0 0 - 0 0 0 0 0
Gill - Dactylogyrid monogeneans 0 0 0 0 100 40.00
(5.00) 0 0 0 100 66.67 (14.00) 0 0 0 0 - 0 0 0 0 0
Polyopisthocotyid monogeneans
15.79 (1.50) 0 0 0 0 20.00
(1.00) 0 0 0 0 0 0 0 0 0 - 0 100 0 0 0
Capsalid monogeneans 15.79 (2.00) 0 0 0 0 20.00
(4.00) 0 0 0 0 0 0 0 0 0 - 0 0 0 0 0
Transversotrema digeneans 0 0 0 100 0 80.00 (6.25) 0 0 0 0 33.33
(1.00) 0 0 0 0 - 0 100 0 0 0
Didymozoid digeneans 0 0 0 0 0 0 0 0 0 0 0 0 0 0 0 - 0 0 0 0 0
Nematodes - Philometrids 0 0 0 0 0 0 0 0 0 0 0 0 0 0 0 - 0 0 0 0 0
Nematodes - Anisakis 15.79 (1.00) 0 0 0 0 0 50.00
(27.5) 0 0 100 33.33 (1.00) 0 0 0 0 - 0 0 0 100 0
Cestodes - Metacestode 0 0 33.33 (1.00) 0 33.33
(1.00) 20.00 (2.00) 0 0 0 0 0 0 0 0 0 - 0 100 50.00
(3.00) 0 0
Leeches - Hirudines 0 0 0 0 0 0 0 0 0 0 0 0 0 0 0 - 0 0 0 0 0
Gills hyperplasia 0 0 0 0 0 0 0 0 0 0 0 0 0 0 0 - 0 0 0 0 0
Granulomas (Pooled) 21.05 (1.50) 0 0 0 0 0 0 0 0 0 0 0 0 0 0 - 0 0 0 0 0
Gill - Granulomas 0 0 0 0 0 0 0 0 0 0 0 0 0 0 0 - 0 0 0 0 0
Liver - Granulomas 0 0 0 0 0 0 0 0 0 0 0 0 0 0 0 - 0 0 0 0 0
Kidney - Granulomas 21.05 (1.00) 0 0 0 0 0 0 0 0 0 0 0 0 0 0 - 0 0 0 0 0
Spleen - Granulomas 10.53 (1.00) 0 0 0 0 0 0 0 0 0 0 0 0 0 0 - 0 0 0 0 0
Metazoa (Pooled) 10.53 (1.00) 0 0 0 0 0 66.67
(1.00) 0 0 0 0 0 0 0 0 - 0 0 50.00 (1.00) 0 0
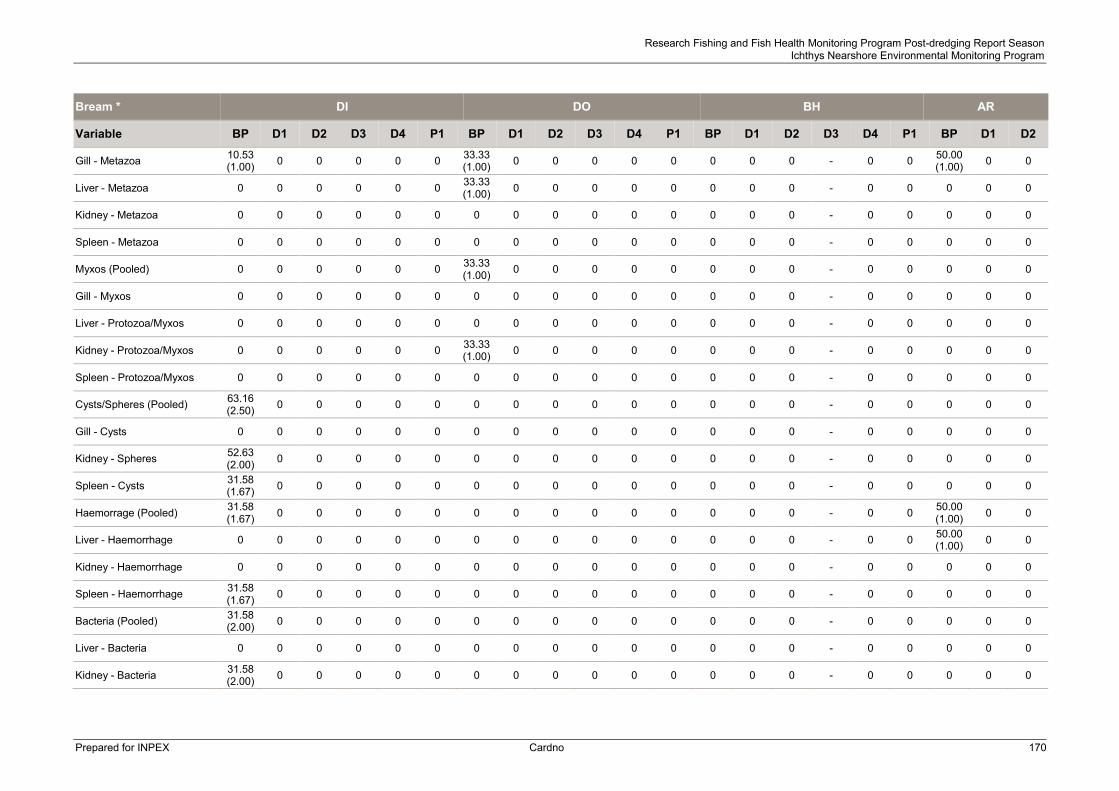
Research Fishing and Fish Health Monitoring Program Post-dredging Report Season Ichthys Nearshore Environmental Monitoring Program
Prepared for INPEX Cardno 170
Bream * DI DO BH AR
Variable BP D1 D2 D3 D4 P1 BP D1 D2 D3 D4 P1 BP D1 D2 D3 D4 P1 BP D1 D2
Gill - Metazoa 10.53 (1.00) 0 0 0 0 0 33.33
(1.00) 0 0 0 0 0 0 0 0 - 0 0 50.00 (1.00) 0 0
Liver - Metazoa 0 0 0 0 0 0 33.33 (1.00) 0 0 0 0 0 0 0 0 - 0 0 0 0 0
Kidney - Metazoa 0 0 0 0 0 0 0 0 0 0 0 0 0 0 0 - 0 0 0 0 0
Spleen - Metazoa 0 0 0 0 0 0 0 0 0 0 0 0 0 0 0 - 0 0 0 0 0
Myxos (Pooled) 0 0 0 0 0 0 33.33 (1.00) 0 0 0 0 0 0 0 0 - 0 0 0 0 0
Gill - Myxos 0 0 0 0 0 0 0 0 0 0 0 0 0 0 0 - 0 0 0 0 0
Liver - Protozoa/Myxos 0 0 0 0 0 0 0 0 0 0 0 0 0 0 0 - 0 0 0 0 0
Kidney - Protozoa/Myxos 0 0 0 0 0 0 33.33 (1.00) 0 0 0 0 0 0 0 0 - 0 0 0 0 0
Spleen - Protozoa/Myxos 0 0 0 0 0 0 0 0 0 0 0 0 0 0 0 - 0 0 0 0 0
Cysts/Spheres (Pooled) 63.16 (2.50) 0 0 0 0 0 0 0 0 0 0 0 0 0 0 - 0 0 0 0 0
Gill - Cysts 0 0 0 0 0 0 0 0 0 0 0 0 0 0 0 - 0 0 0 0 0
Kidney - Spheres 52.63 (2.00) 0 0 0 0 0 0 0 0 0 0 0 0 0 0 - 0 0 0 0 0
Spleen - Cysts 31.58 (1.67) 0 0 0 0 0 0 0 0 0 0 0 0 0 0 - 0 0 0 0 0
Haemorrage (Pooled) 31.58 (1.67) 0 0 0 0 0 0 0 0 0 0 0 0 0 0 - 0 0 50.00
(1.00) 0 0
Liver - Haemorrhage 0 0 0 0 0 0 0 0 0 0 0 0 0 0 0 - 0 0 50.00 (1.00) 0 0
Kidney - Haemorrhage 0 0 0 0 0 0 0 0 0 0 0 0 0 0 0 - 0 0 0 0 0
Spleen - Haemorrhage 31.58 (1.67) 0 0 0 0 0 0 0 0 0 0 0 0 0 0 - 0 0 0 0 0
Bacteria (Pooled) 31.58 (2.00) 0 0 0 0 0 0 0 0 0 0 0 0 0 0 - 0 0 0 0 0
Liver - Bacteria 0 0 0 0 0 0 0 0 0 0 0 0 0 0 0 - 0 0 0 0 0
Kidney - Bacteria 31.58 (2.00) 0 0 0 0 0 0 0 0 0 0 0 0 0 0 - 0 0 0 0 0

Research Fishing and Fish Health Monitoring Program Post-dredging Report Season Ichthys Nearshore Environmental Monitoring Program
Prepared for INPEX Cardno 171
Bream * DI DO BH AR
Variable BP D1 D2 D3 D4 P1 BP D1 D2 D3 D4 P1 BP D1 D2 D3 D4 P1 BP D1 D2
Spleen – Bacteria rickettsia 0 0 0 0 0 0 0 0 0 0 0 0 0 0 0 - 0 0 0 0 0
Blood fluke (Pooled) 0 0 0 0 0 0 0 0 0 0 0 0 0 0 0 - 0 0 0 0 0
Gill - Blood fluke eggs 0 0 0 0 0 0 0 0 0 0 0 0 0 0 0 - 0 0 0 0 0
Liver - Blood fluke 0 0 0 0 0 0 0 0 0 0 0 0 0 0 0 - 0 0 0 0 0
Kidney - Blood fluke 0 0 0 0 0 0 0 0 0 0 0 0 0 0 0 - 0 0 0 0 0
Pigment deposition (Pooled) 52.63 (1.40) 0 0 0 0 0 66.67
(1.50) 0 0 0 0 0 0 0 0 - 0 0 50.00 (2.00) 0 0
Liver - Pigment 0 0 0 0 0 0 0 0 0 0 0 0 0 0 0 - 0 0 0 0 0
Kidney - Pigment 21.05 (1.00) 0 0 0 0 0 66.67
(1.00) 0 0 0 0 0 0 0 0 - 0 0 50.00 (1.00) 0 0
Spleen - Pigment 52.63 (1.00) 0 0 0 0 0 33.33
(1.00) 0 0 0 0 0 0 0 0 - 0 0 50.00 (1.00) 0 0
Gill - Epitheliocystis 0 0 0 0 0 0 0 0 0 0 0 0 0 0 0 - 0 0 0 0 0
Liver - Clear cell foci 0 0 0 0 0 0 0 0 0 0 0 0 0 0 0 - 0 0 0 0 0
Spleen - Vacuoles 0 0 0 0 0 0 0 0 0 0 0 0 0 0 0 - 0 0 0 0 0
Spleen - Scar tissue 0 0 0 0 0 0 0 0 0 0 0 0 0 0 0 - 0 0 0 0 0
Internal Myxos/Protozoa 0 0 0 0 0 0 33.33 (1.00) 0 0 0 0 0 0 0 0 - 0 0 0 0 0
Gill - Normal 0 0 0 0 0 0 0 0 0 0 0 0 0 0 0 - 0 0 0 0 0
Gill - Post mortem autolysis 0 0 0 0 0 0 0 0 0 0 0 0 0 0 0 - 0 0 0 0 0
Gill - Congestion 0 0 0 0 0 0 0 0 0 0 0 0 0 0 0 - 0 0 0 0 0
Liver - Normal 0 0 0 0 0 0 0 0 0 0 0 0 0 0 0 - 0 0 0 0 0
Liver - Post mortem autolysis/necrosis 0 0 0 0 0 0 0 0 0 0 0 0 0 0 0 - 0 0 0 0 0
Kidney - Normal 0 0 0 0 0 0 0 0 0 0 0 0 0 0 0 - 0 0 0 0 0
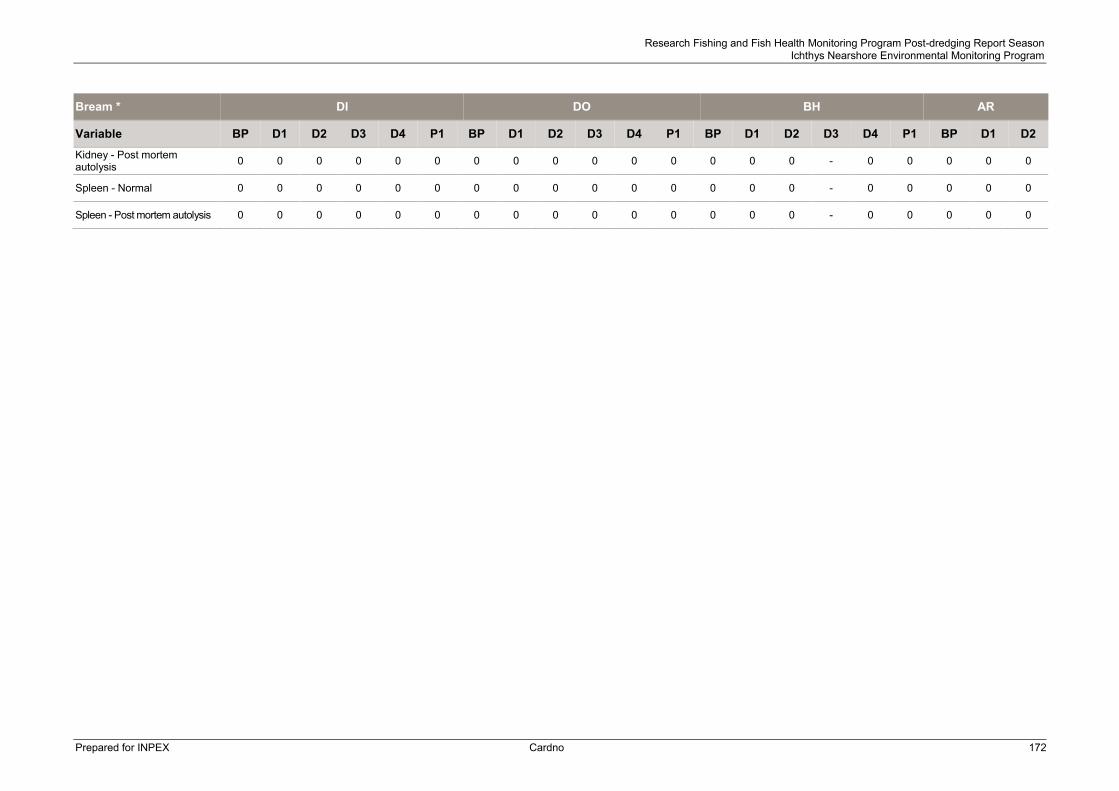
Research Fishing and Fish Health Monitoring Program Post-dredging Report Season Ichthys Nearshore Environmental Monitoring Program
Prepared for INPEX Cardno 172
Bream * DI DO BH AR
Variable BP D1 D2 D3 D4 P1 BP D1 D2 D3 D4 P1 BP D1 D2 D3 D4 P1 BP D1 D2 Kidney - Post mortem autolysis 0 0 0 0 0 0 0 0 0 0 0 0 0 0 0 - 0 0 0 0 0
Spleen - Normal 0 0 0 0 0 0 0 0 0 0 0 0 0 0 0 - 0 0 0 0 0
Spleen - Post mortem autolysis 0 0 0 0 0 0 0 0 0 0 0 0 0 0 0 - 0 0 0 0 0

Research Fishing and Fish Health Monitoring Program Post-dredging Report Season Ichthys Nearshore Environmental Monitoring Program
Prepared for INPEX Cardno 173
Giant trevally DI DO BH AR
Variable BP D1 D2 D3 D4 P1 BP D1 D2 D3 D4 P1 BP D1 D2 D3 D4 P1 BP D1 D2
Number sampled in the field 3 1 0 0 0 0 0 0 0 0 1 2 4 6 0 - 0 1 1 4 0
Average length sampled in the field (SE)
33.67 (6.36)
23.3 (NA) 0 0 0 0 0 0 0 0 17.8
(NA) 21.15 (0.35)
27.02 (3.6)
27.93 (11.34
) 0 - 0 29.5
(NA) 17.9 (NA)
22.02 (0.17) 0
Average length examined in the laboratory (SE)
28(5.00)
23.3 (NA) 0 0 0 0 0 0 0 0 17.8
(NA) NaN (NA)
27.45 (5.05)
84 (NA) 0 - 0 29.5
(NA) 17.9 (NA)
22.02 (0.17) 0
Proportion observed abnormal 0 0 0 0 0 0 0 0 0 0 100 0 25 0 0 - 0 0 0 0 0
Number examined in the laboratory 2 1 0 0 0 0 0 0 0 0 1 0 2 1 0 - 0 1 1 4 0
Number examined by histopathology 2 0 0 0 0 0 0 0 0 0 1 0 2 0 0 - 0 1 1 0 0
Protozoa/Myxozoa (Internal and External Pooled)
50.00 (1.00) 0 0 0 0 0 0 0 0 0 0 0 0 0 0 - 0 0 100 0 0
Protozoa/Myxozoa (External) 0 0 0 0 0 0 0 0 0 0 0 0 0 0 0 - 0 0 0 0 0
Cryptocaryon 0 0 0 0 0 0 0 0 0 0 0 0 0 0 0 - 0 0 0 0 0
Copepods - Argulus 0 0 0 0 0 0 0 0 0 0 0 0 0 0 0 - 0 0 0 0 0
Caligid copepods (Pooled) 100 100 0 0 0 0 0 0 0 0 100 0 100 100 0 - 0 100 100 75.00 (5.00) 0
Caligus sp1 0 100 0 0 0 0 0 0 0 0 100 0 75.00 (2.00) 100 0 - 0 100 100 75.00
(4.33) 0
Caligus sp2 100 0 0 0 0 0 0 0 0 0 0 0 25.00 (11.00) 0 0 - 0 100 100 25.00
(2.00) 0
Gill tip copepods 0 0 0 0 0 0 0 0 0 0 0 0 0 0 0 - 0 0 0 0 0
Copepods - Brachiellas 0 0 0 0 0 0 0 0 0 0 0 0 0 0 0 - 0 0 0 0 0
Copepods - Ergasilus 0 0 0 0 0 0 0 0 0 0 0 0 0 0 0 - 0 0 0 0 0
Copepods - Lernanthropuses 0 0 0 0 0 0 0 0 0 0 0 0 0 100 0 - 0 0 0 0 0
Copepods - Lernaeopodidae 0 0 0 0 0 0 0 0 0 0 0 0 0 0 0 - 0 0 0 0 0
Copepods - Hatschekias 0 0 0 0 0 0 0 0 0 0 0 0 0 0 0 - 0 0 0 0 0
Copepods - Bomolochus 0 0 0 0 0 0 0 0 0 0 0 0 0 0 0 - 0 0 0 0 0

Research Fishing and Fish Health Monitoring Program Post-dredging Report Season Ichthys Nearshore Environmental Monitoring Program
Prepared for INPEX Cardno 174
Giant trevally DI DO BH AR
Variable BP D1 D2 D3 D4 P1 BP D1 D2 D3 D4 P1 BP D1 D2 D3 D4 P1 BP D1 D2
Copepods - Thyansote 0 0 0 0 0 0 0 0 0 0 0 0 0 0 0 - 0 0 0 0 0
Copepods - Naebranchia 0 0 0 0 0 0 0 0 0 0 0 0 0 0 0 - 0 0 0 0 0
Isopods - Gnathiids 0 0 0 0 0 0 0 0 0 0 0 0 0 0 0 - 0 0 0 0 0
Isopods - Isopods 0 0 0 0 0 0 0 0 0 0 0 0 25.00 (2.00) 100 0 - 0 0 0 0 0
Gill - Dactylogyrid monogeneans 0 100 0 0 0 0 0 0 0 0 0 0 0 0 0 - 0 0 0 0 0
Polyopisthocotyid monogeneans
50.00 (2.00) 100 0 0 0 0 0 0 0 0 100 0 25.00
(2.00) 100 0 - 0 100 0 100 0
Capsalid monogeneans 0 0 0 0 0 0 0 0 0 0 0 0 75.00 (1.00) 0 0 - 0 0 0 0 0
Transversotrema digeneans 0 0 0 0 0 0 0 0 0 0 0 0 0 0 0 - 0 0 0 0 0
Didymozoid digeneans 0 0 0 0 0 0 0 0 0 0 0 0 0 0 0 - 0 0 0 0 0
Nematodes - Philometrids 0 0 0 0 0 0 0 0 0 0 0 0 0 0 0 - 0 0 0 0 0
Nematodes - Anisakis 0 0 0 0 0 0 0 0 0 0 0 0 0 0 0 - 0 0 0 0 0
Cestodes - Metacestode 0 0 0 0 0 0 0 0 0 0 0 0 25.00 (2.00) 0 0 - 0 100 100 0 0
Leeches - Hirudines 0 0 0 0 0 0 0 0 0 0 0 0 0 0 0 - 0 0 0 0 0
Gills hyperplasia 0 0 0 0 0 0 0 0 0 0 0 0 0 0 0 - 0 0 0 0 0
Granulomas (Pooled) 100 0 0 0 0 0 0 0 0 0 100 0 75.00 (2.00) 0 0 - 0 0 100 0 0
Gill - Granulomas 0 0 0 0 0 0 0 0 0 0 0 0 0 0 0 - 0 0 0 0 0
Liver - Granulomas 100 0 0 0 0 0 0 0 0 0 0 0 75.00 (1.00) 0 0 - 0 0 100 0 0
Kidney - Granulomas 0 0 0 0 0 0 0 0 0 0 0 0 75.00 (1.00) 0 0 - 0 0 0 0 0
Spleen - Granulomas 0 0 0 0 0 0 0 0 0 0 100 0 0 0 0 - 0 0 0 0 0
Metazoa (Pooled) 50.00 (2.00) 0 0 0 0 0 0 0 0 0 0 0 0 0 0 - 0 0 100 0 0
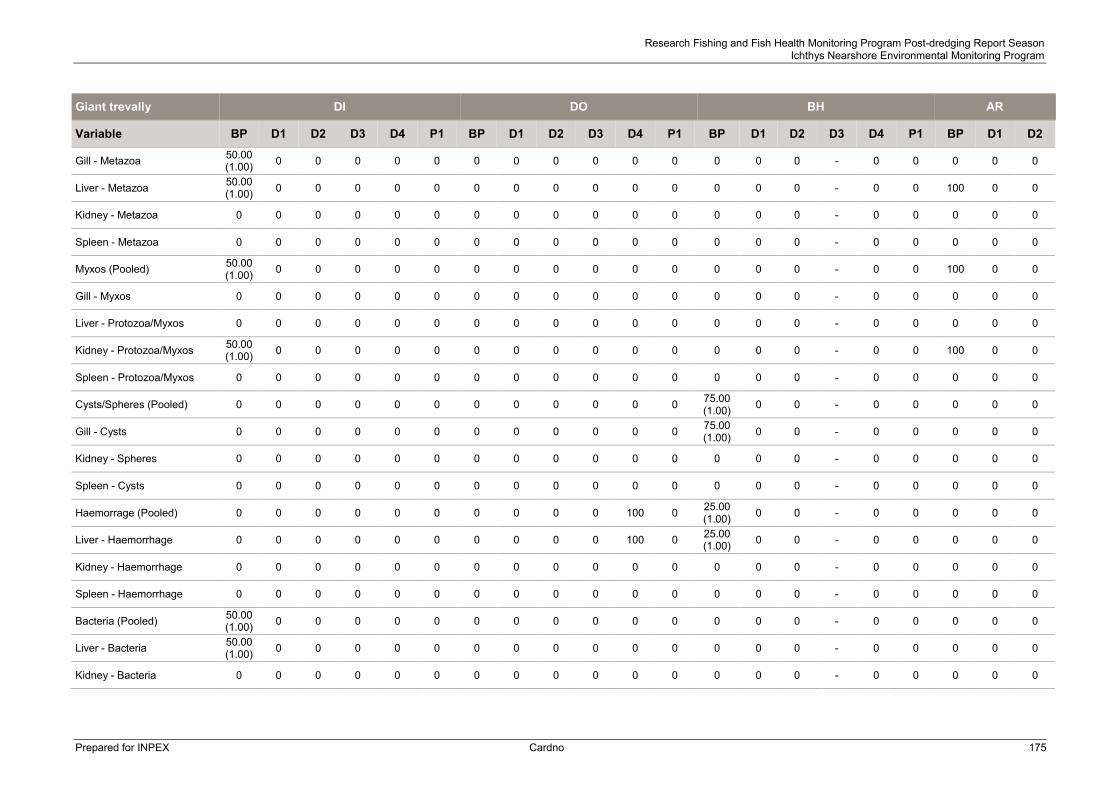
Research Fishing and Fish Health Monitoring Program Post-dredging Report Season Ichthys Nearshore Environmental Monitoring Program
Prepared for INPEX Cardno 175
Giant trevally DI DO BH AR
Variable BP D1 D2 D3 D4 P1 BP D1 D2 D3 D4 P1 BP D1 D2 D3 D4 P1 BP D1 D2
Gill - Metazoa 50.00 (1.00) 0 0 0 0 0 0 0 0 0 0 0 0 0 0 - 0 0 0 0 0
Liver - Metazoa 50.00 (1.00) 0 0 0 0 0 0 0 0 0 0 0 0 0 0 - 0 0 100 0 0
Kidney - Metazoa 0 0 0 0 0 0 0 0 0 0 0 0 0 0 0 - 0 0 0 0 0
Spleen - Metazoa 0 0 0 0 0 0 0 0 0 0 0 0 0 0 0 - 0 0 0 0 0
Myxos (Pooled) 50.00 (1.00) 0 0 0 0 0 0 0 0 0 0 0 0 0 0 - 0 0 100 0 0
Gill - Myxos 0 0 0 0 0 0 0 0 0 0 0 0 0 0 0 - 0 0 0 0 0
Liver - Protozoa/Myxos 0 0 0 0 0 0 0 0 0 0 0 0 0 0 0 - 0 0 0 0 0
Kidney - Protozoa/Myxos 50.00 (1.00) 0 0 0 0 0 0 0 0 0 0 0 0 0 0 - 0 0 100 0 0
Spleen - Protozoa/Myxos 0 0 0 0 0 0 0 0 0 0 0 0 0 0 0 - 0 0 0 0 0
Cysts/Spheres (Pooled) 0 0 0 0 0 0 0 0 0 0 0 0 75.00 (1.00) 0 0 - 0 0 0 0 0
Gill - Cysts 0 0 0 0 0 0 0 0 0 0 0 0 75.00 (1.00) 0 0 - 0 0 0 0 0
Kidney - Spheres 0 0 0 0 0 0 0 0 0 0 0 0 0 0 0 - 0 0 0 0 0
Spleen - Cysts 0 0 0 0 0 0 0 0 0 0 0 0 0 0 0 - 0 0 0 0 0
Haemorrage (Pooled) 0 0 0 0 0 0 0 0 0 0 100 0 25.00 (1.00) 0 0 - 0 0 0 0 0
Liver - Haemorrhage 0 0 0 0 0 0 0 0 0 0 100 0 25.00 (1.00) 0 0 - 0 0 0 0 0
Kidney - Haemorrhage 0 0 0 0 0 0 0 0 0 0 0 0 0 0 0 - 0 0 0 0 0
Spleen - Haemorrhage 0 0 0 0 0 0 0 0 0 0 0 0 0 0 0 - 0 0 0 0 0
Bacteria (Pooled) 50.00 (1.00) 0 0 0 0 0 0 0 0 0 0 0 0 0 0 - 0 0 0 0 0
Liver - Bacteria 50.00 (1.00) 0 0 0 0 0 0 0 0 0 0 0 0 0 0 - 0 0 0 0 0
Kidney - Bacteria 0 0 0 0 0 0 0 0 0 0 0 0 0 0 0 - 0 0 0 0 0
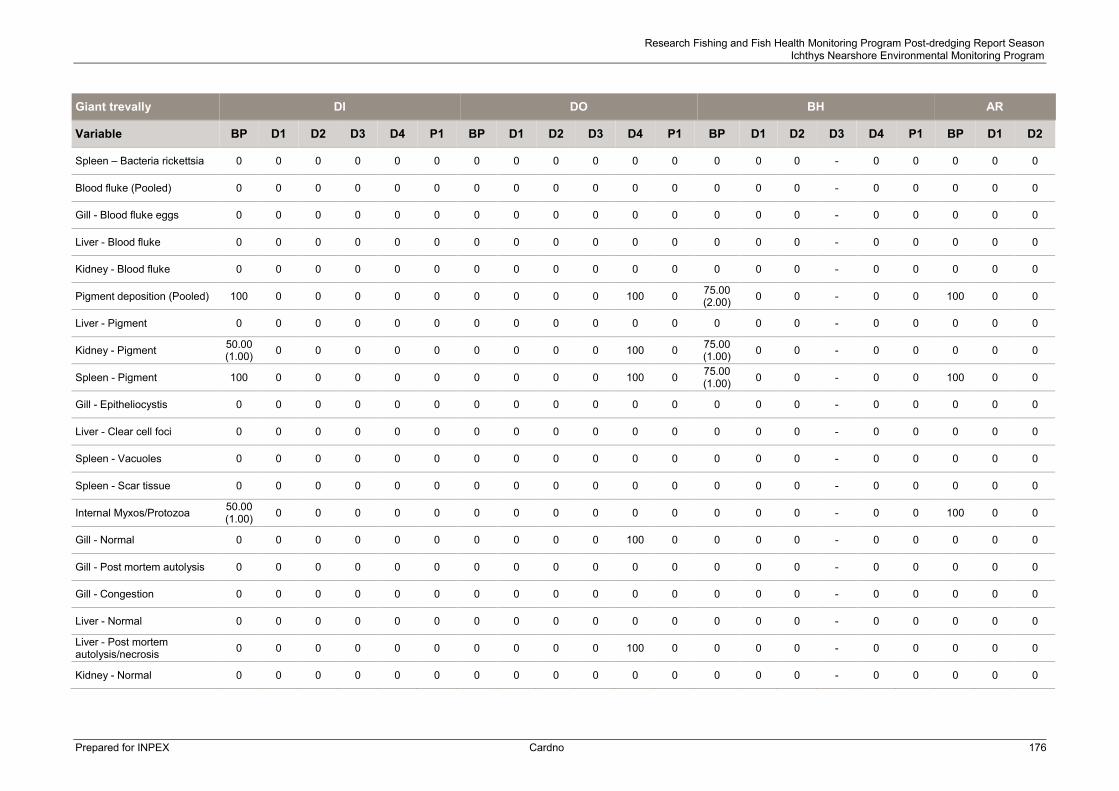
Research Fishing and Fish Health Monitoring Program Post-dredging Report Season Ichthys Nearshore Environmental Monitoring Program
Prepared for INPEX Cardno 176
Giant trevally DI DO BH AR
Variable BP D1 D2 D3 D4 P1 BP D1 D2 D3 D4 P1 BP D1 D2 D3 D4 P1 BP D1 D2
Spleen – Bacteria rickettsia 0 0 0 0 0 0 0 0 0 0 0 0 0 0 0 - 0 0 0 0 0
Blood fluke (Pooled) 0 0 0 0 0 0 0 0 0 0 0 0 0 0 0 - 0 0 0 0 0
Gill - Blood fluke eggs 0 0 0 0 0 0 0 0 0 0 0 0 0 0 0 - 0 0 0 0 0
Liver - Blood fluke 0 0 0 0 0 0 0 0 0 0 0 0 0 0 0 - 0 0 0 0 0
Kidney - Blood fluke 0 0 0 0 0 0 0 0 0 0 0 0 0 0 0 - 0 0 0 0 0
Pigment deposition (Pooled) 100 0 0 0 0 0 0 0 0 0 100 0 75.00 (2.00) 0 0 - 0 0 100 0 0
Liver - Pigment 0 0 0 0 0 0 0 0 0 0 0 0 0 0 0 - 0 0 0 0 0
Kidney - Pigment 50.00 (1.00) 0 0 0 0 0 0 0 0 0 100 0 75.00
(1.00) 0 0 - 0 0 0 0 0
Spleen - Pigment 100 0 0 0 0 0 0 0 0 0 100 0 75.00 (1.00) 0 0 - 0 0 100 0 0
Gill - Epitheliocystis 0 0 0 0 0 0 0 0 0 0 0 0 0 0 0 - 0 0 0 0 0
Liver - Clear cell foci 0 0 0 0 0 0 0 0 0 0 0 0 0 0 0 - 0 0 0 0 0
Spleen - Vacuoles 0 0 0 0 0 0 0 0 0 0 0 0 0 0 0 - 0 0 0 0 0
Spleen - Scar tissue 0 0 0 0 0 0 0 0 0 0 0 0 0 0 0 - 0 0 0 0 0
Internal Myxos/Protozoa 50.00 (1.00) 0 0 0 0 0 0 0 0 0 0 0 0 0 0 - 0 0 100 0 0
Gill - Normal 0 0 0 0 0 0 0 0 0 0 100 0 0 0 0 - 0 0 0 0 0
Gill - Post mortem autolysis 0 0 0 0 0 0 0 0 0 0 0 0 0 0 0 - 0 0 0 0 0
Gill - Congestion 0 0 0 0 0 0 0 0 0 0 0 0 0 0 0 - 0 0 0 0 0
Liver - Normal 0 0 0 0 0 0 0 0 0 0 0 0 0 0 0 - 0 0 0 0 0
Liver - Post mortem autolysis/necrosis 0 0 0 0 0 0 0 0 0 0 100 0 0 0 0 - 0 0 0 0 0
Kidney - Normal 0 0 0 0 0 0 0 0 0 0 0 0 0 0 0 - 0 0 0 0 0

Research Fishing and Fish Health Monitoring Program Post-dredging Report Season Ichthys Nearshore Environmental Monitoring Program
Prepared for INPEX Cardno 177
Giant trevally DI DO BH AR
Variable BP D1 D2 D3 D4 P1 BP D1 D2 D3 D4 P1 BP D1 D2 D3 D4 P1 BP D1 D2 Kidney - Post mortem autolysis 0 0 0 0 0 0 0 0 0 0 100 0 0 0 0 - 0 0 0 0 0
Spleen - Normal 0 0 0 0 0 0 0 0 0 0 0 0 0 0 0 - 0 0 0 0 0
Spleen - Post mortem autolysis 0 0 0 0 0 0 0 0 0 0 0 0 0 0 0 - 0 0 0 0 0

Research Fishing and Fish Health Monitoring Program Post-dredging Report Season Ichthys Nearshore Environmental Monitoring Program
Prepared for INPEX Cardno 178
Golden snapper DI DO BH AR
Variable BP D1 D2 D3 D4 P1 BP D1 D2 D3 D4 P1 BP D1 D2 D3 D4 P1 BP D1 D2
Number sampled in the field 84 114 20 101 21 86 27 18 2 27 31 12 16 53 30 - 61 13 73 40 28
Average length sampled in the field (SE)
21.04 (0.47)
22.89 (0.41)
21.4 (0.48)
22.59 (0.42)
23.84 (1.43)
20.77 (0.39)
24.37 (1.34)
24.36 (1.27)
24.9 (6.2)
27.24 (1.17)
27.04 (1.03)
23.5 (1.82)
22.16 (1.27)
21.51 (0.42)
25.16 (0.82) - 27.45
(0.69) 28.4
(1.28) 23.95 (0.68)
24.75 (0.84)
26.75 (1.09)
Average length examined in the laboratory (SE)
20.14 (0.98)
24.6 (1.49)
21.4 (0.55)
22.85 (1.04)
26.43 (1.84)
23.27 (1.09)
28.18 (1.37)
23.1 (2.26)
24.9 (6.2)
30.94 (1.24)
26.62 (2.03)
24.32 (2.06)
24.14 (1.7)
21.15 (1.13)
22.74 (1.51) - 31.34
(0.94) 27.3
(1.46) 23.92 (0.76)
22.83 (0.98)
27.9 (1.86)
Proportion observed abnormal 1.19 0 0 2.97 9.52 0 0 11.11 0 7.41 16.13 0 0 3.77 0 - 1.64 7.69 1.37 5 17.86
Number examined in the laboratory 20 6 9 15 11 12 16 7 2 12 13 10 10 6 7 - 12 10 24 6 12
Number examined by histopathology 12 6 5 11 11 12 12 5 2 10 13 7 9 5 5 - 12 9 18 6 6
Protozoa/Myxozoa (Internal and External Pooled)
82.03 (1.00)
16.67 (1.00)
11.11 (1.00)
24.26 (1.00) 0 0 8.33
(1.00) 55.56 (1.00)
50.00 (1.00)
40.74 (1.23) 0 0 33.33
(1.00) 0 42.86 (1.00) - 0 0 17.41
(1.00) 19.00 (1.00)
11.73 (1.00)
Protozoa/Myxozoa (External) 0 0 11.11 (1.00)
24.26 (1.00) 0 0 0 0 50.00
(1.00) 40.74 (1.23) 0 0 0 0 42.86
(1.00) - 0 0 0 0 11.73 (1.00)
Cryptocaryon 0 0 0 0 0 0 0 0 0 0 0 10.00 (7.00) 0 0 0 - 0 0 0 0 0
Copepods - Argulus 0 0 0 0 0 0 0 0 0 0 0 0 0 0 0 - 0 0 0 0 11.73 (1.00)
Caligid copepods (Pooled) 0 0 0 16.17 (1.00)
9.52 (3.00)
16.70 (2.00)
6.25 (2.00)
17.78 (1.00) 0 46.30
(1.40) 41.13 (1.63)
70.00 (2.00)
20.00 (1.00)
16.04 (2.00) 0 - 35.77
(2.50) 30.80 (1.00)
17.15 (1.00)
43.00 (1.00)
18.88 (1.00)
Caligus sp1 0 0 0 16.17 (1.00)
9.52 (3.00)
16.7 (2.00)
6.25 (2.00)
17.78 (1.00) 0 46.3
(1.4) 41.13 (1.63)
70.00 (2.00)
20.00 (1.00)
16.04 (2.00) 0 - 35.77
(2.50) 30.8
(1.00) 17.15 (1.00)
43.00 (1.00)
18.88 (1.00)
Caligus sp2 0 0 0 0 0 0 0 0 0 0 0 0 0 0 0 - 0 0 0 0 0
Gill tip copepods 0 0 0 0 0 0 0 0 0 0 0 0 0 0 0 - 0 0 0 0 0
Copepods - Brachiellas 0 0 0 32.34 (2.75)
10.05 (1.00)
8.30 (1.00)
6.25 (7.00)
58.89 (5.66) 0 44.44
(9.04) 45.16 (1.84) 0 10.00
(1.00) 32.08 (1.00) 0 - 0 0 0 0 0
Copepods - Ergasilus 0 0 0 0 0 0 0 0 0 0 0 0 0 0 0 - 17.88 (245) 0 0 0 0
Copepods - Lernanthropuses 0 0 11.11 (1.00)
8.09 (1.00) 0 8.30
(1.00) 6.25
(1.00) 35.56 (2.00)
50.00 (2.00)
9.26 (1.00) 0 30.00
(1.00) 0 0 0 - 0 10.30 (1.00)
5.66 (1.00) 0 3.57
(1.00)
Copepods - Lernaeopodidae 0 0 0 0 0 0 0 0 0 0 0 0 0 0 0 - 0 0 0 0 0
Copepods - Hatschekias 0 0 0 16.17 (4.50)
34.92 (6.76) 0 18.75
(1.67) 0 0 46.30 (5.60)
13.71 (2.71)
40.00 (2.50) 0 0 0 - 17.88
(3.50) 7.70
(1.00) 0 0 15.31 (1.00)
Copepods - Bomolochus 0 0 0 0 0 0 0 0 0 0 0 0 0 0 0 - 0 0 0 0 0

Research Fishing and Fish Health Monitoring Program Post-dredging Report Season Ichthys Nearshore Environmental Monitoring Program
Prepared for INPEX Cardno 179
Golden snapper DI DO BH AR
Variable BP D1 D2 D3 D4 P1 BP D1 D2 D3 D4 P1 BP D1 D2 D3 D4 P1 BP D1 D2
Copepods - Thyansote 0 0 0 0 0 0 0 0 0 0 0 0 0 0 0 - 0 0 0 0 0
Copepods - Naebranchia 0 0 0 0 0 0 0 0 0 0 0 0 0 0 0 - 0 0 0 0 0
Isopods - Gnathiids 0 0 0 0 20.11 (1.00) 0 18.75
(53.00) 0 0 46.30 (10.20)
13.71 (3.59)
70.00 (13.14) 0 0 0 - 0 0 0 0 22.45
(1.52)
Isopods - Isopods 0 16.67 (1.00)
11.11 (1.00) 0 0 0 0 0 0 0 10.48
(1.00) 10.00 (1.00) 0 0 0 - 0 0 5.66
(1.24) 5.00
(1.00) 0
Gill - Dactylogyrid monogeneans
74.00 (7.41)
83.33 (15.60
) 100 100 100 100 68.75
(26.1) 94.44 (51.0) 100 81.48
(41.8) 83.06 (47.5)
70.00 (18.29)
70.00 (11.00)
80.19 (14.60)
71.43 (20.80) - 100 100 69.98
(15.4) 81.00 (7.21)
54.08 (3.93)
Polyopisthocotyid monogeneans 0 0 0 0 0 0 0 0 0 0 0 0 0 0 0 - 0 0 0 0 0
Capsalid monogeneans 5.20 (1.00)
16.67 (2.00) 0 0 0 0 0 0 0 0 0 20.00
(1.00) 0 0 0 - 0 0 0 0 0
Transversotrema digeneans 0 0 0 0 0 0 0 0 0 0 0 0 0 0 0 - 0 0 0 0 0
Didymozoid digeneans 0 0 0 0 0 16.70 (3.50)
12.50 (1.00) 0 0 18.52
(6.50) 24.19 (3.10)
10.00 (3.00)
10.00 (2.00) 0 0 - 17.88
(3.00) 18.00 (2.14) 0 0 0
Nematodes - Philometrids 0 0 0 0 0 0 0 5.56 (1.00) 0 0 3.23
(7.00) 0 0 0 0 - 10.58 (2.85)
7.70 (20.00
) 0 0 0
Nematodes - Anisakis 0 0 0 0 0 0 0 17.78 (2.00) 0 0 0 0 0 0 0 - 0 0 4.29
(1.00) 0 0
Cestodes - Metacestode 0 16.67 (1.00) 0 0 20.11
(1.50) 16.70 (1.50)
18.75 (2.67) 0 0 18.52
(2.00) 0 0 0 16.04 (5.00) 0 - 19.52
(2.63) 0 12.86 (2.33) 0 0
Leeches - Hirudines 0 0 0 0 10.05 (1.00) 0 0 0 0 0 0 0 0 0 0 - 8.94
(1.00) 0 4.29 (1.00) 0 0
Gills hyperplasia 0 0 0 0 0 0 0 0 0 0 0 0 0 0 20.00 (1.00) - 0 0 5.80
(1.00) 0 0
Granulomas (Pooled) 17.97 (1.00)
16.67 (1.00)
20.00 (1.00)
14.11 (1.00) 0 8.30
(1.00) 8.33
(2.00) 0 0 11.57 (1.00)
3.23 (1.00) 0 22.22
(1.00) 0 0 - 0 7.70 (1.00)
17.41 (1.33) 0 5.95
(1.00)
Gill - Granulomas 0 0 0 0 0 0 0 0 0 0 3.23 (1.00) 0 0 0 0 - 0 0 0 0 0
Liver - Granulomas 0 0 0 0 0 0 0 0 0 0 0 0 0 0 0 - 0 0 0 0 0
Kidney - Granulomas 17.97 (1.00)
16.67 (1.00)
20.00 (1.00)
13.12 (1.00) 0 8.30
(1.00) 8.33
(1.00) 0 0 11.57 (1.00) 0 0 11.11
(1.00) 0 0 - 0 7.70 (1.00)
5.8.00 (1.00) 0 5.95
(1.00)
Spleen - Granulomas 0 0 0 0.99 (1.00) 0 0 8.33
(1.00) 0 0 0 0 0 11.11 (1.00) 0 0 - 0 0 17.41
(1.00) 0 0
Metazoa (Pooled) 44.91 (1.00)
33.33 (1.00)
40.00 (1.00)
49.50 (1.00)
65.08 (1.31)
66.70 (1.12) 0 100 50.00
(1.00) 26.85 (1.43)
48.39 (1.00)
42.90 (1.00)
11.11 (1.00)
19.25 (1.00)
40.00 (1.00) - 55.29
(1.35) 57.70 (1.00)
17.41 (1.00) 0 27.38
(1.00)
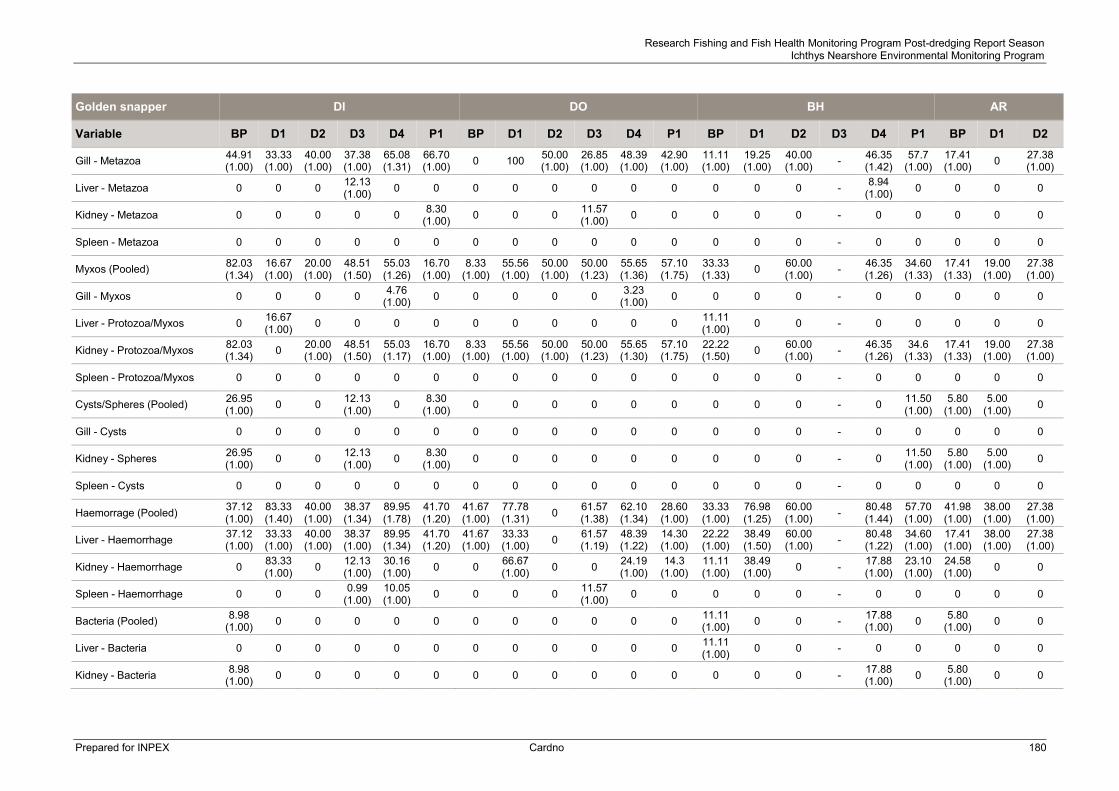
Research Fishing and Fish Health Monitoring Program Post-dredging Report Season Ichthys Nearshore Environmental Monitoring Program
Prepared for INPEX Cardno 180
Golden snapper DI DO BH AR
Variable BP D1 D2 D3 D4 P1 BP D1 D2 D3 D4 P1 BP D1 D2 D3 D4 P1 BP D1 D2
Gill - Metazoa 44.91 (1.00)
33.33 (1.00)
40.00 (1.00)
37.38 (1.00)
65.08 (1.31)
66.70 (1.00) 0 100 50.00
(1.00) 26.85 (1.00)
48.39 (1.00)
42.90 (1.00)
11.11 (1.00)
19.25 (1.00)
40.00 (1.00) - 46.35
(1.42) 57.7
(1.00) 17.41 (1.00) 0 27.38
(1.00)
Liver - Metazoa 0 0 0 12.13 (1.00) 0 0 0 0 0 0 0 0 0 0 0 - 8.94
(1.00) 0 0 0 0
Kidney - Metazoa 0 0 0 0 0 8.30 (1.00) 0 0 0 11.57
(1.00) 0 0 0 0 0 - 0 0 0 0 0
Spleen - Metazoa 0 0 0 0 0 0 0 0 0 0 0 0 0 0 0 - 0 0 0 0 0
Myxos (Pooled) 82.03 (1.34)
16.67 (1.00)
20.00 (1.00)
48.51 (1.50)
55.03 (1.26)
16.70 (1.00)
8.33 (1.00)
55.56 (1.00)
50.00 (1.00)
50.00 (1.23)
55.65 (1.36)
57.10 (1.75)
33.33 (1.33) 0 60.00
(1.00) - 46.35 (1.26)
34.60 (1.33)
17.41 (1.33)
19.00 (1.00)
27.38 (1.00)
Gill - Myxos 0 0 0 0 4.76 (1.00) 0 0 0 0 0 3.23
(1.00) 0 0 0 0 - 0 0 0 0 0
Liver - Protozoa/Myxos 0 16.67 (1.00) 0 0 0 0 0 0 0 0 0 0 11.11
(1.00) 0 0 - 0 0 0 0 0
Kidney - Protozoa/Myxos 82.03 (1.34) 0 20.00
(1.00) 48.51 (1.50)
55.03 (1.17)
16.70 (1.00)
8.33 (1.00)
55.56 (1.00)
50.00 (1.00)
50.00 (1.23)
55.65 (1.30)
57.10 (1.75)
22.22 (1.50) 0 60.00
(1.00) - 46.35 (1.26)
34.6 (1.33)
17.41 (1.33)
19.00 (1.00)
27.38 (1.00)
Spleen - Protozoa/Myxos 0 0 0 0 0 0 0 0 0 0 0 0 0 0 0 - 0 0 0 0 0
Cysts/Spheres (Pooled) 26.95 (1.00) 0 0 12.13
(1.00) 0 8.30 (1.00) 0 0 0 0 0 0 0 0 0 - 0 11.50
(1.00) 5.80
(1.00) 5.00
(1.00) 0
Gill - Cysts 0 0 0 0 0 0 0 0 0 0 0 0 0 0 0 - 0 0 0 0 0
Kidney - Spheres 26.95 (1.00) 0 0 12.13
(1.00) 0 8.30 (1.00) 0 0 0 0 0 0 0 0 0 - 0 11.50
(1.00) 5.80
(1.00) 5.00
(1.00) 0
Spleen - Cysts 0 0 0 0 0 0 0 0 0 0 0 0 0 0 0 - 0 0 0 0 0
Haemorrage (Pooled) 37.12 (1.00)
83.33 (1.40)
40.00 (1.00)
38.37 (1.34)
89.95 (1.78)
41.70 (1.20)
41.67 (1.00)
77.78 (1.31) 0 61.57
(1.38) 62.10 (1.34)
28.60 (1.00)
33.33 (1.00)
76.98 (1.25)
60.00 (1.00) - 80.48
(1.44) 57.70 (1.00)
41.98 (1.00)
38.00 (1.00)
27.38 (1.00)
Liver - Haemorrhage 37.12 (1.00)
33.33 (1.00)
40.00 (1.00)
38.37 (1.00)
89.95 (1.34)
41.70 (1.20)
41.67 (1.00)
33.33 (1.00) 0 61.57
(1.19) 48.39 (1.22)
14.30 (1.00)
22.22 (1.00)
38.49 (1.50)
60.00 (1.00) - 80.48
(1.22) 34.60 (1.00)
17.41 (1.00)
38.00 (1.00)
27.38 (1.00)
Kidney - Haemorrhage 0 83.33 (1.00) 0 12.13
(1.00) 30.16 (1.00) 0 0 66.67
(1.00) 0 0 24.19 (1.00)
14.3 (1.00)
11.11 (1.00)
38.49 (1.00) 0 - 17.88
(1.00) 23.10 (1.00)
24.58 (1.00) 0 0
Spleen - Haemorrhage 0 0 0 0.99 (1.00)
10.05 (1.00) 0 0 0 0 11.57
(1.00) 0 0 0 0 0 - 0 0 0 0 0
Bacteria (Pooled) 8.98 (1.00) 0 0 0 0 0 0 0 0 0 0 0 11.11
(1.00) 0 0 - 17.88 (1.00) 0 5.80
(1.00) 0 0
Liver - Bacteria 0 0 0 0 0 0 0 0 0 0 0 0 11.11 (1.00) 0 0 - 0 0 0 0 0
Kidney - Bacteria 8.98 (1.00) 0 0 0 0 0 0 0 0 0 0 0 0 0 0 - 17.88
(1.00) 0 5.80 (1.00) 0 0

Research Fishing and Fish Health Monitoring Program Post-dredging Report Season Ichthys Nearshore Environmental Monitoring Program
Prepared for INPEX Cardno 181
Golden snapper DI DO BH AR
Variable BP D1 D2 D3 D4 P1 BP D1 D2 D3 D4 P1 BP D1 D2 D3 D4 P1 BP D1 D2
Spleen – Bacteria rickettsia 0 0 0 0 0 0 0 0 0 0 0 0 0 0 0 - 0 0 0 0 0
Blood fluke (Pooled) 0 0 0 0 0 0 0 0 0 0 0 0 11.11 (1.00) 0 0 - 0 0 0 0 0
Gill - Blood fluke eggs 0 0 0 0 0 0 0 0 0 0 0 0 0 0 0 - 0 0 0 0 0
Liver - Blood fluke 0 0 0 0 0 0 0 0 0 0 0 0 11.11 (1.00) 0 0 - 0 0 0 0 0
Kidney - Blood fluke 0 0 0 0 0 0 0 0 0 0 0 0 0 0 0 - 0 0 0 0 0
Pigment deposition (Pooled) 82.03 (1.88) 100 40.00
(1.00) 87.87 (1.30)
79.89 (1.50)
50.00 (1.00)
41.67 (1.40) 100 100 84.72
(1.63) 69.35 (1.30)
57.1 (1.00)
66.67 (1.83)
57.74 (1.67)
80.00 (1.50) - 100 76.90
(1.45) 41.98 (1.55)
95.00 (1.60)
94.05 (1.96)
Liver - Pigment 0 0 0 0 0 0 0 0 0 0 0 0 0 0 0 - 0 0 0 0 0
Kidney - Pigment 71.86 (1.00) 100 40.00
(1.00) 74.75 (1.18)
79.89 (1.19)
50.00 (1.00)
25.00 (1.00) 100 100 73.15
(1.68) 69.35 (1.15)
57.10 (1.00)
66.67 (1.00)
57.74 (1.00)
60.00 (1.00) - 100 76.90
(1.15) 36.18 (1.00)
95.00 (1.00)
94.05 (1.00)
Spleen - Pigment 82.03 (1.00)
66.67 (1.00) 0 26.24
(1.00) 24.87 (1.00) 0 25.00
(1.33) 33.33 (1.00)
50.00 (1.00)
15.28 (1.00)
10.48 (1.00) 0 55.56
(1.00) 38.49 (1.00)
60.00 (1.00) - 80.48
(1.22) 23.10 (1.00)
29.01 (1.00)
57.00 (1.00)
88.10 (1.00)
Gill - Epitheliocystis 8.98 (1.00) 0 20.00
(1.00) 0.99
(1.00) 4.76
(1.00) 16.70 (1.00)
25.00 (1.00) 0 0 0 13.71
(1.00) 28.60 (1.00) 0 0 0 - 8.94
(1.00) 0 5.80 (1.00) 0 0
Liver - Clear cell foci 0 0 0 12.13 (1.00) 0 0 0 0 0 0 0 0 11.11
(1.00) 0 0 - 0 0 0 0 0
Spleen - Vacuoles 0 0 0 0 0 0 0 11.11 (1.00) 0 15.28
(1.76) 13.71 (1.00) 0 0 0 0 - 37.41
(1.00) 0 0 19.00 (1.00) 0
Spleen - Scar tissue 0 0 0 25.25 (1.00)
20.11 (1.00) 0 0 0 50.00
(1.00) 0 10.48 (1.00) 0 0 0 0 - 53.65
(1.00) 0 0 19.00 (1.00)
54.76 (1.00)
Internal Myxos/Protozoa 82.03 (1.34)
16.67 (1.00)
20.00 (1.00) 0 0 0 8.33
(1.00) 55.56 (1.00)
50.00 (1.00) 0 0 0 33.33
(1.33) 0 60.00 (1.00) - 0 0 17.41
(1.33) 19.00 (1.00)
27.38 (1.00)
Gill - Normal 0 0 0 0 0 16.70 (1.00) 0 0 0 0 3.23
(1.00) 0 0 0 0 - 0 0 0 0 0
Gill - Post mortem autolysis 0 100 100 100 100 83.30 (1.00) 0 100 100 100 96.77
(1.00) 100 0 96.23 (1.00) 100 - 100 100 0 100 100
Gill - Congestion 0 16.67 (1.00) 0 87.87
(1.00) 55.03 (1.00) 0 0 100 0 100 83.06
(1.00) 0 0 57.74 (1.33)
40.00 (1.00) - 73.17
(1.00) 0 0 0 5.95 (1.00)
Liver - Normal 0 50.00 (1.00)
40.00 (1.00)
13.12 (1.00) 0 25.00
(1.00) 0 0 50.00 (1.00)
3.70 (1.00)
41.13 (1.00)
71.40 (1.00) 0 0 20.00
(1.00) - 19.52 (1.00)
57.70 (1.00) 0 24.00
(1.00) 72.62 (1.00)
Liver - Post mortem autolysis/necrosis 0 33.33
(1.00) 0 74.75 (1.00)
40.21 (1.00)
58.30.00
(1.00) 0 77.78
(1.00) 50.00 (1.00)
57.87 (1.00)
34.68 (1.00)
14.30 (1.00) 0 76.98
(1.00) 60.00 (1.00) - 53.65
(1.00) 30.80 (1.00) 0 57.00
(1.00) 27.38 (1.00)
Kidney - Normal 0 0 60.00 (1.00) 0 0 83.30
(1.00) 0 0 0 0 27.42 (1.00)
85.70 (1.00) 0 19.25
(1.00) 20.00 (1.00) - 0 34.60
(1.00) 0 0 5.95 (1.00)
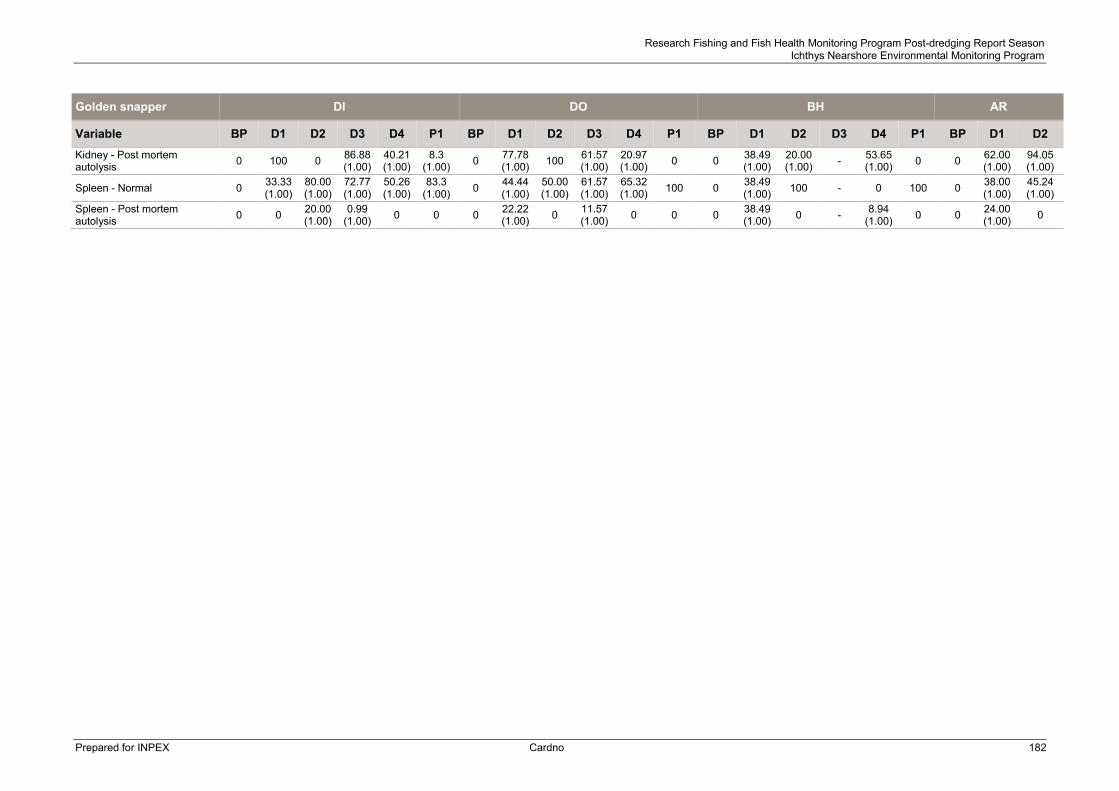
Research Fishing and Fish Health Monitoring Program Post-dredging Report Season Ichthys Nearshore Environmental Monitoring Program
Prepared for INPEX Cardno 182
Golden snapper DI DO BH AR
Variable BP D1 D2 D3 D4 P1 BP D1 D2 D3 D4 P1 BP D1 D2 D3 D4 P1 BP D1 D2 Kidney - Post mortem autolysis 0 100 0 86.88
(1.00) 40.21 (1.00)
8.3 (1.00) 0 77.78
(1.00) 100 61.57 (1.00)
20.97 (1.00) 0 0 38.49
(1.00) 20.00 (1.00) - 53.65
(1.00) 0 0 62.00 (1.00)
94.05 (1.00)
Spleen - Normal 0 33.33 (1.00)
80.00 (1.00)
72.77 (1.00)
50.26 (1.00)
83.3 (1.00) 0 44.44
(1.00) 50.00 (1.00)
61.57 (1.00)
65.32 (1.00) 100 0 38.49
(1.00) 100 - 0 100 0 38.00 (1.00)
45.24 (1.00)
Spleen - Post mortem autolysis 0 0 20.00
(1.00) 0.99
(1.00) 0 0 0 22.22 (1.00) 0 11.57
(1.00) 0 0 0 38.49 (1.00) 0 - 8.94
(1.00) 0 0 24.00 (1.00) 0

Research Fishing and Fish Health Monitoring Program Post-dredging Report Season Ichthys Nearshore Environmental Monitoring Program
Prepared for INPEX Cardno 183
Goldspotted rockcod DI DO BH AR
Variable BP D1 D2 D3 D4 P1 BP D1 D2 D3 D4 P1 BP D1 D2 D3 D4 P1 BP D1 D2
Number sampled in the field 23 12 2 9 2 1 15 7 5 8 7 8 26 10 3 - 6 0 28 4 0
Average length sampled in the field (SE)
27.6 (1.3)
27.4 (1.8)
27.0 (4.5)
27.4 (1.95)
30.2 (4.8)
24.6 (NA)
27.8 (1.68)
27.8 (2.81)
28.5 (1.8)
28.3 (1.6)
29.9 (1.1)
29.5 (1.6)
27.3 (1.4)
24.4 (1.7)
31.4 (7.7) - 26.8
(2.6) 0 26.8 (1.1)
26.1 (3.1) 0
Average length examined in the laboratory (SE)
24.5 (1.8)
25.8 (2.0)
27.0 (4.5)
26.8 (1.6)
30.2 (4.8)
24.6 (NA)
25.2 (0.9)
26.6 (3.0)
28.5 (1.8)
26.9 (0.7)
29.9 (1.1)
29.5 (1.6)
25.2 (1.2)
25.4 (3.0)
31.4 (7.7) - 26.8
(2.6) 0 25.4 (1.6)
26.1 (3.1) 0
Proportion observed abnormal 8.7 0 50.0 22.2 50.0 0 6.7 0 0 25.0 0 37.5 7.7 0 66.7 - 33.3 0 14.3 25.0 0
Number examined in the laboratory 10 7 2 6 2 1 8 6 5 7 7 8 13 5 3 - 6 0 11 4 0
Number examined by histopathology 8 6 2 6 2 1 4 5 5 7 7 6 12 4 3 - 6 0 9 4 0
Protozoa/Myxozoa (Internal and External Pooled)
30.43 (1.00) 0 0 19.44
(1.00) 0 0 23.33 (1.00) 0 0 0 0 0 9.23
(1.00) 25.00 (1.00) 0 - 0 0 0 0 0
Protozoa/Myxozoa (External) 0 0 0 19.44 (1.00) 0 0 0 0 0 0 0 0 0 0 0 - 0 0 0 0 0
Cryptocaryon 0 0 0 0 0 0 0 0 0 0 0 0 0 0 0 - 0 0 0 0 0
Copepods - Argulus 0 0 0 0 0 0 0 0 0 0 0 0 0 0 0 - 0 0 0 0 0
Caligid copepods (Pooled) 34.24 (2.00) 0 0 0 0 0 0 0 0 0 0 12.50
(1.00) 8.39
(3.00) 0 0 - 0 0 0 0 0
Caligus sp1 34.24 (2.00) 0 0 0 0 0 0 0 0 0 0 0 8.39
(3.00) 0 0 - 0 0 0 0 0
Caligus sp2 0 0 0 0 0 0 0 0 0 0 0 12.50 (1.00) 0 0 0 - 0 0 0 0 0
Gill tip copepods 54.35 (91.3)
42.86 (64.33) 100 0 50.00
(10.00) 0 53.33 (23.75)
83.33 (25.6) 0 0 42.86
(15.67) 0 45.80 (54.07) 100 66.67
(15.5) - 33.33 (3.00) 0 28.06
(152.9) 25.00
(27.00) 0
Copepods - Brachiellas 0 0 0 0 0 0 0 0 0 0 0 0 0 0 0 - 0 0 0 0 0
Copepods - Ergasilus 0 0 100 80.56 (144.2
4) 0 100 0 0 0 70.00
(27.25) 0 100 0 0 66.67 (15.5) - 33.33
(83.5) 0 0 0 0
Copepods - Lernanthropuses 0 0 0 0 0 0 0 16.67 (1.00) 0 0 0 0 0 0 0 - 16.67
(1.00) 0 0 0 0
Copepods - Lernaeopodidae 0 0 0 0 0 0 0 0 0 0 0 0 0 0 0 - 0 0 0 0 0
Copepods - Hatschekias 0 0 0 0 0 0 0 0 0 0 0 0 0 0 0 - 0 0 0 0 0
Copepods - Bomolochus 0 0 0 0 0 0 0 0 0 0 0 0 0 0 0 - 0 0 0 0 0
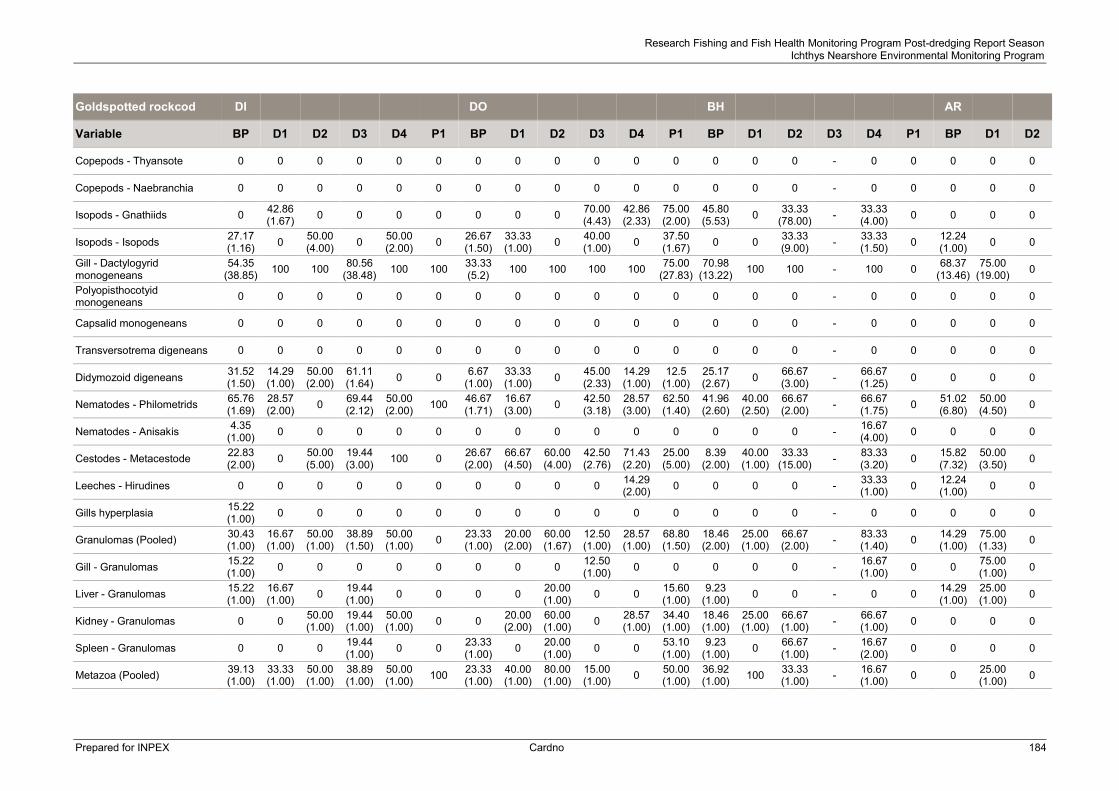
Research Fishing and Fish Health Monitoring Program Post-dredging Report Season Ichthys Nearshore Environmental Monitoring Program
Prepared for INPEX Cardno 184
Goldspotted rockcod DI DO BH AR
Variable BP D1 D2 D3 D4 P1 BP D1 D2 D3 D4 P1 BP D1 D2 D3 D4 P1 BP D1 D2
Copepods - Thyansote 0 0 0 0 0 0 0 0 0 0 0 0 0 0 0 - 0 0 0 0 0
Copepods - Naebranchia 0 0 0 0 0 0 0 0 0 0 0 0 0 0 0 - 0 0 0 0 0
Isopods - Gnathiids 0 42.86 (1.67) 0 0 0 0 0 0 0 70.00
(4.43) 42.86 (2.33)
75.00 (2.00)
45.80 (5.53) 0 33.33
(78.00) - 33.33 (4.00) 0 0 0 0
Isopods - Isopods 27.17 (1.16) 0 50.00
(4.00) 0 50.00 (2.00) 0 26.67
(1.50) 33.33 (1.00) 0 40.00
(1.00) 0 37.50 (1.67) 0 0 33.33
(9.00) - 33.33 (1.50) 0 12.24
(1.00) 0 0
Gill - Dactylogyrid monogeneans
54.35 (38.85) 100 100 80.56
(38.48) 100 100 33.33 (5.2) 100 100 100 100 75.00
(27.83) 70.98
(13.22) 100 100 - 100 0 68.37 (13.46)
75.00 (19.00) 0
Polyopisthocotyid monogeneans 0 0 0 0 0 0 0 0 0 0 0 0 0 0 0 - 0 0 0 0 0
Capsalid monogeneans 0 0 0 0 0 0 0 0 0 0 0 0 0 0 0 - 0 0 0 0 0
Transversotrema digeneans 0 0 0 0 0 0 0 0 0 0 0 0 0 0 0 - 0 0 0 0 0
Didymozoid digeneans 31.52 (1.50)
14.29 (1.00)
50.00 (2.00)
61.11 (1.64) 0 0 6.67
(1.00) 33.33 (1.00) 0 45.00
(2.33) 14.29 (1.00)
12.5 (1.00)
25.17 (2.67) 0 66.67
(3.00) - 66.67 (1.25) 0 0 0 0
Nematodes - Philometrids 65.76 (1.69)
28.57 (2.00) 0 69.44
(2.12) 50.00 (2.00) 100 46.67
(1.71) 16.67 (3.00) 0 42.50
(3.18) 28.57 (3.00)
62.50 (1.40)
41.96 (2.60)
40.00 (2.50)
66.67 (2.00) - 66.67
(1.75) 0 51.02 (6.80)
50.00 (4.50) 0
Nematodes - Anisakis 4.35 (1.00) 0 0 0 0 0 0 0 0 0 0 0 0 0 0 - 16.67
(4.00) 0 0 0 0
Cestodes - Metacestode 22.83 (2.00) 0 50.00
(5.00) 19.44 (3.00) 100 0 26.67
(2.00) 66.67 (4.50)
60.00 (4.00)
42.50 (2.76)
71.43 (2.20)
25.00 (5.00)
8.39 (2.00)
40.00 (1.00)
33.33 (15.00) - 83.33
(3.20) 0 15.82 (7.32)
50.00 (3.50) 0
Leeches - Hirudines 0 0 0 0 0 0 0 0 0 0 14.29 (2.00) 0 0 0 0 - 33.33
(1.00) 0 12.24 (1.00) 0 0
Gills hyperplasia 15.22 (1.00) 0 0 0 0 0 0 0 0 0 0 0 0 0 0 - 0 0 0 0 0
Granulomas (Pooled) 30.43 (1.00)
16.67 (1.00)
50.00 (1.00)
38.89 (1.50)
50.00 (1.00) 0 23.33
(1.00) 20.00 (2.00)
60.00 (1.67)
12.50 (1.00)
28.57 (1.00)
68.80 (1.50)
18.46 (2.00)
25.00 (1.00)
66.67 (2.00) - 83.33
(1.40) 0 14.29 (1.00)
75.00 (1.33) 0
Gill - Granulomas 15.22 (1.00) 0 0 0 0 0 0 0 0 12.50
(1.00) 0 0 0 0 0 - 16.67 (1.00) 0 0 75.00
(1.00) 0
Liver - Granulomas 15.22 (1.00)
16.67 (1.00) 0 19.44
(1.00) 0 0 0 0 20.00 (1.00) 0 0 15.60
(1.00) 9.23
(1.00) 0 0 - 0 0 14.29 (1.00)
25.00 (1.00) 0
Kidney - Granulomas 0 0 50.00 (1.00)
19.44 (1.00)
50.00 (1.00) 0 0 20.00
(2.00) 60.00 (1.00) 0 28.57
(1.00) 34.40 (1.00)
18.46 (1.00)
25.00 (1.00)
66.67 (1.00) - 66.67
(1.00) 0 0 0 0
Spleen - Granulomas 0 0 0 19.44 (1.00) 0 0 23.33
(1.00) 0 20.00 (1.00) 0 0 53.10
(1.00) 9.23
(1.00) 0 66.67 (1.00) - 16.67
(2.00) 0 0 0 0
Metazoa (Pooled) 39.13 (1.00)
33.33 (1.00)
50.00 (1.00)
38.89 (1.00)
50.00 (1.00) 100 23.33
(1.00) 40.00 (1.00)
80.00 (1.00)
15.00 (1.00) 0 50.00
(1.00) 36.92 (1.00) 100 33.33
(1.00) - 16.67 (1.00) 0 0 25.00
(1.00) 0

Research Fishing and Fish Health Monitoring Program Post-dredging Report Season Ichthys Nearshore Environmental Monitoring Program
Prepared for INPEX Cardno 185
Goldspotted rockcod DI DO BH AR
Variable BP D1 D2 D3 D4 P1 BP D1 D2 D3 D4 P1 BP D1 D2 D3 D4 P1 BP D1 D2
Gill - Metazoa 39.13 (1.00)
33.33 (1.00)
50.00 (1.00)
38.89 (1.00) 0 100 23.33
(1.00) 40.00 (1.00)
80.00 (1.00)
15.00 (1.00) 0 50.00
(1.00) 36.92 (1.00) 100 33.33
(1.00) - 16.67 (1.00) 0 0 25.00
(1.00) 0
Liver - Metazoa 0 0 0 0 50.00 (1.00) 0 0 0 0 0 0 0 0 0 0 - 0 0 0 0 0
Kidney - Metazoa 0 0 0 0 0 0 0 0 0 0 0 0 0 0 0 - 0 0 0 0 0
Spleen - Metazoa 0 0 0 0 0 0 0 0 0 0 0 0 0 0 0 - 0 0 0 0 0
Myxos (Pooled) 30.43 (1.00) 0 0 19.44
(1.00) 100 0 23.33 (1.00) 0 0 0 0 18.80
(2.00) 9.23
(1.00) 25.00 (2.00) 0 - 0 0 0 0 0
Gill - Myxos 0 0 0 0 0 0 0 0 0 0 0 0 0 0 0 - 0 0 0 0 0
Liver - Protozoa/Myxos 0 0 0 0 0 0 23.33 (1.00) 0 0 0 0 0 0 0 0 - 0 0 0 0 0
Kidney - Protozoa/Myxos 30.43 (1.00) 0 0 19.44
(1.00) 100 0 0 0 0 0 0 18.80 (2.00)
9.23 (1.00)
25.00 (2.00) 0 - 0 0 0 0 0
Spleen - Protozoa/Myxos 0 0 0 0 0 0 0 0 0 0 0 0 0 0 0 - 0 0 0 0 0
Cysts/Spheres (Pooled) 0 0 0 19.44 (1.00) 0 0 0 0 20.00
(1.00) 0 0 0 0 25.00 (1.00) 0 - 0 0 0 0 0
Gill - Cysts 0 0 0 19.44 (1.00) 0 0 0 0 20.00
(1.00) 0 0 0 0 25.00 (1.00) 0 - 0 0 0 0 0
Kidney - Spheres 0 0 0 0 0 0 0 0 0 0 0 0 0 0 0 - 0 0 0 0 0
Spleen - Cysts 0 0 0 0 0 0 0 0 0 0 0 0 0 0 0 - 0 0 0 0 0
Haemorrage (Pooled) 34.78 (1.44) 0 0 38.89
(1.50) 50.00 (1.00) 0 70.00
(1.33) 0 20.00 (1.00)
12.50 (1.00)
42.86 (1.33) 0 26.15
(1.00) 0 0 - 66.67 (1.50) 0 42.86
(1.00) 0 0
Liver - Haemorrhage 34.78 (1.00) 0 0 38.89
(1.00) 0 0 23.33 (1.00) 0 20.00
(1.00) 12.50 (1.00)
42.86 (1.33) 0 0 0 0 - 50.00
(1.00) 0 14.29 (1.00) 0 0
Kidney - Haemorrhage 15.22 (1.00) 0 0 19.44
(1.00) 50.00 (1.00) 0 70.00
(1.00) 0 0 0 0 0 26.15 (1.00) 0 0 - 50.00
(1.00) 0 28.57 (1.00) 0 0
Spleen - Haemorrhage 0 0 0 0 0 0 0 0 0 0 0 0 0 0 0 - 0 0 0 0 0
Bacteria (Pooled) 0 0 0 0 0 0 0 0 20.00 (1.00) 0 14.29
(1.00) 0 0 0 0 - 16.67 (1.00) 0 0 0 0
Liver - Bacteria 0 0 0 0 0 0 0 0 20.00 (1.00) 0 14.29
(1.00) 0 0 0 0 - 0 0 0 0 0
Kidney - Bacteria 0 0 0 0 0 0 0 0 0 0 0 0 0 0 0 - 16.67 (1.00) 0 0 0 0

Research Fishing and Fish Health Monitoring Program Post-dredging Report Season Ichthys Nearshore Environmental Monitoring Program
Prepared for INPEX Cardno 186
Goldspotted rockcod DI DO BH AR
Variable BP D1 D2 D3 D4 P1 BP D1 D2 D3 D4 P1 BP D1 D2 D3 D4 P1 BP D1 D2
Spleen – Bacteria rickettsia 0 0 0 0 0 0 0 0 0 0 0 0 0 0 0 - 0 0 0 0 0
Blood fluke (Pooled) 0 0 0 0 0 0 0 0 0 0 0 0 0 0 0 - 0 0 0 0 0
Gill - Blood fluke eggs 0 0 0 0 0 0 0 0 0 0 0 0 0 0 0 - 0 0 0 0 0
Liver - Blood fluke 0 0 0 0 0 0 0 0 0 0 0 0 0 0 0 - 0 0 0 0 0
Kidney - Blood fluke 0 0 0 0 0 0 0 0 0 0 0 0 0 0 0 - 0 0 0 0 0
Pigment deposition (Pooled) 15.22 (1.00) 0 0 0 0 0 0 0 0 0 0 0 18.46
(2.00) 0 0 - 0 0 0 0 0
Liver - Pigment 15.22 (1.00) 0 0 0 0 0 0 0 0 0 0 0 9.23
(1.00) 0 0 - 0 0 0 0 0
Kidney - Pigment 0 0 0 0 0 0 0 0 0 0 0 0 18.46 (1.00) 0 0 - 0 0 0 0 0
Spleen - Pigment 0 0 0 0 0 0 0 0 0 0 0 0 9.23 (1.00) 0 0 - 0 0 0 0 0
Gill - Epitheliocystis 0 0 0 0 0 0 0 0 0 0 0 0 0 0 33.33 (1.00) - 16.67
(1.00) 0 0 0 0
Liver - Clear cell foci 0 0 0 0 0 0 0 0 0 0 0 0 0 0 0 - 0 0 0 0 0
Spleen - Vacuoles 0 0 0 0 0 0 0 0 0 0 14.29 (1.00) 0 0 0 0 - 0 0 0 0 0
Spleen - Scar tissue 0 0 0 0 0 0 0 0 0 30.00 (1.00) 0 0 0 0 0 - 33.33
(1.00) 0 0 25.00 (1.00) 0
Internal Myxos/Protozoa 30.43 (1.00) 0 0 0 0 0 23.33
(1.00) 0 0 0 0 0 9.23 (1.00)
25.00 (2.00) 0 - 0 0 0 0 0
Gill - Normal 0 0 0 0 0 0 0 0 0 0 0 0 0 0 0 - 0 0 0 0 0
Gill - Post mortem autolysis 0 100 100 100 100 100 0 60.00 (1.00) 100 100 100 100 0 100 100 - 100 0 0 75.00
(1.00) 0
Gill - Congestion 0 0 0 30.56 (1.00) 100 0 0 0 20.00
(1.00) 0 71.43 (1.00) 0 0 50.00
(1.00) 0 - 100 0 0 0 0
Liver - Normal 0 66.67 (1.00) 0 0 0 100 0 40.00
(1.00) 20.00 (1.00) 0 14.29
(1.00) 68.80 (1.00) 0 50.00
(1.00) 66.67 (1.00) - 0 0 0 50.00
(1.00) 0
Liver - Post mortem autolysis/necrosis 0 33.33
(1.00) 100 100 100 0 0 60.00 (1.00)
60.00 (1.00) 100 71.43
(1.00) 15.60 (1.00) 0 50.00
(1.00) 33.33 (1.00) - 100 0 0 50.00
(1.00) 0
Kidney - Normal 0 16.67 (1.00)
50.00 (1.00)
11.11 (1.00) 0 100 0 40.00
(1.00) 20.00 (1.00)
25.00 (1.00)
42.86 (1.00)
46.90 (1.00) 0 50.00
(1.00) 33.33 (1.00) - 16.67
(1.00) 0 0 25.00 (1.00) 0

Research Fishing and Fish Health Monitoring Program Post-dredging Report Season Ichthys Nearshore Environmental Monitoring Program
Prepared for INPEX Cardno 187
Goldspotted rockcod DI DO BH AR
Variable BP D1 D2 D3 D4 P1 BP D1 D2 D3 D4 P1 BP D1 D2 D3 D4 P1 BP D1 D2 Kidney - Post mortem autolysis 0 83.33
(1.00) 0 69.44 (1.00) 100 0 0 40.00
(1.00) 20.00 (1.00)
75.00 (1.00)
57.14 (1.00)
18.80 (1.00) 0 25.00
(1.00) 0 - 66.67 (1.00) 0 0 75.00
(1.00) 0
Spleen - Normal 0 100 100 100 100 100 0 100 80.00 (1.00) 100 85.71
(1.00) 65.60 (1.00) 0 100 33.33
(1.00) - 33.33 (1.00) 0 0 50.00
(1.00) 0
Spleen - Post mortem autolysis 0 0 0 0 0 0 0 0 0 0 14.29
(1.00) 0 0 0 0 - 16.67 (1.00) 0 0 50.00
(1.00) 0

Research Fishing and Fish Health Monitoring Program Post-dredging Report Season Ichthys Nearshore Environmental Monitoring Program
Prepared for INPEX Cardno 188
Grass emperor DI DO BH AR
Variable BP D1 D2 D3 D4 P1 BP D1 D2 D3 D4 P1 BP D1 D2 D3 D4 P1 BP D1 D2
Number sampled in the field 17 9 7 11 0 9 18 16 4 38 3 20 32 13 15 - 1 3 0 0 0
Average length sampled in the field (SE)
19.0 (0.7)
17.3 (0.6)
17.2 (0.4)
21.2 (0.7) 0 19.8
(0.8) 22.3 (0.8)
20.1 (0.7)
23.7 (2.1)
22.9 (0.5)
20.6 (3.3)
23.4 (1.0)
20.2 (0.4)
18.9 (0.8)
18.2 (0.3) - 17.9
(NA) 22.3 (1.3) 0 0 0
Average length examined in the laboratory (SE)
19.8 (0.7)
16.5 (0.3)
17.3 (0.5)
20.5 (0.7) 0 21.2
(0.9) 22.1 (1.0)
21.5 (0.7)
23.7 (2.1)
25.2 (0.8)
20.6 (3.3)
27.4 (2.9)
20.4 (0.5)
20.6 (0.7)
18.0 (0.2) - 17.9
(NA) 22.3 (1.2) 0 0 0
Proportion observed abnormal 0 0 0 0 0 0 5.6 0 0 0 0 0 3.1 0 0 - 0 0 0 0 0
Number examined in the laboratory 9 4 5 7 0 5 12 4 4 6 3 5 20 6 7 - 1 3 0 0 0
Number examined by histopathology 1 0 0 5 0 0 5 0 0 5 0 0 11 0 0 - 0 0 0 0 0
Protozoa/Myxozoa (Internal and External Pooled) 0 0 0 0 0 0 0 0 0 0 0 0 0 0 0 - 0 0 0 0 0
Protozoa/Myxozoa (External) 0 0 0 0 0 0 0 0 0 0 0 0 0 0 0 - 0 0 0 0 0
Cryptocaryon 0 0 0 0 0 0 0 0 0 0 0 0 0 0 0 - 0 0 0 0 0
Copepods - Argulus 0 0 0 0 0 0 0 0 0 0 0 0 0 0 0 - 0 0 0 0 0
Caligid copepods (Pooled) 0 0 0 0 0 0 0 0 0 0 0 0 0 0 0 - 0 0 0 0 0
Caligus sp1 0 0 0 0 0 0 0 0 0 0 0 0 0 0 0 - 0 0 0 0 0
Caligus sp2 0 0 0 0 0 0 0 0 0 0 0 0 0 0 0 - 0 0 0 0 0
Gill tip copepods 0 0 0 0 0 0 0 0 0 0 0 0 0 0 0 - 0 0 0 0 0
Copepods - Brachiellas 0 0 0 0 0 0 0 0 0 0 0 0 0 16.67 (1.00) 0 - 0 0 0 0 0
Copepods - Ergasilus 0 0 0 0 0 0 0 0 0 0 0 0 0 0 0 - 0 0 0 0 0
Copepods - Lernanthropuses 0 0 0 0 0 0 0 0 0 0 0 0 0 0 0 - 0 0 0 0 0
Copepods - Lernaeopodidae 0 0 0 0 0 0 0 0 0 0 0 0 0 0 0 - 0 0 0 0 0
Copepods - Hatschekias 44.44 (1.25)
75.00 (3.33)
40.00 (3.50)
14.29 (4.00) 0 40.00
(1.50) 0 0 25.00 (1.00)
16.67 (3.00) 0 0 15.30
(2.67) 33.33 (1.50)
28.57 (2.50) - 0 0 0 0 0
Copepods - Bomolochus 0 0 0 0 0 0 0 0 0 0 0 0 0 0 0 - 0 33.30 (1.00) 0 0 0
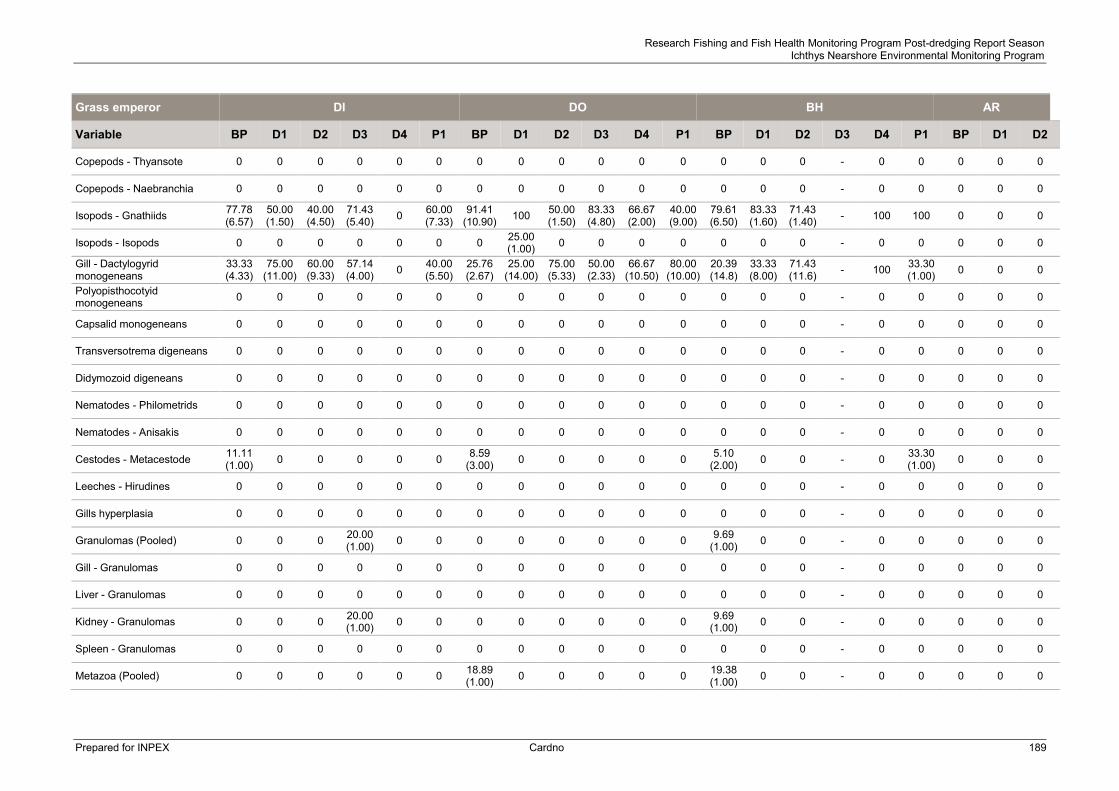
Research Fishing and Fish Health Monitoring Program Post-dredging Report Season Ichthys Nearshore Environmental Monitoring Program
Prepared for INPEX Cardno 189
Grass emperor DI DO BH AR
Variable BP D1 D2 D3 D4 P1 BP D1 D2 D3 D4 P1 BP D1 D2 D3 D4 P1 BP D1 D2
Copepods - Thyansote 0 0 0 0 0 0 0 0 0 0 0 0 0 0 0 - 0 0 0 0 0
Copepods - Naebranchia 0 0 0 0 0 0 0 0 0 0 0 0 0 0 0 - 0 0 0 0 0
Isopods - Gnathiids 77.78 (6.57)
50.00 (1.50)
40.00 (4.50)
71.43 (5.40) 0 60.00
(7.33) 91.41
(10.90) 100 50.00 (1.50)
83.33 (4.80)
66.67 (2.00)
40.00 (9.00)
79.61 (6.50)
83.33 (1.60)
71.43 (1.40) - 100 100 0 0 0
Isopods - Isopods 0 0 0 0 0 0 0 25.00 (1.00) 0 0 0 0 0 0 0 - 0 0 0 0 0
Gill - Dactylogyrid monogeneans
33.33 (4.33)
75.00 (11.00)
60.00 (9.33)
57.14 (4.00) 0 40.00
(5.50) 25.76 (2.67)
25.00 (14.00)
75.00 (5.33)
50.00 (2.33)
66.67 (10.50)
80.00 (10.00)
20.39 (14.8)
33.33 (8.00)
71.43 (11.6) - 100 33.30
(1.00) 0 0 0
Polyopisthocotyid monogeneans 0 0 0 0 0 0 0 0 0 0 0 0 0 0 0 - 0 0 0 0 0
Capsalid monogeneans 0 0 0 0 0 0 0 0 0 0 0 0 0 0 0 - 0 0 0 0 0
Transversotrema digeneans 0 0 0 0 0 0 0 0 0 0 0 0 0 0 0 - 0 0 0 0 0
Didymozoid digeneans 0 0 0 0 0 0 0 0 0 0 0 0 0 0 0 - 0 0 0 0 0
Nematodes - Philometrids 0 0 0 0 0 0 0 0 0 0 0 0 0 0 0 - 0 0 0 0 0
Nematodes - Anisakis 0 0 0 0 0 0 0 0 0 0 0 0 0 0 0 - 0 0 0 0 0
Cestodes - Metacestode 11.11 (1.00) 0 0 0 0 0 8.59
(3.00) 0 0 0 0 0 5.10 (2.00) 0 0 - 0 33.30
(1.00) 0 0 0
Leeches - Hirudines 0 0 0 0 0 0 0 0 0 0 0 0 0 0 0 - 0 0 0 0 0
Gills hyperplasia 0 0 0 0 0 0 0 0 0 0 0 0 0 0 0 - 0 0 0 0 0
Granulomas (Pooled) 0 0 0 20.00 (1.00) 0 0 0 0 0 0 0 0 9.69
(1.00) 0 0 - 0 0 0 0 0
Gill - Granulomas 0 0 0 0 0 0 0 0 0 0 0 0 0 0 0 - 0 0 0 0 0
Liver - Granulomas 0 0 0 0 0 0 0 0 0 0 0 0 0 0 0 - 0 0 0 0 0
Kidney - Granulomas 0 0 0 20.00 (1.00) 0 0 0 0 0 0 0 0 9.69
(1.00) 0 0 - 0 0 0 0 0
Spleen - Granulomas 0 0 0 0 0 0 0 0 0 0 0 0 0 0 0 - 0 0 0 0 0
Metazoa (Pooled) 0 0 0 0 0 0 18.89 (1.00) 0 0 0 0 0 19.38
(1.00) 0 0 - 0 0 0 0 0

Research Fishing and Fish Health Monitoring Program Post-dredging Report Season Ichthys Nearshore Environmental Monitoring Program
Prepared for INPEX Cardno 190
Grass emperor DI DO BH AR
Variable BP D1 D2 D3 D4 P1 BP D1 D2 D3 D4 P1 BP D1 D2 D3 D4 P1 BP D1 D2
Gill - Metazoa 0 0 0 0 0 0 18.89 (1.00) 0 0 0 0 0 9.69
(1.00) 0 0 - 0 0 0 0 0
Liver - Metazoa 0 0 0 0 0 0 0 0 0 0 0 0 0 0 0 - 0 0 0 0 0
Kidney - Metazoa 0 0 0 0 0 0 0 0 0 0 0 0 9.69 (1.00) 0 0 - 0 0 0 0 0
Spleen - Metazoa 0 0 0 0 0 0 0 0 0 0 0 0 0 0 0 - 0 0 0 0 0
Myxos (Pooled) 0 0 0 0 0 0 0 0 0 0 0 0 0 0 0 - 0 0 0 0 0
Gill - Myxos 0 0 0 0 0 0 0 0 0 0 0 0 0 0 0 - 0 0 0 0 0
Liver - Protozoa/Myxos 0 0 0 0 0 0 0 0 0 0 0 0 0 0 0 - 0 0 0 0 0
Kidney - Protozoa/Myxos 0 0 0 0 0 0 0 0 0 0 0 0 0 0 0 - 0 0 0 0 0
Spleen - Protozoa/Myxos 0 0 0 0 0 0 0 0 0 0 0 0 0 0 0 - 0 0 0 0 0
Cysts/Spheres (Pooled) 0 0 0 0 0 0 18.89 (1.00) 0 0 0 0 0 19.38
(1.00) 0 0 - 0 0 0 0 0
Gill - Cysts 0 0 0 0 0 0 18.89 (1.00) 0 0 0 0 0 9.69
(1.00) 0 0 - 0 0 0 0 0
Kidney - Spheres 0 0 0 0 0 0 0 0 0 0 0 0 9.70 (1.00) 0 0 - 0 0 0 0 0
Spleen - Cysts 0 0 0 0 0 0 0 0 0 0 0 0 0 0 0 - 0 0 0 0 0
Haemorrage (Pooled) 0 0 0 20.00 (1.00) 0 0 0 0 0 0 0 0 38.75
(1.00) 0 0 - 0 0 0 0 0
Liver - Haemorrhage 0 0 0 20.00 (1.00) 0 0 0 0 0 0 0 0 29.06
(1.00) 0 0 - 0 0 0 0 0
Kidney - Haemorrhage 0 0 0 0 0 0 0 0 0 0 0 0 9.69 (1.00) 0 0 - 0 0 0 0 0
Spleen - Haemorrhage 0 0 0 0 0 0 0 0 0 0 0 0 0 0 0 - 0 0 0 0 0
Bacteria (Pooled) 0 0 0 0 0 0 0 0 0 0 0 0 9.69 (1.00) 0 0 - 0 0 0 0 0
Liver - Bacteria 0 0 0 0 0 0 0 0 0 0 0 0 0 0 0 - 0 0 0 0 0
Kidney - Bacteria 0 0 0 0 0 0 0 0 0 0 0 0 9.69 (1.00) 0 0 - 0 0 0 0 0

Research Fishing and Fish Health Monitoring Program Post-dredging Report Season Ichthys Nearshore Environmental Monitoring Program
Prepared for INPEX Cardno 191
Grass emperor DI DO BH AR
Variable BP D1 D2 D3 D4 P1 BP D1 D2 D3 D4 P1 BP D1 D2 D3 D4 P1 BP D1 D2
Spleen – Bacteria rickettsia 0 0 0 0 0 0 0 0 0 0 0 0 0 0 0 - 0 0 0 0 0
Blood fluke (Pooled) 0 0 0 0 0 0 0 0 0 0 0 0 0 0 0 - 0 0 0 0 0
Gill - Blood fluke eggs 0 0 0 0 0 0 0 0 0 0 0 0 0 0 0 - 0 0 0 0 0
Liver - Blood fluke 0 0 0 0 0 0 0 0 0 0 0 0 0 0 0 - 0 0 0 0 0
Kidney - Blood fluke 0 0 0 0 0 0 0 0 0 0 0 0 0 0 0 - 0 0 0 0 0
Pigment deposition (Pooled) 0 0 0 20.00 (1.00) 0 0 56.67
(1.00) 0 0 0 0 0 41.88 (1.77) 0 0 - 0 0 0 0 0
Liver - Pigment 0 0 0 0 0 0 0 0 0 0 0 0 0 0 0 - 0 0 0 0 0
Kidney - Pigment 0 0 0 0 0 0 0 0 0 0 0 0 32.19 (1.00) 0 0 - 0 0 0 0 0
Spleen - Pigment 0 0 0 20.00 (1.00) 0 0 56.67
(1.00) 0 0 0 0 0 41.88 (1.00) 0 0 - 0 0 0 0 0
Gill - Epitheliocystis 0 0 0 0 0 0 0 0 0 0 0 0 0 0 0 - 0 0 0 0 0
Liver - Clear cell foci 0 0 0 0 0 0 0 0 0 0 0 0 0 0 0 - 0 0 0 0 0
Spleen - Vacuoles 0 0 0 0 0 0 0 0 0 0 0 0 0 0 0 - 0 0 0 0 0
Spleen - Scar tissue 0 0 0 20.00 (1.00) 0 0 0 0 0 0 0 0 0 0 0 - 0 0 0 0 0
Internal Myxos/Protozoa 0 0 0 0 0 0 0 0 0 0 0 0 0 0 0 - 0 0 0 0 0
Gill - Normal 0 0 0 0 0 0 0 0 0 0 0 0 0 0 0 - 0 0 0 0 0
Gill - Post mortem autolysis 0 0 0 20.00 (1.00) 0 0 0 0 0 0 0 0 0 0 0 - 0 0 0 0 0
Gill - Congestion 0 0 0 20.00 (1.00) 0 0 0 0 0 0 0 0 0 0 0 - 0 0 0 0 0
Liver - Normal 0 0 0 0 0 0 0 0 0 0 0 0 0 0 0 - 0 0 0 0 0
Liver - Post mortem autolysis/necrosis 0 0 0 20.00
(1.00) 0 0 0 0 0 0 0 0 0 0 0 - 0 0 0 0 0
Kidney - Normal 0 0 0 0 0 0 0 0 0 0 0 0 0 0 0 - 0 0 0 0 0
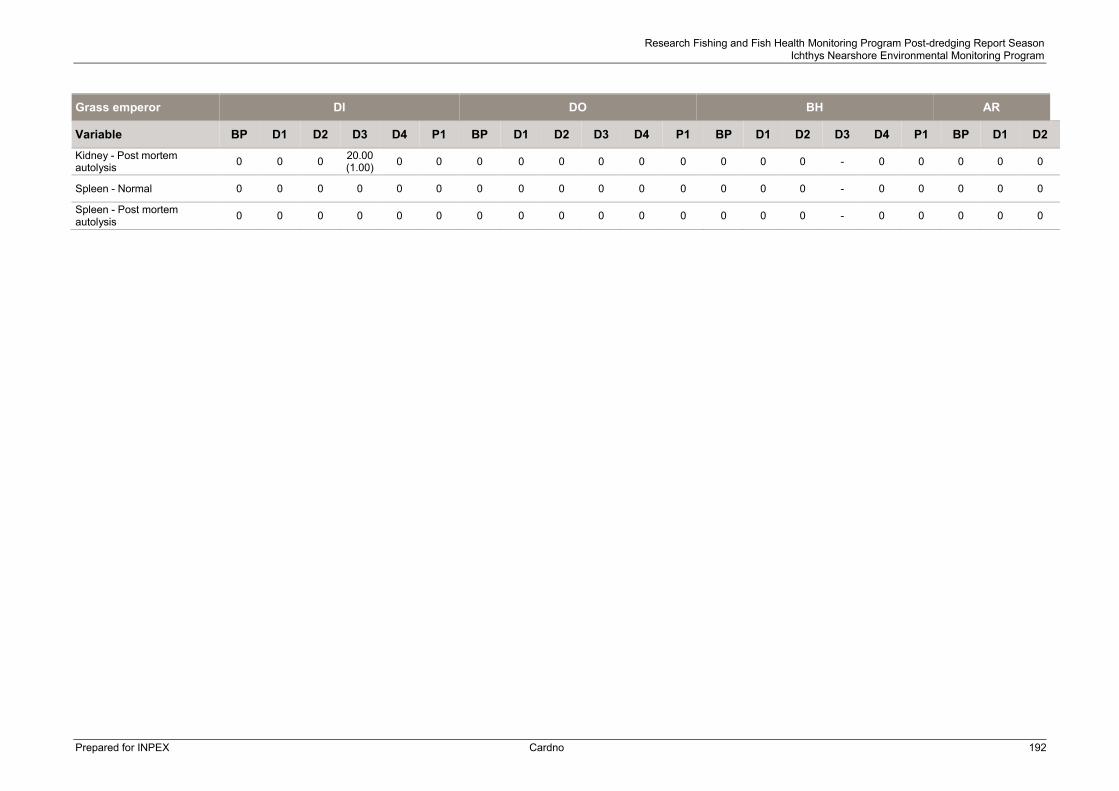
Research Fishing and Fish Health Monitoring Program Post-dredging Report Season Ichthys Nearshore Environmental Monitoring Program
Prepared for INPEX Cardno 192
Grass emperor DI DO BH AR
Variable BP D1 D2 D3 D4 P1 BP D1 D2 D3 D4 P1 BP D1 D2 D3 D4 P1 BP D1 D2 Kidney - Post mortem autolysis 0 0 0 20.00
(1.00) 0 0 0 0 0 0 0 0 0 0 0 - 0 0 0 0 0
Spleen - Normal 0 0 0 0 0 0 0 0 0 0 0 0 0 0 0 - 0 0 0 0 0
Spleen - Post mortem autolysis 0 0 0 0 0 0 0 0 0 0 0 0 0 0 0 - 0 0 0 0 0

Research Fishing and Fish Health Monitoring Program Post-dredging Report Season Ichthys Nearshore Environmental Monitoring Program
Prepared for INPEX Cardno 193
Javelin * DI DO BH AR
Variable BP D1 D2 D3 D4 P1 BP D1 D2 D3 D4 P1 BP D1 D2 D3 D4 P1 BP D1 D2 Number sampled in the field 28 33 11 19 5 9 24 15 5 0 27 0 42 54 11 - 6 20 35 12 5
Average length sampled in the field (SE)
18.1 (0.9)
20.0 (0.6)
18.4 (1.5)
20.7 (1.2)
23.1 (3.3)
20.1 (0.8)
23.8 (0.8)
20.5 (1.0)
21.0 (1.2) 0 18.1
(0.9) 0 21.5 (0.7)
18.2 (0.4)
21.4 (1.3) - 25.1
(2.3) 26.0 (2.4)
19.5 (0.5)
21.78 (2.67)
18.6 (1.5)
Average length examined in the laboratory (SE)
19.1 (0.8)
21.2 (2.4)
19.4 (2.8)
21.3 (1.7)
23.1 (3.3)
20.6 (0.7)
24.7 (1.0)
19.2 (1.6)
21.0 (1.2) 0 19.9
(1.7) 0 23.1 (1.8)
20.9 (1.1)
20.8 (1.1) - 25.1
(2.3) 25.1 (2.7)
19.2 (1.0)
22.2 (4.6)
18.6 (1.5)
Proportion observed abnormal 0 0 0 0 20 0 4.17 6.67 0 0 0 0 2.38 0 9.09 - 0 0 2.86 0 0
Number examined in the laboratory 17 6 6 12 5 8 13 6 5 0 10 0 8 6 5 - 6 14 14 7 5
Number examined by histopathology 14 0 0 10 5 8 13 0 0 0 10 0 8 0 0 - 5 14 14 0 1
Protozoa/Myxozoa (Internal and External Pooled) 0 0 0 0 0 0 7.99
(1.00) 0 0 0 0 0 13.95 (1.00) 0 0 - 0 0 10.33
(1.00) 0 0
Protozoa/Myxozoa (External) 0 0 0 0 0 0 0 0 0 0 0 0 0 0 0 - 0 0 0 0 0
Cryptocaryon 0 0 0 0 0 0 0 0 0 0 10.00 (1.00) 0 0 0 0 - 0 0 0 0 0
Copepods - Argulus 0 0 0 0 0 0 0 0 0 0 0 0 0 0 0 - 0 0 0 0 0
Caligid copepods (Pooled) 0 0 0 0 0 0 0 0 0 0 0 0 0 0 0 - 0 0 7.47 (2.00) 0 0
Caligus sp1 0 0 0 0 0 0 0 0 0 0 0 0 0 0 0 - 0 0 7.47 (2.00) 0 0
Caligus sp2 0 0 0 0 0 0 0 0 0 0 0 0 0 0 0 - 0 0 0 0 0
Gill tip copepods 0 0 0 0 0 0 0 0 0 0 0 0 0 0 0 - 0 0 0 0 0
Copepods - Brachiellas 0 0 0 0 0 0 0 0 0 0 0 0 0 0 0 - 0 0 0 0 0
Copepods - Ergasilus 0 0 0 0 0 0 7.99 (1.00) 0 0 0 0 0 0 0 0 - 0 0 7.47
(1.00) 0 0
Copepods - Lernanthropuses
23.53 (1.75) 0 0 25.00
(1.33) 0 25.00 (1.00)
23.96 (1.00)
37.33 (6.00) 0 0 10.00
(1.00) 0 27.89 (1.00) 0 0 - 16.67
(1.00) 21.40 (3.00) 0 42.86
(3.33) 20.00 (1.00)
Copepods - Lernaeopodidae 0 0 0 0 0 0 0 0 0 0 0 0 0 0 0 - 0 0 0 0 0
Copepods - Hatschekias 0 16.67 (4.00) 0 0 0 0 0 0 0 0 0 0 0 0 0 - 0 0 0 0 0
Copepods - Bomolochus 0 0 0 0 0 0 0 0 0 0 0 0 0 0 0 - 0 0 0 0 0

Research Fishing and Fish Health Monitoring Program Post-dredging Report Season Ichthys Nearshore Environmental Monitoring Program
Prepared for INPEX Cardno 194
Javelin * DI DO BH AR
Variable BP D1 D2 D3 D4 P1 BP D1 D2 D3 D4 P1 BP D1 D2 D3 D4 P1 BP D1 D2
Copepods - Thyansote 0 0 0 0 0 0 0 0 0 0 0 0 0 0 0 - 0 0 0 0 0
Copepods - Naebranchia 0 0 0 0 0 0 0 0 0 0 0 0 0 0 0 - 0 0 0 0 0
Isopods - Gnathiids 0 0 0 0 0 0 4.17 (1.00) 0 0 0 0 0 0 0 0 - 0 0 0 0 0
Isopods - Isopods 0 0 0 0 0 0 0 0 0 0 0 0 0 0 0 - 0 0 2.86 (2.00) 0 0
Gill - Dactylogyrid monogeneans
5.88 (25.00) 100 100 91.67
(15.00) 100 100 71.88 (7.00)
93.33 (17.80) 100 0 100 0 72.11
(14.38) 83.33 (11.6) 100 - 100 92.90
(29.23) 29.89 (5.75)
57.14 (12.25)
60.00 (6.67)
Polyopisthocotyid monogeneans 0 16.67
(1.00) 0 0 0 0 0 0 0 0 10.00 (1.00) 0 0 0 0 - 0 0 0 0 0
Capsalid monogeneans 5.88 (1.00) 0 0 0 0 12.50
(1.00) 7.99
(1.00) 0 20.00 (1.00) 0 0 0 13.95
(1.00) 16.67 (1.00)
22.73 (3.00) - 0 0 0 0 0
Transversotrema digeneans 0 0 0 0 0 0 0 0 0 0 0 0 0 0 0 - 0 14.30
(5.50) 0 0 0
Didymozoid digeneans 0 0 0 0 0 0 0 0 0 0 0 0 0 0 0 - 0 0 0 0 0
Nematodes - Philometrids 5.88 (1.00)
33.33 (2.50) 0 0 0 25.00
(12.50) 7.99
(3.00) 0 0 0 20.00 (4.50) 0 0 0 0 - 33.33
(4.00) 42.90 (6.00) 0 0 0
Nematodes - Anisakis 0 0 0 0 0 0 0 0 0 0 0 0 0 0 0 - 0 0 0 0 0
Cestodes - Metacestode 0 66.67 (1.25) 0 16.67
(2.50) 0 0 23.96 (1.00)
18.67 (1.00) 0 0 0 0 0 33.33
(1.50) 0 - 0 21.40 (2.33) 0 0 0
Leeches - Hirudines 0 0 0 0 0 0 0 0 0 0 0 0 0 0 0 - 0 0 0 0 0
Gills hyperplasia 7.14 (1.00) 0 0 0 0 0 0 0 0 0 0 0 0 0 0 - 0 0 0 0 0
Granulomas (Pooled) 7.14 (1.00) 0 0 10.00
(1.00) 20.00 (1.00)
50.00 (1.75)
23.96 (4.67) 0 0 0 30.00
(2.00) 0 16.33 (2.00) 0 0 - 80.00
(2.75) 50.00 (1.43)
14.95 (1.00) 0 0
Gill - Granulomas 0 0 0 0 0 0 0 0 0 0 20 (1.00) 0 0 0 0 - 0 0 7.47
(1.00) 0 0
Liver - Granulomas 0 0 0 0 0 0 0 0 0 0 0 0 0 0 0 - 0 0 0 0 0
Kidney - Granulomas 0 0 0 10.00 (1.00)
20.00 (1.00)
50.00 (1.50)
7.99 (11.00) 0 0 0 20.00
(1.50) 0 16.33 (1.00) 0 0 - 80.00
(2.00) 42.90 (1.17)
7.47 (1.00) 0 0
Spleen - Granulomas 7.14 (1.00) 0 0 0 0 12.50
(1.00) 23.96 (1.00) 0 0 0 10.00
(1.00) 0 16.33 (1.00) 0 0 - 20.00
(3.00) 21.40 (1.00) 0 0 0
Metazoa (Pooled) 28.57 (1.25) 0 0 30.00
(1.00) 0 87.50 (1.29) 0 0 0 0 50.00
(1.00) 0 0 0 0 - 60.00 (1.33)
42.90 (1.67)
7.47 (1.00) 0 0

Research Fishing and Fish Health Monitoring Program Post-dredging Report Season Ichthys Nearshore Environmental Monitoring Program
Prepared for INPEX Cardno 195
Javelin * DI DO BH AR
Variable BP D1 D2 D3 D4 P1 BP D1 D2 D3 D4 P1 BP D1 D2 D3 D4 P1 BP D1 D2
Gill - Metazoa 28.57 (1.00) 0 0 30.00
(1.00) 0 87.5 (1.14) 0 0 0 0 50.00
(1.00) 0 0 0 0 - 60.00 (1.00)
35.7 (1.8)
7.47 (1.00) 0 0
Liver - Metazoa 0 0 0 0 0 0 0 0 0 0 0 0 0 0 0 - 0 0 0 0 0
Kidney - Metazoa 7.14 (1.00) 0 0 0 0 12.50
(1.00) 0 0 0 0 0 0 0 0 0 - 20.00 (1.00)
7.10 (1.00) 0 0 0
Spleen - Metazoa 0 0 0 0 0 0 0 0 0 0 0 0 0 0 0 - 0 0 0 0 0
Myxos (Pooled) 0 0 0 0 0 25.00 (1.5)
7.99 (1.00) 0 0 0 10.00
(2.00) 0 13.95 (1.00) 0 0 - 0 7.10
(1.00) 10.33 (1.00) 0 0
Gill - Myxos 0 0 0 0 0 0 0 0 0 0 10.00 (1.00) 0 0 0 0 - 0 0 0 0 0
Liver - Protozoa/Myxos 0 0 0 0 0 0 0 0 0 0 0 0 0 0 0 - 0 0 0 0 0
Kidney - Protozoa/Myxos 0 0 0 0 0 25.00 (1.5)
7.99 (1.00) 0 0 0 10.00
(1.00) 0 13.95 (1.00) 0 0 - 0 7.10
(1.00) 10.33 (1.00) 0 0
Spleen - Protozoa/Myxos 0 0 0 0 0 0 0 0 0 0 0 0 0 0 0 - 0 0 0 0 0
Cysts/Spheres (Pooled) 0 0 0 0 0 0 0 0 0 0 0 0 13.95 (1.00) 0 0 - 0 0 0 0 0
Gill - Cysts 0 0 0 0 0 0 0 0 0 0 0 0 0 0 0 - 0 0 0 0 0
Kidney - Spheres 0 0 0 0 0 0 0 0 0 0 0 0 13.95 (1.00) 0 0 - 0 0 0 0 0
Spleen - Cysts 0 0 0 0 0 0 0 0 0 0 0 0 0 0 0 - 0 0 0 0 0
Haemorrage (Pooled) 50.00 (1.43) 0 0 90.00
(1.78) 40.00 (1.00)
12.50 (1.00)
55.90 (1.57) 0 0 0 40.00
(1.25) 0 83.67 (1.50) 0 0 - 80.00
(1.50) 57.10 (1.12)
70.11 (1.00) 0 0
Liver - Haemorrhage 35.71 (1.00) 0 0 70.00
(1.00) 40.00 (1.00)
12.50 (1.00)
47.92 (1.00) 0 0 0 30.00
(1.33) 0 55.78 (1.00) 0 0 - 80.00
(1.25) 57.10 (1.00)
22.42 (1.00) 0 0
Kidney - Haemorrhage 35.71 (1.00) 0 0 50.00
(1.00) 0 0 39.93 (1.00) 0 0 0 10.00
(1.00) 0 69.73 (1.00) 0 0 - 20.00
(1.00) 7.10
(1.00) 47.69 (1.00) 0 0
Spleen - Haemorrhage 0 0 0 40.00 (1.00) 0 0 0 0 0 0 0 0 0 0 0 - 0 0 0 0 0
Bacteria (Pooled) 0 0 0 0 60.00 (1.00) 0 0 0 0 0 0 0 0 0 0 - 40.00
(5.50) 0 0 0 0
Liver - Bacteria 0 0 0 0 20.00 (1.00) 0 0 0 0 0 0 0 0 0 0 - 0 0 0 0 0
Kidney - Bacteria 0 0 0 0 0 0 0 0 0 0 0 0 0 0 0 - 20.00 (10.00) 0 0 0 0

Research Fishing and Fish Health Monitoring Program Post-dredging Report Season Ichthys Nearshore Environmental Monitoring Program
Prepared for INPEX Cardno 196
Javelin * DI DO BH AR
Variable BP D1 D2 D3 D4 P1 BP D1 D2 D3 D4 P1 BP D1 D2 D3 D4 P1 BP D1 D2
Spleen – Bacteria rickettsia 0 0 0 0 40.00 (1.00) 0 0 0 0 0 0 0 0 0 0 - 20.00
(1.00) 0 0 0 0
Blood fluke (Pooled) 0 0 0 0 0 0 0 0 0 0 0 0 0 0 0 - 0 0 0 0 0
Gill - Blood fluke eggs 0 0 0 0 0 0 0 0 0 0 0 0 0 0 0 - 0 0 0 0 0
Liver - Blood fluke 0 0 0 0 0 0 0 0 0 0 0 0 0 0 0 - 0 0 0 0 0
Kidney - Blood fluke 0 0 0 0 0 0 0 0 0 0 0 0 0 0 0 - 0 0 0 0 0
Pigment deposition (Pooled)
21.43 (1.67) 0 0 60.00
(2.00) 100 50.00 (1.00)
63.89 (1.75) 0 0 0 60.00
(1.67) 0 16.33 (2.00) 0 0 - 100 50.00
(1.71) 10.33 (1.00) 0 0
Liver - Pigment 0 0 0 0 0 0 7.99 (1.00) 0 0 0 0 0 0 0 0 - 0 0 0 0 0
Kidney - Pigment 14.29 (1.00) 0 0 60.00
(1.50) 100 50.00 (1.00)
63.89 (1.00) 0 0 0 60.00
(1.67) 0 16.33 (1.00) 0 0 - 100 50.00
(1.71) 2.86
(1.00) 0 0
Spleen - Pigment 21.43 (1.00) 0 0 30.00
(1.00) 0 0 39.93 (1.00) 0 0 0 0 0 16.33
(1.00) 0 0 - 0 0 7.47 (1.00) 0 0
Gill - Epitheliocystis 0 0 0 0 0 0 0 0 0 0 0 0 0 0 0 - 0 0 0 0 0
Liver - Clear cell foci 0 0 0 0 0 0 0 0 0 0 0 0 0 0 0 - 0 0 0 0 0
Spleen - Vacuoles 0 0 0 0 0 12.50 (2.00) 0 0 0 0 0 0 0 0 0 - 0 35.70
(1.00) 0 0 0
Spleen - Scar tissue 0 0 0 20.00 (1.00) 0 0 0 0 0 0 20.00
(1.00) 0 0 0 0 - 0 0 0 0 0
Internal Myxos/Protozoa 0 0 0 0 0 0 7.99 (1.00) 0 0 0 0 0 13.95
(1.00) 0 0 - 0 0 10.33 (1.00) 0 0
Gill - Normal 0 0 0 0 0 0 0 0 0 0 0 0 0 0 0 - 0 0 0 0 0
Gill - Post mortem autolysis 0 0 0 100 100 100 0 0 0 0 100 0 0 0 0 - 100 100 0 0 100
Gill - Congestion 0 0 0 70.00 (1.00) 100 0 0 0 0 0 70.00
(1.00) 0 0 0 0 - 100 0 0 0 0
Liver - Normal 0 0 0 20.00 (1.00)
20.00 (1.00)
75.00 (1.00) 0 0 0 0 40.00
(1.00) 0 0 0 0 - 20.00 (1.00)
57.10 (1.00) 0 0 0
Liver - Post mortem autolysis/necrosis 0 0 0 50.00
(1.00) 60.00 (1.00)
25.00 (1.00) 0 0 0 0 60.00
(1.00) 0 0 0 0 - 60.00 (1.00)
35.70 (1.00) 0 0 100
Kidney - Normal 0 0 0 0 0 25.00 (1.00) 0 0 0 0 0 0 0 0 0 - 0 7.10
(1.00) 0 0 0

Research Fishing and Fish Health Monitoring Program Post-dredging Report Season Ichthys Nearshore Environmental Monitoring Program
Prepared for INPEX Cardno 197
Javelin * DI DO BH AR
Variable BP D1 D2 D3 D4 P1 BP D1 D2 D3 D4 P1 BP D1 D2 D3 D4 P1 BP D1 D2 Kidney - Post mortem autolysis 0 0 0 80.00
(1.00) 80.00 (1.00)
12.50 (1.00) 0 0 0 0 60.00
(1.00) 0 0 0 0 - 60.00 (1.00)
50.00 (1.00) 0 0 100
Spleen - Normal 0 0 0 30.00 (1.00)
40.00 (1.00)
62.50 (1.00) 0 0 0 0 50.00
(1.00) 0 0 0 0 - 0 28.60 (1.00) 0 0 0
Spleen - Post mortem autolysis 0 0 0 50.00
(1.00) 60.00 (1.00)
25.00 (1.00) 0 0 0 0 10.00
(1.00) 0 0 0 0 - 60.00 (1.00)
57.10 (1.00) 0 0 0

Research Fishing and Fish Health Monitoring Program Post-dredging Report Season Ichthys Nearshore Environmental Monitoring Program
Prepared for INPEX Cardno 198
King threadfin DI DO BH AR Variable BP D1 D2 D3 D4 P1 BP D1 D2 D3 D4 P1 BP D1 D2 D3 D4 P1 BP D1 D2 Number sampled in the field 0 2 0 0 0 0 0 0 2 0 0 3 3 8 7 - 3 0 4 6 5 Average length sampled in the field (SE) 0 63.0
(0.5) 0 0 0 0 0 0 59. 5 (3.7) 0 0 42.5
(1.0) 58.3 (4.9)
51.8 (3.3)
64.0 (2.7) - 59.5
(3.6) 0 48.2 (8.5)
44.3 (5.4)
58.0 (3.5)
Average length examined in the laboratory (SE) 0 63
(0.5) 0 0 0 0 0 0 59. 5 (3.7) 0 0 42.5
(1.0) 58.3 (4.9)
51.8 (3.3)
64.0 (2.7) - 59.5
(3.6) 0 48.2 (8.5)
44.3 (5.4)
58.0 (3.5)
Proportion observed abnormal 0 0 0 0 0 0 0 0 0 0 0 0 0 0 0 - 0 0 0 0 0
Number examined in the laboratory 0 2 0 0 0 0 0 0 2 0 0 3 3 8 5 - 3 0 4 6 5
Number examined by histopathology 0 0 0 0 0 0 0 0 0 0 0 3 3 0 0 - 0 0 4 0 0
Protozoa/Myxozoa (Internal and External Pooled) 0 0 0 0 0 0 0 0 0 0 0 0 0 0 0 - 0 0 0 0 0
Protozoa/Myxozoa (External) 0 0 0 0 0 0 0 0 0 0 0 0 0 0 0 - 0 0 0 0 0
Cryptocaryon 0 0 0 0 0 0 0 0 0 0 0 0 0 0 0 - 0 0 0 0 0
Copepods - Argulus 0 0 0 0 0 0 0 0 0 0 0 0 0 0 0 - 0 0 0 0 0
Caligid copepods (Pooled) 0 0 0 0 0 0 0 0 0 0 0 0 0 0 0 - 0 0 25.00 (2.00)
16.67 (3.00) 0
Caligus sp1 0 0 0 0 0 0 0 0 0 0 0 0 0 0 0 - 0 0 0 16.67 (1.00) 0
Caligus sp2 0 0 0 0 0 0 0 0 0 0 0 0 0 0 0 - 0 0 25 (2.00)
16.67 (2.00) 0
Gill tip copepods 0 0 0 0 0 0 0 0 0 0 0 0 0 0 0 - 0 0 0 0 0
Copepods - Brachiellas 0 0 0 0 0 0 0 0 0 0 0 0 0 0 0 - 0 0 0 0 0
Copepods - Ergasilus 0 0 0 0 0 0 0 0 0 0 0 0 0 0 0 - 66.67 (1.00) 0 0 0 0
Copepods - Lernanthropuses 0 0 0 0 0 0 0 0 0 0 0 0 0 0 0 - 0 0 0 0 20.00 (1.00)
Copepods - Lernaeopodidae 0 0 0 0 0 0 0 0 0 0 0 0 0 0 0 - 0 0 0 0 0
Copepods - Hatschekias 0 0 0 0 0 0 0 0 0 0 0 0 0 0 0 - 0 0 0 0 0
Copepods - Bomolochus 0 0 0 0 0 0 0 0 0 0 0 0 0 0 0 - 0 0 0 0 0
Copepods - Thyansote 0 0 0 0 0 0 0 0 50.00 (4.00) 0 0 33.30
(1.00) 0 12.50 (1.00)
20.00 (1.00) - 0 0 50.00
(1.50) 0 80.00 (3.00)
Copepods - Naebranchia 0 0 0 0 0 0 0 0 0 0 0 0 0 0 0 - 0 0 0 0 0
Isopods - Gnathiids 0 0 0 0 0 0 0 0 0 0 0 0 0 0 0 - 0 0 0 0 0
Isopods - Isopods 0 0 0 0 0 0 0 0 0 0 0 0 0 12.50 (1.00) 0 - 0 0 0 0 0

Research Fishing and Fish Health Monitoring Program Post-dredging Report Season Ichthys Nearshore Environmental Monitoring Program
Prepared for INPEX Cardno 199
King threadfin DI DO BH AR Variable BP D1 D2 D3 D4 P1 BP D1 D2 D3 D4 P1 BP D1 D2 D3 D4 P1 BP D1 D2
Gill - Dactylogyrid monogeneans 0 100 0 0 0 0 0 0 0 0 0 0 0 12.50
(38.00) 0 - 0 0 0 0 20.00 (105.0
0) Polyopisthocotyid monogeneans 0 0 0 0 0 0 0 0 0 0 0 0 0 0 0 - 0 0 0 0 0
Capsalid monogeneans 0 0 0 0 0 0 0 0 0 0 0 0 0 0 0 - 0 0 0 0 0
Transversotrema digeneans 0 0 0 0 0 0 0 0 0 0 0 0 0 0 0 - 0 0 0 0 0
Didymozoid digeneans 0 0 0 0 0 0 0 0 0 0 0 0 0 0 0 - 0 0 0 0 0
Nematodes - Philometrids 0 0 0 0 0 0 0 0 0 0 0 0 0 12.50 (5.00)
20.00 (1.00) - 33.33
(2.00) 0 0 16.67 (1.00) 0
Nematodes - Anisakis 0 0 0 0 0 0 0 0 0 0 0 0 0 12.50 (1.00) 0 - 0 0 50.00
(4.00) 16.67 (9.00) 0
Cestodes - Metacestode 0 0 0 0 0 0 0 0 50.00 (2.00) 0 0 66.67
(1.50) 33.33 (6.00)
12.50 (1.00)
60.00 (6.7) - 33.33
(6.00) 0 50.00 (8.00)
66.67 (5.80) 100
Leeches - Hirudines 0 0 0 0 0 0 0 0 0 0 0 0 0 0 0 - 0 0 0 0 0
Gills hyperplasia 0 0 0 0 0 0 0 0 0 0 0 0 0 0 0 - 0 0 0 0 0
Granulomas (Pooled) 0 0 0 0 0 0 0 0 0 0 0 0 33.33 (1.00) 0 0 - 0 0 25.00
(1.00) 0 0
Gill - Granulomas 0 0 0 0 0 0 0 0 0 0 0 0 0 0 0 - 0 0 0 0 0
Liver - Granulomas 0 0 0 0 0 0 0 0 0 0 0 0 33.33 (1.00) 0 0 - 0 0 25.00
(1.00) 0 0
Kidney - Granulomas 0 0 0 0 0 0 0 0 0 0 0 0 0 0 0 - 0 0 0 0 0
Spleen - Granulomas 0 0 0 0 0 0 0 0 0 0 0 0 0 0 0 - 0 0 0 0 0
Metazoa (Pooled) 0 0 0 0 0 0 0 0 0 0 0 66.70 (1.00)
33.33 (1.00) 0 0 - 0 0 50.00
(1.00) 0 0
Gill - Metazoa 0 0 0 0 0 0 0 0 0 0 0 66.7 (1.00) 0 0 0 - 0 0 25.00
(1.00) 0 0
Liver - Metazoa 0 0 0 0 0 0 0 0 0 0 0 0 33.33 (1.00) 0 0 - 0 0 25.00
(1.00) 0 0
Kidney - Metazoa 0 0 0 0 0 0 0 0 0 0 0 0 0 0 0 - 0 0 0 0 0
Spleen - Metazoa 0 0 0 0 0 0 0 0 0 0 0 0 0 0 0 - 0 0 0 0 0
Myxos (Pooled) 0 0 0 0 0 0 0 0 0 0 0 0 0 0 0 - 0 0 0 0 0
Gill - Myxos 0 0 0 0 0 0 0 0 0 0 0 0 0 0 0 - 0 0 0 0 0
Liver - Protozoa/Myxos 0 0 0 0 0 0 0 0 0 0 0 0 0 0 0 - 0 0 0 0 0
Kidney - Protozoa/Myxos 0 0 0 0 0 0 0 0 0 0 0 0 0 0 0 - 0 0 0 0 0
Spleen - Protozoa/Myxos 0 0 0 0 0 0 0 0 0 0 0 0 0 0 0 - 0 0 0 0 0
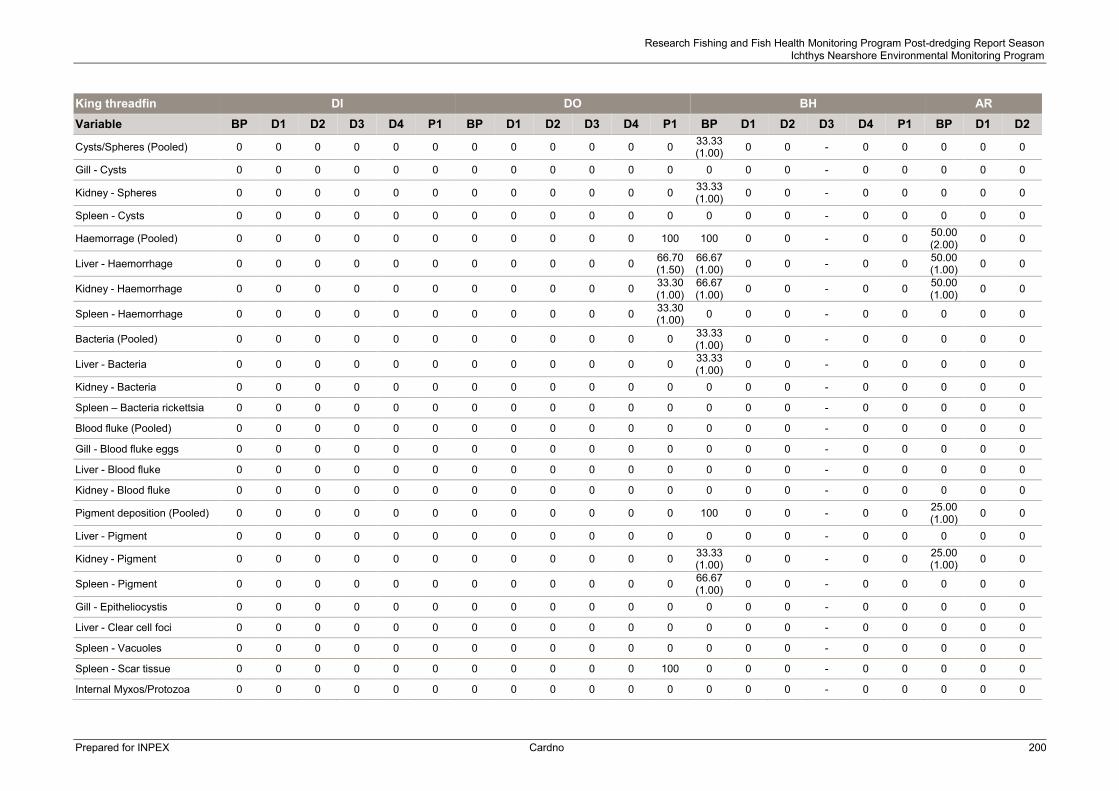
Research Fishing and Fish Health Monitoring Program Post-dredging Report Season Ichthys Nearshore Environmental Monitoring Program
Prepared for INPEX Cardno 200
King threadfin DI DO BH AR Variable BP D1 D2 D3 D4 P1 BP D1 D2 D3 D4 P1 BP D1 D2 D3 D4 P1 BP D1 D2
Cysts/Spheres (Pooled) 0 0 0 0 0 0 0 0 0 0 0 0 33.33 (1.00) 0 0 - 0 0 0 0 0
Gill - Cysts 0 0 0 0 0 0 0 0 0 0 0 0 0 0 0 - 0 0 0 0 0
Kidney - Spheres 0 0 0 0 0 0 0 0 0 0 0 0 33.33 (1.00) 0 0 - 0 0 0 0 0
Spleen - Cysts 0 0 0 0 0 0 0 0 0 0 0 0 0 0 0 - 0 0 0 0 0
Haemorrage (Pooled) 0 0 0 0 0 0 0 0 0 0 0 100 100 0 0 - 0 0 50.00 (2.00) 0 0
Liver - Haemorrhage 0 0 0 0 0 0 0 0 0 0 0 66.70 (1.50)
66.67 (1.00) 0 0 - 0 0 50.00
(1.00) 0 0
Kidney - Haemorrhage 0 0 0 0 0 0 0 0 0 0 0 33.30 (1.00)
66.67 (1.00) 0 0 - 0 0 50.00
(1.00) 0 0
Spleen - Haemorrhage 0 0 0 0 0 0 0 0 0 0 0 33.30 (1.00) 0 0 0 - 0 0 0 0 0
Bacteria (Pooled) 0 0 0 0 0 0 0 0 0 0 0 0 33.33 (1.00) 0 0 - 0 0 0 0 0
Liver - Bacteria 0 0 0 0 0 0 0 0 0 0 0 0 33.33 (1.00) 0 0 - 0 0 0 0 0
Kidney - Bacteria 0 0 0 0 0 0 0 0 0 0 0 0 0 0 0 - 0 0 0 0 0
Spleen – Bacteria rickettsia 0 0 0 0 0 0 0 0 0 0 0 0 0 0 0 - 0 0 0 0 0
Blood fluke (Pooled) 0 0 0 0 0 0 0 0 0 0 0 0 0 0 0 - 0 0 0 0 0
Gill - Blood fluke eggs 0 0 0 0 0 0 0 0 0 0 0 0 0 0 0 - 0 0 0 0 0
Liver - Blood fluke 0 0 0 0 0 0 0 0 0 0 0 0 0 0 0 - 0 0 0 0 0
Kidney - Blood fluke 0 0 0 0 0 0 0 0 0 0 0 0 0 0 0 - 0 0 0 0 0
Pigment deposition (Pooled) 0 0 0 0 0 0 0 0 0 0 0 0 100 0 0 - 0 0 25.00 (1.00) 0 0
Liver - Pigment 0 0 0 0 0 0 0 0 0 0 0 0 0 0 0 - 0 0 0 0 0
Kidney - Pigment 0 0 0 0 0 0 0 0 0 0 0 0 33.33 (1.00) 0 0 - 0 0 25.00
(1.00) 0 0
Spleen - Pigment 0 0 0 0 0 0 0 0 0 0 0 0 66.67 (1.00) 0 0 - 0 0 0 0 0
Gill - Epitheliocystis 0 0 0 0 0 0 0 0 0 0 0 0 0 0 0 - 0 0 0 0 0
Liver - Clear cell foci 0 0 0 0 0 0 0 0 0 0 0 0 0 0 0 - 0 0 0 0 0
Spleen - Vacuoles 0 0 0 0 0 0 0 0 0 0 0 0 0 0 0 - 0 0 0 0 0
Spleen - Scar tissue 0 0 0 0 0 0 0 0 0 0 0 100 0 0 0 - 0 0 0 0 0
Internal Myxos/Protozoa 0 0 0 0 0 0 0 0 0 0 0 0 0 0 0 - 0 0 0 0 0
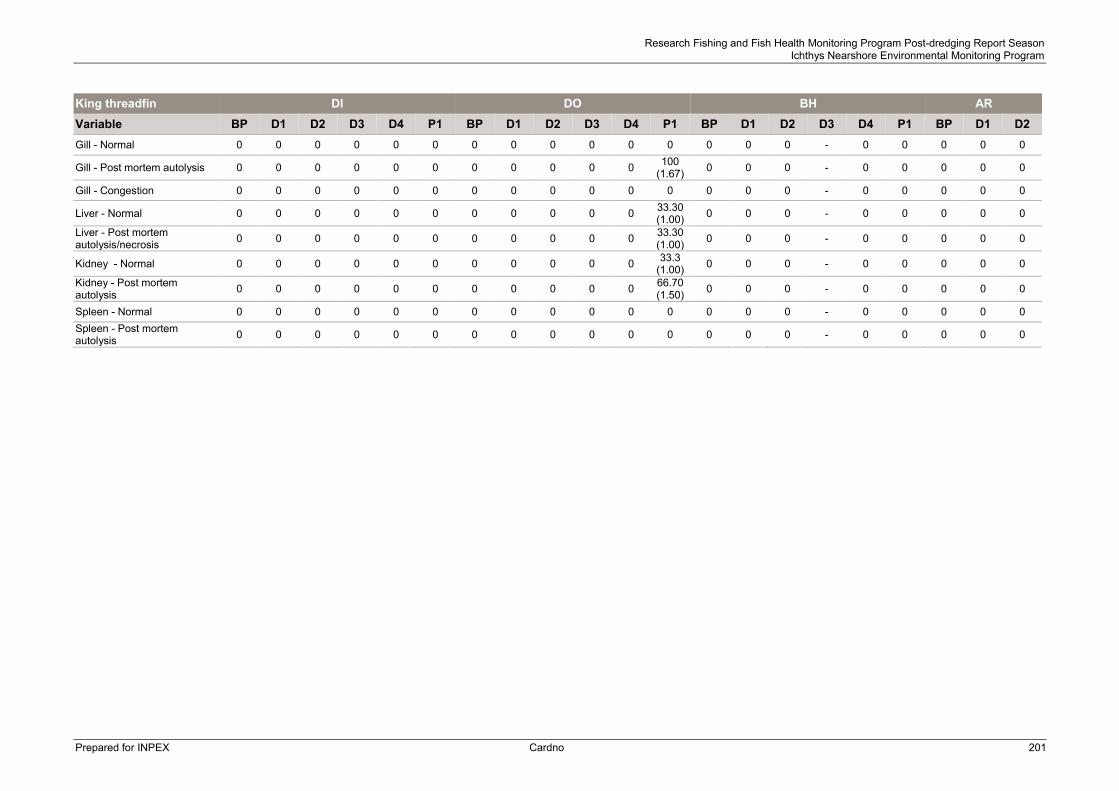
Research Fishing and Fish Health Monitoring Program Post-dredging Report Season Ichthys Nearshore Environmental Monitoring Program
Prepared for INPEX Cardno 201
King threadfin DI DO BH AR Variable BP D1 D2 D3 D4 P1 BP D1 D2 D3 D4 P1 BP D1 D2 D3 D4 P1 BP D1 D2 Gill - Normal 0 0 0 0 0 0 0 0 0 0 0 0 0 0 0 - 0 0 0 0 0
Gill - Post mortem autolysis 0 0 0 0 0 0 0 0 0 0 0 100 (1.67) 0 0 0 - 0 0 0 0 0
Gill - Congestion 0 0 0 0 0 0 0 0 0 0 0 0 0 0 0 - 0 0 0 0 0
Liver - Normal 0 0 0 0 0 0 0 0 0 0 0 33.30 (1.00) 0 0 0 - 0 0 0 0 0
Liver - Post mortem autolysis/necrosis 0 0 0 0 0 0 0 0 0 0 0 33.30
(1.00) 0 0 0 - 0 0 0 0 0
Kidney - Normal 0 0 0 0 0 0 0 0 0 0 0 33.3 (1.00) 0 0 0 - 0 0 0 0 0
Kidney - Post mortem autolysis 0 0 0 0 0 0 0 0 0 0 0 66.70
(1.50) 0 0 0 - 0 0 0 0 0
Spleen - Normal 0 0 0 0 0 0 0 0 0 0 0 0 0 0 0 - 0 0 0 0 0 Spleen - Post mortem autolysis 0 0 0 0 0 0 0 0 0 0 0 0 0 0 0 - 0 0 0 0 0

Research Fishing and Fish Health Monitoring Program Post-dredging Report Season Ichthys Nearshore Environmental Monitoring Program
Prepared for INPEX Cardno 202
Moses snapper DI DO BH AR
Variable BP D1 D2 D3 D4 P1 BP D1 D2 D3 D4 P1 BP D1 D2 D3 D4 P1 BP D1 D2
Number sampled in the field 114 23 1 23 0 16 16 6 0 4 0 18 25 25 9 - 0 15 0 0 0
Average length sampled in the field (SE)
17.4 (0.2)
17.5 (0.4)
18.6 (NA)
16.7 (0.47) 0 17.9
(0.3) 19.2 (0.6)
19.5 (0.9) 0 17.5
(2.7) 0 18.8 (0.8)
15.8 (0.4)
18.0 (0.3)
15.8 (0.9) - 0 18.1
(0.4) 0 0 0
Average length examined in the laboratory (SE)
17.5 (0.3)
18.6 (0.7)
18.6 (NA)
16.6 (0.2) 0 18.9
(0.4) 20.3 (0.5)
19.5 (0.9) 0 18.7
(5.1) 0 16.2 (1.4)
15.5 (0.5)
19.3 (1.0)
17.2 (0.7) - 0 18.8
(0.4) 0 0 0
Proportion observed abnormal 0 0 0 4.35 0 0 0 0 0 0 0 0 0 0 0 - 0 0 0 0 0
Number examined in the laboratory 30 7 1 7 0 5 8 6 0 2 0 5 15 5 5 - 0 6 0 0 0
Number examined by histopathology 11 0 0 6 0 0 1 0 0 1 0 0 9 0 0 - 0 4 0 0 0
Protozoa/Myxozoa (Internal and External Pooled)
9.09 (1.00) 0 0 0 0 0 0 0 0 0 0 0 11.1
(1.00) 0 0 - 0 0 0 0 0
Protozoa/Myxozoa (External) 0 0 0 0 0 0 0 0 0 0 0 0 0 0 0 - 0 0 0 0 0
Cryptocaryon 0 0 0 0 0 0 0 0 0 0 0 20.00 (1.00) 0 0 0 - 0 0 0 0 0
Copepods - Argulus 0 0 0 0 0 0 0 0 0 0 0 0 0 0 0 - 0 0 0 0 0
Caligid copepods (Pooled) 0 0 0 0 0 0 12.50 (3.00) 0 0 0 0 0 13.33
(1.00) 0 0 - 0 0 0 0 0
Caligus sp1 0 0 0 0 0 0 12.50 (3.00) 0 0 0 0 0 13.33
(1.00) 0 0 - 0 0 0 0 0
Caligus sp2 0 0 0 0 0 0 0 0 0 0 0 0 0 0 0 - 0 0 0 0 0
Gill tip copepods 0 0 0 0 0 0 0 0 0 0 0 0 0 0 0 - 0 0 0 0 0
Copepods - Brachiellas 0 0 0 0 0 0 0 0 0 0 0 0 0 0 0 - 0 0 0 0 0
Copepods - Ergasilus 0 0 0 0 0 0 0 0 0 0 0 0 0 0 0 - 0 0 0 0 0
Copepods - Lernanthropuses 13.33 (1.25) 0 0 0 0 0 12.50
(1.00) 16.67 (1.00) 0 0 0 0 13.33
(1.00) 0 60.00 (2.00) - 0 0 0 0 0
Copepods - Lernaeopodidae 0 0 0 0 0 0 0 0 0 0 0 0 0 0 0 - 0 0 0 0 0
Copepods - Hatschekias 70.00 (1.95)
85.71 (2.67) 0 63.77
(4.75) 0 60.00 (2.33)
37.50 (2.00)
66.67 (5.75) 0 50.00
(12.00) 0 100 33.33 (1.40)
60.00 (3.67)
40.00 (2.50) - 0 50.00
(3.67) 0 0 0
Copepods - Bomolochus 0 0 0 0 0 0 0 0 0 0 0 0 0 0 0 - 0 0 0 0 0

Research Fishing and Fish Health Monitoring Program Post-dredging Report Season Ichthys Nearshore Environmental Monitoring Program
Prepared for INPEX Cardno 203
Moses snapper DI DO BH AR
Variable BP D1 D2 D3 D4 P1 BP D1 D2 D3 D4 P1 BP D1 D2 D3 D4 P1 BP D1 D2
Copepods - Thyansote 0 0 0 0 0 0 0 0 0 0 0 0 0 0 0 - 0 0 0 0 0
Copepods - Naebranchia 0 0 0 0 0 0 0 0 0 0 0 0 0 0 0 - 0 0 0 0 0
Isopods - Gnathiids 0 14.29 (1.00) 0 0 0 0 12.50
(1.00) 16.67 (4.00) 0 50.00
(2.00) 0 0 6.67 (2.00) 0 0 - 0 0 0 0 0
Isopods - Isopods 0 0 0 0 0 0 0 0 0 0 0 0 0 0 0 - 0 0 0 0 0
Gill - Dactylogyrid monogeneans
63.33 (8.00) 100 100 100 0 100 25.00
(4.50) 66.67 (5.00) 0 50.00
(10.00) 0 100 60.00 (6.00)
80.00 (6.00) 100 - 0 83.30
(11.80) 0 0 0
Polyopisthocotyid monogeneans
20.00 (1.00) 0 0 0 0 0 0 0 0 0 0 0 0 0 0 - 0 0 0 0 0
Capsalid monogeneans 0 0 0 0 0 0 0 16.67 (2.00) 0 0 0 0 13.33
(2.50) 0 20.00 (1.00) - 0 33.30
(1.00) 0 0 0
Transversotrema digeneans 0 14.29 (1.00) 0 0 0 0 0 16.67
(1.00) 0 0 0 0 13.33 (1.50)
20.00 (1.00)
20.00 (1.00) - 0 0 0 0 0
Didymozoid digeneans 0 0 0 0 0 0 12.50 (1.00) 0 0 0 0 0 0 0 0 - 0 0 0 0 0
Nematodes - Philometrids 0 0 0 0 0 0 0 0 0 0 0 0 0 0 0 - 0 0 0 0 0
Nematodes - Anisakis 0 0 0 0 0 0 0 0 0 0 0 0 0 0 0 - 0 0 0 0 0
Cestodes - Metacestode 3.33 (1.00)
14.29 (1.00) 0 0 0 20.00
(1.00) 0 16.67 (2.00) 0 0 0 0 6.67
(1.00) 0 0 - 0 16.70 (2.00) 0 0 0
Leeches - Hirudines 0 0 0 0 0 0 0 0 0 0 0 0 0 0 0 - 0 0 0 0 0
Gills hyperplasia 9.09 (1.00) 0 0 0 0 0 0 0 0 0 0 0 0 0 0 - 0 0 0 0 0
Granulomas (Pooled)
18.18 (1.00) 0 0 0 0 0 0 0 0 0 0 0 11.11
(1.00) 0 0 - 0 0 0 0 0
Gill - Granulomas 0 0 0 0 0 0 0 0 0 0 0 0 0 0 0 - 0 0 0 0 0
Liver - Granulomas 0 0 0 0 0 0 0 0 0 0 0 0 0 0 0 - 0 0 0 0 0
Kidney - Granulomas 9.09 (1.00) 0 0 0 0 0 0 0 0 0 0 0 0 0 0 - 0 0 0 0 0
Spleen - Granulomas 9.09 (1.00) 0 0 0 0 0 0 0 0 0 0 0 11.11
(1.00) 0 0 - 0 0 0 0 0
Metazoa (Pooled) 18.18 (1.00) 0 0 0 0 0 0 0 0 0 0 0 0 0 0 - 0 0 0 0 0

Research Fishing and Fish Health Monitoring Program Post-dredging Report Season Ichthys Nearshore Environmental Monitoring Program
Prepared for INPEX Cardno 204
Moses snapper DI DO BH AR
Variable BP D1 D2 D3 D4 P1 BP D1 D2 D3 D4 P1 BP D1 D2 D3 D4 P1 BP D1 D2
Gill - Metazoa 9.09 (1.00) 0 0 0 0 0 0 0 0 0 0 0 0 0 0 - 0 0 0 0 0
Liver - Metazoa 9.09 (1.00) 0 0 0 0 0 0 0 0 0 0 0 0 0 0 - 0 0 0 0 0
Kidney - Metazoa 0 0 0 0 0 0 0 0 0 0 0 0 0 0 0 - 0 0 0 0 0
Spleen - Metazoa 0 0 0 0 0 0 0 0 0 0 0 0 0 0 0 - 0 0 0 0 0
Myxos (Pooled) 9.09 (1.00) 0 0 0 0 0 0 0 0 0 0 0 11.11
(1.00) 0 0 - 0 0 0 0 0
Gill - Myxos 0 0 0 0 0 0 0 0 0 0 0 0 0 0 0 - 0 0 0 0 0
Liver - Protozoa/Myxos 9.09 (1.00) 0 0 0 0 0 0 0 0 0 0 0 0 0 0 - 0 0 0 0 0
Kidney - Protozoa/Myxos 0 0 0 0 0 0 0 0 0 0 0 0 11.11 (1.00) 0 0 - 0 0 0 0 0
Spleen - Protozoa/Myxos 0 0 0 0 0 0 0 0 0 0 0 0 0 0 0 - 0 0 0 0 0
Cysts/Spheres (Pooled) 0 0 0 0 0 0 0 0 0 0 0 0 11.11 (1.00) 0 0 - 0 0 0 0 0
Gill - Cysts 0 0 0 0 0 0 0 0 0 0 0 0 0 0 0 - 0 0 0 0 0
Kidney - Spheres 0 0 0 0 0 0 0 0 0 0 0 0 11.11 (1.00) 0 0 - 0 0 0 0 0
Spleen - Cysts 0 0 0 0 0 0 0 0 0 0 0 0 0 0 0 - 0 0 0 0 0
Haemorrage (Pooled) 9.09 (1.00) 0 0 0 0 0 0 0 0 0 0 0 22.22
(1.00) 0 0 - 0 0 0 0 0
Liver - Haemorrhage 9.09 (1.00) 0 0 0 0 0 0 0 0 0 0 0 22.22
(1.00) 0 0 - 0 0 0 0 0
Kidney - Haemorrhage 0 0 0 0 0 0 0 0 0 0 0 0 0 0 0 - 0 0 0 0 0
Spleen - Haemorrhage 0 0 0 0 0 0 0 0 0 0 0 0 0 0 0 - 0 0 0 0 0
Bacteria (Pooled) 9.09 (1.00) 0 0 0 0 0 0 0 0 0 0 0 11.11
(1.00) 0 0 - 0 0 0 0 0
Liver - Bacteria 9.09 (1.00) 0 0 0 0 0 0 0 0 0 0 0 0 0 0 - 0 0 0 0 0
Kidney - Bacteria 0 0 0 0 0 0 0 0 0 0 0 0 11.11 (1.00) 0 0 - 0 0 0 0 0
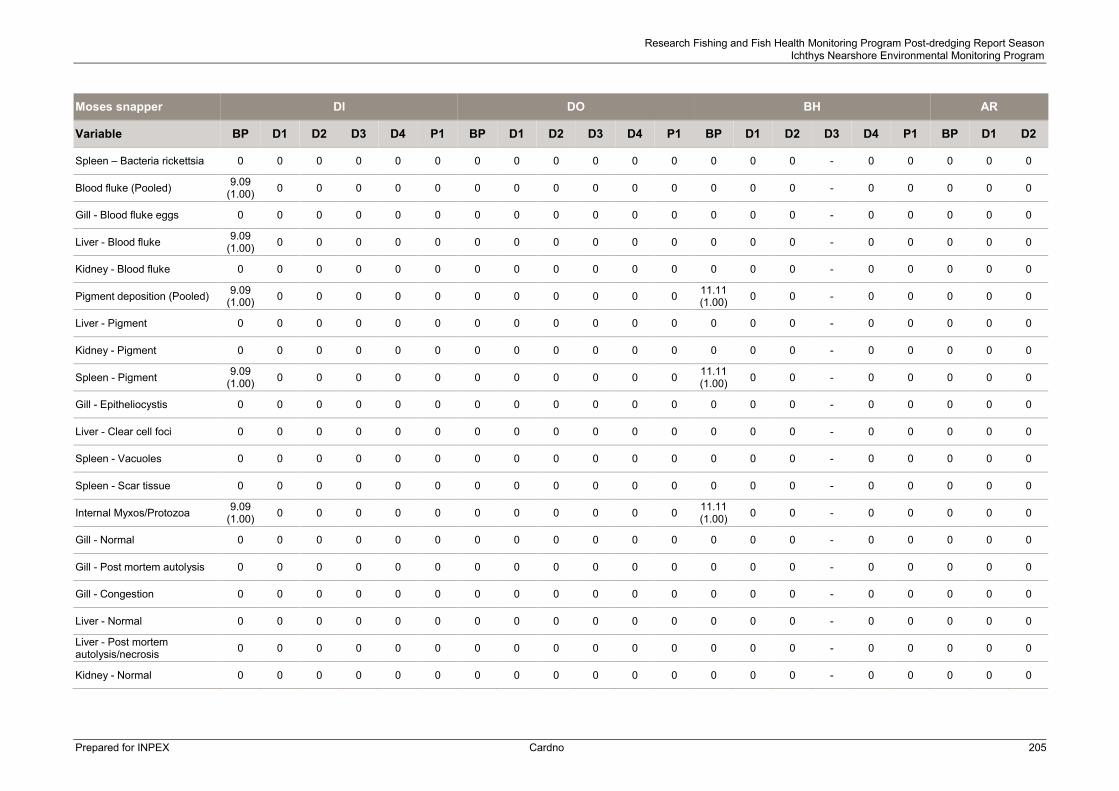
Research Fishing and Fish Health Monitoring Program Post-dredging Report Season Ichthys Nearshore Environmental Monitoring Program
Prepared for INPEX Cardno 205
Moses snapper DI DO BH AR
Variable BP D1 D2 D3 D4 P1 BP D1 D2 D3 D4 P1 BP D1 D2 D3 D4 P1 BP D1 D2
Spleen – Bacteria rickettsia 0 0 0 0 0 0 0 0 0 0 0 0 0 0 0 - 0 0 0 0 0
Blood fluke (Pooled) 9.09 (1.00) 0 0 0 0 0 0 0 0 0 0 0 0 0 0 - 0 0 0 0 0
Gill - Blood fluke eggs 0 0 0 0 0 0 0 0 0 0 0 0 0 0 0 - 0 0 0 0 0
Liver - Blood fluke 9.09 (1.00) 0 0 0 0 0 0 0 0 0 0 0 0 0 0 - 0 0 0 0 0
Kidney - Blood fluke 0 0 0 0 0 0 0 0 0 0 0 0 0 0 0 - 0 0 0 0 0
Pigment deposition (Pooled) 9.09 (1.00) 0 0 0 0 0 0 0 0 0 0 0 11.11
(1.00) 0 0 - 0 0 0 0 0
Liver - Pigment 0 0 0 0 0 0 0 0 0 0 0 0 0 0 0 - 0 0 0 0 0
Kidney - Pigment 0 0 0 0 0 0 0 0 0 0 0 0 0 0 0 - 0 0 0 0 0
Spleen - Pigment 9.09 (1.00) 0 0 0 0 0 0 0 0 0 0 0 11.11
(1.00) 0 0 - 0 0 0 0 0
Gill - Epitheliocystis 0 0 0 0 0 0 0 0 0 0 0 0 0 0 0 - 0 0 0 0 0
Liver - Clear cell foci 0 0 0 0 0 0 0 0 0 0 0 0 0 0 0 - 0 0 0 0 0
Spleen - Vacuoles 0 0 0 0 0 0 0 0 0 0 0 0 0 0 0 - 0 0 0 0 0
Spleen - Scar tissue 0 0 0 0 0 0 0 0 0 0 0 0 0 0 0 - 0 0 0 0 0
Internal Myxos/Protozoa 9.09 (1.00) 0 0 0 0 0 0 0 0 0 0 0 11.11
(1.00) 0 0 - 0 0 0 0 0
Gill - Normal 0 0 0 0 0 0 0 0 0 0 0 0 0 0 0 - 0 0 0 0 0
Gill - Post mortem autolysis 0 0 0 0 0 0 0 0 0 0 0 0 0 0 0 - 0 0 0 0 0
Gill - Congestion 0 0 0 0 0 0 0 0 0 0 0 0 0 0 0 - 0 0 0 0 0
Liver - Normal 0 0 0 0 0 0 0 0 0 0 0 0 0 0 0 - 0 0 0 0 0
Liver - Post mortem autolysis/necrosis 0 0 0 0 0 0 0 0 0 0 0 0 0 0 0 - 0 0 0 0 0
Kidney - Normal 0 0 0 0 0 0 0 0 0 0 0 0 0 0 0 - 0 0 0 0 0

Research Fishing and Fish Health Monitoring Program Post-dredging Report Season Ichthys Nearshore Environmental Monitoring Program
Prepared for INPEX Cardno 206
Moses snapper DI DO BH AR
Variable BP D1 D2 D3 D4 P1 BP D1 D2 D3 D4 P1 BP D1 D2 D3 D4 P1 BP D1 D2 Kidney - Post mortem autolysis 0 0 0 0 0 0 0 0 0 0 0 0 0 0 0 - 0 0 0 0 0
Spleen - Normal 0 0 0 0 0 0 0 0 0 0 0 0 0 0 0 - 0 0 0 0 0
Spleen - Post mortem autolysis 0 0 0 0 0 0 0 0 0 0 0 0 0 0 0 - 0 0 0 0 0

Research Fishing and Fish Health Monitoring Program Post-dredging Report Season Ichthys Nearshore Environmental Monitoring Program
Prepared for INPEX Cardno 207
Mullet * DI DO BH AR
Variable BP D1 D2 D3 D4 P1 BP D1 D2 D3 D4 P1 BP D1 D2 D3 D4 P1 BP D1 D2
Number sampled in the field 25 6 0 1 0 0 23 19 5 0 0 0 14 2 0 - 1 0 12 6 0
Average length sampled in the field (SE)
10.6 (1.5)
13.7 (1.9) 0 9
(NA) 0 0 11.0 (0.69)
10.9 (0.7)
47.9 (2.7) 0 0 0 8.5
(0.9) 26.3
(11.1) 0 - 48.0 (NA) 0 18.9
(1.4) 17.8 (2.6) 0
Average length examined in the laboratory (SE)
11.9 (2.5)
13.7 (1.9) 0 9
(NA) 0 0 10.3 (0.6)
11.7 (1.2)
47.9 (2.7) 0 0 0 12.0
(2.3) 26.3
(11.1) 0 - 48.0 (NA) 0 19.7
(1.4) 17.8 (2.6) 0
Proportion observed abnormal 4 0 0 0 0 0 0 0 0 0 0 0 0 0 0 - 0 0 0 0 0
Number examined in the laboratory 15 6 0 1 0 0 15 7 5 0 0 0 4 2 0 - 1 0 10 6 0
Number examined by histopathology 11 0 0 0 0 0 10 0 0 0 0 0 4 0 0 - 0 0 10 0 0
Protozoa/Myxozoa (Internal and External Pooled)
6.86 (4.00) 0 0 0 0 0 27.41
(2.00) 0 0 0 0 0 0 0 0 - 0 0 40.00 (15.00) 0 0
Protozoa/Myxozoa (External) 6.86 (4.00) 0 0 0 0 0 6.67
(4.00) 0 0 0 0 0 0 0 0 - 0 0 30.00 (19.67)
16.67 (10.00) 0
Cryptocaryon 0 0 0 0 0 0 0 0 0 0 0 0 0 0 0 - 0 0 0 0 0
Copepods - Argulus 0 0 0 0 0 0 0 0 0 0 0 0 0 0 0 - 0 0 0 0 0
Caligid copepods (Pooled) 6.86 (5.00)
16.67 (2.00) 0 0 0 0 13.33
(3.00) 28.57 (8.00)
60.00 (7.33) 0 0 0 25.00
(6.00) 50.00 (2.00) 0 - 100 0 10.00
(1.00) 66.67 (1.75) 0
Caligus sp1 6.86 (2.00)
16.67 (1.00) 0 0 0 0 6.67
(3.00) 28.57 (8.00)
60.00 (3.33) 0 0 0 25.00
(6.00) 50.00 (2.00) 0 - 0 0 10.00
(1.00) 0 0
Caligus sp2 6.86 (3.00)
16.67 (1.00) 0 0 0 0 6.67
(3.00) 0 20.00 (12.00) 0 0 0 0 0 0 - 100 0 0 66.67
(1.75) 0
Gill tip copepods 0 0 0 0 0 0 0 0 0 0 0 0 0 0 0 - 0 0 0 0 0
Copepods - Brachiellas 0 0 0 0 0 0 0 0 0 0 0 0 0 0 0 - 0 0 0 0 0
Copepods - Ergasilus 6.86 (2.00) 0 0 0 0 0 6.67
(1.00) 0 0 0 0 0 0 0 0 - 100 0 10.00 (1.00) 0 0
Copepods - Lernanthropuses 0 0 0 0 0 0 0 0 0 0 0 0 0 0 0 - 0 0 0 0 0
Copepods - Lernaeopodidae 0 0 0 0 0 0 0 0 0 0 0 0 0 0 0 - 0 0 0 0 0
Copepods - Hatschekias 0 0 0 0 0 0 0 0 0 0 0 0 0 0 0 - 0 0 0 0 0
Copepods - Bomolochus 0 0 0 0 0 0 0 0 0 0 0 0 0 0 0 - 0 0 0 0 0

Research Fishing and Fish Health Monitoring Program Post-dredging Report Season Ichthys Nearshore Environmental Monitoring Program
Prepared for INPEX Cardno 208
Mullet * DI DO BH AR
Variable BP D1 D2 D3 D4 P1 BP D1 D2 D3 D4 P1 BP D1 D2 D3 D4 P1 BP D1 D2
Copepods - Thyansote 6.86 (3.00) 0 0 0 0 0 0 0 0 0 0 0 0 0 0 - 0 0 0 0 0
Copepods - Naebranchia 0 0 0 0 0 0 0 0 0 0 0 0 0 0 0 - 0 0 0 0 0
Isopods - Gnathiids 0 0 0 0 0 0 0 14.29 (1.00) 0 0 0 0 0 0 0 - 0 0 0 0 0
Isopods - Isopods 0 0 0 0 0 0 0 0 0 0 0 0 0 0 0 - 0 0 0 0 0
Gill - Dactylogyrid monogeneans
6.86 (21) 0 0 100 0 0 46.67
(17.71) 28.57
(20.00) 100 0 0 0 0 0 0 - 100 0 10.00 (8.00) 100 0
Polyopisthocotyid monogeneans
6.86 (1.00) 0 0 0 0 0 0 14.29
(1.00) 0 0 0 0 0 0 0 - 0 0 10.00 (1.00) 0 0
Capsalid monogeneans 0 0 0 0 0 0 0 0 0 0 0 0 0 0 0 - 0 0 0 0 0
Transversotrema digeneans 0 0 0 0 0 0 6.67 (1.00) 0 0 0 0 0 0 0 0 - 0 0 0 0 0
Didymozoid digeneans 0 0 0 0 0 0 0 0 0 0 0 0 0 0 0 - 0 0 0 0 0
Nematodes - Philometrids 0 0 0 0 0 0 0 0 0 0 0 0 0 0 0 - 0 0 0 0 0
Nematodes - Anisakis 0 0 0 0 0 0 0 0 0 0 0 0 0 0 0 - 0 0 0 0 0
Cestodes - Metacestode 0 0 0 0 0 0 0 0 0 0 0 0 0 0 0 - 0 0 0 0 0
Leeches - Hirudines 0 0 0 0 0 0 6.67 (3.00) 0 0 0 0 0 0 50.00
(1.00) 0 - 0 0 0 0 0
Gills hyperplasia 0 0 0 0 0 0 0 0 0 0 0 0 0 0 0 - 0 0 0 0 0
Granulomas (Pooled) 0 0 0 0 0 0 0 0 0 0 0 0 0 0 0 - 0 0 50.00 (1.40 0 0
Gill - Granulomas 0 0 0 0 0 0 0 0 0 0 0 0 0 0 0 - 0 0 0 0 0
Liver - Granulomas 0 0 0 0 0 0 0 0 0 0 0 0 0 0 0 - 0 0 10.00 (1.00) 0 0
Kidney - Granulomas 0 0 0 0 0 0 0 0 0 0 0 0 0 0 0 - 0 0 20.00 (1.00) 0 0
Spleen - Granulomas 0 0 0 0 0 0 0 0 0 0 0 0 0 0 0 - 0 0 40.00 (1.00) 0 0
Metazoa (Pooled) 0 0 0 0 0 0 40.00 (1.25) 0 0 0 0 0 0 0 0 - 0 0 80.00
(1.12) 0 0

Research Fishing and Fish Health Monitoring Program Post-dredging Report Season Ichthys Nearshore Environmental Monitoring Program
Prepared for INPEX Cardno 209
Mullet * DI DO BH AR
Variable BP D1 D2 D3 D4 P1 BP D1 D2 D3 D4 P1 BP D1 D2 D3 D4 P1 BP D1 D2
Gill - Metazoa 0 0 0 0 0 0 40.00 (1.00) 0 0 0 0 0 0 0 0 - 0 0 40.00
(1.00) 0 0
Liver - Metazoa 0 0 0 0 0 0 0 0 0 0 0 0 0 0 0 - 0 0 0 0 0
Kidney - Metazoa 0 0 0 0 0 0 10.00 (1.00) 0 0 0 0 0 0 0 0 - 0 0 50.00
(1.00) 0 0
Spleen - Metazoa 0 0 0 0 0 0 0 0 0 0 0 0 0 0 0 - 0 0 30.00 (1.00) 0 0
Myxos (Pooled) 0 0 0 0 0 0 20.00 (1.00) 0 0 0 0 0 0 0 0 - 0 0 60.00
(1.17) 0 0
Gill - Myxos 0 0 0 0 0 0 20.00 (1.00) 0 0 0 0 0 0 0 0 - 0 0 20.00
(1.00) 0 0
Liver - Protozoa/Myxos 0 0 0 0 0 0 0 0 0 0 0 0 0 0 0 - 0 0 0 0 0
Kidney - Protozoa/Myxos 0 0 0 0 0 0 0 0 0 0 0 0 0 0 0 - 0 0 0 0 0
Spleen - Protozoa/Myxos 0 0 0 0 0 0 0 0 0 0 0 0 0 0 0 - 0 0 20.00 (1.00) 0 0
Cysts/Spheres (Pooled) 0 0 0 0 0 0 0 0 0 0 0 0 0 0 0 - 0 0 20.00 (1.00) 0 0
Gill - Cysts 0 0 0 0 0 0 0 0 0 0 0 0 0 0 0 - 0 0 20.00 (1.00) 0 0
Kidney - Spheres 0 0 0 0 0 0 0 0 0 0 0 0 0 0 0 - 0 0 0 0 0
Spleen - Cysts 0 0 0 0 0 0 0 0 0 0 0 0 0 0 0 - 0 0 0 0 0
Haemorrage (Pooled) 9.60 (1.00) 0 0 0 0 0 10.00
(1.00) 0 0 0 0 0 0 0 0 - 0 0 30.00 (1.33) 0 0
Liver - Haemorrhage 0 0 0 0 0 0 10.00 (1.00) 0 0 0 0 0 0 0 0 - 0 0 20.00
(1.00) 0 0
Kidney - Haemorrhage 9.60 (1.00) 0 0 0 0 0 0 0 0 0 0 0 0 0 0 - 0 0 20.00
(1.00) 0 0
Spleen - Haemorrhage 0 0 0 0 0 0 0 0 0 0 0 0 0 0 0 - 0 0 0 0 0
Bacteria (Pooled) 0 0 0 0 0 0 0 0 0 0 0 0 0 0 0 - 0 0 0 0 0
Liver - Bacteria 0 0 0 0 0 0 0 0 0 0 0 0 0 0 0 - 0 0 0 0 0
Kidney - Bacteria 0 0 0 0 0 0 0 0 0 0 0 0 0 0 0 - 0 0 0 0 0

Research Fishing and Fish Health Monitoring Program Post-dredging Report Season Ichthys Nearshore Environmental Monitoring Program
Prepared for INPEX Cardno 210
Mullet * DI DO BH AR
Variable BP D1 D2 D3 D4 P1 BP D1 D2 D3 D4 P1 BP D1 D2 D3 D4 P1 BP D1 D2
Spleen – Bacteria rickettsia 0 0 0 0 0 0 0 0 0 0 0 0 0 0 0 - 0 0 0 0 0
Blood fluke (Pooled) 0 0 0 0 0 0 0 0 0 0 0 0 0 0 0 - 0 0 0 0 0
Gill - Blood fluke eggs 0 0 0 0 0 0 0 0 0 0 0 0 0 0 0 - 0 0 0 0 0
Liver - Blood fluke 0 0 0 0 0 0 0 0 0 0 0 0 0 0 0 - 0 0 0 0 0
Kidney - Blood fluke 0 0 0 0 0 0 0 0 0 0 0 0 0 0 0 - 0 0 0 0 0
Pigment deposition (Pooled) 0 0 0 0 0 0 0 0 0 0 0 0 0 0 0 - 0 0 0 0 0
Liver - Pigment 0 0 0 0 0 0 0 0 0 0 0 0 0 0 0 - 0 0 0 0 0
Kidney - Pigment 0 0 0 0 0 0 0 0 0 0 0 0 0 0 0 - 0 0 0 0 0
Spleen - Pigment 0 0 0 0 0 0 0 0 0 0 0 0 0 0 0 - 0 0 0 0 0
Gill - Epitheliocystis 0 0 0 0 0 0 20.00 (1.00) 0 0 0 0 0 0 0 0 - 0 0 10.00
(1.00) 0 0
Liver - Clear cell foci 0 0 0 0 0 0 0 0 0 0 0 0 0 0 0 - 0 0 0 0 0
Spleen - Vacuoles 0 0 0 0 0 0 0 0 0 0 0 0 0 0 0 - 0 0 0 0 0
Spleen - Scar tissue 0 0 0 0 0 0 0 0 0 0 0 0 0 0 0 - 0 0 0 0 0
Internal Myxos/Protozoa 0 0 0 0 0 0 20.00 (1.00) 0 0 0 0 0 0 0 0 - 0 0 30.00
(1.33) 0 0
Gill - Normal 0 0 0 0 0 0 0 0 0 0 0 0 0 0 0 - 0 0 0 0 0
Gill - Post mortem autolysis 0 0 0 0 0 0 0 0 0 0 0 0 0 0 0 - 0 0 0 0 0
Gill - Congestion 0 0 0 0 0 0 0 0 0 0 0 0 0 0 0 - 0 0 0 0 0
Liver - Normal 0 0 0 0 0 0 0 0 0 0 0 0 0 0 0 - 0 0 0 0 0
Liver - Post mortem autolysis/necrosis 0 0 0 0 0 0 0 0 0 0 0 0 0 0 0 - 0 0 0 0 0
Kidney - Normal 0 0 0 0 0 0 0 0 0 0 0 0 0 0 0 - 0 0 0 0 0
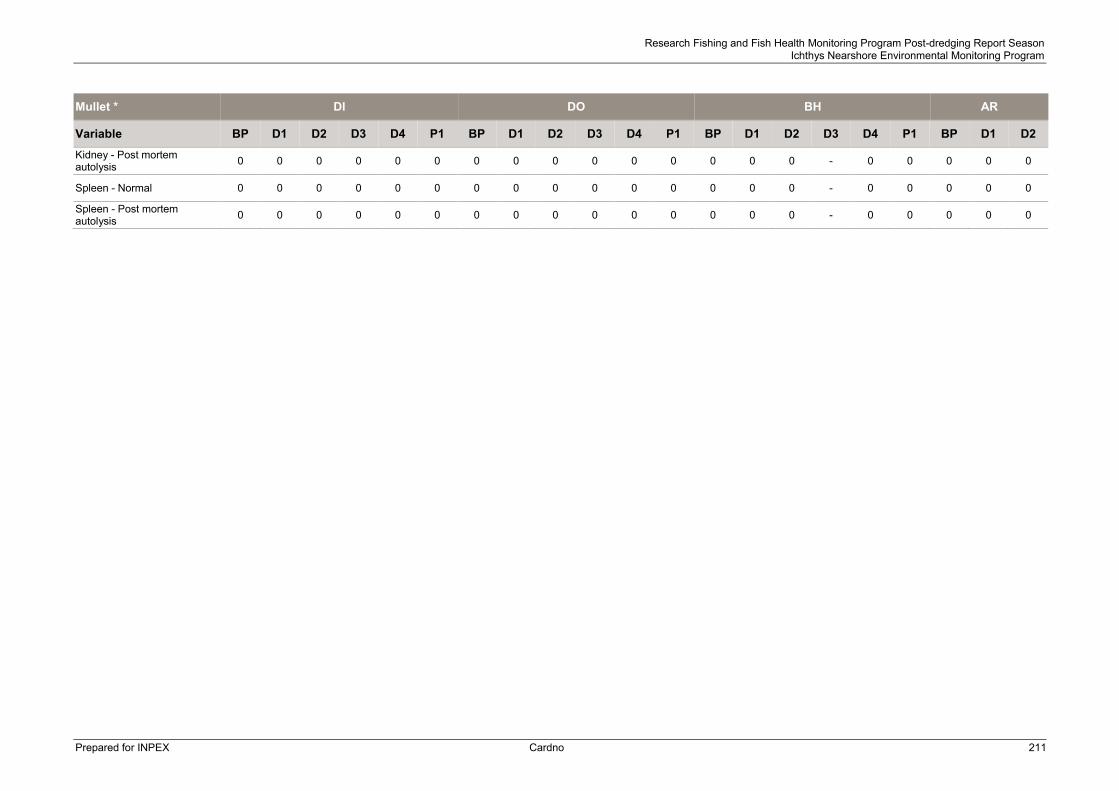
Research Fishing and Fish Health Monitoring Program Post-dredging Report Season Ichthys Nearshore Environmental Monitoring Program
Prepared for INPEX Cardno 211
Mullet * DI DO BH AR
Variable BP D1 D2 D3 D4 P1 BP D1 D2 D3 D4 P1 BP D1 D2 D3 D4 P1 BP D1 D2 Kidney - Post mortem autolysis 0 0 0 0 0 0 0 0 0 0 0 0 0 0 0 - 0 0 0 0 0
Spleen - Normal 0 0 0 0 0 0 0 0 0 0 0 0 0 0 0 - 0 0 0 0 0
Spleen - Post mortem autolysis 0 0 0 0 0 0 0 0 0 0 0 0 0 0 0 - 0 0 0 0 0

Research Fishing and Fish Health Monitoring Program Post-dredging Report Season Ichthys Nearshore Environmental Monitoring Program
Prepared for INPEX Cardno 212
Queenfish * DI DO BH AR
Variable BP D1 D2 D3 D4 P1 BP D1 D2 D3 D4 P1 BP D1 D2 D3 D4 P1 BP D1 D2
Number sampled in the field 9 9 7 16 4 8 10 6 16 3 5 3 4 5 4 - 12 6 0 1 1
Average length sampled in the field (SE)
49.5 (2.3)
45.6 (4.2)
49.5 (4.3)
48.7 (2.2)
50.8 (2.2)
51.4 (6.0)
55.3 (2.2)
46.9 (3.0)
51.1 (3.6)
42.4 (6.1)
46.2 (4.2)
46.1 (9.8)
41.0 (3.2)
43.9 (3.9)
42.7 (4.82) - 47.8
(1.7) 40.7 (2.6) 0 71.1
(NA) 76.1 (NA)
Average length examined in the laboratory (SE)
49.5 (2.3)
45.6 (4.2)
53.1 (5.1)
49.6 (2.8)
50.8 (2.2)
51.4 (6.0)
55.3 (2.2)
46.9 (3.0)
55.1 (7.6)
42.4 (6.1)
46.2 (4.2)
46.1 (9.8)
41.0 (3.2)
43.9 (3.9)
42.7 (4.8) - 48.2
(1.8) 40.7 (2.6) 0 71.1
(NA) 76.1 (NA)
Proportion observed abnormal 11.11 0 0 0 25 0 0 0 0 0 0 0 0 0 0 - 0 0 0 0 100
Number examined in the laboratory 9 9 5 12 4 8 10 6 5 3 5 3 4 5 4 - 11 6 0 1 1
Number examined by histopathology 9 5 5 10 4 7 10 6 5 3 5 3 4 5 4 - 11 6 0 1 1
Protozoa/Myxozoa (Internal and External Pooled) 0 0 20.00
(1.00) 16.67 (1.00) 0 0 0 0 0 66.67
(1.00) 0 0 0 0 0 - 0 0 0 0 0
Protozoa/Myxozoa (External) 0 0 0 16.67
(1.00) 0 0 0 0 0 66.67 (1.00) 0 0 0 0 0 - 0 0 0 0 0
Cryptocaryon 0 0 0 0 25.00 (1.00) 0 0 0 0 0 0 0 0 0 0 - 0 0 0 0 0
Copepods - Argulus 0 0 0 16.67 (1.00) 0 0 0 0 0 0 0 0 0 0 0 - 0 0 0 0 0
Caligid copepods (Pooled) 77.78 (6.00)
88.89 (2.88)
40.00 (1.00)
75.00 (6.00)
25.00 (3.00) 100 70.00
(6.00) 66.67 (1.50)
60.00 (1.33)
66.67 (1.00)
40.00 (1.50)
33.30 (4.00) 100 60.00
(1.67) 50.00 (5.00) - 9.09
(1.00) 33.30 (2.50) 0 100 100
Caligus sp1 55.56 (1.80)
88.89 (2.62)
40.00 (1.00)
50.00 (3.33)
25.00 (3.00) 100 60.00
(1.83) 66.67 (1.50)
60.00 (1.33)
33.33 (1.00) 0 0 50.00
(2.00) 40.00 (2.00)
50.00 (4.5) - 9.09
(1.00) 33.3
(2.00) 0 100 100
Caligus sp2 55.56 (6.60)
11.11 (2.00) 0 58.33
(4.86) 0 87.50 (2.14)
50.00 (6.20) 0 0 33.33
(1.00) 40.00 (1.50)
33.30 (4.00) 100 20.00
(1.00) 25.00 (1.00) - 0 16.70
(1.00) 0 0 0
Gill tip copepods 0 0 0 0 0 0 0 0 0 0 0 0 0 0 0 - 0 0 0 0 0
Copepods - Brachiellas 0 0 0 0 0 0 0 0 0 0 0 0 0 0 0 - 0 0 0 0 0
Copepods - Ergasilus 0 0 0 0 0 12.50 (1.00) 0 0 0 0 0 0 0 0 0 - 0 0 0 0 0
Copepods - Lernanthropuses 0 11.11
(2.00) 0 0 0 0 10.00 (1.00) 0 0 0 0 0 0 0 0 - 0 0 0 100 0
Copepods - Lernaeopodidae 0 0 0 0 0 0 0 0 0 0 0 0 0 0 0 - 0 0 0 0 0
Copepods - Hatschekias 0 0 0 0 0 0 0 0 0 0 0 0 0 0 0 - 0 0 0 0 0
Copepods - Bomolochus 0 0 0 0 0 0 0 0 0 0 0 0 0 0 0 - 0 0 0 0 0

Research Fishing and Fish Health Monitoring Program Post-dredging Report Season Ichthys Nearshore Environmental Monitoring Program
Prepared for INPEX Cardno 213
Queenfish * DI DO BH AR
Variable BP D1 D2 D3 D4 P1 BP D1 D2 D3 D4 P1 BP D1 D2 D3 D4 P1 BP D1 D2
Copepods - Thyansote 0 0 0 0 0 0 0 0 0 0 0 0 0 0 0 - 0 0 0 0 0
Copepods - Naebranchia 0 0 0 0 0 0 0 0 0 0 0 0 0 0 0 - 0 0 0 0 0
Isopods - Gnathiids 0 0 0 8.33 (1.00) 0 0 0 0 0 0 0 0 0 0 0 - 0 0 0 0 0
Isopods - Isopods 0 0 0 8.33 (1.00) 0 0 0 0 0 0 0 0 0 0 0 - 0 0 0 0 0
Gill - Dactylogyrid monogeneans 0 0 0 8.33
(87.00) 0 0 0 0 0 0 0 0 25.00 (3.00) 0 0 - 0 0 0 0 0
Polyopisthocotyid monogeneans
55.56 (2.00)
66.67 (2.33)
40.00 (2.50)
58.33 (3.14)
25.00 (4.00)
50.00 (1.50)
60.00 (4.67)
16.67 (1.00)
40.00 (2.50)
66.67 (1.50)
20.00 (1.00)
33.30 (1.00)
75.00 (2.33) 0 0 - 18.18
(1.50) 33.30 (1.00) 0 100 100
Capsalid monogeneans 0 0 0 16.67 (1.50)
25.00 (1.00)
12.50 (2.00)
10.00 (3.00) 0 0 0 0 0 25.00
(1.00) 20.00 (1.00) 0 - 0 33.30
(1.00) 0 0 0
Transversotrema digeneans 0 0 0 0 0 0 0 0 0 0 0 0 0 0 0 - 0 0 0 0 0
Didymozoid digeneans 0 0 0 0 0 0 0 0 0 0 0 0 0 0 0 - 0 0 0 0 0
Nematodes - Philometrids 0 0 0 25 (7) 0 0 0 0 0 0 0 0 0 0 0 - 0 0 0 0 0
Nematodes - Anisakis 0 0 0 0 0 0 0 0 0 0 0 0 0 0 0 - 9.09 (5.00) 0 0 0 0
Cestodes - Metacestode 88.89 (8.62)
88.89 (8.25) 100 91.67
(6.64) 100 100 100 66.67 (12.75) 100 66.67
(7.00) 100 100 75.00 (21.33) 100 100 - 100 100 0 100 100
Leeches - Hirudines 0 0 0 0 0 0 0 0 0 0 0 0 0 0 0 - 0 0 0 0 0
Gills hyperplasia 0 0 0 0 0 0 0 0 0 0 0 0 0 0 0 - 0 0 0 0 0
Granulomas (Pooled) 0 20.00 (1.00)
20.00 (1.00)
30.00 (1.67) 0 0 0 16.67
(1.00) 0 0 0 33.30 (1.00) 0 0 50.00
(1.00) - 9.09 (1.00) 0 0 0 0
Gill - Granulomas 0 0 0 20.00 (1.00) 0 0 0 0 0 0 0 0 0 0 0 - 0 0 0 0 0
Liver - Granulomas 0 20.00 (1.00)
20.00 (1.00)
20.00 (1.00) 0 0 0 16.67
(1.00) 0 0 0 33.30 (1.00) 0 0 50.00
(1.00) - 9.09 (1.00) 0 0 0 0
Kidney - Granulomas 0 0 0 10.00 (1.00) 0 0 0 0 0 0 0 0 0 0 0 - 0 0 0 0 0
Spleen - Granulomas 0 0 0 0 0 0 0 0 0 0 0 0 0 0 0 - 0 0 0 0 0
Metazoa (Pooled) 11.11 (1.00)
20.00 (1.00)
40.00 (1.50)
30.00 (1.00)
25.00 (1.00) 0 0 0 40.00
(1.00) 33.33 (1.00)
80.00 (1.00)
33.3 (1.00)
25.00 (1.00) 0 50.00
(1.00) - 9.09 (1.00) 0 0 0 0
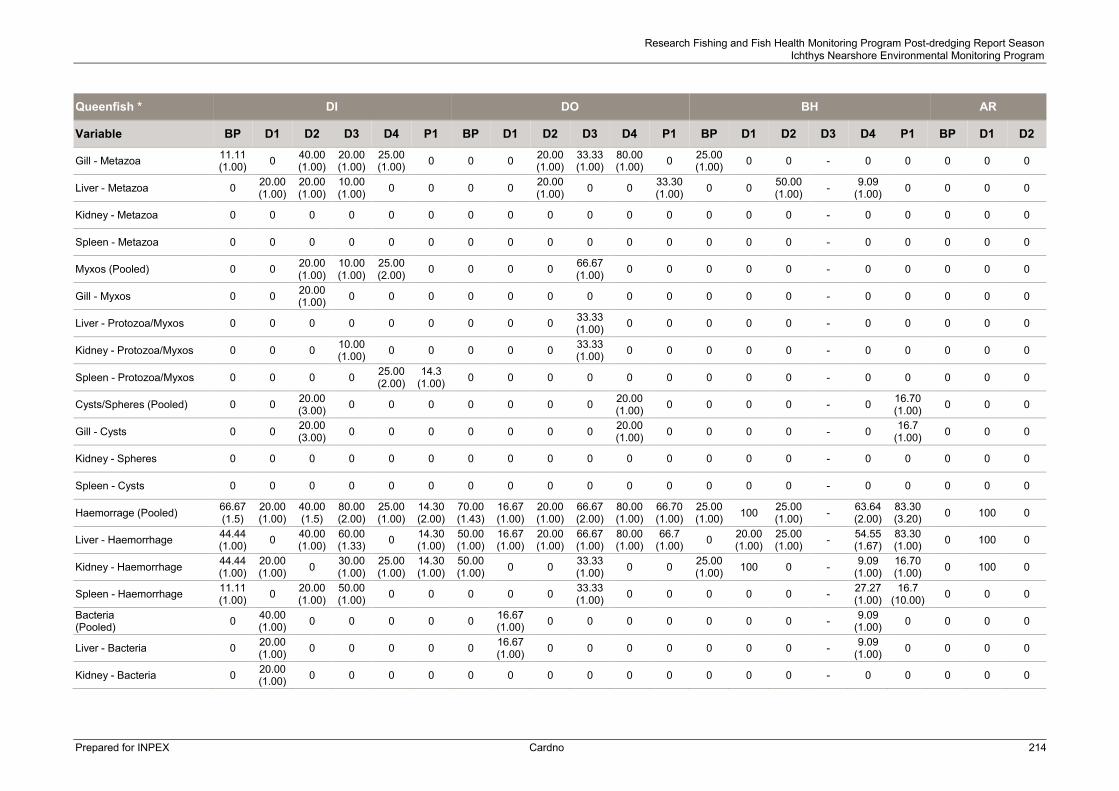
Research Fishing and Fish Health Monitoring Program Post-dredging Report Season Ichthys Nearshore Environmental Monitoring Program
Prepared for INPEX Cardno 214
Queenfish * DI DO BH AR
Variable BP D1 D2 D3 D4 P1 BP D1 D2 D3 D4 P1 BP D1 D2 D3 D4 P1 BP D1 D2
Gill - Metazoa 11.11 (1.00) 0 40.00
(1.00) 20.00 (1.00)
25.00 (1.00) 0 0 0 20.00
(1.00) 33.33 (1.00)
80.00 (1.00) 0 25.00
(1.00) 0 0 - 0 0 0 0 0
Liver - Metazoa 0 20.00 (1.00)
20.00 (1.00)
10.00 (1.00) 0 0 0 0 20.00
(1.00) 0 0 33.30 (1.00) 0 0 50.00
(1.00) - 9.09 (1.00) 0 0 0 0
Kidney - Metazoa 0 0 0 0 0 0 0 0 0 0 0 0 0 0 0 - 0 0 0 0 0
Spleen - Metazoa 0 0 0 0 0 0 0 0 0 0 0 0 0 0 0 - 0 0 0 0 0
Myxos (Pooled) 0 0 20.00 (1.00)
10.00 (1.00)
25.00 (2.00) 0 0 0 0 66.67
(1.00) 0 0 0 0 0 - 0 0 0 0 0
Gill - Myxos 0 0 20.00 (1.00) 0 0 0 0 0 0 0 0 0 0 0 0 - 0 0 0 0 0
Liver - Protozoa/Myxos 0 0 0 0 0 0 0 0 0 33.33 (1.00) 0 0 0 0 0 - 0 0 0 0 0
Kidney - Protozoa/Myxos 0 0 0 10.00 (1.00) 0 0 0 0 0 33.33
(1.00) 0 0 0 0 0 - 0 0 0 0 0
Spleen - Protozoa/Myxos 0 0 0 0 25.00 (2.00)
14.3 (1.00) 0 0 0 0 0 0 0 0 0 - 0 0 0 0 0
Cysts/Spheres (Pooled) 0 0 20.00 (3.00) 0 0 0 0 0 0 0 20.00
(1.00) 0 0 0 0 - 0 16.70 (1.00) 0 0 0
Gill - Cysts 0 0 20.00 (3.00) 0 0 0 0 0 0 0 20.00
(1.00) 0 0 0 0 - 0 16.7 (1.00) 0 0 0
Kidney - Spheres 0 0 0 0 0 0 0 0 0 0 0 0 0 0 0 - 0 0 0 0 0
Spleen - Cysts 0 0 0 0 0 0 0 0 0 0 0 0 0 0 0 - 0 0 0 0 0
Haemorrage (Pooled) 66.67 (1.5)
20.00 (1.00)
40.00 (1.5)
80.00 (2.00)
25.00 (1.00)
14.30 (2.00)
70.00 (1.43)
16.67 (1.00)
20.00 (1.00)
66.67 (2.00)
80.00 (1.00)
66.70 (1.00)
25.00 (1.00) 100 25.00
(1.00) - 63.64 (2.00)
83.30 (3.20) 0 100 0
Liver - Haemorrhage 44.44 (1.00) 0 40.00
(1.00) 60.00 (1.33) 0 14.30
(1.00) 50.00 (1.00)
16.67 (1.00)
20.00 (1.00)
66.67 (1.00)
80.00 (1.00)
66.7 (1.00) 0 20.00
(1.00) 25.00 (1.00) - 54.55
(1.67) 83.30 (1.00) 0 100 0
Kidney - Haemorrhage 44.44 (1.00)
20.00 (1.00) 0 30.00
(1.00) 25.00 (1.00)
14.30 (1.00)
50.00 (1.00) 0 0 33.33
(1.00) 0 0 25.00 (1.00) 100 0 - 9.09
(1.00) 16.70 (1.00) 0 100 0
Spleen - Haemorrhage 11.11 (1.00) 0 20.00
(1.00) 50.00 (1.00) 0 0 0 0 0 33.33
(1.00) 0 0 0 0 0 - 27.27 (1.00)
16.7 (10.00) 0 0 0
Bacteria (Pooled) 0 40.00
(1.00) 0 0 0 0 0 16.67 (1.00) 0 0 0 0 0 0 0 - 9.09
(1.00) 0 0 0 0
Liver - Bacteria 0 20.00 (1.00) 0 0 0 0 0 16.67
(1.00) 0 0 0 0 0 0 0 - 9.09 (1.00) 0 0 0 0
Kidney - Bacteria 0 20.00 (1.00) 0 0 0 0 0 0 0 0 0 0 0 0 0 - 0 0 0 0 0
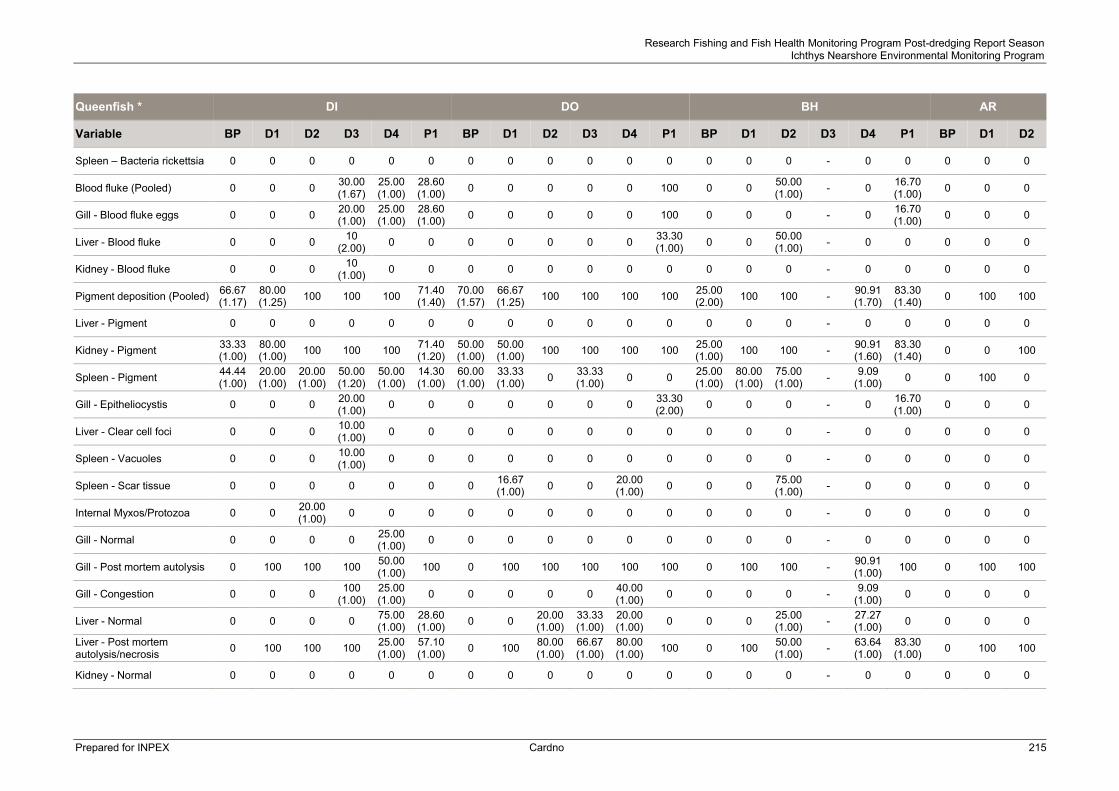
Research Fishing and Fish Health Monitoring Program Post-dredging Report Season Ichthys Nearshore Environmental Monitoring Program
Prepared for INPEX Cardno 215
Queenfish * DI DO BH AR
Variable BP D1 D2 D3 D4 P1 BP D1 D2 D3 D4 P1 BP D1 D2 D3 D4 P1 BP D1 D2
Spleen – Bacteria rickettsia 0 0 0 0 0 0 0 0 0 0 0 0 0 0 0 - 0 0 0 0 0
Blood fluke (Pooled) 0 0 0 30.00 (1.67)
25.00 (1.00)
28.60 (1.00) 0 0 0 0 0 100 0 0 50.00
(1.00) - 0 16.70 (1.00) 0 0 0
Gill - Blood fluke eggs 0 0 0 20.00 (1.00)
25.00 (1.00)
28.60 (1.00) 0 0 0 0 0 100 0 0 0 - 0 16.70
(1.00) 0 0 0
Liver - Blood fluke 0 0 0 10 (2.00) 0 0 0 0 0 0 0 33.30
(1.00) 0 0 50.00 (1.00) - 0 0 0 0 0
Kidney - Blood fluke 0 0 0 10 (1.00) 0 0 0 0 0 0 0 0 0 0 0 - 0 0 0 0 0
Pigment deposition (Pooled) 66.67 (1.17)
80.00 (1.25) 100 100 100 71.40
(1.40) 70.00 (1.57)
66.67 (1.25) 100 100 100 100 25.00
(2.00) 100 100 - 90.91 (1.70)
83.30 (1.40) 0 100 100
Liver - Pigment 0 0 0 0 0 0 0 0 0 0 0 0 0 0 0 - 0 0 0 0 0
Kidney - Pigment 33.33 (1.00)
80.00 (1.00) 100 100 100 71.40
(1.20) 50.00 (1.00)
50.00 (1.00) 100 100 100 100 25.00
(1.00) 100 100 - 90.91 (1.60)
83.30 (1.40) 0 0 100
Spleen - Pigment 44.44 (1.00)
20.00 (1.00)
20.00 (1.00)
50.00 (1.20)
50.00 (1.00)
14.30 (1.00)
60.00 (1.00)
33.33 (1.00) 0 33.33
(1.00) 0 0 25.00 (1.00)
80.00 (1.00)
75.00 (1.00) - 9.09
(1.00) 0 0 100 0
Gill - Epitheliocystis 0 0 0 20.00 (1.00) 0 0 0 0 0 0 0 33.30
(2.00) 0 0 0 - 0 16.70 (1.00) 0 0 0
Liver - Clear cell foci 0 0 0 10.00 (1.00) 0 0 0 0 0 0 0 0 0 0 0 - 0 0 0 0 0
Spleen - Vacuoles 0 0 0 10.00 (1.00) 0 0 0 0 0 0 0 0 0 0 0 - 0 0 0 0 0
Spleen - Scar tissue 0 0 0 0 0 0 0 16.67 (1.00) 0 0 20.00
(1.00) 0 0 0 75.00 (1.00) - 0 0 0 0 0
Internal Myxos/Protozoa 0 0 20.00 (1.00) 0 0 0 0 0 0 0 0 0 0 0 0 - 0 0 0 0 0
Gill - Normal 0 0 0 0 25.00 (1.00) 0 0 0 0 0 0 0 0 0 0 - 0 0 0 0 0
Gill - Post mortem autolysis 0 100 100 100 50.00 (1.00) 100 0 100 100 100 100 100 0 100 100 - 90.91
(1.00) 100 0 100 100
Gill - Congestion 0 0 0 100 (1.00)
25.00 (1.00) 0 0 0 0 0 40.00
(1.00) 0 0 0 0 - 9.09 (1.00) 0 0 0 0
Liver - Normal 0 0 0 0 75.00 (1.00)
28.60 (1.00) 0 0 20.00
(1.00) 33.33 (1.00)
20.00 (1.00) 0 0 0 25.00
(1.00) - 27.27 (1.00) 0 0 0 0
Liver - Post mortem autolysis/necrosis 0 100 100 100 25.00
(1.00) 57.10 (1.00) 0 100 80.00
(1.00) 66.67 (1.00)
80.00 (1.00) 100 0 100 50.00
(1.00) - 63.64 (1.00)
83.30 (1.00) 0 100 100
Kidney - Normal 0 0 0 0 0 0 0 0 0 0 0 0 0 0 0 - 0 0 0 0 0

Research Fishing and Fish Health Monitoring Program Post-dredging Report Season Ichthys Nearshore Environmental Monitoring Program
Prepared for INPEX Cardno 216
Queenfish * DI DO BH AR
Variable BP D1 D2 D3 D4 P1 BP D1 D2 D3 D4 P1 BP D1 D2 D3 D4 P1 BP D1 D2 Kidney - Post mortem autolysis 0 100 80.00
(1.00) 100
(1.00) 25.00 (1.00)
57.10 (1.00) 0 100 100 100 80.00
(1.00) 100 0 60.00 (1.00) 100 - 72.73
(1.00) 50.00 (1.00) 0 100 100
Spleen - Normal 0 0 20.00 (1.00) 0 25.00
(1.00) 28.60 (1.00) 0 0 40.00
(1.00) 0 20.00 (1.00) 100 0 0 25.00
(1.00) - 27.27 (1.00)
50.00 (1.00) 0 0 100
Spleen - Post mortem autolysis 0 100 60.00
(1.00) 90.00 (1.00)
50.00 (1.00)
28.60 (1.00) 0 83.33
(1.00) 60.00 (1.00) 100 40.00
(1.00) 0 0 100 50.00 (1.00) - 45.45
(1.00) 16.70 (1.00) 0 100 0

Research Fishing and Fish Health Monitoring Program Post-dredging Report Season Ichthys Nearshore Environmental Monitoring Program
Prepared for INPEX Cardno 217
Shortfin batfish DI DO BH AR
Variable BP D1 D2 D3 D4 P1 BP D1 D2 D3 D4 P1 BP D1 D2 D3 D4 P1 BP D1 D2
Number sampled in the field 4 0 1 16 5 1 23 0 1 3 1 4 17 2 3 - 6 16 12 2 0
Average length sampled in the field (SE)
24.4 (0.6) 0 26.1
(NA) 25.7 (0.9)
25.0 (1.6)
23.4 (NA)
24.3 (1.1) 0 25.7
(NA) 21.7 (2.4)
22.5 (NA)
25.8 (1.4)
27.0 (0.5)
23.9 (0.5)
25.1 (2.2) - 24.7
(1.1) 26.2 (1.0)
29.1 (0.5)
24.9 (1.6) 0
Average length examined in the laboratory (SE)
24.4 (0.6) 0 NaN
(NA) NaN (NA)
NaN (NA)
NaN (NA)
24.3 (1.1) 0 NaN
(NA) NaN (NA)
NaN (NA)
NaN (NA)
28.2 (1.0)
NaN (NA)
NaN (NA) - NaN
(NA) NaN (NA)
28.5 (0.8)
24.9 (1.3) 0
Proportion observed abnormal 0 0 0 0 0 0 0 0 0 0 0 0 0 0 0 - 0 0 0 0 0
Number examined in the laboratory 4 0 0 0 0 0 7 0 0 0 0 0 5 0 0 - 0 0 3 2 0
Number examined by histopathology 2 0 0 0 0 0 1 0 0 0 0 0 1 0 0 - 0 0 3 0 0
Protozoa/Myxozoa (Internal and External Pooled) 0 0 0 0 0 0 0 0 0 0 0 0 0 0 0 - 0 0 0 0 0
Protozoa/Myxozoa (External) 0 0 0 0 0 0 0 0 0 0 0 0 0 0 0 - 0 0 0 0 0
Cryptocaryon 0 0 0 0 0 0 0 0 0 0 0 0 0 0 0 - 0 0 0 0 0
Copepods - Argulus 0 0 0 0 0 0 0 0 0 0 0 0 0 0 0 - 0 0 0 0 0
Caligid copepods (Pooled) 0 0 0 0 0 0 14.30 (4.00) 0 0 0 0 0 0 0 0 - 0 0 0 0 0
Caligus sp1 0 0 0 0 0 0 14.30 (4.00) 0 0 0 0 0 0 0 0 - 0 0 0 0 0
Caligus sp2 0 0 0 0 0 0 0 0 0 0 0 0 0 0 0 - 0 0 0 0 0
Gill tip copepods 0 0 0 0 0 0 0 0 0 0 0 0 0 0 0 - 0 0 0 0 0
Copepods - Brachiellas 0 0 0 0 0 0 0 0 0 0 0 0 0 0 0 - 0 0 0 0 0
Copepods - Ergasilus 25.00 (1.00) 0 0 0 0 0 0 0 0 0 0 0 0 0 0 - 0 0 0 0 0
Copepods - Lernanthropuses 0 0 0 0 0 0 0 0 0 0 0 0 0 0 0 - 0 0 0 0 0
Copepods - Lernaeopodidae 0 0 0 0 0 0 0 0 0 0 0 0 0 0 0 - 0 0 0 0 0
Copepods - Hatschekias 0 0 0 0 0 0 0 0 0 0 0 0 0 0 0 - 0 0 0 0 0
Copepods - Bomolochus 0 0 0 0 0 0 0 0 0 0 0 0 0 0 0 - 0 0 0 0 0

Research Fishing and Fish Health Monitoring Program Post-dredging Report Season Ichthys Nearshore Environmental Monitoring Program
Prepared for INPEX Cardno 218
Shortfin batfish DI DO BH AR
Variable BP D1 D2 D3 D4 P1 BP D1 D2 D3 D4 P1 BP D1 D2 D3 D4 P1 BP D1 D2
Copepods - Thyansote 0 0 0 0 0 0 0 0 0 0 0 0 0 0 0 - 0 0 0 0 0
Isopods - Gnathiids 0 0 0 0 0 0 57.10 (2.50) 0 0 0 0 0 0 0 0 - 0 0 33.30
(10.00) 50.00 (2.00) 0
Isopods - Isopods 0 0 0 0 0 0 0 0 0 0 0 0 0 0 0 - 0 0 0 0 0
Gill - Dactylogyrid monogeneans 0 0 0 0 0 0 57.10
(5.50) 0 0 0 0 0 0 0 0 - 0 0 0 50.00 (5.00) 0
Polyopisthocotyid monogeneans 0 0 0 0 0 0 0 0 0 0 0 0 0 0 0 - 0 0 0 0 0
Capsalid monogeneans 0 0 0 0 0 0 0 0 0 0 0 0 0 0 0 - 0 0 0 0 0
Transversotrema digeneans 0 0 0 0 0 0 0 0 0 0 0 0 0 0 0 - 0 0 0 0 0
Didymozoid digeneans 0 0 0 0 0 0 0 0 0 0 0 0 0 0 0 - 0 0 0 0 0
Nematodes - Philometrids 0 0 0 0 0 0 0 0 0 0 0 0 0 0 0 - 0 0 33.30 (2.00) 0 0
Nematodes - Anisakis 0 0 0 0 0 0 14.30 (2.00) 0 0 0 0 0 0 0 0 - 0 0 0 0 0
Cestodes - Metacestode 0 0 0 0 0 0 0 0 0 0 0 0 0 0 0 - 0 0 33.30 (1.00) 0 0
Leeches - Hirudines 0 0 0 0 0 0 0 0 0 0 0 0 0 0 0 - 0 0 0 0 0
Gills hyperplasia 0 0 0 0 0 0 0 0 0 0 0 0 0 0 0 - 0 0 0 0 0
Granulomas (Pooled) 0 0 0 0 0 0 0 0 0 0 0 0 0 0 0 - 0 0 66.70 (1.00) 0 0
Gill - Granulomas 0 0 0 0 0 0 0 0 0 0 0 0 0 0 0 - 0 0 0 0 0
Liver - Granulomas 0 0 0 0 0 0 0 0 0 0 0 0 0 0 0 - 0 0 0 0 0
Kidney - Granulomas 0 0 0 0 0 0 0 0 0 0 0 0 0 0 0 - 0 0 66.70 (1.00) 0 0
Spleen - Granulomas 0 0 0 0 0 0 0 0 0 0 0 0 0 0 0 - 0 0 0 0 0
Metazoa (Pooled) 0 0 0 0 0 0 0 0 0 0 0 0 0 0 0 - 0 0 33.30 (1.00) 0 0
Gill - Metazoa 0 0 0 0 0 0 0 0 0 0 0 0 0 0 0 - 0 0 0 0 0

Research Fishing and Fish Health Monitoring Program Post-dredging Report Season Ichthys Nearshore Environmental Monitoring Program
Prepared for INPEX Cardno 219
Shortfin batfish DI DO BH AR
Variable BP D1 D2 D3 D4 P1 BP D1 D2 D3 D4 P1 BP D1 D2 D3 D4 P1 BP D1 D2
Liver - Metazoa 0 0 0 0 0 0 0 0 0 0 0 0 0 0 0 - 0 0 0 0 0
Kidney - Metazoa 0 0 0 0 0 0 0 0 0 0 0 0 0 0 0 - 0 0 33.30 (1.00) 0 0
Spleen - Metazoa 0 0 0 0 0 0 0 0 0 0 0 0 0 0 0 - 0 0 0 0 0
Myxos (Pooled) 0 0 0 0 0 0 0 0 0 0 0 0 0 0 0 - 0 0 0 0 0
Gill - Myxos 0 0 0 0 0 0 0 0 0 0 0 0 0 0 0 - 0 0 0 0 0
Liver - Protozoa/Myxos 0 0 0 0 0 0 0 0 0 0 0 0 0 0 0 - 0 0 0 0 0
Kidney - Protozoa/Myxos 0 0 0 0 0 0 0 0 0 0 0 0 0 0 0 - 0 0 0 0 0
Spleen - Protozoa/Myxos 0 0 0 0 0 0 0 0 0 0 0 0 0 0 0 - 0 0 0 0 0
Cysts/Spheres (Pooled) 0 0 0 0 0 0 0 0 0 0 0 0 0 0 0 - 0 0 0 0 0
Gill - Cysts 0 0 0 0 0 0 0 0 0 0 0 0 0 0 0 - 0 0 0 0 0
Kidney - Spheres 0 0 0 0 0 0 0 0 0 0 0 0 0 0 0 - 0 0 0 0 0
Spleen - Cysts 0 0 0 0 0 0 0 0 0 0 0 0 0 0 0 - 0 0 0 0 0
Haemorrage (Pooled) 0 0 0 0 0 0 0 0 0 0 0 0 0 0 0 - 0 0 0 0 0
Liver - Haemorrhage 0 0 0 0 0 0 0 0 0 0 0 0 0 0 0 - 0 0 0 0 0
Kidney - Haemorrhage 0 0 0 0 0 0 0 0 0 0 0 0 0 0 0 - 0 0 0 0 0
Spleen - Haemorrhage 0 0 0 0 0 0 0 0 0 0 0 0 0 0 0 - 0 0 0 0 0
Bacteria (Pooled) 0 0 0 0 0 0 0 0 0 0 0 0 0 0 0 - 0 0 0 0 0
Liver - Bacteria 0 0 0 0 0 0 0 0 0 0 0 0 0 0 0 - 0 0 0 0 0
Kidney - Bacteria 0 0 0 0 0 0 0 0 0 0 0 0 0 0 0 - 0 0 0 0 0
Spleen – Bacteria rickettsia 0 0 0 0 0 0 0 0 0 0 0 0 0 0 0 - 0 0 0 0 0

Research Fishing and Fish Health Monitoring Program Post-dredging Report Season Ichthys Nearshore Environmental Monitoring Program
Prepared for INPEX Cardno 220
Shortfin batfish DI DO BH AR
Variable BP D1 D2 D3 D4 P1 BP D1 D2 D3 D4 P1 BP D1 D2 D3 D4 P1 BP D1 D2
Blood fluke (Pooled) 0 0 0 0 0 0 0 0 0 0 0 0 0 0 0 - 0 0 0 0 0
Gill - Blood fluke eggs 0 0 0 0 0 0 0 0 0 0 0 0 0 0 0 - 0 0 0 0 0
Liver - Blood fluke 0 0 0 0 0 0 0 0 0 0 0 0 0 0 0 - 0 0 0 0 0
Kidney - Blood fluke 0 0 0 0 0 0 0 0 0 0 0 0 0 0 0 - 0 0 0 0 0
Pigment deposition (Pooled) 0 0 0 0 0 0 100 0 0 0 0 0 0 0 0 - 0 0 100 0 0
Liver - Pigment 0 0 0 0 0 0 0 0 0 0 0 0 0 0 0 - 0 0 0 0 0
Kidney - Pigment 0 0 0 0 0 0 100 0 0 0 0 0 0 0 0 - 0 0 100 0 0
Spleen - Pigment 0 0 0 0 0 0 0 0 0 0 0 0 0 0 0 - 0 0 66.70 (1.00) 0 0
Gill - Epitheliocystis 0 0 0 0 0 0 0 0 0 0 0 0 0 0 0 - 0 0 0 0 0
Liver - Clear cell foci 0 0 0 0 0 0 0 0 0 0 0 0 0 0 0 - 0 0 0 0 0
Spleen - Vacuoles 0 0 0 0 0 0 0 0 0 0 0 0 0 0 0 - 0 0 0 0 0
Spleen - Scar tissue 0 0 0 0 0 0 0 0 0 0 0 0 0 0 0 - 0 0 0 0 0
Internal Myxos/Protozoa 0 0 0 0 0 0 0 0 0 0 0 0 0 0 0 - 0 0 0 0 0
Gill - Normal 0 0 0 0 0 0 0 0 0 0 0 0 0 0 0 - 0 0 0 0 0
Gill - Post mortem autolysis 0 0 0 0 0 0 0 0 0 0 0 0 0 0 0 - 0 0 0 0 0
Gill - Congestion 0 0 0 0 0 0 0 0 0 0 0 0 0 0 0 - 0 0 0 0 0
Liver - Normal 0 0 0 0 0 0 0 0 0 0 0 0 0 0 0 - 0 0 0 0 0
Liver - Post mortem autolysis/necrosis 0 0 0 0 0 0 0 0 0 0 0 0 0 0 0 - 0 0 0 0 0
Kidney - Normal 0 0 0 0 0 0 0 0 0 0 0 0 0 0 0 - 0 0 0 0 0
Kidney - Post mortem autolysis 0 0 0 0 0 0 0 0 0 0 0 0 0 0 0 - 0 0 0 0 0
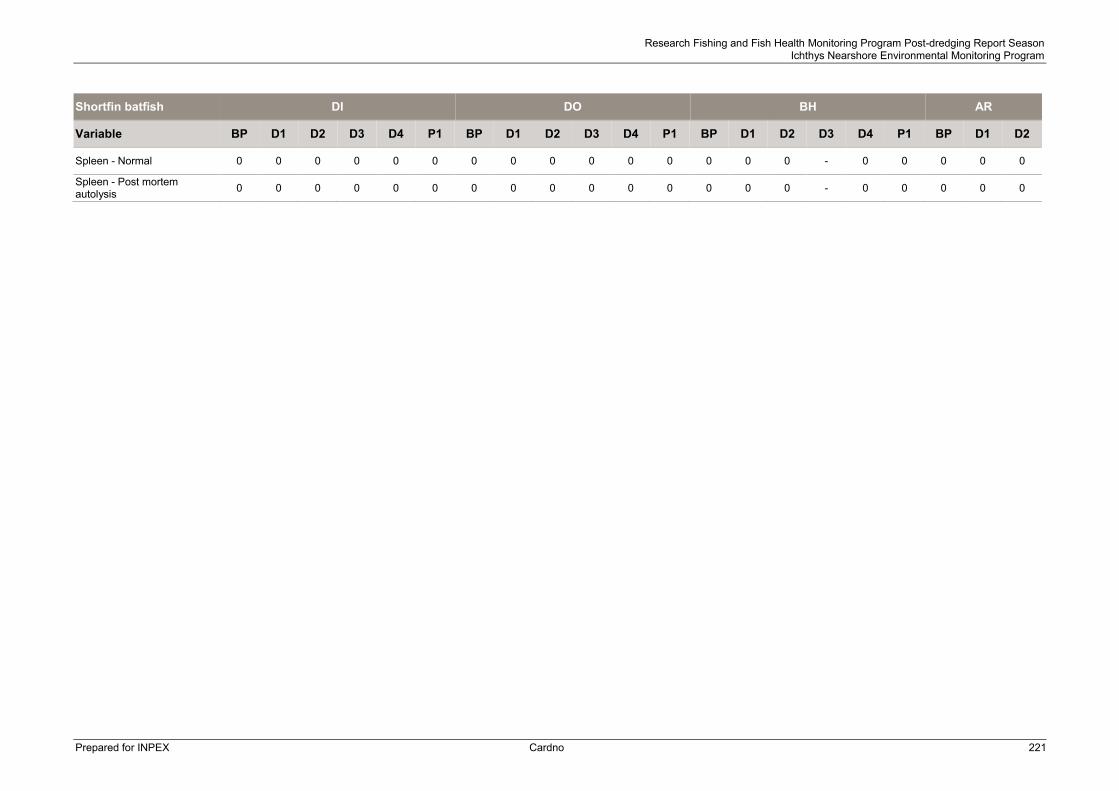
Research Fishing and Fish Health Monitoring Program Post-dredging Report Season Ichthys Nearshore Environmental Monitoring Program
Prepared for INPEX Cardno 221
Shortfin batfish DI DO BH AR
Variable BP D1 D2 D3 D4 P1 BP D1 D2 D3 D4 P1 BP D1 D2 D3 D4 P1 BP D1 D2
Spleen - Normal 0 0 0 0 0 0 0 0 0 0 0 0 0 0 0 - 0 0 0 0 0
Spleen - Post mortem autolysis 0 0 0 0 0 0 0 0 0 0 0 0 0 0 0 - 0 0 0 0 0
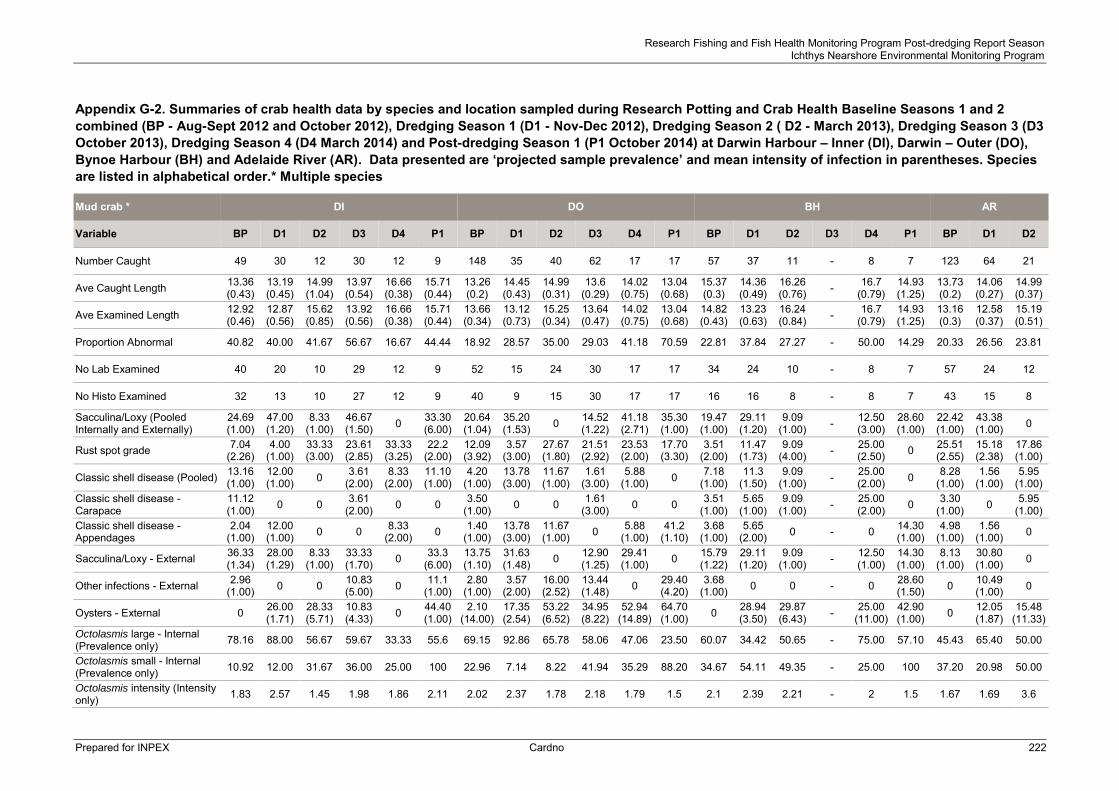
Research Fishing and Fish Health Monitoring Program Post-dredging Report Season Ichthys Nearshore Environmental Monitoring Program
Prepared for INPEX Cardno 222
Appendix G-2. Summaries of crab health data by species and location sampled during Research Potting and Crab Health Baseline Seasons 1 and 2 combined (BP - Aug-Sept 2012 and October 2012), Dredging Season 1 (D1 - Nov-Dec 2012), Dredging Season 2 ( D2 - March 2013), Dredging Season 3 (D3 October 2013), Dredging Season 4 (D4 March 2014) and Post-dredging Season 1 (P1 October 2014) at Darwin Harbour – Inner (DI), Darwin – Outer (DO), Bynoe Harbour (BH) and Adelaide River (AR). Data presented are ‘projected sample prevalence’ and mean intensity of infection in parentheses. Species are listed in alphabetical order.* Multiple species
Mud crab * DI DO BH AR
Variable BP D1 D2 D3 D4 P1 BP D1 D2 D3 D4 P1 BP D1 D2 D3 D4 P1 BP D1 D2
Number Caught 49 30 12 30 12 9 148 35 40 62 17 17 57 37 11 - 8 7 123 64 21
Ave Caught Length 13.36 (0.43)
13.19 (0.45)
14.99 (1.04)
13.97 (0.54)
16.66 (0.38)
15.71 (0.44)
13.26 (0.2)
14.45 (0.43)
14.99 (0.31)
13.6 (0.29)
14.02 (0.75)
13.04 (0.68)
15.37 (0.3)
14.36 (0.49)
16.26 (0.76) - 16.7
(0.79) 14.93 (1.25)
13.73 (0.2)
14.06 (0.27)
14.99 (0.37)
Ave Examined Length 12.92 (0.46)
12.87 (0.56)
15.62 (0.85)
13.92 (0.56)
16.66 (0.38)
15.71 (0.44)
13.66 (0.34)
13.12 (0.73)
15.25 (0.34)
13.64 (0.47)
14.02 (0.75)
13.04 (0.68)
14.82 (0.43)
13.23 (0.63)
16.24 (0.84) - 16.7
(0.79) 14.93 (1.25)
13.16 (0.3)
12.58 (0.37)
15.19 (0.51)
Proportion Abnormal 40.82 40.00 41.67 56.67 16.67 44.44 18.92 28.57 35.00 29.03 41.18 70.59 22.81 37.84 27.27 - 50.00 14.29 20.33 26.56 23.81
No Lab Examined 40 20 10 29 12 9 52 15 24 30 17 17 34 24 10 - 8 7 57 24 12
No Histo Examined 32 13 10 27 12 9 40 9 15 30 17 17 16 16 8 - 8 7 43 15 8
Sacculina/Loxy (Pooled Internally and Externally)
24.69 (1.00)
47.00 (1.20)
8.33 (1.00)
46.67 (1.50) 0 33.30
(6.00) 20.64 (1.04)
35.20 (1.53) 0 14.52
(1.22) 41.18 (2.71)
35.30 (1.00)
19.47 (1.00)
29.11 (1.20)
9.09 (1.00) - 12.50
(3.00) 28.60 (1.00)
22.42 (1.00)
43.38 (1.00) 0
Rust spot grade 7.04 (2.26)
4.00 (1.00)
33.33 (3.00)
23.61 (2.85)
33.33 (3.25)
22.2 (2.00)
12.09 (3.92)
3.57 (3.00)
27.67 (1.80)
21.51 (2.92)
23.53 (2.00)
17.70 (3.30)
3.51 (2.00)
11.47 (1.73)
9.09 (4.00) - 25.00
(2.50) 0 25.51 (2.55)
15.18 (2.38)
17.86 (1.00)
Classic shell disease (Pooled) 13.16 (1.00)
12.00 (1.00) 0 3.61
(2.00) 8.33
(2.00) 11.10 (1.00)
4.20 (1.00)
13.78 (3.00)
11.67 (1.00)
1.61 (3.00)
5.88 (1.00) 0 7.18
(1.00) 11.3
(1.50) 9.09
(1.00) - 25.00 (2.00) 0 8.28
(1.00) 1.56
(1.00) 5.95
(1.00) Classic shell disease - Carapace
11.12 (1.00) 0 0 3.61
(2.00) 0 0 3.50 (1.00) 0 0 1.61
(3.00) 0 0 3.51 (1.00)
5.65 (1.00)
9.09 (1.00) - 25.00
(2.00) 0 3.30 (1.00) 0 5.95
(1.00) Classic shell disease - Appendages
2.04 (1.00)
12.00 (1.00) 0 0 8.33
(2.00) 0 1.40 (1.00)
13.78 (3.00)
11.67 (1.00) 0 5.88
(1.00) 41.2
(1.10) 3.68
(1.00) 5.65
(2.00) 0 - 0 14.30 (1.00)
4.98 (1.00)
1.56 (1.00) 0
Sacculina/Loxy - External 36.33 (1.34)
28.00 (1.29)
8.33 (1.00)
33.33 (1.70) 0 33.3
(6.00) 13.75 (1.10)
31.63 (1.48) 0 12.90
(1.25) 29.41 (1.00) 0 15.79
(1.22) 29.11 (1.20)
9.09 (1.00) - 12.50
(1.00) 14.30 (1.00)
8.13 (1.00)
30.80 (1.00) 0
Other infections - External 2.96 (1.00) 0 0 10.83
(5.00) 0 11.1 (1.00)
2.80 (1.00)
3.57 (2.00)
16.00 (2.52)
13.44 (1.48) 0 29.40
(4.20) 3.68
(1.00) 0 0 - 0 28.60 (1.50) 0 10.49
(1.00) 0
Oysters - External 0 26.00 (1.71)
28.33 (5.71)
10.83 (4.33) 0 44.40
(1.00) 2.10
(14.00) 17.35 (2.54)
53.22 (6.52)
34.95 (8.22)
52.94 (14.89)
64.70 (1.00) 0 28.94
(3.50) 29.87 (6.43) - 25.00
(11.00) 42.90 (1.00) 0 12.05
(1.87) 15.48
(11.33) Octolasmis large - Internal (Prevalence only) 78.16 88.00 56.67 59.67 33.33 55.6 69.15 92.86 65.78 58.06 47.06 23.50 60.07 34.42 50.65 - 75.00 57.10 45.43 65.40 50.00
Octolasmis small - Internal (Prevalence only) 10.92 12.00 31.67 36.00 25.00 100 22.96 7.14 8.22 41.94 35.29 88.20 34.67 54.11 49.35 - 25.00 100 37.20 20.98 50.00
Octolasmis intensity (Intensity only) 1.83 2.57 1.45 1.98 1.86 2.11 2.02 2.37 1.78 2.18 1.79 1.5 2.1 2.39 2.21 - 2 1.5 1.67 1.69 3.6
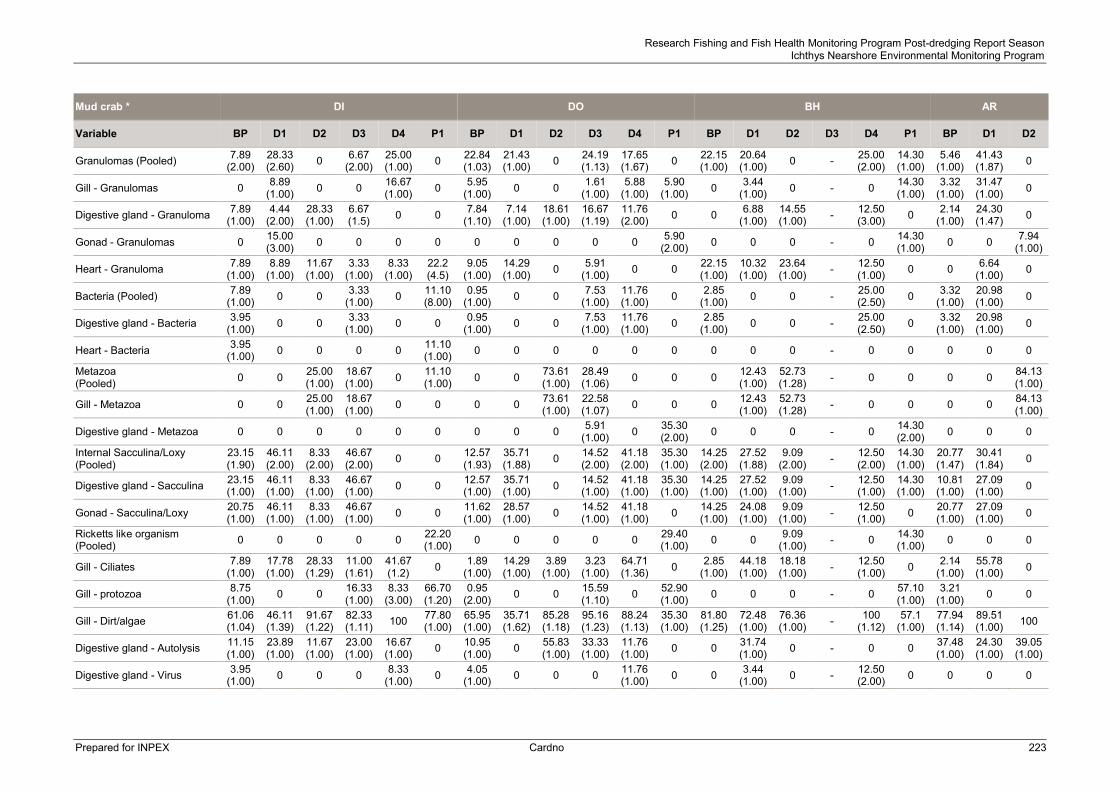
Research Fishing and Fish Health Monitoring Program Post-dredging Report Season Ichthys Nearshore Environmental Monitoring Program
Prepared for INPEX Cardno 223
Mud crab * DI DO BH AR
Variable BP D1 D2 D3 D4 P1 BP D1 D2 D3 D4 P1 BP D1 D2 D3 D4 P1 BP D1 D2
Granulomas (Pooled) 7.89 (2.00)
28.33 (2.60) 0 6.67
(2.00) 25.00 (1.00) 0 22.84
(1.03) 21.43 (1.00) 0 24.19
(1.13) 17.65 (1.67) 0 22.15
(1.00) 20.64 (1.00) 0 - 25.00
(2.00) 14.30 (1.00)
5.46 (1.00)
41.43 (1.87) 0
Gill - Granulomas 0 8.89 (1.00) 0 0 16.67
(1.00) 0 5.95 (1.00) 0 0 1.61
(1.00) 5.88
(1.00) 5.90
(1.00) 0 3.44 (1.00) 0 - 0 14.30
(1.00) 3.32
(1.00) 31.47 (1.00) 0
Digestive gland - Granuloma 7.89 (1.00)
4.44 (2.00)
28.33 (1.00)
6.67 (1.5) 0 0 7.84
(1.10) 7.14
(1.00) 18.61 (1.00)
16.67 (1.19)
11.76 (2.00) 0 0 6.88
(1.00) 14.55 (1.00) - 12.50
(3.00) 0 2.14 (1.00)
24.30 (1.47) 0
Gonad - Granulomas 0 15.00 (3.00) 0 0 0 0 0 0 0 0 0 5.90
(2.00) 0 0 0 - 0 14.30 (1.00) 0 0 7.94
(1.00)
Heart - Granuloma 7.89 (1.00)
8.89 (1.00)
11.67 (1.00)
3.33 (1.00)
8.33 (1.00)
22.2 (4.5)
9.05 (1.00)
14.29 (1.00) 0 5.91
(1.00) 0 0 22.15 (1.00)
10.32 (1.00)
23.64 (1.00) - 12.50
(1.00) 0 0 6.64 (1.00) 0
Bacteria (Pooled) 7.89 (1.00) 0 0 3.33
(1.00) 0 11.10 (8.00)
0.95 (1.00) 0 0 7.53
(1.00) 11.76 (1.00) 0 2.85
(1.00) 0 0 - 25.00 (2.50) 0 3.32
(1.00) 20.98 (1.00) 0
Digestive gland - Bacteria 3.95 (1.00) 0 0 3.33
(1.00) 0 0 0.95 (1.00) 0 0 7.53
(1.00) 11.76 (1.00) 0 2.85
(1.00) 0 0 - 25.00 (2.50) 0 3.32
(1.00) 20.98 (1.00) 0
Heart - Bacteria 3.95 (1.00) 0 0 0 0 11.10
(1.00) 0 0 0 0 0 0 0 0 0 - 0 0 0 0 0
Metazoa (Pooled) 0 0 25.00
(1.00) 18.67 (1.00) 0 11.10
(1.00) 0 0 73.61 (1.00)
28.49 (1.06) 0 0 0 12.43
(1.00) 52.73 (1.28) - 0 0 0 0 84.13
(1.00)
Gill - Metazoa 0 0 25.00 (1.00)
18.67 (1.00) 0 0 0 0 73.61
(1.00) 22.58 (1.07) 0 0 0 12.43
(1.00) 52.73 (1.28) - 0 0 0 0 84.13
(1.00)
Digestive gland - Metazoa 0 0 0 0 0 0 0 0 0 5.91 (1.00) 0 35.30
(2.00) 0 0 0 - 0 14.30 (2.00) 0 0 0
Internal Sacculina/Loxy (Pooled)
23.15 (1.90)
46.11 (2.00)
8.33 (2.00)
46.67 (2.00) 0 0 12.57
(1.93) 35.71 (1.88) 0 14.52
(2.00) 41.18 (2.00)
35.30 (1.00)
14.25 (2.00)
27.52 (1.88)
9.09 (2.00) - 12.50
(2.00) 14.30 (1.00)
20.77 (1.47)
30.41 (1.84) 0
Digestive gland - Sacculina 23.15 (1.00)
46.11 (1.00)
8.33 (1.00)
46.67 (1.00) 0 0 12.57
(1.00) 35.71 (1.00) 0 14.52
(1.00) 41.18 (1.00)
35.30 (1.00)
14.25 (1.00)
27.52 (1.00)
9.09 (1.00) - 12.50
(1.00) 14.30 (1.00)
10.81 (1.00)
27.09 (1.00) 0
Gonad - Sacculina/Loxy 20.75 (1.00)
46.11 (1.00)
8.33 (1.00)
46.67 (1.00) 0 0 11.62
(1.00) 28.57 (1.00) 0 14.52
(1.00) 41.18 (1.00) 0 14.25
(1.00) 24.08 (1.00)
9.09 (1.00) - 12.50
(1.00) 0 20.77 (1.00)
27.09 (1.00) 0
Ricketts like organism (Pooled) 0 0 0 0 0 22.20
(1.00) 0 0 0 0 0 29.40 (1.00) 0 0 9.09
(1.00) - 0 14.30 (1.00) 0 0 0
Gill - Ciliates 7.89 (1.00)
17.78 (1.00)
28.33 (1.29)
11.00 (1.61)
41.67 (1.2) 0 1.89
(1.00) 14.29 (1.00)
3.89 (1.00)
3.23 (1.00)
64.71 (1.36) 0 2.85
(1.00) 44.18 (1.00)
18.18 (1.00) - 12.50
(1.00) 0 2.14 (1.00)
55.78 (1.00) 0
Gill - protozoa 8.75 (1.00) 0 0 16.33
(1.00) 8.33
(3.00) 66.70 (1.20)
0.95 (2.00) 0 0 15.59
(1.10) 0 52.90 (1.00) 0 0 0 - 0 57.10
(1.00) 3.21
(1.00) 0 0
Gill - Dirt/algae 61.06 (1.04)
46.11 (1.39)
91.67 (1.22)
82.33 (1.11) 100 77.80
(1.00) 65.95 (1.00)
35.71 (1.62)
85.28 (1.18)
95.16 (1.23)
88.24 (1.13)
35.30 (1.00)
81.80 (1.25)
72.48 (1.00)
76.36 (1.00) - 100
(1.12) 57.1
(1.00) 77.94 (1.14)
89.51 (1.00) 100
Digestive gland - Autolysis 11.15 (1.00)
23.89 (1.00)
11.67 (1.00)
23.00 (1.00)
16.67 (1.00) 0 10.95
(1.00) 0 55.83 (1.00)
33.33 (1.00)
11.76 (1.00) 0 0 31.74
(1.00) 0 - 0 0 37.48 (1.00)
24.30 (1.00)
39.05 (1.00)
Digestive gland - Virus 3.95 (1.00) 0 0 0 8.33
(1.00) 0 4.05 (1.00) 0 0 0 11.76
(1.00) 0 0 3.44 (1.00) 0 - 12.50
(2.00) 0 0 0 0
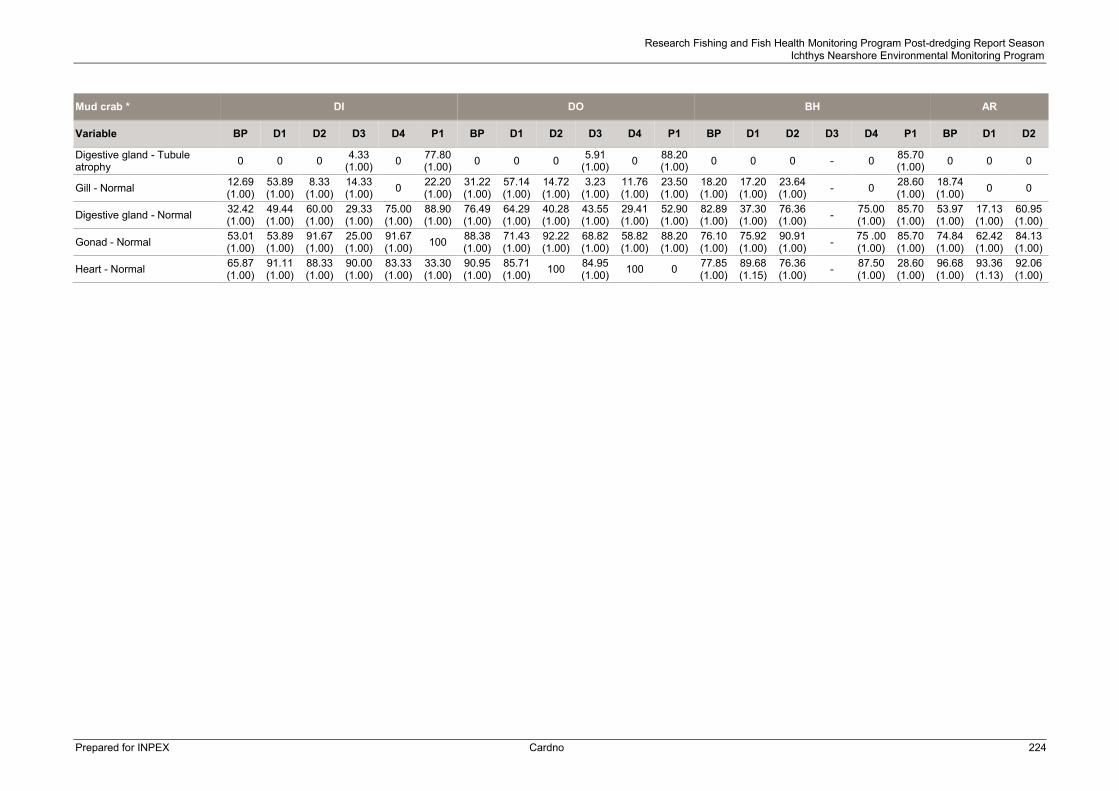
Research Fishing and Fish Health Monitoring Program Post-dredging Report Season Ichthys Nearshore Environmental Monitoring Program
Prepared for INPEX Cardno 224
Mud crab * DI DO BH AR
Variable BP D1 D2 D3 D4 P1 BP D1 D2 D3 D4 P1 BP D1 D2 D3 D4 P1 BP D1 D2
Digestive gland - Tubule atrophy 0 0 0 4.33
(1.00) 0 77.80 (1.00) 0 0 0 5.91
(1.00) 0 88.20 (1.00) 0 0 0 - 0 85.70
(1.00) 0 0 0
Gill - Normal 12.69 (1.00)
53.89 (1.00)
8.33 (1.00)
14.33 (1.00) 0 22.20
(1.00) 31.22 (1.00)
57.14 (1.00)
14.72 (1.00)
3.23 (1.00)
11.76 (1.00)
23.50 (1.00)
18.20 (1.00)
17.20 (1.00)
23.64 (1.00) - 0 28.60
(1.00) 18.74 (1.00) 0 0
Digestive gland - Normal 32.42 (1.00)
49.44 (1.00)
60.00 (1.00)
29.33 (1.00)
75.00 (1.00)
88.90 (1.00)
76.49 (1.00)
64.29 (1.00)
40.28 (1.00)
43.55 (1.00)
29.41 (1.00)
52.90 (1.00)
82.89 (1.00)
37.30 (1.00)
76.36 (1.00) - 75.00
(1.00) 85.70 (1.00)
53.97 (1.00)
17.13 (1.00)
60.95 (1.00)
Gonad - Normal 53.01 (1.00)
53.89 (1.00)
91.67 (1.00)
25.00 (1.00)
91.67 (1.00) 100 88.38
(1.00) 71.43 (1.00)
92.22 (1.00)
68.82 (1.00)
58.82 (1.00)
88.20 (1.00)
76.10 (1.00)
75.92 (1.00)
90.91 (1.00) - 75 .00
(1.00) 85.70 (1.00)
74.84 (1.00)
62.42 (1.00)
84.13 (1.00)
Heart - Normal 65.87 (1.00)
91.11 (1.00)
88.33 (1.00)
90.00 (1.00)
83.33 (1.00)
33.30 (1.00)
90.95 (1.00)
85.71 (1.00) 100 84.95
(1.00) 100 0 77.85 (1.00)
89.68 (1.15)
76.36 (1.00) - 87.50
(1.00) 28.60 (1.00)
96.68 (1.00)
93.36 (1.13)
92.06 (1.00)

Research Fishing and Fish Health Monitoring Program Post-dredging Report Season Ichthys Nearshore Environmental Monitoring Program
Prepared for INPEX Cardno 225
Sand crab * DI DO BH AR Variable BP D1 D2 D3 D4 P1 BP D1 D2 D3 D4 P1 BP D1 D2 D3 D4 P1 BP D1 D2 Number Caught 89 38 59 18 20 28 23 14 7 19 34 7 37 21 18 - 2 8 19 0 0
Ave Caught Length 13.1 (0.1)
13.5 (0.2)
12.6 (0.1)
13.2 (0.3)
12.8 (0.3)
13.3 (0.2)
13.0 (0.2)
13.6 (0.2)
13.0 (0.5)
13.5 (0.3)
12.7 (0.2)
12.8 (0.3)
13.7 (0.1)
13.3 (0.4)
12.7 (0.3) - 12.5
(1.4) 13.2 (0.7)
13.5 (0.2) 0 0
Ave Examined Length 13.1 (0.2)
14.1 (0.4)
13.2 (0.4)
13.3 (0.3)
12.8 (0.3)
14.3 (0.2)
13.3 (0.3)
13.9 (0.4)
13 (0.5)
13.8 (0.3)
12.7 (0.1)
12.8 (0.3)
13.8 (0.3)
13.9 (0.3)
13.1 (0.4) - 12.5
(1.4) 13.2 (0.7)
13.4 (0.3) 0 0
Proportion Abnormal 6.74 10.5 5.08 11.1 15 7.14 13.0 14.3 0 5.26 8.82 0 0 4.76 11.1 - 0 12.5 10.5 0 0
No Lab Examined 20 7 20 17 20 12 13 6 7 15 34 7 16 8 13 - 2 8 9 0 0
No Histo Examined 20 5 7 14 13 (13) 12 13 1 5 11 16 (16) 7 16 6 8 - 2 (2.00) 8 9 0 0
Sacculina/Loxy (Pooled Internally and Externally)
7.73 (1.00)
2.63 (1.20) 0 0 0 40.70
(2.10) 8.70
(1.50) 14.30 (7.00) 0 0 0 42.90
(2.30) 0 13.60 (1.00) 0 - 0 12.50
(1.00) 0 0 0
Rust spot grade 0 0 1.69 (1.00) 0 5.00
(1.00) 3.60
(2.00) 0 0 0 0 5.88 (1.00) 0 6.25
(3.00) 0 0 - 0 0 0 0 0
Classic shell disease (Pooled) 24.20 (1.00)
7.89 (2.00)
25.70 (1.30)
11.5 (1.00)
10.00 (2.5)
3.60 (1.00) 0 31.40
(1.00) 0 6.77 (1.00)
5.88 (1.50) 0 18.80
(1.00) 59.20 (1.00)
13.60 (1.40) - 0 0 23.30
(1.00) 0 0
Classic shell disease - Carapace 13.20 (1.00)
5.26 (2.00) 0 5.56
(1.00) 0 18.60 (1.00) 0 0 0 0 2.94
(1.00) 0 12.50 (1.00)
32.00 (1.00) 0 - 0 0 5.26
(1.00) 0 0
Classic shell disease - Appendages
11.0 (1.00)
5.26 (1.00)
25.70 (1.30)
5.93 (1.00)
10.00 (2.50) 0 0 31.40
(1.00) 0 6.77 (1.00)
5.88 (1.00) 0 6.25
(1.00) 27.2
(1.00) 13.60 (1.40) - 0 0 18.10
(1.00) 0 0
Sacculina/Loxy - External 2.25 (1.00) 0 0 0 0 40.70
(2.10) 4.35
(1.00) 0 0 0 0 14.30 (2.00) 0 0 0 - 0 0 0 0 0
Other infections - External 7.73 (1.00)
32.50 (1.20)
3.39 (1.00)
11.50 (1.00) 0 0 4.35
(1.00) 14.30 (7.00)
14.30 (3.00)
20.30 (2.30) 2.94 28.60
(1.00) 12.50 (1.00)
13.60 (1.00)
29.80 (1.40) - 0 0 0 0 0
Oysters - External 0 2.63 5.58 0 10.00 27.90 (1.00) 4.35 0 0 13.50
(2.50) 0 57.10 (1.00) 0 13.6
(1.00 19.10 (9.00) - 0 50.00
(1.00) 0 0 0
Octolasmis large - Internal (Prevalence only) 48.3 40.3 29.6 42.5 1 0 43.4 65.7 42.8 18.9 1 0 62.5 100 45.9 - 1 0 69.1 0 0
Octolasmis small - Internal (Prevalence only) 0 0 0 0 0 27.9 1 0 0 0 0 57.1 1 0 0 - 0 50.0 0 0 0
Octolasmis intensity (Intensity only) 48.4 40.4 29.6 1 1 1.8 1 1.3 1 1 1 1 1.2 1 1 - 1 1 1.1 0 0
Granulomas (Pooled) 26.4 (1.00)
2.63 (1.00) 0 27.80
(1.30) 30.50 (1.30) 0 13.00
(1.00) 14.30 (1.00) 0 37.90
(1.50) 19.90 (1.00)
14.30 (1.00)
12.50 (1.00)
76.20 (1.30) 0 - 0 0 5.26
(1.00) 0 0
Gill - Granulomas 0 0 0 0 0 22.10 (1.30) 0 0 20.00
(1.00) 9.47
(1.00) 0 14.30 (1.00) 0 0 14.81
(1.00) - 0 12.50 (1.00) 0 0 0
Digestive gland - Granuloma 24.20 (1.00)
2.63 (1.00)
25.40 (1.00)
27.80 (1.00)
30.50 (1.30) 0 13.00
(1.00) 14.30 (1.00)
20.00 (1.00)
19.00 (1.00)
19.90 (1.00) 0 12.50
(1.00) 76.20 (1.00)
29.60 (1.00) - 0 0 5.26
(1.00) 0 0
Gonad - Granulomas 0 0 0 0 0 9.30 (3.00) 0 0 0 0 0 0 0 0 0 - 0 0 0 0 0
Heart - Granuloma 2.25 (1.00) 0 0 7.41
(1.00) 0 0 0 0 0 28.42 (1.00) 0 14.30
(1.00) 0 19.05 (1.00) 0 - 0 12.50
(1.00) 0 0 0
Bacteria (Pooled) 10.97 (1.00) 0 1.69
(1.00) 0 18.50 (1.00) 0 0 0 20.00
(1.00) 9.47
(1.00) 7.01
(1.00) 0 6.25 (1.00)
23.81 (1.00) 0 - 0 0 0 0 0
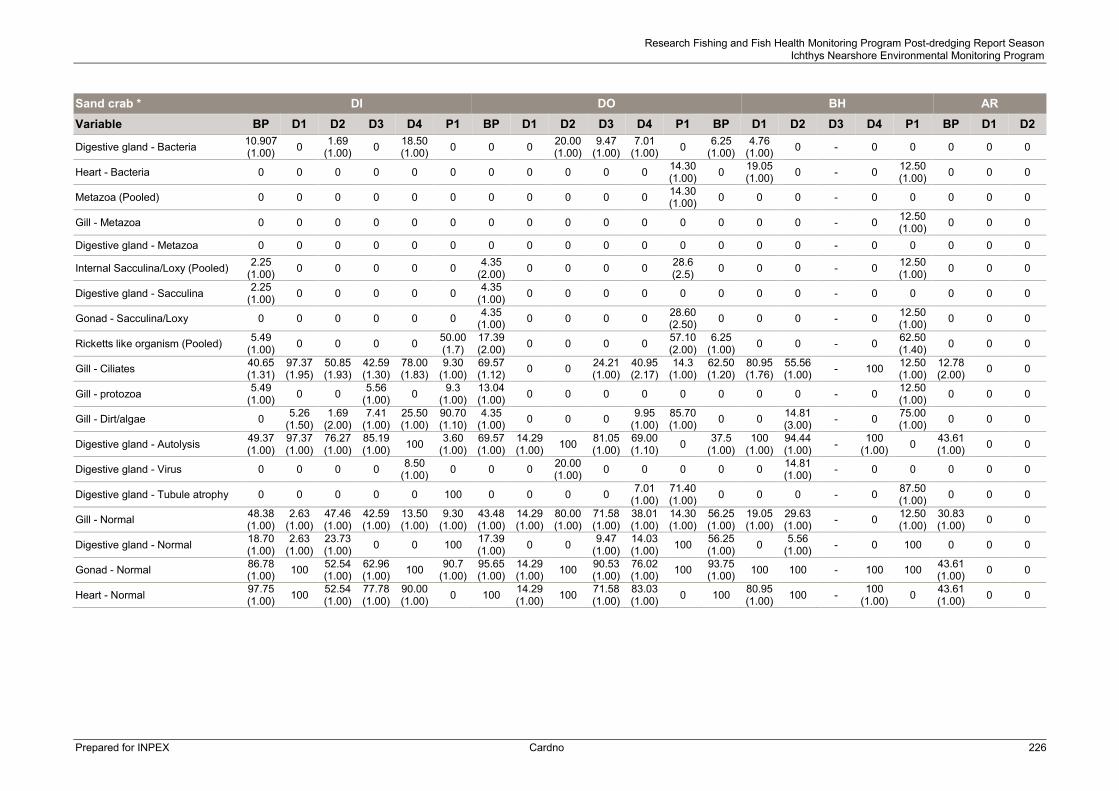
Research Fishing and Fish Health Monitoring Program Post-dredging Report Season Ichthys Nearshore Environmental Monitoring Program
Prepared for INPEX Cardno 226
Sand crab * DI DO BH AR Variable BP D1 D2 D3 D4 P1 BP D1 D2 D3 D4 P1 BP D1 D2 D3 D4 P1 BP D1 D2
Digestive gland - Bacteria 10.907 (1.00) 0 1.69
(1.00) 0 18.50 (1.00) 0 0 0 20.00
(1.00) 9.47
(1.00) 7.01
(1.00) 0 6.25 (1.00)
4.76 (1.00) 0 - 0 0 0 0 0
Heart - Bacteria 0 0 0 0 0 0 0 0 0 0 0 14.30 (1.00) 0 19.05
(1.00) 0 - 0 12.50 (1.00) 0 0 0
Metazoa (Pooled) 0 0 0 0 0 0 0 0 0 0 0 14.30 (1.00) 0 0 0 - 0 0 0 0 0
Gill - Metazoa 0 0 0 0 0 0 0 0 0 0 0 0 0 0 0 - 0 12.50 (1.00) 0 0 0
Digestive gland - Metazoa 0 0 0 0 0 0 0 0 0 0 0 0 0 0 0 - 0 0 0 0 0
Internal Sacculina/Loxy (Pooled) 2.25 (1.00) 0 0 0 0 0 4.35
(2.00) 0 0 0 0 28.6 (2.5) 0 0 0 - 0 12.50
(1.00) 0 0 0
Digestive gland - Sacculina 2.25 (1.00) 0 0 0 0 0 4.35
(1.00) 0 0 0 0 0 0 0 0 - 0 0 0 0 0
Gonad - Sacculina/Loxy 0 0 0 0 0 0 4.35 (1.00) 0 0 0 0 28.60
(2.50) 0 0 0 - 0 12.50 (1.00) 0 0 0
Ricketts like organism (Pooled) 5.49 (1.00) 0 0 0 0 50.00
(1.7) 17.39 (2.00) 0 0 0 0 57.10
(2.00) 6.25
(1.00) 0 0 - 0 62.50 (1.40) 0 0 0
Gill - Ciliates 40.65 (1.31)
97.37 (1.95)
50.85 (1.93)
42.59 (1.30)
78.00 (1.83)
9.30 (1.00)
69.57 (1.12) 0 0 24.21
(1.00) 40.95 (2.17)
14.3 (1.00)
62.50 (1.20)
80.95 (1.76)
55.56 (1.00) - 100 12.50
(1.00) 12.78 (2.00) 0 0
Gill - protozoa 5.49 (1.00) 0 0 5.56
(1.00) 0 9.3 (1.00)
13.04 (1.00) 0 0 0 0 0 0 0 0 - 0 12.50
(1.00) 0 0 0
Gill - Dirt/algae 0 5.26 (1.50)
1.69 (2.00)
7.41 (1.00)
25.50 (1.00)
90.70 (1.10)
4.35 (1.00) 0 0 0 9.95
(1.00) 85.70 (1.00) 0 0 14.81
(3.00) - 0 75.00 (1.00) 0 0 0
Digestive gland - Autolysis 49.37 (1.00)
97.37 (1.00)
76.27 (1.00)
85.19 (1.00) 100 3.60
(1.00) 69.57 (1.00)
14.29 (1.00) 100 81.05
(1.00) 69.00 (1.10) 0 37.5
(1.00) 100
(1.00) 94.44 (1.00) - 100
(1.00) 0 43.61 (1.00) 0 0
Digestive gland - Virus 0 0 0 0 8.50 (1.00) 0 0 0 20.00
(1.00) 0 0 0 0 0 14.81 (1.00) - 0 0 0 0 0
Digestive gland - Tubule atrophy 0 0 0 0 0 100 0 0 0 0 7.01 (1.00)
71.40 (1.00) 0 0 0 - 0 87.50
(1.00) 0 0 0
Gill - Normal 48.38 (1.00)
2.63 (1.00)
47.46 (1.00)
42.59 (1.00)
13.50 (1.00)
9.30 (1.00)
43.48 (1.00)
14.29 (1.00)
80.00 (1.00)
71.58 (1.00)
38.01 (1.00)
14.30 (1.00)
56.25 (1.00)
19.05 (1.00)
29.63 (1.00) - 0 12.50
(1.00) 30.83 (1.00) 0 0
Digestive gland - Normal 18.70 (1.00)
2.63 (1.00)
23.73 (1.00) 0 0 100 17.39
(1.00) 0 0 9.47 (1.00)
14.03 (1.00) 100 56.25
(1.00) 0 5.56 (1.00) - 0 100 0 0 0
Gonad - Normal 86.78 (1.00) 100 52.54
(1.00) 62.96 (1.00) 100 90.7
(1.00) 95.65 (1.00)
14.29 (1.00) 100 90.53
(1.00) 76.02 (1.00) 100 93.75
(1.00) 100 100 - 100 100 43.61 (1.00) 0 0
Heart - Normal 97.75 (1.00) 100 52.54
(1.00) 77.78 (1.00)
90.00 (1.00) 0 100 14.29
(1.00) 100 71.58 (1.00)
83.03 (1.00) 0 100 80.95
(1.00) 100 - 100 (1.00) 0 43.61
(1.00) 0 0