research discussion papers - policy studies institute1.pdf · psi research discussion paper 26 ......
TRANSCRIPT
esearch
PSI Research Discussion Paper 26
New Zealand Working For Families programme: Methodological considerations for evaluating MSD programmes
Alex Bryson, Martin Evans, Genevieve Knight, Ivana La Valle and Sandra Vegeris
RDPiscussion
apersPolicy Studies Institute
All rights reserved. No part of this publication may be reproduced, stored ina retrieval system or transmitted in any form or by any means, electronic orotherwise, without the prior permission of the copyright holder.
ISBN: 978-0-85374-825-0 PSI Report No: 904
Policy Studies InstituteFor further information contact:Publications Dept., PSI, 50 Hanson Street, London W1W 6UPTel: (020) 7911 7500 Fax: (020) 7911 7501
PSI is a wholly owned subsidiary of the University of Westminster
esearch Discussion PapersR
Policy Studies Institute
cPoli y Studies Institute© 2007

Methodological considerations for evaluating MSD programmes
Prepared by
Alex Bryson, Martin Evans, Genevieve Knight, Ivana La Valle and Sandra Vegeris
Prepared for
Centre for Social Research and Evaluation Te Pokapū Rangahau Arotake Hapori
April 2006

Disclaimer The views in this report are the authors’ own and do not necessarily reflect those of the Ministry of Social Development. This report was authored prior to substantive changes to the Working for Families Programme.

Contents Acknowledgements ................................................................................................................... iii Glossary of abbreviations and useful terminology..................................................................... iv 1 Introduction to the purpose of this paper............................................................................... 1 2 Implementation and delivery.................................................................................................. 2
2.1 The descriptive and evaluative tasks for the WFF evaluation................................... 2 2.2 The meaning of delivery “effectiveness” ................................................................... 2 2.3 “Barriers” to effective implementation ....................................................................... 4 2.4 Delivery and implementation issues specific to WFF................................................ 8 2.5 Data challenges and opportunities............................................................................ 9 2.6 Thoughts on improving implementation and delivery of WFF in the future............. 16
3 Take-up and entitlement...................................................................................................... 18 3.1 Capturing entitlement to and receipt of WFF .......................................................... 18 3.2 Identifying reasons for non-take-up......................................................................... 25 3.3 Evaluating measures taken to improve take-up...................................................... 29
4 Identifying the causal impact of social programmes............................................................ 32 4.1 Nature of the impact evaluation problem ................................................................ 32 4.2 Solutions to the evaluation problem........................................................................ 33 4.3 Random assignment experiments........................................................................... 35 4.4 Non-experimental approaches ................................................................................ 36 4.5 General equilibrium effects...................................................................................... 42 4.6 Which techniques “work”?....................................................................................... 43
5 Making work pay.................................................................................................................. 45 5.1 The rationale behind WFF....................................................................................... 45 5.2 Household labour supply......................................................................................... 46 5.3 Other considerations in making work pay ............................................................... 47 5.4 What is WFF offering?............................................................................................. 48 5.5 Effects of WFF......................................................................................................... 51 5.6 Participation versus eligibility .................................................................................. 54 5.7 Identifying comparators to the eligible population in a “natural experiment”........... 55 5.8 Identifying those entitled to WFF............................................................................. 58 5.9 Methodologies for identifying the impact of WFF on “making work pay” ................ 60 5.10 Data sources ......................................................................................................... 61 5.11 Job entry and job retention: Survival modelling .................................................... 63 5.12 Some initial ideas for evaluating WFF sub-programmes ...................................... 64 5.13 Laboratory experiments......................................................................................... 71 5.14 General equilibrium estimators ............................................................................. 71 5.15 Summary ............................................................................................................... 72
6 Measuring changes in poverty and wellbeing ..................................................................... 73 6.1 Capturing poverty impacts using a relative poverty line.......................................... 73 6.2 Secondary analysis and poverty profiling................................................................ 74 6.3 Micro-simulation ...................................................................................................... 76 6.4 Evaluating changes to hardship, living standards and wellbeing............................ 77
Conclusion ............................................................................................................................... 82 Bibliography............................................................................................................................. 83 Appendix 1 Figures.................................................................................................................. 97
ii
List of boxes, figures and tables Box 2.1 Implementation and delivery factors influencing programme success ....................... 6 Box 4.1 Summary of types of impact...................................................................................... 33 Box 6.1 UK Family Resources Survey – material deprivation items...................................... 78 Figure 1a Budget Constraints Facing Rod and Barb, April 2004 – April 2007....................... 98 Figure 1b Income Package Available to Rod and Barb in April 2004 .................................... 99 Figure 1c Income Package Available to Rod and Barb in April 2007................................... 100 Figure 2a Budget Constraints Facing Rob and Aroha, April 2004 – April 2007................... 101 Figure 2b Income Package Available to Rob and Aroha in April 2004 ................................ 102 Figure 2c Income Package Available to Rob and Aroha in April 2007................................. 103 Figure 3a Budget Constraints Facing Pete and Sue, April 2004 – April 2007 ..................... 104 Figure 3b Income Package Available to Pete and Sue in April 2004................................... 105 Figure 3c Income Package Available to Pete and Sue in April 2007................................... 106 Figure 4a Budget Constraints Facing Mary, April 2004 – April 2007 ................................... 107 Figure 4b Income Package Available to Mary in April 2004................................................. 108 Figure 4c Income Package Available to Mary in April 2007................................................. 109 Table 3.1 Data sources: advantages and disadvantages ...................................................... 24

iii
Acknowledgements This research was commissioned by the Ministry of Social Development (MSD). In particular, the authors would like to thank Drs Debbie McLeod and Mike Roguski of the Ministry, who provided considerable help with the material. We would like to give special thanks to Alan Marsh OBE, Susan Purdon of NatCen, Jeff Smith of the University of Maryland, Michael White OBE and participants at a PSI seminar in January 2005 for useful comments. Thanks also to Jenny Yip for assisting with the document production.

iv
Glossary of abbreviations and useful terminology abatement or taper The process of gradually reducing the amount of a government
payment as income increases. For example, an abatement of 20% means that for every extra dollar earned above a given income level (threshold), the payment will reduce by 20 cents. An abatement of 100% means that for each extra dollar earned, the payment is reduced by a dollar.
AS Accommodation Supplement, housing costs assistance available to homeowners, boarders and renters not in Housing New Zealand Corporation houses.
ATE Average Treatment Effect, the impact that programme participation would have on an individual drawn randomly from the population.
budget constraint An accounting identity that describes the consumption options available to an agent with a limited income (or wealth) to allocate among various goods.
CCS Childcare Subsidy, a payment for low- and middle-income parents to subsidise the costs of childcare and early childhood education for pre-school children. It is available for up to 50 hours a week for parents in work, education or training and for up to nine hours a week for other parents. CCS is paid directly to the childcare provider.
CIA Conditional independence assumption, the identifying assumption for matching and for the simple regression estimator, that if one can control for observable differences in characteristics between treated and non-treated groups, the outcome that would result in the absence of treatment is the same in both cases.
counterfactual Term used in non-experimental analysis of programme impacts to represent the equivalent of the control in an experiment. The control and counterfactual terms are used to describe the outcome of not undergoing treatment.
CTC Child tax credit, a per-child payment to families that existed prior to in-work payment; an additional payment to low- to middle-income families not receiving other assistance; to be replaced by in-work payment in 2006.
EMTR Effective marginal tax rate. The percentage reduction in the last dollar earned due to the additive effects of paying tax and also losing a portion of a government benefit or other assistance through abatement. For example, someone who has an effective marginal tax rate of 80% only gets 20 cents in the hand for every dollar earned.

v
endogenous A term arising from econometric analysis, in which the value of one independent variable is correlated with the error term (ie dependent on the value of the error term).
FACS Families And Children Study, Great Britain.
FES Family Expenditure Survey, United Kingdom.
FIA Family income assistance, a general term covering financial assistance paid by the Ministry of Social Development and the Inland Revenue Department to qualifying families with dependent children; currently consists of family support, child tax credit, family tax credit and parental tax credit.
FRS Family Resources Survey, United Kingdom.
FS Family support, a per-child payment available to families whether in or out of work, to help with the costs of dependent children.
FTC Family tax credit, a payment per annum to families not in receipt of benefits to guarantee a minimum in-work income.
GAIN Greater Avenues for Independence, a Californian welfare-to-work programme.
general equilibrium effects
These are the impacts a programme may have on outcomes and behaviour of non-participants; they come about when programmes affect outcomes and behaviour of non-participants as well as participants. To examine general equilibrium effects requires a general equilibrium framework, the opposite of that defined for partial equilibrium analysis (see definition of partial equilibrium).
heterogeneous Differing across groups (opposite of homogeneous).
HNZ Housing New Zealand Corporation.
homogeneous Identical across groups (opposite of heterogeneous).
impact The estimated effect of a programme on an outcome, eg employment, relative to what would have occurred in the absence of the programme.
income distribution A description of the fractions of a population that are at various levels of income. The larger are the differences in income, the “worse” the income distribution is usually said to be; the smaller the differences, the “better”.
income effect (of a price change)
Refers to the change in the quantity demanded of a product exclusively associated with a change in real income. The income effect can be either negative or positive depending on whether the good (product) under consideration is inferior or normal.

vi
income smoothing The reduction of variation in income over a period.
indifference curve A set of points with the same utility. That is, utility is constant along an indifference curve and the curve shows all the consumption bundles that yield the same utility.
Invalid’s Benefit A benefit for those who are permanently and severely restricted in their capacity to work or are blind.
IRD Inland Revenue Department.
IV Instrumental variables, an econometric method for non-experimental data, to help recover the programme impact estimate.
IWP In-work payment, a per-family payment made to the principal carer to help parents move into and stay in paid work.
JTPA Job Training Partnership Act, United States.
LATE Local average treatment effect, the mean effect on those people whose participation changes as a result of a policy.
LEED Linked Employer–Employee Database, New Zealand.
MATE Marginal average treatment effect, the mean effect on those people whose participation changes where it is defined by a change in a policy variable that is not an instrumental variable (see definition of LATE).
MSD Ministry of Social Development, New Zealand.
NER Non-entitled recipient.
non-experimental methods
Similar to quasi-experimental methods, a term that is used in earlier literature. The underlying ideal is the experiment where both an experimental group and a control group are randomly selected from prospective participants. Hence, quasi- or non-experimental methods attempt to find a satisfactory surrogate for the randomly selected control group when the control group is not actually randomly selected.
ONE The ONE pilots (formerly the “Single Work-Focused Gateway”) were launched in 1999 in the UK, to test the feasibility of different ways of delivering joined-up benefit and employment services – see Osgood et al. 2003.
opportunity cost The cost of consuming (using) a resource arises from the value of what it could be used for instead. The “opportunity cost” of a resource is the value of the next-highest-valued alternative use of that resource.

vii
OSCAR Out-of-school care and recreation subsidy, a childcare subsidy. This is a payment to low- and middle-income families in work, education or training to subsidise care for 5- to 13-year-olds outside of school hours. It is available for up to 20 hours a week during term-time and up to 50 hours a week during school holidays. An OSCAR subsidy is paid directly to the childcare provider.
outcomes Social and economic factors liable to be affected by a social programme, such as WFF, which analysts will often treat as dependent variables.
partial equilibrium Partial equilibrium analysis means that the effects of policy actions are examined only in the markets that are directly affected; it either ignores effects on other groups in the economy or assumes that the sector in question is very small and therefore has little, if any, impact on other sectors of the economy. Opposite of general equilibrium (see definition of general equilibrium effects).
poverty trap See definition of unemployment trap.
PRILIF Programme of Research Into Low-Income Families, a United Kingdom series of surveys that preceded Families and Children Study.
PTC Parental tax credit, financial assistance for the first 56 days after a child is born where paid parental leave is not taken.
replacement ratio A measure of incentives to work. It is the net income from benefits as a percentage of net income from work. If it were possible to receive as much from benefits as from work (a replacement ratio of 100%), the motivation to work would be much reduced.
reservation wage The lowest wage rate for which a person will supply labour to the market. Below that wage, the person will not supply labour.
selection bias Bias resulting from the self-selection of individuals to participate in an activity or survey or as a subject in an experimental study; may also arise if participants are selected non-randomly by others, such as programme administrators.
SOLO The Ministry of Social Development’s client activity management system.
special benefit A supplementary benefit available on the grounds of financial hardship to both benefit recipients and non-benefit recipients, who are unable to meet their essential needs and commitments from their income and other sources.

viii
substitution effect (of a price change)
Refers to the change in the quantity demanded of a product resulting exclusively from a change in its price when the consumer’s real income is held constant. The substitution effect is always negative as it changes in the opposite direction to the change in price.
SUTVA Stable unit treatment value assumption, an assumption that the impact of the programme on one person does not depend on whom else, or on how many others, is/are in the programme.
SWIFTT The Ministry of Social Development’s client payroll system.
SWN Social welfare number, a unique number used as an identifier for an individual’s contact and payments with the Ministry of Social Development.
taper See definition of abatement.
TAS Temporary additional support, which replaces special benefit for new hardship applicants from 1 April 2006.
TAXMOD Treasury micro simulation model, a computer simulation model of the New Zealand population, mainly concerned with income, tax and benefit data. It is maintained by the New Zealand Treasury.
TT The average effect of treatment on the treated, the impact that programme participation has on individuals who actually participated.
UB Unemployment benefit, a benefit paid to adults who are able to work but unable to find employment. Other income, including from part-time, temporary or seasonal work, is allowed: an individual claimant and their partner can earn up to $80 a week (before tax) between them before benefit is affected. When earnings are more than this, the deduction is usually 70c for each dollar over the $80 limit. Any income will also affect any other payments (deductions vary).
UI Unemployment Insurance, the programme of US unemployment benefits.
unemployment trap
A name for the phenomenon by which taxation and welfare systems jointly contribute to keep people on social insurance. This is also known as the poverty trap in the United Kingdom.
WFF Working For Families, programme of changes to accommodation, out-of-work and in-work assistance introduced over the period 2004–2008, announced in the Budget, 27 May 2004.

1
1 Introduction to the purpose of this paper The methodological review is the second part of the evaluation research commissioned by the Ministry of Social Development (MSD) in 2005 to help in the preparation of the evaluation of the Working for Families (WFF) programme. This review enumerates the key evaluation questions identified by MSD as central to their policy concerns and considers how the features of WFF could affect evaluation. It details the methodological and data requirements that must be addressed in order to meet the four key evaluation objectives, namely: • tracking and evaluating the implementation and delivery of WFF • identifying changes in entitlement take-up and reasons for it • establishing the impact of WFF on employment-related outcomes • assessing WFF’s effect on net income and quality of life more generally. The methodological review complements the literature review by reviewing evaluations from around the world that are pertinent to WFF. An overview of evaluation methods is provided, concentrating on particular issues that arise within the WFF context. Section 2 focuses on implementation and delivery. Section 3 covers the issues related to take-up and entitlement and their evaluation. Section 4 discusses the evaluation methodologies that can be used in evaluating programmes such as WFF and introduces the data requirements they entail. Making work pay is the focus of section 5. Finally, section 6 examines hardship and poverty, living standards and wellbeing.
2
2 Implementation and delivery There are a number of issues to address in relation to implementation and delivery. The specific questions raised in the monitoring framework document relate to: 1. the effectiveness of changes to systems, processes and procedures in delivering
WFF to clients 2. whether business processes and procedures deliver WFF to target groups
effectively and, if not, what the barriers are 3. the impact of WFF delivery on the agencies themselves and their ability to deliver
other agency outcomes 4. the impact of policies and processes on take-up 5. whether groups who “access” assistance differ from those who do not, and why 6. the effectiveness of inter-agency co-operation. The information sought for each of these four broad sub-programmes is fairly similar and relates to: • application processes • resourcing • barriers and facilitators to implementation • clients’ experiences. The intention is to get this information through a mixture of documentary evidence, interviews with implementation team members, surveys of MSD and IRD staff, and administrative data – some of which has been set up specifically to monitor the implementation of WFF. This section will consider issues 1, 2, 3 and 6 noted above; issues 4 and 5 will be addressed in section 3.
2.1 The descriptive and evaluative tasks for the W FF evaluation Policymakers devise programmes such as WFF in the hope that the policy instruments will be implemented in the field as originally designed. To establish whether this in fact happens, they frequently commission evaluation research to establish what happened in the process of implementation. Central questions posed in such research are “Was everything implemented as planned?” and “Did the eligible population receive what they were entitled to receive?”. These are essentially descriptive questions. Policymakers also want to know what happened and, if it differed from what was anticipated, why it differed. These questions can be addressed through qualitative research identifying what happened, and what people thought about what was happening during the implementation process. Key informants are usually staff at different levels in administering organisations, contracted providers of services and “clients” with experience of applying for assistance. These questions can also be addressed through quantitative analysis of monitoring data, which establishes whether key indicators of the process are going in the anticipated direction.
2.2 The meaning of delivery “effectiveness” “Effectiveness” is referred to in three of the six issues identified above, but the meaning of “effective” is open to interpretation. It is usually deployed as a “relative”

3
rather than an “absolute” concept, so that the question is normally posed with some implicit comparison in mind. The benchmark might be expectations of some sort, relative to past performance, or perhaps the degree to which delivery meets a specific target. It might be reasonable to assume that delivery has been effective if the poverty reduction targets are met or if the take-up of assistance among those eligible is 100%. However, it is less clear that these outcome-oriented measures can deliver definitive answers to the “effectiveness” question when targets are missed: how far below 100% does take-up have to be before evaluators suggest delivery has been “ineffective”? As take-up is unlikely to be close to 100%, it will be advantageous for the evaluation to adopt explicit targets or use international benchmarks for take-up rates. The companion to this report, which contains a literature review, will provide useful international evidence.1 The monitoring framework poses effectiveness questions at different levels: at the level of sub-programmes and systems, the level of the whole programme, for individual agencies and for “networks” arising from inter-agency co-operation. Establishing the effectiveness of the programme and its constituent parts might be readily quantifiable, but “agency” and “network” effectiveness imply more qualitative assessments of effectiveness, along the lines of “Are things working effectively enough?”. Turning specifically to the question of the effectiveness of changes to systems, processes and procedures in delivering WFF to clients, it is necessary to establish whether new and “re-engineered” systems deliver administrative outputs to a level prescribed or anticipated in business plans or to a level that exceeds performance in the pre-programme period. Fundamental to any appraisal of changes along these dimensions are: • a clear understanding of what business processes were supposed to accompany
WFF • a knowledge of how they differed from the previous regime • information on procedural outcomes before and after the introduction of WFF. 2.2.1 “Hard” and “soft” measures There are two broad types of administrative “effectiveness” measures, loosely described as “hard” and “soft”. “Hard” measures are quantifiable indicators, such as the number of applications, the number of transactions, the number of errors per task, the size of errors made and time to process applications. These are standard measures in relation to accurate payments, but the information systems that generate them are not usually accessible for evaluation purposes. “Hard” measures from administrative systems can be configured in a variety of ways to obtain insights into different aspects of performance. For example, information on the number of tasks performed and time taken to perform them may be used as the basis for productivity estimates. If these outcomes are expressed in terms of labour input or costs, they can indicate labour productivity. Accounting for the number or size of errors in processing activities or applications can give measures of the quality of service provided. One of the difficulties with this data is that monitoring processes are not usually sophisticated enough to identify variation in time or cost per task across individual staff, regions or time. Instead, dedicated “time-and-motion” studies are performed to establish the relationship between inputs and outputs at a particular moment in time 1 Evans et al. (2006).

4
for a subset of tasks. These relationships are then used as benchmark indicators against which to test performance, or are simply taken as “given”. This is problematic because there is great variance in procedures and practices across individual staff, teams, offices, regions and time. The second set of outcomes is the “softer” measures based on survey respondents’ impressions of what, if anything, has changed and their attitudes towards the change. Measured staff perceptions can be meaningful evidence of change to processes where programme decisions are made by staff. Hence, there is a role for both hard and soft measures. Soft measures are discussed in relation to staff surveys in section 2.5.2.
2.3 “Barriers” to effective implementation A simple descriptive analysis of patterns of administrative inputs and outputs may indicate substantial variance across the administration of WFF. It might be assumed that this variance translates into variance in performance. Variance may indeed be associated with the quality and experience of front-line staff who deal with clients, office-level management and leadership, and the quality of guidance, all of which are amenable to optimisation through lesson learning. However, variance may also stem from the profile of clients and from the stage of the administrative intervention (from the impetus of a new policy drive through to the neglect characterising the period before policy replacement). It is difficult to isolate the factors that drive variance. Unless there is a systemic failure to deliver – as might occur with general information technology failures, which are immediately apparent – the best way to address “barriers” to implementation is to investigate variance in administrative outcomes across agencies, offices and staff. This implies there may be many lessons embedded in the analysis of within-office and across-office variance of administrative outcomes. This analysis might allow MSD to optimise its deployment of resources. However, acquiring this knowledge entails rigorous monitoring procedures over time and place, and depends on administrators’ preparedness to see their performance scrutinised by evaluators intent on raising standards of administration. There is a body of US evidence on local differences in delivery. Analysis of across-office and within-office variance in inputs and outcomes is an important part of describing sub-group impacts. This is true even in the US, where offices can have substantial autonomy in their deployment of resources and may be heavily penalised financially if they perform poorly relative to targets or other offices. Nevertheless, there is clear evidence from the US that the quality of provision and the nature of delivery are critical in determining the success of welfare-to-work programmes (Evans 2001). For instance, useful information is found for California’s Greater Avenues for Independence (GAIN) programme. Both the Riverside version of the programme, with its emphasis on work-first, and the Alameda version, with its strong encouragement for clients to enter education, were consistent with the overall GAIN framework, but that framework was flexible. The extent of permitted discretion in such cases means that between-site variations cannot necessarily be reduced to a matter of service intensity, as they can operate along different dimensions. Riccio and Orenstein (1996) discriminate between GAIN sites in terms of personalised attention and in terms of enforcement including the use of sanctions. In a more extensive
5
JOBS2 evaluation in Atlanta, Bloom et al. (2001 and 2003) use a “quick job entry” scale, personalised attention and monitoring among their discriminators. In the Michigan PRWORA3 study by Sandfort et al. (1998), an emphasis on focused job search assistance was found to have a negative relationship with aggregated employment outcomes, while the use of workshops to enhance job search skills was found to have a positive relationship. For the WFF evaluation, the above experiences indicate that a wide range of variables need to be taken into account when modelling variations in public service outcomes (Lynn et al. 2000). The particular selection of variables and the way in which they are used to frame hypotheses remain matters for judgement in the context of WFF. Three lessons have been learned from evidence to date. First, there is substantial across-region and across-office variance in the way programmes are administered and in the quality of service delivered (White 2004, Evans et al. 2002). Second, little is known about why these differences exist and, oftentimes, persist. However, there are exceptions. For instance, it is well known that some urban centres run programmes poorly because job opportunities beyond the agency mean agency wage rates are insufficient to retain staff, resulting in implementation problems associated with staff turnover and staff inexperience (Bryson and Jacobs 1992). It is also well established that rural areas often suffer from a dearth of job, training or childcare opportunities and, as such, place major constraints on the ability of programmes to run to their full potential (Bryson and Jacobs 1992). Third, evaluators scrutinising staff motivations and actions find they often operate within a “social” model that seeks to maximise what they perceive to be the client’s welfare, regardless of the rules laid down in statute or regulations (Bryson and Jacobs 1992). This is often interpreted by economists as behaviour consistent with maximising their own utility as staff, which they derive from the feeling of “doing good” rather than from following procedures. As a consequence, some studies find staff discretion militates against positive employment impacts (Frölich et al. 2003, Smith 2000). A number of implementation and delivery factors other than those relating to office and administrative practices influence the success or failure of programmes such as WFF. The key factors are listed in Box 2.1. In the case of WFF, issues such as “who gets what”, “when to intervene” and appropriate programme design are largely formalised and may not be amenable to alteration, even if they are creating difficulties for implementation and delivery.
2 The centrepiece of the 1988 Family Support Act (FSA) is the Job Opportunities and Basic Skills Training (JOBS) programme, which requires eligible recipients of Aid to Families with Dependent Children (AFDC) to participate in educational, job training and work experience, or job search activities, in order to reduce welfare dependency and to promote self-sufficiency. 3 In the US, the Personal Responsibility and Work Opportunity Reconciliation Act (PRWORA) of 1996 ended the federal guarantee of cash assistance and replaced the AFDC programme with the Temporary Assistance for Needy Families (TANF) programme.

6
Box 2.1 Implementation and delivery factors influencing programme success Who gets what? • those in receipt of payments v. those eligible not in receipt • sub-groups of the population receiving payments (unemployed people, sole
parents, sick and disabled people) When to intervene? • short-term v. long-term unemployed • younger v. older workers • conducive economic conditions • pilot before national roll-out v. pilot to test whether viable at all Where to intervene? • national v. local schemes • rural versus urban Who will deliver the programme? • agency collaboration • who will lead? • public v. private provision • local discretion versus central control • getting employers onside Programme design • carrot v. stick (compulsion for eligible groups or selective use of sanctions) • sequencing of elements in the programme • components to be delivered (job search, training, job creation, subsidies) Financing the policy • how to pay (windfall tax, spending review, matching funds from elsewhere) • incentives to succeed (output-related funding)

7
2.3.1 Who delivers the programme and how There may be more scope to manoeuvre who delivers the programme and how. Recent literature has devoted considerable attention to two aspects of who delivers; the role of the private sector and the role of inter-agency collaboration. Private sector provision has been piloted in a number of schemes in Britain (eg Employment Zones – see Hasluck et al. 2003 and Hales et al. 2003 – and the ONE programme – see Osgood et al. 2003), the Netherlands and Australia.4 This interest comes from the belief that efficiency gains may be made through the deployment of commercial managerial and systems knowledge. More broadly, there has been interest in overcoming communications difficulties, information technology problems and “cultural” barriers to implementation by formalising network structures among the agencies involved in different parts of the delivery process. In the case of WFF, delivery partners include government departments and their agencies (MSD, IRD, Treasury), local authorities, voluntary agencies and providers of formal childcare. This, in turn, has raised issues regarding optimal contracting arrangements. 2.3.2 Local discretion Another theme emerging from recent literature is the degree to which delivery should be controlled from the centre (see Department for Work and Pensions 2004). There is a growing belief that programmes can be run more effectively within a decentralised service delivery model – where offices have some degree of autonomy in deploying resources as they see fit – since this can correspond with the dictates of local circumstances and staff suggestions. Interest has extended to consider the degree to which local offices are cost or profit centres whose budgets are dependent, at least in part, on performance (Barnow and Smith (2004) give a good discussion of the role of performance standards). However, local-level variance in delivery has prompted some concerns about the need for standardisation of delivery where the service relates to the prompt and accurate payment of credits or benefits set down in law. Issues also arise with respect to equity across applicants for assistance, since what is on offer, and whether similar individuals are offered it, may become a “postcode lottery” where entitlements are denied or overridden by local factors. 2.3.3 Performance incentives There is also growing interest in maximising the “added value” of the staff working with clients through appropriately crafted financial incentives and by increasing the ambit for discretion. Once again, however, problems can arise. Financial incentives, either at individual, team or office level, may induce both negative and positive behavioural responses from staff. Movements away from a “rules-based” orientation towards discretion may empower staff and permit them to become more “client” focused instead of being “target” focused (“rule-bound”). However, this may lead to better outcomes only where staff are appropriately trained and capable of making reasonable judgements about an applicant’s best interests. Research for the US indicates that local offices respond to performance standards, but that short-term incentive structures often produce perverse long-term outcomes (Heckman et al. 2002).
4 For an OECD overview, see Struyven 2004 and Grubb 2004.
8
For WFF, it might be worth investigating the impact of existing performance incentives. In particular, attention could be given to the issue of “cream skimming”5 and the impact of staff treatment on the outcomes of those who are not targeted for treatment.
2.4 Delivery and implementation issues specific to WFF The issues noted here exclude those relating to identifying the eligible populations and take-up, which are covered in section 3. 2.4.1 Systems co-ordination across MSD and IRD WFF may face information technology-related issues. The fact that WFF is jointly administered by IRD and MSD introduces the issue of systems co-ordination across departments. These co-ordination issues may be particularly important for the 20,000 or so “double-dippers”6 in receipt of family income assistance from both MSD and IRD (IRD Data Warehouse Report of 2 December 2004), but will also be important for those eligibles moving onto and off income-tested payments, and thus into and out of MSD administrative responsibility. New procedures designed specifically to improve co-ordination between MSD and IRD with the aim of avoiding delays and overpayment/underpayment (eg the information exchange project between the agencies), means there is some compatibility between the computer systems. A further safeguard is that FIA details are stored in IRD’s tax administration data system. 2.4.2 Debt problems Debts can accrue when beneficiaries are overpaid, an issue that is usually identified when the IRD “squares up” at the end of the fiscal year. FIA debt rose between 1999 and 2002. The subsequent fall was due to IRD writing off debt and, from 2003, “proactive actions”, whereby actual income is matched to expected income. Nevertheless, FIA debt7 totalled $141 million in 2004 (Crown Revenue Statistics 2004, cited at 07.03 in MSD (2005c)). Debt also accrues through the Childcare Subsidy. WFF includes efforts to minimise the risk of debt, including ring-fencing Family Support, introducing a weekly payment option, automating information exchange between MSD and IRD, and using more proactive actions. The MSD debt department has also started to bill parents for overpayment. Given the difficulties low-income families face in servicing debt, this may be a high monitoring priority. There is scope to include questions related to debt, perhaps by survey, when evaluating hardship, living standards and wellbeing (see section 6.4). 2.4.3 Monitoring provision by contractors Social programmes such as WFF involve government agencies contracting with private agencies for the delivery of a range of services. Methods for monitoring delivery and implementation usually form part of the contract for the provision of services and reflect compromises based on perceptions of what is “do-able” and what is affordable. Government analysts and evaluators usually have to spend some
5 Cream skimming relates to selection; in this context, it is where service providers face a strong incentive to seek out those whose needs can be most easily met or can be met at the least cost compared with others eligible. 6 Note that “double-dippers” are not those who are overpaid, but those who illegitimately get Family Support payments from both IRD and MSD. 7 FIA debt accrues when overpayments are not repaid by the end-of-year tax-due date.

9
time to understand fully what these monitoring procedures cover, how they cover it and what they omit. This is often an onerous task. In WFF, perhaps the area most affected is childcare provision, which poses data challenges, as discussed in section 2.5.3. 2.4.4 Interactions with other programmes Competing and complementary programmes run alongside WFF. These programmes may interact with WFF in ways that affect its implementation and delivery – in particular localities or time frames or more generally. For instance, monitoring of WFF childcare subsidies will need to take account of other changes to the funding of early childhood education from April 2005. These changes include free early childhood education for three- and four-year-olds, which will be delivered from July 2007 through Ministry of Education bulk funding of providers.8 Fees will not be charged for the first 20 hours of care for eligible children: no childcare subsidy is payable in this case, so places and carers providing such care may be invisible to those monitoring WFF. In cases such as this, it is important to establish what was happening before the change and what happened afterwards. However, at best, one could estimate the impact of increasing the overall funding for childcare. Distinguishing between the impact of (increased) subsidies and bulk funding would be difficult, if not impossible, particularly as: • subsidies and bulk grants have been available for a number of years, although
the level of funding for both is increasing • most children who attend kindergartens (which provide part-time, sessional, early
childhood education) already receive free provision, and kindergartens account for just over 40% of the 98% of three- and four-year-old children who attend some form of early childhood education.
The other key issue that will make it hard to estimate the impact of WFF on childcare use is the intention to raise the quality of care. On one hand, this could make childcare more expensive and therefore less accessible. On the other hand, an increase in quality could lead to an increase in participation, as quality is known to have a considerable positive influence on parents’ decision to use formal childcare.
2.5 Data challenges and opportunities The above discussion suggests the need for data to describe the implementation processes, to identify barriers and facilitators to implementation and delivery, and to measure inputs in order to establish resource implications in optimising delivery. This section considers how existing and new data might help shed light on these issues. 2.5.1 Using existing administrative data In principle, administrative data can perform a range of functions crucial in tracking the implementation and delivery of WFF, including: • monitoring the movement of existing beneficiaries (the “stock”) from the “old”
regime onto WFF • measuring the inflow of new recipients (the “flow”) onto WFF
8 It is estimated that this will save MSD $15 million per year (email correspondence, J Marney, MSD, December 2004).

10
• identifying the churn in the WFF client population as individuals/households leave and re-enter WFF or move between MSD and IRD jurisdiction
• recording the delays between application and receipt of WFF payments • recording the sums received by applicants • identifying which types of person/household obtain which combination of
payments • identifying where beneficiaries go on leaving WFF. Analyses can be undertaken at an aggregated level to discern patterns relating to geographical, administrative, payment receipt or other indicators. Analyses may also be conducted at the level of individuals or households, in cross-section, through repeat cross-sectional snapshots or even longitudinally (where there is almost continuous observation of an individual’s status and circumstances). Administrative data may be used for other purposes too, such as identifying the percentage of invalid benefit recipients capable of working at least 15 hours per week. As discussed in section 3, administrative data will also be crucial in identifying eligibility for WFF and estimating take-up. However, there are many problems in configuring administrative data for evaluation purposes because this data was not originally intended for evaluation. Furthermore, even where practical constraints can be overcome, there may be legal and ethical issues in making full use of this data. We return to these issues in sections 3–6 in the context of the other evaluation objectives, where they are more pertinent. Data absence The first issue is total data absence. A number of administrative innovations in WFF, such as the national network of childcare co-ordinators, are departures from the previous system, so new administrative systems may be needed to track their implementation and delivery. Also, some agencies may never have been required to retain data permitting evaluation. This is often a problem with childcare providers. Although licensed and certified childcare providers are required to submit attendance schedules on a weekly basis to trigger reimbursement, a quality control system for this data has yet to be implemented. The lack of data relating to unlicensed providers, who may move into and/or out of licensed status, is also problematic. Data format A second issue relates to the format in which data is held. Administrative data is not usually amenable to analysis using standard statistical packages because it is held on dedicated systems designed to generate simple aggregate-level data. This seems to be the case, for instance, with SWIFTT, the client payroll system, which is currently used to produce 250 tables. SWIFTT has very rich data on payment recipients’ demographics, payment details and partners, but the data is not in a format that allows analysis of the microdata, and the database’s supporting documentation is complex. The IRD administrative data can be analysed through the IRD data warehouse, but fully utilising such data requires a considerable investment of time and effort. Partial data

11
In addition, data is often partial. A complete picture of payment receipt usually entails data-matching across administrative data-sets. For instance, MSD can track family income assistance payments but only for families with a core benefit whose income threshold is below a certain amount. IRD administers FIA payments for the eligible population whose gross household income is greater than $20,356, so a complete picture requires matching of the two data-sets. This requires legal and administrative permissions and unique identifiers on both data-sets. In most instances, data relates to successful applications only, so administrative data rarely contains sufficient information on the eligible population. Data is also often partial because it consists of records at individual rather than household level: households need to be constructed using identifiers linking adults and children. More on these last two points are found in section 3. Data error and imputations Data is often “dirty”. Administrative systems make up for historical inadequacies in data through imputation procedures that can introduce systematic measurement errors with respect to variables, such as the start and end dates of receiving a payment/benefit and the destination on leaving receipt. In the UK, independent analysts have been heavily involved in the construction and configuration of administratively based data-sets for the purpose of evaluating welfare programmes. This has given them an intimate knowledge of the limitations and pitfalls in using the data, improving their chances of analysing the data in an appropriate manner. It may be possible to develop this relationship with analysts in New Zealand. Using administrative data for identifying problems in implementation and delivery Analysts usually identify problems in implementation and delivery phases by checking patterns in data (delays, payment levels, uneven flows of recipients) at the office, district or region level. Thus, office or area identifiers are used as proxies for administrative variance. It is rare to obtain information offering a more precise fit – for example, in the form of individual staff caseloads and the number of staff and grading levels within offices. However, the availability of staff caseloads and other staff delivery variables might improve understanding of what is generating variance. 2.5.2 Generating new data It is unlikely that new administrative data sources will be created purely to track WFF implementation and delivery. However, as suggested above, it may be necessary to do this with respect to childcare providers; in any event, much may be done to reconfigure existing data in this area. New data is necessary, however, to obtain clearer information on detailed processes of delivery and to obtain insights from those administering the system to help establish linkages between what WFF is delivering and the administrative systems underpinning it. Qualitative and quantitative surveys of staff As this is a very broad topic, a brief overview only of the key points is presented. Qualitative and quantitative surveys of staff are a good way of establishing whether a policy has been implemented in practice and, if not, why not and what is happening instead. Information from these surveys may complement information from “hard” measures, but should be able to go further in understanding the mechanisms underlying observed outcomes. That is, the surveys should elicit information that

12
explains why implementation is taking place as it is. They are one of the best ways of exploring the extent of inter-agency co-operation and the institutional limitations on it. Bloom et al. (2003) and Riccio and Orenstein (1996) use staff surveys to identify local effects (see earlier discussion in section 2.3). Staff are also in a good position to evaluate whether or not changes in delivery are valuable, either in policy terms or in respondents’ own terms. They may, for example, identify unintended positive or negative effects of administrative changes. One of the consequences of programme change is the impact it has on staff as workers, in terms of workloads, motivation and job satisfaction. Assuming staff are important agents of change, changes in staff work methods and practices can be a useful early indicator of whether a programme is “bedding down” well or not. Staff surveys might also be able to indicate why staff are, or are not, “buying into” the new programme, offering analysts insights into ways of improving implementation and delivery.9 There are some obvious limits to what can be learned from staff surveys and self-report measures. A vast quantity of research exists on the limitations of the design of these questionnaires: see, for example, Anastasi (1976) or Oppenheim (1966).10 There may be systematic biases in responses if staff have ulterior motives for giving particular answers. For instance, they may stress the increased burden laid upon them, in the hope that extra resources will be forthcoming. The views of staff may be partial, either because they may be recently appointed to their role or because they see only a part of the programme. If there is a divergence of views on, for example, the advent or extensiveness of changes, the analyst may not know what weight to attach to opposing views. As with all subjective evaluative measures, there can be problems with interpersonal comparability (Manski 2004). If respondent A rates a change as “very effective” and respondent B rates it “quite effective”, how do we know that A is rating it higher than B and how do we know they are using comparable definitions of effectiveness? There are, however, means of overcoming some of these measurement difficulties using probabilistic measurements of expectation (Manski 2004). Also, panel surveys (which are repeated surveys of the same subjects) or longitudinal qualitative measures of individuals can help net out any fixed effect of being a “high” or “low” rater for individual-specific reasons, such as being an optimist or a pessimist. The systematic recording of staff actions on a database11 may provide more coverage and accurate data than surveys. Finally, surveys can be expensive. 2.5.3 Data for evaluating the implementation and delivery of Childcare Subsidies Monitoring the way Childcare Subsidies are implemented and delivered is a particularly important issue. There is real uncertainty about the impact of WFF on the demand for and supply of childcare and little data currently available with which to monitor the effect.
9 The human resource management literature is replete with studies identifying the human resource prerequisites to effective organisational change. Most invoke models making causal linkages to worker perceptions of their working environment, the impact these have on their levels of commitment and satisfaction, and outcomes in terms of labour turnover, productivity and so on. 10 A useful brief review of concerns with self-report measures can be found in Razavi (2001). 11 Typical staff actions that could be recorded might be “referred the client to a job”, “referred the client to a training programme” or “gave the client information about WFF”.

13
In order to gain an understanding of how increased Childcare Subsidies influence the behaviour of families and childcare services, surveys covering parents and providers would be required. The proposed Longitudinal Study of New Zealand Children and Families will undoubtedly be invaluable in tracking families’ experiences of childcare (for instance, cost, convenience, quality and take-up). There is also a plan to repeat the Childcare Survey carried out in 1998, which would also be very useful in exploring parents’ perspectives on this issue. For example, these surveys could assess the roles that information on childcare services and funding play in influencing parents’ childcare choices; explore parents’ views on childcare quality, affordability, accessibility and flexibility, and the extent to which services meet their needs (particularly in terms of opening hours, as these could considerably constrain parents’ employment options); and assess how subsidies influence parents’ childcare choices – for example, whether they enable or encourage families to use different types of non-parental care, substitute informal care with formal provision and/or switch to a more expensive service. On the supply side, the proposed survey of childcare service providers (as put forward by MSD in the draft WFF evaluation plan) will help with the following: • Identify how childcare providers adapt their systems to WFF, including differential
pricing between those eligible and ineligible for WFF. This issue will have to be explored in conjunction with changes aimed at increasing childcare quality, as these are also likely to affect fee levels.
• Establish the constraints on providers recruiting additional staff to increase
capacity (including those generated by recent government requirements for more registered staff).
• Understand the change, if any, in the quality and quantity of childcare supply; in
particular, whether there has been a net increase in the number of childcare places. A robust assessment of childcare quality would require researchers to visit childcare settings and collect data on different aspects of child–staff interaction, as this is one of the key determinants of quality; any other means would provide a rather “weak” measure of quality.
• Establish whether new childcare places have been filled by the eligible population
and, if so, whether this has been at the expense of the ineligible population; or whether some providers might be reluctant, for whatever reason, to offer places to eligibles, and the reasons for eligible families not being attractive to some providers.
• Establish if providers have targeted WFF-subsidised families for additional places
and why – for example, whether this decision was driven by the provider’s ethos/aims or profit focus.
• Establish if services have become more responsive to parents’ needs – for
example, in relation to opening hours and the flexibility of the service. • Explore issues around sustainability and financial viability, and the role of
subsidies and bulk grants in relation to these.

14
• Look at changes in the quantity, type and quality of provision among different types of service – for example, early childhood education and out-of-school childcare, group and home-based services, in the voluntary and private sectors.
It would be useful to use this survey, or data on providers, to examine the availability and price of childcare services on an area basis in order to identify any local differences. There may be difficulties obtaining a sampling frame for such a survey. MSD can identify childcare providers from payment of the subsidy to providers. However, this information will necessarily exclude providers who have not received subsidies, yet data on these providers may be crucial to understand the configuration of care in localities, including demand for and supply of that care. It would be very useful for the survey to cover all licensed providers12 to compare the experiences of services that receive the subsidies and those that do not. For example, the survey could assess how the availability (or lack) of subsidies might affect services’ ability to be more responsive to parents’ needs; might increase childcare quality or target those groups with poorer access to childcare; and might affect attitudes towards the service being open to subsidised children perhaps because of cultural issues such as köhanga reo or towards private providers in high-income areas. There might also be issues about the nature of such a survey and whether it is necessary to conduct visits and face-to-face interviews to establish the extent to which the care provided is commensurate with WFF subsidies paid. There is some monitoring of whether the children actually attend when subsidies have been received for them by providers. However, it is likely to be very difficult for a survey to collect this kind of data. To establish the extent of childcare supply, MSD is reliant on the Ministry of Education’s Annual Census of Childcare Service Providers. The census can provide information on the number of early childhood service providers by region, population density and hours of operation. It might be convenient to add questions to this census and link the survey of childcare providers to it. Using a census that was conducted before WFF was introduced and one conducted afterwards, it might be possible to establish whether the introduction of WFF corresponds to an increase in formal licensed provision. One would need to determine how to isolate any WFF effect from the effects of other ongoing policy changes (see section 2.4.4). MSD plans to use documentary analysis and interviews with implementation teams to track implementation and delivery of WFF childcare services. It might be worth including in this analysis other administrators who may not have direct responsibility for implementing WFF, to see whether they have a different view of the process. The interviews were scheduled for Spring 2005 and Spring 2006 to establish changes following increases in rates of subsidy in October 2005. The number of childcare co-ordinators is a potentially useful indicator of programme delivery progress, potential awareness and take-up, since the nationwide network of Work and Income childcare co-ordinators is the part of the programme planned to increase awareness and take-up of subsidies. If few co-ordinators have been established in this network, this may point to delivery problems, which may in turn limit awareness and take-up. Childcare co-ordinators can provide a crucial source of data on implementation, with the evaluation tapping into the data they collect
12 Although those who receive the subsidies could be oversampled (eg through screening) if it were not possible to identify them in advance.

15
routinely in their jobs. This can help identify the nature of providers and waiting lists. It usually saves a great deal of time if thought can be given to the data collection processes and data storage formats before co-ordinators “invent” their own systems. In this way, it is possible to standardise the items collected and to analyse them systematically. It is important to include in this element of the evaluation those who have responsibility for co-ordinating and supporting childcare services at the local level and for providing “market intelligence” to providers who want to set up a new service or expand an existing one. This would help in understanding the influences on providers’ behaviour and how these interact with the availability of subsidies and result in different outcomes (eg in relation to quantity, quality and type of provision, childcare fees and target groups). 2.5.4 Data for evaluating the implementation and delivery of Accommodation Supplement and In-Work Payment MSD and Housing New Zealand Corporation (HNZ) are reliant on SWIFTT to identify the number of Accommodation Supplement (AS) beneficiaries, the size of their payments and the non-benefit income they receive. This data might indicate the way AS changes are “bedding down”, particularly with respect to the amount of debt incurred through overpayment. More detailed information will, however, come from document analysis and interviews with implementation team members, together with a survey of WFF case managers. Baseline data was taken in March 2005 and, in the case of the survey of WFF case managers, will be updated regularly. An important aspect of the evaluation will be the experience of the call centres managing enquiries and applications. Monitoring of call-centre activity is sophisticated, so monitoring the number and nature of calls, waiting times and other indicators should be straightforward. It will be more difficult to assess the quality of advice and assistance given by call-centre staff and to identify barriers to improving their performance. This may require a dedicated staff survey or other anonymous checks, such as a mystery shopper exercise. Similar approaches are proposed for In-Work Payment (IWP), and similar issues arise with respect to the quality of service and access to advisers. However, some issues will require particular attention, since IRD administers this payment. These will include methods of delivering IWP to those who are working and not receiving other payments. 2.5.5 The potential value of laboratory experiments There are other innovative ways of identifying why a programme is being implemented in the way that it is, and how to improve the performance of administrators and systems. One only recently applied in the field of social policy administration is laboratory experimentation. This is covered only briefly here; more information on laboratory experiments can be found in Falk and Fehr (2003). Laboratory experiments are artificial settings created by evaluators to establish how actors respond to different stimuli, which can, in principle, be manipulated by third parties such as policymakers. In the case of WFF, laboratory experiments may help to identify how staff and/or clients respond to environmental factors, such as financial incentives, peer pressure and alternative staff methods. This will help reveal why these people behave as they do and how they might behave when those factors change.

16
The advantage of laboratory experiments is the level of control evaluators have over the setting. This makes them good for testing simple hypotheses regarding cause-and-effect, and the opportunity of honing procedures to improve efficiency. Laboratory experiments can also capture peer effects, which can be important in an office environment. Disadvantages, such as the artificiality of the environment created or the small stakes actors usually play for, can be rectified (Falk and Fehr 2003).
2.6 Thoughts on improving implementation and deliv ery of WFF in the future The current mode of delivering WFF appears to be largely decided. However, in the next phase of WFF, policymakers will want to explore ways to improve the programme’s administration where this might enable the programme to be delivered more effectively. This section outlines some of the issues worth considering. 2.6.1 Physical engagement with agencies Recent developments give business managers and policymakers more options in configuring the organisational form that agencies can take in the future. One development has been the capacity of technology to link clients and staff in different ways, without necessarily requiring face-to-face encounters. This raises the question of what added value there is to face-to-face engagement. If it is valued, how often is it required? A second development has been the growing recognition of the value of locally based initiatives, often in the community, an issue explored in the UK’s Ethnic Minority Outreach project (Barnes et al. 2005). Outreach facilities are particularly valuable in reaching some groups of single parents and sick and disabled people. The challenge here is to identify what appears to work well at a local level and what should be left to more “distant” structures. Another development has been the movement towards mentoring in support of job retention, requiring agency contact with people who remain clients even once they have entered jobs (Kellard et al. 2002). Again, this is an area undergoing development with evaluation underway in the Employment Retention and Advancement Demonstration13 in the UK. 2.6.2 The right provider? The role of contracting-out and privatisation As noted in section 2.4.3, there has been some experimentation with the role privatisation and contracting can play in improving the efficiency of services (Fay 1997). Evaluations to date have proved inconclusive (Grubb 2004, Hasluck et al. 2003; Hales et al. 2003). It is not clear that the private sector can provide efficiency savings or that it has managerial expertise that is lacking in the public sector. Indeed, in the UK, there are indications that private sector providers are not content to operate public job placement services at the prices currently on offer, and some contracts have not been renewed.
13 For information on the design, see Morris et al. (2003). For information on the evaluation, see http://www.mdrc.org/project_14_63.html.

17
On the other hand, contracting out to service providers – both not-for-profit and for-profit – is now widespread in the UK. Contracting with providers raises issues, notably including the contractual basis on which it is undertaken (especially weighting towards output-related funding; see Rolfe et al. 1996) and the variability of the provider pool across localities. Research might be able to identify the optimal basis for contracting, with providers being trained and initiatives being geared to increasing the number of potential good-quality contractors. Comparative research could play a valuable role. For instance, there are indications that the radical overhaul of the system in Australia has produced notable successes (Finn 2002). OECD research identifies a number of crucial dimensions of contract-setting that can enhance the performance of job placement services, including contract duration and size, monitoring processes, degree of specialisation, client choice, fee-setting and quality criteria for awarding contracts (Grubb 2004). This research suggests a number of ways by which performance might be improved in Britain, including the elimination of poor performers, methods for reducing transaction costs and steeper performance incentives (Grubb 2004). Key to these considerations is the extent to which systems and monitoring are centralised.14 2.6.3 Provision of technical assistance Technical field advisers have been used to oversee and assist the evaluation process in the Employment Retention and Advancement research in the UK. This has proved very useful. The technical adviser (TA) role was developed in the US by the Manpower Demonstration Research Corporation (MDRC) to liaise between local delivery staff and the evaluation project team to ensure the research and the programme unfold as planned. TAs with knowledge of the local implementation culture may be assigned to a given programme patch or, to save money, may move between regions. Because they may perform various operational and research activities over the course of the research project, the ideal candidates for the positions will have experience as either line staff or managers in social programmes, some background in research (through education or work) and an interest in and commitment to the research goals of the policy initiatives. 2.6.4 Large-scale project management Perhaps the greatest area for discretionary expenditure in service delivery relates to choice of computer hardware and software, and the subcontracting of work to implement and service large systems. Agencies often hit big problems when implementing new systems; this is due often to short timescales, badly negotiated contracts or the subsequent realisation that a system cannot deliver what was originally anticipated (eg Lissenburgh and Marsh 2003 p.24). Research into the role of this issue in service delivery would be valuable.
14 Systems at IRD seem to be quite centralised.
18
3 Take-up and entitlement The core issues for evaluation of take-up of the means-tested elements of WFF are: • capture entitlement to, and receipt of, the WFF package of transfers accurately
and thus measure take-up rates • identify reasons for applying for, receiving, or not receiving WFF • evaluate measures taken to improve take-up.
3.1 Capturing entitlement to and receipt of WFF At the heart of the concept of take-up is the idea that there are two main population groups to identify and study: • group 1, entitled non-recipients (ENRs) – those entitled to the WFF package of
transfers but are not observed to make an application for them • group 2, entitled recipients – those who are entitled to, apply for and receive WFF
payments. Estimates of take-up are usually expressed in the form of group 2 as a proportion of all those entitled (sum of groups 1 and 2). There are also those who receive the transfer but who are not entitled – non-entitled recipients. Levels of such receipt in most systems are non-trivial and result from either wrong information or incorrect assessment. Non-entitled recipients also occur because circumstances change over time and during the period of payment. The different rules for periodic reassessment for tax credits and for other elements of the WFF package mean that such changes in circumstance will lead to different patterns of non-entitled recipients across WFF. The treatment of non-entitled recipients in the calculation of take-up rates is covered in more detail below. WFF is an intervention based on a number of income transfers that can combine to give multiple entitlements, with entitled individuals and families moving from one element to another (out-of-work to in-work entitlement, for instance) and potentially having entitlement to more than one element at any particular time (Accommodation Supplement (AS) alongside the In-Work Support Payment, for instance). It is thus important to see take-up as an issue that not only addresses each element of the programme but also ensures that each subset of WFF entitlement is taken up when individuals access any part of the programme. Research in both the UK and the US shows such multiple-programme take-up to be problematic (Keane and Moffitt 1983; Hancock et al. 200415). It is difficult to give detailed advice on multiple take-up issues without an insider’s knowledge of how separate agencies interlink and co-operate on individual payment details and how systems share details across the different computational and payment systems. Entitled non-recipients will not, by definition, be recorded in WFF administrative data (but may be recorded in other administrative data such as income tax records, separate applications for AS or other transfers), so estimating the total entitled population relies on good-quality household income survey data. The UK has the longest and most consistent record of measuring take-up.16 It relied on the Family Expenditure Survey (FES), the equivalent to New Zealand’s Household Economic Survey, for many years, until the introduction of a more specialised annual survey, 15 This paper concerns pensioners but many of its findings are applicable to multiple entitlements for working age groups. For further discussion see Evans et al. (2006). 16 See Hernanz et al. 2004.

19
the Family Resources Survey (FRS). This was developed in the UK in 1992 for the purposes of better-quality modelling and estimation of benefits, pensions and taxation.17 Two measures of take-up are commonly used: • caseload – a headcount of entitled recipients as a proportion of all those entitled • expenditure – the total amount of payments received by entitled recipients as a
proportion of the total amount potentially available for all those entitled. The difference between these measures is crucial since it is a common finding across studies of take-up that those with larger monetary entitlements are more likely to apply for and receive transfers. This means that, for example, a 90% headcount take-up may reflect a 99% expenditure take-up, with the 10% of entitled non-recipients only accounting for 1% of the estimated budget. An early and important task in developing any methodology for estimating WFF take-up is the evaluation of the Household Economic Survey and other existing survey data, to establish their coverage and accuracy of data for estimating entitlement across the whole WFF package. For measuring entitlement and estimating take-up and associated outcomes, the most problematic area is often seen as accurate quantification of savings and other investments, and of capital resources. Such data on capital and income from capital is known to be subject to reporting and measurement error. However, at times of policy change, the likelihood of measurement error is increased. Careful consideration must also be given to ensuring that recipients and potential recipients can accurately identify entitlements they receive or do not receive in any survey instruments and interview protocols (for instance, whether to ask for documentary evidence alongside recall). Underpayment and overpayment of entitlement (to the point that survey data will find non-entitled recipients), and the associated variation of rates of entitlement to recover overpayments, are issues important to measure in take-up (see section 3.2 regarding transaction costs). 3.1.1 Difficulties identifying eligibility from survey data sources Surveys entail taking a subset from a known population and extrapolating from the analysis of the data to the population. The extrapolation is done by re-weighting the analysis back to population proportions using survey weights based on the inverse of an individual’s known probability of selection for the survey. Several problems arise with this procedure. Identifying suitable sampling frames The first hurdle to overcome is identifying a suitable sampling frame. For WFF this would be a population identifying all those with children. Since some may move into and out of eligibility with fluctuations in income and personal circumstances, it is
17 The FRS was launched in October 1992 to meet the information requirements of Department for Work and Pensions (DWP) analysts. Traditionally, the department had relied on other government social surveys, notably the FES and the General Household Survey (GHS). However, these surveys have relatively small sample sizes and therefore did not provide sufficiently reliable information on many groups in society that were of particular interest to the DWP. Households interviewed in the survey are asked a wide range of questions about their circumstances. Although some of the information collected is available elsewhere, the FRS provides new or much more detailed information in a number of areas and brings some topics together in one survey for the first time. The sample size allows more confidence in the analysis of smaller sub-groups, including, for example, regional breakdowns and analysis of recipients of certain benefits.

20
unwise to draw eligibility criteria too narrowly. It is important to retain those on the margins of eligibility, not only because they may shortly become eligible but also because they may provide useful comparators to those in receipt of WFF payments when assessing WFF impact on wellbeing and employment in other parts of the evaluation. Much could be learned from the sampling processes used for the studies evaluating the UK’s Working Families’ Tax Credit (see Brewer et al. 2005). Like WFF, this scheme offered substantial tax credit transfers to families up to the median equivalised household income. Sampling was based on records from Child Benefit, a non-income-tested benefit with an almost 100% take-up in Britain. The data also contained addresses, permitting the construction of a sampling frame for all families with children. In a second phase, it was possible to home in on families likely to be in or on the margins of eligibility using doorstep and other sift procedures. It is not clear that such a file exists in New Zealand. If it does not, there may be no alternative but to undertake a doorstep or telephone sift of the population in order to identify those in or on the margins of eligibility for WFF components, perhaps having excluded much-higher-income households using individual tax record data from IRD. This approach might be necessary anyway, for AS, which is available to low- and middle-income households without children. Identifying eligibility and entitlement with survey data Surveys measuring take-up of WFF require questions that collect all relevant information that may affect entitlement, including income sources and amounts, household structure, economic status including hours of work, age, residency and location. Existing micro-simulation based on Household Economic Survey (HES) data will provide a basis for examining how far existing data “captures” the full implementation of WFF. Efforts should be made to ensure that the periodicity of income measures and fluctuations in income are optimally captured. However, fluctuations and periodicity of income lead to difficulties in accurately capturing entitlement to tax credits that are reconciled on an annual basis. One of the greatest difficulties in survey research is identifying eligible non-recipients (ENRs) or non-participants. Research conducted at the Policy Studies Institute (Marsh and McKay 1993) indicates that the more accurately one obtains information about ENRs, the less eligible they look. This is because they often fail to qualify for support for reasons that are difficult to capture in basic sets of data on income and circumstances (eg because they have sources of income that are not immediately apparent). They may also fail to gain support because they are only on the margins of eligibility (eg because they have small entitlements, or are about to pass out of eligibility due to a foreseeable change of circumstance that the data analyst cannot see, making the application for payment not worthwhile). The need for large-scale surveys The precision of take-up and entitlement estimates depends on sample size. Furthermore, there is policy interest in sub-populations that are not very numerous in the New Zealand population as a whole. These include sub-groups of non-European ethnic groups, for instance. In order to make comparisons between low-incidence groups and across such groups, it is necessary to stratify the sample and over sample these groups so that sample sizes are sufficiently large to permit accurate assessments of their experiences. “Grossing up” is the term usually given in the UK to the process of applying factors to sample data so they yield estimates for the overall population. The simplest grossing system would be a single factor, the uniform grossing factor could be calculated as the number of households in the population divided by the number in the achieved sample. However, surveys are

21
normally grossed up by a more complex set of grossing factors, which attempt to correct for differential non-response at the same time as they scale up sample estimates. Grossing-up procedures have received considerable attention in the UK, and MSD would be well advised to use this experience as an illustration.18 Large samples also allow analysts some scope to deal with sample attrition and out-of-scope cases without having to resort to drawing further samples. They also permit more careful hypothesis testing, since smaller confidence intervals around estimates reduce the likelihood of rejecting a hypothesis that is actually true or accepting a hypothesis that is actually false. The major disadvantage of large-scale surveys is the cost incurred in interviewing and in processing data. These costs can be limited by clustering the sampling points used to obtain the sample, though this can come at some cost in sampling error. However, the loss of sample precision through clustering is usually small in social surveys of typical design. Survey non-response High response rates to surveys increase confidence in their quality and in the results obtained.19 Differential non-response between sub-groups can induce biases in survey estimates. Grossing-up and re-weighting surveys back to population proportions using observable characteristics is only a partial solution to the bias that non-response can induce, since the patterns of non-response may be correlated with unobservable attributes that may, nevertheless, be relevant in interpreting results. The characteristics of non-respondents can be partially captured in a variety of ways. Refusals and non-contact cases (where an address produces no contact) can be profiled with a minimal amount of data. Interviewers can code reasons for non-contact and a simple observation form can be filled out with data on the accommodation and any known characteristics of its occupants. Additionally, data on refusals can be captured by interviewers through a shortened list of questions given at the point of refusal. Current best practice in the UK on the Family Resources Survey can be seen in McCee et al. (2004). However, the influence of unobserved differences between non-respondents and respondents is, by definition, difficult to establish. Motivation levels may be correlated with the probability of response, as well as the likelihoods of receiving WFF payments and job entry. Hence, some survey costs should be focused on boosting response rates, which could be investigated with piloting. The detailed levels of necessary response rates and non-response thresholds will depend on future specification of research design and the needs of MSD to capture take-up and other phenomena in sub-groups of the population. A role for longitudinal survey data One approach to conceptualising take-up is to look at “frictional” elements of behaviour – delayed applications rather than a simple failure to apply.20 Longitudinal survey data, especially panel data, can also be an important additional source of
18 See http://www.dwp.gov.uk/asd/frs/2002_03/methodology/estimation.asp for the current approach to grossing up Family Resources Survey data for benefit policy estimation in the UK. 19 Target response rates are adopted by some organisations and governments. The US Office of Management and Budget (OMB), which governs federal surveys in the US, requires its agencies to employ procedures designed to maximise the likelihood of achieving an 80% response rate. However, this requirement is accompanied by a fairly conservative definition of response rate employed by OMB, which includes all the non-contacted sample in the calculation (no answers, busy signals, answering machines and call backs for telephone studies; non-answered mail for mail and Internet studies). 20 Discussed most clearly in Fry and Stark (1993) and Costigan et al. (1999).

22
take-up measurement alongside cross-sectional evidence to capture such delays and to capture income fluctuation over time. Additional data on income fluctuations can be used to calibrate and adjust cross-sectional measures of take-up of WFF tax credits, which are adjusted on an annual tax-year basis. Longitudinal data can follow individual and family circumstances as they change and allow us to observe differences in take-up behaviour. These arguments for longitudinal data are additional to those used elsewhere in this paper in the overall evaluation of WFF. However, attrition can be a problem, especially when correlated with outcomes of interest, as might be the case when residential mobility, induced by a switch in labour market or benefit status, results in the survey agency losing a respondent. Measurement error, including recall and awareness problems Survey responses to factual questions (whether you have received WFF payments and, if so, the type and size) are subject to error when respondents’ recall is inaccurate. The biases are not necessarily a problem if randomly distributed across respondents, but they will be problematic where they are large or associated with particular features of the recipient or his/her payment application. For example, it may be that those receiving smaller sums are less likely to recall their receipt, potentially lowering headcount estimates of take-up. It is usually informative to link survey data to administrative data to investigate the nature of these biases. Linking administrative data more generally for evaluation and take-up reasons can be problematic, and survey protocols and agreements with respondents may preclude linking data to tax and other records. The UK’s official estimates of take-up use administrative data to calculate the denominator (the actual number of recipients); using administrative data to calculate the true number of entitled recipients can add an element of precision to estimates that is not available to grossed-up estimates from survey data. Even administrative totals will require adjustment for non-entitled recipients and for non-household-based payments (for comparison with household survey data) and other adjustments. Some studies of take-up in the UK have used administrative records of one transfer (housing allowances in particular) to investigate take-up of another. In assessing survey information on the incidence and size of WFF payments, one must be aware that it will be difficult for recipients to know precisely which WFF payments they are receiving and how much they receive. The In-Work Payment (IWP), Family Support and Family Tax Credit are all tax credits paid directly into the principal caregiver’s bank account. The credits will be paid as a single sum when the recipient is in receipt of more than one credit, making it difficult for the recipient to distinguish one from another. Furthermore, the periodicity of payment could affect awareness of payments received. Payments are made weekly, fortnightly or annually, depending on the recipient’s choice. Those receiving more frequent payments are likely to factor them into household budgeting, making it likely that they will be aware of what they get and when. Those receiving annual payments may be aware of large sums but reconciling predicted and actual annual income may make it more difficult for them to recollect accurately what they receive. External validation Let us suppose a survey has a large achieved sample and a good response rate, with individuals drawn with known probability drawn from an accurate and up-to-date sampling frame. One is still left with the difficulty of interpreting the responses to specific questions. There are the issues of interpersonal comparability and of the extent to which any item is reliably measuring what the analyst thinks it is measuring. Questionnaire designers can avail themselves of question batteries that have been

23
tested for reliability across many surveys over time, such as those from the General Health Questionnaire (GHQ), which are interpreted as measures of wellbeing. However, asking about perceptions of services and experiences of payment in take-up and entitlement surveys often entails designing purpose-built questions. These can be tested with statistical procedures for validity and reliability in the context of the particular survey, but it is unclear how they might perform for another cohort, at another time, or if the order of questions is altered. External validation is possible through the repetition of tried-and-tested questions or the deployment of other methodologies bearing on the same issues. Once again, the UK is the main source of potential questionnaire design, since its package of transfers looks most similar to WFF. The documentation and questionnaires on the FRS and the Families and Children Study (FACS) are available online and can be accessed and compared with MSD’s needs.21 3.1.2 The role of administrative data Linking survey data to administrative data can help with problems of non-response and sample attrition. It can help verify individual-level entitlement as well as provide grossed-up totals of recipient numbers and expenditure totals for take-up measurement.22 An administrative data source used as a sampling frame may contain detailed information on the universe of interest. It may thus be used to model sample non-response and attrition, and therefore help to adjust for them in survey estimates of take-up, perceptions and experiences. It is unlikely that longitudinal data will contain the detail of income and assets necessary for full imputation of entitlement to the WFF package, but linking to administrative data could provide important insights into dynamic profiles of take-up, especially where differences in take-up between those entering work and those already in work may be important. 3.1.3 Comparing data sources for estimating take-up With respect to childcare assistance, MSD relies on a combination of SWIFTT administrative data and dedicated survey data to establish the proportion of eligible families taking up assistance, how they differ from existing beneficiaries of subsidised childcare, perceptions of the availability of places and the relative merits of formal and informal care. It is not obvious how a sample frame will be constructed for this survey; it may be that childcare providers will be sampled, with primary carers drawn from within those primary sampling units. There are certainly analytical advantages to linking carers with data on the care provider(s) they use. The Department of Labour may take the lead on some of these surveys. This data will be supplemented by the proposed survey of childcare service providers discussed in section 2.5.3. In addition to the MSD SWIFTT administrative data on AS payments, evaluation of AS entitlement will involve what appear to be three separate surveys: a national survey to identify families brought into eligibility by changes to rent and income thresholds; a communications evaluation survey focusing on awareness of eligibility
21 http://www.data-archive.ac.uk/doc/4803%5Cmrdoc%5Cpdf%5C4803userguide5.pdf and http://www.dwp.gov.uk/asd/frs/2003_04/methodology/questionnaire.asp for FRS; http://www.dwp.gov.uk/asd/asd5/facs/questionnaires/questionnaire4.pdf for FACS. 22 The UK’s Department for Work and Pensions baseline estimates of take-up are based on administrative totals of recipients and expenditure compared with FRS estimates of ENRs and ENR expenditure. See also the discussion of matching administrative data with survey data to validate take-up estimates in chapter 5 of Department for Work and Pensions (2005).

24
and entitlement; and a survey of clients exiting payment receipt who do not take up AS, to assess eligibility, awareness and reasons for failure to take up AS. The combination of these methods is likely to fulfil most evaluation requirements. The evaluation of IWP envisages a similar mix of data sources to that envisaged for AS (the communications evaluation survey, national survey data and a survey of clients exiting benefit, together with MSD administrative data). The advantages of administrative data are substantial. It not only contains the variables needed to establish eligibility and payment receipt, but it is also likely to be fairly error-free and individuals will be tracked by the system, provided they remain recipients of benefits or tax credits,. One further advantage is that the IRD data has been collected in a fairly standard fashion since 1996/1997 and, in the case of data on AS and childcare payments held by MSD, since 1992. This will allow analysis of patterns before and after the introduction of WFF. From an analytical perspective, if one wished to identify the effect of policy changes on take-up, the work and payment receipt histories of those with experience of the system would permit comparisons between seemingly similar individuals whose patterns of take-up differ. Of course, this identification strategy would be confined to individuals with some history of payment receipt recorded on the system. The recent OECD overview summarises the advantages and disadvantages of general-purpose survey data, of administrative data and of specifically designed surveys in the table, reproduced here as table 3.1. Table 3.1 Data sources: advantages and disadvantages Type of data Advantages Disadvantages General-purpose surveys • Information about both the eligible
and the recipients • Richness of information about other
individual and household characteristics
• Readily available
• Measurement errors of various types (timing of the survey, misreporting of income, etc)
• Small sample sizes for specific sub-groups of the population
Administrative records • Accuracy of information about recipients
• No information about the eligible non-recipients
• Scarcity of information about other individual and household characteristics
Specifically designed surveys
• Information about both the eligible and the recipients
• Richness of information about other individual and household characteristics
• Hard to generalise results when the survey is targeted to specific sub-groups
• Costly and time consuming to produce
Source: Hernanz et al. 2004:16. 3.1.4 Common methodological problems A range of commonly encountered methodological problems have been recently summarised in the Department for Work and Pensions (2005) in the UK. Private household assumption: There will be entitlement for individuals and families who do not live in private households and who, most probably, fall outside survey sampling frames. Adjustments to take-up estimates based on household surveys will be required for the denominator (the numerator will also need adjustment if based on administrative data). It is recommended that the number of non-household-based recipients is identified, together with an estimate of expenditure on them, in order to adjust household-survey-based take-up estimates.

25
Self-employment: Accurate modelling of entitlement for self-employed people is severely constrained. Methods will have to be developed to reflect both WFF payment entitlement rules and data quality for this group. Grossing-up: Investment in good quality grossing-up weights that reflect a number of population characteristics has been a feature of UK official measurement of take-up. See previous discussion. Awaiting the outcome of an application: A proportion of entitled non-recipients will be wrongly identified because they have made an application, but it is awaiting (a positive) determination. ENR estimates can be refined to eliminate such cases using administrative data or, if an application is recorded as being made in the survey data, by estimating the outcome. Accounting for errors: The Department for Work and Pensions in the UK identifies five types of error: • overstatement of entitlement to payments • under-reporting of benefit receipt • understatement of entitlement to payments • inaccurate grossing-up • payment to non-entitled cases. These problems and types of error mean that a variety of ranges of errors and error combinations will be found in most take-up estimates. Reporting take-up is thus advisably done in ranges rather than fixed estimates. One outcome of reporting in ranges is that, over time, it is more difficult to establish if take-up is increasing or decreasing unless changes in estimates occur outside of the range intervals. The last two methodological considerations (concerning waiting for the outcome of an application and accounting for errors) can also help conceptualise the dimensions of take-up. According to van Oorschot (1991), these dimensions can be thought of as the following: Primary versus secondary non-take-up: Primary non-take-up refers to not making an application or not receiving payment. Secondary non-take-up refers to wrongly determined ineligibles. Total versus partial non-take-up: Both primary and secondary non-take-up lead to total non-take-up of payments (payments are zero). There are also cases where take-up is partial and entitlement is actually higher than the (non-zero) payment received. Temporary versus permanent non-take-up: Temporary non-take-up is where a delay occurs between entitlement beginning and an application being made.
3.2 Identifying reasons for non-take-up There is a substantial literature on the theory of take-up,23 which is best summarised here as a split between individual and institutional factors with a variety of approaches that either concentrate on one of these factors or look across both of them. A full list of references and a fuller overview is given in the accompanying
23 See Hernanz et al. 2004, Currie 2004 and Dornan 2003, chapter 2.

26
literature review.24 The main arguments are summarised here only in order to contextualise methodological approaches. At the individual level, there are three main methods, each based on different assumptions and disciplinary approaches. • Economic studies tend to use cost–benefit assumptions to explain non-take-up by
looking at the relative individual costs and benefits of making an application. • Psychological models tend to look at motivation and different thresholds for
action. • Sociological models tend to look at group and individual identity (stigma),
networks, knowledge and various interpretations of agency. The literature on institutional factors relies more on explaining macro-level social and governmental attitudes and approaches to transfer policy along with more narrow concerns about the design and implementation of the programmes themselves.
Methodologically, evaluative studies that seek to explain take-up can go down two non-mutually exclusive potential paths: to sign up to one or more of the theoretical approaches (and design specific survey or other instruments to capture them); or to be more pragmatic and identify a common set of factors that cut across the different theoretical approaches to create an evidence base. The research concentrates on the second approach, as it involves a smaller commitment to new specific survey work and can occur as a review of both the current evidence from New Zealand general-purpose surveys and of the potential of current survey instruments to identify factors that can explain non-take-up. At the individual level, the following factors are important (many of these factors overlap and interrelate). • Complexity and ignorance: Thirty years of UK research consistently finds that
individuals often do not know or understand issues pertaining to entitlement to many benefits (Dornan 2003). There are also misunderstandings and misinterpretation – either that schemes are “not for them” when indeed they are, or that different elements of government assistance activity (tax, benefits of different types) are integrated and that an application for one is automatically an application for all forms of entitlement or that contact with one agency will be shared with all other government agencies concerned.25
• Personal characteristics: These are also important, with consistent evidence of
non-take-up associated with older people (in the UK) and race and ethnicity (in the US) and with some evidence of age of children affecting take-up for lone mothers (in the US). Education level and literacy are also linked to non-take-up.26
• Stigma: A large range of studies use different measures of stigma and find
relationships with non-take-up. However, there is no consistent or certain definition of stigma across these. Stigma seems to arise from cultural attitudes and from wider factors, and from more direct effects of the welfare system and its
24 Evans et al. (2006). 25 See Ritchie and Mathews 1982, Finch and Elam 1995 and National Audit Office 2002. 26 However, the approach and implementation of US welfare programmes probably mean that this finding cannot be generalised to other countries. On the other hand, the presence of young children will also be more closely linked to the “trigger” event of birth, which can lead to a claim.

27
perceived or experienced administration of benefits and attitudes to recipients. See the accompanying literature review for more details and references.27
• Transaction costs: These are sometimes seen as “information costs” and thus
linked to complexity and ignorance (mentioned above). Alternatively, such costs relate to the pecuniary gain from payment receipt – with short-term or low levels of entitlement seen as marginal reward for the costs of making an application. Other costs are seen as the procedures, delays, hassle and uncertainty (for instance, concerns about wrong payment and incurring debt) associated with making an application. The incidences of underpayment and overpayment can be important, and they link into debt issues. Recent work on tax credits in the UK and internationally has shown how annualised assessment and reviews can be problematic in this respect (Griggs et al. 2005, Howard 2004).
• The experience of “trigger” events: “Trigger” events are those that give
entitlement to transfers. Payments for children are triggered by birth, for instance, and income-related benefits can be triggered by loss of income – for example, at retirement, unemployment or sickness. Additionally, in the UK, there has been great investment in ensuring that in-work benefit entitlement is assessed and pre-applied in active labour market programmes, particularly for lone parents (Evans et al. 2003). Advice and advocacy can also be seen as a trigger event to start an application. Non-take-up can be linked to those with underlying low incomes who experience no defined trigger event – such as the stock of low-paid families already in work and their potential entitlement to in-work benefits.
It is obvious from the description of these factors that many of the so-called individual-level factors actually relate to institutional factors – the design and implementation of the benefits themselves. The aim of WFF policy is to increase take-up of a set of more generous transfers. Take-up is a systemic outcome based on a combination of institutional rules and behaviour (delivery factors) and individual-level behaviour (payment receipt factors). There is much that is built into the design of both transfers and their implementation that will affect take-up, including the following factors: • entitlement periods before review for changes of circumstances • cross-entitlement within the package of transfers and with the tax system – so
that information on entitlement to one element can be used to help establish entitlement to others (and thus reduce additional information required)
• potential “passporting” – where entitlement to one element is known to be coincidental to, or gives rise to, automated entitlement to another
• length and complexity of application form • tests of income and assets • evidential requirements • speed of assessment and payment • form and manner of payment • the use of caseworkers and other brokers of entitlement • the requirement to apply promptly and the ability to backdate. Where specific measures and practices are introduced to encourage take-up, these should be covered by specific questions to analyse their effectiveness.
27 Evans et al. (2006).

28
At present, we have some information on some of these items, from the following administrative data sources: • application forms requested and given • details of applications submitted and characteristics of recipients • outcomes of successful and unsuccessful applications • linking of applications/receipt over time and between overall elements of the WFF
package • accompanying institutional information (on caseload of employment services or
from outreach activity, for instance). As well as mapping take-up of entitlements, government departments wish to know more about perceptions of the service they provide and attitudes to the application process. Information on these is often considered to be an end in itself. It can also help explain variations in take-up that go beyond correlations with age, ethnicity and size of entitlement, since it can account for perceived costs and benefits of applying for payments. The factors involved include any stigma attached to making applications and any barriers to payment application inherent in the application process, such as the effort involved in making an application and the quality of information and advice on offer from staff. For instance, customer satisfaction surveys, which are occasionally disparaged by social scientists, can actually shed important light on the perceived costs of making an application and can be useful in understanding take-up and barriers to take-up. It is well established that awareness and knowledge of entitlements and application processes are correlated with applying for transfer payments, but it is unclear whether poor knowledge and awareness are causal factors explaining low take-up. This can only be clearly established with panel data that track individuals before they apply for payments. There is more robust evidence of links between advisers’ perceptions and people’s propensity to use a service. Front-line staff, as “gatekeepers” to the system, can deter people from applying, or encourage them to apply, in the first place. Staff, through their knowledge and dealings with the applicant, can influence the nature of a longer-term relationship. Case managers in employment advice can emphasise the benefits from applying for IWPs and tax credits that can influence job search and job entry. The crucial factor here is the degree to which advisers are “trusted” by applicants to help manage the perceived risk of changing their circumstances – for example, by entering work. This risk arises from the potential for disruption of income streams with a shift in personal circumstances (McLaughlin 1991). It is arguable that analyses in this area have not been as sophisticated as is merited by the issue. Consumer theories of market segmentation could be usefully deployed to distinguish between client types and between the multiple products and services on offer through WFF. This could be the basis for a better understanding of the way in which agencies can meet the needs of their various customers. Dorsett and Kasparova (2004) have recently used this approach when using cluster and factor analysis to classify payment recipients using FACS data, and it has also been used in analysis of the market for union membership (Bryson and Gomez 2003). A recent study to assess the feasibility of statistical profiling also uses what might be regarded as a market segmentation approach, since it seeks to allocate resources across clients according to their expected need (Bryson and Kasparova 2003). A matter of particular interest in WFF is the ability of recipients to choose the frequency of tax-credit payments – weekly, fortnightly or annually. A study of the
29
determinants of this choice could be very useful for the Government. Such a study could also contribute to the wider literature on public economics, which views such behaviour in terms of individual discount rates.
3.3 Evaluating measures taken to improve take-up There is a far larger literature suggesting remedies following analysis of reasons for non-take-up than there is of studies that have evaluated the success of pro-take-up programmes. In an OECD working paper, Hernanz et al. (2004:22) state that the evidence
... suggests the existence of significant interactions both among different welfare programmes, and between the welfare and the tax system. Receiving one benefit typically makes it more likely that the same person will also apply for other programmes. Careful design of the rules and regulations regarding eligibility for multiple programmes could both increase information and take-up among eligible individuals, and reduce fraudulent behaviour by the non-eligible. For example, one-stop shops introduced in several OECD countries – where individuals who apply for one benefit are automatically informed about other programmes they could be eligible for – could significantly increase take-up rates. Especially in times of reforms, the effect of the tax system on the incentives to take up welfare should also be carefully considered.
The possibility of using administrative data to improve take-up should be considered. IRD administrative data relating to Family Income Assistance (FIA) contains fairly rich information regarding demographic, family, income, work history, and payment/benefit history data. This information is initially generated when people approach IRD to make an application: they are required to register and complete a registration form before doing so. This means there is sufficient information held on IRD files to identify eligibility and the amount payable for applicants. The data is updated throughout the year and is longitudinal, so data is accurate. Profiles of FIA recipients are problematic because there are both “year-end” and “front-end” recipients, with end-of-year square-ups, and because inactive accounts are closed after two years. When IRD refers to the FIA population, it distinguishes between three populations: • the FIA-paid population – the total number of people who have elected to receive
their payments from IRD • the FIA-assessed population – the FIA-paid population plus those assessed for
their end-of-year square up; this includes those who receive their payments from MSD
• the “total” population – all those contacting IRD in the past two years, including the assessed, the FIA paid and those to be assessed by or transferred from MSD.
There may be value in distinguishing between these populations for evaluation purposes. It is not possible to identify an eligible population for WFF payments from administrative sources alone because IRD data is confined to families registering for assistance. IRD has no information on non-applicants who may be eligible for assistance. Furthermore, families who receive FIA via the benefit system only (ie from MSD) are not required to file returns and therefore IRD will not have any information about their family composition unless extra information is also transferred from MSD to IRD. This means that no single agency has administrative files covering

30
the whole FIA recipient population; the creation of such a file depends upon legal and technical hurdles being overcome. What, then, of MSD administrative data? This data is based on the client payroll system, SWIFTT, which holds demographic details of primary benefit recipients and partners if recorded, the recipient’s incomes, number of children, length of time receiving payments and changes in benefit/payment status. Hours of work are recorded if relevant to the benefit being received. Payments themselves – including those for AS and childcare payments – are traceable back to 1992. FIA payments are only observed for those below a certain income threshold who are in receipt of social assistance; otherwise, payments are made through IRD. The other major source of administrative data is SOLO, the MSD’s client activity management system. It records information on matching clients to employment and programme opportunities, and on employment-related activities and status. SOLO is confined to beneficiaries. Individuals receiving an assessment for payment or actual payment for a main social assistance benefit or superannuation from MSD are given a social welfare number (SWN). This number can be used to track changes in payments received and payments made to individuals. Eligibles who do not contact MSD do not enter the system for IRD, as administrative files cannot identify the whole eligible population. A further difficulty arises in creating household-level data from the individual files. This might be feasible using residential addresses to link individual files, but MSD can only accurately create family or couple groupings if the payment they apply for requires family-related information. Codes identifying the rate of payment may reveal whether a payment is received by an individual, family or couple, but this may prove inaccurate in some cases. To summarise, administrative data from MSD and IRD can identify the characteristics of individuals approaching agencies to apply for payments, estimate their entitlements and record the payments received. The whole applicant population would only be observable if IRD and MSD data were linked, which is practical but legally difficult. The data does not systematically identify household-level information. Nor does it identify eligibles and ineligibles in the non-applicant population. Turning to the eligible population for childcare subsidy, MSD collects data on the number of applications (granted and declined), payments to providers and information relating to parents. However, MSD does not hold data on eligibles who have not applied, so it is not possible to construct an eligible population from administrative sources alone. A further problem is that there is no data to establish which childcare places are taken up by WFF-eligible families and, if eligibles are taking a greater proportion of available places, the impact this has on the childcare options available to ineligibles. MSD refers to this as “an ongoing problem that was first identified in the Cabinet paper” (MSD written communication). Additionally, specific measures to improve take-up could be designed on an experimental basis – with a treatment and a control group to assess how far changing elements of administration, form design or other aspects of design and implementation can improve take-up. See the discussion in sections 2.5.5 and 4.3 on the advantages and disadvantages of such an approach. In relation to childcare subsidies, the issue of take-up will be inextricably linked to parents’ views and attitudes about formal childcare. It will therefore be very important to explore how the availability of subsidies might affect parents’ willingness to use formal provision and their perceptions of the accessibility of childcare services (for

31
example, of whether more places are created, whether they are more locally based and whether they are cheaper). The survey could also establish whether subsidies might affect parents’ choices in terms of provider types – for example, they might enable them to (partly) replace an informal carer with a formal provider or to switch to a higher-quality (but more expensive) service. The survey could also try to disentangle the effects of different influences (eg increased funding and higher quality standards), although since this analysis would be based on parents’ perceptions, it would provide only some softer measures of the impact of different types of intervention. Any changes in childcare prices that affect eligibility for subsidy will also affect take-up and will need to be examined in any survey and evaluation.

32
4 Identifying the causal impact of social programm es The purpose of policy evaluation is to assess whether, and by how much, changes in policy and the introduction of new programmes influence outcomes, such as employment and earnings for those subject to the policy change and those not. As one analyst noted:
The task of evaluation research lies in devising methods to reliably estimate [the impact of policy change], so that informed decisions about programme expansion and termination can be made. (Smith 2000:1)
The fact that WFF is not randomly assigned means that identifying its causal impact on outcomes such as employment, wages and wellbeing relies on the deployment of non-experimental methods. Some practical approaches to this problem are discussed in sections 5 and 6. This section introduces these methods in a more general way so that the reader is familiar with the principles underpinning the different approaches.28
4.1 Nature of the impact evaluation problem To know the effect of WFF on a participating individual, we must compare the observed outcome (eg employment) with the outcome that would have resulted had that person not participated in WFF. However, only one outcome is actually observed. This can be called the factual outcome. The so-called counterfactual29 outcome is that which would have resulted had the participating individual not participated (or had the non-participating individual participated). This counterfactual outcome cannot be observed, which is why the evaluation problem arises. Seen in this way, the essential difficulty in programme evaluation is one of missing data. Many approaches to evaluation attempt to provide an estimate of the counterfactual and to use this to identify the programme effect. 4.1.1 Types of impact It is unlikely that all individuals will respond to a policy intervention in precisely the same way. Rather, there will be heterogeneity (variation) in the impact across individuals. This insight raises two questions which evaluations might wish to address: • what impact programme participation would have on an individual drawn
randomly from the population – the average treatment effect (ATE)30 • what impact participation has on individuals who actually participated – the
average effect of treatment on the treated (TT). Both estimates are of interest, assuming the goal of the programme is efficiency rather than equity. While TT can indicate the average benefit of participation, ATE would be relevant were the policy interest focused on making a voluntary programme compulsory, for example. The “population” for the ATE might be wider or narrower – for example, it could be all working-age people, or all on low wages, or all potentially eligible for a (voluntary) programme.
28 This section draws heavily on Bryson et al. 2002. 29 In an experiment, this group would be the controls. 30 Note that the term conventionally used in the evaluation literature to indicate the programme is “treatment” and that for people participating in a programme is “treated”.

33
The two effects are identical if we assume homogeneous (equal) responses. However, where we allow for the more realistic scenario of responses varying across individuals, the measures can likewise differ. To illustrate, where a programme is voluntary, as in the case of WFF, we might anticipate that those who volunteer differ from the wider eligible population in terms of their expected gains from the programme: it is because they perceive benefits from participation that they participate in the first place. If this is so, it is unlikely that impact estimates for participants will be relevant for eligible non-participants. It is important for policymakers to be aware of the different treatment effects, for two reasons. • When comparing results across studies, the reader needs to be aware of which
treatment effect the study is addressing. In general, if those with the largest expected gains participate, ATE will be smaller than TT.
• Different policy questions are addressed by the different treatment effects. For
example, TT is the estimate that can answer the policy question of whether or not a programme should be abandoned since, if the mean pecuniary impact of treatment on the treated lies below the per-participant cost of the programme, there is a strong case for its elimination. When deciding whether to make a voluntary programme compulsory – extend it to the whole eligible population – the question becomes whether or not the mandatory programme would pass a cost–benefit test. (Note that there are difficulties in predicting the impact of a mandatory programme from evaluation of a voluntary one.) In this case, the parameter of interest is the ATE.
There is a third parameter of interest to policymakers. This is the impact of a policy introduced to affect people at the margin of participation – for instance, by widening eligibility or increasing outreach. The mean effect on those people whose participation changes as a result of the policy is known as the local average treatment effect (LATE). Since the most realistic policy option is often a modest expansion or contraction in the number of people participating in a programme, LATE may often be of most interest for policy.31 Box 4.1 Summary of types of impact • Average treatment effect (ATE): the impact programme participation would have
on an individual drawn randomly from the population. • Average effect of treatment on the treated (TT): the impact participation has on
individuals who actually participated. • Local average treatment effect (LATE): the mean effect on those people whose
participation changes as a result of the policy.
4.2 Solutions to the evaluation problem A simplistic approach to estimating the impact of WFF on an outcome would be to compare the outcomes of programme participants with those of non-participants. If those participating in the programme were a random sample of all those eligible, this would be a valid approach. However, as already noted, this is unlikely to be the case.
31 Formally and technically, a LATE depends on the existence of an instrumental variable. A change in a policy variable that is not an instrumental variable (although it might be what is called a policy instrument, which is something different) defines a marginal average treatment effect (MATE).

34
4.2.1 Selection bias In reality, such a simple comparison would result in a probable overestimation of the effectiveness of the programme. For instance, if those with more favourable labour market characteristics were more likely to have chosen to participate in WFF, it is probable that participating individuals would have done better on average than non-participating individuals, irrespective of whether they actually undertook the WFF assistance. This is the essence of the selection problem. To arrive at a valid estimate of a WFF impact, the effect of selection must be accounted for. The question of selection bias32 arises when some component of the participation decision is relevant to the process determining success in job search. More simply, selection bias can result when some of the determinants of participation also influence the outcome. 4.2.2 Observable and unobservable characteristics The relationship between the two processes may be able to be fully accounted for by observable characteristics. In this case, selection bias can be avoided simply by including the relevant variables in the equation explaining outcomes, and hence controlling for confounding observable characteristics. In the more general case, unobservable characteristics affecting participation can also influence outcomes. As an example of this, the impact of individual characteristics such as motivation and desire to do paid work is an important issue in the literature. It may be that more highly motivated individuals are more likely to participate in WFF and are also more likely to find work. In this case, the effects of motivation are correlated across the two equations. Controlling for differences in observable characteristics does nothing to alleviate this. Without addressing the issue of sample selection, the estimated impact of WFF on employment will will be biased (incorrectly estimated).33 However, it is worth mentioning that judicious use of observable characteristics can go some way towards minimising the bias associated with unobservables. In the example above, observables that are thought to be highly correlated with motivation, such as pre-programme unemployment duration, may capture some of the motivation effect. But some would argue that including such observables can introduce endogeneity (as a kind of lagged outcome). As another example of potentially unobservable differences between the treatment and comparison groups, consider the role of the administrator in selecting participants. Programme entry may be a function of administrator selection as well as of choice on the part of the individual applicant. Where administrators are discriminating between the less able and the better able, either consciously or otherwise, as a basis for programme selection, this process will bias estimates of programme effects if it is unobserved by the evaluator. This may occur where administrators are “cream skimming” (that is, taking the best for the programme), in which case programme effects will be overestimated. Equally, programme effects may be underestimated if the programme administrators are targeting programme resources on the least able.
32 Selection bias is bias resulting from the self-selection of individuals to participate in an activity or survey or as a subject in an experimental study. It may also arise if participants are selected non-randomly by others, such as programme administrators. 33 Despite the seemingly limited potential for administrator selection in the WFF programme, discretionary decisions are still made regarding eligibility and hence the issue of sample selection is not avoided.
35
A number of alternative approaches exists that take explicit account of the selection issue. These can be grouped under the broad headings of experimental and non-experimental approaches and are described briefly in sections 4.3 and 4.4. 4.2.3 General equilibrium effects Before turning to these techniques, it is worth noting that they have a common feature; they ignore the impact a programme may have on outcomes and behaviour of non-participants. These effects, known as general equilibrium effects, may arise where participants benefit to the detriment of non-participants. This may occur, for instance, where WFF participants are helped in such a way that they take jobs that would otherwise have gone to non-participants, such that participants simply substitute for non-participants. General equilibrium effects can negate the gains that a partial equilibrium framework suggests accrue to participants. Whether this occurs in practice depends on the nature and size of the programme. A small programme operating in a sizeable labour market is unlikely to generate noticeable general equilibrium effects. Programmes that increase the effective supply of labour by equipping the previously inactive with marketable skills will also have some negative effects on non-participants. Note that general equilibrium effects need not be negative, but can involve positive spillovers; however, for programmes that encourage search effort, they are likely to be negative. General equilibrium effects need to be taken into account in evaluating WFF given its size relative to the New Zealand population and labour market. A good discussion of general equilibrium effects is found in Heckman, Lochner and Taber (1998). See also sections 4.5 and 5.14 for further discussion.
4.3 Random assignment experiments Although there are unlikely to be any randomly assigned programmes in WFF, it is worthwhile mentioning the value of random assignment as an insight into the limitations of other methodologies. Random assignment experiments operate by creating a control group of individuals who are randomly denied access to a programme. Properly carried out, random assignment creates a control group comprising individuals with identical distributions of observable and unobservable characteristics to those in the treatment group (within sampling variation). The selection problem is overcome because participation is randomly determined. The mean outcome for those participating in the programme relative to that for those in the control group provides an estimate of the TT. While this is the parameter most commonly examined using random assignment, it is possible to design experiments in such a way as to derive estimates of ATE. 4.3.1 Practical problems Random assignment tends to be costly and requires close monitoring to ensure it is effectively administered, however. Random assignment experiments may also require informing potential participants of the possibility of being denied treatment. The potential for denying treatment can pose politically sensitive, ethical questions.34
34 Some opponents argue that there could be no role for experiments in social programmes. Yet some proponents argue there is a stronger ethical case for random assignment in social programmes when there is no strong evidence base regarding effectiveness of the programme, making it unclear whether there are potential benefits.

36
These may reduce the chances of an experiment being considered as a means of evaluating a programme. Ethical considerations may also increase the chances of those responsible for delivery of the programme being reluctant to co-operate. Other practical problems can bias the estimates. The implementation of the experiment itself may alter the framework within which the programme operates. This “randomisation bias” can arise for a number of reasons (Heckman and Smith 1995). For instance, if random exclusion from a programme de-motivates those who have been randomised out, they may perform more poorly than they might otherwise have done, and artificially boost the apparent advantages of participation. Furthermore, those receiving treatment may drop out of the programme. In this case, random assignment does not identify treatment on the treated but instead identifies the mean effect of “intent to treat”. This may or may not be of direct policy interest. Conversely, those denied treatment may choose to participate in programmes that are effective substitutes for the programme under evaluation.
4.4 Non-experimental approaches There are a number of non-experimental evaluation techniques, and the choice of best approach is determined in large part by practicalities. Specifically, the characteristics of the programme and the nature and quality of available data are key factors. Non-experimental techniques have one thing in common: in the absence of an observable counterfactual, assumptions have to be made to identify the causal effect of a policy or programme on the outcome of interest. These are termed identifying assumptions. In general, the fewer the assumptions made, and the more plausible they are, the more likely it is that estimated effects will approximate real programme effects.35 The main approaches are discussed, and their identifying assumptions highlighted, below. They are presented in two broad categories: before–after estimators and cross-section estimators. 4.4.1 Before–after estimators The essential idea of the before–after estimator is to compare the outcomes of a group of individuals after participating in a programme with the outcomes of the same or a broadly equivalent group before participating, and to view the difference as the estimate of TT. This approach has been widely used in evaluations, usually adjusting the results to control for the effect of observable characteristics. Given the nature of WFF and available data, this might be the only available technique in some cases. The identifying assumption for this estimator is that the difference between the true post-programme counterfactual and the pre-programme outcome averages out to zero across all individuals participating in the programme. In fact, so long as this averaging-out takes place, the approach does not require longitudinal data. Instead, it can be implemented with repeat cross-section data, so long as at least one cross-section is from a pre-programme period.
35 The plausibility of the assumptions is the most important aspect, rather than the number of assumptions.

37
Before–after estimators involve selection on unobservables. In essence, it assumes that the unobservables are specific to an individual and either fixed over time (individual effects) or not fixed over time (transitory effects). Participation in the programme is assumed to depend on the fixed effect and not the transitory effect. Clearly, macroeconomic changes between the two observation points will violate the assumption, as might changes in the lifecycle position of a cohort of participants. In addition, anticipation effects by participants and non-participants are problematic for the before–after estimator. Difference-in-differences In view of the likely transgression of the identifying assumption, a more widely used approach is the difference-in-differences (DiD) estimator, also known as the “natural experiment” approach (eg Blundell and MaCurdy 1999). DiD operates by comparing a before–after estimate for participants with a before–after estimate for non-participants and regarding the difference as TT. The identifying assumption is more plausible than that for the before–after estimator. Specifically, the average change in the no-programme outcome measure is assumed to be the same for participants and non-participants. What this means in effect is that the DiD estimator can cope with macroeconomic changes or changes in the lifecycle position, so long as those changes affect both participants and non-participants similarly. This highlights the need to select a suitable comparison group of non-participants. Often, the choice of comparison group is justified on the basis of it trending in a similar way to the treatment group with regard to the outcome variable in question over a prolonged period before the programme was introduced. While this is reassuring, it is usual to adjust DiD estimates for observable characteristics and consequently it is the regression-adjusted outcomes that should trend together rather than the outcome measures themselves. The effectiveness of the DiD estimator can be seen by considering the nature of the characteristics of the unobserved variables that may affect outcomes. In addition to the individual effects and transitory effects characterising the before–after estimator, an effect common to individuals but varying over time (trend effect) is also allowed for. As already noted, the before–after estimator eliminates the individual effects. The advantage of the DiD estimator is that it also removes the trend effects. Thus, the only remaining effect is that specific to the individual but varying over time. This cannot be controlled for, and should it influence the decision to participate in the programme, the identifying assumption will be violated and the resulting estimates biased. The fragility of the DiD estimator to violation of the identifying assumption can be seen by considering an empirical phenomenon which has become known as Ashenfelter’s dip. It has often been noted that participation in a training programme is more likely where there is a temporary reduction in earnings just before the programme takes place. Should earnings be mean-reverting,36 earnings growth among participants would exceed that among non-participants, irrespective of whether they received any training. Consequently, the DiD estimator (and the before–after estimator) will provide overestimates of programme effects on earnings in this
36 Mean reversion is a characteristic of certain statistical processes, and is the tendency to gravitate towards a “normal” equilibrium level.

38
scenario (Heckman and Smith 1999). This could be relevant also to wage supplementation programmes such as WFF, ie some people who receive payments could be in this position of a temporary dip in earnings, so change in earnings over time could be misleading as a measure of programme effect. Furthermore, the before–after estimator and the DiD estimator both rely on the composition of the treatment group remaining unchanged in the post-programme period. If this condition is not satisfied, the difference between the true counterfactual and the pre-programme outcome will not necessarily average out to zero across all individuals. Both panel and repeat cross-section data can be problematic with regard to changing composition of the treated and untreated populations. Changing composition can occur most obviously with repeat cross-section data but it is also possible with longitudinal data – for example, should the sample deplete over time on a systematic basis. 4.4.2 Cross-section estimators If longitudinal or repeat cross-section data is not available, other approaches must be considered. Cross-section estimators use non-participants to derive the counterfactual for participants. Until recently, a standard way to isolate the independent effect of programme participation on labour market and wellbeing outcomes involved using regression methods to control for observable differences between participants and non-participants. For example, to compare differences in the rates of a binary outcome (such as entry to work) between participants and non-participants after controlling for observable differences in the two groups, a logistic regression approach was used. The binary outcome was the dependent variable, and the observables plus a binary “participation” indicator were the independent variables. The coefficient for the “participation” indicator was interpreted as the programme effect on the treated, TT, after controlling for the observables. Implicit in this approach is the assumption that, having controlled for observables, participation is independent of the process determining outcomes. In other words, observables that enter the regression capture selection into the programme. As we note below, regression shares this assumption with the method of matching. Two other cross-sectional estimators that deal with selection on unobservables are common in the literature – instrumental variables and the Heckman selection estimator. Regression and instrumental variables The instrumental variables (IV) method is a regression approach possible when a variable can be identified that is related to participation but not outcomes. This variable is known as the instrument and it introduces an element of randomness into the assignment that approximates the effect of an experiment. Where an instrument exists, estimation of the treatment effect can proceed using a standard IV approach. One way to think about random assignment is that it provides the ideal instrumental variable. Where variation in the impact of treatment across people is not correlated with the instrument, the IV approach recovers an estimate of impact of treatment on the treated, TT. However, if the variation in gains is related to the instrument, the parameter estimated is LATE (Imbens and Angrist 1994). Consider the example of

39
using distance from a childcare centre as the instrument. If individuals know their gains from using the centre, then among participants, those from farther away need a larger gain than average to cover their higher cost of participating. Where there is such a correlation, LATE is estimated. As noted earlier, if the policy under consideration is a marginal increase or decrease in the costs of participation (childcare costs in the example), then LATE is the parameter of interest. The main drawback of the IV approach is that it will often be difficult to find a suitable instrument because, to identify the treatment effect, one needs at least one regressor that determines programme participation but is not itself determined by the factors that affect outcomes (Blundell and Costa Dias 2000, Heckman 1995). The instrument is most effective if it is virtually randomly assigned. There are few obvious instruments in the case of WFF, although distance from a childcare provider might be one, and non-linearities in income entitlements for assistance might also be plausible. Detailed knowledge of how a programme is administered can throw up ideas for instruments – hence the implementation and delivery evaluation data can link to the impact evaluation. Heckman selection estimator (control function) The Heckman selection estimator allows for selection into the treatment group on the basis of variables that are unobservable to the analyst. It operates by assuming a particular form for the distribution of the unobservable characteristics that jointly influence participation and outcome. By explicitly modelling the participation decision, it is possible to derive a variable that can be used to control for that part of the unobserved variation in the outcome equation that is correlated with the unobserved variation in the participation decision. Including this new variable alongside the observable variables in the outcome equation can result in unbiased estimates of the treatment effect. While not strictly necessary from a mathematical viewpoint, credible implementations include an instrument – that is, a variable included in the estimation of the participation equation that is excluded from the outcome equation. This approach appears to offer an elegant means of obtaining an estimate of TT in the presence of selection. However, there are two main drawbacks. First, as with the IV approach, the identification of a suitable instrument is often a significant practical obstacle to successful implementation. Second, the resulting estimates are entirely contingent on the underlying distributional assumption relating to the unobserved variables. In fact, research has shown that estimates can be surprisingly sensitive to these assumptions not being met.37 Method of matching The method of matching assumes selection on observables. For every individual in the treatment group, a matching individual is found from among the non-treatment group.38 The choice of match is dictated by observable characteristics. What is required is to match each individual in the treatment group with an untreated individual with similar characteristics. The mean effect of treatment can then be calculated as the average difference in outcomes between the treated and the matched non-treated.
37 See, for example, Goldberger (1983) and Puhani (2000). 38 In practice, participants may be matched to multiple non-participants. See, for example, Smith and Todd (2005) and Heckman, Lalonde and Smith (1999) for more about matching methods.
40
The approach has an intuitive appeal but rests on several assumptions. The first is that if one can control for observable differences in characteristics between the treated and non-treated groups, the outcome that would result in the absence of treatment is the same in both cases. This identifying assumption for matching, which is also the identifying assumption for the simple regression estimator, is known as the conditional independence assumption (CIA). It allows the counterfactual outcome for the treatment group to be inferred, and therefore for any differences between the treated and non-treated to be attributed to the effect of the programme. To be credible, a very rich dataset is required since the evaluator needs to be confident that all the variables affecting both participation and outcome are observed. That is, it is assumed that any selection on unobservables is trivial in that these unobservables do not affect outcomes in the absence of the treatment. Where data does not contain all the variables influencing both participation and the outcome, the CIA is violated since the programme effect will be accounted for in part by information that is not available to the evaluator. One example might be instances in which the evaluator is unaware of those approaching eligibility for the programme adjusting their behaviour in anticipation of programme entry by reducing their job search (the Ashenfelter’s dip noted earlier). This might affect both their probability of entering the programme and their likelihood of obtaining a job. Another example is where some of those eligible for a programme do not participate because they are expecting a job offer shortly. However, if the CIA holds, the matching process is analogous to creating an experimental dataset in that, conditional on observed characteristics, the selection process is random. Consequently, the distribution of the counterfactual outcomes for the treated is the same as the distribution of the observed outcomes for the non-treated. Matching makes an assumption made by all partial equilibrium estimators, that an individual’s programme participation decision does not depend on the decisions of others. This assumption would be violated if peer effects influenced participation. This might occur, for instance, where a programme targeted at single parents is highly regarded by participants locally, thus encouraging others to join. If this peer correlation is unrelated to outcomes, it becomes part of the error term in the participation equation and need not be a problem. However, where peer correlation is related to outcomes, estimates that cannot account for those peer effects will be biased. An example might be instances in which a programme offers a limited number of places such that decisions to participate now reduce the probability of other applicants entering the programme later. If decisions to participate early are correlated with factors that independently improve labour market prospects – such as motivation to get a job – estimates failing to account for this will be upwardly biased. It is possible to overcome this problem where proxies for supply constraints are available for inclusion in the estimation (Sianesi 2001). However, it should be noted that peer correlation unrelated to outcomes still has implications for the standard errors. Another assumption that is required for matching and all of the other partial equilibrium estimation strategies is the so-called SUTVA (stable unit treatment value assumption). This assumption says that the impact of the programme on one person does not depend on who else, or how many others, is/are in the programme. SUTVA is the assumption that the model’s representation of outcomes is adequate, ie that the observed outcome for an individual exposed to treatment depends only on the individual and not on treatments other individuals receive nor on the mechanism

41
assigning treatment to individuals, and that whether the individual participates depends only on the individual. A practical constraint exists in that as the number of characteristics used in the match increases the chances of finding a match reduce. It is easy to see that including even a relatively small number of characteristics can quickly result in some participants remaining unmatched. This obstacle was overcome thanks to an important result of Rosenbaum and Rubin (1983). This showed that matching on a single index reflecting the probability of participation could achieve consistent estimates of the treatment effect, in the same way as matching on all covariates. This index is the propensity score39 and this variant of matching is called “propensity score matching”. Its clear advantage is that it replaces high-dimensional matches with single-index matches. The problem of reduced chances of finding a match does not disappear entirely with propensity score matching, however. It is still possible there will be nobody in the non-treatment group with a propensity score that is “similar” to that of a particular treatment-group individual.40 This is known as the support problem, and means of addressing it vary in their level of complexity. However, they all operate by identifying participants who are poorly matched and omitting them from the estimation of treatment effects. What they seek to guarantee is that any combination of characteristics seen among those in the treatment group may also be observed among those in the non-treatment group. Where there is no support for the treated individual in the non-treated population, the treated individual is dropped from the analysis. The estimated treatment effect has then to be redefined as the mean treatment effect for those treated falling within the common support. In one way this is a strength of matching, since it makes explicit the need for common support across the treated and non-treated. However, enforcement of the common support can result in the loss of a sizeable proportion of the treated population, especially when considering multiple-treatment programmes. One must bear this in mind when considering the policy relevance of results. This is because the policy analyst wishes to know the effect of a policy on those who participate (or even on the whole eligible population), not just a sub-sample for whom common support is enforceable (see also section 4.1.1). If treatment effects vary non-randomly with those unsupported characteristics, the treatment effect relevant to the supported sub-population will not provide a consistent estimate for the unsupported sub-population. Whether this is a problem in practice will depend upon the proportion of the treatment group lost. In any event, it is informative to consider the characteristics of those treated who are lost to the analysis, since this will uncover the sorts of treated individuals who have no counterparts in the non-treated population. This can often tell a great deal about the nature of selection into a programme and provide important clues for the interpretation of estimated effects. The explicit acknowledgement of the common support problem is one of the main features distinguishing matching methods from standard parametric regressions. The problem is less severe with parametric approaches since the model results can be used to extrapolate to unsupported regions. However, such out-of-sample predictions
39 Note that the index used for matching need not necessarily be the probability of participation, although in practice it commonly is. 40 Participants are similar to non-participants in that their propensity to participate is similar. For this to happen, it is not necessary for the participant and matched non-participant to share characteristics. Rather, the values each has for the combination of variables entering the participation equation generate similar propensity scores.

42
will need to be carefully assessed. The other main distinguishing feature, already hinted at, is that matching is non-parametric. Consequently, it avoids the restrictions involved in models that require the relationship between characteristics and outcomes to be specified. If one is willing to impose a linear functional form, the matching estimator and the regression-based approach have the same identifying assumptions. While the use of matching has largely focused on participation or non-participation in a programme, there is often a need to consider programmes that may comprise several different types of treatment, as might be the case in WFF. Imbens (1999) and Lechner (2001a) show that the major results relating to the two-state framework extend straightforwardly to the case of multiple mutually exclusive treatments – that is, where an individual’s participation in one part of the programme precludes them from simultaneously participating in another part of the programme. Hence, matching can be used to evaluate more complex labour market programmes. Conditional difference-in-differences Heckman, Ichimura et al. (1998) proposed combining matching with difference-in-differences. This “conditional” DiD estimator allows for individual fixed effects and trend effects to influence participation. In other words, it weakens the identifying assumption for matching by allowing unobserved variables to influence participation. This weaker assumption was not rejected in their study.41 This methodology is perhaps among the most commonly used at present in the evaluation of welfare-to-work programmes.
4.5 General equilibrium effects 42 General equilibrium effects come about when programmes affect outcomes and behaviour of non-participants as well as of participants. Heckman, Lochner and Taber (1998) show that taking account of general equilibrium effects can strongly affect the impact estimates made using partial equilibrium analysis. However, there are considerable methodological difficulties in analysing general equilibrium effects such that “they will remain controversial in both the academic literature and the policy world” (Smith 2000:2). Smith goes on to argue:
Despite this controversy, evaluators should pay attention to general equilibrium effects, if only indirectly through examining the sensitivity of cost–benefit analyses to alternative assumptions about them. Such sensitivity analyses would represent an improvement on much current partial equilibrium research that simply ignores general equilibrium effects.
One way in which WFF may affect non-participants is through displacement (Calmfors 1994). In the context of WFF, displacement may occur because assistance such as that provided by additional subsidised childcare hours increases the speed with which participants leave out-of-work benefits for employment but slows down the return to work of others, since participants are competing for the same job places as WFF ineligibles. Related to this are substitution effects, whereby subsidies to one group of workers cause employers to substitute them for other unsubsidised workers.
41 For an application of conditional DiD to the evaluation of the New Deal in the UK, see Blundell et al. (2003) and Blundell and Costa Dias (2000). See Bergemann, Fitzenberger and Speckesser (2001) and Eichler and Lechner (2000) for applications of conditional DiD using matching. 42 This subsection draws heavily on Smith (2000).

43
A third consideration is deadweight effects, whereby a programme devotes time or resources to an activity that would have occurred anyway. Note that the usual partial equilibrium estimates are net of deadweight. Calmfors (1994) also notes the importance of tax effects, whereby the taxes collected to finance a programme may distort the choices and opportunities of both participants and non-participants. Tax effects do not appear to be relevant in the case of WFF since it is funded out of budget surpluses. However, estimation of displacement, substitution and deadweight effects is important in appraising the benefits of a programme net of its true costs and its distributional effects.43 This is particularly so for programmes such as WFF, which offers generous financial work incentives to a sizeable proportion of the population. 4.5.1 Estimating general equilibrium effects General equilibrium effects are usually recovered using structural models that involve making explicit assumptions about the mechanisms generating the general equilibrium effects. As well as being computationally and conceptually complex, these models rely upon strong assumptions about the functional forms of economic relationships and the values of economic parameters. All the partial equilibrium analyses described in sections 4.3 and 4.4 ignore displacement, substitution and deadweight, and thus estimate potentially biased programme effects. To illustrate for WFF, consider the impact of the In-Work Payment (IWP) on the annual earnings of participants versus a comparator group. If eligibles are induced to work, or to work for longer, by the offer of a tax credit, but IWP has displacement effects, these effects will show up as lower earnings among comparison-group members, some of whom will have been displaced, leading to an upward bias in the estimated impact of IWP on its participants. Empirical investigation of the general equilibrium effects of job-entry bonuses for the Unemployment Insurance (UI) population in the US reveals substantial deadweight (Meyer 1995) and displacement effects (Davidson and Woodbury 199344), the latter offsetting between one- and two-thirds of the gross impact obtained through partial equilibrium estimates.
4.6 Which techniques “work”? There is no single answer to this question. The choice of evaluation technique depends on the nature of the programme being evaluated plus the nature of the available dataset. The identifying assumptions that underlie each of the approaches may be more or less credible in particular applications. The key point is that all approaches involve assumptions being made, and these assumptions are generally untestable in practice. However, researchers have sought to appraise the plausibility of key assumptions by analysing experimental data using non-experimental techniques, judging the “success” of the non-experimental approaches by their ability to replicate experimental results. Findings are mixed. For instance, propensity score-matching techniques successfully replicate experimental results in one study (Dehijia and Wahba 1999) but not in others (Heckman et al. 1998; Smith and Todd 2000, 2003, 2005; Agodini and Dynarski 2001). Heckman et al. is the most comprehensive
43 A budget surplus does not mean that there are no deadweight costs, since opportunity costs matter. 44 Note that their results may be dependent on the assumption they make that total employment is fixed. This is reasonable in the short-term but not in the medium- or long-term.

44
attempt to use experimental data to examine the assumptions underlying various evaluation techniques. While the results are data dependent and not necessarily able to be generalised, they provide an insight into the strength of the assumptions underlying the main techniques. However, in general, studies comparing experimental and non-experimental results place non-experimental estimators at a disadvantage. This is because they rely on drawing comparison groups from localities other than those where the treatment occurs, and often use different data to construct predictor and outcome measures (see, for instance, LaLonde 1986; Dehijia and Wahba 1999; Smith and Todd 2000, 2003, 2005; and Agodini and Dynarski 2001).45 Even if, in a particular study, one or other of the assumptions underpinning a particular approach is likely to be violated, this does not mean that we should dismiss using that approach out of hand. It is also important to consider the likely seriousness of the violation and the direction of any bias introduced. Often, the assumptions are not justifiable and there is no prior knowledge of the relative magnitudes of the bias due to unobservables and that due to observables. It is then useful to apply matching methods to eliminate the bias due to observables first and then use different procedures to address the bias due to unobservables; this is the use of the conditional DiD estimator described at the end of section 4.4.2. However, the size of the WFF – that is, the percentage of the population eligible for the programme coupled with the size of the financial incentives it offers – suggests that the programme is liable to have a substantial impact on non-participants as well as participants. This indicates that the potential general equilibrium effects must be accounted for in any thorough investigation.
45 The comparisons using Job Training Partnership Act (JTPA) data in Heckman et al. (1998) are different in this respect because JTPA eligible non-participants are from the same local labour markets and have data collected in the same manner as a subset of people in the experiment.

45
5 Making work pay In this section, the issues related to evaluating the impact of WFF on making work pay are discussed. The methods of identifying causal impact introduced in section 4 are drawn upon.
5.1 The rationale behind WFF There is a unifying logic to the WFF interventions, namely that, although increases in paid employment can improve net household income, this is not always the case and that, furthermore, there is a strong perception among many who are out of work that the returns for paid work are insufficient to merit moving into the labour market, particularly for those with children. Thus, WFF seeks to “make work pay” through income transfers to workers that increase the net returns to working relative to being out of work. This is primarily achieved through income-tested transfers that, in reflecting assessed needs, are gradually withdrawn as net income rises. In social policy terms, WFF seeks to breach the “unemployment trap” associated with relatively high replacement ratios (albeit driven by low wages rather than high benefits) by offering state assistance to those moving into employment and, in some cases, lowering effective marginal tax rates (EMTRs). However, it does so at the expense of extending the “poverty trap” of EMTRs fairly high up the income scale to those who now become eligible for assistance. This scenario is fairly similar to the one faced in the UK, where, since the early 1990s, successive governments, Conservative and Labour, have increased the generosity of in-work wage supplements. In the 1980s and first half of the 1990s, this was undertaken in conjunction with a decline in the real value of out-of-work transfer payments (driven by a decision to “up rate” them by prices rather than earnings in the early 1980s) and an increase in the conditionality of any out-of-work payments to encourage job search and a closer attachment to the labour market. There are strong theoretical grounds for expecting offsetting effects from these financial incentives on parents’ labour market participation decisions. In theory, there are two decisions individuals (and households) must make. The first is whether or not to participate in the labour market at all. The second is, conditional on choosing to participate, deciding how many hours of paid labour to supply. Assume for the moment that these are relatively unconstrained choices of individuals and that the choice is determined largely by the net income generated by decisions and preferences for work versus leisure at different levels of net income. These decisions are affected by what economists call income and substitution effects. The income effect refers to changes in desired hours of work as individuals’ incomes change, holding the wage rate constant. If leisure is a normal good, the effect of higher income (with a constant wage rate) is to reduce labour supply. The substitution effect describes the effect on a person’s choice between hours of paid work and leisure as the wage rate changes, holding income constant. An increase in the net wage rate (with constant income) may be expected to increase labour supply. Policy reforms such as more generous tax credits involve both income and substitution effects, so the impact on labour supply cannot be predicted in advance. The income effect of a higher tax credit will reduce labour supply, whereas the substitution effect will increase it. At what point an individual will change their preference set depends, in part, on the costs they face and the utility they derive from each state. In extremis, those with high out-of-work utility may trade additional

46
income for leisure because the effective income guarantee offered by tax credits for relatively low hours of work makes leisure attractive above the qualifying hours’ threshold. Under these circumstances, the income effect outweighs the substitution effect, resulting in existing workers reducing their hours to close to the qualifying threshold. This phenomenon was observed among single parents in the UK eligible for wage supplements and is labelled the backward-bending labour supply curve by economists (Blundell 1994). The key point here is that, a priori, it is not obvious whether a certain set of financial incentives will induce people to supply their labour and, if they do, what hours they will choose. Nor do we know, a priori, what the new incentive set might do to the hours decisions of those already in employment, many of whom will be eligible for existing (less generous) assistance. However, there is a second component to WFF – increases in Family Support (FS) that are not conditional on employment status and thus offer more income to lower-income families regardless of employment status. This increase comes about partly through the transfer of the child component of the out-of-work benefit to FS, but also through above-inflation upratings. This approach, perhaps motivated by concerns about poverty, can also have ambiguous effects on labour supply. By increasing the income available to those out of work, it can make being out of work a more viable option, potentially extending periods of labour market inactivity. On the other hand, there is substantial evidence that interruptions to income flows during the transition into work, and the precariousness of many entry-level jobs, act as a disincentive to job entry among those reliant on out-of-work state support (Jenkins and Millar 1989). FS may assuage those concerns, assisting movement into work by offering a basic income that is not put at risk when a parent chooses to enter employment. There is evidence in Britain that policies designed to assist families with the perceived risk of transition into paid employment can increase labour market participation (McLaughlin 1991, 1994).
5.2 Household labour supply Many of those eligible for WFF are in couples, or are in the process of leaving or forming partnerships, whereupon labour supply decisions occur at the level of the household. This is because the unit for eligibility is the household (its income, its working hours, etc), such that the decisions of two parents are inextricably linked. That is to say, in a household context, there is interdependence between parents’ preferences, making the decision a household-level one rather than a purely individual one. This raises a number of important issues about the way in which incentives work and resultant choices.46 Consider three scenarios. The first is one in which both parents are out of work. Faced with greater financial incentives to enter employment, they must decide whether to do so, who moves into a job and what hours to work. In most countries, the hours condition for tax credit eligibility must be reached by one or other parent. Combined hours are not relevant. This usually results in one parent entering paid employment at or above the threshold. However, in the case of In-Work Payment (IWP), the hours condition is at the household level, so whether the eligibility threshold for IWP is reached depends on the sum of the couple’s working hours. In principle, this offers greater flexibility to the couple, both of whom may supply shorter
46 Note that preferences are constant in the standard model, but choices change.

47
working hours. That said, the threshold for a couple is 30 hours for IWP, almost twice the threshold for working tax credit in the UK (16 hours). It is possible that the IWP household-level hours threshold will help avoid the “dual earner” versus “no earner” (“work rich” and “work poor”) household divide which some in the UK attribute to the hours eligibility rules.47 In the second scenario, one parent is already in paid work but the second parent is considering whether to work or not. The IWP hours threshold rule could allow the couple to combine their hours in any number of ways to reach the 30-hour eligibility threshold. However, the low net returns to state-assisted households induced by relatively high EMTRs mean that second earners may only supply their labour when the combined earned income of both parents takes them well beyond the “poverty trap”. This is certainly the experience in the UK, where a decision to participate by a second earner is one of the primary routes off in-work assistance (Bryson and Marsh 1996). In the third scenario, both parents are in work but become eligible for the first time for tax credits or are eligible for more assistance than before. How do these low-earning two-earner households respond to the policy change? One possibility is that the parent with a lower attachment to the labour market will reduce their hours or withdraw completely from the labour market. In the literature, it is often assumed that the woman conditions her labour supply on her spouse’s labour supply, making her the secondary earner (this is known as the chauvinist model).
5.3 Other considerations in making work pay The stylised discussion above ignores some crucial points about the nature of labour market decisions made by households, which need to be considered in any evaluation of WFF. First, individual and household choices are often constrained. These constraints may be set by employers who are not amenable to offering “family-friendly” hours, either because they have cost implications for the firm or because they are simply viewed as inconvenient by the employer. One needs to survey employers to understand how they engage with this issue, or at least observe the changing distribution of hours offered by employers to eligible and non-eligible workers to establish how serious this constraint is. Another constraint is the availability of affordable and suitable childcare during working hours and while travelling to work. The total number of hours for which childcare is subsidised through WFF is substantial (up to 50 hours per week for those in employment or training, and nine hours for those seeking paid work). The subsidy meets all, or some, of the cost per hour of care, depending on the charge made by the provider and the income-testing of the parent(s). However, it is as yet unclear whether available care will be suitable in the eyes of parents.48
47 Since 2003, the amount payable for 30 hours’ working to couples in receipt of Working Tax Credit has been based on the couple’s joint hours. The effect of this change has yet to be evaluated. We thank Mike Brewer for pointing this out. 48 Suitability will turn on criteria such as quality, convenience and reliability. See section 2.5.3 for suggestions of how the Childcare Survey might cover these issues. The survey would also need to cover accessibility to family-friendly working arrangements, as these will shape parents’ work and childcare decisions. It will also be important for this survey to measure work and parental care preferences, as these might help in understanding for whom and under what circumstances childcare subsidies affect behaviour.

48
Second, labour supply choices are not purely calculations based on the net financial returns to paid employment relative to unemployment. These considerations are clearly very important, but they are not the only ones. Parents’ choices will be determined by the implications of labour market choices for their wellbeing and that of other family members. There are well-established psychological benefits to paid work for the workers themselves, associated with self-actualisation (Warr’s concept of job-related wellbeing; see Mullarkey et al. 1999), social status and social contact. However, these must be weighed against the opportunity costs of going to work, which might be particularly high for those who view their caring role as central to their own self-conception. Difficulties in obtaining entry-level jobs and holding onto them can also result in negative outcomes for parents and their children, including stress, reduced quality time for parent/child relationships, and the loss of the positives from working when those jobs disappear. Third, children make an input into the labour supply decisions of single and couple parents. They have their own perceptions of whether paid work is good for the parent, children and household, and they negotiate with parents over working patterns, care arrangements and so on, all of which can feature in the choices made by parents. Parents’ perceptions of children’s needs at different lifecycle stages will also influence parents’ choices, particularly among families with young children. Fourth, there are fixed costs to working, which are often overlooked. These relate not only to the childcare costs referred to above, but also to travel time and costs, the purchasing of work-related tools, clothes and other equipment and, in some cases, child-related expenditures following the cessation of “passported benefits” such as the community services card. Once such factors are taken into consideration, any net returns to working may diminish significantly.49 Fifth, there are time dimensions to the supply of labour, which cannot be captured simply in a “snapshot” before/after time frame. Most parents will be considering the consequences of entering, or not entering, the labour market or training for the medium and longer terms. For instance, the desire to fulfil a prime-carer role may delay a parent’s entry to the labour market for some years, even though the parent is eager to return to employment.
5.4 What is WFF offering? When faced with labour supply decisions, parents and households have a range of benefits and credits for which they may be eligible. Depending on their circumstances, many will be eligible for more than one benefit or credit. These transfers to individuals interact in a complex way, so it can often be difficult for individuals to establish precisely how well-off they might be by entering paid work and how the net returns might differ with the number of hours worked. What can look like a perfectly sensible set of arrangements on paper can prove to be very difficult to comprehend for a beneficiary or worker. Making the “right” choice can be difficult
49 According to Cabinet Policy Committee (2004 in Cabinet Paper minutes 04 13/4 point 109), the WFF reforms reforms “have the potential to cause an estimated 29,000 existing Community Services Card holders to lose their eligibility. The loss would, on average, cost current holders approximately $600 annually. Holders with chronic health problems have the potential to lose more from the loss of Community Services Card subsidies than they will gain from the Family Income Assistance reforms. In light of the above impacts, we propose increasing the Community Services Card eligibility thresholds at each of the three stages of the Family Income Assistance reforms to ensure all current recipients remain eligible for Community Services.”

49
without adequate information about the way the system works, which is why MSD advisers play such an important role in explaining what financial assistance is on offer and matching that to labour market opportunities. It is useful, nevertheless, to consider what WFF looks like “on paper” – that is to say, how the financial support package alters as individuals enter work and supply more hours. To do this, we present what economists term the budget constraint facing workers as they move up the hours’ distribution. The budget constraint comprises a level of non-labour income (income when hours of work are zero) and a schedule indicating net income for any number of hours worked. For a given wage rate and a specified level of non-labour income, utility-maximising individuals will simultaneously select whether to work or not and how many hours of work are desired. We present graphical illustrations of the way in which net income changes with hours worked due to the interaction of gross earnings and tax/benefit entitlements. We show the budget constraint for seven points in time, from pre-WFF in April 2004 through to April 2007, after the major WFF changes. In addition, we show how the state assistance package changes with additional hours of work in April 2004 and April 2007.50 What is on offer depends on entitlements determined by family type, gross hourly wages, housing costs and locality. We are grateful to analysts at MSD for providing the information used below. To simplify, we focus on the following four families: • Rod and Barb live with their three children aged 1, 5 and 7 in Auckland. They pay
$385 per week in rent and Rod works with a $25 per hour gross wage. • Rob and Aroha live with their two children aged 4 and 16 in Wairoa. They pay
$120 per week in rent and both work with a $12 per hour gross wage. • Pete and Sue live with their two children aged 6 and 12 in Timaru. They pay $150
per week in mortgage and both work with a $27.88 per hour gross wage. • Mary is a single parent with one child aged 4, living in Onehunga. She pays $255
per week in rent and works with an $11 per hour gross wage. Rod and Barb (figures 1a–1c) The budget constraints for Rod and Barb in April 2004, April 2007 and the intervening period are shown in Figures 1a–1c in appendix 1. At zero hours’ work, net household income rises from below $600 per week to almost $700 between April 2004 and April 2007, due to more generous entitlements to AS and FS. The removal of the AS abatement for beneficiaries in October 2004 produces a net income increase at low hours, but this Auckland family benefits particularly from the AS changes in maxima in April 2005. The FS up-ratings in April 2005 and April 2007 are particularly valuable for this three-child household, as is the introduction of IWP in April 2006, when the family work earnings are in excess of the eligibility threshold. There is an interaction between hourly pay rates, earnings and the eligibility threshold. Whereas in 2004 state assistance ceases at around 40 hours of work due to the low hourly rates of pay (see figure 1b), by April 2007 assistance is available through to around 55 hours due to the increased generosity of payments (see figure 1c).51 This additional assistance is apparent in the budget constraint (figure 1a), which shows much higher net incomes in 2007 than in 2004 until entitlements to state assistance diminish for hours in the mid-40s. This comes at the expense of high EMTRs. These were already high 50 The examples use hourly pay rates, which is useful for lower income groups, where this type of payment form is more common, and which also helps illustrate the work impacts; however, the eligibility for payments is related to earnings, which will reflect both the pay rate and number of hours worked. 51 Obviously, the example does not reflect all cases, as someone working for a very low hourly pay rate will be able to work a much greater number of hours before eligibility is affected than someone on a higher hourly rate.
50
in 2004 for low hours working, averaging close to 100% through to 20 hours, but similar EMTRs also exist by 2007 in the over-40-hour range, whereas the absence of assistance meant EMTRs of around 40% previous to 2004. Rob and Aroha (figures 2a–2c) Rob and Aroha differ in a number of ways from Rod and Barb. The budget constraints for Rob and Aroha are shown in figures 2a–2c in appendix 1. They have only two children, they are in receipt of Unemployment Benefit and their rental costs are considerably lower. Both parents are working but have much lower hourly earnings than Rod. Indeed, at $12 per hour, their earnings are only 1.25 times the adult minimum wage. The assistance package available to them in 2004 differs accordingly. They have only a small entitlement to AS and they are eligible for substantial childcare subsidy (which is paid to the childcare provider). In April 2004, the budget constraint remains very flat up to around 30 hours’ work, when it actually dips because of an EMTR above 100% due to a drop in benefit income. The budget constraint then climbs steadily, with the household still eligible for substantial assistance at 60 hours’ work. By April 2007, as in the case of Rod and Barb, net income is appreciably higher at zero hours. Net returns to working are roughly constant in the 8- to 30-hour range in 2007, as in 2004, due to high EMTRs of close to 100%. Around the 30-hour mark, net returns to working improve from April 2006 due to FTC changes, which eliminate the very high EMTR at that point. The substantial hike in net incomes from April 2006 compared with October 2005 from the 30-hour point is due to the advent of IWP. This household continues to be eligible for substantial FS/IWP and childcare subsidy even at 60 hours’ employment. Pete and Sue (figures 3a–3c) Like Rob and Aroha, Pete and Sue are married with two children, but their hourly earnings are considerably higher and they have a mortgage rather than renting. Figures 3a–3c in appendix 1 illustrate their budget constraint changes. This is a household facing a fairly smooth budget constraint with high EMTRs of close to 100% between four and 18 hours, a situation that remains unchanged after the introduction of WFF. There is some increase in net income through gradual upratings of FS and AS, with the latter payable further up the hours distribution, but the only substantial change affecting this household is the advent of IWP, which increases net earnings in the 30- to 40-hour range from April 2006. Due to their high hourly earnings (close to double the median hourly wage in 2004 of $15.3452), assistance ceases at a little over 40 hours. Mary (figures 4a–4c) Mary is one of many single parents expected to benefit financially from WFF. Mary’s budget constraint is shown in figures 4a–4c in appendix 1. She is a low earner, with a gross hourly wage only 1.2 times the adult minimum wage, and her rent is fairly high. The budget constraint shows she will benefit substantially from WFF, regardless of the hours she works, although compared with the pre-WFF regime of April 2004 the net returns to working are particularly high for long hours of work. High EMTRs of nearly 100% in the hours range 16–44 mean she can do little to improve her net income by working more hours over that range. Even beyond these hours, the net returns to working remain modest until, from April 2006, there is a substantial increase in income arising from IWP. Compared with 2004, Mary receives
52 Statistics New Zealand 2004.

51
considerably more in childcare assistance, IWP and FS in the 50- to 60-hour range in 2007. Within economics, the decision between hours of work and hours of leisure is treated as part of neoclassical consumer theory. The budget constraint is the “objective” component, but where people place themselves on the budget constraint is determined by the “subjective” component, namely their indifference curves. The illustrations above nevertheless illustrate how the objective component differs across household types, pointing to the potential for heterogeneous impacts across households and thus the value of sub-group analyses.
5.5 Effects of WFF 5.5.1 Routes by which WFF may affect aggregate employment There are five direct ways that WFF may affect aggregate employment. The first is the rate at which individuals take up paid work. It is possible that some non-workers will contemplate paid work for the first time due to the new incentives regime set by WFF,53 while others will simply enter employment more rapidly than they might have anticipated. If a person expects entitlements to rise substantially with a forthcoming event – for instance, the ageing of a child – this may slow the rate of job entry. Second, some may remain in jobs for longer than they otherwise would have done. This happens because wage supplements have the effect of smoothing individuals’ and households’ incomes over difficult periods. In the absence of a tax credit, those facing cuts in overtime payments, reductions in hours or the birth of a new child might have left their jobs due to difficulties making ends meet. With wage supplementation, these decisions can be delayed or do not arise because the extra income coming into the household makes job exit unnecessary. There is substantial evidence that this was the prime reason that family credit raised employment rates for low-income families in Britain (Bryson and Marsh 1996; Kempson, Bryson and Rowlingson 1994). Third, total hours will depend upon the hours worked by new workers, plus the hours’ adjustments made by existing workers. Existing workers below the hours qualifying threshold may find that a small increase in their hours results in a substantial rise in net income, inducing a supply of more hours. However, this may be offset by those well above the hours threshold who, faced with a poverty trap and relatively high out-of-work utility, choose to cut their hours, so maximising their per-hour income from working. Fourth, the credit may induce workers to accept wages that are below those they might otherwise be prepared to take – something described in the economics literature as lowering their reservation wage, namely the price at which they are prepared to enter the market. This can have other consequences: for instance, if it means they are induced to enter a “poor” job that they might not have otherwise gone for, the poor job match may result in them exiting that job more quickly than the job they might have entered if they had prolonged their job search to find a better “match”.
53 There are other incentive effects of WFF than on employment – for example, wage changes may affect incentives to invest in human capital (training on the job or externally) and there are also the effects of WFF on the incentive to take compensation in kind rather than in wages.

52
The fifth direct WFF effect on employment levels arises from the general equilibrium effects (discussed in section 4.5) through its impact on non-participants’ behaviour and opportunities through displacement and substitution effects. In addition to these effects, there are the second-order effects associated with WFF’s impact on wage-setting, labour demand and consumer behaviour. It is conceivable that WFF will increase the overall demand for labour. If IWP wage supplements reduce the price of labour relative to capital, employers may substitute labour for capital where opportunities arise. In addition, WFF may increase the effective labour supply by, for instance, increasing job search activity or increasing the pool of Invalid’s Benefit clients willing to do more than 15 hours’ work per week. If this happens, it may drive down equilibrium wages, or at least reduce wage inflation pressures and, other things being equal, increase the number of job places offered by employers (Layard et al. 1991).54 A similar effect might occur if wage-setting behaviour alters. This may happen in a number of ways. Employers aware of widespread wage subsidies may drop wages to the statutory minimum, or to some point lower than ambient wages, knowing that the shortfall will be made up by the state.55 The lower cost per job slot may induce employers to offer more jobs. Even if employers are unaware of the extent of state wage supplements, employees may be less demanding with respect to wages, knowing that high EMTRs within the WFF eligibility range lower net returns from wage rises compared with what they might otherwise be. Under these circumstances, employers may find that they face less demand from employees for wage hikes or less wage competition more generally. This may induce a downward drift in wages due to a diminution in pressures to maintain the real value of wages. On the other hand, if aggregate employment rises, so too will the aggregate wage bill, barring a substantial drop in earnings. In these circumstances, jobs growth could come through a multiplier effect whereby employees have more money to spend on domestic goods, resulting in greater labour demand.56 5.5.2 WFF effects on wages and promotion We have already noted that WFF may influence wage setting in the economy. However, WFF tax credits may also have ambiguous effects on workers’ wage growth and incentives to invest in jobs (Lydon and Walker 2003, Bryson 1998). High EMTRs for those eligible for income-tested benefits can blunt the incentive to enhance their earnings potential through human capital investments, such as on- or off-the-job training, and reduce their inclination to seek promotion because such activity is effectively taxed by the high EMTR. An employer may be less inclined to reward an employee financially if they know the worker will lose much of an increase in forgone state assistance. On the other hand, an employer may have more financial resources available to train workers if credit subsidies to workers exert downward pressure on wage inflation, potentially increasing the supply of wage-enhancing employer-provided training. On the worker side, if we assume that workers have to co-fund general training with the employer because the employer will not recoup all of the returns from that training, this will usually mean the worker taking a lower wage to help fund that general training. If this training effect occurs, then it may increase
54 Of course, in a competitive labour market, increased demand for labour would, other things being equal, begin to push up the price of labour again. 55 Callender et al. (1995) found the UK family credit system had no such effect on wage-setting. This is not that surprising since, in practice, employers are constrained in their wage-setting by equity considerations, recruitment and retention pressures and because they use wages to enhance worker efficiency. 56 The distributional effects of welfare reform are discussed in Bitler et al. (2004).

53
the propensity of workers to engage in general human-capital-enhancing training. Furthermore, it is conceivable that any such effects will be countered by the returns to work experience, which are enhanced by the programme if WFF induces more rapid job entry than would otherwise be the case. If wage subsidies induce job entry at pay rates below those that individuals might otherwise expect, one might expect those workers’ wages to revert, before long, to those obtained by “like” workers – a process that would show up as accelerated wage growth associated with the credit. 5.5.3 Other potential WFF impacts pertinent to “making work pay” The discussion so far has identified possible WFF effects on a number of outcomes pertinent to the “making work pay” agenda of MSD. At the level of the individual, there are the issues of job entry (whether to enter and the rate of entry); job retention (usually measured in terms of the elapsed time to job exit); hours choices; promotion and training decisions; and earnings levels and earnings growth. These all have their counterparts at household level and economy wide. For instance, job entry and exit rates determine the rate of labour turnover in the economy and are related to job creation and job destruction rates. There are three other types of outcome pertinent to WFF’s objective of making work pay – wellbeing, labour market orientation and labour market activity short of job entry. Individuals’ perceptions of their wellbeing and that of their family, and how both might be influenced by job entry, were mentioned above as among the subjective costs and benefits of entering the labour market. Even though the psychological benefits of paid work are well established (Jackson 1994), it is unclear whether WFF-induced entry will have net psychological benefits for individuals and their families. WFF jobs may differ in a number of dimensions from those that individuals might otherwise have entered. For instance, they may be lower paid, of shorter hours or be entered more quickly than jobs that individuals may otherwise have obtained (as discussed previously). These criteria may positively or negatively affect how individuals feel about themselves and their family circumstances. The only way to measure WFF effects is to conduct surveys of individuals’ wellbeing before and after WFF reforms such as IWP. The Families and Children Study (FACS), a series of surveys known as the Programme of Research into Low-Income Families (PRILIF) and other studies conducted in Britain, discussed in section 6.4.1, identify methodological considerations in conducting such surveys. Policies may be regarded as successful where they encourage those in receipt of payments to take a more positive attitude to working and making a contribution to society. Such changes may be visible in terms of changing behaviour or may be measured by attitude surveys. This criterion of success is valid if policymakers are content to get people “closer to work” by increasing their employability, even if they do not actually take work. Thus, even if WFF does not affect job entry, it may bring about changes in individuals’ orientation towards employment or their labour market activity. For instance, individuals may become more work-focused if they see greater financial rewards from entering paid work. This may manifest itself in positive orientations towards employment in the form of work commitment, for instance, or in job search behaviour (eg shifting from being wholly inactive to beginning some search, or increasing the intensity of job search, or lowering expectations about the sorts of jobs one is prepared to take). There have been efforts to measure such effects (eg Bryson, Knight and White (2000) in relation to the New Deal for Young People in Britain). This measurement usually entails the design of dedicated surveys, preferably with a longitudinal component to avoid reliance on retrospective data.
54
However, some measures such as job search behaviour are to be found in Labour Force Surveys.57 Thus, provided it is possible to identify those who are likely to be eligible for WFF or its components, one can estimate WFF effects on job search behaviour by comparing it across eligibles and ineligibles, ideally within a difference-in-differences framework to overcome confounding unobservable factors that might influence both entitlement and behaviour. There is great advantage in collecting information over time for eligible and ineligible individuals on attitudinal and behavioural dimensions of labour market attachment – it helps the evaluator get inside the “black box” of the mechanisms by which policies may bring about changes in individuals’ orientations that result in the “hard” outcomes such as job entry and earnings. Without this information, evaluators may invoke mechanisms that are theoretically plausible without knowing whether they had an impact in practice. This is particularly important when it is difficult to separate out theoretically important yet counteracting influences, such as those relating to income and substitution effects, or when, even though theory suggests mechanisms are pointing in the same direction, it is hard to discern how much weight to attribute to each mechanism. Such surveys often reveal that the barriers to labour market participation policymakers had in mind when designing a policy are not the ones that feature in the mind of the target population or, if they are, are conceived in a somewhat different way. There is a long tradition in Britain of survey respondents being asked to explore the mechanisms by which a policy may or may not be having its intended effect. These questions, asked in dedicated surveys constructed specifically for the programme evaluation, establish individuals’ knowledge of a programme or policy, their attitudes towards it, and the role – if any – that the policy has in influencing individuals’ or households’ labour market decision making. Standard sets of questions have been developed over years of programme evaluation, though questionnaire design is always tailored to the programme and client group at hand (see FACS, which is more recent and builds on the earlier PRILIF). Code frames have been developed for answers to such questions, though space is often left for open-ended answers in the spirit of qualitative, depth interviewing. The advantage of such surveys is that, provided they are based on random or stratified random samples from representative populations, they allow for extrapolation to the pertinent population (eg all eligibles or all participants) so that one can infer the incidence of certain attitudes, practices and perceptions. This approach is frequently supplemented by qualitative research using in-depth interviews based on topic-guided interviewing to explore in greater detail individuals’ and families’ perceptions of activities and processes key to the programme, such as application processes, job searching, work orientations and wider concerns for family wellbeing. For example, the issue of behavioural effects might be well approached by a study of how well clients understand the WFF both before and after interacting with staff.58 Although highly informative, such programmes of research are costly and do not always provide results in a time frame that policy clients desire.
5.6 Participation versus eligibility
57 For example, high marginal tax rates on wages might induce non-wage compensation, and survey questions about such compensation could be used to explore this. 58 The programme is quite complex, and the size of any behavioural effects will depend in part on the extent to which individuals understand the incentives it presents.
55
Tax credits, like other income-tested state transfers, are dogged by take-up difficulties, as discussed in section 3. These may be attributable to poor information, a high distaste for work or a low distaste for being on out-of-work benefits. Low take-up may also be driven by a high distaste for in-work transfers (Brewer 2003, Brewer et al. 2005, Lydon and Walker 2004). In the UK, this has led to the payment of Working Families’ Tax Credit through the pay packet in the hope that this will reduce stigma. In estimating labour supply, these potential alternative explanations are important because they help determine who takes up the tax credit from the eligible population. There is substantial evidence that those who take up programmes such as tax credits are not a random subset of the eligible population. In particular, they tend to have larger entitlements and longer likely periods of entitlement. So, if one is estimating the impact of something such as the IWP by comparing those eligible who receive the payment with those eligible who do not receive the payment, this may produce upper-bound estimates of a programme’s impact. This can be overcome, to some degree, if one tries to match the two groups on observable characteristics, though this technique will only assist in dealing with selection if selection can be captured by observable characteristics. Where take-up problems are severe, the very concept of eligibility is problematic because there may be a substantial number of people who do not qualify for assistance because they do too few or zero hours of work, but would be eligible by virtue of their relatively low underlying earnings potential if they did meet the hours qualifying condition. That is to say, the eligible population is truncated in some way because the programme is not sufficiently attractive to induce some to enter the eligibility zone. When eligibles differ systematically from those who might become eligible if they were to enter work, how the evaluator sets up the “treatment” and comparator groups may have a big effect on estimated impacts. Thus, the way eligibility is treated and the assumptions made about the nature of non-take-up may alter inferences about the success or otherwise of WFF. From the evaluator’s perspective, and indeed from the policymaker’s perspective, the parameter of interest may well be the “intention to treat” rather than actual treatment. However, if it is likely that this parameter is liable to differ from the impact of actual treatment (either eligibility or actual credit receipt), it seems wise to estimate these parameters alongside one another if practically feasible, since differences or similarities are likely to be informative with respect to the programme’s effects. As noted elsewhere, it is common to compare outcomes for eligibles versus ineligibles, where eligibility is roughly proxied by family structure and estimated earnings. This can help sidestep the potential selection bias that might arise if one simply focused on those who had entered paid employment, since this might itself be a function of the net benefits of programme participation. However, it does introduce problems of measurement error, since the analyst may not have sufficiently detailed information to make precise judgements on entitlement. Usually, this information is only available through dedicated surveys which obtain all relevant information pertinent to individual and partner.
5.7 Identifying comparators to the eligible popula tion in a “natural experiment” Most social programmes and welfare programmes are piloted to ensure the implementation process is optimal. This partial roll-out is often used to test the impact of a programme among a subset of the wider eligible population. However, there appears to be no formal piloting of WFF. Once a programme is nationally available, it can be difficult to identify a comparator group that can proxy a counterfactual scenario against which to measure programme impacts. A standard means of doing

56
this is a before–after study, often combined with a matching of eligible and “like” ineligible individuals (as in the case of matched difference-in-differences estimation). However, there may still be opportunities to pursue a before–after comparison with those who are not eligible for the programme.59 Difference-in-differences estimation may be plausible for the following: • all parents v. all non-parents • single parents v. single women • single parents v. high-wage single parents • men in couples v. men in childless couples • men in couples v. single men • men in couples v. high-wage men in couples • women in couples v. women in childless couples • women in couples v. single women • women in couples v. high-wage women in couples. The viability of using any of these groups as comparators to the eligible population for DiD estimation depends on four factors. First, it depends on whether the comparators have really been untouched by the programme. They will have been touched by the programme if substitution or displacement is occurring, for instance – a point returned to in the discussion of general equilibrium effects in section 5.14. Comparison between those with and those without children may itself be a problem if the very composition of these groups is partly a function of WFF, as may be the case if childbearing choices are affected by the new WFF regime. (In economists’ language, the childbearing decision becomes endogenous.) This may occur if, for instance, new financial incentives encourage people to delay or hasten their choice to have children. This problem can only be overcome if analysts model labour supply and childbearing jointly, such as Angrist and Evans (1998). This requires the analyst to identify one or more factors that influence childbearing choices but do not affect labour supply. Second, DiD estimation relies on the assumption that macro trends affecting outcomes of interest that may have coincided with the timing of the programme commonly affect the eligible and ineligible populations. If the macro effects have differential impacts across the two groups because they have characteristics that make them react differently to common macro shocks, this will confound estimates of WFF effects. There are, however, methods for adjusting for differential trends. For instance, one can search for a pre-programme period characterised by the same responses to macro effects (Bell et al. 1999, Blundell and Costa Dias 2000, 2002). Third, the DiD estimator cannot control for unobserved temporary individual-specific factors that influence the participation decision. The classic example is Ashenfelter’s dip, wherein a temporary dip in earnings will temporarily increase an individual’s probability of being eligible for a programme. Because the dip is temporary, we would expect earnings growth in that group to exceed that for those who did not suffer a temporary dip, whereupon earnings growth for the participants would exceed that for non-participants even in the absence of the programme. In this case, the programme effect on earnings growth would be overestimated. 59 An important aspect is what the treatment consists of. For the WFF package, the treatment may be defined as the change to the budget set, rather than the take-up of a particular benefit. In this case, because treatment is the change in the budget set, everyone is in some way treated because: one may respond to the change by becoming eligible for and then taking up one of the WFF payments; someone else eligible but not taking up the payment is not someone untreated, but someone without a treatment effect. To use a design that compares eligibles and ineligibles then requires plausible and convincing arguments that the ineligibles are individuals who never change behaviour in response to the particular change in the budget set represented by WFF.

57
Fourth, when using cross-sectional data for DiD estimation, there is a danger that the compositions of the comparator and control groups will change between the pre-programme and post-programme periods. These variations in the composition of the two groups may themselves affect outcomes independently of the programme, thus confounding estimates of the programme’s impact. This can be overcome, as discussed in section 6.4.3, if one uses panel longitudinal data to control for compositional effects. Changes in composition are easy to check and can be corrected by regression, since DiD is based on conditional means. An alternative way of identifying programme effects in a differencing framework is to use those who become newly eligible for a programme through its increased generosity, an approach also discussed in relation to earnings growth (see section 5.12.1). Comparators can also be found from within the eligible population. In essence, this entails comparing two eligible groups, using differences in entitlement amounts, the timing of entitlements, or multiple versus single programme participation to identify the effect of one programme or treatment versus another. Thus, for instance, there are differences in the amount of FS that families get, depending upon the number and age of children. If one maintains that these factors are exogenous – that is, that they are not themselves a function of the availability of WFF-related payments – one might compare outcomes for those entitled to different amounts to establish the impact of differences in FS eligibility on outcomes such as employment. A before–after comparison of the differences would help identify the impact of the difference in treatment. Similarly, one might obtain estimates of the impact of one sub-programme (call it sub-programme A) by comparing differences in outcomes before and after treatment for one client group using sub-programme B alone, versus a client group using sub-programme B in combination with sub-programme A. In principle, it might be possible in this circumstance to estimate the additive effect of programme A, although this would rely on controlling for selection into A and B versus B alone and making some assumptions about interaction effects between A and B. One threat to this evaluative approach, often overlooked, would be the impact on ineligibles of financing WFF. There are three ways by which programmes are usually funded: • a windfall – for example, the tax on utilities that paid for the New Deals in Britain • tax increases • government debt increases. If WFF were funded, at least in part, through raising taxes in other areas (eg indirect sales taxes) or through income taxes levied on eligibles or ineligibles, this would become part of the “treatment”: these funding methods will have their own behavioural effects on, for example, labour supply. There is also the efficiency loss from the excess burden (also known as the marginal social cost of taxes) associated with them. Thus, the financing of WFF must be taken into account when designing and interpreting the evaluation. However, the New Zealand Government has been running a current account surplus for some time. Much of this is being invested in superannuation funds and capital projects but it is also funding WFF and other initiatives, and some might interpret this as implying that there are no attendant fiscal

58
indirect impacts of the programme.60 However, the opportunity cost of the money spent on WFF indicates a potential deadweight cost due to taxation.61
5.8 Identifying those entitled to WFF Any evaluation of WFF impacts on making work pay, wellbeing and other outcomes relies upon accurate identification of those who are eligible for WFF components and accurate estimates of those entitlements. These are a prerequisite for the construction of counterfactuals and in establishing where people may be located along a budget constraint. As discussed in section 3, the data requirements for establishing entitlement can be onerous, even when the criteria for entitlement are clear and transparent. In particular, it is often difficult to obtain accurate estimates of household income, capital and assets. Analysts using publicly available datasets such as Labour Force Surveys usually “make do”, proxying entitlement with household characteristics (age and number of children, partnership status) and estimated earnings potential (using human capital earnings equations, such as Leigh (2004)). This is further discussed in section 5.12.4. One can place more reliance on such studies when findings prove robust to sensitivity tests involving alterations to the entitlement definition. The ideal solution to this data problem is to construct surveys containing both the outcomes of interest (eg employment and wellbeing) and those items permitting accurate identification of entitlements and take-up. This is the rationale for surveys conducted in Britain, for instance, to track the impact of policies such as Family Credit (using PRILIF) and Working Families’ Tax Credit / Working Tax Credit (using FACS). Another possibility is using administrative data. Data held by MSD and IRD contain accurate information on recipients of Family Income Assistance (FIA). IRD information includes: • demographics – gender, age, location (though not ethnicity) • family – partner, number and age of children, dependency of children, shared
custody, changes in family circumstances (for FIA recipients only) • income, taxation and FIA – annual income for individuals and families (market,
business, benefit, investment), tax for individuals, family tax credits for the family, overpayment and underpayment of FIA, child support receipts and payments, student loan allowances and repayments
• work and payment history – dates in employment, employer, dates on payments (though no direct measure of hours worked).
Although there are some important data items absent (hours worked, ethnicity), this data is very rich. However, there are a number of drawbacks. First, families receiving FIA via the MSD system are not required to file returns to IRD so there is no information about their family composition. MSD administrative data from payroll (SWIFTT) and case management (SOLO) systems could, in principle, track individuals’ payments longitudinally and, provided an assessment for payment or payment for a main benefit or superannuation has been made, detailed information on individuals and their households could be obtained. However, it seems that this MSD data is not readily useable at an individual level. Also, although MSD and IRD
60 http://www.beehive.govt.nz/ViewDocument.cfm?DocumentID=21824. 61 If the money were not spent on WFF, a social benefit could be produced by returning the money to the taxpayer, hence reducing the deadweight cost of taxation. However, this might not meet redistribution goals.

59
data can be matched technically (using MSD’s Social Welfare Number (SWN), a unique IRD identifier, location and first/last name), there are legal and ethical barriers to doing this. MSD and IRD data has been matched in exceptional circumstances in the past, but the decision to do so is made on a case-by-case basis. The use of linked IRD/MSD data for WFF evaluation requires a persuasive case to be made. These legal and ethical difficulties in matching data owned by different departments also affect matching with other useful data sources on issues such as schooling and health. Perhaps even more fundamentally, however, there are two key drawbacks to the IRD/MSD data. First, IRD and MSD have no information on the potential entitlements of individuals who never approach them to make an application. This means that one cannot construct eligible populations from administrative data alone. Second, IRD and MSD data cannot create household-level files from individual files unless people apply for a payment relating to families. According to information supplied by IRD, it is not possible to link individuals in a household unless they are in receipt of Family Support (FAM), and for this reason it is not possible to identify who may be eligible for WFF. Similarly, MSD points out that there is no clear way of linking individuals to households using MSD administrative data (unless they are linked using addresses). However, MSD can create family/couple groupings if the payment received requires information related to the family composition/partnering status. There is a code that describes the rate at which people are paid, and this could be used in conjunction with a number of tables to determine whether the payment received is for individuals, families or couples. Like IRD, MSD cannot create families from individual files unless people apply for a payment relating to families. It is also possible for IRD/MSD to infer household or family relationships; however, the results from doing this are imprecise. Nevertheless, the UK experience indicates there is great value in utilising administrative data and tailoring it, where possible, to evaluation purposes. Among other things, it has the advantages of being fairly accurate, free of recall error, longitudinal, free of non-response bias and free of attrition problems (provided individuals can be tracked as they move into and out of the benefit system and into and out of employment) and of offering populations or large sample sizes. Once initial investments in data quality and data format have been made, using administrative data can also be a much cheaper option than surveys for some analyses. There is also real value in linking administrative data to survey-based data, thus giving a “second take” on all the variables identified above. This cannot be done retrospectively for surveys that have already been conducted but administrative data can be linked to survey data, provided those in a sampling frame can be identified with their unique MSD/IRD identifiers, and provided legal permissions are granted and respondents are content. Statistics New Zealand may permit linkage between MSD/IRD data sources and its own major surveys. Similar linking happens very rarely elsewhere (eg in Britain concerns about undercounting benefit claimants led to a matching exercise linking Labour Force Survey data to administrative benefit records for cross-checking). But there seems to be much more mileage in linking administrative data to surveys conducted by MSD/IRD. This can help give the true picture in relation to household or income circumstances, establish which state transfers have been made and when, create the basis for sampling frames – for example, for transfer recipients of various sorts – and offer accurate outcome information in relation to earnings and the like. Administrative sample frames also permit analysis of non-response bias and attrition in surveys because the administrative data on who responds and who does not relates to the whole sample frame. This data therefore allows for adjustments to otherwise potentially biased

60
estimates (as an example, Green et al. (2001) evaluated the ONE programme in Britain). We would therefore strongly encourage efforts to bring administrative data into play in the WFF evaluation.
5.9 Methodologies for identifying the impact of WF F on “making work pay” 5.9.1 The viability of the matching methodology In section 4, we stressed the need for rich data to support identification strategies, based on the presumption that selection into treatment can be captured by observables. The conditional independence assumption discussed in section 4.4.2 requires that the analyst include all variables influencing both treatment and outcome and that, in the absence of these variables, matching estimates will be biased. Until recently, it had been assumed that administrative data might not be sufficiently rich to fulfil this requirement, thus making a case for data collected through dedicated surveys. However, recent research62 on the evaluation of the New Deal for Lone Parents in Britain suggests that the sequence of labour market events in the years before policy change helps capture what would otherwise be unobservable factors influencing treatment and outcome. Since MSD/IRD data contains work and payment/benefit histories going back some years, matching estimators may be able to play a role in WFF evaluation, especially if combined with the differencing approach described in section 5.7. Of course, the richness of the administrative data does not overcome the other limitations (omission of non-applicants and difficulties identifying eligible households) described in section 5.8. In the absence of administrative data, survey data would probably need to collect retrospective information on payment/benefit and work history. This is available, to a limited degree, in ongoing surveys. 5.9.2 Regression discontinuity designs Another methodology that could be deployed to identify WFF impacts on making work pay is the regression discontinuity method.63 This is a special case of instrumental variables estimation and identifies the effect of treatment on the treated for individuals at the discontinuity, unless additional very strong functional form assumptions are made. In essence, the method involves individuals being scored according to their probability of treatment. Some will have a high score, meaning they have a very high probability, and some will have a very low score, meaning they are very unlikely to be eligible for treatment. However, there will be a margin at the cut-off point between those who are eligible and those who are not (the cut-off for eligibility – for example, income level) which generates some randomness as to whether a person is treated as entitled or not. At this margin, it is possible to find counterfactuals for eligibles, allowing WFF effects on outcomes to be identified. Profiling can be used as the basis for a discontinuity analysis but only if the profiling is actually used as the basis for selection into the programme, which may not be applicable for WFF. In one of the caseload administrative datasets, there is a variable akin to a profiling variable where the member of staff working with the client ascribes a probability that an individual will go on to long-term payment receipt. This may be used to assign WFF treatments. If one assumes homogeneous treatment effects,
62 Dolton et al. 2005. 63 See useful references such as van der Klaauw 2002, Hahn et al. 2001, Buddelmeyer and Skoufias 2004 and Heckman, Lalonde and Smith 1999, section 7.4.6.

61
then this is the most efficient method of WFF resource allocation (Bryson and Kasparova 2003). It may be that this profiling variable can be used as the basis for a regression discontinuity design since there will be some individuals close to the decision cut-off who are “almost” treated or “almost” entitled. To the extent that this variable is useful, an analysis could be based on this, but it would likely have some limitations as to which WFF target groups are covered.
5.10 Data sources 5.10.1 The demand side: The value of employer surveys Employers may respond in a number of ways to WFF. We have alluded to some of them above in relation to the demand for different types and quantities of labour, training provision, wage setting and making job offers. But, just as it is valuable to conduct surveys of individuals to see how they perceive WFF and establish how they have responded to the changes behaviourally and in their attitudes, so it is for employers. Because it is unfashionable for governments to manage the demand side of the economy, policymakers often overlook the fact that supply-side changes such as those made by WFF can be undermined or succeed depending on employers’ responses to them. Employer surveys would be helpful in identifying levels of employer knowledge about WFF components, such as subsidised childcare and tax credits. A longitudinal survey before and after changes such as IWP would help establish whether levels of knowledge change as WFF beds down and, irrespective of the knowledge that employers have, whether their behaviour alters with respect to recruitment, retention, wage-setting, training and so on. Employer surveys also provide valuable information on mechanisms generating general equilibrium effects, such as the probabilities of displacement effects. 5.10.2 Linked employer–employee data Linked employer–employee data, such as that being developed with the New Zealand Linked Employer–Employee Database (LEED), could have substantial benefits in evaluating WFF. Although the number of variables in the dataset is limited, as a population of employees and employers it offers opportunities to track workers over time, thus establishing job entry and exit patterns and therefore job durations at particular moments during the introduction and development of LEED. With wage data it also offers information on starting wages and wage growth. Proxies for WFF eligibility will be crude, but it may be possible to detect changes in labour market behaviour that are contemporaneous with WFF changes. For instance, Accommodation Supplement (AS) changes may show up in area-specific differences in patterns of labour market behaviour. Another advantage of LEED data is that it offers multiple observations per employer and, as such, allows evaluators to establish the extent to which outcomes such as wage distributions are accounted for by variance within and across workplaces. Comparisons of such outcomes before and after the introduction of WFF may be informative with respect to wage-setting behaviour on the part of employers. 5.10.3 Counterfactual scenarios taken from survey respondents Surveys in the UK, such as PRILIF, have frequently asked respondents directly what they might have done in the absence of a policy or if the policy had differed in one or

62
more dimensions. For instance, childcare surveys in the UK64 have recently asked parents about their perceptions of the impact of funded childcare on their childcare and employment decisions. These questions complement retrospective data collected on childcare use and employment to permit a fuller understanding of how parents’ behaviour may have changed in response to a policy that aims to increase affordable daycare provision. Although often distrusted by economists, answers to these questions can be revealing in terms of the way in which individuals frame their decision making. Of course, when faced with a question such as “Would you work harder if the credit were higher?”, it can be difficult to interpret responses, and it is uncertain what credence can be given to them in terms of their ability to predict behaviour. There are difficulties, too, in comparing responses across individuals at a point in time or for an individual over time. Nevertheless, economists and psychologists have developed good survey instruments for measuring expectations using subjective probabilities (Manski 2004) which could be applied in WFF to help identify how individuals respond to financial incentives and in identifying possible counterfactual scenarios. Similar approaches could be devised with employers as respondents in relation to their hiring behaviour. 5.10.4 Other limitations to survey analysis As well as difficulties in interpreting survey-based results, surveys are plagued by a number of well-known limitations which should nevertheless be remembered when considering the value of surveys in the WFF evaluation. Obtaining reliable sampling frames and distinguishing between eligibles and ineligibles have already been mentioned. Measurement errors can also plague evaluators, particularly with respect to key variables such as wages (especially partner’s wages), capital and assets. It can be difficult to obtain accurate information regarding individuals’ receipt of tax credits, and this is going to be particularly problematic in the case of WFF given that multiple credits will be paid as a single sum. Such errors are not a significant problem, if they are random. However, they seldom are. For instance, errors in recalling payment levels tend to be correlated with the size and timing of payments. The value of surveys is frequently undermined by non-response bias, something that can arise when response rates are low or when some subsets of the population have not been reached. Even if response rates are reasonable in the first wave of a survey, differential sample attrition can introduce biases in subsequent waves. There are weighting, refreshment sampling and other methodologies to address such issues, but none is particularly satisfactory, thus placing the onus on good survey design and execution. There are two particular difficulties with relying on survey data in the case of WFF. The first is obtaining baseline (ie pre-reform) survey data. MSD is already well advanced in identifying the sorts of surveys it wishes to run and when. Nevertheless, there is relatively little time available for WFF evaluators to identify the populations they wish to target, the purpose of surveys, their design and content. To illustrate, individuals’ motivations are often regarded as a key explanatory variable determining
64 These surveys are still at the design stage, with the report forthcoming. The study is the Evaluation of the Neighbourhood Nursery Initiative, commissioned by the Department for Education and Skills and carried out by a consortium that includes the National Centre for Social Research, Oxford University and the Institute for Fiscal Studies.
63
labour supply behaviour, childbearing and the propensity for programme participation. If this variable is not observed, it can confound estimates of WFF effects on making work pay, and it means that methods relying on selection on observables are problematic. Motivation can be measured in surveys, but the possibility that a programme can change motivations means that one needs measures before and after the introduction of the programme to make causal inferences. A second difficulty concerns the policy imperative to understand what WFF is doing to sub-groups of the population, some of whom are geographically concentrated or of low incidence throughout New Zealand. Of course, one can boost the sample numbers of low-incidence groups through stratified random sampling, though this does affect effective sample numbers. The bigger point is that one needs large samples to make inferences about differences across sub-groups. Large surveys are expensive.
5.11 Job entry and job retention: Survival modelli ng By affecting the relative returns to being out of work versus being in work, WFF may influence the rate at which individuals move into work and, conditional on being in a job, the rate at which they leave jobs. If WFF has got it right, then financial incentives should have a net impact of increasing the rate at which individuals enter jobs and slowing the rate at which they leave. To observe these rates, one requires panel data on individuals whose employment status is observed over time. By tracking what happens to individuals over time, and estimating their probabilities of entry (exit) conditional on the event not having occurred up until that point, one can establish the rates of transition into and out of paid employment. To establish whether WFF or its sub-programmes have affected transition rates, one can observe what happens to individuals before and after policy changes. If shifts in the policy regime influence job entry and/or exit rates, this can be observed in the rate at which eligible individuals make a transition. If these adjustments are instantaneous, one may observe “spikes” in the transition (or “hazard”) rates, which then affect the time individuals spend in various states (“survival” rates). It is usual to go beyond simple description of transitions and model the process, thus controlling for potentially confounding factors. Job search theory suggests that individuals will accept job offers when the wage offered exceeds their own “reservation wage”, namely the benchmark notional wage that an individual has in mind as a trigger point for labour market entry. In some analyses, this reservation wage is explicitly modelled together with the market wage. In others, the idea of a comparison between reservation and market wages is simply invoked as the model underlying the instantaneous probability of a transition, whereupon the model estimating that probability simply includes variables affecting the reservation and market wages. One can also estimate probabilities of exit to more than one state – for example, into part-time and full-time jobs – a technique known as competing risks modelling. Survival modelling has been used to estimate the impact of the Working Families’ Tax Credit on the year-to-year transitions of single mothers in the UK (Francesconi and van der Klaauw 2004). With administrative data, or detailed work history data collected in surveys, it is possible to estimate month-on-month (or even day-by-day) probabilities of transition. One difficulty with this approach is how to tackle multiple treatments occurring in succession and correspondence between policy change and other events. One also needs to deal with the possibility that individuals will anticipate policy changes, in which case changes in exit rates may precede the policy event. Entry and exit rates may be influenced by a number of factors. It is often difficult to

64
distinguish between duration dependence (the increased probability of non-transition by virtue of the lengthening time in a state) and unobservable traits of individuals that mean that they differ from one another in systematic ways affecting transition probabilities. Note that survival modelling can be used wherever information on the spell length is available, and for WFF it might be of interest to examine poverty spells.
5.12 Some initial ideas for evaluating WFF sub-pro grammes This paper does not set out to give any definitive guidance regarding how to evaluate WFF or its sub-programmes. However, it is worthwhile mentioning some initial ideas to give a more concrete feel to some of the issues discussed above and in earlier sections of the paper. Comments are mainly concentrated on IWP by way of illustration. 5.12.1 In-work payment In evaluating IWP, it is necessary first of all to establish precisely how it differs from the previous regime, the Child Tax Credit (CTC). The key features of the new regime relative to the old are: • IWP is much more generous than CTC in that its rates are higher, the abatement
threshold has been increased to $27,500, with the 18% taper between $20,356 and $27,481 being abolished, thus increasing the income range over which a full credit will be paid, but the taper above that threshold remains the same (30%)
• a household-level hours threshold for entitlement has been introduced • the payment is at household level rather than per child. It is also worth noting how IWP differs from tax credits evaluated in the existing literature: • the household-level hours threshold is, to our knowledge, unique, since in most
countries it must be achieved by one or other individual in a couple • unlike Earned Income Tax Credit in the US, there is no “phase-in” period before
maximum entitlement is achieved • unlike the UK, there is no childcare credit because the subsidy for childcare goes
directly to the provider • the choice of payment period (weekly, fortnightly or annually) is unusual • the taper is lower than in the UK • unlike the UK or the US, the credit is not paid through the pay packet by default;
rather, it goes to the main caregiver, and consequently the employer is not involved in a direct way, which in turn may mean less wage substitution.
As in the UK, out-of-work payments were raised (through FS), thus affecting the replacement ratio. However, this change was not coterminous with the IWP introduction. Unlike in the UK, where tax credits count as income in determining entitlement for Housing Benefit, IWP does not count as income in the determination of AS, thus reducing the impact of IWP on effective marginal tax rates for those seeking housing cost assistance. Increasing the abatement threshold increases the hours’ range over which the maximum credit is paid. This hours’ range, in which the EMTR associated with IWP is zero because the taper is zero, will be larger for those with low hourly earnings. Those with higher earnings potential will hit the threshold at which the taper cuts in with fewer working hours.

65
The timing of the IWP change (April 2006) is fortuitous as it appears no other major WFF change coincides with it (AS changes occurred in October 2004 and April 2005; FS changes occurred in 2005 and there will be more in 2007; Childcare Subsidy changes occurred in 2004 and 2005). There is an increase in Family Tax Credit at the same time, but this is a credit that goes to relatively few people. Temporary Additional Support (TAS) comes in at the same time, but, again, this may not be viewed as a major change. This point is important if one wishes to identify the IWP effect and isolate it from the effect of other policy changes using a differencing framework. Of course, other policies may also change when IWP changes – for example, if there is an increase in the national minimum wage. Furthermore, the fact that there are a number of key policy changes on either side of the IWP changes – especially in the pre-programme period – might make it difficult to identify a settled period before the changes, which is required for differencing. What, then, of the theoretical impact of IWP? This should be carefully established in constructing an evaluation strategy and we do not attempt a thorough investigation here. In any event, we lack some key information presently, such as the percentage of CTC recipients who fall below the IWP hours’ thresholds. However, it seems likely that the following outcomes may occur. • Those currently out of work: IWP should increase incentives to work at least 20
hours (for single parents) or at least 30 hours (for couples), particularly if they are liable to lose the payment previously made under CTC.
• Sole parents working below the hours’ threshold: They will have an incentive to supply at least 20 hours.
• Sole parents working more than 20 hours: The effect is indeterminate since there will be an income effect away from work but this may be counteracted by substitution effects.
• Couples doing some work but below the 30 hours’ threshold: If the primary earner in a two-earner household can increase his/her hours to the threshold, the income effect might mean the household reverts to being a single-earner household. But if supply is constrained, the second earner may hike his/her hours to the threshold, increasing the incentive for the “primary” earner to quit. Alternatively, both may raise supply a little to meet the threshold.
• Couples where someone is already working more than 30 hours: The effect is indeterminate since there will be an income effect away from work but this may be counteracted by substitution effects.
It seems likely that a difference-in-differences methodology could be deployed to evaluate IWP using the counterfactual groups discussed in sections 5.7 and 5.10.3. This could be undertaken with cross-sectional data, but recent evaluations of tax credits have resorted to panel data. A very good example is Leigh (2004), who uses the UK Quarterly Labour Force Survey pre- and post-reform to evaluate the introduction of Working Families’ Tax Credit (WFTC) in 1999. The advantage of using panel data is that it can take out fixed individual effects, thus controlling for changing sample composition over time, which helps isolate changes in behaviour. This is useful given the difficulties with DiD arising from changes in the composition of eligible and ineligible groups pre- and post-reform. Leigh does not directly observe eligibility, but he is careful to check the robustness of his results by checking their sensitivity to changes in the definition of the eligible and comparator groups. He includes estimates for those predicted to be within scope due to their predicted low earnings using predictions made on data for the pre-programme period. The drawback to this panel approach is that it is confined to a balanced panel, namely those in the workforce both before and after the policy change. This raises the

66
question: “What if compositional change in the eligible and comparator groups is itself a function of the policy?” Another feature of Leigh’s paper is that he estimates a range of impacts to get a fuller picture of what the credit is doing. These include: if employed, total weekly hours, whether working over the hours’ threshold, and log pre- and post-tax earnings. He points out that if one finds positive hours effects for all points in the hours distribution, this indicates that the substitution effect (driven by increased marginal returns) dominates the income effect on labour supply (arising from an increase in total income for a given wage). Leigh considers confounding factors, the chief one being the statutory national minimum wage, which was introduced in Britain at the same time as WFTC and may therefore affect the “after-period” co-efficient. However, he argues that it should not affect this treatment parameter (“after-period*kids” interaction) because there is no reason to suspect that the minimum wage should differentially affect the treatment and comparator groups. An alternative might be to check the sensitivity of results to the exclusion of those most likely to get the minimum wage, such as the young, though this would introduce truncation to the earnings’ distribution. Francesconi and van der Klaauw (2004) also use panel data (from the British Household Panel Survey) to estimate WFTC effects using a DiD estimator. A nice feature of their paper is that they consider lone mother entry and exit rates to jobs pre- and post-reform. Although the DiD methodology is currently in vogue, section 4 and the comments above make it apparent that there are serious limitations to the approach and that, despite assertions to the contrary, it is reliant on strong assumptions.65 The chief candidate as an alternative to the DiD methodology is microsimulation using structural modelling. Perhaps the most useful paper in this vein is Brewer et al. (2005). They argue the need for a structural approach to separate the effects of WFTC from the effects of contemporaneous tax/benefit changes, which included changes to out-of-work benefits. The approach entails estimating preferences for work and income to predict how individuals’ desired labour supply changes in response to tax changes. This involves inferring parents’ labour supply preferences from observed behaviour on the basis that these are revealed preferences. The assumption is that individuals have unconstrained hours’ choice given the wage they can command; an assumption that is a particular problem where involuntary unemployment is significant or where employers determine hours offered. The underpinning assumption is that people maximise their utility subject to their own budget constraint. Preferences are written in terms of hours of work, net income, observable characteristics and unknown preference parameters to be estimated. The technique tries to estimate indifference curves that intersect with the budget constraint to give an individual’s choice of hours. This is done for a discrete subset of hours choices. The approach relies on one’s ability to depict net income accurately at levels of gross income, something that is particularly difficult with the sorts of budget constraints described in section 5.4. Brewer et al. (2005) extend their model to account for additional fixed costs of employment, childcare costs/usage and programme non-participation. To account adequately for all these factors simultaneously, one needs to estimate the equations
65 Indeed, in one of the most succinct and illuminating critiques of the technique Heckman maintains that the popularity of the method is solely based on computational convenience (Heckman 1996, in response to Eissa 1996).

67
jointly. This is theoretically and computationally very difficult, so Brewer et al. simplify by assuming a fixed, deterministic relationship between hours of childcare and hours of work. This is a big assumption since, among other things, it means imputing usage and prices for the out-of-work on the basis of usage by those observed in work. Brewer et al.’s particular concern is to incorporate the cost of applying for WFTC and its impact on take-up and thus labour supply. This requires estimating labour supply and programme participation jointly. Often, analysts assume full take-up, but, as Brewer et al. observe, this can bias labour supply estimates:
[a person] observed not working in a model that assumed full programme participation would be presumed to have relatively high distastes for work, relatively low tastes for income, or relatively high fixed costs of working, when the true cause could be that she has relatively high distastes for or relatively low knowledge of [the credit]. Assuming full participation in any transfer programme that affects the shape of the budget constraint may lead to inconsistent estimates of preferences for income and work in a utility-maximising model of labour supply. It will also lead to misleading inferences about the extent of high effective marginal tax rates. (2005:3)
This raises the following question in the case of WFF: “How realistic is it to expect very high take-up?” Structural modelling of the sort described above relies on identifying factors affecting participation that do not independently influence outcomes. It is normal to use exogenous variations in budget constraint across individuals that arise from variations in wages, the number and age of children, housing costs and so on. Having estimated preferences for income, distaste for work, fixed costs of work and stigma costs, structural modellers draw from the distributions of these preferences to estimate individuals’ preferred labour market status under different regimes. There is a general concern, pertinent to the DiD and structural equation approaches to evaluation, raised by Mroz (1987), about the sensitivity of results to the way in which self-selection into the labour force is treated when extrapolating from results based on employed individuals. There are also difficulties using wages, which may be endogenous in the sense that they are the result of labour supply decisions, rather than an independent variable capable of predicting supply. It is therefore common to use expected wage values instead, driven by prior labour market experience and other human capital variables. Turning to IWP’s impact on wage growth, one must account for the three possible sources of wage growth: accumulated labour market experience, job tenure (seniority) and job mobility. Predictions as to the likely impact of a wage subsidy on these three factors depend, in part, on how one characterises the labour market and its jobs. It is instructive to compare and contrast the work of Card et al. (2001) and Connolly and Gottschalk (2001) using the same labour programme experiment (Canada’s Self-Sufficiency Project). Connolly and Gottschalk develop a job search model, which includes the effort people make to search while in a job, and allows for choice between two types of job – low-starting-wage but high-growth jobs and jobs offering a higher starting wage but low growth. Card et al. on the other hand, conceive of the treatment effect being driven largely by selection into work of individuals with particularly flat earnings profiles. In the case of IWP, predictions about the likely impact of the subsidy on wage growth depend on the balance

68
between the costs and benefits of investing in job search and training. These are likely to depend upon where in the budget constraint individuals are likely to find themselves (ie whether they are within the maximum receipt or taper zone) as well as upon the interaction of IWP with other transfers. The best paper on wage growth is by Lydon and Walker (2004), who use UK Quarterly Labour Force Survey panel data comparing 12-month wage growth for 20 cohorts of workers before and after the introduction of WFTC. They are able to measure job tenure, job changes (quits and layoffs) and wage growth, though they have problems estimating entitlement accurately due to the absence of data on assets. Similar problems may arise with respect to IWP if using the New Zealand Labour Force Survey. The authors show the value of descriptive analysis of cohorts of workers before and after a policy change. However, although this helps control for observable differences between the eligible and comparator groups, Lydon and Walker are concerned about unobservable differences between the two groups that might independently affect wage growth. They overcome the problem through use of the newly entitled individuals who came into scope of the credit because it became more generous. Pre-change, those in that part of the wage distribution were entitled to nothing and so were not subject to the taper, whereas they were entitled to something post-change and were therefore subject to the WFTC taper. This is the basis for their natural experiment approach, which permits the computation of DiD estimates of effects of the taper on wage growth. They compare this group with others based on entitlements (at the maximum or less than the maximum) and take-up before and after the introduction of WFTC. It would be feasible to adopt a similar approach for WFF. In addition, one might wish to investigate those for whom the taper was removed because the income range over which people are entitled to the maximum was broadened. The analysis of wage growth remains problematic, particularly if one treats experience and tenure as endogenous, as one should if labour supply is responsive to wages. The problem can be overcome with panel data if one uses lagged variables for experience and tenure. The use of balanced panels means analyses are often conducted on persistent workers, who are likely a non-random subset of the population. Conditional on being in the sample, it is straightforward to net out worker fixed effects, which might drive earnings’ growth and that are correlated with tax credit receipt, using first-difference methods. 5.12.2 Accommodation Supplement The only part of WFF that appears to differ across geographical regions of New Zealand is the AS. From April 2005, the maximum available assistance will increase in some areas, and the number of rating areas will increase from three to four, Auckland being divided into two areas, with new higher maximum rates for central and north Auckland.66 Some other locations will move into an area with higher maximum rates. These changes can all be treated as natural experiments, offering possibilities for difference-in-differences estimations. These could involve estimating the impact of AS entitlement changes on employment in one area relative to what happens to a matched comparator group in a “similar” control area where the AS entitlement changes are very different. However, if estimated with cross-sectional data, this approach may be vulnerable to compositional changes in the treatment and comparator groups arising from migration induced by the AS changes.
66 There is the possibility of a regression discontinuity study looking at the effects using houses immediately on either side of this boundary between the two zones in Auckland.

69
There may also be possibilities for identifying AS effects on making work pay using the 15,000 people brought into eligibility for assistance for the first time. The report to the Minister for Social Development and Employment and the Minister for Finance and Revenue entitled Future Directions (MSD 2004b) indicates that changes in October 2004 brought in an abatement-free income zone of $80 per week, while other documents indicate that the abatement has been removed so that people will not have their AS reduced if they have other income. This suggests that more people will be entitled to the maximum AS than before. Although this change may increase replacement ratios (the amount of income one can receive out of work relative to being in work), potentially slowing entry to employment, it may be that if the change allows individuals to engage in some paid work without being financially penalised, it may improve chances of entering more substantial employment.67 The date of this change does not seem to coincide with other major changes, so it may be possible to estimate the impact of this more generous arrangement using differencing techniques. However, it does coincide with an uprating in childcare subsidies (see section 5.12.3). Its impact on the length of benefit spells can be estimated using the survival modelling techniques described in section 5.11. The structural modelling of discrete choices, described in section 5.12.1 in the context of tax credit reforms, can also be applied to housing assistance reforms. This approach has been adopted by Bingley and Walker (2001) to investigate the impact of housing subsidy changes on work incentives in Great Britain. The technical difficulties arise from the fact that hours of work, participation in housing subsidies and wages may be jointly determined. One can only obtain an unbiased estimate of financial incentives on labour supply if one can net out the unobservable correlations between these three outcomes. Bingley and Walker do this by modelling wages, labour supply and programme participation jointly. The AS changes may also affect accommodation prices, thus potentially limiting the ability to improve the affordability of housing. It will be important to track the prices attached to various types of housing tenure pre- and post-reform. A further difficulty is that, to the extent that the differential price and affordability of housing change with AS, they may induce changes in migration patterns, affecting the composition and size of labour forces, a factor that needs to be investigated to assist in understanding any impacts of AS and its interaction with other facets of WFF. 5.12.3 Childcare subsidies The childcare subsidies (CCS and OSCAR), although payable to providers as hourly subsidies, effectively subsidise the cost of care to parents. This increases the affordability of childcare for parents, increasing the net returns to employment. The improvement in the financial incentives arises from the fact that WFF increased the rates of subsidy under two existing schemes in 2004 and 2005 and the thresholds over which the subsidy is payable (2004). Parents in work and those in training will be eligible for up to 50 hours of childcare assistance each week, while out-of-work parents will be eligible for nine hours. The amount of assistance available depends on household income and the number of children in the household. It is estimated that 28,000 families (33,000 children) may benefit, with an average $23 per week gain, at a cost to Government of $120 million over 2004–2008. To increase families’ awareness of assistance available and to facilitate take-up, the government instituted a nationwide network of Work and Income childcare co-ordinators in October 2004.
67 This depends on the rules for disregarding earnings, and it would be important to take these into account.

70
One could treat these changes in childcare subsidies as the basis for a natural experiment to establish what happens to patterns of childcare demand and labour supply pre- and post-reform. Such a strategy would have particular regard for those becoming newly eligible for the subsidy and those who are entitled to substantially more hours of care than previously. However, there are two big threats to this strategy. The first is ongoing developments in childcare policy – for example, the policy introducing additions to the training requirements for childcare staff – that run alongside the WFF policies. These make it particularly difficult to establish the independent impact of the WFF-related changes. The second difficulty is the potential for the changes to feed through into childcare price increases. The likelihood of this happening rises where increased demand outstrips supply and because the subsidy is particularly apparent to price setters since it goes to them rather than the parents. The other major difficulties in evaluating the childcare subsidy impact on labour supply relate to identifying eligible parents who do not take up care, and establishing who has taken up care and whether they are substituting for other unsubsidised parents (substitution effects). This might be an issue if childcare subsidies give eligible parents greater purchasing power and displace parents who are not entitled to the subsidy. This could be the case if the supply of childcare does not increase in line with demand and there is a financial advantage for childcare providers to cater for parents who are entitled to the subsidies (eg because they can charge them higher fees). Once again, there may be opportunities to evaluate childcare subsidy impacts on labour supply by simulating parents’ response to the increased subsidies using discrete choice models. For the reasons outlined above, it will be largely impossible to clearly establish the impact of WFF childcare subsidies on patterns of participation in early childhood education and childcare. However, information could be collected to gain a better understanding of if and how these subsidies affect providers’ and parents’ behaviour. This would provide an outcome measure, albeit a rather “soft” one, of the effects of these subsidies. As suggested earlier, the WFF evaluation will require regular data from all regulated services on the topics listed in section 2.5.3. Additionally, it would be useful to supplement this data with information collected from those who are responsible for co-ordinating and monitoring childcare provision at the local level. Through planned surveys (eg the Childcare Survey and the Longitudinal Study of New Zealand Children and Families), it will also be important to gain a good understanding of: • the factors that shape parents’ attitudes towards parenting, non-parental care and
work, with a particular focus on how these might be related to a child’s lifecycle stage
• the range of influences that might constrain or facilitate parents’ work and childcare decisions, with a particular focus on childcare (eg accessibility, cost, quality, flexibility) and (perceived) ability to obtain family-friendly working arrangements
• patterns of participation in early childhood education and out-of-school childcare among children in different circumstances (eg sole- and two-parent families, in urban and rural areas) and from different communities (eg Māori, Pacific, Asian)
• patterns of maternal and paternal employment among families in different circumstances, from different communities and socio-economic groups
• the impact of early childhood education on a range of child outcomes – this could be explored in the longitudinal study and the analysis would be particularly

71
powerful if data on the quality of early childhood education services attended by a child could also be included.
5.12.4 Family support (FS) One should not overlook the potential importance of increases in FS in 2005 and 2007 for labour supply. As noted in section 5.1, the effects are ambiguous because, although they effectively raise out-of-work replacement ratios, they also offer some degree of financial security to recipients since payments continue if in paid work. Changes to the rates and to the abatement threshold and the fact that increases differ with the age of children and between first and subsequent children, may offer opportunities for a differencing estimate of the effects of the changes on labour supply – for example, between those with a single child versus those with two or more children.
5.13 Laboratory experiments It is only recently that labour economists and psychologists have started to apply laboratory techniques to labour supply and programme participation problems. They offer evaluators the opportunity to construct a controlled environment in which it is possible to observe shifts in the way individuals (beneficiaries, workers, staff, etc) respond to different stimuli. These stimuli could include all aspects of WFF, the targets staff must meet that are set by management, financial incentive payments made to providers, and so on. Laboratory experiments can be devised to test policy effects before going into the field, in parallel with field analysis and after programme roll-out. Laboratory experiments are particularly valuable in establishing how and why individuals respond to different policy packages in different ways, including the weight they attach to different features of an incentive package when making choices regarding labour supply, childcare and the like. Camerer et al. (1997), Fehr and Götte (2002) and Götte and Huffman (2003) illustrate ways in which laboratory experiments can be used to understand labour supply issues.
5.14 General equilibrium estimators General equilibrium effects come about when programmes affect outcomes and behaviour of non-participants as well as of participants, as described in section 4.5. Comparisons between participants and non-participants cannot recover general equilibrium effects because, if one assumes that an entire population is affected in different ways by a programme, there is no comparable group from which to draw a counterfactual. Another reason is that many of these effects will build up over time, so they are unlikely to show up in any data collected over a short time frame. General equilibrium effects are usually recovered using structural models that involve making explicit assumptions about the mechanisms generating the general equilibrium effects. As well as being computationally and conceptually complex, these models rely upon strong assumptions about the functional forms of economic relationships and the values of economic parameters. Examples include the model of Blundell, Costa Dias and Meghir (2003), who have recently estimated the impact of wage subsidies under the UK’s New Deal for Young People on labour supply using a general equilibrium approach. They find that risk is the main driving force behind individual labour market decisions and economic responses to wage subsidies.

72
Another recent example is the model of Lise et al. (2003), who develop a dynamic general equilibrium model that seeks to account for the impact of changes in financial incentives on job search intensity and the process by which wages are determined in the labour market. The authors explain how they first calibrate their equilibrium model in the absence of the programme (in their case, the Self-Sufficiency Programme (SSP) in Canada) using data on wages, unemployment and the benefit system from public-use data. The calibration involves parameters such as discount rates, search friction and job separation rates. Using the parameters obtained, the authors simulate the SSP regime in partial equilibrium. Finally, they re-calibrate the model in the presence of the programme using parameters estimated in the first stage and simulate the equilibrium effects (displacement, wage and entry effects) that result from introducing the programme. In trying to gauge the direction and magnitude of general equilibrium effects, some past UK evaluations relied on qualitative assessments obtained directly from employers. The employers, by recounting how they make hiring and firing decisions, can shed some light on the likely impact of WFF sub-programmes. However, the value or reliability of this method is not clear and accordingly it has become discredited amongst evaluators.68
5.15 Summary This section has identified the real prospect of general equilibrium effects associated with WFF arising from its potential impact on non-participants and in the childcare and housing markets, as well as in wage setting and employment. It has commented on the two main partial equilibrium methodologies currently deployed for the analysis of employment outcomes associated with tax and benefit changes (conditional difference-in-differences estimator and structural modelling). It has also drawn attention to the value of panel data in estimating employment outcomes such as job entry and exit rates, the length of spells and wage growth. The methodologies identified are not substitutes for one another, but rather they are complementary. If deployed together, they may offer more insights into what WFF is doing to labour market outcomes than might be the case if reliance were placed on one methodology. The advantage of such an approach is that it permits cross-checking of results across methodologies and means that, if insuperable problems arise in the deployment of one methodology, one can resort to others in the hope of answering the same or similar questions.
68 For example, employers may simply respond with answers that they perceive would be well received (known as satisficing in survey design). See Hales et al. 2000 for the survey of employers carried out for New Deal for Young People.

73
6 Measuring changes in poverty and wellbeing Reductions in poverty, and especially child poverty, are an important aim of the WFF package. One of the expected impacts is a 30% reduction in child poverty by 2007/2008 (using a poverty line based on 60% of median equivalised household income).69 However, if the proportion in poverty comes down after WFF starts, this could be because of better economic and labour market conditions rather than WFF itself. A central element of an evaluation of the impact of WFF will be to estimate the effects of the programme on poverty incidence and depth. However, as previous sections have argued, the ability to evaluate the impact of WFF against an empirical counterfactual (the absence of the programme) is limited. This is because the package of reforms is being simultaneously implemented across the whole population and there are thus no comparison groups. Methodology for estimating the impact of WFF on poverty is faced with a considerable set of complexities and uncertainties, but MSD seems currently well placed to capture poverty impacts, for the following reasons. • The obvious great strength in current micro-simulation of policy reform within
MSD given a series of clear forecasts of impact using TAXMOD (Perry 2004). One area of methodological consideration is how to use micro simulation to assess post-facto rather than pre-facto policy change. There is an opportunity to refine some of the limitations of current TAXMOD estimation to capture impacts more accurately.
• The availability of Household Economic Survey (HES) data and the established
practice of using such data to produce poverty profiles and associated analysis. There are questions relating to the need to assess the quality of such data for specific elements of WFF reform (housing supplements especially) and to the frequency of HES reporting (currently three-yearly).
• The recent development of complementary and alternative measures of wellbeing
such as the Economic Living Standard Index (ELSI) and of multi-dimensional studies of wellbeing in children.
The main part of this review of methodology addresses the primary task of establishing what changes to poverty profiles arise after the introduction of WFF and the attribution of such changes to WFF – capturing poverty impacts using a relative poverty line. A second, smaller part of the review takes examples of longitudinal and other surveys that have captured different aspects of wellbeing as an alternative to or alongside poverty. This makes the case for longitudinal surveys to best capture the dynamics of poverty. Longitudinal qualitative studies can also give good insight into change for particular targeted household types.
6.1 Capturing poverty impacts using a relative pov erty line
69 This estimate is given in Cabinet Policy Committee (2004:5).

74
The main source of methodological literature that is most relevant to WFF and poverty impacts is the UK.70 The relevance stems from two main similarities: • policy design and implementation (with perhaps greater emphasis in the UK on
active labour market “pushing” entry into work alongside in-work benefits “pulling” people into employment by making work pay)
• the adoption of a relative poverty line set as a proportion of median or average equivalent household income – as suggested in early assessments of potential impact using micro-simulation.
The primary method for evaluating the impact of fiscal reforms on poverty is through a combination of: • secondary analysis of data from household survey income data (Household
Economic Survey in New Zealand; Households Below Average Incomes (HBAI) dataset, which is itself based on the UK’s Family Resources Survey)
• micro-simulation modelling of policy change – to produce a post-facto model of policy before and after reform.
This methodology combines a series of descriptive analytical profiles of changes in poverty from HES/HBAI data that describe overall changes in poverty and the income distribution. This is used to identify the main drivers of such changes that are not policy related but will also affect the incidence of poverty – for instance, changes in population structure, and the business cycle. These descriptions and analyses of reasons for changes in poverty are then followed by micro-simulation of the policy changes to assess their potential impact on poverty. These two sets of analysis – of the empirical changes and of modelled change – are then brought together to give a range of estimates of the likely impact of policy change on poverty.
6.2 Secondary analysis and poverty profiling Taking the issue of secondary analysis of HES data and poverty profiling first, there are several important considerations. First, HES or other survey evidence takes a significant period of time to be available, and thus some measurements of impact are not available until long after policies have taken effect. The HES moved from an annual to a triennial basis in 1997/1998, and a more prompt and regular evaluation of WFF would be one reason (among many others) for considering moving back to a biennial or annual survey. Second, both measurement errors and sampling errors will affect poverty estimation through secondary analysis of survey data. These are well known to CSRE researchers from reading CSRE literature, but it will be important for policymakers to realise that estimates of changes in poverty will be accompanied by some uncertainty and are best presented in ranges rather than fixed numbers. For example, using 95% confidence intervals, UK estimates of changes in child poverty over time show that there were between 3.2 and 3.5 million poor children in 1996/1997 and between 2.6 and 2.9 million in 2000/2001. It is thus certain that poverty has fallen (as there is no overlap between the two sets of confidence intervals) but the size of the fall is uncertain.71
70 It is noticeable from citations in MSD’sCentre for Social Research and Evaluation (CSRE) publications that there is already an appreciation and knowledge of current UK measurement of poverty and the impact of benefit and tax credit reforms. 71 See Sutherland et al. (2003, page 23) for instance.

75
The issue of measurement error is of potentially greater concern because it is now accepted that incomes at the bottom and top ends of the distribution are subject to misreporting and/or under-reporting. There are several complementary ways of approaching this problem: a series of weights can be produced, based on national accounts, benefit expenditure accounts or other sources that can adjust estimates. Alternatively, administrative data can be used to merge with and/or validate survey data, subject to survey protocol and data protection issues. Lastly, there is great strength in accepting that there is a “mismatch” between low income, poverty and living standards using the same data. Those identified as being in poverty may not show signs of material disadvantage, and vice versa.72 This means that it is well advised to have alternative measures of living standards, hardship and wellbeing to run parallel to the central evaluation of poverty changes measured as a proportion of median income. These are discussed further in section 6.4. There is also the need to ensure that survey instruments are able to record and identify the new WFF transfers accurately. This is a problem that additionally cuts across many of the evaluation strands of WFF attempting to measure take-up. Third, interpretation of changes in poverty rates and the impact of policy over time need care. Poverty incidence will alter, in part, with the movement of median income (if a relative approach is used), and thus periods of economic growth tend to be accompanied by a higher propensity for poverty, and recessions by a lower propensity for poverty, if the underlying risks of poverty are constant or ignored. This means that WFF-type transfers will work, in part, by holding poverty levels constant rather than reducing them during periods of economic growth (as envisaged by wider New Zealand policy). Additionally, one of the intended effects of WFF is to encourage entry into work from social assistance, with resulting higher incomes. Such movements will reduce poverty, but such reductions will be offset in part by the deterioration of the incomes of those out of work without children compared with median income. Similarly, for those receiving WFF payments, these are planned to rise with prices in order to maintain their real value, but over time median income is likely to rise ahead of prices and thus poverty clearance will erode without growth in earnings or other income. There are a number of reasons why relative poverty measures are less useful. These factors suggest that, as in the UK, a secondary approach to measuring changes in poverty over time should be considered in addition to using a measure based on the contemporary median. The second measure shows changes in real income over time compared with the value of the poverty line based on median/average income in the first comparison year (prior to policy change), as already done in New Zealand. In other words, it captures the absolute income changes of a relative poverty line. Such measures would more clearly show the effects of WFF payments up-rated with prices and their impact on poverty irrespective of the growth in median income. Fourth, the previous changes in housing policy on rent levels and the introduction of the Accommodation Supplement (AS) mean that the issue of housing allowances and rents (and other housing costs) becomes an important ingredient of income change. The inclusion of AS in gross income calculations will distort any analysis of recipients’ disposable incomes and it would be advisable to consider two measures of poverty, one using before-housing-cost incomes and the other using after-housing-cost incomes.
72 There is an excellent overview of this in Perry (2002).
76
6.3 Micro-simulation Micro-simulation is used to model post facto the schemes before and after the introduction of WFF using the actual rates of payments but holding the population constant. This approach is used the analyses in the UK by Brewer, Clark and Goodman (2002), HM Treasury (2001) and Sutherland et al. (2003). However, there are many considerations to be made and they can be split into two main questions: • What is currently required to make TAXMOD (or other micro-simulation models)
fit post-facto simulation of WFF reforms? • What assumptions can be made about changes in incomes and poverty lines? From the limited documentation on TAXMOD available, there appears to be great potential for it to be used to estimate impact. However, there are several issues that should be considered for potential updating of TAXMOD or in the creation of a new revised simulation model. • The absence of childcare payments and usage is a serious limitation given the
target group of WFF policies and the intention to increase parents’ employment rates.
• The absence of AS is also a problem that springs from measurement error in the Household Economic Survey, already discussed. The most obvious solution could be to merge administrative data – both on rents and other housing costs and on awards – into the HES and use this updated data.
• The inability to estimate take-up could also be reviewed. UK-based simulation models at the Institute for Fiscal Studies (IFS) now use take-up assumptions based on eligible recipient characteristics and amount of modelled award.
Making micro-simulation estimates over time requires some careful assumptions about income change. First, even for a single-year estimation, the effect of policy on median income and the poverty line must be estimated. Second, when comparing policy over time, income change can be considered according to either constant or changing assumptions. A constant-price approach converts the policies in different years to a constant process and applies this to a sample with constant incomes. This approach allows the analysis to concentrate solely on policy changes. A changing-income approach reflects the facts that incomes change over time and that entitlement and liabilities to benefits and taxes change alongside median income and the resulting poverty line. Aggregate data with adjusted pre-tax and pre-benefit incomes is prepared for each year and the appropriately specified simulation programme run on each of these datasets (simulating each year the contemporary actual tax–benefit system in place). This allows the poverty line to be influenced by both income and policy change and allows analysis to take into account both policy and income change. Comparison across years can be done by subsequent adjustment to constant prices. This approach of using secondary analysis and micro-simulation gives rise to a series of estimates (depending on how many poverty and income definitions are chosen) but enables changes in poverty to be analysed carefully and systematically and allows empirical evidence to be placed alongside hypothetical counterfactual evidence from simulation. This appears to be the major and most relevant measure of policy “impact” available in the literature and plays to many existing strengths in MSD. However, there are other measures of wellbeing and other ways of evaluating the impact of policy on poverty that have been used in the UK and the US. It is to these that we now turn.

77
6.4 Evaluating changes to hardship, living standar ds and wellbeing Increasingly, governments are recognising the multidimensional nature of poverty and the mismatches between family income and expenditure and living standards. These added dimensions provide more direct means for observing living standards through reports of material possessions, activities and debts rather than relying almost solely on income for extrapolating families’ living conditions and quality of life. Following the lead of the Irish Government, in which a concept of consistent poverty is constructed from relative poverty and material deprivation measures, the recently revamped Family Resources Survey (FRS) in the UK has introduced family-level and child-level material deprivation items into the 2004/2005 observations.73 This added dimension contributes to a three-tiered measure of child poverty consisting of: absolute low income – to detect income rises among poor families in real terms relative low income – to analyse how poor families’ incomes compare with the growth in family incomes on the whole material deprivation and low income combined – to include a fuller picture of household economies, with outgoing as well as incoming resources. The FRS family- and child-level material deprivation items are listed in box 6.1. Ultimately, the UK Government is succeeding in reducing poverty when all three indicators are moving in the right direction. Section 6.2 has already outlined the need to monitor alternative measures of “outcomes” from policy besides changes in relative poverty measured as a proportion of median income. This section outlines some of the options for monitoring the impact of WFF on family living standards and wellbeing.
73 Specific material deprivation items were selected because they best discriminated between poor and non-poor families. More details are supplied in Department for Work and Pensions (2003).

78
Box 6.1 UK Family Resources Survey – material deprivation i tems Adult items • home kept adequately warm • two pairs of all-weather shoes for each adult • home kept in a decent state of repair • a holiday away from home for one week a year, not staying with relatives • any worn-out furniture replaced • a small amount of money to spend each week on yourself, not on your family • regular savings (of £10 a month) for rainy days or retirement • insurance of contents of dwelling • friends or family round for a drink or meal at least once a month • a hobby or leisure activity • broken electrical goods, such as refrigerator or washing machine, repaired or
replaced. Child items • a holiday away from home at least one week a year with his or her family • swimming at least once a month • a hobby or leisure activity • friends round for tea or a snack at least once a fortnight • enough bedrooms for every child over 10 of different sex to have his or her own
bedroom • leisure equipment (eg sports equipment or a bicycle) • celebrations on special occasions such as birthdays, Christmas or other religious
festivals • playgroup / nursery / toddler group at least once a week for children of pre-school
age • a school trip at least once a term for school-aged children. For each item, respondents are asked to indicate one of the following: “We have this” “We would like to have this, but cannot afford it at the moment” “We do not want/need this at the moment” 6.4.1 Wellbeing indicators Given the magnitude of WFF, one would expect far-reaching impacts on families. In time, these would manifest in general demographic trends in work, income, health, housing, education, anti-social behaviour and crime. With improved family incomes and working-parent role models, it is reasonable to expect improvements to national figures monitoring child wellbeing, such as: • infant mortality • children in workless households • smoking and drinking behaviour • truancy and early school leaving • violent assaults
79
• teenage conceptions • young people’s employment rates • post-secondary school training. Positive changes in these general population statistics might be detected in time, but more direct observations of families who have received the WFF interventions need to be taken before any causal connections can be assumed. Longitudinal qualitative studies can be very informative in this context. The profiling and monitoring of family living standards through indicators of material wellbeing are a common alternative means for tracking policy initiatives set to improve quality of life. The Economic Living Standard Index (ELSI) in New Zealand, the Urban Institute’s Survey of American Families in the US and, in addition to the Family Resources Survey, the Poverty and Social Exclusion Survey and the Families and Children Study (FACS) in the UK are good examples of this. These data sources refer to the material aspects of wellbeing, surveying families on a variety of areas of social and material expenditure – for example, housing, clothing, food, transportation and social entertainment. The focus is on an imposed lack or deprivation of materials, usually measured by tallying those items families lack and are not able to afford. Over time, living standards are said to improve when more families indicate they have the items and there is a drop in the proportion of families who indicate they cannot afford the items. Instating a tool to track changes in living standards is advisable, but is not without issue. Recent research on measures applied in the UK questions how consensual the “necessary” items really are across population sub-groups (McKay 2004). Family profiles on living standards would therefore need to account for variation in the value ascribed to items by different sectors of the population (eg split by age or ethnicity). In addition, the list of necessary items needs to be empirically updated because deprivation rates are expected to decline naturally as certain items, such as electronic equipment, become more publicly accessible due to price changes. For example, according to FACS data, the rate of personal computer ownership among single-parent families increased by 26% between 1999 and 2002. 6.4.2 Summary indices of deprivation Lists of material deprivation items are unwieldy for analysis purposes, so a summary index is suitably derived. Methods for constructing an index vary and may include factor analytic techniques and empirical consensus for selection of items to an index. Additionally, each item in a scale may be weighted equally, or some may bear more importance than others. Whether or not more empirical approaches are used, it is vital that the validity of a scale be tested against the expenditure behaviour of the contemporary population. FACS includes the most comprehensive survey of non-monetary deprivation indicators in the UK. The derived Hardship Index accounts for over 80 separate questions about family housing conditions, financial behaviour (including problem debt) and material and social expenditure. For each of nine criteria, families score a point on a hardship scale ranging from zero to nine. Scores are then summarised into three categories: “not in hardship”, “in moderate hardship” and “in severe hardship”.74 The scale is designed as a conservative estimate of poor living standards, so that in 2002 over 70% of surveyed families with children did not satisfy any of the hardship
74 For details on the construction of the FACS Hardship Index, refer to Vegeris and Perry (2003, appendix E).
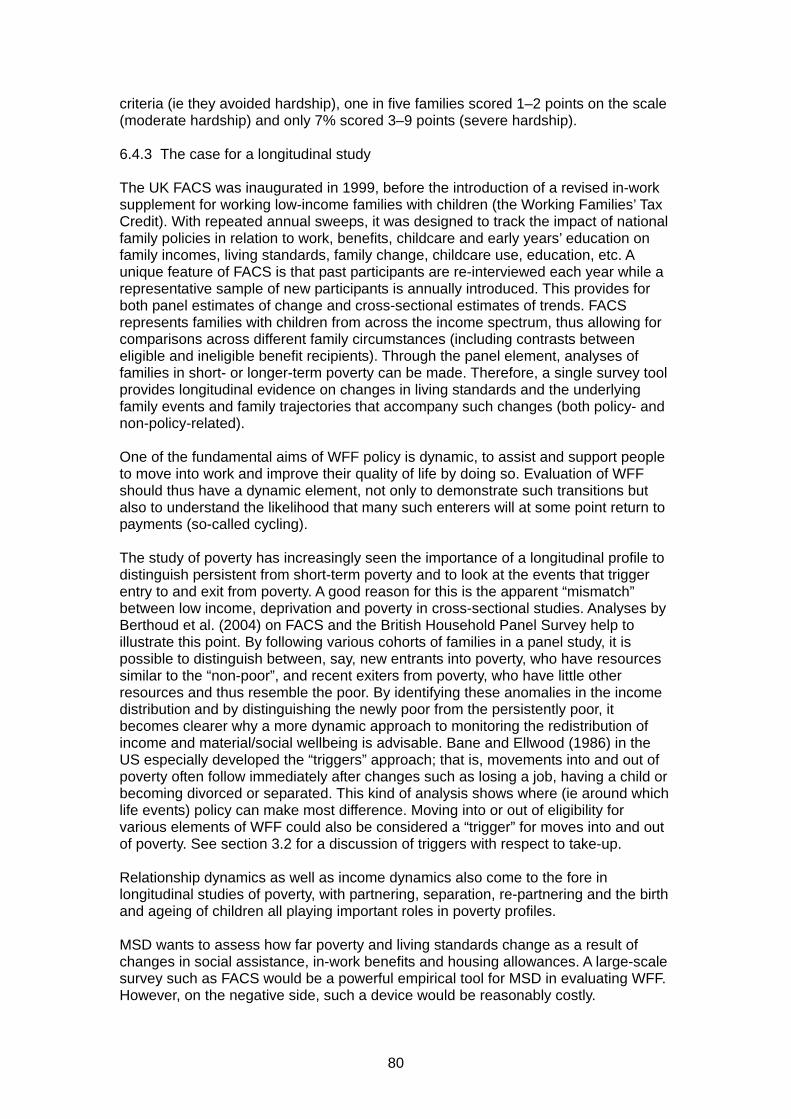
80
criteria (ie they avoided hardship), one in five families scored 1–2 points on the scale (moderate hardship) and only 7% scored 3–9 points (severe hardship). 6.4.3 The case for a longitudinal study The UK FACS was inaugurated in 1999, before the introduction of a revised in-work supplement for working low-income families with children (the Working Families’ Tax Credit). With repeated annual sweeps, it was designed to track the impact of national family policies in relation to work, benefits, childcare and early years’ education on family incomes, living standards, family change, childcare use, education, etc. A unique feature of FACS is that past participants are re-interviewed each year while a representative sample of new participants is annually introduced. This provides for both panel estimates of change and cross-sectional estimates of trends. FACS represents families with children from across the income spectrum, thus allowing for comparisons across different family circumstances (including contrasts between eligible and ineligible benefit recipients). Through the panel element, analyses of families in short- or longer-term poverty can be made. Therefore, a single survey tool provides longitudinal evidence on changes in living standards and the underlying family events and family trajectories that accompany such changes (both policy- and non-policy-related). One of the fundamental aims of WFF policy is dynamic, to assist and support people to move into work and improve their quality of life by doing so. Evaluation of WFF should thus have a dynamic element, not only to demonstrate such transitions but also to understand the likelihood that many such enterers will at some point return to payments (so-called cycling). The study of poverty has increasingly seen the importance of a longitudinal profile to distinguish persistent from short-term poverty and to look at the events that trigger entry to and exit from poverty. A good reason for this is the apparent “mismatch” between low income, deprivation and poverty in cross-sectional studies. Analyses by Berthoud et al. (2004) on FACS and the British Household Panel Survey help to illustrate this point. By following various cohorts of families in a panel study, it is possible to distinguish between, say, new entrants into poverty, who have resources similar to the “non-poor”, and recent exiters from poverty, who have little other resources and thus resemble the poor. By identifying these anomalies in the income distribution and by distinguishing the newly poor from the persistently poor, it becomes clearer why a more dynamic approach to monitoring the redistribution of income and material/social wellbeing is advisable. Bane and Ellwood (1986) in the US especially developed the “triggers” approach; that is, movements into and out of poverty often follow immediately after changes such as losing a job, having a child or becoming divorced or separated. This kind of analysis shows where (ie around which life events) policy can make most difference. Moving into or out of eligibility for various elements of WFF could also be considered a “trigger” for moves into and out of poverty. See section 3.2 for a discussion of triggers with respect to take-up. Relationship dynamics as well as income dynamics also come to the fore in longitudinal studies of poverty, with partnering, separation, re-partnering and the birth and ageing of children all playing important roles in poverty profiles. MSD wants to assess how far poverty and living standards change as a result of changes in social assistance, in-work benefits and housing allowances. A large-scale survey such as FACS would be a powerful empirical tool for MSD in evaluating WFF. However, on the negative side, such a device would be reasonably costly.

81
Child poverty from the children’s perspective Usually, all systematic sources of data on child poverty are representative of an adult rather than a child perspective. In the UK, Ridge’s (2002) groundbreaking research on young people and poverty has emphasised the unique perspective of children in non-working households, both distinct from the adult experience and distinct from that of children in working households. For the WFF evaluation, such data and analysis of child self-reported behaviour and aspirations would improve understanding of the dynamics of household deprivation. For policies that seek to reduce child poverty, children’s perspective would be invaluable to the findings of the WFF evaluation. Longitudinal analysis can track changes in household living standards reflected in positive changes from the children’s perspectives. It would be useful to complement this analysis with a qualitative investigation into the issue. Also, analysis of parent- and child-reported measures would help to substantiate in what dimensions of living there are intergenerational similarities and where there are differences. From 2004, FACS includes interviews with children over 10 years of age to glean their perspectives on what stability and changes they have experienced. It would be revealing to analyse this type of data in association with existing measures of deprivation reported by parents, including the FACS-type measures from separate components of hardship along with the composite index. Researching a child’s perspective Governments are slow to collect the child perspective in policy evaluation, partly because research with children poses additional methodological challenges to those of research conducted adult to adult. Ethically, children’s participation requires both the parent’s and the child’s consent. The experience from PRILIF is that dual consent is not difficult to obtain. During the interview, the level of detail reported by children might be compromised if the child feels intimidated by the researcher or the research process. To avoid this, in a structured survey approach, children could report their answers in private either on a self-administered Computer-Assisted Personal Interview (CAPI) or with paper and pencil, or an audio tape could be used to ask the questions and the children could fill in an answer form. In a less structured approach that requires interaction with a researcher, care should be taken in selecting interviewers with whom the child is more likely to feel comfortable, taking into account age, ethnicity, gender, etc. Because of the likelihood that parents and children can and do have different understandings of their family circumstances, there is the additional challenge of aligning children’s evidence with that of their parents. Data comparability should be borne in mind during the instrument design phase of the study, where question wording (and re-wording when adapting existing questions to more child-friendly language) should take into account compatibility with other data sources. Due to different understandings of the issues, further analysis should be undertaken in cases where the child data does not support general adult trends (and vice versa), in order to help explain the discrepancies.
82
Conclusion This paper has identified design aspects that MSD should take into consideration for the evaluation of Working for Families (WFF). Throughout, the paper draws on a selection of the evaluation literature. The references included are relevant to WFF, either because they evaluate a similar programme, or a sub-programme within WFF, or because they are informative about evaluation techniques useful for WFF. A number of features of WFF that affect the evaluation have been detailed. The WFF monitoring and evaluation framework should address the following issues: • the scale of WFF may introduce general equilibrium effects • the impact of parts of WFF might not be able to be estimated separately • variation in flexible implementation and delivery may introduce area effects • there will be no “once-and-for-all” impact, and impacts in the short-, medium- and
long-term should be estimated. Realistic targets need to be set against which to measure the efficacy of the programme, which may vary across the short- to long-term. Non-experimental techniques must be relied upon to estimate the impacts of WFF. These evaluation methodologies were presented in section 4. They have some particular data requirements, which need to be assessed against the data available or collected for WFF. Ideally, these specific data needs can be built into the data development strategy. The national nature of the programme also imposes some limits on the impact estimation methods and on the choice of comparisons. The impact type one would like to measure will depend on the foreseen use of the evaluation findings. This will need to be carefully considered for any impact evaluation. The methodological and data requirements that must be addressed in meeting the four key evaluation objectives of implementation and delivery, take-up and entitlement, making work pay, and poverty and wellbeing were looked at in detail in sections 2 to 6. Evaluation for the WFF childcare initiatives has been examined in each of these sections. Each topic was introduced and the WFF context outlined. A summary of the issues perceived to arise was explored. The solutions or limitations imposed were put forward. Examples from the literature demonstrated the capacity to resolve the evaluation issues. An important question is whether WFF can be evaluated at all. This paper may give the impression that there are so many difficulties and complications that an evaluation is completely impossible. However, it should be emphasised that, in practice, some potential problems will not prove to be serious. In addition, good choice of designs and methods can deal with other issues to a reasonable degree. The task for MSD will be to devise a comprehensive evaluation design for WFF that includes components capable of capturing the effects of WFF. This might include impact studies, process and implementation studies and a more general monitoring programme. The precise components remain matters for judgement in the context of the WFF. Findings from each of these studies will provide an integrated body of evidence on the operation, effectiveness and consequences of WFF. The different evaluation parts, when taken together, will offer policymakers and administrators a firm basis of information for deciding whether WFF has met key objectives.

83
Bibliography Acs G and L Pamela (2001) Final synthesis report of the findings from ASPE’s Leavers Grants, report to the US Department of Health and Human Services, Urban Institute, Washington DC. Agodini R and M Dynarski (2001) Are experiments the only option? A look at dropout prevention programs, Mathematica Policy Research Inc., Princeton NJ. Anastasi A (1976) Psychological Testing (4th ed.) Macmillan Publishing, New York. Angrist J D and W N Evans (1998) “Children and their parents’ labour supply: evidence from exogenous variation in family size”, American Economic Review, 88(3): 450–477. Athayde R, R Blackburn, M Hart and J Kitching (2003) Working Families’ Tax Credit and Disabled Person’s Tax Credit: The views, attitudes and experiences of employers, Inland Revenue Research Report 3, Inland Revenue, London. Bane M J and D T Ellwood (1986) “Slipping into and out of poverty: The dynamics of spells”, Journal of Human Resources, 21: 1–23. Barnes H, M Hudson, J Parry, J M Sahin-Dikmen, R Taylor and D Wilkinson (2005) Ethnic Minority Outreach: An evaluation, Department for Work and Pensions Social Research Division Research Report 229, Corporate Document Services, Leeds. http://www.dwp.gov.uk/asd/asd5/rports2005-2006/rrep229.pdf Barnow B and J Smith (2004) “Performance management of U.S. job training programs: Lessons from the Job Training Partnership Act”, Public Finance and Management, 4: 247–287. Bell B, R Blundell and J Van Reenen (1999) ”Getting the unemployed back to work: The role of wage subsidies”, International Tax and Public Finance, 6: 339–360. Bergemann A, B Fitzenberger and S Speckesser (2001) Evaluating the employment effects of public sector sponsored training in East Germany: Conditional difference-in-differences and Ashenfelter’s dip, mimeo, University of Mannheim. Berthoud R, M Bryan and E Bardasi (2004) The dynamics of deprivation: The relationship between income and material deprivation over time, Department for Work and Pensions Research Report 219, Corporate Document Services, Leeds. Bingley P and I Walker (2001) ”Housing subsidies and work incentives in Great Britain, Economic Journal”, 111: 86–103. Bitler M P, J B Gelbach and H W Hoynes (2004) What mean impacts miss: Distributional effects of welfare reform experiments, Working Paper, University of Maryland. http://glue.umd.edu/~gelbach/papers/experimental/bghexperimental-paper-6-01-04.pdf
84
Bloom H S, C J Hill and J Riccio (2001) Modeling the performance of welfare-to-work programs: The effects of program management and services, economic environment, and client characteristics, Working paper on research methodology, MDRC (Manpower Demonstration Research Corporation). Bloom H S, C J Hill and J Riccio (2003) ”Linking programme implementation and effectiveness: Lessons from a pooled sample of welfare-to-work experiments”, Journal of Policy Analysis and Management, 22: 551–575. Blundell R (1994) ”Work incentives and labour supply in the United Kingdom”, in A Bryson and S McKay (eds.) Is It Worth Working? Factors Affecting Labour Supply, Policy Studies Institute, London. Blundell R and M Costa Dias (2000) ”Evaluation methods for non-experimental data”, Fiscal Studies, 21: 427–468. Blundell R and M Costa Dias (2002) Alternative approaches to evaluation in empirical microeconomics, Cemmap Working Paper CWP10/02, Institute for Fiscal Studies, London. Blundell R, M Costa Dias and C Meghir (2003) The overall impact of wage subsidies under idiosyncratic uncertainty, mimeo, Institute for Fiscal Studies, London. Blundell R, A Duncan, J McCrae and C Meghir (2000) ”The labour market impact of the Working Families’ Tax Credit”, Fiscal Studies, 21: 75–103. Blundell R and T MaCurdy (1999) ”Labor supply: A review of alternative approaches”, in O Ashenfelter and D Card (eds.) Handbook of Labor Economics, Vol. 3A, North-Holland, Amsterdam. Blundell R, H Reed, J Van Reenen and A Shephard (2003) ”The impact of the New Deal for Young People on the labour market: A four year assessment”, in R Dickens, P Gregg and J Wadsworth, The Labour Market under New Labour: The State of Working Britain, Basingstoke: Palgrave Macmillan. Blundell R and I Walker (2002) Working Families’ Tax Credit: A review of the evidence, issues and prospects for further research, Inland Revenue Research Report 1, Inland Revenue, London. Bonjour D, R Dorsett, G Knight, S Lissenburgh, A Mukherjee, J Payne, M Range, P Urwin and M White (2001) New Deal for Young People: National survey of participants: Stage 2, Employment Service Research and Development Report ESR67, Employment Service, Sheffield, UK. Bonjour D, R Dorsett and G Knight (2002) Joint claims for Jobseekers Allowance, stage 2 quantitative evaluation of labour market effects, Department for Work and Pensions, Employment Service Research and Development Report WAE117, Sheffield, UK. http://www.dwp.gov.uk/jad/2002/wae117rep.pdf Brewer M (2003) Estimating models of benefit take-up, Working Paper 1b, Inland Revenue, London.

85
Brewer M and T Clark (2002) The impact on incentives of five years of social security reform in the United Kingdom, Working Paper W02/14, Institute for Fiscal Studies, London. Brewer M, T Clark and A Goodman (2002) The Government’s Child Poverty Target: How much progress has been made?, Commentary 88, Institute for Fiscal Studies, London. Brewer M, A Duncan, A Shephard and M J Suárez (2005) Did Working Families’ Tax Credit work? The final evaluation of the impact of in-work support on parents’ labour supply and take-up behaviour in the UK, Working Paper, Inland Revenue, London. http://www.hmrc.gov.uk/research/ifs-laboursupply.pdf Brewer M and P Gregg (2002) Eradicating child poverty in Britain: Welfare reform and children since 1997, University of Bristol, CMPO (Centre for Market and Public Organisation), Working Paper 02/052. Brewer M and G Paull (2004) Reviewing approaches to understanding the link between childcare use and mothers’ employment, Working Paper 14, Department for Work and Pensions, UK. Brewer M, M Suárez and I Walker (2003) Modelling take-up of Family Credit and Working Families’ Tax Credit, Working Paper 1a, Inland Revenue, UK. Bryson A (1998) ”Lone mothers’ earnings”, in R Ford and J Miller (eds.) Private Lives, Public Responses: Lone Parenthood and Future Policy in the United Kingdom, Policy Studies Institute, London. Bryson A, R Dorsett and S Purdon (2002) The use of propensity score matching in the evaluation of active labour market policies, Working Paper 4, Department for Work and Pensions, UK. Bryson A and R Gomez (2003) Segmentation, switching costs and the demand for unionization in Britain, Discussion Paper 568, London School of Economics, Centre for Economic Performance. Bryson A and J Jacobs (1992) Policing the Workshy: Benefit Controls, the Labour Market and the Unemployed, Avebury, Aldershot. Bryson A and D Kasparova (2003) Profiling benefit claimants in Britain: A feasibility study, Department for Work and Pensions Report 196, HMSO, Leeds. Bryson A, G Knight and M White (2000) New Deal for Young People: National survey of participants: Stage 1, Employment Service Research and Development Report ESR44, Employment Service, Sheffield. Bryson A and A Marsh (1996) Leaving Family Credit, Department of Social Security Research Report 48, HMSO, London. Buddelmeyer H and E Skoufias (2004) An evaluation of the performance of regression discontinuity design on progresa, Working Paper 3386, World Bank Policy Research.

86
Cabinet Policy Committee (2004) “Reform of Social Assistance: Working for Families Package”, Minutes of Decisions CAB Min (04) 13/4, New Zealand Cabinet Office, Wellington. Callender C, G Court, M Thompson and A Patch (1995) Employers and Family Credit, Department of Social Security Research Report 32, HMSO, London. Calmfors L (1994) Active labour market policy and unemployment: A framework for the analysis of crucial design features, OECD Economic Studies, 22: 7–47. Camerer C, L Babcock, G Loewenstein and R Thaler (1997), ”Labor supply of New York city cabdrivers: One day at a time”, Quarterly Journal of Economics, 112: 407–441. Card D, C Michalopoulos and P K Robins (2001) The limits to wage growth: Measuring the growth rates of wages for recent welfare leavers, Working Paper 8444, NBER (National Bureau of Economic Research), Cambridge: MA. Chiappori P, R Blundell and N Meghir (2002) Collective labour supply with children, Working Paper W02/08, Institute for Fiscal Studies, London. Connolly H and P Gottschalk (2001) Stepping stone jobs: Theory and evidence, Working Paper 427, Boston College. Costigan P, H Finch, B Jackson, R Legard and J Ritchie (1999) Overcoming barriers: Older people and income support, Department of Social Security, Leeds. Currie J (2004), The take-up of social benefits, prepared for the Smolensky Conference “Poverty, the Distribution of Income and Public Policy,” University of California, Berkeley, December 12-13, 2003 (revised). Dalley G and R Berthoud (1992) Challenging Discretion: The Social Fund Review Procedure, Policy Studies Institute, London. Davidson C and S A Woodbury (1993) ”The displacement effect of reemployment bonus programs”, Journal of Labor Economics, 11: 575–605. Dehijia R and S Wahba (1999) ”Causal effects in nonexperimental studies: Reevaluating the evaluation of training programs”, Journal of American Statistical Association, 94:1053–1062. Department for Work and Pensions (2003) Measuring child poverty, Corporate Document Services, Leeds. http://www.dwp.gov.uk/consultations/consult/2003/childpov/final.pdf Department for Work and Pensions (2004) Building on New Deal: local solutions meeting local needs, DWP, London. http://www.dwp.gov.uk/publications/dwp/2004/buildingonnewdeal/mainreport.pdf Department for Work and Pensions (2005) Income related benefits: Estimates of take-up in 2002/2003, DWP, London. http://www.dwp.gov.uk/asd/income_analysis/final0203btense.pdf

87
Dolton P, J Smith and J P de Azevado (2005) The econometric evaluation of the New Deal for Lone Parents, report to the UK Department for Work and Pensions, forthcoming. Dornan P (2003) Guaranteeing a minimum income in old age? Means testing in the twenty-first century, University of York, PhD thesis. Dorsett R (2001) Workless couples: Characteristics and labour market transitions, Employment Service Report ESR79, Department for Work and Pensions, UK. http://www.dwp.gov.uk/jad/2001/esr79rep.pdf Dorsett R (2001) Workless couples: Modelling labour market transitions, Employment Service Report ESR98, Department for Work and Pensions, UK. http://www.dwp.gov.uk/jad/2001/esr98rep.pdf Dorsett R and D Kasparova (2004) Low-moderate income couples and the labour market, Working Paper 15, Department for Work and Pensions, UK. Duncan A, C Giles and S Webb (1995) The Impact of Subsidising Childcare, Equal Opportunities Commission, Manchester. Duncan A, G Paull and J Taylor (2001) Price and quality in the UK childcare market, Working Paper W01/14, Institute for Fiscal Studies, London. Eichler M and M Lechner (1998) An evaluation of public employment programmes in the East German State of Sachsen-Anhalt, Discussion Paper 9815, University of St Gallen, Volkswirtschaftliche Abteilung. Eichler M and M Lechner (2000) Some econometric evidence on the effectiveness of active labour market programmes in East Germany, Working Paper 318, William Davidson Institute, Michegan. Eissa N (1996) ”Labor supply and the economic recovery tax act of 1981”, in M Feldstein and J M Poterba (eds.) Empirical Foundations in Household Taxation, University of Chicago Press, Chicago and London. Ellwood D (2001) ”The impact of the Earned Income Tax Credit and social policy reforms on work, marriage, and living arrangements”, National Tax Journal, 53: 1063–1106. Ellwood D and R Blank (2002) ”The Clinton legacy for America’s poor”, in J A Frankel and P R Orszag (eds.) American Economic Policy in the 1990s, MIT Press, Cambridge MA. Ellwood D and R Dickens (2003) ”Child poverty in Britain and the United States”, in R Dickens, P Gregg and J Wadsworth (eds.) The Labour Market under New Labour: The State of Working Britain, Palgrave Macmillan, London. Evans M (2001) Welfare to work and the rganisation of opportunity: Lessons from abroad, CASE Report 15, Centre for the Analysis of Social Exclusion, London School of Economics, London.

88
Evans M, J Eyre, J Millar and S Sarre (2003) New Deal for Lone Parents: Second synthesis report of the national evaluation, Department for Work and Pensions Report 163, DWP, Sheffield. http://www.dwp.gov.uk/jad/2003/163_rep.pdf Evans M, G Knight and I La Valle (2006) Working for Families: Literature review of evaluation evidence, Ministry of Social Development, Wellington. Evans M, A McKnight and C Namazie (2002) New Deal for Lone Parents: First synthesis report of the national evaluation, Department for Work and Pensions Report 116, DWP, Sheffield. http://www.dwp.gov.uk/jad/2002/esr116rep.pdf Falk A and E Fehr (2003) ”Why labour market experiments?”, Labour Economics, 10: 399–406. http://www.iew.unizh.ch/home/fehr/papers/WhyLabourMarketExperiments.pdf Farrell C and W O’Connor (2003) Low-income families and household spending, Department for Work and Pensions Research Report 192, Corporate Document Services, Leeds. Fay R G (1997) Making the public employment service more effective through the introduction of market signals, OECD Labour Market and Social Policy Occasional Papers 25, OECD, Paris. Fehr E and L Götte (2002) Do workers work more if wages are high? Evidence from a randomized field experiment, Working Paper 125, Institute for Empirical Research in Economics, University of Zurich. Finch H and G Elam (1995) Managing Money in Later Life, Department of Social Security, London. Finch H and M Gloyer (2000) A further look at the evaluation of NDLP Phase One data: Focus on childcare, DSS In-House Report 68, Department of Social Security Social Research Branch, London. Finn D (2002) Privatising employment assistance: Lessons from the Australian Job Network, paper presented to the first joint Inclusion and Work Foundation welfare-to-work seminar, London. Foley K, R Ford, D Gyarmati, C Michalopoulos, C Miller, P Morris, C Redcross, P Robins and D Tattrie (2002) Making work pay: Final report on the Self-Sufficiency Project for Long-Term Welfare Recipients, Social Research Demonstration Corporation, Ottawa. Francesconi M and W van der Klaauw (2004) The consequences of ‘in-work’ benefit reform in Britain: New evidence from panel data, Working Paper 2004-13, ISER (Institute for Social and Economic Research) and Working Paper 1248, IZA (Institute for the Study of Labour). Franses A and A Thomas (2004) Jobcentre Plus’ delivery of new tax credit policy, Department for Work and Pensions Research Report 220, Corporate Document Services, Leeds.

89
Freedman S, M Mitchell and D Navarro (1999) The Los Angeles Jobs-First GAIN evaluation: First-year findings on participation patterns and impacts, MDRC (Manpower Demonstration Research Corporation), New York. Frölich M, M Lechner and H Steiger (2003) ”Statistically assisted programme selection: International experiences and potential benefits for Switzerland”, Swiss Journal of Economics and Statistics, 139: 311–331. Fry V and G Stark (1993), The Take-Up of Means-Tested Benefits 1984–90, Institute for Fiscal Studies, London. Goldberger A (1983) ”Abnormal selection bias”, in S Karlin, T Amemiya and L Goodman (eds.) Studies in Econometrics, Time Series and Multivariate Statistics, Academic Press, New York. Götte L and D Huffman (2003) Reference-dependent preferences and the allocation of effort over time: Evidence from natural experiments, mimeo, Institute for Empirical Research in Economics, University of Zurich. Green H, H Connolly, A Marsh and A Bryson (2001) The medium-term effects of voluntary participation in ONE, Department for Work and Pensions Research Report 149, DWP, London. Greenberg D H and U Appenzeller (1998) Cost analysis step by step: A how-to guide for planners and providers of welfare-to-work and other employment and training programs, MDRC (Manpower Demonstration Research Corporation), New York. Gregg P and S Harkness (2003a) ”Welfare reform and lone parents employment in the United Kingdom”, in R Dickens, P Gregg and J Wadsworth (eds.) The Labour Market under New Labour: The State of Working Britain, Palgrave Macmillan, London. Gregg P and S Harkness (2003b) Welfare reform and lone parents in the United Kingdom, Working Paper 03/072, University of Bristol, CMPO (Centre for Market and Public Organisation). Griggs J, F McAllister and R Walker (2005) The New Tax Credits System: Knowledge and Awareness among Recipients, One Parent Families, London. Grubb D (2004) Performance measurement and quasi-competitive mechanisms for the public employment service, LSE lunchtime seminar, 27 January, Centre for Economic Performance, London. Hales J, R Taylor, W Mandy and M Miller (2003) Evaluation of employment zones: report on a cohort survey of long-term unemployed people in the zones and a matched set of comparison areas, Department for Work and Pensions Report 176, DWP, Sheffield. http://www.dwp.gov.uk/jad/2003/176rep.pdf Hahn J, P Todd and W van der Klaauw (2001) ”Identification and estimation of treatment effects with a regression-discontinuity design”, Econometrica, Vol 69(1), January: 201–209.

90
Hales J, D Collins, C Hasluck and S Woodland (2000) New Deals for Young People and for Long-term Unemployed: Survey of employers, Employment Service Report ESR58, Department for Work and Pensions, UK. Hales J, R Taylor, W Mandy and M Miller (2003) Evaluation of employment zones: report on a cohort survey of long term unemployed people in the zones and a matched set of comparison areas, Department for Work and Pensions Research Report WAE 173. Hancock R M, S E Pudney, G Barker, M Hernandez and H Sutherland (2004) ”The take-up of multiple means-tested benefits by British pensioners: Evidence from the family resources survey”, Fiscal Studies, 25: 279–304. Harris T, I La Valle and S Dickens (2004) Childcare: How local markets respond to national initiatives, Research Report RB526, Department for Education and Skills, London. http://www.dfes.gov.uk/research/data/uploadfiles/RB526.pdf Hasluck C, P Elias and A E Green (2003) The wider labour market impact of employment zones, Department for Work and Pensions Research Report 175, DWP, Sheffield. http://www.dwp.gov.uk/jad/2003/175rep.pdf Heckman J (1995) Instrumental variables: A cautionary tale, Technical Working Paper 185, NBER (National Bureau of Economic Research), Cambridge: MA. Heckman J (1996) ”Comment”, in M Feldstein and J M Poterba (eds.) Empirical Foundations in Household Taxation, University of Chicago Press, Chicago and London. Heckman J, C Heinrich and J Smith (2002) ”The performance of performance standards”, Journal of Human Resources, 36: 778–811. Heckman J, H Ichimura, J Smith and P Todd (1998) ”Characterizing selection bias using experimental data”, Econometrica, 66: 1017–1098. Heckman J, H Ichimura and P Todd (1997) ”Matching as an econometric evaluation estimator: Evidence from evaluating a job training programme”, Review of Economic Studies, 64: 605–654. Heckman J, R J LaLonde and J A Smith (1999) ”The economics and econometrics of active labour market programs”, in O Ashenfelter and D Card (eds.) Handbook of Labour Economics, North-Holland, Amsterdam. Heckman J, L Lochner and C Taber (1998) ”General equilibrium treatment effects: A study of tuition policy”, American Economic Review, 88: 381–386. Heckman J and J Smith (1995) ”Assessing the case for social experiments”, Journal of Economic Perspectives, 9(2): 85–100. Heckman J and J Smith (1999) ”Pre-programme earnings dip and the determinants of participation in a social programme: implications for simple programme evaluation strategies”, Economic Journal, 109: 313–348.

91
Hernanz V, F Malherbet and M Pellizzari (2004) Take-up of welfare benefits in OECD countries: A review of the evidence, OECD Social, Employment and Migration Working Paper 17. HM Treasury (2001) Tackling Child Poverty: Giving Every Child the Best Possible Start in Life, HMSO, London. Howard M (2004) Tax Credits One Year On, Child Poverty Action Group, London. Imbens G (1999) The role of the propensity score in estimating dose-response functions, Technical Working Paper 237, NBER (National Bureau of Economic Research), Cambridge: MA. Imbens G and J Angrist (1994) ”Identification and estimation of local average treatment effects”, Econometrica, 62: 467–476. Jackson P R (1994) ”Influences on commitment to employment and commitment to work”, in A Bryson and S McKay (eds.) Is It Worth Working? Policy Studies Institute, London. Jenkins S and J Millar (1989) ”Income risk and income maintenance”, in A W Dilnot and I Walker (eds.) The Economics of Social Security, Oxford University Press, Oxford. Keane M and R Moffitt (1983) ”A structural model of multiple welfare program participation and labor supply”, International Economic Review, 39: 553–589. Kellard K (2002) ”Job retention and advancement in the United Kingdom: A developing agenda”, Benefits, 10: 93–98. Kellard K, L Adelman, A Cebulla and C Heaver (2002) From job seekers to job keepers: Job retention, advancement and the role of in-work support programmes, Department for Work and Pensions Research Report 170, Corporate Document Services, Leeds. http://www.dwp.gov.uk/asd/asd5/170summ.asp Kempson E, A Bryson and R Rowlingson (1994) Hard Times: How Poor Families Make Ends Meet, Policy Studies Institute, London. van der Klaauw W (2002) ”Estimating the effect of financial aid offers on college enrollment: A regression-discontinuity approach”, International Economic Review, Vol 43(4). LaLonde R (1986) ”Evaluating the econometric evaluations of training programs with experimental data”, American Economic Review, 76: 604–620. Layard R, S Nickell and R Jackman (1991) Unemployment, Macroeconomic Performance and the Labour Market, Oxford University Press, Oxford. Lechner M (2001a) ”Identification and estimation of causal effects of multiple treatments under the conditional independence assumption”, in M Lechner and F Pfeiffer (eds.) Econometric Evaluation of Labour Market Policies, Physica-Verlag, Heidelberg.

92
Lefebvre P and P Merrigan (2003) ”Assessing family policy in Canada: A new deal for families and children”, Choices, 9(5). Leigh A (2004) Optimal design of Earned Income Tax Credits: Evidence from a British natural experiment, mimeo, Australian National University. Lise J, S Seitz and J Smith (2003) Equilibrium policy experiments and the evaluation of social programs, Discussion Paper 758, IZA (Institute for the Study of Labour). Lissenburgh S and A Marsh (2003) Experiencing JobcentrePlus Pathfinders: Overview of early evaluation evidence, In-House Report 111, Department for Work and Pensions. http://www.dwp.gov.uk/asd/asd5/IH111.pdf Loprest P (1999) Families who left welfare: Who are they and how are they doing?, Assessing the New Federalism Discussion Paper 99-02, Urban Institute, Washington DC. Loprest P (2001) ”How are families who left welfare doing over time? A comparison of two cohorts of welfare leavers”, Federal Reserve Bank of New York Economic Policy Review, 7(2): 9–19. Loprest P (2002) Who returns to welfare?, Assessing the New Federalism Policy Brief B-49, Urban Institute, Washington DC. Loprest P and D Wissoker (2004) Employment and welfare reform in the national survey of America’s families, Assessing the New Federalism Discussion Paper 02-04, Urban Institute, Washington DC. Lowe E, V McLoyd, D Crosby, M Ripke and C Redcross (2003) New hope for families and children: Five-year results of a program to reduce poverty and reform welfare, MDRC (Manpower Demonstration Research Corporation), New York. Lydon R and I Walker (2003) Welfare-to-work, wages and wage growth, Working Paper 2, Inland Revenue, UK. Lydon R and I Walker (2004) Welfare to work, wages and wage growth, mimeo, Inland Revenue, UK. http://www.hmrc.gov.uk/research/ifs-wagegrowth.pdf Lynn L E Jr, C J Heinrich and C J Hill (2000) ”Studying governance and public management: Challenges and prospects”, Journal of Public Administration Research and Theory, 10: 233–261. Mallar C D (1977) ”The estimation of simultaneous probability models”, Econometrica, 45: 1717–1722. Manski C F (2004) ”Measuring expectations”, Econometrica, 72: 1329–1376. Manski C F and J D Straub (2000) ”Worker perceptions of job insecurity in the mid-1990s: Evidence from the survey of economic expectations”, Journal of Human Resources, 35: 447–479. Marney J (2006) Personal communication. Ministry of Social Development.

93
Marsh A and S McKay (1993) Families, Work and Benefits, Policy Studies Institute, London. McCee A, R Fitzgerald and M Thornby (2004) A Description of Non-Respondents to the Family Resources Survey 2002–2003, National Centre for Social Research, London. McKay S (2002) Low/moderate-income families in Britain: Work, Working Families’ Tax Credit and childcare in 2000, Department for Work and Pensions Research Report 161, Corporate Document Services, Leeds. McKay S (2003) Working Families’ Tax Credit in 2001, Department for Work and Pensions Research Report 181, Corporate Document Services, Leeds. McKay S (2004) ”Poverty or preference: What do ‘consensual deprivation indicators’ really measure? ”, Fiscal Studies, 25: 201–223. McLaughlin E (1991) ”Work and welfare benefits: Social security, employment and unemployment in the 1990s”, Journal of Social Policy, 20: 485–508. McLaughlin E (1994) Flexibility in work and benefits, paper for the Commission on Social Justice, Institute for Public Policy Research, London. Melhuish E C (1994) A literature review of the impact of early years provision on young children, with emphasis given to children from disadvantaged backgrounds, National Audit Office, London. Meyer B (1995) ”Lessons from the US unemployment insurance experiments”, Journal of Economic Literature, 33: 91–131. Milligan K and M Stabile (2004) The integration of child tax credits and welfare: Evidence from the national child benefit program, Working Paper 10968, NBER (National Bureau of Economic Research), Cambridge, MA. Morris S, D Greenberg, J Riccio, B Mittra, H Green, S Lissenburg and R Blundell (2003) Designing a demonstration project: An employment, retention and advancement demonstration for Great Britain, Government Chief Social Researchers’ Office Occasional Paper Series. http://www.strategy.gov.uk/downloads/files/ddp.pdf Mroz T (1987) ”Sensitivity of an empirical model of married women’s hours of work to economic and statistical assumptions”, Econometrica, 55: 765–799. MSD (2004a) Working for Families package monitoring framework (October 2004 version), Ministry of Social Development, Wellington. MSD (2004b) Future Directions: Overview of costs and impacts of the Future Directions package: A report to the Minister of Finance and Revenue and the Minister for Social Development and Employment (1 March 2004 version), Ministry of Social Development New Zealand, Wellington. MSD (2004c) Working for Families Factsheet 2: Increasing family incomes & making work pay, Ministry of Social Development, Wellington.

94
MSD (2005a) Intervention logic and assumptions: Working for Families, Ministry of Social Development, Wellington. MSD (2005b) Working for Families package monitoring framework (February 2005 version), Ministry of Social Development, Wellington. MSD (2005c) Family Assistance Index (February 2005 version), Ministry of Social Development, Wellington. Mullarkey S, T D Wall, P B Warr, C W Clegg and C B Stride (1999) Measures of job satisfaction, mental health and job-related well-being, Institute of Work Psychology, Sheffield. National Audit Office (2002) Tackling pensioner poverty: Encouraging take-up of entitlements, report by the Comptroller and Auditor General, HC 37 Session 2002–2003, HM Stationery Office, London. http://www.nao.org.uk/publications/nao_reports/02-03/020337es.pdf Oppenheim A N (1966) Questionnaire Design and Attitude Measurement, Heinemann, London. Osgood J, V Stone, A Thomas, S Dempsey, G Jones and R Solon (2003) ONE evaluation: Summary of service delivery findings, In-House Report 108, Department for Work and Pensions, UK. http://www.dwp.gov.uk/asd/asd5/IH108.pdf Perry B (2002) ”The mismatch between income measures and direct outcome measures of poverty”, Social Policy Journal of New Zealand, 19: 101–127. Perry B (2004) ”Working for Families: The impact on child poverty”, Social Policy Journal of New Zealand, 22: 19–54. Phillips M, K Pickering, C Lessof, S Purdon and J Hales (2003) Evaluation of the New Deal for Lone Parents: technical report for the quantitative survey, Department for Work and Pensions, London. Piachaud D and H Sutherland (2000) How effective is the British government’s attempt to reduce child poverty? Casepaper 38, Centre for Analysis of Social Exclusion, London. Piachaud D and H Sutherland (2003) Changing poverty post-1997, Casepaper 64, Centre for Analysis of Social Exclusion, London. Pudney S E, R M Hancock and H Sutherland (2004) Simulating the reform of means-tested benefits with endogenous take-up and claim costs, Working Paper 2004–4, ISER (Institute for Social and Economic Research), Colchester. http://www.iser.essex.ac.uk/pubs/workpaps/pdf/2004-04.pdf. Puhani P (2000) ”The Heckman correction for sample selection and its critique: A short survey”, Journal of Economic Surveys, 14: 53–68.

95
Razavi T (2001) Self-report measures: An overview of concerns and limitations of questionnaire use in occupational stress research, Discussion Paper 01/175, University of Southampton, Accounting and Management Science Papers. http://www.management.soton.ac.uk/research/publications/documents/01-175.pdf Riccio J and H Bloom (2002) ”Extending the reach of randomized social experiments: New directions in evaluations of american welfare-to-work and employment initiatives”, Journal of the Royal Statistical Society: Series A (Statistics in Society), 165:13–30. Riccio J and A Orenstein (1996) ”Understanding best practices for operating welfare-to-work programs”, Evaluation Review, 20: 3–28. Ridge T (2002) Child Poverty and Social Exclusion, Policy Press, Bristol. Ritchie J and A Mathews (1982) Take up of rent allowances: An in depth study, Social and Community Research, London. Rolfe H, A Bryson and H Metcalf (1996) The effectiveness of TECs in achieving jobs and qualifications for disadvantaged groups, Department for Education and Employment Research Study RS4, HMSO, London. Rosenbaum P R and D B Rubin (1983) ”The central role of the propensity score in observational studies for causal effects”, Biometrica, 70: 41–50. Sandfort J, K Seefeldt and S Danziger (1998) Exploring the effect of welfare reform implementation on the attainment of policy goals: An examination of Michigan’s Counties, paper presented at the annual research conference of the Association for Public Policy Analysis and Management (APPAM), New York. Sefton T and H Sutherland (2005) ”Inequality and poverty under New Labour”, in J Hills and K Stewart (eds.) A More Equal Society: New Labour, Poverty, Inequality and Social Exclusion, Policy Press, Bristol. Sianesi B (2001) An evaluation of the active labour market programmes in Sweden, Working Paper 2000:5, Office of Labour Market Policy Evaluation (IFAU), Uppsala, Sweden. Smith J (2000) ”A critical survey of empirical methods for evaluating active labor market policies”, Schweizerische Zeitschrift für Volkswirtschaft und Statistik, 136: 1–22. Smith J and P Todd (2000) Does matching overcome LaLonde’s critique of non-experimental estimators? mimeo, University of Western Ontario, Canada. Smith J and P Todd (2003) Does matching overcome LaLonde’s critique of nonexperimental estimators? CIBC Working Paper 2003/5, Department of Economics, Social Science Centre, University of Western Ontario. http://www.ssc.uwo.ca/economics/centres/cibc/wp2003/Smith05.pdf Smith J and P Todd (2005) ”Does matching overcome LaLonde’s critique of nonexperimental methods?”, Journal of Econometrics, 125: 305–353.

96
Statistics New Zealand (2005) Labour Market Statistics 2004, Statistics New Zealand, Wellington. Struyven L (2004) Design choices in market competition for employment services for the long-term unemployed, Social, Employment and Migration Working Paper 21, OECD, Paris. http://www.oecd.org/dataoecd/52/48/34053187.pdf. Sutherland H, T Sefton and D Piachaud (2003) Poverty in Britain: The Impact of Government Policy since 1997, Joseph Rowntree Foundation, York. van Oorschot W (1991) ”Non-take-up of social security benefits in Europe”, Journal of European Social Policy, 1: 15–30. Vandivere S, M Zaslow, J Brooks and Z Redd (2004) Do child characteristics affect how children fare in families receiving and leaving welfare? Assessing the New Federalism Discussion Paper 04-04, Urban Institute, Washington DC Vegeris S and J Perry (2003) Families and Children 2001: Living Standards and the Children, Department for Work and Pensions Research Report 190, Corporate Document Services, Leeds. http://www.dwp.gov.uk/asd/asd5/rrep190.asp. Warr P B (1987) Work, Unemployment and Mental Health, Oxford University Press, Oxford. White M (2004) Effective job search practices in the United Kingdom’s mandatory welfare-to-work programme for youth, Policy Studies Institute, Discussion Paper 17.

97
Appendix 1 Figures
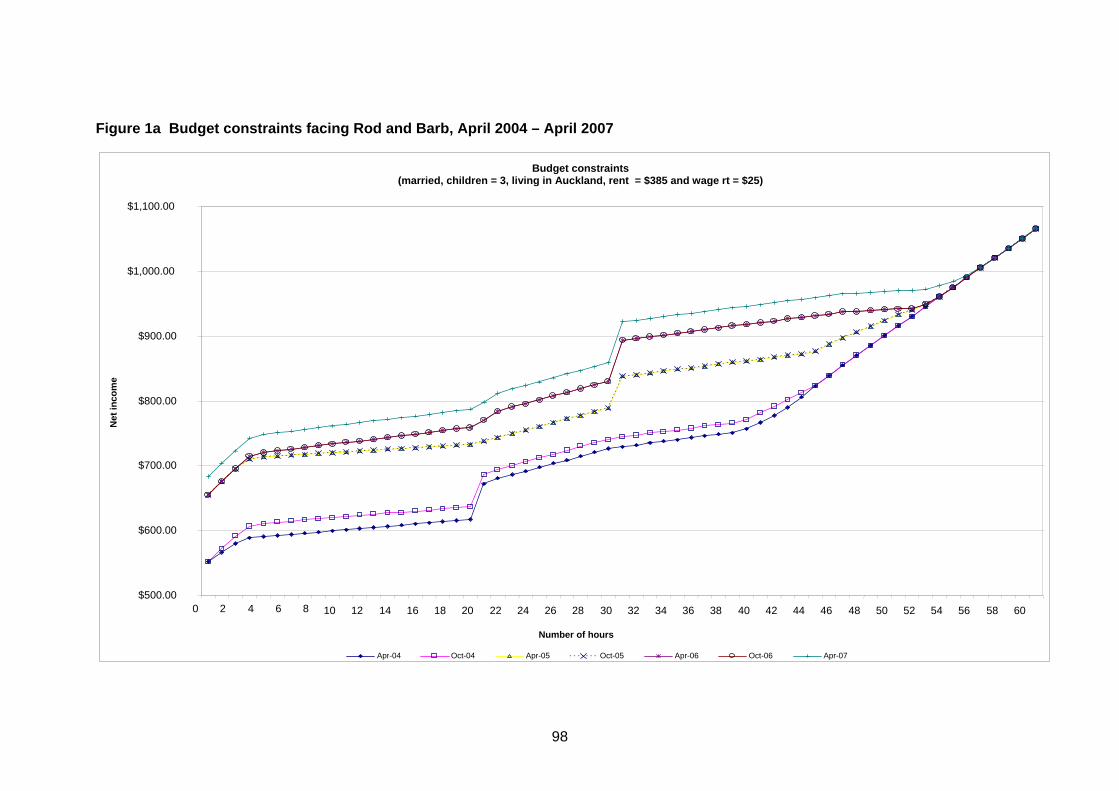
98
Figure 1a Budget constraints facing Rod and Barb, April 2004 – April 2007
$500.00
$600.00
$700.00
$800.00
$900.00
$1,000.00
$1,100.00
0 2 4 6 8 10 12 14 16 18 20 22 24 26 28 30 32 34 36 38 40 42 44 46 48 50 52 54 56 58 60
Number of hours
Net
inco
me
Apr-04 Oct-04 Apr-05 Oct-05 Apr-06 Oct-06 Apr-07
Budget constraints (married, children = 3, living in Auckland, rent = $385 and wage rt = $25)
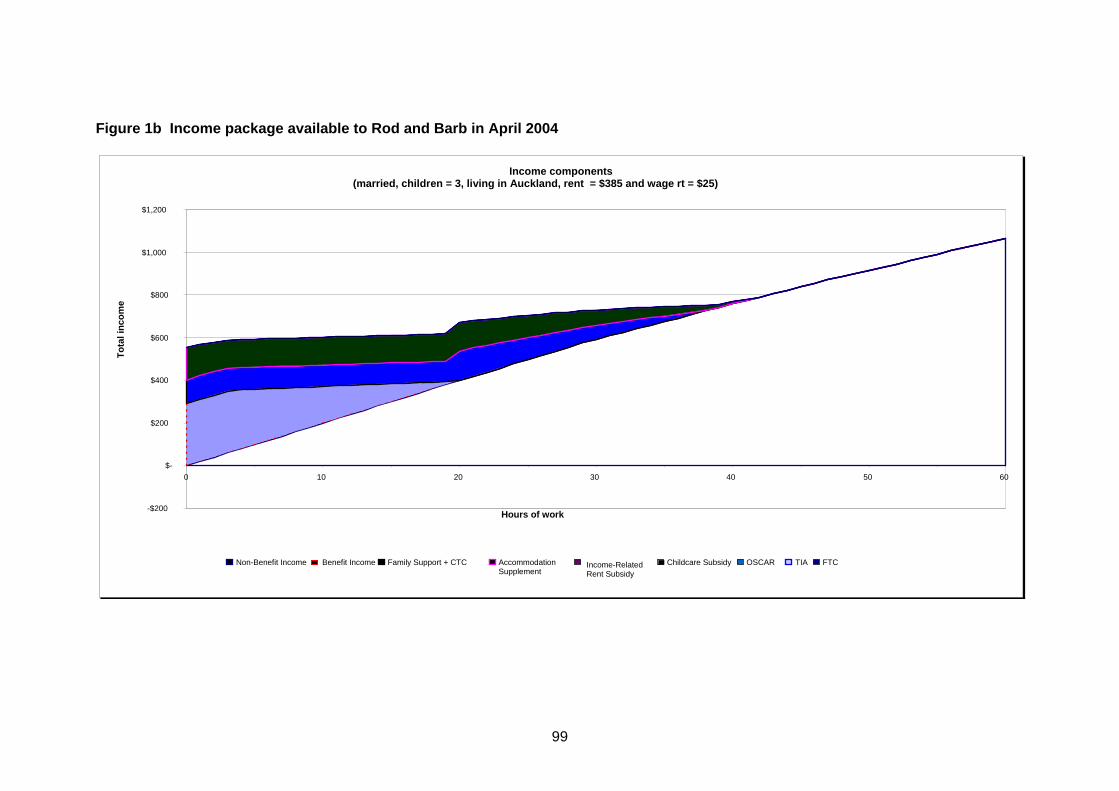
99
Figure 1b Income package available to Rod and Barb in April 2004
Income components (married, children = 3, living in Auckland, rent = $385 and wage rt = $25)
-$200
$-
$200
$400
$600
$800
$1,000
$1,200
0 10 20 30 40 50 60
Hours of work
Tot
al in
com
e
Non-Benefit Income Benefit Income Family Support + CTC Accommodation Supplement Income-Related
Rent Subsidy Childcare Subsidy OSCAR TIA FTC
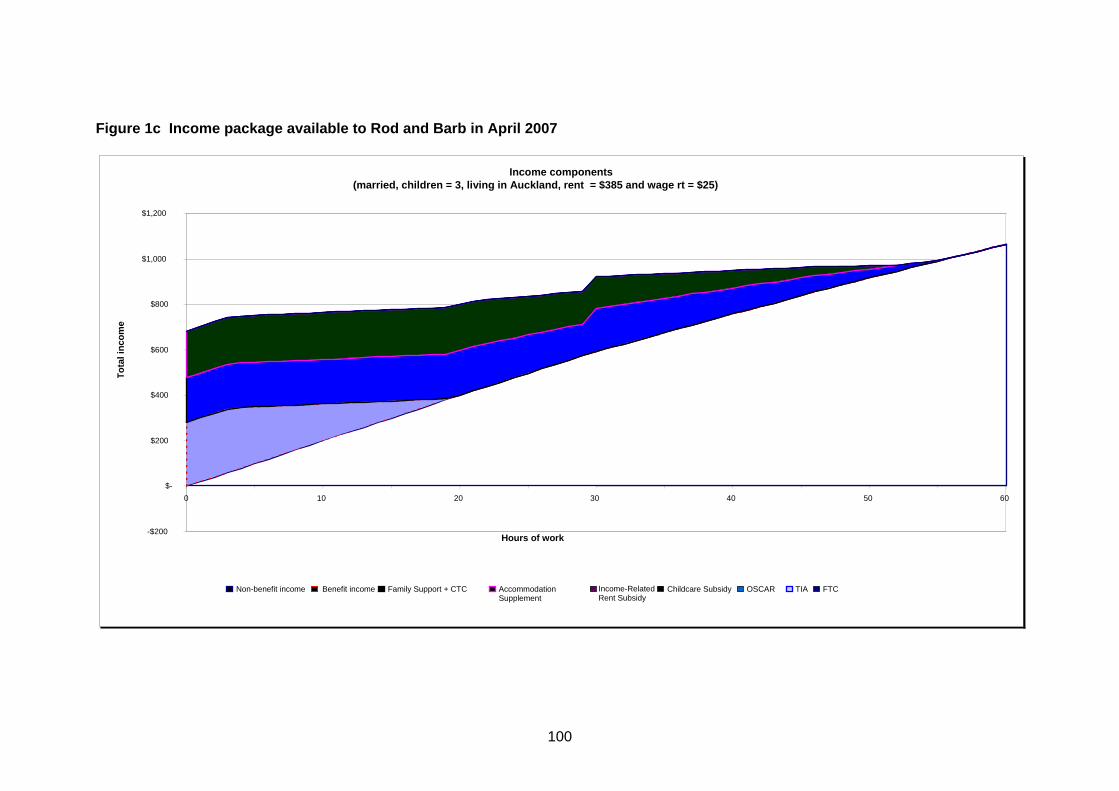
100
Figure 1c Income package available to Rod and Barb in April 2007
Income components (married, children = 3, living in Auckland, rent = $385 and wage rt = $25)
-$200
$-
$200
$400
$600
$800
$1,000
$1,200
0 10 20 30 40 50 60
Hours of work
Tot
al in
com
e
Non-benefit income Benefit income Family Support + CTC Accommodation Supplement
Income-Related Rent Subsidy
Childcare Subsidy OSCAR TIA FTC

101
Figure 2a Budget constraints facing Rob and Aroha, April 2004 – April 2007
Budget constrainta (married, children = 2, living in Wairoa, rent = $ 120 and wage rt = $12)
$400.00
$450.00
$500.00
$550.00
$600.00
$650.00
$700.00
$750.00
$800.00
$850.00
$900.00
0 2 4 6 8 10 12 14 16 18 20 22 24 26 28 30 32 34 36 38 40 42 44 46 48 50 52 54 56 58 60 Number of hours
Net
inco
me
Apr-04 Oct-04 Apr-05 Oct-05 Apr-06 Oct-06 Apr-07
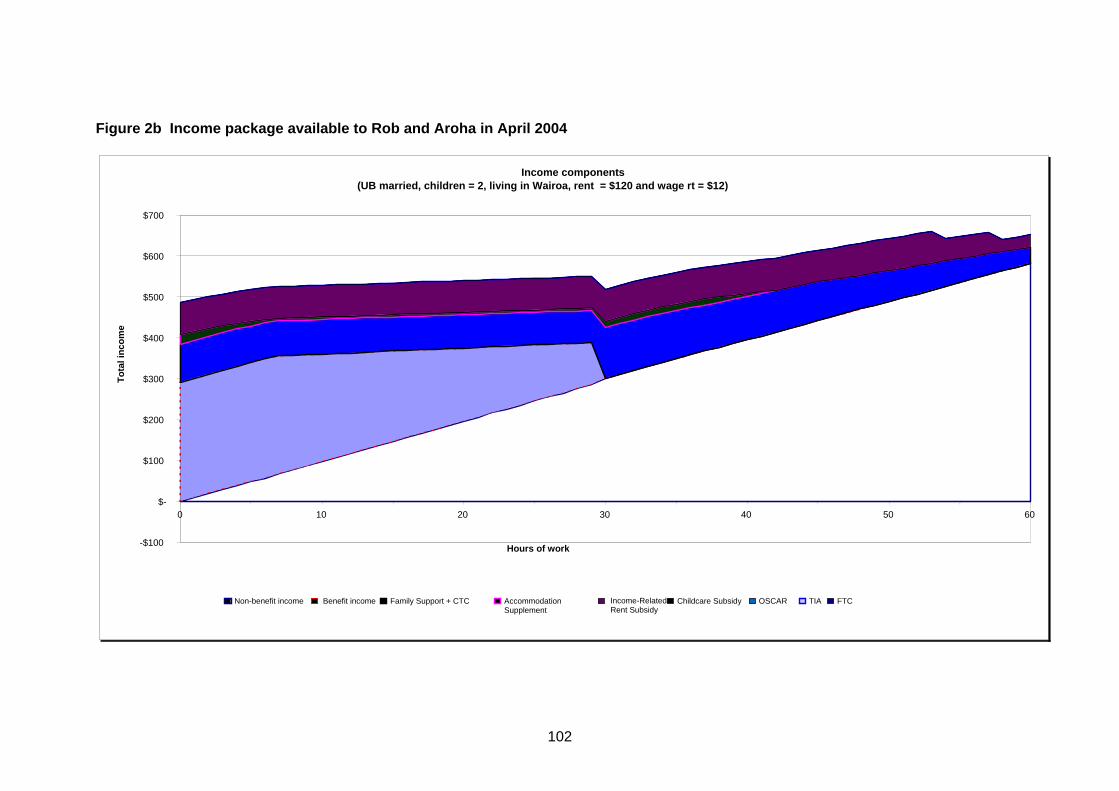
102
Figure 2b Income package available to Rob and Aroh a in April 2004
Income comp onents (UB married, children = 2, living in Wairoa, rent = $120 and wage rt = $12)
-$100
$-
$100
$200
$300
$400
$500
$600
$700
0 10 20 30 40 50 60
Hours of work
Tot
al in
com
e
Non-benefit income Benefit income Family Support + CTC Accommodation Supplement
Income-Related Rent Subsidy
Childcare Subsidy OSCAR TIA FTC
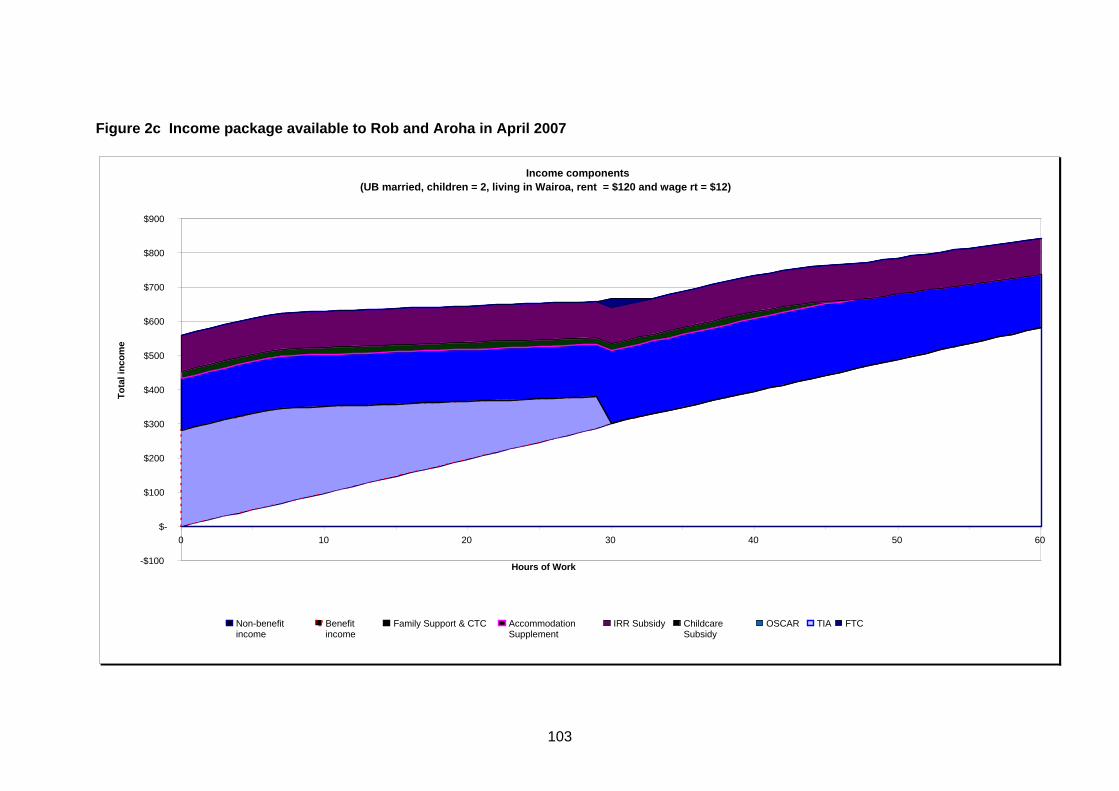
103
Figure 2c Income package available to Rob and Aroh a in April 2007
Income components (UB married, children = 2, living in Wairoa, rent = $120 and wage rt = $12)
-$100
$-
$100
$200
$300
$400
$500
$600
$700
$800
$900
0 10 20 30 40 50 60
Hours of Work
Tot
al in
com
e
Non-benefit income
Benefit income
Family Support & CTC Accommodation Supplement
IRR Subsidy Childcare Subsidy
OSCAR TIA FTC
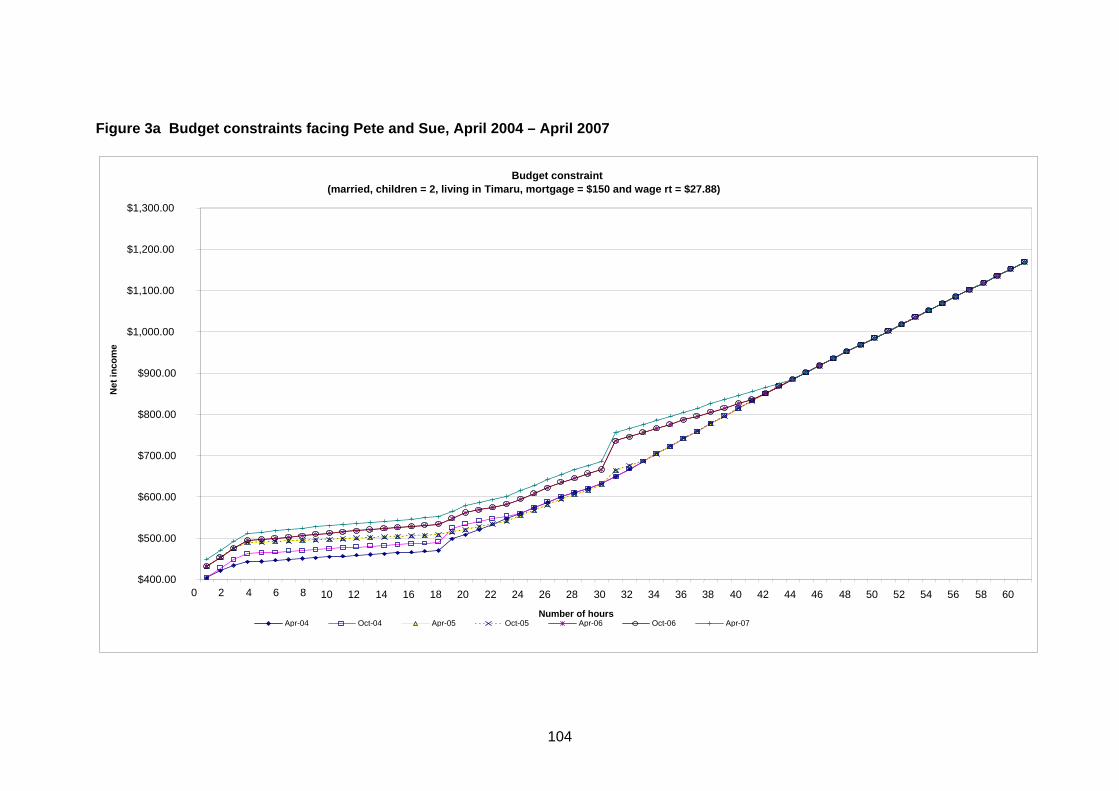
104
Figure 3a Budget constraints facing Pete and Sue, April 2004 – April 2007
Budget constraint (married, children = 2, living in Timaru, mortgage = $150 and wage rt = $27.88)
$400.00
$500.00
$600.00
$700.00
$800.00
$900.00
$1,000.00
$1,100.00
$1,200.00
$1,300.00
0 2 4 6 8 10 12 14 16 18 20 22 24 26 28 30 32 34 36 38 40 42 44 46 48 50 52 54 56 58 60 Number of hours
Net
inco
me
Apr-04 Oct-04 Apr-05 Oct-05 Apr-06 Oct-06 Apr-07
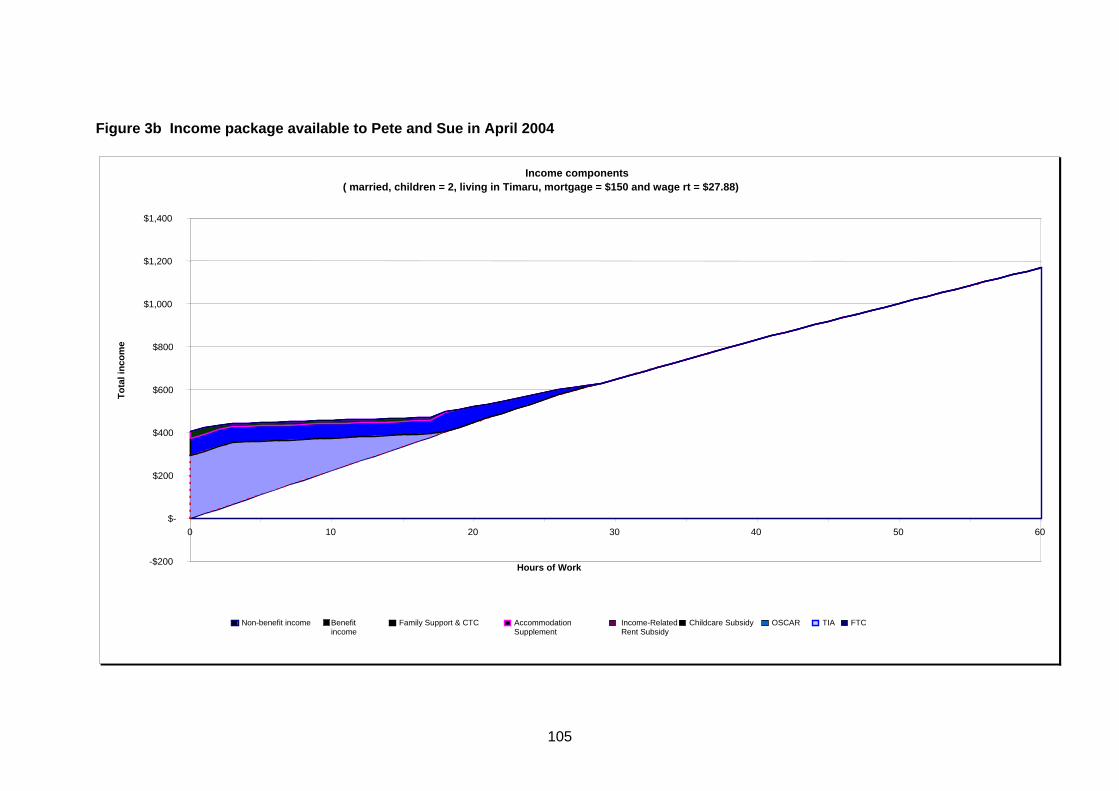
105
Figure 3b Income package available to Pete and Sue in April 2004
Income components ( married, children = 2, living in Timaru, mortgage = $150 and wage rt = $27.88)
-$200
$-
$200
$400
$600
$800
$1,000
$1,200
$1,400
0 10 20 30 40 50 60
Hours of Work
Tot
al in
com
e
Non-benefit income Benefit income
Family Support & CTC Accommodation Supplement
Income-Related Rent Subsidy
Childcare Subsidy OSCAR TIA FTC
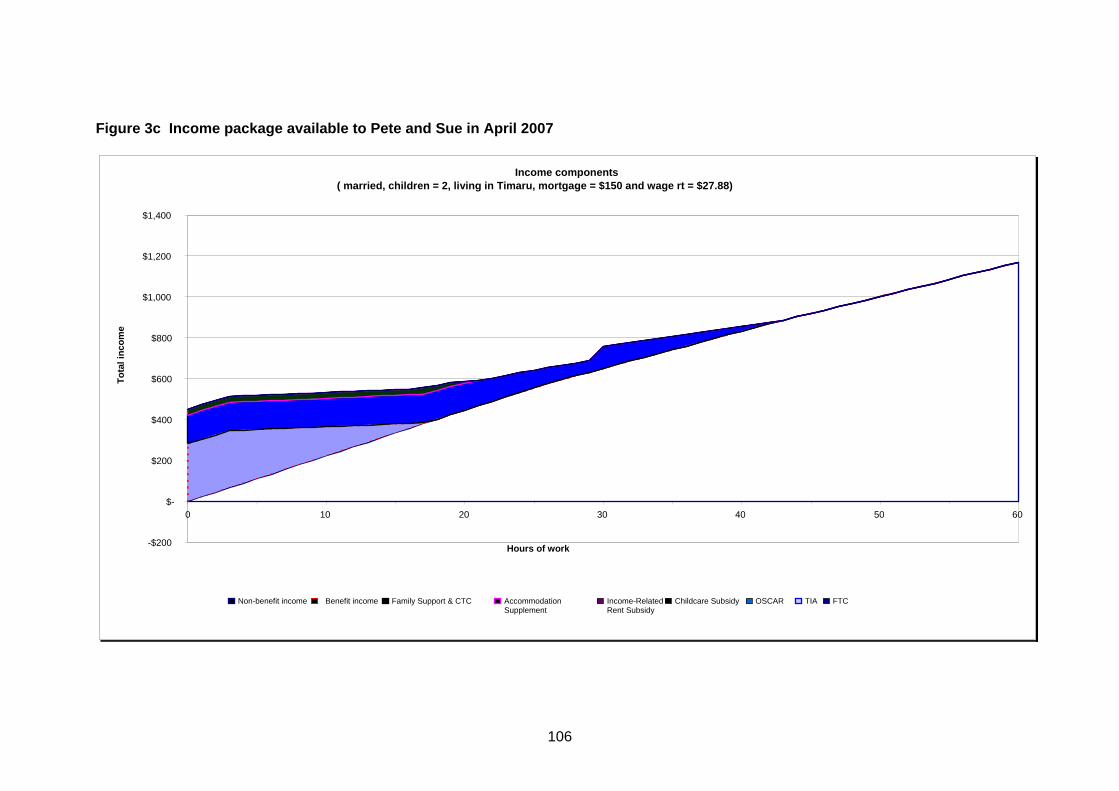
106
Figure 3c Income package available to Pete and Sue in April 2007
Income components ( married, children = 2, living in Timaru, mortgage = $150 and wage rt = $27.88)
-$200
$-
$200
$400
$600
$800
$1,000
$1,200
$1,400
0 10 20 30 40 50 60
Hours of work
Tot
al in
com
e
Non-benefit income Benefit income Family Support & CTC Accommodation Supplement
Income-Related Rent Subsidy
Childcare Subsidy OSCAR TIA FTC
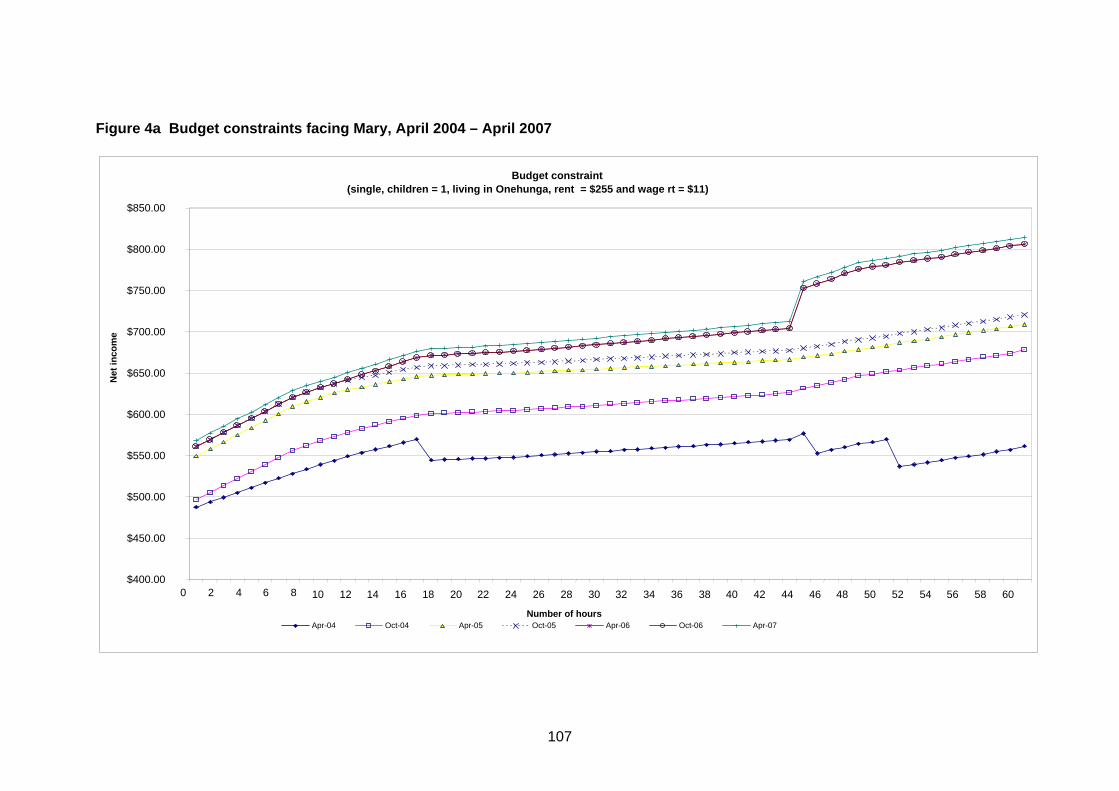
107
Figure 4a Budget constraints facing Mary, April 20 04 – April 2007
Budget constraint (single, children = 1, living in Onehunga, rent = $255 and wage rt = $11)
$400.00
$450.00
$500.00
$550.00
$600.00
$650.00
$700.00
$750.00
$800.00
$850.00
0 2 4 6 8 10 12 14 16 18 20 22 24 26 28 30 32 34 36 38 40 42 44 46 48 50 52 54 56 58 60 Number of hours
Net
inco
me
Apr-04 Oct-04 Apr-05 Oct-05 Apr-06 Oct-06 Apr-07
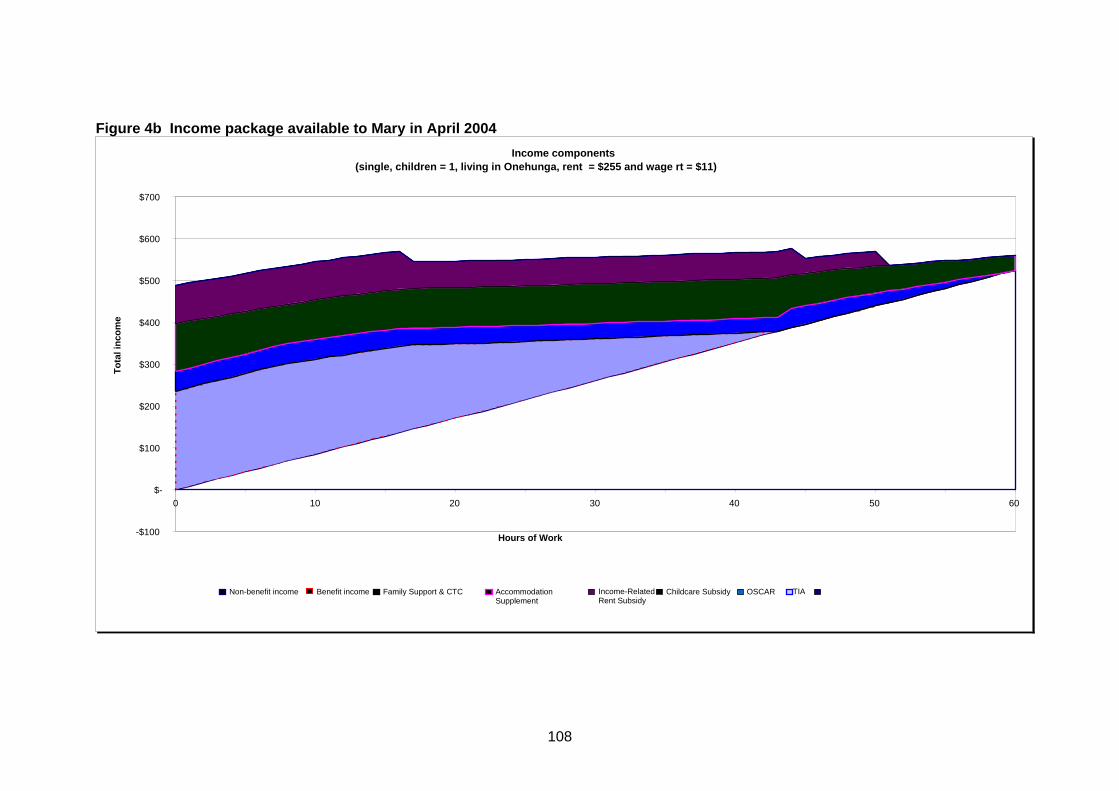
108
Figure 4b Income package available to Mary in Apri l 2004
Income components (single, children = 1, living in Onehunga, rent = $255 and wage rt = $11)
-$100
$-
$100
$200
$300
$400
$500
$600
$700
0 10 20 30 40 50 60
Hours of Work
Tot
al in
com
e
Non-benefit income Benefit income Family Support & CTC Accommodation Supplement
Income-Related Rent Subsidy
Childcare Subsidy OSCAR TIA
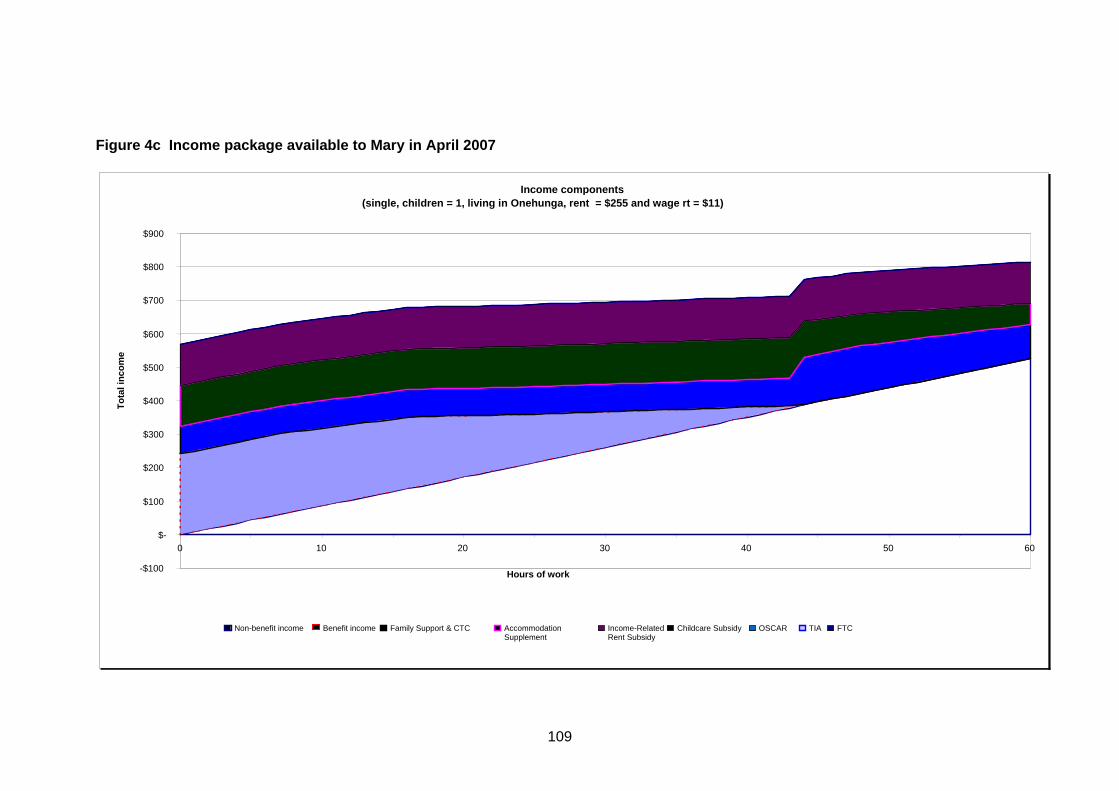
109
Figure 4c Income package available to Mary in Apri l 2007
Income components (single, children = 1, living in Onehunga, rent = $255 and wage rt = $11)
-$100
$-
$100
$200
$300
$400
$500
$600
$700
$800
$900
0 10 20 30 40 50 60
Hours of work
Tot
al in
com
e
Non-benefit income Benefit income Family Support & CTC Accommodation Supplement
Income-Related Rent Subsidy
Childcare Subsidy OSCAR TIA FTC