research & development department ref: … · nace standard rp0775-2005 outlines procedures for...
TRANSCRIPT
RESEARCH & DEVELOPMENT DEPARTMENT
Ref: R&D/24A/511/2014 Date: 13/10/2014
General Manager (PLS)
Attn: Shri P. J. Sarma, CEPL (PLM)
Sub : Results of Corrosion Monitoring in NSPL for the year 2013-14
Ref : Your letter no. PL-PLM/NSPL/08-14/366 of 07/08/2014
Please find attached herewith R&D Report No. 83 on the results of corrosion monitoring in NSPL
through weight loss coupons retrieved during 31st July – 6th August 2014 and sent to R&D
Department for analysis and interpretation. This report summarizes the results of R&D in-house
studies as well as microscopic analysis of pits outsourced to a metallurgical lab. The report
includes both general corrosion rates as well as maximum pitting rates as observed in all the six
coupons. The general corrosion rates are found to be low at all the six locations, however, pitting
corrosion have been observed on both sides (flush and non-flush) as well as on the
circumference of the coupons in all the six locations. Pitting corrosion on the non-flush sides of
the coupons, indicates scaling and under deposit corrosion on the non-flush sides. While the
maximum pitting rates on the flush sides of all the coupons is low; the same is found to be on the
higher side on the non-flush sides of coupons ranging from 9 – 11 mpy at three locations IPS-3,
IPS-4 and RT. Microbiological analysis did not show evidence of SRB or APB; however, proper
sampling is advisable during next field visits to monitor biological activities. The sludge from
scraper barrels shows presence of corrosion products. Evidence of external corrosion was also
observed on the scraper barrels at Loc. IPS-3 under PS-6 (Bongaigaon).
(M. C. Nihalani)
General Manager - R&D (I/c)
Encl: As above
Copy: Director (O) / RCE / ED (E&D) / ED (Prod)
Files 79B, 12X1
R&D Report No. 83
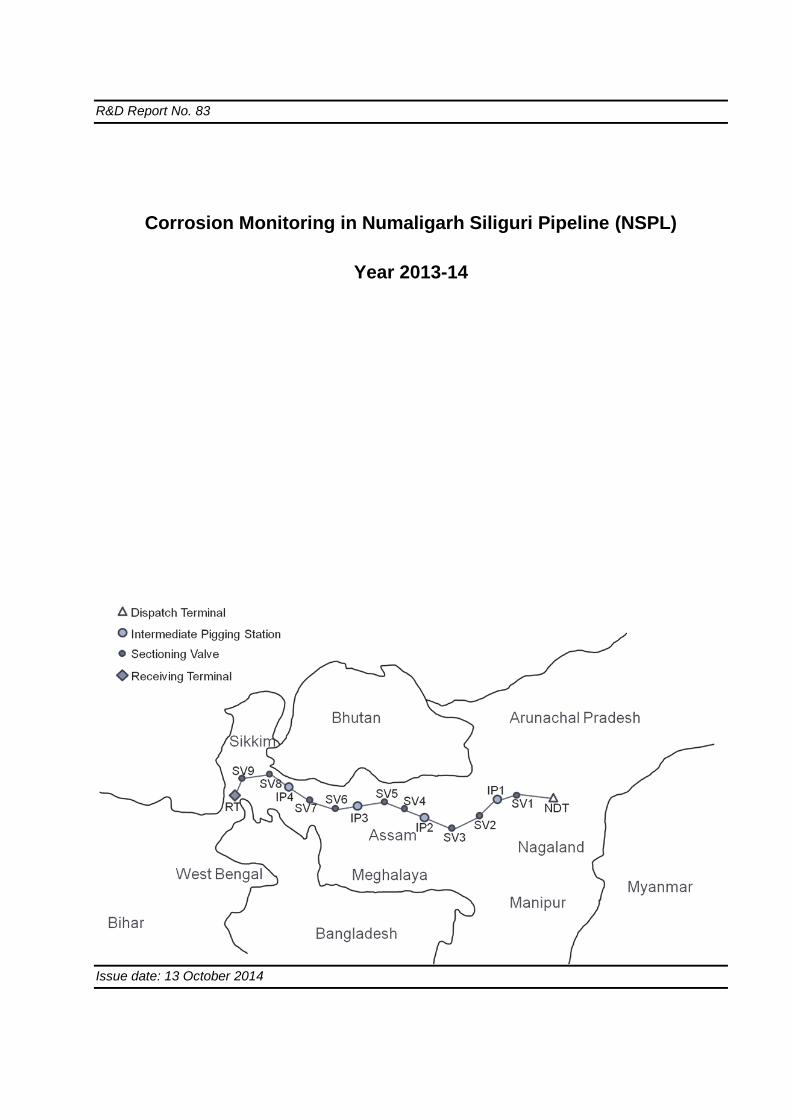
Corrosion Monitoring in Numaligarh Siliguri Pipeline (NSPL)
Year 2013-14
Issue date: 13 October 2014

1. Introduction
Carbon steel corrosion coupons bearing serial numbers XT402, XT403, XT404, XT407,
XT405 and XT406 were installed at locations NDT (Numaligarh Despatch Terminal), IPS-1
(Sekoni), IPS-2 (PHQ Guwahati), IPS-3 (Bongaigoan), IPS-4 (Madarihat) and Rangapani
Terminal (RT) in Siliguri respectively, between 6th August – 5th September 2013. These
coupons were exposed in the multi-product NSPL for a duration ranging 333 – 362 days, after
which these were retrieved by a joint team from PLM Section of PL and R&D Departments.
The retrieved coupons were sent to R&D Department for analysis and interpretation. This
report presents calculated general corrosion rates and maximum pitting rates using weight
loss coupons; analysis of sludge sample from scraper barrels and discussion thereof.
2. Materials and method
NACE Standard RP0775-2005 outlines procedures for preparing, installing and analyzing
metallic corrosion coupons to monitor mass-loss and pitting corrosion in oilfield operations.
Received coupons were cleaned and weighed as per the NACE standard recommended
practice.
a. Average Corrosion Rate
The average corrosion rate is calculated as uniform rate of thickness loss per unit time
in mils per year (mpy).
b. Maximum Pitting Corrosion Rate
The Maximum Pitting Rate is calculated using the depth of deepest pit and dividing it
by the exposure time. The depth of deepest pit is measured using stereo microscope
calibrated for depth measurement. Optical microscopic analysis was outsourced for
this study to a metallurgical lab in Vadodara and is attached as Annexure-I. The
results of the optical analysis are used for calculating maximum pitting rates for each
side of the coupons. For the sake of identification, the two sides of the coupon are
designated as flush-side (facing the pipeline fluids) and non-flush side (side facing the
wall of the pipeline)
3. Results
The general corrosion rates and pitting corrosion rates are tabulated in Table 1a and 1b.
Fig. 1 a) Flush Side of the Coupon Fig. 1 b) Non-Flush Side of the Coupon
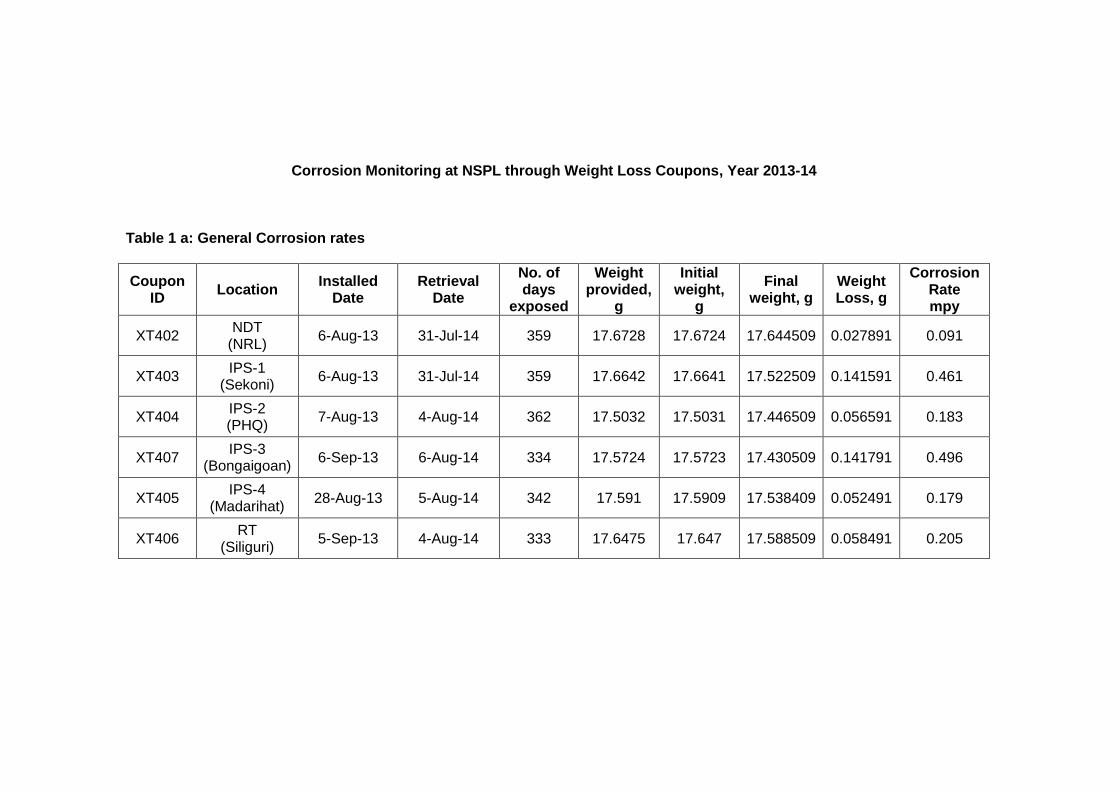
Corrosion Monitoring at NSPL through Weight Loss Coupons, Year 2013-14 Table 1 a: General Corrosion rates
Coupon ID
Location Installed
Date Retrieval
Date
No. of days
exposed
Weight provided,
g
Initial weight,
g
Final weight, g
Weight Loss, g
Corrosion Rate mpy
XT402 NDT
(NRL) 6-Aug-13 31-Jul-14 359 17.6728 17.6724 17.644509 0.027891 0.091
XT403 IPS-1
(Sekoni) 6-Aug-13 31-Jul-14 359 17.6642 17.6641 17.522509 0.141591 0.461
XT404 IPS-2 (PHQ)
7-Aug-13 4-Aug-14 362 17.5032 17.5031 17.446509 0.056591 0.183
XT407 IPS-3
(Bongaigoan) 6-Sep-13 6-Aug-14 334 17.5724 17.5723 17.430509 0.141791 0.496
XT405 IPS-4
(Madarihat) 28-Aug-13 5-Aug-14 342 17.591 17.5909 17.538409 0.052491 0.179
XT406 RT
(Siliguri) 5-Sep-13 4-Aug-14 333 17.6475 17.647 17.588509 0.058491 0.205
Corrosion Monitoring at NSPL through Weight Loss Coupons, Year 2013-14
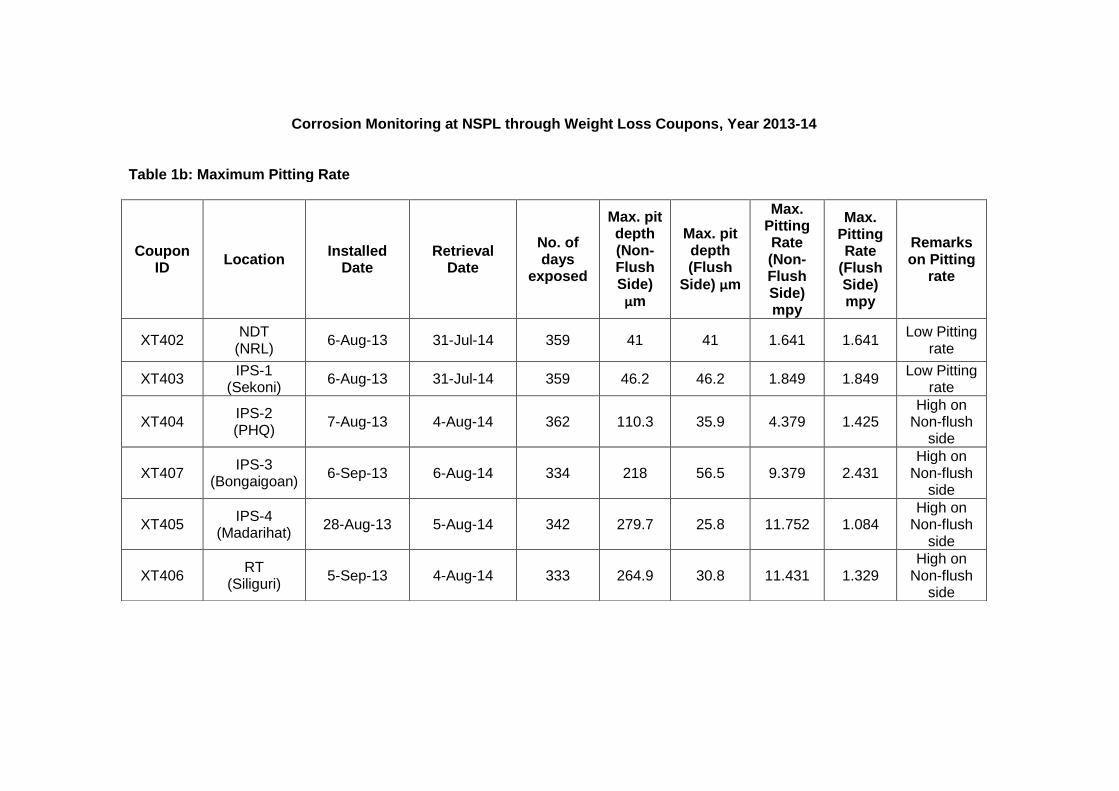
Table 1b: Maximum Pitting Rate
Coupon ID
Location Installed
Date Retrieval
Date
No. of days
exposed
Max. pit depth (Non-Flush Side) µm
Max. pit depth (Flush
Side) µm
Max. Pitting Rate (Non-Flush Side) mpy
Max. Pitting Rate
(Flush Side) mpy
Remarks on Pitting
rate
XT402 NDT
(NRL) 6-Aug-13 31-Jul-14 359 41 41 1.641 1.641
Low Pitting rate
XT403 IPS-1
(Sekoni) 6-Aug-13 31-Jul-14 359 46.2 46.2 1.849 1.849
Low Pitting rate
XT404 IPS-2 (PHQ)
7-Aug-13 4-Aug-14 362 110.3 35.9 4.379 1.425 High on
Non-flush side
XT407 IPS-3
(Bongaigoan) 6-Sep-13 6-Aug-14 334 218 56.5 9.379 2.431
High on Non-flush
side
XT405 IPS-4
(Madarihat) 28-Aug-13 5-Aug-14 342 279.7 25.8 11.752 1.084
High on Non-flush
side
XT406 RT
(Siliguri) 5-Sep-13 4-Aug-14 333 264.9 30.8 11.431 1.329
High on Non-flush
side

Fig 2: Exposed Corrosion Coupon XT- 406, Loc. RT before and after cleaning
Fig 3: Optical Microscopic image of XT- 406, Loc. RT showing pits
a) Before Cleaning b) After Cleaning
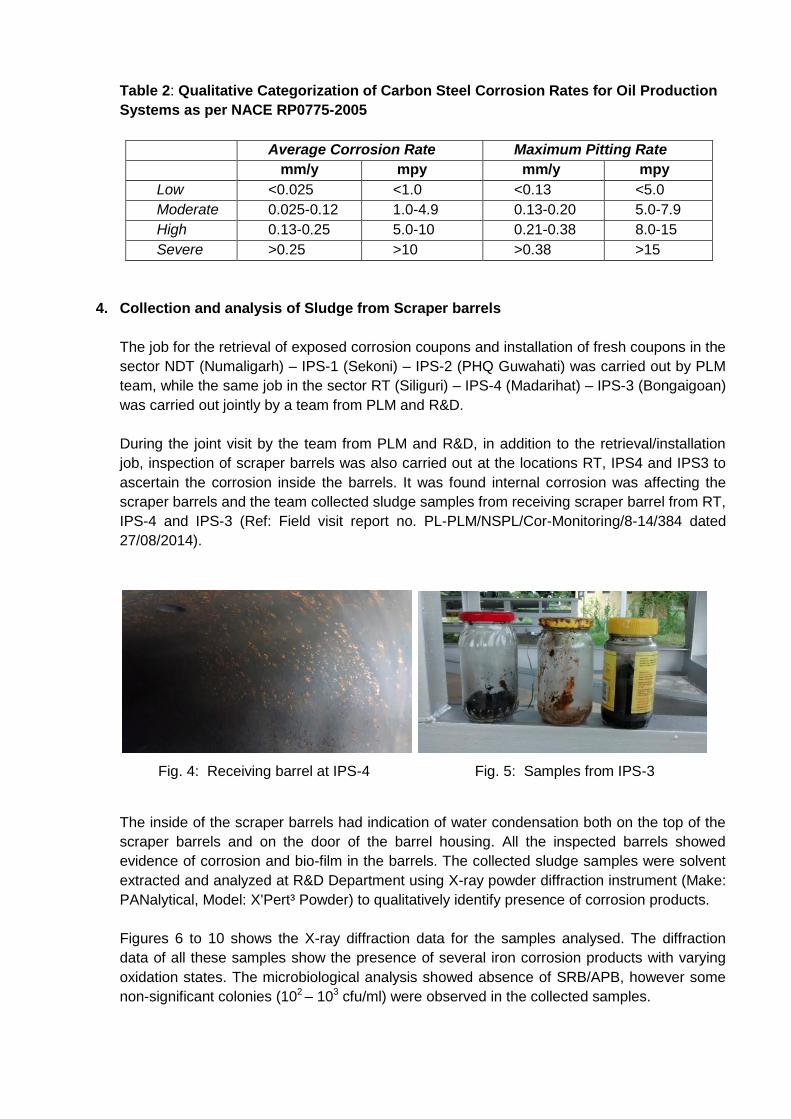
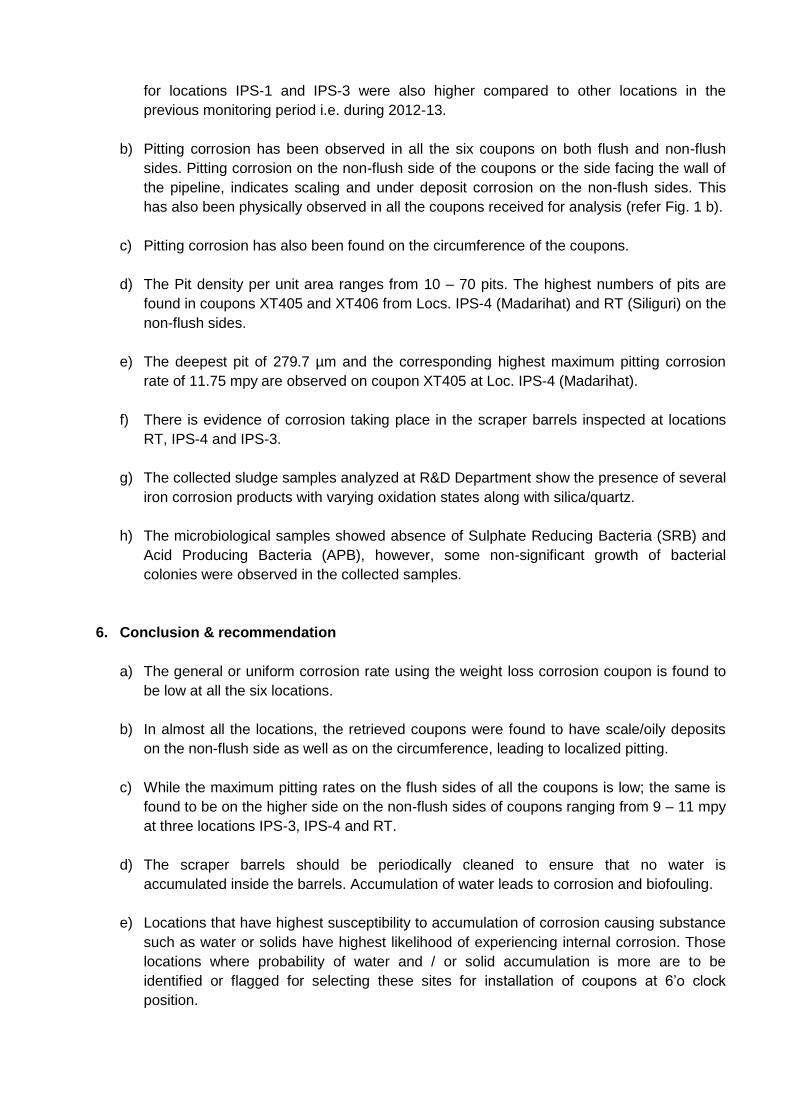
Table 2: Qualitative Categorization of Carbon Steel Corrosion Rates for Oil Production
Systems as per NACE RP0775-2005
Average Corrosion Rate Maximum Pitting Rate
mm/y mpy mm/y mpy
Low <0.025 <1.0 <0.13 <5.0
Moderate 0.025-0.12 1.0-4.9 0.13-0.20 5.0-7.9
High 0.13-0.25 5.0-10 0.21-0.38 8.0-15
Severe >0.25 >10 >0.38 >15
4. Collection and analysis of Sludge from Scraper barrels
The job for the retrieval of exposed corrosion coupons and installation of fresh coupons in the
sector NDT (Numaligarh) – IPS-1 (Sekoni) – IPS-2 (PHQ Guwahati) was carried out by PLM
team, while the same job in the sector RT (Siliguri) – IPS-4 (Madarihat) – IPS-3 (Bongaigoan)
was carried out jointly by a team from PLM and R&D.
During the joint visit by the team from PLM and R&D, in addition to the retrieval/installation
job, inspection of scraper barrels was also carried out at the locations RT, IPS4 and IPS3 to
ascertain the corrosion inside the barrels. It was found internal corrosion was affecting the
scraper barrels and the team collected sludge samples from receiving scraper barrel from RT,
IPS-4 and IPS-3 (Ref: Field visit report no. PL-PLM/NSPL/Cor-Monitoring/8-14/384 dated
27/08/2014).
The inside of the scraper barrels had indication of water condensation both on the top of the
scraper barrels and on the door of the barrel housing. All the inspected barrels showed
evidence of corrosion and bio-film in the barrels. The collected sludge samples were solvent
extracted and analyzed at R&D Department using X-ray powder diffraction instrument (Make:
PANalytical, Model: X'Pert³ Powder) to qualitatively identify presence of corrosion products.
Figures 6 to 10 shows the X-ray diffraction data for the samples analysed. The diffraction
data of all these samples show the presence of several iron corrosion products with varying
oxidation states. The microbiological analysis showed absence of SRB/APB, however some
non-significant colonies (102 – 103 cfu/ml) were observed in the collected samples.
Fig. 4: Receiving barrel at IPS-4 Fig. 5: Samples from IPS-3
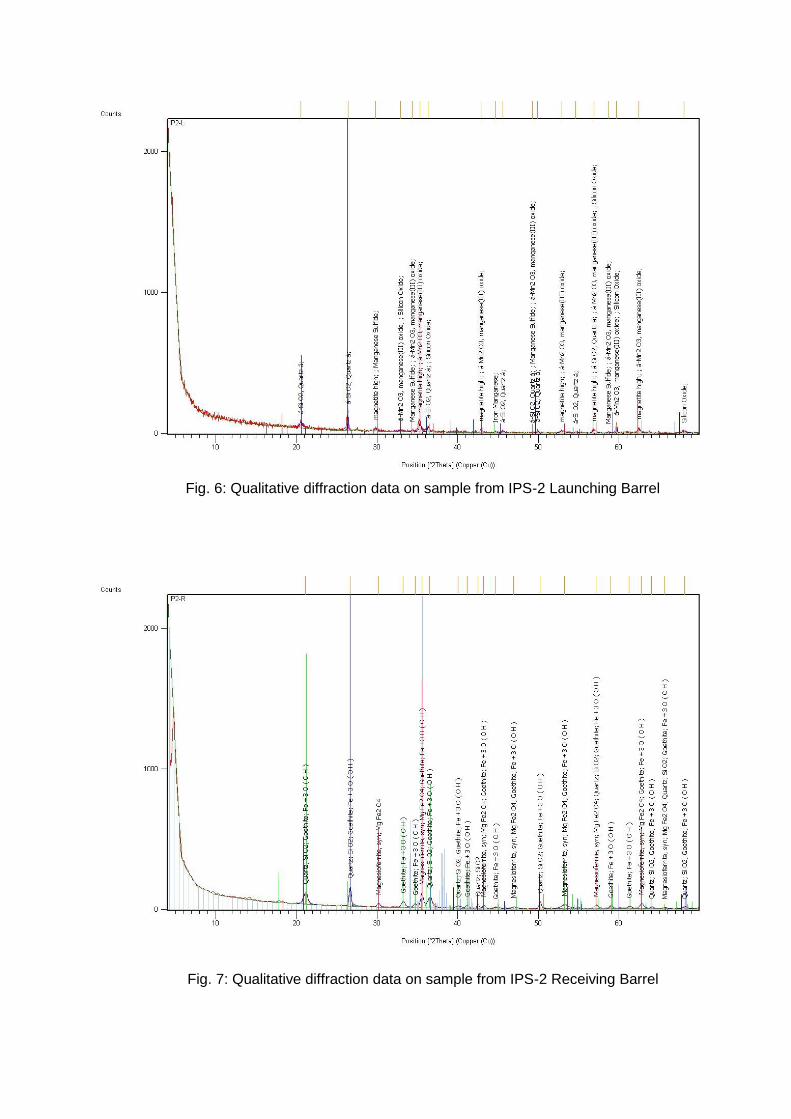
Fig. 6: Qualitative diffraction data on sample from IPS-2 Launching Barrel
Fig. 7: Qualitative diffraction data on sample from IPS-2 Receiving Barrel

Fig. 8: Qualitative diffraction data on sample from IPS-3 Receiving Barrel
Fig. 9: Qualitative diffraction data on sample from IPS-4 Receiving Barrel

Fig. 10: Qualitative diffraction data on sample from RT Receiving Barrel
Fig. 11: Microbiological tests on the sludge from Scraper Barrels
5. Discussion
a) The general corrosion rates for all the six coupons from the six different locations can be
categorized as low. However, the observed corrosion rates are relatively higher for
locations IPS-1 and IPS-3 compared to the other locations. The observed corrosion rates
for locations IPS-1 and IPS-3 were also higher compared to other locations in the
previous monitoring period i.e. during 2012-13.
b) Pitting corrosion has been observed in all the six coupons on both flush and non-flush
sides. Pitting corrosion on the non-flush side of the coupons or the side facing the wall of
the pipeline, indicates scaling and under deposit corrosion on the non-flush sides. This
has also been physically observed in all the coupons received for analysis (refer Fig. 1 b).
c) Pitting corrosion has also been found on the circumference of the coupons.
d) The Pit density per unit area ranges from 10 – 70 pits. The highest numbers of pits are
found in coupons XT405 and XT406 from Locs. IPS-4 (Madarihat) and RT (Siliguri) on the
non-flush sides.
e) The deepest pit of 279.7 µm and the corresponding highest maximum pitting corrosion
rate of 11.75 mpy are observed on coupon XT405 at Loc. IPS-4 (Madarihat).
f) There is evidence of corrosion taking place in the scraper barrels inspected at locations
RT, IPS-4 and IPS-3.
g) The collected sludge samples analyzed at R&D Department show the presence of several
iron corrosion products with varying oxidation states along with silica/quartz.
h) The microbiological samples showed absence of Sulphate Reducing Bacteria (SRB) and
Acid Producing Bacteria (APB), however, some non-significant growth of bacterial
colonies were observed in the collected samples.
6. Conclusion & recommendation
a) The general or uniform corrosion rate using the weight loss corrosion coupon is found to
be low at all the six locations.
b) In almost all the locations, the retrieved coupons were found to have scale/oily deposits
on the non-flush side as well as on the circumference, leading to localized pitting.
c) While the maximum pitting rates on the flush sides of all the coupons is low; the same is
found to be on the higher side on the non-flush sides of coupons ranging from 9 – 11 mpy
at three locations IPS-3, IPS-4 and RT.
d) The scraper barrels should be periodically cleaned to ensure that no water is
accumulated inside the barrels. Accumulation of water leads to corrosion and biofouling.
e) Locations that have highest susceptibility to accumulation of corrosion causing substance
such as water or solids have highest likelihood of experiencing internal corrosion. Those
locations where probability of water and / or solid accumulation is more are to be
identified or flagged for selecting these sites for installation of coupons at 6’o clock
position.

f) The uninterrupted dosing of CI should be ensured to mitigate internal corrosion. The CI
dosing vessels may also be cleaned periodically. Provision of CI dosing may also be
incorporated at Madarihat IPS-3 as this would provide internal protection further
downstream till the Receipt Terminal in Siliguri.
g) Microbiologically influenced corrosion is also another important mechanism that is widely
active in oil transmission pipelines. Degradation of diesel and naphtha by microbes have
been studied and reported in the literature. The degraded product may adsorb on the
pipeline surface and enhance the rate of microbial corrosion. Though, sampling for MIC
was carried out, only non-significant growth of bacterial colonies was observed in the
collected samples. However, it is advisable to carry out proper sampling in sterile
sampling pots during next field visits to monitor biological activities
h) ILI and or Corrosion audit of NSPL may be carried out in detail through domain experts to
develop a robust long term corrosion management plan or pipeline integrity program.
(S. Purohit)
Dy. SRS
Encl: Annexure – I, Report on Optical Pitting Analysis at M/s TCR Advanced Engineering, Vadodara.