research articles testing the molecular clock: molecular
TRANSCRIPT

RESEARCH ARTICLES
Testing the Molecular Clock: Molecular and Paleontological Estimates ofDivergence Times in the Echinoidea (Echinodermata)
Andrew B. Smith,*1 Davide Pisani,�1 Jacqueline A. Mackenzie-Dodds,�1 Bruce Stockley,*1
Bonnie L. Webster,�1 and D. Timothy J. Littlewood�1
*Department of Palaeontology, The Natural History Museum, London, United Kingdom; �Bioinformatics Laboratory, The NationalUniversity of Ireland, Maynooth, County Kildare, Ireland; and �Department of Zoology, The Natural History Museum, CromwellRoad, London, United Kingdom
The phylogenetic relationships of 46 echinoids, with representatives from 13 of the 14 ordinal-level clades and about 70%of extant families commonly recognized, have been established from 3 genes (3,226 alignable bases) and 119 morpho-logical characters. Morphological and molecular estimates are similar enough to be considered suboptimal estimates of oneanother, and the combined data provide a tree that, when calibrated against the fossil record, provides paleontologicalestimates of divergence times and completeness of their fossil record. The order of branching on the cladogram largelyagrees with the stratigraphic order of first occurrences and implies that their fossil record is more than 85% complete atfamily level and at a resolution of 5-Myr time intervals.
Molecular estimates of divergence times derived from applying both molecular clock and relaxed molecular clockmodels are concordant with estimates based on the fossil record in up to 70% of cases, with most concordant resultsobtained using Sanderson’s semiparametric penalized likelihood method and a logarithmic-penalty function. There are3 regions of the tree where molecular and fossil estimates of divergence time consistently disagree. Comparison withresults obtained when molecular divergence dates are estimated from the combined (morphology 1 gene) tree suggeststhat errors in phylogenetic reconstruction explain only one of these. In another region the error most likely lies with thepaleontological estimates because taxa in this region are demonstrated to have a very poor fossil record. In the third case,morphological and paleontological evidence is much stronger, and the topology for this part of the molecular tree differsfrom that derived from the combined data. Here the cause of the mismatch is unclear but could be methodological, arisingfrom marked inequality of molecular rates. Overall, the level of agreement reached between these different data and meth-odological approaches leads us to believe that careful application of likelihood and Bayesian methods to molecular dataprovides realistic divergence time estimates in the majority of cases (almost 80% in this specific example), thus providinga remarkably well-calibrated phylogeny of a character-rich clade of ubiquitous marine benthic invertebrates.
Introduction
Congruence between independent sources of data isone of the most persuasive arguments when assessingthe reliability of a phylogenetic hypothesis (De Queirozet al. 1995; Cunnigham 1997). Although some striking dif-ferences initially existed between morphological andmolecular-based phylogenies, many of these are graduallybeing resolved as characters are added or reassessed, densersampling is carried out, new fossils are found, and bettermethods of analysis adopted. For example, morphologicaland molecular data initially pointed to different sister-grouprelationships for the whales (Cetacea) within mammals.This conflict has now been resolved by the discovery ofnew fossils (Gingerich 2005), which demonstrated that pre-vious morphological hypotheses were in error. Conversely,Xia et al. (2003) have shown that a bird–mammal linkage in18S ribosomal RNA (rRNA) (which conflicted with mor-phological evidence) could be explained by misalignmentof sequences, inappropriate generalization of base-frequencyparameters over the whole tree, and poor sequence quality.The comparison of morphological and molecular data
sets provides an important cross-check on the reliabilityof results.
In recent years, attention has shifted to another aspectwhere concordance between morphological and molecularestimates has been hard to achieve, namely, the dating ofdivergence times. Here workers seem to be more polarizedin their outlook, either critical of the reliability and accuracyof molecular clock methods to date divergence times (e.g.,Benton 1999; Rodriguez-Trelles et al. 2002; Benton andAyala 2003) or dismissive of the quality of the fossil record(e.g., Easteal 1999). Until now, debate has logically focusedon areas where the two approaches give the most divergentresults, specifically the radiation of the metazoan phyla andon theMesozoic origins of birds and ofmammals (see Smithand Peterson 2002; Aris-Brosou and Yang 2003; Donoghueand Smith 2003; Peterson et al. 2004; Pisani et al. 2004;Blair and Hedges 2005; Ho et al. 2005; Peterson and Butter-field 2005; Welch et al. 2005). In all 3 cases, however, thefossil record is far from satisfactory. The fossil record ofbirds, for example, is miserable by comparison to almost allother fossil groups, with approximately two-thirds of fossilspecies from the Mesozoic still represented only by a singlespecimen (Fountaine et al. 2005), implying that the fossilbird record is still very poorly sampled. Similarly, thepre-Cambrian fossil record of bilaterian metazoans (Eume-tazoans) is scant or nonexistent. In order to advance this de-bate, molecular clock methods need to be more widelytested in groups where the fossil record is considerably bet-ter and the phylogeny unequivocally established. Apartfrom the pioneering work of Perez-Losada et al. (2004)
1 A.B.S. led the research for this paper and is responsible for thepaleontological and morphological data; D.P. undertook all molecular dat-ing analyses; J.A.M.D., B.S., and B.L.W. carried out the sequencing; andD.T.J.L. was responsible for phylogenetic alignment and analysis.
Key words: molecular clock, rates of evolution, echinoids.
E-mail: [email protected].
Mol. Biol. Evol. 23(10):1832–1851. 2006doi:10.1093/molbev/msl039Advance Access publication June 15, 2006
� The Author 2006. Published by Oxford University Press on behalf ofthe Society for Molecular Biology and Evolution. All rights reserved.For permissions, please e-mail: [email protected]

on barnacles (Thoracica), no studies have looked at the re-liability and consistency of molecular clock methods usingmarine invertebrate groups with a good fossil record.
Sea urchins (Echinoidea) are a diverse group of marineinvertebrate deuterostomes (Schultz 2005; Smith 2006;Smith et al. 2004). Their multielement skeleton is complex,providing a large number of phylogenetically informativecharacters. This skeleton also preserves well, creating a richfossil record that has been the focus for much paleontolog-ical research. Importantly, echinoid taxonomy, which waslargely established in the great monographic works ofMortensen (1928, 1935, 1940, 1943a, 1943b, 1948a,1948b, 1950, 1951), is based almost exclusively on skeletalcharacters and so is equally applicable to living and fossil taxa.
Today there are some 900 extant species distributed inabout 50 families and 14 orders. Previous phylogenetic stud-ies (e.g., Smith 1988; Smith et al. 1992; Littlewood andSmith 1995; Lessios et al. 1999, 2001; Jeffery et al. 2003;Lee 2003; Stockley et al. 2005) have generally found goodlevels of congruence between morphological and molecularestimates of relationship. With their good fossil recordand well-established phylogenetic relationships, echinoidsshould provide a model system against which to examinethe performance of molecular methods of dating.
Here we compare molecular and paleontological esti-mates of divergence times for Echinoidea as an empiricalcross-check on the reliability of the methods and assump-tions. We do this by 1) constructing phylogenies from bothmolecular data and traditional morphological data to arriveat the best-supported tree, 2) estimating the quality of theechinoid fossil record by calibrating this tree against the ob-served record of first occurrences, 3) estimating divergencetimes using a molecular clock method and a variety of re-laxed molecular clock models applied to the molecular data,and 4) quantifying the match between the observed times ofappearance of clades in the fossil record and the resultsderived from molecular data.
Materials and MethodsTaxa Included
To construct our phylogeny, we compiled morpholog-ical information and gene sequence data for 46 genera(listed in table 1) with representatives from 28 familiesand 13 of the 14 orders of living echinoid. Where sequencedata for multiple species of the same genus existed, a strictconsensus sequence was constructed. Because we restrictedour analyses to only those regions of the genes that could beunambiguously aligned across all genera, sequences of con-generic species were effectively identical. However, the 2species of Araeosoma were retained separately as theseshowed modest amounts of sequence divergence.
To compare divergence times based on the fossil recordandmolecular data,we selected1 taxon fromeach family (as-terisked in table 1). These were chosen, after examining ourinitial molecular phylogenetic analysis (fig. 2), to avoid taxashowing anomalously long or short branches, thereby creat-ing a ‘‘partially linearized tree’’ (sensu Takezaki et al. 1995).
Morphological data were rooted by outgroup compar-ison using the fossil Archaeocidaris, a late stem-groupechinoid. Data on this taxon were taken from a remarkably
well-preserved Carboniferous species (Lewis and Ensom1982). Molecular data were rooted using a combinationof representatives from each of the other 4 classes of echi-noderm as outgroup: the starfish Asterias, the ophiuroidOphiocanops, the crinoid Antedon, and 2 holothurians,Cucumaria and Psychopetes. In regions where the ingroupand outgroup sequences were too divergent for meaningfulalignment, outgroup sequences were scored as unknown toavoid spurious rooting.
Morphological Characters
Morphological characters were compiled from pub-lished analyses, notably from Smith (1988), Littlewoodand Smith (1995), Jeffery et al. (2003), and Stockleyet al. (2005). In total, 119 characters were scored, 29 ofwhich are multistate (see Supplementary Material online).Twomultistate characters (characters 6 and 8 in supplemen-tary table 1, Supplementary Material online) reflect a clearand unambiguous ontogenetic sequence of character statesand were, therefore, treated as ordered; the remainder wasleft unordered. The great majority of characters relate toskeletal features of the adult, which forms the basis forthe classification of the group. Only 3 characters relateto the larval skeleton as larval characteristics have beenshown to be more homoplastic than characters based onadult skeletal morphology (Smith et al. 1996; Smith andLittlewood 1997). Characters were obtained from direct ob-servation or from modern descriptions in the literature andscored on the basis of the states shown in the species forwhich sequence data were available. The complete charac-ter listing and data matrix are provided as supplementarydata (Supplementary Material online).
Molecular Characters
Three rRNA genes, 2 nuclear (18S small subunit [18S]and 28S large subunit [28S]) and 1 mitochondrial (16Slarge subunit [16S]), were sequenced. These were selectedto encompass a range of different evolutionary rates andhave been used successfully in a wide range of metazoanphylogeny studies aimed at resolving divergences overthe past 250 Myr, including echinoderms (e.g., Littlewoodand Smith 1995; Littlewood et al. 1997; Jeffery et al. 2003;Winchell et al. 2004; Stockley et al. 2005). Approximately630 bp from the 3# end of the 16S gene, 1,250 bp from the5# end of the 28S gene, and the entire 18S gene (ca. 1,800bp) were sequenced.
For details of tissue selection and DNA extraction andamplification methods see Littlewood and Smith (1995) andStockley et al. (2005). Sequence data were obtained forboth forward and reverse reads. An initial multiple se-quence alignment was made using MacClade (MaddisonDR and Maddison WP 2001) followed by alignment of se-quences by eye. Areas of high variability, for which no re-liable alignment across the different orders could be made,were excluded from further data analysis. In total, out of3,990 bp, 3,226 were alignable and 449 were phylogenet-ically informative. All sequences are lodged with GenBank/European Bioinformatics Institute under accession numberslisted in table 1. The aligned data matrix is available as sup-plementary data (Supplementary Material online).
Testing the Molecular Clock in Echinoids 1833

Analytical Methods
Phylogenetic analysis of the morphological data wascarried out with maximum parsimony as the optimality cri-terion, using the Macintosh version of PAUP* (4.0b10
[Altivec]) (Swofford 2002). Because of the large number
of taxa included, we used a heuristic search method, with
1,000 random additional replicates and tree bisection
reconnection branch swapping. Node support was tested
Table 1List of Taxa Included in This Study, Their Higher Taxonomic Placement, and GenBank Accession Numbers forTheir Gene Sequences
Order Family Genus Species 18S rRNA 28S rRNA 16S rRNA
Cidaroida Cidaridae Calocidaris micans (Mortensen, 1903) DQ073782 DQ073756 DQ073737*Prionocidaris bispoinosa (Lamarck, 1816) DQ073792 DQ073767 DQ073747Stereocidaris excavatus Mortensen, 1936 DQ073795 DQ073772 DQ073740
Diadematoida Aspidodiadematidae *Aspidodiadema jacobi Agassiz, 1880 DQ073780 DQ073754 DQ073734Diadematidae Diadema setosum (Leske, 1778) Z37122 DQ073760 DQ073741
Centrostephanus coronatus (Verrill, 1867) Z37120 — —*Centrostephanus longispinus (Philippi, 1845) DQ073783 DQ073757 DQ073738
Echinothurioida Echinothuriidae *Araeosoma fenestratum Wyville Thomson, 1872 DQ073777 DQ073752 DQ073732§Araeosoma owstoni Mortensen, 1904 Z37118 Z37507 DQ073735
Pedinoida Pedinidae *Caenopedina cubensis Agassiz, 1869 DQ073781 DQ073755 DQ073736Arbacioida Arbaciidae *Arbacia lixula (Linnaeus, 1758) Z37514 DQ073753 X80396
Arbacia punctulata (Lamarck, 1816) DQ073778 AY26367 DQ073733Coelopleurus floridanus Agassiz, 1871 DQ073784 DQ073758 DQ073739
Phymosomatoida Stomopneustidae *Stomopneustes variolaris (Lamarck, 1816) AF279214, Z37133 DQ073773 AF279169Temnopleuroida Temnopleuridae Temnopleurus reevesii (Gray, 1855) AF279200 — AF279149
Temnopleurus hardwickii (Gray, 1855) Z37135 — —Temnopleurus toreumaticus (Leske, 1778) — DQ073774 AF279164Temnopleurus alexandrei (Bell, 1880) AF279206 — AF279156Temnotrema sculptum Agassiz, 1863 AF279201 — AF279150*Salmacis sphaeroides (Linnaeus, 1758) AF279210, Z37131 DQ073770 AF279162Salmacis belli Doderlein, 1902 AF279213 — AF279167Salmaciella oligopora (Clark, 1916) AF279211 — AF279163Mespilia globulus (Linnaeus, 1758) AF279203, Z37130 — AF279152Microcyphus annulatus Mortensen, 1904 AF279216 — AF279172Microcyphus olivaceus (Doderlein, 1885) AF279202 — AF279151Amblypneustes ovum (Lamarck, 1816) AF279207 — AF279157Amblypneustes formosus Valenciennes, 1846 AF279212 — AF279165Holopneustes porosissimus Agassiz, 1846 AF279208 — AF179159Holopneustes inflatus Lutken, in Agassiz, 1872 AF279209 — AF279161Pseudechinus albocinctus (Hutton, 1872) AF279204 — AF279153Pseudechinus novaezealandiae Mortensen, 1921 AF279205 — AF279155
Trigonocidaridae *Genocidaris maculata Agassiz, 1869 AF279199 — AF279148Echinoida Strongylocentrotidae *Strongylocentrotus purpuratus (Stimpson, 1857) L28056 AF212171 —
Strongylocentrotus intermedius (Agassiz, 1863) — — AB154276Echinometridae *Anthocidaris crassispinus (Agassiz, 1863) DQ073776 DQ073751 AB154278Echinidae Psammechinus miliaris (Muller, 1771) AF279215, Z37149 DQ073768 AF279170
*Paracentrotus lividus (Lamarck, 1816) AY428816 DQ073766 J04815Toxopneustidae Tripneustes gratilla (Linnaeus, 1758) Z37134 — AB154279
*Cyrtechinus verruculatus (Lutken, 1864) DQ073786 DQ073759 DQ073740Sphaerechinus granulosus (Lamarck, 1816) Z37132 DQ073771 DQ073749Lytechinus variegatus (Lamarck, 1816) DQ073790 AJ225816 DQ073746
Echinoneoida Echinoneidae *Echinoneus cyclostomus Leske, 1778 DQ073789 AJ639778 AJ639801Cassiduloida Cassidulidae *Cassidulus mitis Krau, 1954 Z37148 — —
Echinolampadidae *Echinolampas crassus (Bell, 1880) DQ073788 DQ073764 DQ073744Conolampas sigsbei (Agassiz, 1878) DQ073785 AJ639777 AJ639800
Clypeasteroida Arachnoididae *Fellaster zealandiae (Gray, 1855) Z37128 DQ073765 DQ073745Echinocyamiidae *Echinocyamus pusillus (Muller, 1776) DQ073787 DQ073762 DQ073743Laganidae *Rumphia orbicularis (Leske, 1778) DQ073793 DQ073769 DQ073748Astriclypeidae *Echinodiscus bisperforatus Leske, 1778 Z37124 DQ073763 —Mellitidae *Encope abberans Martens, 1867 Z37126 Z37117 —
Holasteroida Plexechinidae *Plexechinus planus Mironov, 1978 AY957468 AY957469 AY957467Spatangoida Schizasteridae *Abatus cavernosus Philippi, 1845 DQ073775 AJ639776 AJ639803
Paleopneustidae *Paleopneustes cristatus Agassiz, 1873 DQ073791 AJ639784 AJ639808Archaeopneustidae *Archaeopneustes hystrix Agassiz, 1880 DQ073779 AJ639785 AJ639809Brissidae Brissopsis atlantica Mortensen, 1907 — AJ639794 AJ639818
Brissopsis lyrifera (Forbes, 1841) Z37119 — —*Meoma ventricosa Lamarck, 1816 Z37129 AJ639796 AJ639820Spatangus multispinus Mortensen, 1925 AJ639786 AJ639810
Spatangidae *Spatangus raschi Loven, 1869 DQ073794 AJ639787 AJ639811Loveniidae *Echinocardium laevigaster Agassiz, 1869 — AJ639789 AJ639813
Echinocardium cordatum (Pennant, 1777) Z37123 DQ073761 DQ073742
NOTE.—Taxa with asterisks were used as representatives of their family in molecular analyses.
1834 Smith et al.

by bootstrapping with 250 replicates and by clade decayanalysis (Bremer 1994).
All 3 genes were combined for phylogenetic and mo-lecular clock analyses. The program Modeltest (version3.06) (Posada and Crandall 1998) was used to analyze eachdata set and produce an appropriate nucleotide substitutionmodel. We used the general time reversible (GTR)1 C1 Imodel (rates set to gamma, with 6 rate categories). Bayesianinference analyses were conducted using a separate GTR1C 1 I model for each data partition independently and alsofor the combined 3-gene analysis, thus allowing separateestimates for each model parameter per data set. Bayesiananalyses were performed using MrBayes (Huelsenbeck andRonquist 2003). The number of generations permitted was5,000,000 with 4 chains, and the 50% majority rule consen-sus tree was constructed from the non–burn-in trees. Max-imum likelihood (ML) analyses were implemented usingsubtree pruning regrafting (Hordijk and Gascuel 2005)under the best-fitting model (GTR 1 C 1 I). Supportfor the nodes in the ML tree was estimated using the boot-strap (100 replicates).
Combined morphological and molecular data were an-alyzed using both parsimony and Bayesian methods. Thelikelihood model developed for morphological data byLewis (2001) was used for the morphological partition,and separate, unlinked GTR 1 C 1 I models were usedfor the molecular partitions.
Data Congruence Tests
The appropriateness of combining the morphologicaland molecular data sets was tested using the partition ho-mogeneity test (Farris et al. 1994), as implemented inPAUP*. A Templeton (1983) test of data heterogeneitywas performed on the trees that were obtained from mor-phological and molecular data, to determine whether theycould be considered suboptimal estimates of the same un-derlying topology. We also used the recommended ap-proach of Wiens (1998) of comparing support levels fornodes in the morphological and molecular analyses. Weidentified problematic areas as nodes where morphologicaland molecular data pointed to incongruent groupings withstrong support, as indicated by bootstrap proportions of.70% or posterior probabilities of .95%.
Stratigraphic Congruence Tests
Benton’s (1995, 2001) Relative Completeness Index(RCI) was used to measure the fit of stratigraphic data tocladogram topology. This measures the amount of missingrange that must be added to make stratigraphic record fit thephylogeny and has the advantage over Huelsenbeck’s(1994) Stratigraphic Consistency Index or the Spearmanrank correlation proposed by Norrell and Novacek(1992) in that it takes account of the relative size of the mis-match over the entire tree (Hitchin and Benton 1997). Wecalculated RCI for the trees derived from the combinedmorphological and molecular data (fig. 3), using both par-simony and Bayesian analysis. We divided the fossil recordinto 5-Myr intervals and, for each sister-group pairing, usedthe earliest occurrence of either to establish the minimum
time of origin of both sister groups. The geological ages ofthe earliest fossil representative of each clade at the familylevel or above included in this analysis are listed in table 2.Supporting evidence for the paleontological dating of nodesis provided in Appendix.
Where a family is the only representative of a largerclade, the oldest member of the more inclusive clade isgiven. For example, the Cidaridae is the only includedfamily-level representative of the subclass Cidaroidea, sis-ter group to all other living echinoids (fig. 1). Whereas thefossil record of Cidaridae is not much older than 150 Myr,stem-group members of the Cidaroidea extend back to255 Myr. In such cases, we always use the earliest repre-sentative of a member of the most inclusive taxonomicgroup to date the divergence.
Molecular Estimates of Divergence Times
All molecular estimates of divergence times werecalculated for the 28 family representatives selected (aster-isked in table 1) plus outgroups, as explained in Materialsand Methods. The likelihood ratio test (LRT) was used totest the null hypothesis that the data evolved under a molec-ular clock. This was done using Modeltest in ‘‘LRT calcu-lator mode,’’ after having estimated the likelihood for themolecular tree (fig. 2) under the GTR 1 C 1 I model, bothimposing a molecular clock and after having removed thisassumption. As the molecular clock assumption could berejected (P , 0.00001 with 29 degrees of freedom), diver-gence time estimates were calculated from the combined16S, 18S, and 28S rRNA sequences using a variety of re-laxed molecular clock approaches. We used the fully para-metric Bayesian method of Thorne et al. (1998), thenonparametric rate smoothing (NPRS), and the semiparamet-ric penalized likelihood (PL) methods of Sanderson (2002).However, we also used a dating method imposing a strictmolecular clock, the Langley–Fitch method (LF; Langleyand Fitch 1974), to evaluate its performance for comparison.The Bayesian method of Thorne et al. (1998) was imple-mented using the softwareMultidivtime (Thorne andKishino2002), whereas NPRS, PL, and LF analyses were performedusing r8s version 1.70 (Sanderson2004).The r8s version 1.70allows divergence times under PL to be estimated using eithera logarithmic- or an additive-penalty function, and divergencetimes for the internal nodes were obtained using both types ofpenalty function (see Sanderson 2004). Optimal smoothingparameters for the PL and log-PL analyses were obtainedby cross-validation (Sanderson 2002, 2004).
Both r8s and Multidivtime need, as input information,a tree topology with associated branch lengths. For the r8sanalyses, branch lengths for the ML molecular tree (fig. 2)were calculated via likelihood using PAUP 4b10, under thebest-fitting substitution model (GTR 1 C 1 I), which hadbeen reestimated using Modeltest after removing all thetaxa that were not selected for the molecular clock analyses.For comparison, in the Bayesian analyses branch lengthswere estimated with the software Estbranches (which is partof the Multidivtime package) under the F84 1 C substitu-tion model (as suggested in the Estbranches manual). Soft-ware limitations did not allow the implementation of morecomplex substitution model (i.e., GTR 1 C 1 I), and the
Testing the Molecular Clock in Echinoids 1835
specific parameters for the F84 1 C model were estimatedusing phylogenetic analysis by maximum likelihood(PAML) (Yang 1997). Each Bayesian analysis was run 4times, comparing the divergence times obtained in orderto estimate whether convergence was reached. For each
analysis, the Markov Chain Monte Carlo chain was runfor 1,000,000 cycles, sampling every 100 cycles. The first200,000 cycles were considered burn-in.
For all Bayesian divergence time estimates, 95% cred-ibility intervals were calculated. For PL, NPRS, and the LF
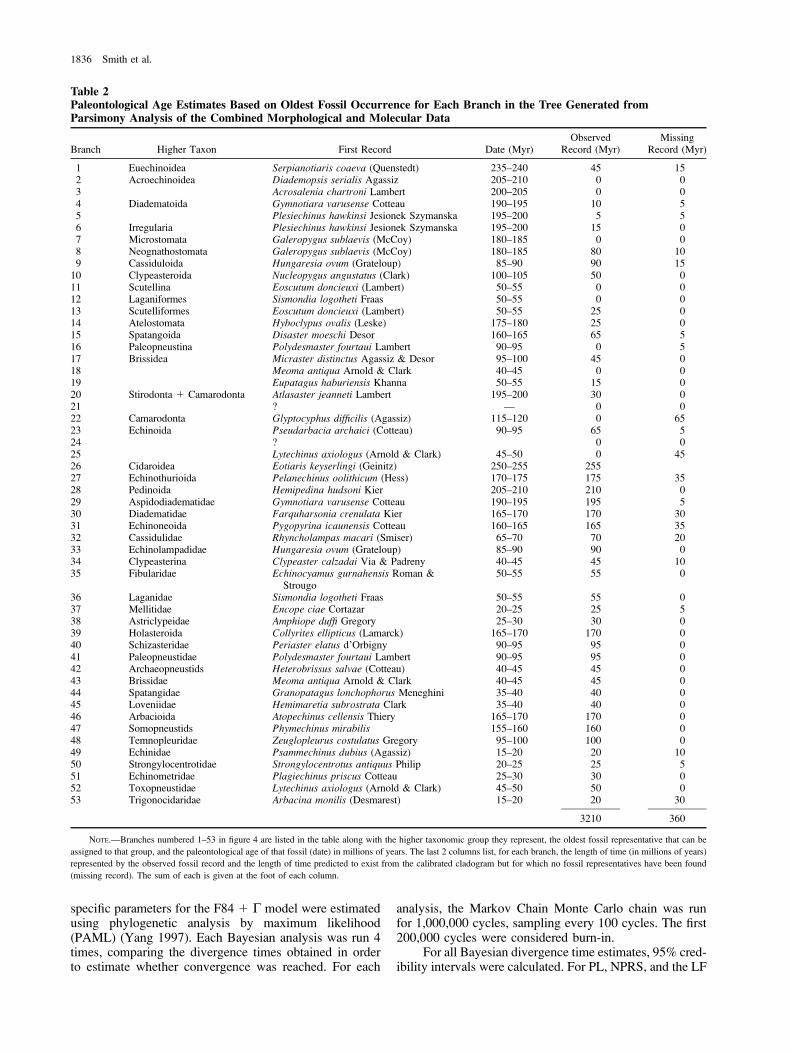
Table 2Paleontological Age Estimates Based on Oldest Fossil Occurrence for Each Branch in the Tree Generated fromParsimony Analysis of the Combined Morphological and Molecular Data
Branch Higher Taxon First Record Date (Myr)Observed
Record (Myr)Missing
Record (Myr)
1 Euechinoidea Serpianotiaris coaeva (Quenstedt) 235–240 45 152 Acroechinoidea Diademopsis serialis Agassiz 205–210 0 03 Acrosalenia chartroni Lambert 200–205 0 04 Diadematoida Gymnotiara varusense Cotteau 190–195 10 55 Plesiechinus hawkinsi Jesionek Szymanska 195–200 5 56 Irregularia Plesiechinus hawkinsi Jesionek Szymanska 195–200 15 07 Microstomata Galeropygus sublaevis (McCoy) 180–185 0 08 Neognathostomata Galeropygus sublaevis (McCoy) 180–185 80 109 Cassiduloida Hungaresia ovum (Grateloup) 85–90 90 15
10 Clypeasteroida Nucleopygus angustatus (Clark) 100–105 50 011 Scutellina Eoscutum doncieuxi (Lambert) 50–55 0 012 Laganiformes Sismondia logotheti Fraas 50–55 0 013 Scutelliformes Eoscutum doncieuxi (Lambert) 50–55 25 014 Atelostomata Hyboclypus ovalis (Leske) 175–180 25 015 Spatangoida Disaster moeschi Desor 160–165 65 516 Paleopneustina Polydesmaster fourtaui Lambert 90–95 0 517 Brissidea Micraster distinctus Agassiz & Desor 95–100 45 018 Meoma antiqua Arnold & Clark 40–45 0 019 Eupatagus haburiensis Khanna 50–55 15 020 Stirodonta 1 Camarodonta Atlasaster jeanneti Lambert 195–200 30 021 ? — 0 022 Camarodonta Glyptocyphus difficilis (Agassiz) 115–120 0 6523 Echinoida Pseudarbacia archaici (Cotteau) 90–95 65 524 ? 0 025 Lytechinus axiologus (Arnold & Clark) 45–50 0 4526 Cidaroidea Eotiaris keyserlingi (Geinitz) 250–255 25527 Echinothurioida Pelanechinus oolithicum (Hess) 170–175 175 3528 Pedinoida Hemipedina hudsoni Kier 205–210 210 029 Aspidodiadematidae Gymnotiara varusense Cotteau 190–195 195 530 Diadematidae Farquharsonia crenulata Kier 165–170 170 3031 Echinoneoida Pygopyrina icaunensis Cotteau 160–165 165 3532 Cassidulidae Rhyncholampas macari (Smiser) 65–70 70 2033 Echinolampadidae Hungaresia ovum (Grateloup) 85–90 90 034 Clypeasterina Clypeaster calzadai Via & Padreny 40–45 45 1035 Fibularidae Echinocyamus gurnahensis Roman &
Strougo50–55 55 0
36 Laganidae Sismondia logotheti Fraas 50–55 55 037 Mellitidae Encope ciae Cortazar 20–25 25 538 Astriclypeidae Amphiope duffi Gregory 25–30 30 039 Holasteroida Collyrites ellipticus (Lamarck) 165–170 170 040 Schizasteridae Periaster elatus d’Orbigny 90–95 95 041 Paleopneustidae Polydesmaster fourtaui Lambert 90–95 95 042 Archaeopneustids Heterobrissus salvae (Cotteau) 40–45 45 043 Brissidae Meoma antiqua Arnold & Clark 40–45 45 044 Spatangidae Granopatagus lonchophorus Meneghini 35–40 40 045 Loveniidae Hemimaretia subrostrata Clark 35–40 40 046 Arbacioida Atopechinus cellensis Thiery 165–170 170 047 Somopneustids Phymechinus mirabilis 155–160 160 048 Temnopleuridae Zeuglopleurus costulatus Gregory 95–100 100 049 Echinidae Psammechinus dubius (Agassiz) 15–20 20 1050 Strongylocentrotidae Strongylocentrotus antiquus Philip 20–25 25 551 Echinometridae Plagiechinus priscus Cotteau 25–30 30 052 Toxopneustidae Lytechinus axiologus (Arnold & Clark) 45–50 50 053 Trigonocidaridae Arbacina monilis (Desmarest) 15–20 20 30
3210 360
NOTE.—Branches numbered 1–53 in figure 4 are listed in the table along with the higher taxonomic group they represent, the oldest fossil representative that can be
assigned to that group, and the paleontological age of that fossil (date) in millions of years. The last 2 columns list, for each branch, the length of time (in millions of years)
represented by the observed fossil record and the length of time predicted to exist from the calibrated cladogram but for which no fossil representatives have been found
(missing record). The sum of each is given at the foot of each column.
1836 Smith et al.

analyses, confidence intervals around the estimated diver-gence times were obtained by bootstrapping (Sanderson2004). Thousand bootstrapped data sets were generatedusing Seqboot (Felsenstein 2004), and for each bootstrap-ped data set, the branch lengths of the input tree werereestimated using likelihood (see also above). The resultsof these analyses were sets of 1,000 bootstrap trees withassociated branch lengths, with the trees in each set havingthe same topology and bootstrapped branch lengths. Diver-gence times were then obtained, and, taking each of these1,000 bootstrap trees and each node in the input tree, thestandard deviation (SD) of its estimated age was calculated.The 95% confidence intervals around each clade’s esti-mated age were approximated as (X 6 2SD), where X isthe estimated age of a given node. All the computationalsteps in the estimation of the bootstrap confidence intervals
for the penalized likelihood analyses were automated usingseveral PERL scripts written by D.P.
In the PL, NPRS, and LF analyses the ingroup nodewas fixed at 265 Myr, which is 10 Myr prior to the firstappearance of the oldest recognizable member of the crowngroup in the fossil record. For the Bayesian analyses of di-vergence times, we set a date for this node of 265 Myr witha SD of 1, whereas the prior date of the root node was setto 480 Myr, which represents the earliest occurrence ofmembers of 2 of our outgroups, the Asteroidea and Ophiur-oidea (Dean 2005). Two sets of analyses were then run, thefirst without any internal constraints (with the exclusion ofthe ingroup node) and a second in which 4 local calibrationpoints were enforced. These 4 points were set as minimaldivergence estimates, and the basal dichotomy (ingroupnode) was taken as a fixed point. The 4 internal calibrations
FIG. 1.—Semistrict consensus tree of 4,605 equally parsimonious solutions of TL 249 steps with a CI of 0.60 and retention index of 0.88 derived fromthe morphological data matrix of 119 characters (see supplementary tables 1 and 3, Supplementary Material online). Bootstrap values for each node aregiven above each internal branch, and Bremer support values are given beneath. Abbreviations for higher taxonomic groupings as follows: Arb 5Arbacioida; Cass 5 Cassiduloida; Cid 5 Cidaroida; Clyp 5 Clypeasteroida; Diad 5 Diadematoida; Ech 5 Echinoida; Ene 5 Echinoneoida; Ethur 5Echinothurioida; Hol 5 Holasteroida; Ped 5 Pedinoida; Phy 5 Phymosomatoida; Spat 5 Spatangoida; and Tem 5 Temnopleuroida.
Testing the Molecular Clock in Echinoids 1837

were selected from across the tree topology to provide con-straints on local rate variation. The following local calibra-tion points were employed: the first occurrence ofPedinoida (fig. 5, node 4) at 210 Myr, the first occurrenceof Scutellina (fig. 5, node 11) at 55Myr, the first occurrenceof paleopneustid spatangoids (fig. 5, node 15) at 95 Myr,and the first occurrence of Temnopleuridae (fig. 5, node25) at 45 Myr (all dates from Smith 2006).
Measuring Congruence of Divergence Estimates
For comparing the different methods of estimating di-vergence times, we use the following measure. Each nodewhere we have an independent molecular and paleontol-ogical estimate of divergence time was given a score be-tween 0 and 2: 2 if the fossil date lies within 1 SD of themean of the molecular estimate, 1 if it lies between 1 and
2 SD of the molecular estimate, and 0 when the paleonto-logical estimate falls outside 2 SDs of the molecular esti-mate. Our overall measure of congruence is then simplythe score summed over all nodes divided by the total numberof nodes 3 2; the higher the score (maximum 1 and min-imum 0), the better the agreement achieved between molec-ular and paleontological estimates of divergence on our tree.
ResultsPhylogenetic Relationships
Parsimony analysis of morphological data found 4,605equally parsimonious solutions of tree length (TL), 249steps with a consistency index (CI) of 0.60 and retentionindex 0.88. A semistrict consensus of these trees (fig. 1)shows good resolution in all parts of the tree except among
FIG. 2.—Phylogram derived from analysis of the combined molecular sequence data (see supplementary table 3, Supplementary Material online) byML. Numbers on branches are posterior probabilities.
1838 Smith et al.

members of the Camarodonta. Some nodes are well sup-ported, especially within the irregular echinoids, but thereare a number of weakly supported areas.
The ML analyses of molecular data identified a topol-ogy very similar, but not identical, to that supported by
morphological data (fig. 2). Of the few differences, only
1 taxon, Fellaster, is placed with strong support at differentpositions in the 2 rival trees. Other conflicting placements
are weakly supported in either one or both of the trees. Themorphological and molecular trees passed Templeton’stest. Although the trees based on molecular data couldnot have been produced by the morphological data, the con-sensus tree of equally parsimonious trees from the morpho-logical analysis was not significantly different in terms ofTL from the molecular ML tree at P . 0.05 (number ofdifferences 5 31, rank sums 5 331.0, P 5 0.07 forTempleton’s test, and P 5 0.15 for Winning sites test).Therefore, the 2 sources of data, morphological and molec-
ular, can be considered to be suboptimal estimates of thesame underlying topology.
Because different nodes are strongly supported in the2 trees, a combined data set arguably provides the mostappropriate way to combine the strengths of the 2 datasets. Parsimony analysis of the combined data found 6trees whose strict consensus is shown (fig. 3, left-handside). Bootstrap and Bremer support values were moderateto high for most branches. The Bayesian analysis of thecombined data produces a tree that is very similar to theparsimony tree, except for its placement of the echinothur-ioids (Araeosoma) and the pedinoid Caenopedina (fig. 3,right-hand side). The topology in this part of the tree iscloser to that derived from analysis of molecular data alone.
Stratigraphic Completeness Estimate
Both Bayesian and parsimony trees derived from thecombined morphological and molecular data (fig. 3) were
FIG. 3.—Trees derived from analysis of the combined morphological and molecular data. (Left hand side) Semistrict consensus of 6 equally mostparsimonious trees derived from parsimony analysis. Bootstrap values (above) and Bremer support values (below) are given for each internal branch.(Right hand side) Tree derived from Bayesian analysis with posterior probabilities for each branch.
Testing the Molecular Clock in Echinoids 1839
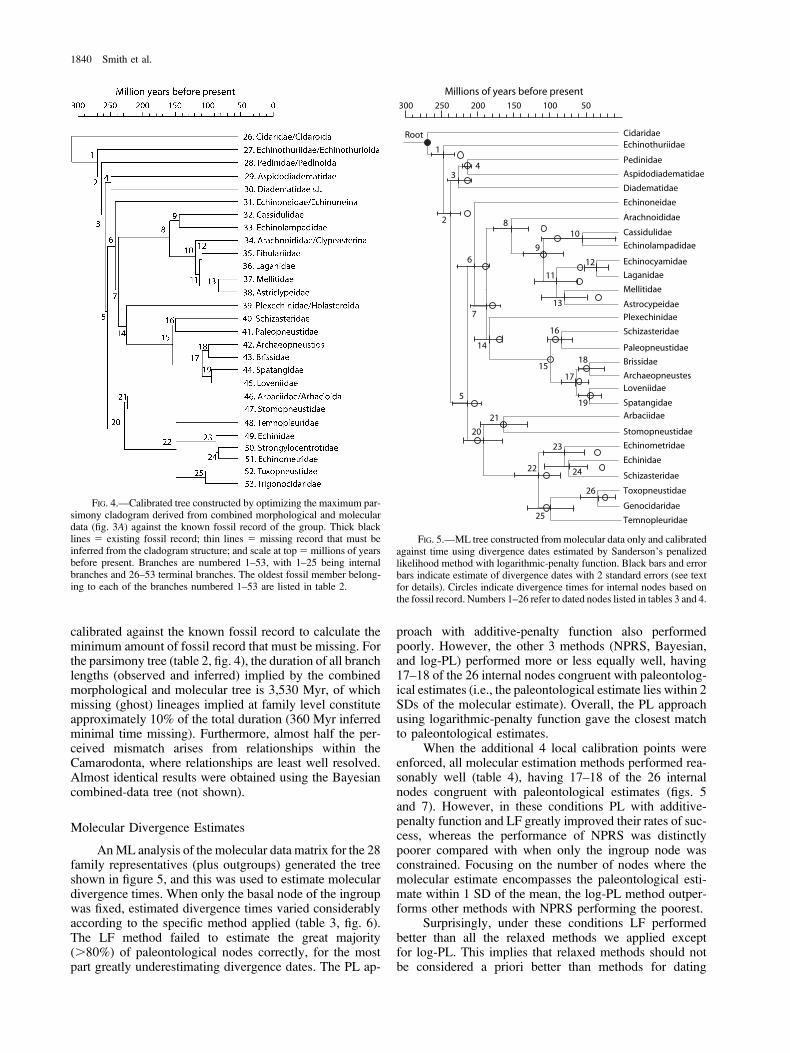
calibrated against the known fossil record to calculate theminimum amount of fossil record that must be missing. Forthe parsimony tree (table 2, fig. 4), the duration of all branchlengths (observed and inferred) implied by the combinedmorphological and molecular tree is 3,530 Myr, of whichmissing (ghost) lineages implied at family level constituteapproximately 10% of the total duration (360 Myr inferredminimal time missing). Furthermore, almost half the per-ceived mismatch arises from relationships within theCamarodonta, where relationships are least well resolved.Almost identical results were obtained using the Bayesiancombined-data tree (not shown).
Molecular Divergence Estimates
AnML analysis of the molecular data matrix for the 28family representatives (plus outgroups) generated the treeshown in figure 5, and this was used to estimate moleculardivergence times. When only the basal node of the ingroupwas fixed, estimated divergence times varied considerablyaccording to the specific method applied (table 3, fig. 6).The LF method failed to estimate the great majority(.80%) of paleontological nodes correctly, for the mostpart greatly underestimating divergence dates. The PL ap-
proach with additive-penalty function also performedpoorly. However, the other 3 methods (NPRS, Bayesian,and log-PL) performed more or less equally well, having17–18 of the 26 internal nodes congruent with paleontolog-ical estimates (i.e., the paleontological estimate lies within 2SDs of the molecular estimate). Overall, the PL approachusing logarithmic-penalty function gave the closest matchto paleontological estimates.
When the additional 4 local calibration points wereenforced, all molecular estimation methods performed rea-sonably well (table 4), having 17–18 of the 26 internalnodes congruent with paleontological estimates (figs. 5and 7). However, in these conditions PL with additive-penalty function and LF greatly improved their rates of suc-cess, whereas the performance of NPRS was distinctlypoorer compared with when only the ingroup node wasconstrained. Focusing on the number of nodes where themolecular estimate encompasses the paleontological esti-mate within 1 SD of the mean, the log-PL method outper-forms other methods with NPRS performing the poorest.
Surprisingly, under these conditions LF performedbetter than all the relaxed methods we applied exceptfor log-PL. This implies that relaxed methods should notbe considered a priori better than methods for dating
FIG. 4.—Calibrated tree constructed by optimizing the maximum par-simony cladogram derived from combined morphological and moleculardata (fig. 3A) against the known fossil record of the group. Thick blacklines 5 existing fossil record; thin lines 5 missing record that must beinferred from the cladogram structure; and scale at top5 millions of yearsbefore present. Branches are numbered 1–53, with 1–25 being internalbranches and 26–53 terminal branches. The oldest fossil member belong-ing to each of the branches numbered 1–53 are listed in table 2.
250 200 150 100 50
Millions of years before present
CidaridaeEchinothuriidae
Diadematidae
Pedinidae
Aspidodiadematidae
Echinoneidae
Arachnoididae
Cassidulidae
Echinolampadidae
Echinocyamidae
Laganidae
Mellitidae
Astrocypeidae
Plexechinidae
Schizasteridae
Paleopneustidae
Brissidae
ArchaeopneustesLoveniidae
Spatangidae
Arbaciidae
Stomopneustidae
Echinometridae
Echinidae
Schizasteridae
Toxopneustidae
Genocidaridae
Temnopleuridae
300
8
9
10
11
12
13
14
15
16
17
18
19
20
21
22
23
24
25
26
Root
1
2
34
5
6
7
FIG. 5.—ML tree constructed from molecular data only and calibratedagainst time using divergence dates estimated by Sanderson’s penalizedlikelihood method with logarithmic-penalty function. Black bars and errorbars indicate estimate of divergence dates with 2 standard errors (see textfor details). Circles indicate divergence times for internal nodes based onthe fossil record. Numbers 1–26 refer to dated nodes listed in tables 3 and 4.
1840 Smith et al.

Table 3Divergence Dates for the 26 Internal Nodes Identified on the Tree Resulting from ML of Molecular Data (fig. 7, nodes 1–26) as Estimated by the LF, NPRS, PenalizedLikelihood with Additive-Penalty Function (PL), Penalized Likelihood with Logarithmic-Penalty Function (log-PL), and Bayesian Methods (see text for details). In AllCases, the Basal Node Is Fixed at 265 Myr and No Internal Calibration Points Were Used
Node
Paleo Dates LF NPRS PL (additional) PL (logarithmic) Bayes
Age (Myr) Age (Myr) 95% CI (Myr) C Age (Myr) 2 3 SD (Myr) C Age (Myr) 2 3 SD (Myr) C Age (Myr) 2 3 SD (Myr) C Age (Myr) 95% CI (Myr) C
Root 2551 220 222 193–251 dd 227 190–264 dd 216 177–253 dd 225 197–253 dd 226 180–254 dd
2 210 177 147–207 213 185–241 dd 196 158–234 dd 212 182–242 dd 210 164–243 dd
3 210 151 112–190 192 157–227 d 173 129–217 d 193 161–224 d 189 138–229 d
4 210 122 84–158 167 131–203 146 106–186 169 132–206 160 109–2055 200 146 114–178 196 161–231 dd 173 134–212 d 197 165–229 dd 186 138–226 dd
6 185 136 107–165 188 161–215 dd 164 125–203 d 190 161–219 dd 173 126–214 dd
7 175 121 95–147 173 146–200 dd 146 111–181 d 177 145–209 dd 157 112–198 dd
8 105 103 78–128 dd 146 115–177 118 84–152 dd 151 118–184 131 87–175 d
9 105 83 62–104 110 81–139 dd 81 47–115 d 114 83–145 dd 98 60–141 dd
10 85 29 0–59 68 9–127 dd 43 5–86 d 77 21–132 dd 52 7–104 d
11 55 74 55–93 d 94 67–121 69 38–100 dd 97 68–126 78 44–121 d
12 55 31 19–43 35 20–50 24 0–38 36 20–52 28 12–5413 30 65 4–86 81 50–112 58 26–90 d 83 51–115 65 35–10514 170 116 91–141 169 140–198 dd 142 106–178 d 174 142–206 dd 149 104–190 d
15 95 52 38–66 78 56–100 d 61 42–80 82 61–104 d 70 39–110 d
16 80 43 30–56 66 45–87 d 51 33–69 69 48–90 d 57 29–94 d
17 55 35 24–46 52 32–72 dd 39 24–54 54 35–73 dd 47 23–83 dd
18 45 22 17–27 35 17–53 d 26 13–39 37 21–53 dd 28 10–57 d
19 40 24 15–33 35 19–51 dd 27 16–38 36 19–53 dd 32 13–62 dd
20 195 130 101–159 180 150–210 dd 154 117–191 182 150–214 dd 167 119–210 d
21 160 105 76–134 152 116–188 dd 129 94–164 d 155 119–191 dd 144 95–190 dd
22 100 86 63–109 d 120 84–156 d 91 59–123 dd 125 97–153 dd 108 67–155 dd
23 30 50 33–67 86 55–117 63 35–91 93 63–123 78 42–12224 25 47 29–65 82 50–114 59 31–88 88 57–119 70 36–11225 100 75 54–96 102 75–129 dd 76 45–107 d 108 81–135 dd 92 53–139 dd
26 20 22 8–34 dd 36 5–67 dd 25 4–46 dd 43 12–74 d 37 11–76 d
0.15 0.63 0.39 0.65 0.62
NOTE.—Paleo dates5 estimated divergence times based on the first occurrence of fossils in the geological record; Age5 divergence date estimated by method; 23 SD5 2 SDs given as maximum and minimum age around the estimate in
millions of years; C5 congruence statistic measuring the fit of paleontological and molecular estimates of divergence time: dd 5 paleontological date lies within 1 SD of the mean of the molecular date; d 5 paleontological date lies between
1 and 2 SDs of the mean of the molecular date. The congruence statistic averaged over all 26 nodes is given at the foot of each column.
Testin
gtheMolecu
larClock
inEchinoids
1841

Table 4Divergence Dates for the 26 Internal Nodes Identified on the Tree Resulting from ML of Molecular Data (fig. 7, nodes 1–26) as Estimated by the LF, NPRS, PenalizedLikelihood with Additive-Penalty Function (PL), Penalized Likelihood with Logarithmic-Penalty Function (log-PL) and Bayesian Methods (see text for details). In AllCases the Basal Node Is Fixed at 265 Myr and 4 Internal Calibration Points Were Set as Minimal Times of Divergence (nodes in brackets)
Node
Paleo dates LF NPRS PL (Additional) PL (Logarithmic) Bayes
Age (Myr) Age (Myr) 95% CI (Myr) C Age (Myr) 2 3 SD (Myr) C Age (Myr) 2 3 SD (Myr) C Age (Myr) 2 3 SD (Myr) C Age (Myr) 95% CI (Myr) C
Root 255 265 0 265 0 265 0 265 01 220 245 227–263 243 226–260 244 227–261 243 226–260 257 240–2652 210 232 212–252 234 216–252 235 218–252 234 220–248 248 231–2613 210 221 196–246 dd 223 202–244 d 223 201–244 d 222 206–238 d 236 217–254[4] 210 210 210 dd 210 205–215 dd 210 205–215 dd 210 206–214 dd 218 210–234 d
5 200 193 167–219 dd 220 197–243 d 218 196–240 d 211 189–233 dd 223 192–248 d
6 185 181 157–205 dd 212 190–234 210 189–231 202 179–225 d 211 180–238 d
7 175 164 144–184 d 196 174–218 d 194 173–215 d 185 164–206 dd 195 162–225 d
8 105 138 115–161 166 137–195 164 136–192 149 123–175 165 125–2039 105 109 87–131 dd 126 97–155 d 124 96–152 d 104 72–136 dd 124 86–166 dd
10 85 37 0–74 — 39 0–99 d 75 10–140 dd 54 6–102 d 67 8–128 dd
[11] 55 98 78–118 — 107 79–135 106 80–132 88 58–118 99 62–14512 55 41 27–55 d 39 23–55 d 39 23–55 d 32 17–47 36 16–67 d
13 30 86 63–109 92 61–123 91 60–122 75 43–107 83 48–12714 170 160 141–179 d 192 170–214 d 190 169–211 d 181 161–201 d 187 154–217 d
[15] 95 95 95 dd 95 95–107 dd 95 95–104 dd 95 95 dd 110 95–144 d
16 80 72 57–87 d 81 67–95 dd 80 66–94 dd 79 65–93 dd 91 65–124 dd
17 55 54 39–69 dd 64 45–83 dd 63 43–83 dd 61 42–80 dd 76 48–112 d
18 45 33 21–45 d 44 26–62 dd 42 23–61 dd 39 21–57 dd 46 19–81 dd
19 40 36 24–48 dd 43 25–62 dd 42 25–59 dd 41 26–56 dd 52 25–88 dd
20 195 171 143–199 d 204 180–228 dd 199 174–224 dd 189 162–216 dd 202 164–234 dd
[21] 160 137 109–165 d 177 146–208 dd 168 135–201 dd 159 127–191 dd 175 130–215 dd
22 100 111 87–135 dd 139 112–166 133 106–160 113 81–145 dd 133 88–180 d
23 30 65 44–86 105 73–137 94 61–127 77 49–105 97 56–14524 25 61 39–83 100 68–132 89 55–123 73 43–103 87 48–13525 100 97 74–120 dd 118 90–146 d 113 86–140 dd 94 61–127 dd 113 68–162 dd
26 20 28 11–45 dd 47 12–82 d 38 5–71 d 31 6–56 dd 47 14–96 d
0.56 0.48 0.52 0.62 0.50
NOTE.—Paleo dates5 estimated divergence times based on the first occurrence of fossils in the geological record; Age5 divergence date estimated by method; 23 SD5 2 SDs given as maximum and minimum age around the estimate in
millions of years; C5 congruence statistic measuring the fit of paleontological and molecular estimates of divergence time: dd 5 paleontological date lies within 1 SD of the mean of the molecular date; d 5 paleontological date lies between
1 and 2 SDs of the mean of the molecular date. The congruence statistic averaged over all 26 nodes is given at the foot of each column.
1842
Smith
etal.

divergence times imposing a molecular clock. Methods im-posing a single, global, rate of evolution could return biasedresults, but the same is true for relaxed models as correctlynoted, for example, by Welch et al. (2005) and Ho et al.(2005).
It is also interesting to note that log-PL and the Bayesianmethod of Thorne et al. (1998) were the most consistent,correctly estimating a high proportion of divergence times,no matter whether internal constraints different from theingroup node were enforced. However, log-PL always per-formed better than the method of Thorne et al. (1998). It is,however, difficult to evaluate what causes this difference.
The method of Thorne et al. (1998), as it is currently imple-mented, can only use simple models (e.g., F84 1 C), but itbuild these models into the likelihood calculations, whereasSanderson’s (2004) software (r8s) relies on trees withbranch lengths that must be previously estimated usingother software (e.g., PAUP) and does not build the modelsinto the likelihood calculations. However, in this way, itallows using more complex models and hence more accu-rate branch length estimations. If the use on simple and per-haps suboptimal model will be discovered to be the cause ofthe difference in performance between the 2 methods, thenwe should expect that the Bayesian method of Thorne et al.(1998) would improve as more models are integrated into it.
In any case, when the molecular estimates and paleon-tological estimates for each node are regressed, there isa strong and highly significant correlation with r2 5 0.91(for log-PL estimates). For the 8 cases where there is sig-nificant mismatch, paleontological data mostly under-estimate the date of divergence.
Irrespective of which specific method was applied,mismatch between molecular and morphological estimatesof divergence time is confined to the same 3 areas of thecladogram, 2 nodes near the base of the tree (the divergenceof Euechinoidea; fig. 5, nodes 1 and 2), 4 nodes within theClypeasteroida (fig. 5, nodes 8 and 11–13), and 2 within theCamarodonta (fig. 5, nodes 23 and 24).
When the tree derived from the combined-data anal-ysis (fig. 3) was used as the base for calculating divergencesinstead of the molecular tree, the overall congruence be-tween molecular and paleontological estimates decreases(table 5), and the camarodont and clypeasteroid nodes thatwere incongruent in the previous analyses are also incon-gruent in this analysis. However, the basal nodes now showa better fit, with molecular and paleontological estimates fornodes 1 and 2 now congruent and in close agreement.
Discussion
There has been much recent discussion about the val-idity of the different methods used to estimate divergencetimes from molecular data but few empirical tests in groupswith a good fossil record. The study of Perez-Losada et al.(2004) tested a variety of different methods on the phylog-eny of barnacles and their relatives but examined onlya small number of nodes. In this study, we have adopteda similar approach but applied across a much larger num-ber of paleontologically well-dated nodes. The fossil recordand molecular-based divergence dates provide effectivelyindependent estimates for the 26 internal nodes on ourfamily-level tree. Furthermore, we specifically used the to-pology derived from only molecular data (rather than thecombined morphological and molecular data tree) in orderto set a more stringent test of the accuracy of the molecularapproach.
It has been suggested that approaches that can accom-modate rate variation in their inference procedures generatesignificantly more realistic results (e.g., Kishino et al. 2001;Sanderson 2002; Thorne and Kishino 2002; Perez-Losadaet al. 2004). However, whether these methods truly returnbetter results seem strongly dependent on the model usedto estimate rate variation, on the calibration points used
FIG. 7.—Plot of estimated divergence times based on molecular data(using 5 different methods as indicated) against paleontological estimatefor the 26 nodes identified in table 3. Molecular divergence estimateswere calculated using a fixed basal date plus 4 local calibration points,as described in the text. PL 5 penalized likelihood method with addi-tive-penalty function; log-PL5 penalized likelihoodmethod with logarith-mic-penalty function; and Bayes 5 Bayesian analysis.
FIG. 6.—Plot of estimated divergence times based on molecular data(using 5 different methods as indicated) against paleontological estimatefor the 26 nodes identified in table 3. Molecular divergence estimateswere calculated using only fixed basal date without local calibrationpoints. PL 5 penalized likelihood method with additive-penalty function;log-PL 5 penalized likelihood method with logarithmic-penalty function;and Bayes 5 Bayesian analysis.
Testing the Molecular Clock in Echinoids 1843
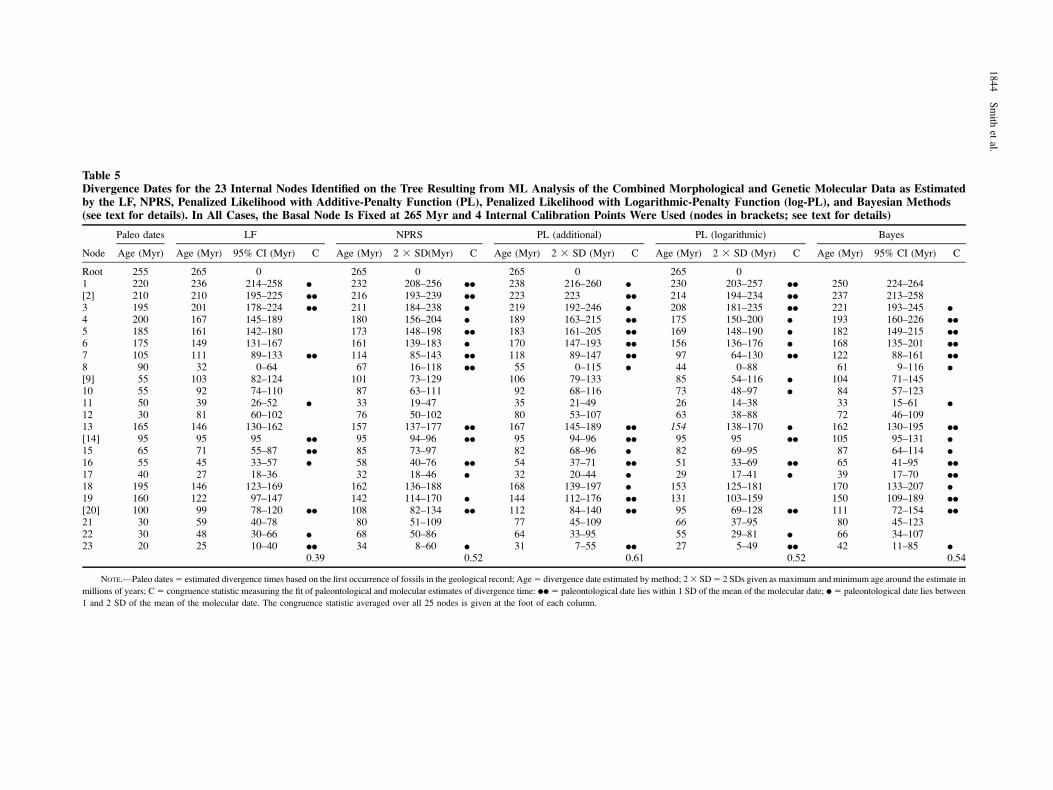
Table 5Divergence Dates for the 23 Internal Nodes Identified on the Tree Resulting from ML Analysis of the Combined Morphological and Genetic Molecular Data as Estimatedby the LF, NPRS, Penalized Likelihood with Additive-Penalty Function (PL), Penalized Likelihood with Logarithmic-Penalty Function (log-PL), and Bayesian Methods(see text for details). In All Cases, the Basal Node Is Fixed at 265 Myr and 4 Internal Calibration Points Were Used (nodes in brackets; see text for details)
Node
Paleo dates LF NPRS PL (additional) PL (logarithmic) Bayes
Age (Myr) Age (Myr) 95% CI (Myr) C Age (Myr) 2 3 SD(Myr) C Age (Myr) 2 3 SD (Myr) C Age (Myr) 2 3 SD (Myr) C Age (Myr) 95% CI (Myr) C
Root 255 265 0 265 0 265 0 265 01 220 236 214–258 d 232 208–256 dd 238 216–260 d 230 203–257 dd 250 224–264[2] 210 210 195–225 dd 216 193–239 dd 223 223 dd 214 194–234 dd 237 213–2583 195 201 178–224 dd 211 184–238 d 219 192–246 d 208 181–235 dd 221 193–245 d
4 200 167 145–189 180 156–204 d 189 163–215 dd 175 150–200 d 193 160–226 dd
5 185 161 142–180 173 148–198 dd 183 161–205 dd 169 148–190 d 182 149–215 dd
6 175 149 131–167 161 139–183 d 170 147–193 dd 156 136–176 d 168 135–201 dd
7 105 111 89–133 dd 114 85–143 dd 118 89–147 dd 97 64–130 dd 122 88–161 dd
8 90 32 0–64 67 16–118 dd 55 0–115 d 44 0–88 61 9–116 d
[9] 55 103 82–124 101 73–129 106 79–133 85 54–116 d 104 71–14510 55 92 74–110 87 63–111 92 68–116 73 48–97 d 84 57–12311 50 39 26–52 d 33 19–47 35 21–49 26 14–38 33 15–61 d
12 30 81 60–102 76 50–102 80 53–107 63 38–88 72 46–10913 165 146 130–162 157 137–177 dd 167 145–189 dd 154 138–170 d 162 130–195 dd
[14] 95 95 95 dd 95 94–96 dd 95 94–96 dd 95 95 dd 105 95–131 d
15 65 71 55–87 dd 85 73–97 82 68–96 d 82 69–95 87 64–114 d
16 55 45 33–57 d 58 40–76 dd 54 37–71 dd 51 33–69 dd 65 41–95 dd
17 40 27 18–36 32 18–46 d 32 20–44 d 29 17–41 d 39 17–70 dd
18 195 146 123–169 162 136–188 168 139–197 d 153 125–181 170 133–207 d
19 160 122 97–147 142 114–170 d 144 112–176 dd 131 103–159 150 109–189 dd
[20] 100 99 78–120 dd 108 82–134 dd 112 84–140 dd 95 69–128 dd 111 72–154 dd
21 30 59 40–78 80 51–109 77 45–109 66 37–95 80 45–12322 30 48 30–66 d 68 50–86 64 33–95 55 29–81 d 66 34–10723 20 25 10–40 dd 34 8–60 d 31 7–55 dd 27 5–49 dd 42 11–85 d
0.39 0.52 0.61 0.52 0.54
NOTE.—Paleo dates5 estimated divergence times based on the first occurrence of fossils in the geological record; Age5 divergence date estimated by method; 23 SD5 2 SDs given as maximum and minimum age around the estimate in
millions of years; C5 congruence statistic measuring the fit of paleontological and molecular estimates of divergence time: dd 5 paleontological date lies within 1 SD of the mean of the molecular date; d 5 paleontological date lies between
1 and 2 SD of the mean of the molecular date. The congruence statistic averaged over all 25 nodes is given at the foot of each column.
1844
Smith
etal.

(Welch et al. 2005), and, in the case of the Bayesian meth-ods, on the prior on-divergence times chosen. For example,Aris-Brosou and Yang (2003) obtained high concordancewith the fossil record from their molecular clock analysis;however, the major determinant of their divergence timeswas not their data, it was their prior (Ho et al. 2005; Welchet al. 2005). This also seems to be the case in our study,which found that although the LF method performed poorlywhen only the root is fixed, the inclusion of internal cali-bration points surprisingly increased its performance,whereas this same operation negatively affected NPRS.Furthermore, it is interesting to note that with our data,when LF behaved poorly, it underestimated most of the di-vergence time, contradicting the claim of Benton and Ayala(2003) that molecular clock methods by default overesti-mate divergence times. The correspondence we obtain be-tween paleontological and molecular estimates ofdivergence using both the fully parametric Bayesianmethod of Thorne et al. (1998) and the semiparametricPL methods of Sanderson (2002) is reassuringly strong.In approximately 70% of cases, morphological and molec-ular estimates are congruent, that is, the paleontological es-timate falls within the 95% confidence error bars of themolecular estimate. The use of internal fossil calibrationpoints made little difference for log-PL and the Bayesianmethod of Thorne et al. (1998), and this consistency of per-formance is encouraging, suggesting that these methodsshould probably be favored over others. Overall, for ourdata, log-PL was best at recovering known divergencetimes, although employing better substitution models to es-timate branch lengths in the Bayesian approach of Thorneet al. (1998) might be expected to improve the success rateof this method.
The few nodes that consistently show a mismatch be-tween paleontological and molecular divergence estimatesare restricted to 3 parts of the tree (fig. 5). These affect basalnodes 1 and 2 and nodes within the Echinoida clade (nodes23 and 24) and clypeasteroid clade (nodes 8 and 11–13).
There are 3 reasons why disagreement between pale-ontological and molecular estimates of divergence mightarise: inaccuracy of the phylogenetic reconstruction beingused, incompleteness of the fossil record, or methodolog-ical problems in the way molecular estimates are derived.In order to test the first possibility, we calculated moleculardivergence dates using the tree constructed from the com-bined morphological and molecular data (fig. 3), which wetake as our best-supported estimate of phylogenetic rela-tionships. This tree differs most obviously from the molec-ular tree (fig. 2) in the relationships of the basal nodes andthe monophyly of clypeasteroids. Using the combined-datatree reduces the correspondence between molecular andpaleontological estimates of divergence in some parts ofthe tree but improves the fit of basal nodes 1 and 2 consider-ably. Consequently, the poor match between paleontolog-ical and molecular estimates of divergence times seen in the2 basal nodes in the molecular analyses could be the resultof there being a suboptimal arrangement of basal taxa in themolecular tree. Significantly, however, mismatch betweenpaleontological and molecular divergence estimates in the 2other regions of the tree remains when using the best overallsupported tree. In these cases, therefore, it is unlikely that
the mismatch is simply a problem of inaccurate phyloge-netic reconstruction.
To check whether inadequacies in the fossil recordcould explain the mismatch, we calibrated the combinedmorphology and gene tree against the observed fossil re-cord (fig. 4). Although this implies that the fossil recordof echinoids is relatively well sampled overall, almosthalf the missing record identified is concentrated in theCamarodonta, suggesting that this group is seriously under-represented in the fossil record. The reason for this is ob-vious. It is notoriously difficult to assign fossil echinoids tospecific families within the Camarodonta becauseMortensen(1943a, 1943b) established his taxonomy on the basis ofstructures (details of pedicellarial anatomy) that are rarelypreserved in fossils. Consequently, it is likely that thefossil record in this part of the tree is better than that sug-gested by our data and that it is simply a lack of diagnosticmorphological characters that creates the apparent mis-match. The fossil record may well be there, it is just thatwe cannot currently place many fossil taxa with any degreeof confidence. On this part of the tree, molecular estimatesof divergence are always deeper than paleontological esti-mates (figs. 5–7). Consequently, the observed mismatchof molecular and paleontological estimates of divergenceat nodes 23 and 24 is probably due to inadequacies ofthe fossil record, rather than due to errors in the molecular-based estimate.
For the remaining 4 nodes (nodes 8 and 11–13), themismatch between paleontological and molecular estimatesof divergence times is less easily explained. All these nodesrefer to divergences within clypeasteroids, a morphologi-cally complex and intensively studied clade (Durham1955; Kier 1982; Mooi 1987, 1990). Furthermore, theyhave a highly distinctive synapomorphy (large numbersof pores perforating all ambulacral plates) that makes themimmediately recognizable in the fossil record, even fromsmall fragments. The group primarily inhabits shallow wa-ter, living in environments that are well represented in thefossil record. Consequently, the chance that crown-groupclypeasteroids have a deep, hidden fossil record stretchingback into the Early Cretaceous seems improbable fromwhat we know of the echinoid fossil record.
Clypeasteroid divergence times estimated frommolec-ular data may be afflicted by two potentially significantproblems. First, the topology of this part of the moleculartree differs from that supported by the combined analysis ofmorphological and molecular data that we take as our bestestimate of the phylogeny (cf. figs. 3 and 5). Specifically,the 2 cassiduloid families group within the clypeasteroids inthe molecular tree (fig. 5) rather than as their sister group(fig. 3). However, even when the combined-data tree is usedas the model to estimate divergence times (log-PL analysis,table 5), the paleontological and molecular-based estimatesof divergence time remain strongly incongruent. Errors inthe topology of the tree cannot, therefore, explain why mo-lecular and paleontological estimates of divergence timesare so incongruent in this part of the tree.
A second potential problem arises from the very un-even rate of molecular evolution shown by the cassiduloidsand clypeasteroids on the combined-data tree. Whereas cas-siduloids show 0.0051–0.0057 substitutions per site, all 5
Testing the Molecular Clock in Echinoids 1845

clypeasteroids have rates about 4 times faster (0.018–0.026substitutions per site). This may be a large amount of rateheterogeneity for molecular methods to accommodate. Wepredict that denser taxon sampling together with two ormore local tie points (minima) might help generate a closermatch between paleontology and molecular data in this partof the tree.
In conclusion, because morphological and moleculardata both point to closely similar phylogenetic relationshipsamong echinoid clades (with the exception of the clypeaste-roid Fellaster) and we estimate that their fossil record isrelatively complete, we have the first real opportunity tocompare the accuracy of molecular and paleontologicalmethods of estimating divergence times empirically. In ap-proximately 70% of nodes tested, paleontological and mo-lecular methods give congruent estimates of divergencedates using methods that allow for rate variation over thetree. Although this is pleasantly reassuring, it is not as goodas we were hoping for. For those nodes where paleontolog-ical and molecular estimates of divergence time are incon-gruent, paleontological datamostly underestimate divergencetimes. In some cases, the problem clearly lies with thepaleontological data because of the poor preservationpotential of key diagnostic characteristics by which paleon-tologists recognize those clades. A second problem may bethat the molecular tree being used to establish divergencetimes is suboptimal in its arrangement of certain branches.When these problems are discounted, only a small propor-tion of nodes (ca. 15%) show a significant mismatch be-tween molecular and paleontological estimates where theerror may be the fault of our molecular techniques. Al-though care is still needed in selecting calibration pointswhen using molecular data to estimate divergence times,our study demonstrates that, so long as a realistic modelof rate variation is applied (see Welch et al. 2005), modernparametric and semiparametric approaches that assume rateheterogeneity can and do generate realistic divergence timeestimates in the great majority of cases.
Supplementary Material
Figures 6 and 7, in color, and the full description ofmorphological characters and character states together withthe data matrix and the aligned sequences used in our anal-yses given as supplementary tables 1, 2, and 3 are availableat Molecular Biology and Evolution online (http://www.mbe.oxfordjournals.org/).
Acknowledgments
We would like to thank Owen Anderson, Mike Hart,Sonoko Kinjo, Benedicte Lafay, Chuck Messing, RichMooi, Matt Richmond, Patrick Schembri, Jon Todd, PaulTyler, and Craig Young for assistance in providing tissuematerial for molecular analysis. Julia Llewellyn-Hughesand Claire Griffin provided expert technical assistance.D.T.J.L. and B.L.W. were funded by a Wellcome TrustSenior Research Fellowship to D.T.J.L. (043965/Z/95/Z)and a Marie Curie Fellowship to D.P. (MEIF-CT-2005-010022). We gratefully acknowledge funding from Na-tional Environmental Research Council (NER/A/S/2000/
00383) and the Natural History Museum, London Zoology Re-search Fund.
Appendix
Supporting evidence for the paleontological dating ofnodes in this study is given in this section.
Paleontological dates for nodes 1–26 in figures 5–7 arefixed as follows.
Root: Cidaroidea–Euechinoidea Divergence. These 2clades have fundamentally different lantern and peri-gnathic girdle structures, both derived compared withthe arrangement seen in Paleozoic late stem-group ar-chaeocidarids. Kier (1984a) recognized that this diver-gence probably occurred in the Permian, and Smithand Hollingworth (1990) showed that the well-dated LatePermian (Kazanian) ‘‘Miocidaris’’ keyserlingi possessedcidaroid synapomorphies in both the structure of its lan-tern and perignathic girdle. As the oldest demonstrablemember of the Cidaroidea, M. keyserlingi sets the min-imum time of crown-group divergence at 255 Myr.
1: Echinothurioida–Acroechinoidea Divergence. Echino-thurioida are the only extant clade of echinoids whosetests have remained imbricate, and, consequently, theyhave the poorest fossil record of any of the groups con-sidered here (see Smith and Wright 1990). This diver-gence is, therefore, dated by the first occurrence ofa member of the Acroechinoidea, which has, as its pri-mary synapomorphies, a fully tessellate test, the lack ofmultiple peristomial ambulacral plates, and the presenceof true ambulacral plate compounding. ‘‘Hemipedina’’hudsoni (Kier 1977), though relatively poorly known,has a solid, nonimbricate test plating and compound am-bulacral plating characteristic of an Acroechinoidea. Itcomes from the Norian of Oman and dates the originof Acroechinoidea at around 220 Myr.
2: Aulodont–[Echinacea 1 Irregularia] Divergence. Themajor synapomorphy distinguishing the Echinacea andIrregularia from aulodonts, is their possession of keeled,as opposed togrooved, teeth. Isolated teeth are not uncom-mon from the Middle Triassic (Carnian) St Cassian beds,but all are grooved (Vadet 1999). The lantern of the LateTriassic (Rhaetian) Diademopsis serialis is known indetail (Smith 1981) and is aulodont in structure. The ear-liest known keeled teeth come from the Lower Jurassic(Pliensbachian; Smith 1981; Markel 1978). However,Kier (1977, p. 33) argued that the Late Triassic (Rhaetian)Pseudodiadema silbinense (which is more correctlyplaced in the genus Stereopyga) represented the oldestechinacean on the basis of general test characteristics.These occurrences suggest that this divergence had defi-nitely occurred by 195 Myr and probably by 210 Myr.
3: Diadematidae–[Aspidodiadematidae 1 Pedinidae] Di-vergence. The pairing of Aspidodiadematidae and Ped-inidae as sister groups to the exclusion of Diadematidaein the molecular analysis is unexpected. Traditionally,the Diadematidae and Aspidodiadematidae have beengrouped together in the order Diadematoida and distin-guished from members of the order Pedinoida by theircrenulated tubercles (e.g., Mortensen 1940; Smith 1981).
1846 Smith et al.

No morphological synapomorphy exists uniting the mo-lecular clade Aspidodiadematidae 1 Pedinidae, and sothe date of this divergence is set by the oldest membershowing synapomorphies of any 1 of the 3 constituentfamilies. The Upper Triassic (Rhaetian) Diademopsisserialis is generally placed in the Pedinidae (Smith1981, 2006) as is the Lower Jurassic (Pliensbachian)Hemipedina, which displays the derived dicyclic pedinidapical disc. Synapomorphies of the Aspidodiadematidaeinclude their distinctive apical disc plating, which is onlyvery loosely connected to the corona, and their distinc-tive sphaeridial pit arrangement. Both occur in the LowerJurassic (Pliensbachian) Gymnotiara varusense (Smith2006). Divergence must have occurred before 195 Myrand probably by 210 Myr, the date used here.
4: Pedinoida–Aspidodiadematidae Divergence. See Dis-cussion for node 4. The oldest member of the Aspidodia-dematidae isG. varusense, from the Pliensbachian at 195Myr (Smith 2006). The oldest member of the Pedinoidais Diademopsis serialis from the Rhaetian, at 210 Myr.
5: Echinacea–Irregularia Divergence. Both these groupshave keeled teeth but differ in their apical disc structure:Echinacea having a normal endocyclic apical disc with5 gonopores in contrast to the more derived apical discarrangement of primitive irregular echinoids in which theperiproct is displaced to the posterior behind the posteriorgenital plates and genital plate 5 has lost its gonopore.The oldest putative echinacean is the Rhaetian Stereopygasilbinense (redescribed by Kier 1977). However, there isnothing to definitely place this as a derived Echinacearather than a stem-group Echinacea 1 Irregularia. Cla-distic analysis consistently identifies the Sinemurian Je-sionekechinus hawkinsi as the earliest member of theIrregularia (Smith and Anzalone 2000; Barras forthcom-ing), establishing divergence at 200 Myr.
6: Echinoneoida–Microstomata Divergence. Among irreg-ular echinoids, Microstomata is more derived than its sis-ter group Echinoneoida in having evolved specializedambulacral zones in the form of aboral petals and adoralphyllodes (Barras forthcoming). The Lower Jurassic(Toarcian) Galeropygus sublaevis has distinct phyllodesand a subanal groove and establishes the date of this splitas no younger than 185 Myr.
7: Atelostomata–Neognathostomata Divergence. Bothatelostomates and neognathostomates have long, well-documented stem groups. The synapomorphies that dis-tinguish basal atelostomates are mostly associatedwith apical disc arrangement, atelostomates having a‘‘stretched’’ apical disc with ocular plates 2 and 4 inter-calated between the anterior and posterior pair of genitalplates, as opposed to the more compact ethmophractdisc structure of early neognathostomates (Smith1981; Barras forthcoming). The earliest echinoid to showthe derived atelostomate disc plating is Aulacopyguscaudatus from the Late Bajocian (Smith 2006), settingthis divergence as no later than 175 Myr.
8: Fellaster–[Cassiduloida 1 Scutellina] Divergence. Asdiscussed in the text, the position taken by Fellasterin the molecular tree is in strong contradiction tothat in traditional taxonomies based on morphology(Mortensen 1948b; Smith 1981; Mooi 1987, 1990). Tra-
ditional taxonomies place Fellaster as a member of theClypeasteroida along with its sister group the Scutellina,whereas the molecular topology implies that Clypeaster-oida are diphyletic, with the 2 cassiduloids as closer tomembers of the Scutellina than Fellaster. A further com-plication is that the Cassiduloida, as currently recog-nized, is a paraphyletic group (Smith 2001). Cladisticanalysis of morphological data suggests that the cassidu-loid families Cassidulidae and Echinolampadidae forma clade, whereas a third cassiduloid family, Apatopygi-dae (not included in the molecular analysis), representsthe closest living sister group to Fellaster and the Scu-tellina (Smith 2001). This latter grouping is based on a de-rived pattern of ambulacral plating seen in apatopygidsand undoubted stem-group Clypeasteroida and impliesthat the Clypeasteroid–[Cassidulidae 1 Echinolampadi-dae] split can be traced back in the Late Cretaceous (Nu-cleopygus angustatus being the earliest recognizablerepresentative of the Apatopygidae1 Clypeasteroida to-tal group). Given the molecular topology, divergence atthis node is thus placed at 105 Myr.
9: Cassiduloida–Scutellina Divergence. As for node 8,above.
10: Cassidulidae–Echinolampadidae Divergence. Thephylogenetic relationships of cassiduloids remain prob-lematic because of the small number of convincing syn-apomorphies available from morphology (Smith 2001).Convincing cassidulids (Rhyncholampas) and echino-lampadids (Vologesia) are, however, present and clearlydifferentiated by the Maastrichtian (70 Myr; Smith andJeffery 2000) with echinolampadids extending back tothe Santonian (Hungaresia ovum; Smith 2006). This pla-ces their divergence at no younger than 85 Myr.
11: Scutelliformes–Laganiformes Divergence. The mostpaleontologically useful synapomorphies characterizingthese 2 clades are 1) the single terminal interambulacralplate unique to laganines and 2) the complex arrange-ment of buttressing internal meshwork in the Scutellina(e.g., Mooi 1987). Both Sismondia and Echinocyamushave interambulacra that terminate in a single plate,and both extend back to the Eocene. However, the veryoldest members of each genus (the Lower Eocene Echi-nocyamus gurnahensis and Sismondia logotheti) are notsufficiently known to confirm that their interambulacrashow the laganiform arrangement (e.g., Roman andStruogo 1994). The oldest scutelliform, Eoscutum don-cieuxi, is also of Lower Eocene and has the apomorphicdense internal buttressing of a scutelliform (Roman1990; Smith 2006). Divergence is thus taken as havingoccurred around 50–55 Myr.
12: Echinocyamidae–Laganidae Divergence. Echinocya-midae are small laganiforms with interambulacral zonesending adapically in a single plate and with internal but-tressing composed of radial buttresses only. Unlike otherlaganiform families, there is no certainty that this isa monophyletic clade, and it could include pedomorphicforms of other laganiforms. Small laganids might beextremely difficult to distinguish from taxa currentlyplaced in the Echinocyamidae. Forms attributed toEchinocyamus extend back into the Eocene (Kier1968), with E. gurnahensis being the oldest (Roman
Testing the Molecular Clock in Echinoids 1847

and Struogo 1994). Laganidae are larger forms witha well-developed internal skeleton of both concentricpartitions and adradial bars. The highly stellate natureof their basicoronal plates, with their radially directedpoints, is also a synapomorphy. One stem-group branchof the Laganidae shows an additional synapomorphy ofhaving pseudocompound plating in their petals and isfound as far back as the Middle Eocene (Kier 1968,1980). The 2 groups were thus clearly separated bythe Middle Eocene with a divergence probably in theEarly Eocene, at 50–55 Myr.
13: Mellitidae–Astroclypidae Divergence. Mellitidae andAstriclypeidae are sister taxa, united by having a well-developed microcanal system internally, spines and tu-bercles on the oral surface clearly differentiated intofood-gathering and locomotory areas, and the periproctopening in the first postbasicoronal interambulacralplate. Mellitidae is the more derived taxa in possessingan anal lunule (Smith 2006). Although both clades pos-sess ambulacral notches or lunules, these are constructeddifferently, as noted by Seilacher (1979), and are presum-ably independently evolved in each. Amphiope duffi,from the Upper Oligocene of North Africa, is the oldestfossil with astriclypeid-style lunules, whereas Encopeciae, from the Lower Miocene, is the oldest fossil withan anal lunule (Durham 1955). This places their diver-gence at around 30 Myr.
14: Holasteroida–Spatangoida Divergence. Traditionally,holasteroids and spatangoids have both been thoughtas originating at the base of the Cretaceous (e.g., Durham1966). However, this is because both are apomorphybased rather than total group definitions. Mintz (1968)was first to realize that both originated from amongthe Jurassic ‘‘disasteroids’’ and might have a long pre-Cretaceous record. Recent cladistic analysis of this para-phyletic grade by Barras (forthcoming) confirms this andplaces the split at 170 Myr, based on the occurrence ofCollyrites ellipticus, the oldest stem-group holasteroid,and Disaster moeschi, the oldest stem-group spatangoid.
15: Schizasterina–Micrasterina Divergence. Micrasterinaand Schizasterina display fundamentally different de-rived fasciole patterns (Smith and Stockley 2005): mi-crasterines having a subanal fasciole andschizasterines a lateroanal fasciole. Periaster elatus,from the Cenomanian, is the earliest spatangoid to havea lateroanal fasciole, whereas the slightly youngerMicraster leskei, from the Lower Turonian, is the oldestmicrasterine with a subanal fasciole (Smith 2006), al-though the Cenomanian ‘‘Micraster’’ distinctus maybe an early micrasterine, lacking a subanal fasciole. Di-vergence is set at 95 Myr.
16: Schizasteridae–Paleopneustidae Divergence. These 2families share a similar fasciole pattern, but in Paleo-pneustidae the lateroanal fasciole is discrete from theperipetalous fasciole, whereas in Schizasteridae the 2 fas-cioles are coalesced around the anterior. Markov and So-lovjev (2001) have argued that paleopneustids (heredefined to include pericosmids) are derived and that theirfasciole pattern is the synapomorphic state. The oldestechinoid with paleopneustid fascioles and apical disc ac-cording toMarkov and Solovjev is Eopericosmus typicus
from the Early Palaeocene, establishing divergence at65 Myr.
17: [Brissidae 1 Archaeopneustid]–[Spatangidae 1 Love-niidae] Divergence. Cladistic analysis of the Spatangoida(Stockley et al. 2005) suggested that the composition ofall these families needs revision. Nevertheless, consider-ing just those taxa discussed in this paper, a dichotomybetween Brissus, Meoma, and Archaeopneustes on theone hand and Spatangus, Echinocardium, and Loveniaon the other hand is clearly evident. The occurrenceof Granopatagus (a Spatangidae) and Brissus (a Brissi-dae) by the late Middle Eocene demonstrates that thissplit had already occurred by 45 Myr. If the cladogramin Stockley et al. (2005) is correct, then it suggests thatthe divergence was even earlier, at around 55 Myr, be-cause of the occurrence of Eupatagus in the Early Eocene(Roman and Struogo 1994).
18: Brissidae–Archaeopneustid Divergence. The brissidMeoma and the deep-sea Archaeopneustid Archaeop-neustes are sister groups in both morphological andmolecular analyses of spatangoid genera by Stockleyet al. (2005). Archaeopneustes extends back in thefossil record to the Oligocene (Heteropneustes elegans(Jackson)), whereas Meoma extends back to the MiddleEocene (Meoma caobaensis Sanchez Roig) (Kier 1984b;Smith 2006). Their divergence is therefore placed at 45Myr.
19: Spatangidae–Loveniidae Divergence. Loveniidae aremore derived than Spatangidae, having as synapomor-phies an inner fasciole and deeply sunken aboral tu-bercles. The latter are found in Hemimaretia, withHemimaretia subrostrata dated from the late Middle Eo-cene of the United States representing the oldest Love-niidae (A. Kroh, personal communication). This,together with the occurrence of the spatangid Granopa-tagus by the late Middle Eocene, demonstrates that thissplit had already occurred by 40 Myr.
20: Stirodonta–Camarodonta Divergence. Camarodonta area monophyletic clade united by their characteristic andderived lantern structure (Mortensen 1943a; Smith1981). Unfortunately, lanterns are rarely preserved infossils, making distinction between camarodonts andstirodonts difficult. Echinoid-style plate compoundingis a reliable synapomorphy for crown-group Camarodon-ta but is absent from the earliest forms (Zeuglopleuridae).A further problem is that the major clades within the Stir-odonta are possibly not a monophyletic group. Smith andWright (1996) argued that the sister group to camaro-donts was the stirodont-group Salenioida as both sharedthe derived character of possessing a suranal plate. Thesplit between stirodonts with and without suranal platesforming an integral part of the apical disc occurred veryearly, with the Hettangian Acrosalenia chartoni beingthe oldest member of the former group. Divergence isthus set at 195 Myr.
21: Arbacioida–Stomopneustidae Divergence. Stomop-neustidae are a small, well-defined group with character-istic ambulacral plating and test morphology that can betraced back to the Upper Jurassic (Oxfordian) Phymechi-nus mirabilis (Smith 2006). However, no cladistic anal-ysis has been carried out to investigate the relationshipsof this clade to potential Middle Jurassic sister taxa and
1848 Smith et al.

its divergence with arbacioids. Tentatively, therefore, di-vergence is set at 160 Myr, though it may be anywhereup to 30 Myr older.
22: Echinoida–Temnopleuroida Divergence. These 2clades share the synapomorphy of having echinoid-styleambulacral plate compounding, with temnopleuroidsfurther derived in having a strongly developed ornamentover test plates. The Cenomanian Zeuglopleurus hasa primitive forerunner to echinoid-style ambulacral platecompounding and a strong ornament of pits (Smith andWright 1996) and is generally accepted to be the oldeststem-group temnopleuroid. Divergence is thus estimatedat 100 Myr.
23: Echinometridae–[Strongylocentrotidae 1 Echinidae]Divergence. Neither Echinidae nor Strongylocentrotidaeare defined on synapomorphies that are likely to be pre-served in fossils (see below) and so are difficult to rec-ognize in the rock record. However, several of theEchinometridae have a very unusual ovate test, and thisdistinctive morphology is first seen in the Upper Oligo-cene Plagiechinus priscus (see Smith 2006), placingtheir divergence at 30 Myr.
24: Echinidae–Strongylocentrotidae Divergence. Thesefamilies are distinguished on pedicellarial features,which are rarely preserved in fossils. Although Echinidaeusually have trigeminate ambulacral plating and Strong-ylocentrotidae polygeminate plating, there are excep-tions and based on test features alone no reliabledistinction can be drawn. Dating is therefore based onfinding taxa that are close enough in morphology tothe extant species to be considered congeneric. The old-est putative strongylocentrotid Strongylocentrotus anti-quus from the Lower Miocene of Australia wasdescribed by Philip (1965), whereas Psammechinus du-bius from the Early Miocene (see Kroh 2005) is probablya valid Echinidae. No earlier species can be reliablyplaced in these families (see also Smith 1988). A diver-gence date is therefore tentatively set at 25 Myr.
25: Temnopleuridae–[Toxopneustidae 1 Trigonocidari-dae] Divergence. Temnopleuridae have, as their mostdistinctive apomorphy, a test ornamentation of deep su-tural pits, a character first seen in the Cenomanian Zeu-glopleurus (Smith and Wright 1996). Divergence is thusestimated at 100 Myr. However, Cretaceous temnopleu-roids such as Zeuglopleurus lack echinoid-style ambula-cral plate compounding, a character that unites all extantTemnopleuridae, Trigonocidaridae, Toxopneustidae aswell as Echinoida (Smith 1988). It is therefore possiblethat this divergence is younger than commonly esti-mated. As a minimum date of divergence, we used thefirst appearance of a member of the Toxopneustidae, Ly-techinus [Scoliechinus] axiologus Arnold & Clark, at 45Myr, as our local calibration point.
26: Toxopneustidae–Trigonocidaridae Divergence. Molec-ular data unexpectedly placed the trigonocidarid Genoci-daris within the Toxopneustidae, despite its lack of deepbuccal notches, and there are no clear morphological syn-apomorphies unitingGenocidaris and its molecular sistertaxon Cyrtechinus. Genocidaris, however, has an almostidentical in-test morphology to the fossil Arbacina, withArbacinamonilis (Desmarest) from theBurdigalian being
the oldest representative known. This establishes a puta-tive divergence date of 20 Myr for Genocidaris.
Literature Cited
Aris-Brosou S, Yang Z. 2003. Bayesian models of episodic evo-lution support a late Precambrian diversification of the Meta-zoa. Mol Biol Evol 20:1947–54.
Barras C. 2007. Phylogeny of the Jurassic to early Cretaceous �dis-asteroid� echinoids (Echinoidea; Echinodermata), and theorigins of spatangoids and holasteroids. J Syst Palaeontol.Forthcoming.
Benton MJ. 1995. Testing the time axis of phylogenies. Phil TransR Soc Lond B 349:5–10.
Benton MJ. 1999. Early origins of modern birds and mammals:molecules vs. morphology. BioEssays 21:1043–51.
Benton MJ. 2001. Finding the tree of life: matching phylogenetictrees to the fossil record through the 20th century. Proc R SocLond B 268:2123–30.
Benton MJ, Ayala FJ. 2003. Dating the tree of life. Science300:1698–700.
Blair JE, Hedges SB. 2005. Molecular clocks do not support theCambrian explosion. Mol Biol Evol 22:387–90.
Bremer K. 1994. Branch support and tree stability. Cladistics10:295–304.
Cunnigham CW. 1997. Can three incongruence tests predictwhen data should be combined? Mol Biol Evol 14:733–40.
Dean J. 2005. Skeletal homologies, phylogeny and classificationof the earliest asterozoan echinoderms. J Syst Palaeontol 3:29–114.
De Queiroz A, Donoghue MJ, Kim J. 1995. Separate versus com-bined analysis of phylogenetic evidence. Annu Rev Ecol Syst26:657–81.
Donoghue PCJ, Smith MP. 2003. Telling the evolutionary time:molecular clocks and the fossil record. Syst Assoc Spec Pub66:296.
Durham JW. 1955. Classification of clypeasteroid echinoids. UnivCalif Publ Geol Sci 31:73–198.
Durham JW. 1966. Phylogeny and evolution. In: Moore RC,editor. Treatise on invertebrate paleontology Part U.Echinodermata 3. Boulder, CO: University of Kansas Pressand The Geological Society of America. p U266–9.
Easteal S. 1999. Molecular evidence for the early divergence ofplacental mammals. Bioessays 21:1052–8.
Farris JS, Kallersjo M, Kluge AG, Bult C. 1994. Testing signif-icance of incongruence. Cladistics 10:315–9.
Felsenstein J. 2004. PHYLIP (phylogeny inference package). Ver-sion 3.6. Distributed by the author. Seattle: Department ofGenome Sciences, University of Washington.
Fountaine TMR, Benton MJ, Dyke GJ, Nudds RL. 2005. Thequality of the fossil record of Mesozoic birds. Proc R Soc B272:289–94.
Gingerich PD. 2005. Cetacea. In: Rose KD, Archibald JD, editors.Placental mammals: origin, timing, and relationships of themajor extant clades. Baltimore, MD: Johns Hopkins UniversityPress. p 234–52.
Hitchin R, Benton MJ. 1997. Congruence between parsimony andstratigraphy: comparisons of three indices. Paleobiology23:20–32.
Ho SYW, Phillips MJ, Drummond AJ, Cooper A. 2005. Accuracyof rate estimation using relaxed-clock models with a criticalfocus on the early metazoan radiation. Mol Biol Evol22:1355–63.
Hordijk W, Gascuel O. 2005. Improving the efficiency of SPRmoves in phylogenetic tree search methods based onmaximumlikelihood. Bioinformatics 21:4338–47.
Testing the Molecular Clock in Echinoids 1849

Huelsenbeck JP. 1994. Comparing the stratigraphic record to esti-mates of phylogeny. Paleobiology 20:470–83.
Jeffery CH, Emlet RB, Littlewood DTJ. 2003. Phylogeny and evo-lution of developmental mode in temnopleurid echinoids. MolPhylogenet Evol 28:99–118.
Kier PM. 1968. Echinoids from the Middle Eocene Lake CityFormation of Georgia. Smithson Misc Collect 153:1–45,pls 1–10.
Kier PM. 1977. Triassic echinoids. Smithson Contrib Paleobiol30:1–88.
Kier PM. 1980. The echinoids of the Middle Eocene Warley HillFormation, Santee Limestone, and Castle Hayne Limestoneof North and South Carolina. Smithson Contrib Paleobiol39:1–102.
Kier PM. 1982. Rapid evolution in echinoids. Palaeontology25:1–9.
Kier PM. 1984a. Echinoids from the Triassic (St Cassian) of Italy,their lantern supports, and a revised phylogeny of Triassic echi-noids. Smithson Contrib Paleobiol 56:1–41.
Kier PM. 1984b. Fossil spatangoids of Cuba. Smithson ContribPaleobiol 55:1–336.
Kishino H, Thorne JL, Bruno WJ. 2001. Performance of a diver-gence time estimation method under a probabilistic model ofrate evolution. Mol Biol Evol 18:352–61.
Kroh A. 2005. Catalogus fossilium Austriae. Band 2 Echinoideaneogenica. Wien, Austria: Osterreichischen Akademie derWissenschaften. 210 p, 82 pls.
Langley CH, Fitch W. 1974. An estimation of the constancy of therate of molecular evolution. J Mol Evol 3:161–77.
Lee Y-H. 2003. Molecular phylogenies and divergence time of seaurchin species of Strongylocentrotidae, Echinoida. Mol BiolEvol 20:1211–21.
Lessios HA, Kessing BD, Pearse JS. 2001. Population structureand speciation in tropical seas: global phylogeography ofthe sea urchin Diadema. Evolution 55:955–75.
Lessios HA, Kessing BD, Robertson DR, Pauley G. 1999.Phylogeography of the pantropical sea urchin Eucidaris inrelation to land barriers and ocean currents. Evolution53:806–17.
Lewis DN, Ensom PC. 1982. Archaeocidaris whatleyensis sp.nov. (Echinoidea) from the carboniferous limestone of Somer-set and notes on echinoid phylogeny. Bull Brit Mus (Nat Hist)Geol Ser 36:77–104.
Lewis PO. 2001. A likelihood approach to estimating phylogenyfrom discrete morphological character data. Syst Biol 50:913–25.
Littlewood DTJ, Smith AB. 1995. A combined morphological andmolecular phylogeny for echinoids. Phil Trans R Soc Lond B347:213–34.
Littlewood DTJ, Smith AB, Clough KA, Emson RH. 1997. Theinterrelationships of the echinoderm classes: morphologicaland molecular evidence. Biol J Linn Soc 61:409–38.
Maddison DR, Maddison WP. 2001. MacClade 4. Analysis ofphylogeny and character evolution. Version 4.03. Sunderland,MA: Sinauer Associates.
Markel K. 1978. On the teeth of the recent cassiduloid Echino-lampas depressa Gray, and on some liassic fossil teeth nearlyidentical in structure (Echinodermata, Echinoidea). Zoomor-phology 89:125–44.
Markov AV, Solovjev AN. 2001. Echinoids of the family Paleo-pneustidae (Echinoidea, Spatangoida): morphology, taxon-omy, phylogeny. Trans Pal Inst Moscow 280:1–109.
Mintz LW. 1968. Echinoids of the Mesozoic families Collyritidaed’Orbigny, 1853, and Disasteridae Gras, 1848. J Paleontol42:1272–88.
Mooi R. 1987. A cladistic analysis of the sand dollars (Clypeast-eroida: Scutellina) and the interpretation of heterochronic
phenomena. [PhD thesis]. Toronto, Canada: University ofToronto; 208 p.
Mooi R. 1990. Paedomorphosis, Aristotle’s Lantern, and theorigin of the sand dollars (Echinodermata; Clypeasteroida).Paleobiology 16:25–48.
Mortensen T. 1928. A monograph of the Echinoidea. I. Cidaroi-dea. Copenhagen, Denmark: C. A. Reitzel. p 551, 88 pls.
Mortensen T. 1935. A monograph of the Echinoidea. II. Bothrio-cidaroida to Stirodonta. Copenhagen, Denmark: C. A. Reitzel.p 647, 89 pls.
Mortensen T. 1940. A monograph of the Echinoidea. III(i). Aulo-donta. Copenhagen, Denmark: C. A. Reitzel. p 369, 79 pls.
Mortensen T. 1943a. A monograph of the Echinoidea. III(ii).Camarodonta 1. Copenhagen, Denmark: C. A. Reitzel. p 553,56 pls.
Mortensen T. 1943b. A monograph of the Echinoidea. III(ii).Camarodonta 2. Copenhagen, Denmark: C. A. Reitzel. p 466,66 pls.
Mortensen T. 1948a. A monograph of the Echinoidea. IV(1).Holectypoida, Cassiduloida. Copenhagen, Denmark: C. A.Reitzel. p 363, 14 pls.
Mortensen T. 1948b. A monograph of the Echinoidea. IV(2).Clypeasteroida. Copenhagen, Denmark: C. A. Reitzel. p 471,72 pls.
Mortensen T. 1950. A monograph of the Echinoidea. V(1).Spatangoida. Copenhagen, Denmark: C. A. Reitzel. p 432,25 pls.
Mortensen T. 1951. A monograph of the Echinoidea. V(2).Spatangoida 2. Copenhagen, Denmark: C. A. Reitzel. p 593,64 pls.
Norrell MA, Novacek MJ. 1992. Congruence between superposi-tional and phylogenetic patterns: comparing cladistic patternswith fossil records. Cladistics 8:319–37.
Perez-Losada M, Hoeg JT, Crandall KA. 2004. Unravelling theevolutionary radiation of the Thoracican barnacles usingmolecular and morphological evidence: a comparison ofseveral divergence time estimation approaches. Syst Biol53:244–64.
Peterson KJ, Butterfield NJ. 2005. Origin of the Eumetazoa: test-ing ecological predictions of molecular clocks against theProterozoic fossil record. PNAS 102:9547–52.
Peterson KJ, Lyons JB, Nowak KS, Takacs CM, Wargo MJ,McPeek MA. 2004. Estimating metazoan divergence timeswith a molecular clock. PNAS 101:6536–41.
Philip GM. 1965. The Tertiary echinoids of South-eastern Aus-tralia III Stirodonta, Aulodonta, and Camarodonta (1). ProcR Soc Victoria 78:181–196, pls 26–29.
Pisani D, Poling LL, Lyons-Weiler M, Hedges SB. 2004. The col-onization of land by animals: molecular phylogeny and diver-gence times among arthropods. BMC Biology 2:1.
Posada D, Crandall KA. 1998. MODELTEST: testing the modelof DNA substitution. Bioinformatics 14:817–8.
Rodriguez-Trelles F, Tarrio R, Ayala FJ. 2002. A methodologicalbias towards overestimation of molecular evolutionary timescales. Proc Natl Acad Sci USA 99:8112–5.
Roman J. 1990. l’ancetre Eocene des Scutellidae (Echinoidea;Clypeasteroida). In: De Ridder C, Dubois P, Lahaye M-C,Jangoux M, editors. Echinoderm research. Rotterdam, theNetherlands: A. A. Balkema. p 41–47.
Roman J, Struogo A. 1994. Echinoides du Libyen (Eocene infe-rieur) d’Egypte. Rev Paleobiol 13:29–57.
Ronquist F, Huelsenbeck JP. 2003. MRBAYES 3: Bayesianphylogenetic inference under mixed models. Bioinformatics19:1572–4.
Sanderson MJ. 2002. Estimating absolute rates of molecular evo-lution and divergence times: a penalized likelihood approach.Mol Biol Evol 19:101–9.
1850 Smith et al.

Sanderson MJ. 2004. r8s, version 1.70: user’s manual. Section ofevolution and ecology. Davis, CA: University of California.
Schultz H. 2005. Sea urchins. Hemdingen, Germany: Heinke &Peter Schulz. p 484.
Seilacher A. 1979. Constructional morphology of sand dollars.Paleobiology 5:191–221.
Smith AB. 1981. Implications of lantern morphology for thephylogeny of post-Palaeozoic echinoids. Palaeontology 24:779–801.
Smith AB. 1988. Phylogenetic relationship, divergence times, andrates of molecular evolution for camarodont sea urchins. MolBiol Evol 5:345–65.
Smith AB. 2001. Optimizing phylogenetic analysis by the inclu-sion of fossils: cassiduloid paraphyly and the origin of cly-peasteroid echinoids. Paleobiology 27:392–404.
Smith AB. 2006. The echinoid directory. London: The NaturalHistory Museum. [Electronic publication]. Available at: http://www.nhm.ac.uk/research-curation/projects/echinoid-directory.Accessed 24 Apr 2006.
Smith AB, Anzalone L. 2000. Loriolella, a key taxon for under-standing the early evolution of irregular echinoids. Palaeontol-ogy 43:303–24.
Smith AB, Hollingworth NTJ. 1990. Tooth structure and phylog-eny of the Upper Permian echinoid Miocidaris keyserlingi.Proc Yorkshire Geol Soc 48:47–60.
Smith AB, Jeffery CH. 2000. Maastrichtian and Palaeocene echi-noids: a key to world faunas. Spec Pap Palaeontol 63:1–406.
Smith AB, Lafay B, Christen R. 1992. Comparative variation inmorphological and molecular evolution through time: 28Sribosomal RNA versus morphology in echinoids. Phil TransR Soc Lond B 338:365–82.
Smith AB, Littlewood DTJ. 1997. Molecular and morphologicalevolution during the post-Palaeozoic diversification of echi-noids. In: Givnish TJ, Systma KJ, editors. Molecular evolutionand adaptive radiation. Cambridge: Cambridge UniversityPress. p 559–83.
Smith AB, Littlewood DTJ, Wray GA. 1996. Comparing patternsof evolution: larval and adult life-history stages and smallribosomal RNA of post-Palaeozoic echinoids. Phil Trans RSoc Lond B 349:11–8.
Smith AB, Peterson KJ. 2002. Dating the time of origin of majorclades: molecular clocks and the fossil record. Annu Rev EarthPlanet Sci 30:65–88.
Smith AB, Peterson KJ, Wray GA, Littlewood DTJ. 2004. Frombilateral symmetry to pentaradiality. The phylogeny of hemi-chordates and echinoderms. In: Cracraft J, Donoghue MJ, edi-tors. Assembling the tree of life. Oxford: Oxford UniversityPress. p 365–83.
Smith AB, Stockley B. 2005. Fasciole pathways in spatangoidechinoids: a new source of phylogenetically informative char-acters. Zool J Linn Soc 144:15–35.
Smith AB, Wright CW. 1990. British Cretaceous echinoids. Part2, Echinothurioida, Diadematoida and Stirodonta (1, Caly-cina). Palaeontogr Soc Monogr 101–198, pls 33–72.
Smith AB, Wright CW. 1996. British Cretaceous echinoids. Part4, Stirodonta 3 (Phymosomatoida 2) and Camarodonta. Palae-ontogr Soc Monogr 268–341, pls 93–114.
Stockley B, Smith AB, Littlewood DTJ, Lessios HA, MacKenzie-dodds JA. 2005. Phylogenetic relationships of spatangoid seaurchins (Echinoidea): taxon sampling density and congruencebetween morphological and molecular estimates. Zool Scr34:447–68.
Swofford DL. 2002. PAUP*. Phylogenetic analysis using parsi-mony (and other methods). Version 4. Sunderland, MA: Sina-uer Associates.
Takezaki N, Rzhetsky A, Nei M. 1995. Phylogenetic test of themolecular clock and linearized trees. Mol Biol Evol12:823–33.
Templeton A. 1983. Phylogenetic inference from restricted endo-nuclease cleavage site maps with particular reference to theevolution of humans and apes. Evolution 37:221–44.
Thorne JL, Kishino H. 2002. Divergence time and evolutionaryrate estimation with multilocus data. Syst Biol 51:689–702.
Thorne JL, Kishino H, Painter IS. 1998. Estimating the rateof evolution of the rate of evolution. Mol Biol Evol 15:1647–57.
Vadet A. 1999. Revision des echinides de Saint Cassian et evo-lution des echinides post-carboniferes. Mem Soc Acad Bou-lonnais Hist Nat 20:1–59.
Welch JJ, Fontanillas E, Bromham L. 2005. Molecular dates forthe ‘‘Cambrian explosion’’: the influence of prior assumptions.Syst Biol 54:672–8.
Wiens JJ. 1998. Combining data sets with different phylogenetichistories. Syst Biol 47:568–81.
Winchell CJ, Martin AP, Mallatt J. 2004. Phylogeny of elasmo-branches based on LSU and SSU ribosomal RNA genes. MolPhylogenet Evol 31:214–24.
Xia X, Xie Z, Kjer KM. 2003. 18S ribosomal RNA and tetrapodphylogeny. Syst Biol 52:283–95.
Yang, Z. 1997. PAML: a program package for phylogeneticanalysis by maximum likelihood. Comput Appl Biosci 13:555–6.
Herre Philippe, Associate Editor
Accepted May 16, 2006
Testing the Molecular Clock in Echinoids 1851