research article work and power analysis of the golf swing
TRANSCRIPT

©Journal of Sports Science and Medicine (2005) 4, 520-533 http://www.jssm.org
Research article
WORK AND POWER ANALYSIS OF THE GOLF SWING
Steven M. Nesbit and Monika Serrano
Department of Mechanical Engineering, Lafayette College, Easton, PA, USA Received: 16 June 2005 / Accepted: 10 October 2005 / Published (online): 01 December 2005
ABSTRACT A work and power (energy) analysis of the golf swing is presented as a method for evaluating the mechanics of the golf swing. Two computer models were used to estimate the energy production, transfers, and conversions within the body and the golf club by employing standard methods of mechanics to calculate work of forces and torques, kinetic energies, strain energies, and power during the golf swing. A detailed model of the golf club determined the energy transfers and conversions within the club during the downswing. A full-body computer model of the golfer determined the internal work produced at the body joints during the downswing. Four diverse amateur subjects were analyzed and compared using these two models. The energy approach yielded new information on swing mechanics, determined the force and torque components that accelerated the club, illustrated which segments of the body produced work, determined the timing of internal work generation, measured swing efficiencies, calculated shaft energy storage and release, and proved that forces and range of motion were equally important in developing club head velocity. A more comprehensive description of the downswing emerged from information derived from an energy based analysis. KEY WORDS: Golf biomechanics, work, energy, power, computer modeling.
INTRODUCTION Since the golf shot is one of the most difficult biomechanical motions in sport to execute, a detailed understanding of the mechanics of the swing would be beneficial to the golfer and teacher (Vaughn, 1979). Traditional and standard methods of biomechanical studies of golf swings have employed models of varying degrees of sophistication (Budney and Bellow, 1979; 1982; Jorgensen, 1970; Lampsa, 1975; Neal and Wilson, 1985; Penner, 2003; Vaughn, 1979; Williams, 1967) to perform kinetic analyses of the golfer. Generally, these models were limited to one or two rigid link (double pendulum) systems and constrained the motion to two dimensions. The double pendulum models were further limited by fixing the pivot point of the upper link. Notable exceptions are Vaughn (1979) who analyzed the three-dimensional (3D) mechanics of a swing using a rigid one-link club model and Milne and Davis (1992) who utilized a
two-link planar system with a flexible lower link to study shaft behavior. The traditional Newton’s Second Law kinetic approach was applied to these models and focused on determining the motions, forces and torques during the downswing (Dillman and Lange, 1994). Much useful information has been obtained concerning club trajectories, and force and torque profiles and their relation to skill level. However, this information provides insight to instantaneous forces and accelerations, not overall changes in velocity and energy transfer thus yielding a snapshot image of the swing dynamics. In addition, these models only provided information concerning the cumulative effects or output of the golfer’s swing. Inferences to specific body motions and their relative effects on the outcome of the golf swing are difficult and inexact without including the human in golf swing modeling. Although biomechanical analysis of the golf swing using computer modeling among other methods, has attracted considerable research, it has yet to produce

Work and power of the golf swing
521
a convincing explanation of the physics involved that makes a significant advance on the landmark work of Cochran and Stobbs, first published in 1968 (Farrally et al., 2003).
The fundamental purpose of the golf swing is to do work to generate club head kinetic energy which is ultimately transferred to the ball through impact. The golfer winds up during the backswing to create a distance over which positive forces and torques can be applied to the club thus creating a potential to do work. During the downswing, these forces and torques function to both control the club trajectory, and increase the velocity, or kinetic energy of the club by doing work. This work is done at an ever increasing rate of speed which is a measure of power. During the downswing, the club shaft flexes a great deal, storing and releasing strain energy. All the complex body segment motions and motion timings are intended to produce the maximum amount of useful work that can be transferred from the golfer to the golf club. Thus information about forces, torques, and accelerations are incomplete descriptions of golf swing mechanics unless viewed in the context of work, power, velocity, displacement, and energy.
From an analytical perspective, an energy analysis has the following advantages: Only the forces/torques that change the velocity of the club are taken into account, i.e., forces/torques that do no work are ignored; The cumulative effects of forces/torques applied over a distance are determinable which introduces factors such as range of motion, timing, and sustainability of forces/torques; The collective effect of various body motions can be summarized by looking at the output i.e., the energy transferred to the club and the resulting club velocity; The general efficiencies of the motions and energy transfer can be studied. While the advantages of studying the golf swing from an energy perspective seem clear, only Budney and Bellow (1982) have used energy values to analyze the swing. They compared the club kinetic energy and power at impact for four subjects using different clubs based upon a two link, two-dimensional (2D) rigid model.
It is the objective of this paper to present a study of the 3D mechanics of the club and body using an energy based approach to investigate the work, power, kinetic energy, strain energy, and efficiencies of the golf swing for four amateur subjects. From these data, hopefully a useful approach and perspective of the golf swing will emerge that can further our understanding of this most complex of sports motions. METHODS
Two computer-based models were created to study the energy production, conversions, and transfers during the golf swing. One model combines a variable full-body multi-link three-dimensional representation of a human with a simple, yet flexible model of a golf club. This model was used to determine the internal work produced at each of the joints during the downswing, and the total amount of work produced by the golfer. The second model is a detailed model of a club which accounts for the stepped shaft configuration, 3D flexibility characteristics, and full mass and inertia properties of the club head. This model was used to determine the work, power, kinetic energy, and strain energy transfers within the club during the swing. Both models were driven kinematically with subject swing data recorded using a motion analysis system. Output from the models formed the basis for a description and comparison of the swing “energy” mechanics and efficiencies of four amateur golfers of widely varying skill levels, body types, and swing styles.
Figure 1. Full-body model of golf swing.
FULL-BODY MODEL A full-body computer model of a human coupled to a simple model of a golf club (Figure 1) was used to study internal work generation and overall swing efficiency. A detailed description of the model development and verification can be found in Nesbit et al. (1994). The humanoid (android) model consists of fifteen rigid segments interconnected with spherical joints. A listing of these joints is given in Table 2. The individual body segments are ellipsoid in shape with the segment size, mass and inertia properties determined from gender, age, and overall body height and weight, or from local segment measurements using the GeBod data base accessible through the ADAMS software (Mechanical Dynamics, Inc., 2004). A notable generality of this model is the simplified

Nesbit
522
representation of the back and spine joints. The model divided the entire torso and spine into two segments and joints (lumbar and thoracic). A finer division was attempted, however severe marker crowding resulted, and tracking was compromised. A linear spring-damper scheme was used to model the contact between the feet and the ground with frictional forces added to provide traction. The model was balanced by kinematically driving the angular degrees-of-freedom (DOF) of the lower torso section (hips) relative to the global coordinate system. To avoid over-constraining the model, the linear DOF’s were set free. The golf club was represented as a simple flexible shaft connected to a rigid club head. The club was attached to the android via spherical joints (wrists) with flexible connectors to avoid a closed-loop configuration. All joints were driven kinematically using local relative spline data functions generated from subject swing data. Swing data were recorded at 200 Hz using a passive six camera digital motion analysis system (Figure 2). Reflective markers were placed at strategic locations on the golfer and club. The paths of the markers were recorded, processed, and analyzed to yield the global 1-2-3 Euler angle motions of each segment, and the club. These angles were then transformed into local relative alpha, beta, gamma Euler angles of each joint (Kane et al., 1983).
Figure 2. Motion analysis data. The body segment reference coordinate
systems, established when the subject is standing in the standard anatomical position, places the Z-axis pointing downward with the exception of the feet which point forward parallel to the long axis of the foot segment. The X-axis points outward from the body, and the Y-axis completing a right-handed coordinate system. Joint motions, forces, and torques are of the distal body segment coordinate system
relative to the proximal body segment coordinate system. The angular quantities are specified according to the relative body (Euler angle) 1-2-3 Bryant angle convention where alpha motion (α) is about the X-axis, beta motion (β) is about the Y’-axis, and gamma motion (γ) is about the Z’’-axis.
Verification of the full-body model was done in three phases. First, the simulated swing and joint motions of the model were compared to the motion analysis data and joint angle calculations. The joint angles for the model were calculated from the marker data. These joint angles were used to drive the joints of the model. The model simulations exactly reproduced the subjects’ motions in terms of joint angles and global swing motion providing kinematic verification of the model. Second, several test simulations were run to verify the joint forces and torques predicted by the model. Here several static and inverse dynamic test cases were applied to the model and compared to analytically predicted results. The static analyses consisted of posing the humanoid model in a variety of stationary positions (such as the arms straight out to the side) and having the model solve for the static torques and forces in the joints to support the segments against gravitational loads. The model results and analytically determined results were identical. Next, harmonic motions were applied to individual segments (inverse dynamic simulation) and the model determined joint torques were compared to analytically predicted joint torques. Both methods gave identical results. And third, the ground reaction forces predicted by the model were compared to force plate data. The one kinetic output of the model that could be directly and accurately measured was ground reaction forces. The vertical reaction forces measured by the force plates and predicted by the model were each summed for both feet and compared (Figure 3). Force plate data compared well with model calculated vertical ground reaction forces with a maximum difference of 7% (Nesbit et al., 1994). While this one corroboration of predicted load data from the model is certainly not complete, coupled with the other verifications, it does increase confidence in both the validity of the model, and its ability to predict internal loads and joint work.
Driving the joints of the model kinematically yields the internal reaction forces and driving torques at each joint. Since there is no relative linear motion at the joints, the linear forces do no work, thus from the joint angular kinematics and driving torques, the work done at each joint can be determined from Eqn (1):
intjoWork = dtTii
t
t)(1
2∑∫ •
rrω (1)
Where iωr
is the relative angular velocity vector, iTr

Work and power of the golf swing
523
Figure 3. Force plate data (dots) vs. model predicted ground reaction forces (line).
is the joint torque vector, and i is the alpha (medial/lateral), beta (anterior/posterior), and gamma (long-axis twisting) motion of each joint.
The time period of interest is from the top of the backswing (t1) to impact (t2). Using the body 1-2-3 Euler angle representation, the work of a joint can be determined by summing each separate angular movement over time as:
)()(
)(
00
0int
t
n
ttt
n
tt
t
n
ttjo
TT
TWork
γγββ
αα
γβ
α
−+−
+−=
∑∑
∑
∆+∆+
∆+
(2)
where n is the number of numerical time steps, γβα andTTT ,, are the torque components, t is time,
and t∆ is the time interval. The total work done by the golfer is
determined by summing the work done at each joint. This total work is compared to the work required to swing the club (determined from the detailed club model) to estimate an overall swing efficiency. Joint power can be determined by substituting the angular velocities for the joint angles in Eqn (2).
CLUB MODEL A detailed model of the club was developed to study the energy transfers, conversions, and storage more closely than could be determined from the limited club model contained in the full-body model. This 3D club model has a flexible stepped shaft joined to a rigid club head. The shaft was made up of 15 rigid sub-segments connected by massless 3D beam elements. The mass, inertia, and flexibility properties for the shaft sub-segments were
calculated using standard analytical methods. This detailed modeling approach for the golf club agrees with the dynamic modeling methods presented by Friswell and Mottershead (1998). Global shaft damping was determined experimentally by fixing the grip end of a club in a cantilever manner, deflecting the club head, and measuring the rate of amplitude decay. This value was assumed to apply to all shaft sub-segments. The rigid club head segment (which includes the hosel section) contains the representative mass, center of gravity (CG) location, and 3x3 inertia tensor. Determination of club head mass and inertia properties was done using either solid modeling techniques described by Oglesby et al. (1992) or experimental methods (Johnson, 1994).
The club model was driven in free space using artificial drivers consisting of three translational joints (X, Y, and Z) and three revolute joints (alpha, beta, and gamma). The revolute drivers were configured in series to match the joint angular motions with the Euler 1-2-3 (alpha, beta, and gamma) relative body angle representation. This angle representation works well for the golf swing as the alpha angle represents the main swing motion, the beta angle is the pitch of the swing plane, and the gamma angle is the roll about the long axis of the shaft.
A triad of markers were fixed to the club just below the golfer’s hands (see triangles in Figure 2). These data were recorded with the Motion Analysis System at 200 Hz. The global X, Y, Z path of the hands and the relative alpha, beta, and gamma Euler angles were determined from these data. The six joints were driven kinematically with cubic spline functions from this swing data to reproduce the subject’s swing (Figure 4).

Nesbit
524
Figure 4. Superimposed animation of club model.
The solution of the club model predicts the
external forces and torques applied by the golfer at the grip of the club, the global trajectories (and derivatives) of the shaft segment and club head CG’s, the relative strains of adjacent shaft segments, and the segment interaction forces and torques. These data allow for the accurate global and component determination of the work, power, and kinetic and strain energies of the club during the swing through the application of the 3D work and energy equation, and its derivative. The work and energy balance is described in terms of the work transferred from the golfer to the club from applied external forces and torques, and the resulting change in kinetic and strain energies in the golf club, and can be written as:
lubcGolferWork → =
lub)(1
2ciii
t
t i KEdtTVF ∆=•+• ∑∫ ∑ ωrrrr
shaftSE∆− (3)
Where iFr
is external applied force vector, iVr
is the linear velocity vector at the point of application, iω
r is the angular velocity vector of the
grip segment, iTr
is the external applied torque vector, and i is the three linear force and velocity vector components (x, y, and z) and three angular velocity and torque vector components (α, β, and γ). Power is determined by taking the derivative with respect to time of Eqn (3).
The kinetic energy expression for the golf club is broken down into the multi-segment shaft (n segments) and the club head. The kinetic energy of the shaft is determined by the expression:
)(21
21 2222
jjijyjjxjgjjshaft IIIVMKE γβα ωωω +++= (4)
where nj →=1 sub-segments, jM is the mass of
a shaft sub-segment, jiV is the magnitude of a sub-
segment CG linear velocity, xjI , yjI , and zjI are the diagonal terms of a sub-segment inertia tensor, and jαω , jβω , and jγω are the components of the angular velocity vector of a sub-segment. The kinetic energy of the club head is determined by the expression:
)222
(21
21 2222
γαγββα
γβα
ωωωωωω
ωωω
xzyzxy
zyxghhhead
III
IIIVMKE
++
++++= (5)
where xyI , etc. are the cross-products of inertia terms for the club head. The total kinetic energy of the club is the sum of Eqns (4) and (5).
The strain energy is stored and released by the combined bending, torsion, and to a small degree, elongation of the shaft. The different bending modes encountered during the swing require that the strain energy be calculated on a per segment basis. This energy can be closely approximated with the following superposition expression:
( )∑=
+++=n
jAjAjjjyjyjxjxjshaft KKKKSE
1
2222 δδδδ γγ (6)
where the δ ’s are the relative bending (x and y), torsional (γ), and axial (A) deflections, and the K’s are the associated spring constants which are determined using standard formulas for a hollow cylinder.
The equations of motion and supplemental work, power, and energy equations for both models were solved using a Wielenga Stiff Numerical Integrator contained in the ADAMS software program (Mechanical Dynamics Inc., 2004). The ADAMS program also provided the basic modeling elements (joints, rigid bodies, flexible elements, spring/damper systems, android, and kinematic constraints), the graphical representations of the modeling elements, the animation of the swing, and the post-processing of results.
Subjects Four amateur golfers were analyzed using the computer models. All subjects were right-handed and their relevant data are given in Table 1. A diversity of skill levels and swing styles was the criteria for selecting subjects in an effort to identify how these differences would be revealed in the energy characteristics of the swing. Subjects 1 and 2 had aggressive, powerful, and quick swing styles, whereas subjects 3 and 4 had smoother, longer, and slower swings. All subjects used the same club (driver). Informed consent for the following procedure was obtained from all the subjects. Each subject had reflective markers placed upon their body. A rigid triad of markers was attached to the club near the top of the shaft. The Motion Analysis

Work and power of the golf swing
525
Table 1. Subject data for detailed comparison. Subject Age
(years) Height
(m) Weight
(kg) Handicap Experience
(years) Round
per Year #1 Male 42 1.83 86.3 0 (scratch) 24 150 #2 Male 35 1.79 93.1 5 20 100 #3 Male 21 1.88 74.9 13 7 120 #4 Female 31 1.70 59.0 18 11 50
system was calibrated until the combined 3D residual for all cameras was under 1.00mm. (Test/retest of static marker locations varied by less than 0.20mm for a given calibration.). The subjects were asked to execute a series of swings that included hitting a ball into a net. The subjects were advised to swing the club in a manner similar to hitting a driver in a competitive situation where distance and accuracy were both important. The subjects were instructed to practice swinging the club as many times as necessary until they became comfortable with the testing situation and felt they could swing “normally” and consistently. Subsequently, several swings from each subject were recorded and tracked then presented to the subjects for their review. It was found that the club head velocities were consistent among the trials within a maximum range of 5% for all subjects. The subjects each selected what they considered to be their most representative swing in terms of club head velocity, impact feel, partial flight of the ball, and overall visual assessment of the motion capture data. This single self-selected swing from each subject was used for the work and power analyses, comparisons, and discussions that follow. RESULTS The output of the full-body model is presented in
Table 2, and in Figures 5 and 6. Table 2 presents the work of each joint, and the total work of the body. The data in Table 2 is the work done from the top of the back swing (determined to be the time when the hands change direction) to impact. These data are also shown graphically in Figure 5 which emphasizes the joint work differences among the subjects. Figures 6a through 6d graphically illustrate the timing of the peak work of each joint for each subject. Superimposed on the data in the figures is a 2nd order polynomial curve which highlights the character of the sequential movement of work of the joints.
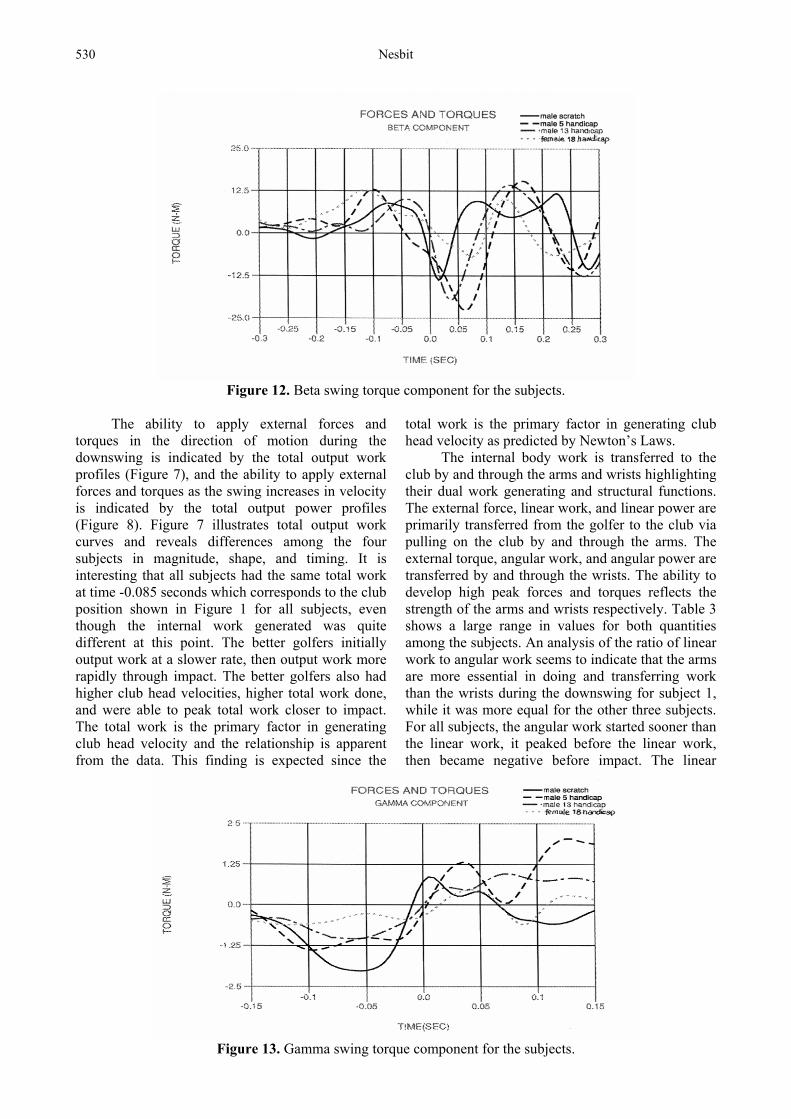
The output from the club model is presented in Table 3, and in Figures 7 through 13. Table 3 gives the total work and peak power (and components of each), maximum external force and torque, and impact club head velocity for each subject. In addition, the peak kinetic and strain energies of the club, and the overall swing efficiency are given. (The swing efficiency is the ratio of total work of the club divided by the total body work). The work and power profiles of the subjects are plotted from the top of the backswing through follow-through in Figures 7 and 8 respectively (impact is at time zero). The total, linear, and angular work and power profiles for Subject 1 are plotted in Figures 9 and 10. Figures 11, 12, and 13 plot the alpha, beta, and gamma swing torque components for the subjects.
Table 2. Full-Body Model work data (Nm).
Body/Joint Work Male Scratch Male 5 Hand Male 13 Hand Female 18 Hand Total Body Work 1452 % total 1429 % total 1105 % total 878 % total Right Ankle 19.8 (1.36) 17.0 (1.19) 11.3 (1.02) 7.0 (0.80) Left Ankle -2.4 (-.17) -3.3 (-.23) -0.8 (-0.07) 0.4 (0.05) Right Knee 38.4 (2.64) 44.1 (3.09) 34.0 (3.08) 24.4 (2.78) Left Knee -4.2 (-.29) -6.5 (-.45) -2.2 (-0.20) -2.6 (-0.30) Right Hip 297 (20.45) 277 (19.38) 190 (17.19) 156 (17.77) Left Hip 126 (8.68) 110 (7.70) 98 (8.87) 104 (11.85) Lumbar 342 (23.55) 379 (26.52) 271 (24.52) 187 (21.30) Thoracic 277 (19.08) 266 18.61) 215 (19.46) 156 (17.77) Right Shoulder 63 (4.34) 71 (4.97) 61 (5.52) 49 (5.58) Left Shoulder 57 (3.93) 47 (3.29) 40 (3.62) 35 (3.99) Right Elbow 125 (8.61) 129 (9.03) 110 (9.95) 101 (11.50) Left Elbow 23 (1.58) 25 (1.75) 15 (1.36) 11 (1.25) Right Wrist 56 (3.86) 45 (3.15) 42 (3.80) 34 (3.87) Left Wrist 34 (2.34) 29 (2.03) 21 (1.90) 16 (1.82)

Nesbit
526
Work of Joints
-50
0
50
100
150
200
250
300
350
400
Rig
ht A
nkle
Left
Ank
le
Rig
ht K
nee
Left
Kne
e
Rig
ht H
ip
Left
Hip
Lum
bar
Thor
acic
Rig
ht S
houl
der
Left
Shou
lder
Rig
ht E
lbow
Left
Elbo
w
Rig
ht W
rist
Left
Wris
t
Wor
k (N
.m)
Male ScratchMale 5 HandMale 13 HandFemale 18 Hand
Figure 5. Work of joints of subjects.
DISCUSSION The following data from Table 3 have been previously reported in the literature; club head velocities, swing torques, interaction forces, total club work, total club kinetic energy, and total club power. The relevant references are listed in the last column of Table 3. In all cases, the reported values are for one subject only with the exception of Budney and Bellow (1982) who reported values for four subjects. The models used were all two-link, two-dimensional, rigid models with the exception of Vaughn (1979) who used a one-link rigid three-dimensional model. There appears to be sufficient agreement among the reported values and the data
predicted by the club model to yield confidence in the model output. For the full-body model, none of the data reported in Table 2 and Figures 5 and 6, have been previously reported. The verifications of the full-body model discussed previously yield some confidence in the model output.
For the purposes of discussing the generation and transference of work within the body, the joints and body segments closer to the ground will be referred to as distal, and the ones closer to the club are referred to as proximal. In addition, the reader must keep in mind that the discussions that follow are based upon the analyses of a single swing from each subject. Referring to the data given in Table 2, the generation of work comes primarily from the
Table 3. Club Model Data. Data Type Units Male
Scratch Male 5H
Male 13H
Fem 18H
Reference Values
Club Head Vel m·s-1 52.0 49.7 46.3 42.1 49.51, 40.52, 42.63, 42.74,51.05, 52.66,43.57
Max Torque Nm 42.1 36.8 24.6 24.0 21.84, 52.05
Max Force N 512 453 390 304 4761, 4004, 3645, (266-364)6
Total Work Nm 355 289 288 235 220.84
Max Lin Work Nm 206 155 140 114 - Max Ang Work Nm 146 134 148 121 - Lin/Ang Work Ratio 1.41 1.16 .95 .94 - Peak Power Nm·s-1 3875 3005 2310 1720 30002, 27504, (2530-3640)6
Peak Lin Power Nm·s-1 2775 2316 1402 1188 - Peak Ang Power Nm·s-1 1150 890 1078 698 - Lin/Ang Power Ratio 2.41 2.60 1.30 1.70 - Peak Kinet Engy Nm 334 302 264 216 (266-311)6, 2977
Peak Strain Engy Nm 3.7 3.4 2.9 2.5 - Swing Efficiency % 24.5 20.2 26.1 26.8 - 1 Williams (1967), 2 Cochran and Stobbs (1969), 3 Jorgensen (1970), 4 Budney and Bellow (1979), 5 Vaughn (1979), 6 Budney and Bellow (1982), 7 Jorgensen (1994).

Work and power of the golf swing
527
a) Timimg of Peak Work of Joints
Male Scratch Handicapy = 0.0014x2 - 0.035x + 0.2209
R2 = 0.9755
00.020.040.060.080.1
0.120.140.160.180.2
Left
Ank
le
Rig
ht A
nkle
Left
Kne
e
Rig
ht K
nee
Left
Hip
Rig
ht H
ip
Lum
bar
Thor
acic
Left
Sho
ulde
r
Rig
ht S
houl
der
Left
Wris
t
Left
Elb
ow
Rig
ht E
lbow
Rig
ht W
rist
Tota
l
Tim
e Be
fore
Impa
ct (s
)
b)
Timing of Peak Work of JointsMale 5 Handicap y = 0.0012x2 - 0.0288x + 0.1815
R2 = 0.9229
00.020.040.060.080.1
0.120.140.160.18
Rig
ht K
nee
Left
Ank
le
Left
Kne
e
Rig
ht A
nkle
Rig
ht H
ip
Left
Hip
Lum
bar
Left
Sho
ulde
r
Thor
acic
Rig
ht S
houl
der
Left
Wris
t
Rig
ht W
rist
Tota
l
Left
Elb
ow
Tim
e Be
fore
Impa
ct (s
)
c)
Timing of Peak Work of JointsMale 13 Handicap y = 0.0008x2 - 0.0214x + 0.1464
R2 = 0.952
0
0.02
0.04
0.06
0.08
0.1
0.12
0.14
Left
Kne
e
Rig
ht K
nee
Left
Ank
le
Rig
ht A
nkle
Lum
bar
Left
Hip
Thor
acic
Rig
ht H
ip
Left
Sho
ulde
r
Rig
ht S
houl
der
Tota
l
Rig
ht W
rist
Left
Wris
t
Left
Elb
ow
Rig
ht E
lbow
Tim
e Be
fore
Impa
ct (s
)
d)Timing of Peak Work of Joints
Female 18 Handicap y = 2E-05x2 - 0.0075x + 0.0909R2 = 0.9886
-0.04
-0.02
0
0.02
0.04
0.06
0.08
0.1
Rig
ht A
nkle
Left
Ank
le
Rig
ht K
nee
Left
Kne
e
Rig
ht H
ip
Left
Hip
Thor
acic
Lum
bar
Left
Sho
ulde
r
Rig
ht S
houl
der
Rig
ht E
lbow
Left
Elb
ow
Tota
l
Rig
ht W
rist
Left
Wris
tTim
e Be
fore
Impa
ct (s
)
Figure 6. Timing of peak work of male scratch handicap (a), 5 handicap (b), 13 handicap (c) and 18 handicap (d).
back (lumbar and thoracic) and hip joints generating 71.8, 72.2, 70.0, and 68.7 percent of the total body work for the four subjects respectively. This core body work is generated by high alpha and gamma torques (much higher in the right hip than left hip) over the entire range of motion of the hip joints, and moderate but consistent gamma torques applied over the considerable twisting range of motion of the
spine. This core generation of work is evident in the first rocking then twisting of the hips, the lifting of the right heel to further this motion, the wide stance to support the high hip torques, and substantial gamma angle pre-twist and powerful release of the back, a characteristic of a more skilled golfer (Cheetham et al., 2001). The analysis of the core body segments by Watkins et al. (1996) using
Figure 7. Total output work during downswing.

Nesbit
528
Figure 8. Total output power during downswing.
dynamic surface electrode electromyography supports the importance of the trunk muscles in stabilizing and controlling the loading response for maximal power and accuracy in the golfer's swing.
The secondary source of the body work comes from the joints of the shoulders and arms accounting for 24.7, 24.2, 26.2, and 28.0 percent of the total body work for the subjects respectively. These upper body joints generate their work primarily through large displacements, especially the right elbow, and in the case of the right wrist and shoulder, two degree-of-freedom motion (alpha and gamma). Of all the upper body joints, the right elbow does by far the most work. The joint torques of the upper body are substantially lower than for the core joints. Power is an important factor here as these are the fastest moving joints, especially the wrists.
The leg joints generate the remainder of the body work (3.6, 3.6, 3.8, and 3.3 percent for the subjects respectively). These leg joints function to support the rest of the body, and move in such a way to facilitate motion of the hip joints.
The generation of work and its transference to the club appears to be a bottom up phenomenon (upward and outward) where a type of segmental summation of work occurs as the swing progresses from the legs, through the hips, lower back, upper back, shoulders, arms, then wrists. The work generation in each joint generally peaks in the same order from distal to proximal (see Figures 6a through 6d). The work of the individual joints then stops increasing or starts to reduce as the motion, i.e. work and energy is transferred upward, and the more distal joints change their function from doing work, to providing static support, or move slightly in the opposite direction (doing negative work). In addition, for right handed players, the right side joints do more work and for a longer period of time, than the left side joints. This difference in timing causes the left side of the body to decelerate sooner than the right side, a key factor in the familiar rocking motion during the later portion of the downswing. The superimposed second order polynomial curves of Figures 6a through 6d indicate
Figure 9. Components of output work for subject 1.

Work and power of the golf swing
529
Figure 10. Components of output power for subject 1.
the general movement of time of maximum work in the downswing in the distal joint to proximal joint direction. The scratch golfer had the most parabolic curve meaning he produced the maximum work in the lower extremities and core joints earlier in the downswing relative to the other subjects. The curves for the other subjects became progressively more linear as skill level decreased indicating a more uniform upward movement of body work.
The data suggests that the generation of joint work is mostly dependent upon range of motion of the joint, and the ability to maintain smooth and consistent torques over the range of motion. Power thus becomes an important factor in the ability to do work as the speed of the swing increases. The better player in this small group (subject 1) was able to maintain more consistent and higher sustained torque values at each joint thus generating the most work. In general, subjects 1 and 2 generated much higher joint torque values than subjects 3 and 4, and their torque profiles during the work generation stages were somewhat trapezoidal in shape. On the
other hand, subjects 3 and 4 had significantly lower torque values, and their profiles were more triangular in shape during the work generation stage. Subjects 3 and 4 had slightly greater ranges of motion in almost every joint over subjects 1 and 2.
An important measure of the efficiency of the golf swing is how much of the internal work is transferred to the golf club. Based upon the overall efficiency values, most of the work produced within the joints is not transferred to the club, but used to move the segments of the body. Subjects 3 and 4 who had the smoother style swings, had the higher overall efficiencies, although the consistency among subjects was quite surprising. Even though subjects 3 and 4 were not as skilled golfers in terms of their handicap as the other two subjects, it appears that they were better able to maximize the potential of their bodies to do useful work through increased range of motion to compensate for lower joint torque values, and through the smoothness of their swing styles, more of this work was transferred from the body to the club.
Figure 11. Alpha swing torque component for the subjects.
Nesbit
530
Figure 12. Beta swing torque component for the subjects.
The ability to apply external forces and
torques in the direction of motion during the downswing is indicated by the total output work profiles (Figure 7), and the ability to apply external forces and torques as the swing increases in velocity is indicated by the total output power profiles (Figure 8). Figure 7 illustrates total output work curves and reveals differences among the four subjects in magnitude, shape, and timing. It is interesting that all subjects had the same total work at time -0.085 seconds which corresponds to the club position shown in Figure 1 for all subjects, even though the internal work generated was quite different at this point. The better golfers initially output work at a slower rate, then output work more rapidly through impact. The better golfers also had higher club head velocities, higher total work done, and were able to peak total work closer to impact. The total work is the primary factor in generating club head velocity and the relationship is apparent from the data. This finding is expected since the
total work is the primary factor in generating club head velocity as predicted by Newton’s Laws.
The internal body work is transferred to the club by and through the arms and wrists highlighting their dual work generating and structural functions. The external force, linear work, and linear power are primarily transferred from the golfer to the club via pulling on the club by and through the arms. The external torque, angular work, and angular power are transferred by and through the wrists. The ability to develop high peak forces and torques reflects the strength of the arms and wrists respectively. Table 3 shows a large range in values for both quantities among the subjects. An analysis of the ratio of linear work to angular work seems to indicate that the arms are more essential in doing and transferring work than the wrists during the downswing for subject 1, while it was more equal for the other three subjects. For all subjects, the angular work started sooner than the linear work, it peaked before the linear work, then became negative before impact. The linear
Figure 13. Gamma swing torque component for the subjects.

Work and power of the golf swing
531
work peaked at or near impact for all subjects. The large range in output torque and force values among subjects are tempered by each subject’s ability to maintain these forces and torques over the range of motion of the downswing. In other words, it is their ability to do work with these forces and torques that determines the club head velocities. Thus the differences in club head velocities is not nearly as pronounced as the differences in forces and torques would imply.
Figure 8 reveals differences among the subjects in the magnitude, shape, and timing of the total output power profiles. Total power is approximately the same until -0.12 seconds which roughly corresponds to the vertical position of the club. The power then peaks at different times prior to impact for each subject. More importantly, the scratch golfer was able to zero his power output at impact resulting in maximum work output. The differences in total power are quite significant as is the balance between angular and linear power components. The arms are more important for generating power than the wrists for all subjects, especially the first two subjects. The angular power peaks prior to the linear power for each subject. Because the wrist joints cannot keep up with the angular speed of the club, they actually retard the angular motion of the club just prior to impact resulting in the straightening of the club and the release of its stored strain energy.
This analysis revealed large differences in output work, power, forces, and torques among the subjects. These differences do translate to differences in club velocity, however not to the degree one would expect. Factor in the higher losses associated with impact and aerodynamic drag at higher club speeds and the results are driving distances that are not that different. This observation is especially important for the individual golfer to realize as swinging the club “harder” may do little to improve driving distance. In fact, it may be more difficult to do useful work with tight muscles, and the cost associated with increased effort is often a reduction in accuracy. This is popular advice given by golf instructors, but often seems counter-intuitive and sometimes difficult for novices to follow.
A further analysis was done on subject one’s output work (Figure 9), output power (Figure 10), and swing torque components (Figures 11, 12, and 13). The total work peaks at 0.004 seconds prior to impact. The linear work peaks at impact, and the angular work peaks at 0.02 seconds before impact. As the progression of body work moves proximally through the arms and wrists toward the club, the club motion is initiated with a pulling along the shaft while simultaneously doing positive alpha wrist torque work. The positive rotational work starts
sooner in the downswing as the wrists work to rotate the club away from the body. The linear work is initially negative which is caused by the upper body twisting ahead of the pulling on the club resulting in the shoulder joints moving a small amount in the (relative) negative direction. As the downswing progresses the arms move forward relative to the upper body causing the linear work to become positive. The linear component of work soon overtakes the angular work and ends up contributing far more to the total work (by a 1.41:1 ratio). Throughout this transition from wrist work to arm work, the total work smoothly increases causing the club to accelerate to impact. While the club head moves away from the body, the action of the external linear force becomes less directed at speeding up the club and more toward controlling the path of the grip point, a finding supported by Miura (2001). By the time impact is reached, this linear force is maximized and perpendicular to the path of the club head in the plane of the swing. At this time the linear force is reacting to the centrifugal loading of the club thus doing no more work thereby maximizing the linear work at impact.
About the time the club becomes vertical in the downswing, positive gamma torque work is initiated to square up the club head for impact, and positive beta torque work is applied to pitch the club forward. From this position up until the club shaft is roughly parallel with the ground, all the torque work components increase smoothly. From the parallel position to impact, which coincides with the uncocking of the wrists, the torque components rapidly decrease. All the torque components pass through zero before impact causing the rotational work to be maximized then decrease by impact. It is at this point that the wrists approximate a ‘free hinge” configuration as the golfer merely holds on to the club as its momentum carries it to impact. By the time impact is reached, all torque components are reversed thus doing negative work simply because the wrists cannot keep up with the rotational speed of the club at this time in the downswing. The club head does not slow down however, as the straightening of the shaft continues to accelerate the club head. The club head deflection passed through zero at impact releasing about half of the shaft stored strain energy, and resulting in the club head velocity peaking exactly at impact.
The amount of strain energy absorbed and then released during the downswing is a very small percentage of the work transferred to the club (see Table 3). Subjects 1 and 2 stored and ultimately released much more strain energy than subjects 3 and 4. The maximum stored strain energy occurred when the club shaft was roughly parallel with the ground and bending in the first mode (cantilever

Nesbit
532
mode) for all subjects. At this point in the downswing, the shaft is at its maximum pre-impact deflection for these subjects. At or near impact, the club head returns to its undeflected position returning much of its stored shaft strain energy into club head kinetic energy. The shaft does remain deformed in the second mode shape which retains about half of the maximum stored strain energy for all subjects. This two mode deflection phenomenon is discussed in Horwood (1994). CONCLUSIONS This paper presented a study of the 3D mechanics of the golf swing using an energy based approach to investigate the work, power, kinetic energy, strain energy, energy conversions, and efficiencies of the body joints and the club. This energy approach in combination with a detailed club model and a full-body model yielded new information on swing mechanics, determined the force and torque components that accelerated the club, illustrated which segments of the body produced work, determined the timing of internal work generation, measured swing efficiencies, calculated shaft energy storage and release, and proved that forces and range of motion are equally important in developing club head velocity. The energy information derived from the models made it possible to describe and characterize the swings of four diverse subjects, and to identify how differences in swing style and skill level were revealed in the motion, force, and energy characteristics of the swing. The general energy information made it possible to provide a more comprehensive mechanical description of the downswing. ACKNOWLEDGEMENT This work was supported by grants from the United States Golf Association and the National Science Foundation. REFERENCES Budney, D.R. and Bellow, D.G. (1979) Kinetic analysis
of a golf swing. Research Quarterly 50(2), 171-179.
Budney, D.R. and Bellow, D.G. (1982) On the swing mechanics of a matched set of golf clubs. Research Quarterly for Exercise and Sport 53(3), 185-192.
Cheetham, P.J., Martin, P.E., Mottram, R.E. and St. Laurent, B.F. (2001) The importance of stretching the 'X-Factor' in the downswing of golf: the 'X-Factor stretch'. In: Optimising performance in golf. Ed: Thomas, P.R. Brisbane, QLD: Australian Academic Press. 192-199.
Cochran, A. and Stobbs, J. (1969) The search for the perfect swing. New York: J.P. Lippincott Co.
Dillman, C.J. and Lange, G.W. (1994) How has biomechanics contributed to the understanding of the golf swing? Proceedings of the 1994 World Scientific Congress of Golf, St. Andrews, Scotland. Eds: Cochran, A.J. and Farrally, M.R. 1-13.
Farrally, M.R., Cochran, A.J., Crews, D.J., Hurdzan, M.J., Price, R.J., Snow, J.T. and Thomas, P.R. (2003) Golf science research at the beginning of the twenty-first century. Journal of Sports Sciences 21(9), 753-765.
Friswell M.I. and Mottershead J.E. (1998) Dynamic models of golf clubs. Sports Engineering 1, 41-46.
Horwood, G.P. (1994) Golf shafts – a technical perspective. Proceedings of the 1994 World Scientific Congress of Golf, St. Andrews, Scotland. Eds: Cochran, A.J. and Farrally, M.R. 247-258.
Johnson, S.H. (1994) Experimental determination of inertia ellipsoids. Proceedings of the 1994 World Scientific Congress of Golf, St. Andrews, Scotland. Eds: Cochran, A.J. and Farrally, M.R. Farrally. 290-295.
Jorgensen, T. (1970). On the dynamics of the swing of a golf club. American Journal of Physics 38(5), 644-651.
Jorgensen, T. (1994) The physics of the golf swing. API Press, New York.
Kane, T.R., Likins, P.W. and Levinson, D.A. (1983) Spacecraft dynamics. New York: McGraw-Hill Co.
Lampsa, M.A. (1975) Maximizing distance of the golf drive: an optimal control study. Journal of Dynamic Systems, Measurement, and Control, Transactions ASME 97 (Series G), Dec: 362-367.
Mechanical Dynamics, Inc. (2004) User’s Manual, Ann Arbor, Michigan.
Milne, R.D. and Davis, J.P. (1992) The role of the shaft in the golf swing. Journal of Biomechanics 25, 975-983.
Miura, K. (2001) Parametric acceleration - the effect of inward pull of the golf club at impact stage. Sports Engineering 4(2), 75-83.
Neal, R.J. and Wilson, B.D. (1985) 3D kinematics and kinetics of the golf swing. International Journal of Sport Biomechanics 1(3), 221-232.
Nesbit, S.M., Cole, J.S., Hartzell, T.A., Oglesby, K.A. and Radich, A.F. (1994) Dynamic model and computer simulation of a golf swing. Proceedings of the 1994 World Scientific Congress of Golf, St. Andrews, Scotland. Eds: Cochran, A.J. and Farrally, M.R. 71-76.
Oglesby, K.A. Cole, J.S. and Nesbit, S.M. (1992). Parametric ANSYS model of golf clubs. Proceeding of the 1992 ANSYS Technical Conference. Pittsburgh, PA, USA.
Penner, A.R. (2003) The physics of golf. Reports on Progress in Physics Annual 66(2), 131-136.
Vaughn, C.L. (1979) A three-dimensional analysis of the forces and torques applied by a golfer during the downswing. Biomechanics VII-B. University Park Press. Warsaw, Poland. 325-331.
Watkins, R.G., Uppal, G.S., Perry, J., Pink, M. and Dinsay, J.M. (1996) Dynamic electromyographic

Work and power of the golf swing
533
analysis of trunk musculature in professional golfers. The American Journal of Sports Medicine 24(4), 535-539.
Williams, D. (1967) The dynamics of the golf swing. Quarterly Journal of Mechanics and Applied Mathematics 20, 247-255.
AUTHORS BIOGRAPHY
Steven M. NESBIT Employment Associate Professor and Head, Department of Mechanical Engineering, Lafayette College, Easton, PA, USA Degrees PhD, PE, MS, BS Research interests Sports Biomechanics, mechanisms, computer modelling Email: [email protected]
Monika SERRANO Employment Mechanical Engineer Degrees BS Research interests Sports biomechanics. Email: [email protected]
KEY POINTS
• Full-Body Model of the golf swing. • Energy analysis of the golf swing. • Work of the body joints dDuring the golf
swing. • Comparisons of subject work and power
characteristics.
Dr. Steven M. Nesbit
Associate Professor and Head, Department of Mechanical Engineering, Lafayette College, Easton, PA, USA