research article statistical downscaling of era-interim
TRANSCRIPT
Research ArticleStatistical Downscaling of ERA-Interim Forecast PrecipitationData in Complex Terrain Using LASSO Algorithm
Lu Gao123 Karsten Schulz4 and Matthias Bernhardt3
1 College of Geographical Sciences Fujian Normal University Fuzhou 350007 China2 Fujian Provincial Engineering Research Center for Monitoring and Assessing Terrestrial Disasters Fuzhou 350007 China3Department of Geography Ludwig-Maximilians-Universitat Munchen 80333 Munich Germany4 Institute of Water Management Hydrology and Hydraulic Engineering University of Natural Resources and Life Sciences1190 Vienna Austria
Correspondence should be addressed to Lu Gao lgaofoxmailcom
Received 27 March 2014 Revised 21 June 2014 Accepted 23 June 2014 Published 10 July 2014
Academic Editor Lian Xie
Copyright copy 2014 Lu Gao et al This is an open access article distributed under the Creative Commons Attribution License whichpermits unrestricted use distribution and reproduction in any medium provided the original work is properly cited
Precipitation is an essential input parameter for land surface models because it controls a large variety of environmental processesHowever the commonly sparsemeteorological networks in complex terrains are unable to provide the information needed formanyapplicationsTherefore downscaling local precipitation is necessary To this end a newmachine learningmethod LASSOalgorithm(least absolute shrinkage and selection operator) is used to address the disparity between ERA-Interim forecast precipitation data(025∘ grid) and point-scalemeteorological observations LASSOwas tested and validated against other three downscalingmethodslocal intensity scaling (LOCI) quantile-mapping (QM) and stepwise regression (Stepwise) at 50 meteorological stations locatedin the high mountainous region of the central AlpsThe downscaling procedure is implemented in two steps Firstly the dry or wetdays are classified and the precipitation amounts conditional on the occurrence of wet days are modeled subsequently Comparedto other three downscaling methods LASSO shows the best performances in precipitation occurrence and precipitation amountprediction on average Furthermore LASSO could reduce the error for certain sites where no improvement could be seen whenLOCI and QM were used This study proves that LASSO is a reasonable alternative to other statistical methods with respect to thedownscaling of precipitation data
1 Introduction
Precipitation is one of the most important variables fora large variety of environmental processes and its spatialand temporal variations directly influence the local as wellas the global water energy and matter cycle (eg [1ndash6])Precipitation is also an essential input parameter for landsurface models in fields such as in hydrology ecology andclimatology [7ndash9] Traditionally precipitation is measuredby rain gauges However most of them are located inhomogeneous terrains and in valley regions In complexterrains few gauge stations exist due to difficulties in snowdepth measuring and maintenance of stations which resultin a lack of long-term and high resolution records [10] Inorder to overcome these limitations in the past decadesGCMs have been widely applied to meet the specific needs
of environmental impact models by providing time series ofprecipitation and plausible scenarios of change [8 11]
However it is well known that the coarse spatial reso-lution (sim300 km) of GCMs limits the reliable use of thesedata in decision making and model based impact stud-ies [12ndash15] Specifically GCMs only provide precipitationcharacteristics that are based on the mean elevation of thepixel thus not considering subgrid variability of topographyand consequent atmospheric features Local processes suchas orographic precipitation along mountain slopes are notrepresented in the coarse grids [12] Even if RCMs nested inGCMs provide better descriptions of local scale characteris-tics based on the finer spatial resolution of 10ndash50 km theydo not fulfill the requirement of hydrological and climaticimpact models which typically run on the scale of 01ndash1 km[11 16ndash21] Thus correction and downscaling are necessary
Hindawi Publishing CorporationAdvances in MeteorologyVolume 2014 Article ID 472741 16 pageshttpdxdoiorg1011552014472741
2 Advances in Meteorology
AIG
WYN
KLO
ALT
SHAGUTREH
LUZ
CGIPUY
VAD
SIO
NEU
WAE
PAY
GLA
TAESMA
CHU
INT
FAH RUE
VIS
STG
PIO
CDF
ENG
ROB
DISFRE SCU
ULR
NAP
DAV
CHA
ZER
SBE
CIM
DOLSAMMLS
PIL
GUE
GSB
SAE
WFJ
COV
BER
GVE MVE
800 20 40(km)
France
N Germany
Italy
Switzer land
6∘E 7
∘E 8∘E 9
∘E 10∘E
6∘E 7
∘E 8∘E 9
∘E 10∘E
46∘N
47∘N
46∘N
47∘N
MeteoSwiss stationElevation (m)
ERA-Interim pointHigh 4783
Low 22
Figure 1 Location of the MeteoSwiss sites (triangles) and ERA-Interim 025∘ times 025∘ points (dots) The elevation ranges from 22 to 4783masl with a DEM resolution of 90m
for both GCM and RCM outputs before they are applied forenvironment impact models [22ndash26]
In a broad sense downscaling includes two purposesone is obtaining future emission scenarios (time series) forstations or regions or catchments from global climate models(eg HadAM3P) using the established statistical relationshipbetween measurements and large-scale predictors The otherpurpose is obtaining time series for nonmeasurement areaThis also could be treated as spatial interpolation or disaggre-gation to some extentMany previous studies have shown thata reproduction of station data and the generation of futuretimes series at the respective locations is extremely useful(eg [19 22 24])
In terms of downscaling methods dynamical andstatistical downscaling are the two main approaches Thelatter approach establishes the statistical connectionsbetween large-scale circulation variables (predictors) andlocal observed variables (predictands) [27 28] Comparedto dynamical downscaling statistical downscaling methodshave lower computational demands and allow for a fastapplication [27 29] Maraun et al [11] comprehensivelyreviewed precipitation downscaling methods from an enduserrsquos point-of-view For example local intensity scaling(LOCI) and quantile-mapping (QM) are the standardmethods used for correcting GCM or RCM outputs withrespect to local observations
Other methods focus on investigating the relationshipbetween local precipitation and large-scale atmosphere cir-culations which vary from linear regression (eg [30ndash35]) to complex nonlinear models (eg [36ndash40]) Althoughnumerous studies were carried out a general standardizedprecipitation downscaling method still does not exist espe-cially for complex terrains Furthermore a separate predictorselection process (eg principal components analysis) isusually implemented in order to search for the most sensitivevariables with regard to precipitation variations (eg [3439 41ndash44]) However this procedure costs the additionalcomputation time Therefore it is of particular interest tointroduce new approaches especially for the stations wherebenchmark methods do not work at all
To this end a new machine learning method the ldquoleastabsolute shrinkage and selection operator (LASSO)rdquo algo-rithm is introduced for downscaling ERA-Interim forecastprecipitation data in complex terrain Compared to standardlinear downscaling approaches LASSO is also well suitedfor possibly underdetermined linear regression problemsas well as for joint estimation and continuous variableselection It is tested and validated against three differentmethods local intensity scaling (LOCI) quantile-mapping(QM) and stepwise regression (Stepwise) using data from50 meteorological stations located in the high mountainousregion of the central Alps (Figure 1)
Advances in Meteorology 3
This paper is structured as follows Section 2 describes theERA-Interim forecast precipitation data and meteorologicalobservations in the study area Section 3 describes the fourdownscaling methods as well as the evaluation criteria Thedownscaling results and methods comparison are presentedin Section 4 while finally a discussion and subsequentconclusions are given in Section 5
2 Datasets
21 ERA-Interim We make use of the ERA-Interim forecastprecipitation data provided by the European Centre forMediumRangeWeather Forecast (ECMWF) for the year 1979onwards and continuing in real time [45 46] ERA-Interimshows some improvements when compared with ERA-40in these aspects a representation of the hydrological cyclean improved description of the stratospheric circulationand an enhanced handling of biases [46ndash49] Cycle 31r2 ofECMWFrsquos Integrated Forecast System (IFS) was used in hereThe model in this configuration comprises 60 vertical levelswith the top level at 01 hPa it uses theT255 spectral harmonicrepresentation for the basic dynamical fields and a reducedGaussian grid (N128) with an approximately uniform spacingof 79 km [46 50] ERA-Interim assimilates four analyses perday at 00 06 12 and 18 UTC Furthermore two 10-dayforecasts with a 3-hour resolution are initialized based on the0000 UTC and 1200 UTC analyses
A variety of data in uniform latlong grids (0125∘ 025∘05∘ 075∘ 1∘ 1125∘ 15∘ 2∘ 25∘ and 3∘) are availablefrom ECMWF datasets Here we apply 3-hourly forecastprecipitation data (03 06 09 12 15 18 21 and 24 UTC)initialized at 00 UTC from 1983ndash2010 which are projectedon the grid of 025∘ times 025∘ Daily precipitation is calculatedfrom eight times 3-hourly precipitation forecast In addition19 surface and upper-atmosphere variables (Table 1) areapplied as predictors according to previous studies (eg[38 40]) These 3-hourly predictors are aggregated into dailyaverages The used variables are listed in Table 1 We used00 UTC initialized forecasts and calculated the elevation inmeters asl by the normalization of the geopotential over thegravity
22 Test Sites Daily total precipitation of the period 1983ndash2010 at 50 meteorological stations was made availablethrough the interactive tools of IDAWEB which is designedby MeteoSwiss (the Swiss Federal Office of Meteorologyand Climatology) providing free available and extensivearchive data of ground level monitoring networks Table 2lists the information about stations and Figure 1 shows thelocations of test sites The stations are located within alarge range of altitude from 381m to 3305m Among thesestations 16 are located below 500m and 11 are situatedbetween 500m and 1000m 9 between 1000m and 1500m8 between 1500m and 2000m and 6 above 2000m Theobservations and ERA-Interim data are processed for thesame period The available data is partitioned into twoperiods 1983ndash1999 for calibration and 1999ndash2010 for valida-tion A 1mm threshold was defined for defining a drywetday
Table 1 Predictors from ERA-Interim forecast dataset All variablesare aggregated from 3-hourly to daily averages
Predictor DescriptionP ERA ERA-Interim precipitation (mm)MSLP Mean sea-level pressure (hPa)TCW Total column water (mm)U 10 10-meter 119880 wind component (m sminus1)V 10 10-meter 119881 wind component (m sminus1)WS 10 Wind speed (m sminus1)FG 10 10-meter wind gust (m sminus1)LSP Large-scale precipitation (mm)H 850 Geopotential height at 850 hPa (m)H 700 Geopotential height at 700 hPa (m)H 500 Geopotential height at 500 hPa (m)T 850 Temperature at 850 hPa (∘C)T 700 Temperature at 700 hPa (∘C)T 500 Temperature at 500 hPa (∘C)RH 850 Relative humidity at 850 hPa ()RH 700 Relative humidity at 700 hPa ()RH 500 Relative humidity at 500 hPa ()SH 850 Specific humidity at 850 hPa (g kgminus1)SH 700 Specific humidity at 700 hPa (g kgminus1)SH 500 Specific humidity at 500 hPa (g kgminus1)
It is necessary to note that the data of the stations GUEPAY and GVE are used within the ERA-interim data assimi-lation procedure given their status asWMO SYNOP stations[46 51] According to the information of the ECMWF it canbe assumed that the majority of the stations (47 of 50 sites)are not used by ERA-Interim and therefore represent a fullyindependent dataset
3 Methods
31 Local Intensity Scaling (LOCI) LOCI is a robustmethod to directly correct GCM or RCM outputs forlocal observations Although GCMs or RCMs are partlyunrealistic due to their coarse resolution they containvaluable information about the actual precipitation [11]The assumption is realized by a so-called scaling factorcalculated from observation and climate model data ofa reference period which is then expanded to scenariosdata Here LOCI is applied as the benchmark methodfor comparison with LASSO LOCI was developed byWidmann and Bretherton [52] Widmann et al [53] usedit for scenario precipitation corrections Not only GCMsbut also RCMs were corrected using the LOCI approach[54ndash56] Schmidli et al [57] further modified LOCI forprecipitation occurrence and amount correction separatelyIn this study LOCI is implemented based on a monthlyscaling factor which is calculated in three steps as follows
Fre (119875ERA ge 119875thresERA ) = Fre (119875obs ge 119875
thresobs )
SF =(119875obs ge 119875
thresobs ) minus 119875
thresobs
(119875ERA ge 119875thresERA ) minus 119875
thresERA
119875
119905= max (119875thresobs + SF (119875
ValERA minus 119875
thresERA ) 0)
(1)
4 Advances in Meteorology
Table 2 Test sites information ERA-Interim grid height is also listed
Site abbreviation Site name Latitude Longitude Site elevation (m) ERA-Interim grid elevation (m)COV Piz Corvatsch 4642 982 3305 1618WFJ Weissfluhjoch 4683 981 2690 1722SAE Santis 4725 934 2502 1154GSB Col du Grand St-Bernard 4587 717 2472 1493GUE Gutsch ob Andermatt 4665 862 2287 1432PIL Pilatus 4698 825 2106 1154MLS Le Moleson 4655 702 1974 1193SAM Samedan 4653 988 1709 1661DOL La Dole 4642 610 1670 699CIM Cimetta 4620 879 1661 1281SBE S Bernardino 4646 918 1639 1532ZER Zermatt 4603 775 1638 1552CHA Chasseral 4713 705 1599 669DAV Davos 4681 984 1594 1722MVE Montana 4630 747 1427 1470NAP Napf 4700 793 1403 1115ULR Ulrichen 4650 830 1345 1435SCU Scuol 4680 1028 1303 1818FRE BulletLa Fretaz 4683 658 1205 818DIS DisentisSedrun 4670 885 1197 1479ROB PoschiavoRobbia 4635 1007 1078 1394ENG Engelberg 4682 842 1035 1432CDF La Chaux-de-Fonds 4708 680 1018 770PIO Piotta 4652 868 990 1447STG St Gallen 4743 940 775 1027VIS Visp 4630 785 639 1498RUE Runenberg 4743 788 611 701FAH Fahy 4742 693 596 554INT Interlaken 4667 787 577 1325CHU Chur 4687 953 556 1668SMA ZurichFluntern 4738 857 555 780BER BernZollikofen 4698 747 552 1008TAE AadorfTanikon 4748 890 539 897GLA Glarus 4703 907 516 1312PAY Payerne 4682 695 490 1030WAE Wadenswil 4722 868 485 1011NEU Neuchatel 4700 695 485 849SIO Sion 4622 733 482 1408VAD Vaduz 4713 952 457 1226PUY Pully 4652 667 455 1100CGI NyonChangins 4640 623 455 835LUZ Luzern 4703 830 454 1154REH ZurichAffoltern 4743 852 443 780GUT Guttingen 4760 928 440 962SHA Schaffhausen 4768 862 438 662ALT Altdorf 4688 862 438 1193KLO ZurichKloten 4748 853 426 780WYN Wynau 4725 778 422 827GVE Geneve-Cointrin 4625 613 420 973AIG Aigle 4633 692 381 1346
Advances in Meteorology 5
where 119875119905is the target station precipitation 119875ValERA the un-
downscaled ERA-Interim data for validation 119875thresERA ERA-Interim precipitation threshold and 119875thresobs the observationthreshold and the brackets present the frequency conditionjudgment function Here 1mm is used to define wetdrydays and SF is the scaling factor In the first step an adjustedthreshold for ERA-Interim data is found that matches theoccurrence of wetdry days based on the 1mm threshold ofobservation In a second step the scaling factor is obtainedand then finally the target station precipitation is calculated
32 Quantile-Mapping (QM) QM introduced by Panof-sky and Brier [58] is a popular statistical transformationsapproach to correct GCM and RCM outputs straightfor-wardly [25 59ndash65] The distribution function (eg cumu-lative distribution function CDF) of model precipitationis first adjusted to match the distribution of observationsSubsequently this matched distribution is used for unbiasedmodel (or future scenario) data The mapping is usuallyimplemented based on empirical quantiles or quantiles ofgamma distributions [11 64] In this study the correctedERA-Interim can be obtained via
119875
119905= 119875
ValERA + Δ119891
Δ119891 = 119891
minus1
obscal (119891ERAcal (119875ValERA)) minus 119891
minus1
ERAcal (119891ERAcal (119875ValERA))
(2)
where 119891minus1obscal and 119891minus1
ERAcal is the inverse CDF of observationsand ERA-Interim for calibration respectively and 119891ERAcal isthe CDF of 119875ValERA
33 Stepwise Regression (Stepwise) Stepwise Regression(Stepwise hereafter) is an automatic procedure where Step-wise combines an ordinary regression (3) with a predictorvariable selection procedureThreemain approaches are usedin Stepwise according to the relevant selection sequenceforward selection backward elimination or bidirectionalelimination The advantage of stepwise regression is easilyexplained and implemented Several previous studies haveused stepwise regression for different purposes For exampleHarpham and Wilby [39] Hessami et al [42] and Huth[66] adopted Stepwise for predictor selection Agnihotriand Mohapatra [30] applied it to occurrence estimation ofdaily summer monsoon precipitation In this study stepwiseregression is adopted to test LASSO Stepwise regression isimplemented using backward elimination method with asignificance level of 005
119910
119894= 119909
119894119895120573
119895+ 120576 (3)
where119910 is the 119894times1 response vector119909 is the 119894times119895 variable vector120573 is the 119895times1 parameter vector and 120576 is the random errorsWeused the same set of 20 variables (Table 1) for Stepwise andLASSO for a better method comparison For precipitationoccurrence 119910 is defined as 1 for wet days (gt1mm) and 0 fordry days (lt1mm) All variables are standardized tomake datafall between 0 and 1
34 LASSO Algorithm Least absolute shrinkage and selec-tion operator (LASSO) is an alternative regularized versionof least squares which is useful for feature selection and toavoid overfitting problems LASSO shrinks the estimates ofthe regression coefficients towards zero to prevent overfittingproblem and to reduce variables by using a penalty parameter[67 68] To simplify understanding the history of LASSOis introduced briefly The following equation presents theordinary least squares regression (OLS) that tries tominimizethe error RSS (Root of Sum of Squares)
120573
ols= argmin
120573
119873
sum
119894=1
(119910
119894minus 120573
0minus
V
sum
119895=1
119909
119894119895120573
119895)
2
(4)
OLS is not always satisfactory for minimizing the RSSespecially when 119909 contains a large number of variables Apenalty parameter 120582 was added based on the normal OLS inLASSO (see the following equation)
120573
lasso= argmin
120573
119873
sum
119894=1
(119910
119894minus 120573
0minus
V
sum
119895=1
119909
119894119895120573
119895)
2
+ 120582
V
sum
119895=1
120573
119895
(5)
where V is the number of variables LASSO imposes inten-tionally that some coefficients have to be zero thus achievinga sparse model Thus the penalty parameter (regularizer) 120582controls the level of sparsity of the resulting model In thisstudy we applied an efficient algorithm for solving LASSO[69] Also we defined the value 1 for wet days (gt1mm) and 0for dry days (lt1mm) and all variables are standardized thesame as Stepwise
35 Evaluation Criteria Precipitation downscaling proce-dure is implemented in two steps Firstly precipitation occur-rence is modeled by the four methods respectively Secondlyprecipitation amount conditional on the occurrence of wetdays is modeled subsequently Please note that the resultsof precipitation occurrence ranges from 0 to 1 We defined05 as the threshold value to classify drywet days Themodeled precipitation amount also could be negative valuesTherefore we set these negative values to zeroThe root meansquare error (RMSE) and the mean absolute error (MAE)are used for the assessment of precipitation amount andcorrespondence ratio (CR) is applied for the evaluation ofdrywet days classification accuracy (6)-(7)
RMSE = radic 1119873
119873
sum
119905=1
(119875
119900minus 119875
119898)
2
MAE = 1119873
119873
sum
119905=1
1003816
1003816
1003816
1003816
119875
119900minus 119875
119898
1003816
1003816
1003816
1003816
(6)
where 119875119900and 119875
119898are observed and modeled precipitation
amount on wet days respectively 119873 is the number of wetdays
CR =119899dry + 119899wet
119873
(7)
6 Advances in Meteorology
0 5 10 15 20 25 30 35 40 45 50minus50
0
50
100
150
Station
Perc
ent (
)
minus2000
minus1000
0
1000
2000
Δh
(m)
Figure 2 Annual precipitation bias (bars) between ERA-Interimand MeteoSwiss stations in percent for the period 1983ndash2010 Pos-itive values indicate an overestimation of the annual precipitationby ERA-Interim and vice versa The line with dots indicates altitudedifferences Δℎ defined as ERA-Interim grid height minus siteelevation
Jan Feb Mar Apr May Jun Jul Aug Sep Oct Nov Dec07
075
08
085
09
095
CR
Original ERALOCIQM
StepwiseLASSO
Figure 3 Averaged correspondence ratio (CR) for each month inthe validation period 1999ndash2010
where 119899dry and 119899wet are the numbers of dry or wet days thatare correctly classified by downscaling methods
4 Results
41 Validation of the Original ERA-Interim Forecast Pre-cipitation Data Table 3 shows the comparison of ERA-Interim daily precipitation forecasts with observations at 50meteorological stations from 1983ndash2010 CR as well as theRMSE and MAE in mm is listed CR varies from 068 to 086andRMSE changes in the range of 440ndash1113mmwhileMAEranges from 222 to 519mmThe large errors show that thereis a great need for the correction and downscaling of ERA-Interim data at local stations The altitude differences changesharply in a large interval We use the abbreviations for thecharacterization of the stations StationCOV is 1687mhigherthan ERA-Interim grid height while station SCU is 515mlower than grid height ERA-Interim shows good agreementwith the occurrence of observations (068 to 086) but large
deviations with respect to the amount of precipitation onwet days However in contrast to temperature estimationsthe difference in altitude is unable to explain the observedbias For example station DOL has the highest CR withthe value of 086 but with a large elevation difference of971m Station ZER has a CR of 074 but its elevation matchesthe grid height very well with an altitude gap of only 86mThis again suggests that the general relationship betweenprecipitation and elevation is not easy to obtain due tothe great variability in the interaction between atmosphericcirculation and complex topographical characteristics
Figure 2 illustrates the bias (in percent) between ERA-Interim data and station precipitation observations for thetime period 1983ndash2010 Positive values indicate that annualprecipitation is overestimated by ERA-Interim and vice versaIn general ERA-Interim data overestimate observations theobserved annual precipitation for the majority of test sitesonly 7 of 50 sites are underestimated Among them stationGSB has the largest negative bias with a value of minus442 5out of 50 sites show an overestimation of more than 100Station WFJ and DAV are located in the same ERA-Interimgrid However ERA-Interim overestimated stationWFJ with75 and station DAV with a value of 456 Besides stationsPIL and LUZ are also in the same ERA-Interim grid ERA-Interim underestimates PILwith 252 In the contrast ERA-Interim overestimates LUZ with a value of 286 The lowerstations that are mainly located at the northern part of theAlps are underestimated by ERA-Interim
42 Evaluation of Downscaling Methods in PrecipitationOccurrence Theperformance of the four downscalingmeth-ods as well as the ERA-Interim original data in precipitationoccurrence in the validation period 1999ndash2010 is summa-rized in Table 4 The averaged CR showed that the fourdownscaling methods were much better than the originalERA-Interim data QM and LASSO had the same range ofCR from 082 to 088 LOCI ranged from 081 to 088 andStepwise varied from 082 to 087 QM estimated a worse CRthan the original ERA data at station GSB LASSO predictedthe worst occurrence at station DOL The four methods hadthe same performance at 7 sites For 11 sites LASSO andStepwise were the best methods in precipitation occurrencemodeling Figure 3 illustrates the averaged correspondenceratio for each month in the validation period 1999ndash2010 Itreveals that LOCI QM Stepwise and LASSO captured thegeneral tendency of the monthly precipitation occurrence forthe whole year LASSO and Stepwise identified better dry andwet days than LOCI and QM in May but they performedworse in October LASSO classified drywet days similarlywith Stepwise for all 12 monthsThe result shows that LASSOis quite suitable for drywet days classification
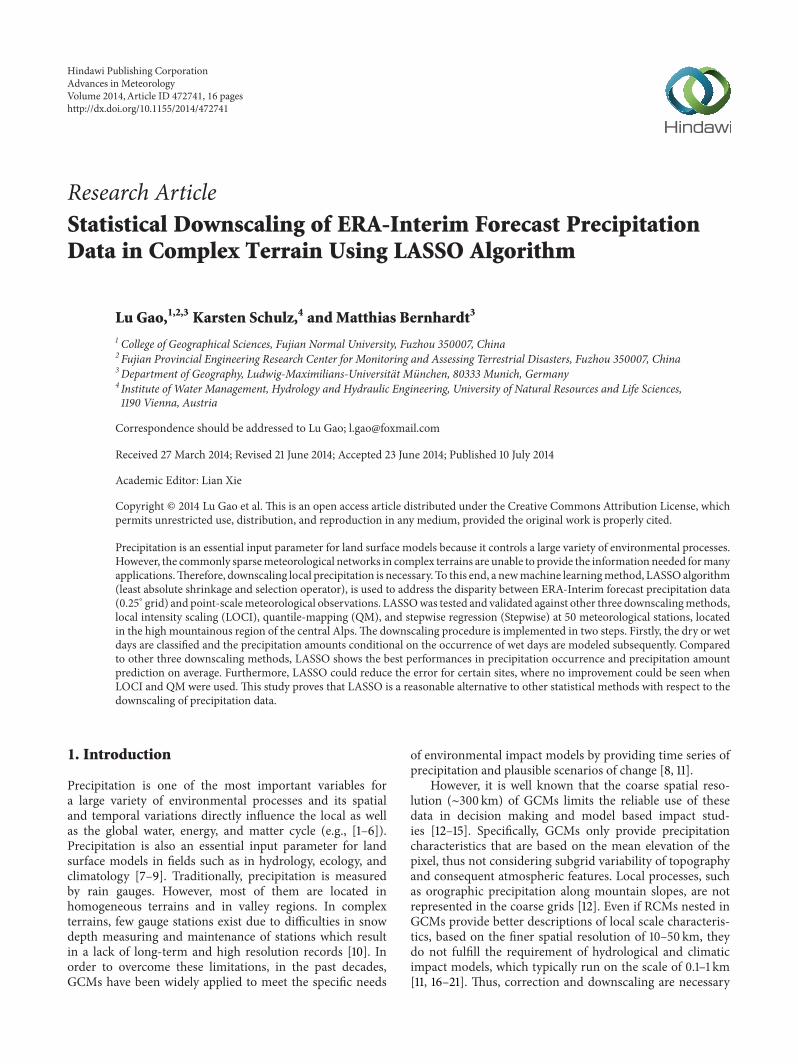
Figure 4 shows the used variables in Stepwise andLASSO for drywet days classification LASSO selected morevariables than Stepwise For LASSO P ERA T 700 andTCW were the most frequent (50 sites) variables RH 500was the least frequently (17 sites) applied by LASSO P ERAand U 10 were the most frequent (more than 45 sites)variables in Stepwise T 500 was the least frequent variable
Advances in Meteorology 7
Table 3 Comparison of ERA-Interim forecast daily precipitation with observations at 50 meteorological stations from 1983 to 2010 CRRMSE and MAE in mm are listed The elevations of sites are different with ERA-Interim grid heights so the altitude differences (Δℎ ERA-Interim grid height minus elevation) are also labeled
Site CR RMSE MAE Δℎ
COV 076 466 237 minus1687WFJ 079 583 293 minus968SAE 084 1113 519 minus1348GSB 083 1086 459 minus979GUE 079 696 330 minus855PIL 082 918 397 minus952MLS 079 540 273 minus781SAM 068 484 262 minus48DOL 086 604 276 minus971CIM 076 897 345 minus380SBE 074 916 391 minus107ZER 074 533 264 minus86CHA 080 523 256 minus930DAV 076 510 269 128MVE 075 552 275 43NAP 082 570 279 minus288ULR 075 633 314 90SCU 069 498 274 515FRE 082 508 246 minus387DIS 075 612 305 282ROB 077 546 250 316ENG 081 591 301 397CDF 084 487 233 minus248PIO 072 817 358 457STG 081 548 274 252VIS 068 566 298 859RUE 079 462 238 90FAH 081 440 222 minus42INT 079 524 270 748CHU 072 519 281 1112SMA 080 485 244 225BER 078 507 259 456TAE 080 491 255 358GLA 080 555 287 796PAY 077 545 284 540WAE 081 555 271 526NEU 077 508 259 364SIO 069 518 280 926VAD 076 511 269 769PUY 080 576 279 645CGI 079 499 256 380LUZ 078 546 279 700REH 079 473 242 337GUT 077 501 266 522SHA 078 447 233 224ALT 077 532 274 755KLO 078 483 249 354WYN 079 471 237 405GVE 078 513 261 553AIG 079 482 244 965Average 078 579 284 100
8 Advances in Meteorology
Table 4 Comparison of downscaling methods as well as the original ERA-Interim forecast data in precipitation occurrence in the validationperiod 1999ndash2010
Site CRERA LOCI QM Stepwise LASSO
COV 076 085 084 082 082WFJ 078 082 082 085 085SAE 083 084 084 084 084GSB 083 083 082 085 085GUE 078 081 082 083 083PIL 081 084 084 083 083MLS 076 083 083 084 084SAM 068 086 085 084 084DOL 086 088 088 086 085CIM 077 085 084 087 087SBE 074 083 082 086 086ZER 074 084 084 084 084CHA 080 085 085 083 083DAV 075 084 084 085 084MVE 074 083 083 085 085NAP 081 085 085 084 084ULR 075 084 083 084 084SCU 069 086 086 085 085FRE 082 087 087 085 085DIS 075 084 084 083 083ROB 076 084 083 086 086ENG 080 082 082 084 084CDF 084 086 087 085 085PIO 071 084 083 087 087STG 081 085 084 084 084VIS 068 085 085 085 085RUE 078 085 084 083 083FAH 081 086 086 085 085INT 079 085 085 085 085CHU 071 084 083 084 084SMA 080 086 086 083 083BER 077 086 086 085 085TAE 080 086 086 085 085GLA 079 084 084 086 086PAY 076 086 085 085 085WAE 081 085 085 084 085NEU 077 087 086 085 085SIO 069 087 087 087 088VAD 076 086 085 085 085PUY 079 087 086 086 086CGI 078 088 088 087 087LUZ 077 084 084 084 084REH 079 085 085 083 084GUT 078 084 084 084 084SHA 078 085 085 083 083ALT 077 084 084 084 084KLO 079 085 085 084 084WYN 079 086 086 085 085GVE 078 088 087 086 086AIG 078 086 086 087 086Average 077 085 085 085 085
Advances in Meteorology 9
05
101520253035404550
Predictors
Num
ber o
f st
atio
ns
StepwiseLASSO
PERA
H850
H700
H500
T850
T700
T500
RH
850
RH
700
RH
500
SH
850
SH
700
SH
500
TCW
U10
V10
FG
10
WG
10
MSL
P
LSP
Figure 4 Selected variables in Stepwise and LASSO for drywet days classification
For the individual sites station INT selected least variables(12 variables) while station COV CHA and CGI chose themost variables (20 variables) in LASSO Stepwise selected 16variables at stations GSB CHA FAH and SMA while it onlyapplied 9 variables at stations SAM and PIO LASSO appliedmore variables compared with Stepwise for the majorityof stations (49 stations) Although different variables areapplied by the two methods the performances of drywetdays classification were similar
43 Evaluation of Downscaling Methods in PrecipitationAmount The overall performance of four downscalingmethods as well as the ERA-Interim original data in precipi-tation amount conditional on the occurrence of a wet day forthe validation period 1999ndash2010 is summarized in Table 5On the average Stepwise and LASSO performed similarly inRMSE and MAE which were much smaller than LOCI andQM The reduction of error of Stepwise was 122 of RMSEand 157 of MAE respectively LASSO was slightly betterthan Stepwise in MAE (163) and it had the same errorreductionwith Stepwise in RMSE (122) whereas LOCI andQM were the worst methods The reduction of RMSE wasonly 35 and 09 for LOCI and QM respectively In totalLOCI and QM did not reduce RMSE at 13 stations such asstation WFJ QM was the worst method at 24 stations whileLOCI performed the worst in RMSE at stations ENG andCDF LASSO outperformed the other methods at 9 stationsStepwise reduced the most RMSE at 40 stations comparedwith other three methods However the four downscalingmethods failed to reduce the errors at station CHA Interms of MAE LOCI outperformed the other methods at 26stations LASSO reduced the most MAE at 22 stations QMmethod was not able to reduce MAE at 5 stations It could beconcluded that LOCI andQMmethod are not always suitablefor local stations It has to be noted that the four downscalingmethods did not work for MAE reduction at station DOL
which has a large elevation difference of 971m against ERA-Interim grid height
Taking station WFJ as an example Figures 5 and 6illustrate the downscaled daily precipitation for the fourdownscaling methods as well as the original ERA-Interimdata in January and July respectively for the validationperiod 1999ndash2010 In general four downscaling methodscapture the tendency of the daily precipitation in Januaryand July However LOCI and QM are generally inclined tomisidentify the heavy precipitation events in particular inJanuary 2008 and July 2003 Stepwise and LASSO underes-timated heavy precipitation events compared with LOCI andQM
Figure 7 illustrates the comparison of observations withdownscaled annual precipitation for the fourmethods as wellas the original ERA-Interim data in the validation period1999ndash2010 LASSO and Stepwise predicted the annual precip-itation best In general LOCI and QMmodeled drier resultswith mean value of minus77 and minus50 respectively 31 out of50 sites were underestimated by LASSO with the range fromminus19 (station KLO) to minus01 (station RUE) while 19 siteswere overestimated by 02 (station SCU) to 316 (stationMLS) The majority of sites were underestimated by LOCI(48 out of 50 sites) and QM (40 out of 50 sites) while 30 of 50sites were underestimated by Stepwise Figure 8 compares theaveraged sum of daily precipitation for each month betweenobservations and the four downscaling methods as well asthe original ERA-Interim data in the validation period 1999ndash2010 It is easy to find that LASSO and Stepwise predictedmore precipitation in the whole year than LOCI and QMwith exception of August and November LASSO reproducedbest monthly precipitation for February March April andNovember Stepwise was the best method for May JuneJuly and October QM performed best in January Augustand September LOCI outperformed the other methods inDecember
10 Advances in Meteorology
Table 5 Comparison of observations with downscaled daily precipitation for the four downscaling methods as well as the original ERA-Interim data in precipitation amount (mm) on wet days for the validation period 1999ndash2010
Site RMSE MAEERA LOCI QM Stepwise LASSO ERA LOCI QM Stepwise LASSO
COV 453 414 431 387 387 233 176 183 180 178WFJ 612 629 645 547 546 303 289 295 271 268SAE 1189 1109 1126 974 975 556 549 558 501 501GSB 1120 1059 1065 918 918 461 472 478 449 448GUE 650 638 679 585 585 316 284 291 295 294PIL 1042 1004 990 957 956 430 421 418 423 420MLS 585 528 565 467 466 302 241 250 237 234SAM 473 390 405 360 360 258 146 154 155 153DOL 571 592 602 540 539 263 264 270 272 270CIM 879 946 956 809 809 348 346 352 352 352SBE 927 908 991 751 750 398 376 398 352 351ZER 510 416 450 365 365 255 161 165 164 162CHA 550 561 577 552 552 262 247 252 260 258DAV 518 482 489 444 445 272 211 215 209 207MVE 532 486 497 421 421 272 208 211 214 213NAP 615 647 650 610 610 297 298 300 295 294ULR 623 592 621 568 571 311 252 260 270 269SCU 493 372 398 355 355 272 146 154 157 154FRE 515 543 556 491 491 246 230 234 226 225DIS 597 533 549 529 529 300 218 220 237 236ROB 572 614 624 509 508 266 240 247 237 236ENG 616 664 641 579 579 313 317 310 293 290CDF 501 544 544 489 489 234 237 240 236 233PIO 788 772 798 676 677 354 299 309 316 316STG 567 581 592 555 553 276 254 258 260 257VIS 549 412 453 375 375 292 152 160 162 161RUE 462 457 468 415 415 240 198 203 200 198FAH 467 469 478 444 445 228 199 204 205 202INT 521 530 534 482 481 271 233 235 233 232CHU 519 448 482 420 421 280 188 196 191 190SMA 486 495 514 471 472 244 217 223 218 216BER 514 516 523 468 468 264 215 220 218 216TAE 474 480 497 451 451 254 224 230 228 226GLA 560 602 605 529 529 287 280 282 265 264PAY 530 451 460 396 397 283 186 192 190 188WAE 550 596 605 540 540 274 267 271 267 264NEU 500 485 490 434 434 260 195 200 197 194SIO 498 352 365 309 308 274 137 143 148 146VAD 526 461 483 438 438 272 187 194 191 190PUY 558 557 576 506 506 276 228 236 244 243CGI 495 450 469 414 415 255 183 190 186 185LUZ 540 548 552 521 521 281 245 248 255 252REH 491 482 488 454 455 246 204 207 204 203GUT 484 434 456 396 397 260 191 198 191 189SHA 436 425 434 390 390 231 185 188 183 180ALT 547 547 557 523 523 280 239 244 240 237KLO 490 483 497 462 463 251 207 211 207 205WYN 487 523 531 460 460 246 221 224 219 217GVE 513 472 490 453 453 261 187 196 193 193AIG 469 455 465 402 402 243 191 197 199 197Average 583 563 578 512 512 287 241 246 242 240
Advances in Meteorology 11
0204060
ObservationOriginal era
0204060
ObservationLOCI
0204060
ObservationQM
0204060
ObservationStepwise
1999 2000 2001 2002 2003 2004 2005 2006 2007 2008 2009 2010
1999 2000 2001 2002 2003 2004 2005 2006 2007 2008 2009 2010
1999 2000 2001 2002 2003 2004 2005 2006 2007 2008 2009 2010
1999 2000 2001 2002 2003 2004 2005 2006 2007 2008 2009 2010
1999 2000 2001 2002 2003 2004 2005 2006 2007 2008 2009 2010
020406080
Dai
ly p
reci
pita
tion
(mm
)D
aily
pre
cipi
tatio
n
(m
m)
Dai
ly p
reci
pita
tion
(mm
)D
aily
pre
cipi
tatio
n
(m
m)
Dai
ly p
reci
pita
tion
(mm
)
ObservationLASSO
Figure 5 Comparison of observations with downscaled daily precipitation for the four downscaling methods as well as the original ERA-Interim data in January at station WFJ during the validation period 1999ndash2010
Figure 9 shows the used variables in Stepwise and LASSOfor precipitation amount prediction on wet days LASSOagain selected more variables than Stepwise For LASSOP ERA H 850 H 700 H 500 T 850 and MSLP wereapplied at all 50 sites SH 500 was applied at 25 sites P ERAwas the sole variable used by all test sites by Stepwise SH 850and U 10 were the second most frequent (34 sites) variablesRH 700 and RH 500 were the least frequent variables (10sites) by Stepwise For the individual sites station VAD usedthe least variables (11 variables) while 19 stations selectedall 20 variables in LASSO Station SBE applied the mostvariables (16 out of 20 vairables) while station WYN onlyapplied 4 variables in Stepwise
5 Discussion and Conclusion
The comparison between ERA-Interim and observationsshowed that ERA-Interimhas a large error (579mmofRMSEand 284mm of MAE) in the central Alps (Table 3) Thusthere is a great need for the correction and downscaling ofERA-Interim data This study compared four downscalingmethods LOCI QM Stepwise and LASSO for downscalingof ERA-Interim daily precipitation data in the central Alps
As a frequent input variable for hydrological modelsdaily precipitation is always corrected or downscaled dueto the limits of rain gauges In the previous studies (eg[57 63]) LOCI and QM methods have been widely used for
12 Advances in Meteorology
1999 2000 2001 2002 2003 2004 2005 2006 2007 2008 2009 20100
20406080
ObservationOriginal era
1999 2000 2001 2002 2003 2004 2005 2006 2007 2008 2009 20100
20406080
ObservationLOCI
1999 2000 2001 2002 2003 2004 2005 2006 2007 2008 2009 20100
20406080
ObservationQM
1999 2000 2001 2002 2003 2004 2005 2006 2007 2008 2009 20100
20406080
ObservationStepwise
1999 2000 2001 2002 2003 2004 2005 2006 2007 2008 2009 20100
20406080
Dai
ly p
reci
pita
tion
(mm
)D
aily
pre
cipi
tatio
n
(m
m)
Dai
ly p
reci
pita
tion
(mm
)D
aily
pre
cipi
tatio
n
(m
m)
Dai
ly p
reci
pita
tion
(mm
)
ObservationLASSO
Figure 6 Comparison of observations with downscaled daily precipitation for the four downscaling methods as well as the original ERA-Interim data in July at station WFJ during the validation period 1999ndash2010
the bias correction with the advantages of maintaining thevariation and distribution of historical data Although LOCIand QM captured the best estimation of daily precipitationoccurrence the reduction of error is not significant by thesetwo methods and even worse than the original ERA-Interimdata for 13 out of 50 sites It demonstrates that straightforwardmethods are not always suitable for downscaling local obser-vations in complex terrain
LASSO algorithm simulated the occurrence of dailyprecipitation as well as LOCI QM and Stepwise it capturedthe occurrence for all test sites generally Compared tothe other three downscaling methods it reduced the mostamount error to 163 of MAE and 122 RMSE LASSO
also predicted the best annual and monthly precipitationAlthough the LASSO algorithm has been developed for morethan 15 years by statistician the application in geosciences isstill at the early-stage (eg [70]) A main practical challengein applying LASSO for precipitation downscaling is thatprecipitation in heterogeneous terrain is such a complexprocesswhich tends to usemore variables and to overestimateobservations It has shown that LASSO tends to use morevariables than Stepwise To avoid the overfitting problem thepenalty (or regularization) parameter 120582 plays a key role Thecross-validation and hundreds of runs are necessary to findan appropriate penalty parameterTherefore LASSO is a littlebit time-consuming than the other three methods
Advances in Meteorology 13
0 5 10 15 20 25 30 35 40 45 50
minus40minus20
020406080
100120140160
Station
Perc
ent (
)
Original ERALOCIQM
StepwiseLASSO
Figure 7 Percentage of annual precipitation bias between observations and the four downscaled results as well as the original ERA-Interimdata in the validation period 1999ndash2010
Jan Feb Mar Apr May Jun Jul Aug Sep Oct Nov Dec0
20
40
60
80
100
120
140
160
180
Mon
thly
pre
cipi
tatio
n (m
m)
ObservationOriginal eraLOCI
QMStepwiseLASSO
Figure 8 Comparison of averaged sum of daily precipitation for each month between observations and the four downscaled results as wellas the original ERA-Interim data in the validation period 1999ndash2010
So far the work presented herein has been limited tothe central Alps with 50 meteorological stations providingcalibrationvalidation data sets for testing LASSO algorithmIt would be necessary to extend LASSO method to otherhighmountainous areas around the world Besides this studyfocuses on the local stations at present it is of special interestto extend LASSO method for nonstation areas A limitednumber of variables (20 variables in this study) derived fromERA-Interimdatawere applied for LASSO however it shouldalso be investigated whether other potential variables suchas vapor pressure can be used in the presented approach
This study focused on the daily total precipitation Certainlyhigher temporal resolution data such as 3-hourly would be ofgreat interest in further investigations Furthermore applyingother reanalysis data sets based on different land surfacerepresentations could also be valuable for validating LASSOalgorithm
Conflict of Interests
The authors declare that there is no conflict of interests in thispaper
14 Advances in Meteorology
05
101520253035404550
Predictors
Num
ber o
f st
atio
ns
StepwiseLASSO
PERA
H850
H700
H500
T850
T700
T500
RH
850
RH
700
RH
500
SH
850
SH
700
SH
500
TCW
U10
V10
FG
10
WG
10
MSL
P
LSP
Figure 9 Selected variables in Stepwise and LASSO for precipitation amount prediction on wet days
Acknowledgments
This research has been funded by China Scholarship Council(CSC) ERA-Interim data was supported by the ECMWFTheauthors would like to thank MeteoSwiss (the Swiss FederalOffice of Meteorology and Climatology) for providing theneeded meteorological data The authors appreciate OURA-NOS and Josef Schmid (Ludwig-Maximilians-UniversitatMunchen) for providing a tool for the data processing
References
[1] R E Benestad I Hanssen-Bauer and E J Foslashrland ldquoAnevaluation of statistical models for downscaling precipitationand their ability to capture long-term trendsrdquo InternationalJournal of Climatology vol 27 no 5 pp 649ndash665 2007
[2] X Beuchat B Schaefli M Soutter and A Mermoud ldquoTowarda robust method for subdaily rainfall downscaling from dailydatardquoWater Resources Research vol 47 no 9 2011
[3] H Guan J L Wilson and H Xie ldquoA cluster-optimizingregression-based approach for precipitation spatial downscal-ing in mountainous terrainrdquo Journal of Hydrology vol 375 no3-4 pp 578ndash588 2009
[4] M Bray D Han Y Xuan P Bates and M Williams ldquoRainfalluncertainty for extreme events in NWP downscaling modelrdquoHydrological Processes vol 25 no 9 pp 1397ndash1406 2011
[5] R E Chandler and H S Wheater ldquoAnalysis of rainfall variabil-ity using generalized linearmodels a case study from thewest ofIrelandrdquoWater Resources Research vol 38 no 10 pp 10-1ndash10-112002
[6] B L Lamptey ldquoComparison of gridded multisatellite rainfallestimates with gridded gauge rainfall overWest Africardquo Journalof Applied Meteorology and Climatology vol 47 no 1 pp 185ndash205 2008
[7] C Daly M Halbleib J I Smith et al ldquoPhysiographically sen-sitive mapping of climatological temperature and precipitationacross the conterminous United Statesrdquo International Journal ofClimatology vol 28 no 15 pp 2031ndash2064 2008
[8] R Fealy and J Sweeney ldquoStatistical downscaling of precipitationfor a selection of sites in Ireland employing a generalised linear
modelling approachrdquo International Journal of Climatology vol27 no 15 pp 2083ndash2094 2007
[9] L Ferraris S Gabellani N Rebora and A Provenzale ldquoA com-parison of stochastic models for spatial rainfall downscalingrdquoWater Resources Research vol 39 no 12 2003
[10] A M Anders G H Roe D R Durran and J R MinderldquoSmall-scale spatial gradients in climatological precipitation onthe olympic Peninsulardquo Journal of Hydrometeorology vol 8 no5 pp 1068ndash1081 2007
[11] D Maraun F Wetterhall A M Ireson et al ldquoPrecipitationdownscaling under climate change Recent developments tobridge the gap between dynamical models and the end userrdquoReviews of Geophysics vol 48 no 3 pp 1ndash34 2010
[12] J M Eden M Widmann D Grawe and S Rast ldquoSkillcorrection and downscaling of GCM-simulated precipitationrdquoJournal of Climate vol 25 no 11 pp 3970ndash3984 2012
[13] M G Grillakis A G Koutroulis and I K Tsanis ldquoMulti-segment statistical bias correction of daily GCM precipitationoutputrdquo Journal of Geophysical ResearchDAtmospheres vol 118no 8 pp 3150ndash3162 2013
[14] T Lafon S Dadson G Buys and C Prudhomme ldquoBiascorrection of daily precipitation simulated by a regional climatemodel a comparison of methodsrdquo International Journal ofClimatology vol 33 no 6 pp 1367ndash1381 2013
[15] E P Maurer A W Wood J C Adam D P Lettenmaier andB Nijssen ldquoA long-term hydrologically based dataset of landsurface fluxes and states for the conterminous United StatesrdquoJournal of Climate vol 15 no 22 pp 3237ndash3251 2002
[16] B Ahrens ldquoRainfall downscaling in an alpine watershedapplying a multiresolution approachrdquo Journal of GeophysicalResearch Atmospheres vol 108 no D8 2003
[17] S P Charles B C Bates I N Smith and J PHughes ldquoStatisticaldownscaling of daily precipitation from observed andmodelledatmospheric fieldsrdquo Hydrological Processes vol 18 no 8 pp1373ndash1394 2004
[18] F Giorgi and L O Mearns ldquoApproaches to the simulation ofregional climate change a reviewrdquo Reviews of Geophysics vol29 no 2 pp 191ndash216 1991
[19] M J Muerth B Gauvin St-Denis S Ricard et al ldquoOn the needfor bias correction in regional climate scenarios to assess climate
Advances in Meteorology 15
change impacts on river runoffrdquo Hydrology and Earth SystemSciences vol 17 no 3 pp 1189ndash1204 2013
[20] C Xu ldquoFrom GCMs to river flow a review of downscalingmethods and hydrologic modelling approachesrdquo Progress inPhysical Geography vol 23 no 2 pp 229ndash249 1999
[21] M Bernhardt K Schulz G E Liston and G Zangl ldquoTheinfluence of lateral snow redistribution processes on snow meltand sublimation in alpine regionsrdquo Journal of Hydrology vol424-425 pp 196ndash206 2012
[22] K F Ahmed GWang J Silander et al ldquoStatistical downscalingand bias correction of climate model outputs for climate changeimpact assessment in the US northeastrdquo Global and PlanetaryChange vol 100 pp 320ndash332 2013
[23] T Crawford N L Betts and D Favis-Mortlock ldquoGCM grid-box choice and predictor selection associated with statisticaldownscaling of daily precipitation over Northern IrelandrdquoClimate Research vol 34 no 2 pp 145ndash160 2007
[24] L Gao M Bernhardt and K Schulz ldquoElevation correction ofERA-Interim temperature data in complex terrainrdquo Hydrologyand Earth System Sciences vol 16 no 12 pp 4661ndash4673 2012
[25] L Gudmundsson J B Bremnes J E Haugen and T Engen-Skaugen ldquoTechnical note downscaling RCM precipitation tothe station scale using statistical transformationsmdasha compari-son of methodsrdquo Hydrology and Earth System Sciences vol 16no 9 pp 3383ndash3390 2012
[26] E Hertig and J Jacobeit ldquoAssessments ofMediterranean precip-itation changes for the 21st century using statistical downscalingtechniquesrdquo International Journal of Climatology vol 28 no 8pp 1025ndash1045 2008
[27] R L Wilby and T M L Wigley ldquoDownscaling general cir-culation model output a review of methods and limitationsrdquoProgress in Physical Geography vol 21 no 4 pp 530ndash548 1997
[28] E Zorita and H Von Storch ldquoThe analog method as a simplestatistical downscaling technique comparison with more com-plicated methodsrdquo Journal of Climate vol 12 no 8 pp 2474ndash2489 1999
[29] R L Wilby C W Dawson and E M Barrow ldquoSDSMmdashadecision support tool for the assessment of regional climatechange impactsrdquo Environmental Modelling and Software vol 17no 2 pp 147ndash159 2002
[30] G Agnihotri and M Mohapatra ldquoPrediction of occurrence ofdaily summer monsoon precipitation over Karnatakardquo Meteo-rological Applications vol 19 no 2 pp 130ndash139 2012
[31] R E Benestad ldquoA comparison between two empirical down-scaling strategiesrdquo International Journal of Climatology vol 21no 13 pp 1645ndash1668 2001
[32] G Burger and Y Chen ldquoRegression-based downscaling of spa-tial variability for hydrologic applicationsrdquo Journal ofHydrologyvol 311 no 1ndash4 pp 299ndash317 2005
[33] E Hertig and J Jacobeit ldquoA novel approach to statisticaldownscaling considering nonstationarities application to dailyprecipitation in the Mediterranean areardquo Journal of GeophysicalResearch-Atmospheres vol 118 2013
[34] J T Schoof and S C Pryor ldquoDownscaling temperature andprecipitation a comparison of regression-based methods andartificial neural networksrdquo International Journal of Climatologyvol 21 no 7 pp 773ndash790 2001
[35] H Tatli H N Dalfes and S S Mentes ldquoA statistical down-scaling method for monthly total precipitation over TurkeyrdquoInternational Journal of Climatology vol 24 no 2 pp 161ndash1802004
[36] A Bardossy I Bogardi and I Matyasovszky ldquoFuzzy rule-based downscaling of precipitationrdquo Theoretical and AppliedClimatology vol 82 no 1-2 pp 119ndash129 2005
[37] A J Cannon ldquoNonlinear analog predictor analysis A coupledneural networkanalog model for climate downscalingrdquo NeuralNetworks vol 20 no 4 pp 444ndash453 2007
[38] S T Chen P S Yu and Y H Tang ldquoStatistical downscaling ofdaily precipitation using support vector machines and multi-variate analysisrdquo Journal of Hydrology vol 385 no 1ndash4 pp 13ndash22 2010
[39] C Harpham and R L Wilby ldquoMulti-site downscaling ofheavy daily precipitation occurrence and amountsrdquo Journal ofHydrology vol 312 no 1ndash4 pp 235ndash255 2005
[40] D N Kumar A Anandhi V V Srinivas and R S NanjundiahldquoDownscaling precipitation to river basin in India for IPCCSRES scenarios using support vector machinerdquo InternationalJournal of Climatology vol 28 no 3 pp 401ndash420 2008
[41] S Ghosh ldquoSVM-PGSL coupled approach for statistical down-scaling to predict rainfall from GCM outputrdquo Journal of Geo-physical Research D Atmospheres vol 115 no 22 Article IDD22102 2010
[42] M Hessami P Gachon T B M J Ouarda and A St-Hilaire ldquoAutomated regression-based statistical downscalingtoolrdquo Environmental Modelling and Software vol 23 no 6 pp813ndash834 2008
[43] J Schmidli C Frei and C Schar ldquoReconstruction of mesoscaleprecipitation fields from sparse observations in complex ter-rainrdquo Journal of Climate vol 14 no 15 pp 3289ndash3306 2001
[44] R L Wilby and T M L Wigley ldquoPrecipitation predictors fordownscaling observed and general circulation model relation-shipsrdquo International Journal of Climatology vol 20 no 6 pp641ndash661 2000
[45] P Berrisford D Dee K Fielding et alTheERA-InterimArchive(Version 10) ERA Report Series European Centre for MediumRange Weather Forecasts Berkshire UK 2009
[46] D P Dee S M Uppala A J Simmons et al ldquoThe ERA-Interimreanalysis Configuration and performance of the data assim-ilation systemrdquo Quarterly Journal of the Royal MeteorologicalSociety vol 137 no 656 pp 553ndash597 2011
[47] D P Dee and S Uppala ldquoVariational bias correction of satelliteradiance data in the ERA-Interim reanalysisrdquoQuarterly Journalof the Royal Meteorological Society vol 135 no 644 pp 1830ndash1841 2009
[48] A Simmons S Uppala D Dee et al ldquoERA-Interim newECMWF reanalysis products from 1989 onwardsrdquo ECMWFNewsletter vol 110 pp 25ndash35 2006
[49] D Dee and S Uppala ldquoVariational bias correction in ERA-Interimrdquo ECMWF Technical Memorandum 575 2008
[50] S Uppala D Dee and S Kobayashi ldquoTowards a climate dataassimilation system status updata of ERA-Interimrdquo ECMWFNewsletter vol 115 pp 12ndash18 2008
[51] A J Simmons K M Willett P D Jones P W Thorneand D P Dee ldquoLow-frequency variations in surface atmo-spheric humidity temperature and precipitation inferencesfrom reanalyses and monthly gridded observational data setsrdquoJournal of Geophysical Research D Atmospheres vol 115 no 1Article ID D01110 2010
[52] M Widmann and C S Bretherton ldquoValidation of mesoscaleprecipitation in the NCEP reanalysis using a new gridcelldataset for the Northwestern United Statesrdquo Journal of Climatevol 13 no 11 pp 1936ndash1950 2000
16 Advances in Meteorology
[53] M Widmann C S Bretherton and E P Salathe Jr ldquoStatisticalprecipitation downscaling over the northwestern united statesusing numerically simulated precipitation as a predictorrdquo Jour-nal of Climate vol 16 no 5 pp 799ndash816 2003
[54] T Engen-Skaugen ldquoRefinement of dynamically downscaledprecipitation and temperature scenariosrdquo Climatic Change vol84 no 3-4 pp 365ndash382 2007
[55] L P Graham J Andreaasson and B Carlsson ldquoAssessingclimate change impacts on hydrology from an ensemble ofregional climate models model scales and linking methods acase study on the Lule River basinrdquo Climatic Change vol 81 no1 pp 293ndash307 2007
[56] R Leander T A Buishand B J JM van denHurk andM JMdeWit ldquoEstimated changes in flood quantiles of the riverMeusefrom resampling of regional climate model outputrdquo Journal ofHydrology vol 351 no 3-4 pp 331ndash343 2008
[57] J Schmidli C Frei and P L Vidale ldquoDownscaling fromGCM precipitation a benchmark for dynamical and statisticaldownscaling methodsrdquo International Journal of Climatologyvol 26 no 5 pp 679ndash689 2006
[58] H W Panofsky and G W Brier Some Applications of Statisticsto Meteorology The Pennsylvania State University Press Uni-versity Park Pa USA 1968
[59] J Boe L Terray F Habets and E Martin ldquoStatistical anddynamical downscaling of the Seine basin climate for hydro-meteorological studiesrdquo International Journal of Climatologyvol 27 no 12 pp 1643ndash1655 2007
[60] CDobler SHagemann R LWilby and J Stotter ldquoQuantifyingdifferent sources of uncertainty in hydrological projections inan Alpine watershedrdquoHydrology and Earth System Sciences vol16 no 11 pp 4343ndash4360 2012
[61] T Hashino A A Bradley and S S Schwartz ldquoEvaluationof bias-correction methods for ensemble streamflow volumeforecastsrdquo Hydrology and Earth System Sciences vol 11 no 2pp 939ndash950 2007
[62] C Piani G PWeedon M Best et al ldquoStatistical bias correctionof global simulated daily precipitation and temperature for theapplication of hydrological modelsrdquo Journal of Hydrology vol395 no 3-4 pp 199ndash215 2010
[63] M J Themeszligl A Gobiet and G Heinrich ldquoEmpirical-statistical downscaling and error correction of regional climatemodels and its impact on the climate change signalrdquo ClimaticChange vol 112 no 2 pp 449ndash468 2012
[64] M Jakob Themeszligl A Gobiet and A Leuprecht ldquoEmpirical-statistical downscaling and error correction of daily precipi-tation from regional climate modelsrdquo International Journal ofClimatology vol 31 no 10 pp 1530ndash1544 2011
[65] A W Wood L R Leung V Sridhar et al ldquoHydrologic impli-cations of dynamical and statistical approaches to downscalingclimate model outputsrdquo Climatic Change vol 62 no 1ndash3 pp189ndash216 2004
[66] R Huth ldquoStatistical downscaling of daily temperature in centralEuroperdquo Journal of Climate vol 15 no 13 pp 1731ndash1742 2002
[67] J Friedman T Hastie H Hofling and R Tibshirani ldquoPathwisecoordinate optimizationrdquoTheAnnals of Applied Statistics vol 1no 2 pp 302ndash332 2007
[68] R Tibshirani ldquoRegression shrinkage and selection via the lassordquoJournal of the Royal Statistical Society B Methodological vol 58no 1 pp 267ndash288 1996
[69] W J Fu ldquoPenalized regressions the bridge versus the lassordquoJournal of Computational and Graphical Statistics vol 7 no 3pp 397ndash416 1998
[70] A M Ebtehaj E Foufoula-Georgiou and G Lerman ldquoSparseregularization for precipitation downscalingrdquo Journal of Geo-physical Research D Atmospheres vol 117 no D8 Article IDD08107 2012
Submit your manuscripts athttpwwwhindawicom
Hindawi Publishing Corporationhttpwwwhindawicom Volume 2014
ClimatologyJournal of
EcologyInternational Journal of
Hindawi Publishing Corporationhttpwwwhindawicom Volume 2014
EarthquakesJournal of
Hindawi Publishing Corporationhttpwwwhindawicom Volume 2014
Hindawi Publishing Corporationhttpwwwhindawicom
Applied ampEnvironmentalSoil Science
Volume 2014
Mining
Hindawi Publishing Corporationhttpwwwhindawicom Volume 2014
Journal of
Hindawi Publishing Corporation httpwwwhindawicom Volume 2014
International Journal of
Geophysics
OceanographyInternational Journal of
Hindawi Publishing Corporationhttpwwwhindawicom Volume 2014
Journal of Computational Environmental SciencesHindawi Publishing Corporationhttpwwwhindawicom Volume 2014
Journal ofPetroleum Engineering
Hindawi Publishing Corporationhttpwwwhindawicom Volume 2014
GeochemistryHindawi Publishing Corporationhttpwwwhindawicom Volume 2014
Journal of
Atmospheric SciencesInternational Journal of
Hindawi Publishing Corporationhttpwwwhindawicom Volume 2014
OceanographyHindawi Publishing Corporationhttpwwwhindawicom Volume 2014
Advances in
Hindawi Publishing Corporationhttpwwwhindawicom Volume 2014
MineralogyInternational Journal of
Hindawi Publishing Corporationhttpwwwhindawicom Volume 2014
MeteorologyAdvances in
The Scientific World JournalHindawi Publishing Corporation httpwwwhindawicom Volume 2014
Paleontology JournalHindawi Publishing Corporationhttpwwwhindawicom Volume 2014
ScientificaHindawi Publishing Corporationhttpwwwhindawicom Volume 2014
Hindawi Publishing Corporationhttpwwwhindawicom Volume 2014
Geological ResearchJournal of
Hindawi Publishing Corporationhttpwwwhindawicom Volume 2014
Geology Advances in

2 Advances in Meteorology
AIG
WYN
KLO
ALT
SHAGUTREH
LUZ
CGIPUY
VAD
SIO
NEU
WAE
PAY
GLA
TAESMA
CHU
INT
FAH RUE
VIS
STG
PIO
CDF
ENG
ROB
DISFRE SCU
ULR
NAP
DAV
CHA
ZER
SBE
CIM
DOLSAMMLS
PIL
GUE
GSB
SAE
WFJ
COV
BER
GVE MVE
800 20 40(km)
France
N Germany
Italy
Switzer land
6∘E 7
∘E 8∘E 9
∘E 10∘E
6∘E 7
∘E 8∘E 9
∘E 10∘E
46∘N
47∘N
46∘N
47∘N
MeteoSwiss stationElevation (m)
ERA-Interim pointHigh 4783
Low 22
Figure 1 Location of the MeteoSwiss sites (triangles) and ERA-Interim 025∘ times 025∘ points (dots) The elevation ranges from 22 to 4783masl with a DEM resolution of 90m
for both GCM and RCM outputs before they are applied forenvironment impact models [22ndash26]
In a broad sense downscaling includes two purposesone is obtaining future emission scenarios (time series) forstations or regions or catchments from global climate models(eg HadAM3P) using the established statistical relationshipbetween measurements and large-scale predictors The otherpurpose is obtaining time series for nonmeasurement areaThis also could be treated as spatial interpolation or disaggre-gation to some extentMany previous studies have shown thata reproduction of station data and the generation of futuretimes series at the respective locations is extremely useful(eg [19 22 24])
In terms of downscaling methods dynamical andstatistical downscaling are the two main approaches Thelatter approach establishes the statistical connectionsbetween large-scale circulation variables (predictors) andlocal observed variables (predictands) [27 28] Comparedto dynamical downscaling statistical downscaling methodshave lower computational demands and allow for a fastapplication [27 29] Maraun et al [11] comprehensivelyreviewed precipitation downscaling methods from an enduserrsquos point-of-view For example local intensity scaling(LOCI) and quantile-mapping (QM) are the standardmethods used for correcting GCM or RCM outputs withrespect to local observations
Other methods focus on investigating the relationshipbetween local precipitation and large-scale atmosphere cir-culations which vary from linear regression (eg [30ndash35]) to complex nonlinear models (eg [36ndash40]) Althoughnumerous studies were carried out a general standardizedprecipitation downscaling method still does not exist espe-cially for complex terrains Furthermore a separate predictorselection process (eg principal components analysis) isusually implemented in order to search for the most sensitivevariables with regard to precipitation variations (eg [3439 41ndash44]) However this procedure costs the additionalcomputation time Therefore it is of particular interest tointroduce new approaches especially for the stations wherebenchmark methods do not work at all
To this end a new machine learning method the ldquoleastabsolute shrinkage and selection operator (LASSO)rdquo algo-rithm is introduced for downscaling ERA-Interim forecastprecipitation data in complex terrain Compared to standardlinear downscaling approaches LASSO is also well suitedfor possibly underdetermined linear regression problemsas well as for joint estimation and continuous variableselection It is tested and validated against three differentmethods local intensity scaling (LOCI) quantile-mapping(QM) and stepwise regression (Stepwise) using data from50 meteorological stations located in the high mountainousregion of the central Alps (Figure 1)
Advances in Meteorology 3
This paper is structured as follows Section 2 describes theERA-Interim forecast precipitation data and meteorologicalobservations in the study area Section 3 describes the fourdownscaling methods as well as the evaluation criteria Thedownscaling results and methods comparison are presentedin Section 4 while finally a discussion and subsequentconclusions are given in Section 5
2 Datasets
21 ERA-Interim We make use of the ERA-Interim forecastprecipitation data provided by the European Centre forMediumRangeWeather Forecast (ECMWF) for the year 1979onwards and continuing in real time [45 46] ERA-Interimshows some improvements when compared with ERA-40in these aspects a representation of the hydrological cyclean improved description of the stratospheric circulationand an enhanced handling of biases [46ndash49] Cycle 31r2 ofECMWFrsquos Integrated Forecast System (IFS) was used in hereThe model in this configuration comprises 60 vertical levelswith the top level at 01 hPa it uses theT255 spectral harmonicrepresentation for the basic dynamical fields and a reducedGaussian grid (N128) with an approximately uniform spacingof 79 km [46 50] ERA-Interim assimilates four analyses perday at 00 06 12 and 18 UTC Furthermore two 10-dayforecasts with a 3-hour resolution are initialized based on the0000 UTC and 1200 UTC analyses
A variety of data in uniform latlong grids (0125∘ 025∘05∘ 075∘ 1∘ 1125∘ 15∘ 2∘ 25∘ and 3∘) are availablefrom ECMWF datasets Here we apply 3-hourly forecastprecipitation data (03 06 09 12 15 18 21 and 24 UTC)initialized at 00 UTC from 1983ndash2010 which are projectedon the grid of 025∘ times 025∘ Daily precipitation is calculatedfrom eight times 3-hourly precipitation forecast In addition19 surface and upper-atmosphere variables (Table 1) areapplied as predictors according to previous studies (eg[38 40]) These 3-hourly predictors are aggregated into dailyaverages The used variables are listed in Table 1 We used00 UTC initialized forecasts and calculated the elevation inmeters asl by the normalization of the geopotential over thegravity
22 Test Sites Daily total precipitation of the period 1983ndash2010 at 50 meteorological stations was made availablethrough the interactive tools of IDAWEB which is designedby MeteoSwiss (the Swiss Federal Office of Meteorologyand Climatology) providing free available and extensivearchive data of ground level monitoring networks Table 2lists the information about stations and Figure 1 shows thelocations of test sites The stations are located within alarge range of altitude from 381m to 3305m Among thesestations 16 are located below 500m and 11 are situatedbetween 500m and 1000m 9 between 1000m and 1500m8 between 1500m and 2000m and 6 above 2000m Theobservations and ERA-Interim data are processed for thesame period The available data is partitioned into twoperiods 1983ndash1999 for calibration and 1999ndash2010 for valida-tion A 1mm threshold was defined for defining a drywetday
Table 1 Predictors from ERA-Interim forecast dataset All variablesare aggregated from 3-hourly to daily averages
Predictor DescriptionP ERA ERA-Interim precipitation (mm)MSLP Mean sea-level pressure (hPa)TCW Total column water (mm)U 10 10-meter 119880 wind component (m sminus1)V 10 10-meter 119881 wind component (m sminus1)WS 10 Wind speed (m sminus1)FG 10 10-meter wind gust (m sminus1)LSP Large-scale precipitation (mm)H 850 Geopotential height at 850 hPa (m)H 700 Geopotential height at 700 hPa (m)H 500 Geopotential height at 500 hPa (m)T 850 Temperature at 850 hPa (∘C)T 700 Temperature at 700 hPa (∘C)T 500 Temperature at 500 hPa (∘C)RH 850 Relative humidity at 850 hPa ()RH 700 Relative humidity at 700 hPa ()RH 500 Relative humidity at 500 hPa ()SH 850 Specific humidity at 850 hPa (g kgminus1)SH 700 Specific humidity at 700 hPa (g kgminus1)SH 500 Specific humidity at 500 hPa (g kgminus1)
It is necessary to note that the data of the stations GUEPAY and GVE are used within the ERA-interim data assimi-lation procedure given their status asWMO SYNOP stations[46 51] According to the information of the ECMWF it canbe assumed that the majority of the stations (47 of 50 sites)are not used by ERA-Interim and therefore represent a fullyindependent dataset
3 Methods
31 Local Intensity Scaling (LOCI) LOCI is a robustmethod to directly correct GCM or RCM outputs forlocal observations Although GCMs or RCMs are partlyunrealistic due to their coarse resolution they containvaluable information about the actual precipitation [11]The assumption is realized by a so-called scaling factorcalculated from observation and climate model data ofa reference period which is then expanded to scenariosdata Here LOCI is applied as the benchmark methodfor comparison with LASSO LOCI was developed byWidmann and Bretherton [52] Widmann et al [53] usedit for scenario precipitation corrections Not only GCMsbut also RCMs were corrected using the LOCI approach[54ndash56] Schmidli et al [57] further modified LOCI forprecipitation occurrence and amount correction separatelyIn this study LOCI is implemented based on a monthlyscaling factor which is calculated in three steps as follows
Fre (119875ERA ge 119875thresERA ) = Fre (119875obs ge 119875
thresobs )
SF =(119875obs ge 119875
thresobs ) minus 119875
thresobs
(119875ERA ge 119875thresERA ) minus 119875
thresERA
119875
119905= max (119875thresobs + SF (119875
ValERA minus 119875
thresERA ) 0)
(1)
4 Advances in Meteorology
Table 2 Test sites information ERA-Interim grid height is also listed
Site abbreviation Site name Latitude Longitude Site elevation (m) ERA-Interim grid elevation (m)COV Piz Corvatsch 4642 982 3305 1618WFJ Weissfluhjoch 4683 981 2690 1722SAE Santis 4725 934 2502 1154GSB Col du Grand St-Bernard 4587 717 2472 1493GUE Gutsch ob Andermatt 4665 862 2287 1432PIL Pilatus 4698 825 2106 1154MLS Le Moleson 4655 702 1974 1193SAM Samedan 4653 988 1709 1661DOL La Dole 4642 610 1670 699CIM Cimetta 4620 879 1661 1281SBE S Bernardino 4646 918 1639 1532ZER Zermatt 4603 775 1638 1552CHA Chasseral 4713 705 1599 669DAV Davos 4681 984 1594 1722MVE Montana 4630 747 1427 1470NAP Napf 4700 793 1403 1115ULR Ulrichen 4650 830 1345 1435SCU Scuol 4680 1028 1303 1818FRE BulletLa Fretaz 4683 658 1205 818DIS DisentisSedrun 4670 885 1197 1479ROB PoschiavoRobbia 4635 1007 1078 1394ENG Engelberg 4682 842 1035 1432CDF La Chaux-de-Fonds 4708 680 1018 770PIO Piotta 4652 868 990 1447STG St Gallen 4743 940 775 1027VIS Visp 4630 785 639 1498RUE Runenberg 4743 788 611 701FAH Fahy 4742 693 596 554INT Interlaken 4667 787 577 1325CHU Chur 4687 953 556 1668SMA ZurichFluntern 4738 857 555 780BER BernZollikofen 4698 747 552 1008TAE AadorfTanikon 4748 890 539 897GLA Glarus 4703 907 516 1312PAY Payerne 4682 695 490 1030WAE Wadenswil 4722 868 485 1011NEU Neuchatel 4700 695 485 849SIO Sion 4622 733 482 1408VAD Vaduz 4713 952 457 1226PUY Pully 4652 667 455 1100CGI NyonChangins 4640 623 455 835LUZ Luzern 4703 830 454 1154REH ZurichAffoltern 4743 852 443 780GUT Guttingen 4760 928 440 962SHA Schaffhausen 4768 862 438 662ALT Altdorf 4688 862 438 1193KLO ZurichKloten 4748 853 426 780WYN Wynau 4725 778 422 827GVE Geneve-Cointrin 4625 613 420 973AIG Aigle 4633 692 381 1346
Advances in Meteorology 5
where 119875119905is the target station precipitation 119875ValERA the un-
downscaled ERA-Interim data for validation 119875thresERA ERA-Interim precipitation threshold and 119875thresobs the observationthreshold and the brackets present the frequency conditionjudgment function Here 1mm is used to define wetdrydays and SF is the scaling factor In the first step an adjustedthreshold for ERA-Interim data is found that matches theoccurrence of wetdry days based on the 1mm threshold ofobservation In a second step the scaling factor is obtainedand then finally the target station precipitation is calculated
32 Quantile-Mapping (QM) QM introduced by Panof-sky and Brier [58] is a popular statistical transformationsapproach to correct GCM and RCM outputs straightfor-wardly [25 59ndash65] The distribution function (eg cumu-lative distribution function CDF) of model precipitationis first adjusted to match the distribution of observationsSubsequently this matched distribution is used for unbiasedmodel (or future scenario) data The mapping is usuallyimplemented based on empirical quantiles or quantiles ofgamma distributions [11 64] In this study the correctedERA-Interim can be obtained via
119875
119905= 119875
ValERA + Δ119891
Δ119891 = 119891
minus1
obscal (119891ERAcal (119875ValERA)) minus 119891
minus1
ERAcal (119891ERAcal (119875ValERA))
(2)
where 119891minus1obscal and 119891minus1
ERAcal is the inverse CDF of observationsand ERA-Interim for calibration respectively and 119891ERAcal isthe CDF of 119875ValERA
33 Stepwise Regression (Stepwise) Stepwise Regression(Stepwise hereafter) is an automatic procedure where Step-wise combines an ordinary regression (3) with a predictorvariable selection procedureThreemain approaches are usedin Stepwise according to the relevant selection sequenceforward selection backward elimination or bidirectionalelimination The advantage of stepwise regression is easilyexplained and implemented Several previous studies haveused stepwise regression for different purposes For exampleHarpham and Wilby [39] Hessami et al [42] and Huth[66] adopted Stepwise for predictor selection Agnihotriand Mohapatra [30] applied it to occurrence estimation ofdaily summer monsoon precipitation In this study stepwiseregression is adopted to test LASSO Stepwise regression isimplemented using backward elimination method with asignificance level of 005
119910
119894= 119909
119894119895120573
119895+ 120576 (3)
where119910 is the 119894times1 response vector119909 is the 119894times119895 variable vector120573 is the 119895times1 parameter vector and 120576 is the random errorsWeused the same set of 20 variables (Table 1) for Stepwise andLASSO for a better method comparison For precipitationoccurrence 119910 is defined as 1 for wet days (gt1mm) and 0 fordry days (lt1mm) All variables are standardized tomake datafall between 0 and 1
34 LASSO Algorithm Least absolute shrinkage and selec-tion operator (LASSO) is an alternative regularized versionof least squares which is useful for feature selection and toavoid overfitting problems LASSO shrinks the estimates ofthe regression coefficients towards zero to prevent overfittingproblem and to reduce variables by using a penalty parameter[67 68] To simplify understanding the history of LASSOis introduced briefly The following equation presents theordinary least squares regression (OLS) that tries tominimizethe error RSS (Root of Sum of Squares)
120573
ols= argmin
120573
119873
sum
119894=1
(119910
119894minus 120573
0minus
V
sum
119895=1
119909
119894119895120573
119895)
2
(4)
OLS is not always satisfactory for minimizing the RSSespecially when 119909 contains a large number of variables Apenalty parameter 120582 was added based on the normal OLS inLASSO (see the following equation)
120573
lasso= argmin
120573
119873
sum
119894=1
(119910
119894minus 120573
0minus
V
sum
119895=1
119909
119894119895120573
119895)
2
+ 120582
V
sum
119895=1
120573
119895
(5)
where V is the number of variables LASSO imposes inten-tionally that some coefficients have to be zero thus achievinga sparse model Thus the penalty parameter (regularizer) 120582controls the level of sparsity of the resulting model In thisstudy we applied an efficient algorithm for solving LASSO[69] Also we defined the value 1 for wet days (gt1mm) and 0for dry days (lt1mm) and all variables are standardized thesame as Stepwise
35 Evaluation Criteria Precipitation downscaling proce-dure is implemented in two steps Firstly precipitation occur-rence is modeled by the four methods respectively Secondlyprecipitation amount conditional on the occurrence of wetdays is modeled subsequently Please note that the resultsof precipitation occurrence ranges from 0 to 1 We defined05 as the threshold value to classify drywet days Themodeled precipitation amount also could be negative valuesTherefore we set these negative values to zeroThe root meansquare error (RMSE) and the mean absolute error (MAE)are used for the assessment of precipitation amount andcorrespondence ratio (CR) is applied for the evaluation ofdrywet days classification accuracy (6)-(7)
RMSE = radic 1119873
119873
sum
119905=1
(119875
119900minus 119875
119898)
2
MAE = 1119873
119873
sum
119905=1
1003816
1003816
1003816
1003816
119875
119900minus 119875
119898
1003816
1003816
1003816
1003816
(6)
where 119875119900and 119875
119898are observed and modeled precipitation
amount on wet days respectively 119873 is the number of wetdays
CR =119899dry + 119899wet
119873
(7)
6 Advances in Meteorology
0 5 10 15 20 25 30 35 40 45 50minus50
0
50
100
150
Station
Perc
ent (
)
minus2000
minus1000
0
1000
2000
Δh
(m)
Figure 2 Annual precipitation bias (bars) between ERA-Interimand MeteoSwiss stations in percent for the period 1983ndash2010 Pos-itive values indicate an overestimation of the annual precipitationby ERA-Interim and vice versa The line with dots indicates altitudedifferences Δℎ defined as ERA-Interim grid height minus siteelevation
Jan Feb Mar Apr May Jun Jul Aug Sep Oct Nov Dec07
075
08
085
09
095
CR
Original ERALOCIQM
StepwiseLASSO
Figure 3 Averaged correspondence ratio (CR) for each month inthe validation period 1999ndash2010
where 119899dry and 119899wet are the numbers of dry or wet days thatare correctly classified by downscaling methods
4 Results
41 Validation of the Original ERA-Interim Forecast Pre-cipitation Data Table 3 shows the comparison of ERA-Interim daily precipitation forecasts with observations at 50meteorological stations from 1983ndash2010 CR as well as theRMSE and MAE in mm is listed CR varies from 068 to 086andRMSE changes in the range of 440ndash1113mmwhileMAEranges from 222 to 519mmThe large errors show that thereis a great need for the correction and downscaling of ERA-Interim data at local stations The altitude differences changesharply in a large interval We use the abbreviations for thecharacterization of the stations StationCOV is 1687mhigherthan ERA-Interim grid height while station SCU is 515mlower than grid height ERA-Interim shows good agreementwith the occurrence of observations (068 to 086) but large
deviations with respect to the amount of precipitation onwet days However in contrast to temperature estimationsthe difference in altitude is unable to explain the observedbias For example station DOL has the highest CR withthe value of 086 but with a large elevation difference of971m Station ZER has a CR of 074 but its elevation matchesthe grid height very well with an altitude gap of only 86mThis again suggests that the general relationship betweenprecipitation and elevation is not easy to obtain due tothe great variability in the interaction between atmosphericcirculation and complex topographical characteristics
Figure 2 illustrates the bias (in percent) between ERA-Interim data and station precipitation observations for thetime period 1983ndash2010 Positive values indicate that annualprecipitation is overestimated by ERA-Interim and vice versaIn general ERA-Interim data overestimate observations theobserved annual precipitation for the majority of test sitesonly 7 of 50 sites are underestimated Among them stationGSB has the largest negative bias with a value of minus442 5out of 50 sites show an overestimation of more than 100Station WFJ and DAV are located in the same ERA-Interimgrid However ERA-Interim overestimated stationWFJ with75 and station DAV with a value of 456 Besides stationsPIL and LUZ are also in the same ERA-Interim grid ERA-Interim underestimates PILwith 252 In the contrast ERA-Interim overestimates LUZ with a value of 286 The lowerstations that are mainly located at the northern part of theAlps are underestimated by ERA-Interim
42 Evaluation of Downscaling Methods in PrecipitationOccurrence Theperformance of the four downscalingmeth-ods as well as the ERA-Interim original data in precipitationoccurrence in the validation period 1999ndash2010 is summa-rized in Table 4 The averaged CR showed that the fourdownscaling methods were much better than the originalERA-Interim data QM and LASSO had the same range ofCR from 082 to 088 LOCI ranged from 081 to 088 andStepwise varied from 082 to 087 QM estimated a worse CRthan the original ERA data at station GSB LASSO predictedthe worst occurrence at station DOL The four methods hadthe same performance at 7 sites For 11 sites LASSO andStepwise were the best methods in precipitation occurrencemodeling Figure 3 illustrates the averaged correspondenceratio for each month in the validation period 1999ndash2010 Itreveals that LOCI QM Stepwise and LASSO captured thegeneral tendency of the monthly precipitation occurrence forthe whole year LASSO and Stepwise identified better dry andwet days than LOCI and QM in May but they performedworse in October LASSO classified drywet days similarlywith Stepwise for all 12 monthsThe result shows that LASSOis quite suitable for drywet days classification
Figure 4 shows the used variables in Stepwise andLASSO for drywet days classification LASSO selected morevariables than Stepwise For LASSO P ERA T 700 andTCW were the most frequent (50 sites) variables RH 500was the least frequently (17 sites) applied by LASSO P ERAand U 10 were the most frequent (more than 45 sites)variables in Stepwise T 500 was the least frequent variable
Advances in Meteorology 7
Table 3 Comparison of ERA-Interim forecast daily precipitation with observations at 50 meteorological stations from 1983 to 2010 CRRMSE and MAE in mm are listed The elevations of sites are different with ERA-Interim grid heights so the altitude differences (Δℎ ERA-Interim grid height minus elevation) are also labeled
Site CR RMSE MAE Δℎ
COV 076 466 237 minus1687WFJ 079 583 293 minus968SAE 084 1113 519 minus1348GSB 083 1086 459 minus979GUE 079 696 330 minus855PIL 082 918 397 minus952MLS 079 540 273 minus781SAM 068 484 262 minus48DOL 086 604 276 minus971CIM 076 897 345 minus380SBE 074 916 391 minus107ZER 074 533 264 minus86CHA 080 523 256 minus930DAV 076 510 269 128MVE 075 552 275 43NAP 082 570 279 minus288ULR 075 633 314 90SCU 069 498 274 515FRE 082 508 246 minus387DIS 075 612 305 282ROB 077 546 250 316ENG 081 591 301 397CDF 084 487 233 minus248PIO 072 817 358 457STG 081 548 274 252VIS 068 566 298 859RUE 079 462 238 90FAH 081 440 222 minus42INT 079 524 270 748CHU 072 519 281 1112SMA 080 485 244 225BER 078 507 259 456TAE 080 491 255 358GLA 080 555 287 796PAY 077 545 284 540WAE 081 555 271 526NEU 077 508 259 364SIO 069 518 280 926VAD 076 511 269 769PUY 080 576 279 645CGI 079 499 256 380LUZ 078 546 279 700REH 079 473 242 337GUT 077 501 266 522SHA 078 447 233 224ALT 077 532 274 755KLO 078 483 249 354WYN 079 471 237 405GVE 078 513 261 553AIG 079 482 244 965Average 078 579 284 100
8 Advances in Meteorology
Table 4 Comparison of downscaling methods as well as the original ERA-Interim forecast data in precipitation occurrence in the validationperiod 1999ndash2010
Site CRERA LOCI QM Stepwise LASSO
COV 076 085 084 082 082WFJ 078 082 082 085 085SAE 083 084 084 084 084GSB 083 083 082 085 085GUE 078 081 082 083 083PIL 081 084 084 083 083MLS 076 083 083 084 084SAM 068 086 085 084 084DOL 086 088 088 086 085CIM 077 085 084 087 087SBE 074 083 082 086 086ZER 074 084 084 084 084CHA 080 085 085 083 083DAV 075 084 084 085 084MVE 074 083 083 085 085NAP 081 085 085 084 084ULR 075 084 083 084 084SCU 069 086 086 085 085FRE 082 087 087 085 085DIS 075 084 084 083 083ROB 076 084 083 086 086ENG 080 082 082 084 084CDF 084 086 087 085 085PIO 071 084 083 087 087STG 081 085 084 084 084VIS 068 085 085 085 085RUE 078 085 084 083 083FAH 081 086 086 085 085INT 079 085 085 085 085CHU 071 084 083 084 084SMA 080 086 086 083 083BER 077 086 086 085 085TAE 080 086 086 085 085GLA 079 084 084 086 086PAY 076 086 085 085 085WAE 081 085 085 084 085NEU 077 087 086 085 085SIO 069 087 087 087 088VAD 076 086 085 085 085PUY 079 087 086 086 086CGI 078 088 088 087 087LUZ 077 084 084 084 084REH 079 085 085 083 084GUT 078 084 084 084 084SHA 078 085 085 083 083ALT 077 084 084 084 084KLO 079 085 085 084 084WYN 079 086 086 085 085GVE 078 088 087 086 086AIG 078 086 086 087 086Average 077 085 085 085 085
Advances in Meteorology 9
05
101520253035404550
Predictors
Num
ber o
f st
atio
ns
StepwiseLASSO
PERA
H850
H700
H500
T850
T700
T500
RH
850
RH
700
RH
500
SH
850
SH
700
SH
500
TCW
U10
V10
FG
10
WG
10
MSL
P
LSP
Figure 4 Selected variables in Stepwise and LASSO for drywet days classification
For the individual sites station INT selected least variables(12 variables) while station COV CHA and CGI chose themost variables (20 variables) in LASSO Stepwise selected 16variables at stations GSB CHA FAH and SMA while it onlyapplied 9 variables at stations SAM and PIO LASSO appliedmore variables compared with Stepwise for the majorityof stations (49 stations) Although different variables areapplied by the two methods the performances of drywetdays classification were similar
43 Evaluation of Downscaling Methods in PrecipitationAmount The overall performance of four downscalingmethods as well as the ERA-Interim original data in precipi-tation amount conditional on the occurrence of a wet day forthe validation period 1999ndash2010 is summarized in Table 5On the average Stepwise and LASSO performed similarly inRMSE and MAE which were much smaller than LOCI andQM The reduction of error of Stepwise was 122 of RMSEand 157 of MAE respectively LASSO was slightly betterthan Stepwise in MAE (163) and it had the same errorreductionwith Stepwise in RMSE (122) whereas LOCI andQM were the worst methods The reduction of RMSE wasonly 35 and 09 for LOCI and QM respectively In totalLOCI and QM did not reduce RMSE at 13 stations such asstation WFJ QM was the worst method at 24 stations whileLOCI performed the worst in RMSE at stations ENG andCDF LASSO outperformed the other methods at 9 stationsStepwise reduced the most RMSE at 40 stations comparedwith other three methods However the four downscalingmethods failed to reduce the errors at station CHA Interms of MAE LOCI outperformed the other methods at 26stations LASSO reduced the most MAE at 22 stations QMmethod was not able to reduce MAE at 5 stations It could beconcluded that LOCI andQMmethod are not always suitablefor local stations It has to be noted that the four downscalingmethods did not work for MAE reduction at station DOL
which has a large elevation difference of 971m against ERA-Interim grid height
Taking station WFJ as an example Figures 5 and 6illustrate the downscaled daily precipitation for the fourdownscaling methods as well as the original ERA-Interimdata in January and July respectively for the validationperiod 1999ndash2010 In general four downscaling methodscapture the tendency of the daily precipitation in Januaryand July However LOCI and QM are generally inclined tomisidentify the heavy precipitation events in particular inJanuary 2008 and July 2003 Stepwise and LASSO underes-timated heavy precipitation events compared with LOCI andQM
Figure 7 illustrates the comparison of observations withdownscaled annual precipitation for the fourmethods as wellas the original ERA-Interim data in the validation period1999ndash2010 LASSO and Stepwise predicted the annual precip-itation best In general LOCI and QMmodeled drier resultswith mean value of minus77 and minus50 respectively 31 out of50 sites were underestimated by LASSO with the range fromminus19 (station KLO) to minus01 (station RUE) while 19 siteswere overestimated by 02 (station SCU) to 316 (stationMLS) The majority of sites were underestimated by LOCI(48 out of 50 sites) and QM (40 out of 50 sites) while 30 of 50sites were underestimated by Stepwise Figure 8 compares theaveraged sum of daily precipitation for each month betweenobservations and the four downscaling methods as well asthe original ERA-Interim data in the validation period 1999ndash2010 It is easy to find that LASSO and Stepwise predictedmore precipitation in the whole year than LOCI and QMwith exception of August and November LASSO reproducedbest monthly precipitation for February March April andNovember Stepwise was the best method for May JuneJuly and October QM performed best in January Augustand September LOCI outperformed the other methods inDecember
10 Advances in Meteorology
Table 5 Comparison of observations with downscaled daily precipitation for the four downscaling methods as well as the original ERA-Interim data in precipitation amount (mm) on wet days for the validation period 1999ndash2010
Site RMSE MAEERA LOCI QM Stepwise LASSO ERA LOCI QM Stepwise LASSO
COV 453 414 431 387 387 233 176 183 180 178WFJ 612 629 645 547 546 303 289 295 271 268SAE 1189 1109 1126 974 975 556 549 558 501 501GSB 1120 1059 1065 918 918 461 472 478 449 448GUE 650 638 679 585 585 316 284 291 295 294PIL 1042 1004 990 957 956 430 421 418 423 420MLS 585 528 565 467 466 302 241 250 237 234SAM 473 390 405 360 360 258 146 154 155 153DOL 571 592 602 540 539 263 264 270 272 270CIM 879 946 956 809 809 348 346 352 352 352SBE 927 908 991 751 750 398 376 398 352 351ZER 510 416 450 365 365 255 161 165 164 162CHA 550 561 577 552 552 262 247 252 260 258DAV 518 482 489 444 445 272 211 215 209 207MVE 532 486 497 421 421 272 208 211 214 213NAP 615 647 650 610 610 297 298 300 295 294ULR 623 592 621 568 571 311 252 260 270 269SCU 493 372 398 355 355 272 146 154 157 154FRE 515 543 556 491 491 246 230 234 226 225DIS 597 533 549 529 529 300 218 220 237 236ROB 572 614 624 509 508 266 240 247 237 236ENG 616 664 641 579 579 313 317 310 293 290CDF 501 544 544 489 489 234 237 240 236 233PIO 788 772 798 676 677 354 299 309 316 316STG 567 581 592 555 553 276 254 258 260 257VIS 549 412 453 375 375 292 152 160 162 161RUE 462 457 468 415 415 240 198 203 200 198FAH 467 469 478 444 445 228 199 204 205 202INT 521 530 534 482 481 271 233 235 233 232CHU 519 448 482 420 421 280 188 196 191 190SMA 486 495 514 471 472 244 217 223 218 216BER 514 516 523 468 468 264 215 220 218 216TAE 474 480 497 451 451 254 224 230 228 226GLA 560 602 605 529 529 287 280 282 265 264PAY 530 451 460 396 397 283 186 192 190 188WAE 550 596 605 540 540 274 267 271 267 264NEU 500 485 490 434 434 260 195 200 197 194SIO 498 352 365 309 308 274 137 143 148 146VAD 526 461 483 438 438 272 187 194 191 190PUY 558 557 576 506 506 276 228 236 244 243CGI 495 450 469 414 415 255 183 190 186 185LUZ 540 548 552 521 521 281 245 248 255 252REH 491 482 488 454 455 246 204 207 204 203GUT 484 434 456 396 397 260 191 198 191 189SHA 436 425 434 390 390 231 185 188 183 180ALT 547 547 557 523 523 280 239 244 240 237KLO 490 483 497 462 463 251 207 211 207 205WYN 487 523 531 460 460 246 221 224 219 217GVE 513 472 490 453 453 261 187 196 193 193AIG 469 455 465 402 402 243 191 197 199 197Average 583 563 578 512 512 287 241 246 242 240
Advances in Meteorology 11
0204060
ObservationOriginal era
0204060
ObservationLOCI
0204060
ObservationQM
0204060
ObservationStepwise
1999 2000 2001 2002 2003 2004 2005 2006 2007 2008 2009 2010
1999 2000 2001 2002 2003 2004 2005 2006 2007 2008 2009 2010
1999 2000 2001 2002 2003 2004 2005 2006 2007 2008 2009 2010
1999 2000 2001 2002 2003 2004 2005 2006 2007 2008 2009 2010
1999 2000 2001 2002 2003 2004 2005 2006 2007 2008 2009 2010
020406080
Dai
ly p
reci
pita
tion
(mm
)D
aily
pre
cipi
tatio
n
(m
m)
Dai
ly p
reci
pita
tion
(mm
)D
aily
pre
cipi
tatio
n
(m
m)
Dai
ly p
reci
pita
tion
(mm
)
ObservationLASSO
Figure 5 Comparison of observations with downscaled daily precipitation for the four downscaling methods as well as the original ERA-Interim data in January at station WFJ during the validation period 1999ndash2010
Figure 9 shows the used variables in Stepwise and LASSOfor precipitation amount prediction on wet days LASSOagain selected more variables than Stepwise For LASSOP ERA H 850 H 700 H 500 T 850 and MSLP wereapplied at all 50 sites SH 500 was applied at 25 sites P ERAwas the sole variable used by all test sites by Stepwise SH 850and U 10 were the second most frequent (34 sites) variablesRH 700 and RH 500 were the least frequent variables (10sites) by Stepwise For the individual sites station VAD usedthe least variables (11 variables) while 19 stations selectedall 20 variables in LASSO Station SBE applied the mostvariables (16 out of 20 vairables) while station WYN onlyapplied 4 variables in Stepwise
5 Discussion and Conclusion
The comparison between ERA-Interim and observationsshowed that ERA-Interimhas a large error (579mmofRMSEand 284mm of MAE) in the central Alps (Table 3) Thusthere is a great need for the correction and downscaling ofERA-Interim data This study compared four downscalingmethods LOCI QM Stepwise and LASSO for downscalingof ERA-Interim daily precipitation data in the central Alps
As a frequent input variable for hydrological modelsdaily precipitation is always corrected or downscaled dueto the limits of rain gauges In the previous studies (eg[57 63]) LOCI and QM methods have been widely used for
12 Advances in Meteorology
1999 2000 2001 2002 2003 2004 2005 2006 2007 2008 2009 20100
20406080
ObservationOriginal era
1999 2000 2001 2002 2003 2004 2005 2006 2007 2008 2009 20100
20406080
ObservationLOCI
1999 2000 2001 2002 2003 2004 2005 2006 2007 2008 2009 20100
20406080
ObservationQM
1999 2000 2001 2002 2003 2004 2005 2006 2007 2008 2009 20100
20406080
ObservationStepwise
1999 2000 2001 2002 2003 2004 2005 2006 2007 2008 2009 20100
20406080
Dai
ly p
reci
pita
tion
(mm
)D
aily
pre
cipi
tatio
n
(m
m)
Dai
ly p
reci
pita
tion
(mm
)D
aily
pre
cipi
tatio
n
(m
m)
Dai
ly p
reci
pita
tion
(mm
)
ObservationLASSO
Figure 6 Comparison of observations with downscaled daily precipitation for the four downscaling methods as well as the original ERA-Interim data in July at station WFJ during the validation period 1999ndash2010
the bias correction with the advantages of maintaining thevariation and distribution of historical data Although LOCIand QM captured the best estimation of daily precipitationoccurrence the reduction of error is not significant by thesetwo methods and even worse than the original ERA-Interimdata for 13 out of 50 sites It demonstrates that straightforwardmethods are not always suitable for downscaling local obser-vations in complex terrain
LASSO algorithm simulated the occurrence of dailyprecipitation as well as LOCI QM and Stepwise it capturedthe occurrence for all test sites generally Compared tothe other three downscaling methods it reduced the mostamount error to 163 of MAE and 122 RMSE LASSO
also predicted the best annual and monthly precipitationAlthough the LASSO algorithm has been developed for morethan 15 years by statistician the application in geosciences isstill at the early-stage (eg [70]) A main practical challengein applying LASSO for precipitation downscaling is thatprecipitation in heterogeneous terrain is such a complexprocesswhich tends to usemore variables and to overestimateobservations It has shown that LASSO tends to use morevariables than Stepwise To avoid the overfitting problem thepenalty (or regularization) parameter 120582 plays a key role Thecross-validation and hundreds of runs are necessary to findan appropriate penalty parameterTherefore LASSO is a littlebit time-consuming than the other three methods
Advances in Meteorology 13
0 5 10 15 20 25 30 35 40 45 50
minus40minus20
020406080
100120140160
Station
Perc
ent (
)
Original ERALOCIQM
StepwiseLASSO
Figure 7 Percentage of annual precipitation bias between observations and the four downscaled results as well as the original ERA-Interimdata in the validation period 1999ndash2010
Jan Feb Mar Apr May Jun Jul Aug Sep Oct Nov Dec0
20
40
60
80
100
120
140
160
180
Mon
thly
pre
cipi
tatio
n (m
m)
ObservationOriginal eraLOCI
QMStepwiseLASSO
Figure 8 Comparison of averaged sum of daily precipitation for each month between observations and the four downscaled results as wellas the original ERA-Interim data in the validation period 1999ndash2010
So far the work presented herein has been limited tothe central Alps with 50 meteorological stations providingcalibrationvalidation data sets for testing LASSO algorithmIt would be necessary to extend LASSO method to otherhighmountainous areas around the world Besides this studyfocuses on the local stations at present it is of special interestto extend LASSO method for nonstation areas A limitednumber of variables (20 variables in this study) derived fromERA-Interimdatawere applied for LASSO however it shouldalso be investigated whether other potential variables suchas vapor pressure can be used in the presented approach
This study focused on the daily total precipitation Certainlyhigher temporal resolution data such as 3-hourly would be ofgreat interest in further investigations Furthermore applyingother reanalysis data sets based on different land surfacerepresentations could also be valuable for validating LASSOalgorithm
Conflict of Interests
The authors declare that there is no conflict of interests in thispaper
14 Advances in Meteorology
05
101520253035404550
Predictors
Num
ber o
f st
atio
ns
StepwiseLASSO
PERA
H850
H700
H500
T850
T700
T500
RH
850
RH
700
RH
500
SH
850
SH
700
SH
500
TCW
U10
V10
FG
10
WG
10
MSL
P
LSP
Figure 9 Selected variables in Stepwise and LASSO for precipitation amount prediction on wet days
Acknowledgments
This research has been funded by China Scholarship Council(CSC) ERA-Interim data was supported by the ECMWFTheauthors would like to thank MeteoSwiss (the Swiss FederalOffice of Meteorology and Climatology) for providing theneeded meteorological data The authors appreciate OURA-NOS and Josef Schmid (Ludwig-Maximilians-UniversitatMunchen) for providing a tool for the data processing
References
[1] R E Benestad I Hanssen-Bauer and E J Foslashrland ldquoAnevaluation of statistical models for downscaling precipitationand their ability to capture long-term trendsrdquo InternationalJournal of Climatology vol 27 no 5 pp 649ndash665 2007
[2] X Beuchat B Schaefli M Soutter and A Mermoud ldquoTowarda robust method for subdaily rainfall downscaling from dailydatardquoWater Resources Research vol 47 no 9 2011
[3] H Guan J L Wilson and H Xie ldquoA cluster-optimizingregression-based approach for precipitation spatial downscal-ing in mountainous terrainrdquo Journal of Hydrology vol 375 no3-4 pp 578ndash588 2009
[4] M Bray D Han Y Xuan P Bates and M Williams ldquoRainfalluncertainty for extreme events in NWP downscaling modelrdquoHydrological Processes vol 25 no 9 pp 1397ndash1406 2011
[5] R E Chandler and H S Wheater ldquoAnalysis of rainfall variabil-ity using generalized linearmodels a case study from thewest ofIrelandrdquoWater Resources Research vol 38 no 10 pp 10-1ndash10-112002
[6] B L Lamptey ldquoComparison of gridded multisatellite rainfallestimates with gridded gauge rainfall overWest Africardquo Journalof Applied Meteorology and Climatology vol 47 no 1 pp 185ndash205 2008
[7] C Daly M Halbleib J I Smith et al ldquoPhysiographically sen-sitive mapping of climatological temperature and precipitationacross the conterminous United Statesrdquo International Journal ofClimatology vol 28 no 15 pp 2031ndash2064 2008
[8] R Fealy and J Sweeney ldquoStatistical downscaling of precipitationfor a selection of sites in Ireland employing a generalised linear
modelling approachrdquo International Journal of Climatology vol27 no 15 pp 2083ndash2094 2007
[9] L Ferraris S Gabellani N Rebora and A Provenzale ldquoA com-parison of stochastic models for spatial rainfall downscalingrdquoWater Resources Research vol 39 no 12 2003
[10] A M Anders G H Roe D R Durran and J R MinderldquoSmall-scale spatial gradients in climatological precipitation onthe olympic Peninsulardquo Journal of Hydrometeorology vol 8 no5 pp 1068ndash1081 2007
[11] D Maraun F Wetterhall A M Ireson et al ldquoPrecipitationdownscaling under climate change Recent developments tobridge the gap between dynamical models and the end userrdquoReviews of Geophysics vol 48 no 3 pp 1ndash34 2010
[12] J M Eden M Widmann D Grawe and S Rast ldquoSkillcorrection and downscaling of GCM-simulated precipitationrdquoJournal of Climate vol 25 no 11 pp 3970ndash3984 2012
[13] M G Grillakis A G Koutroulis and I K Tsanis ldquoMulti-segment statistical bias correction of daily GCM precipitationoutputrdquo Journal of Geophysical ResearchDAtmospheres vol 118no 8 pp 3150ndash3162 2013
[14] T Lafon S Dadson G Buys and C Prudhomme ldquoBiascorrection of daily precipitation simulated by a regional climatemodel a comparison of methodsrdquo International Journal ofClimatology vol 33 no 6 pp 1367ndash1381 2013
[15] E P Maurer A W Wood J C Adam D P Lettenmaier andB Nijssen ldquoA long-term hydrologically based dataset of landsurface fluxes and states for the conterminous United StatesrdquoJournal of Climate vol 15 no 22 pp 3237ndash3251 2002
[16] B Ahrens ldquoRainfall downscaling in an alpine watershedapplying a multiresolution approachrdquo Journal of GeophysicalResearch Atmospheres vol 108 no D8 2003
[17] S P Charles B C Bates I N Smith and J PHughes ldquoStatisticaldownscaling of daily precipitation from observed andmodelledatmospheric fieldsrdquo Hydrological Processes vol 18 no 8 pp1373ndash1394 2004
[18] F Giorgi and L O Mearns ldquoApproaches to the simulation ofregional climate change a reviewrdquo Reviews of Geophysics vol29 no 2 pp 191ndash216 1991
[19] M J Muerth B Gauvin St-Denis S Ricard et al ldquoOn the needfor bias correction in regional climate scenarios to assess climate
Advances in Meteorology 15
change impacts on river runoffrdquo Hydrology and Earth SystemSciences vol 17 no 3 pp 1189ndash1204 2013
[20] C Xu ldquoFrom GCMs to river flow a review of downscalingmethods and hydrologic modelling approachesrdquo Progress inPhysical Geography vol 23 no 2 pp 229ndash249 1999
[21] M Bernhardt K Schulz G E Liston and G Zangl ldquoTheinfluence of lateral snow redistribution processes on snow meltand sublimation in alpine regionsrdquo Journal of Hydrology vol424-425 pp 196ndash206 2012
[22] K F Ahmed GWang J Silander et al ldquoStatistical downscalingand bias correction of climate model outputs for climate changeimpact assessment in the US northeastrdquo Global and PlanetaryChange vol 100 pp 320ndash332 2013
[23] T Crawford N L Betts and D Favis-Mortlock ldquoGCM grid-box choice and predictor selection associated with statisticaldownscaling of daily precipitation over Northern IrelandrdquoClimate Research vol 34 no 2 pp 145ndash160 2007
[24] L Gao M Bernhardt and K Schulz ldquoElevation correction ofERA-Interim temperature data in complex terrainrdquo Hydrologyand Earth System Sciences vol 16 no 12 pp 4661ndash4673 2012
[25] L Gudmundsson J B Bremnes J E Haugen and T Engen-Skaugen ldquoTechnical note downscaling RCM precipitation tothe station scale using statistical transformationsmdasha compari-son of methodsrdquo Hydrology and Earth System Sciences vol 16no 9 pp 3383ndash3390 2012
[26] E Hertig and J Jacobeit ldquoAssessments ofMediterranean precip-itation changes for the 21st century using statistical downscalingtechniquesrdquo International Journal of Climatology vol 28 no 8pp 1025ndash1045 2008
[27] R L Wilby and T M L Wigley ldquoDownscaling general cir-culation model output a review of methods and limitationsrdquoProgress in Physical Geography vol 21 no 4 pp 530ndash548 1997
[28] E Zorita and H Von Storch ldquoThe analog method as a simplestatistical downscaling technique comparison with more com-plicated methodsrdquo Journal of Climate vol 12 no 8 pp 2474ndash2489 1999
[29] R L Wilby C W Dawson and E M Barrow ldquoSDSMmdashadecision support tool for the assessment of regional climatechange impactsrdquo Environmental Modelling and Software vol 17no 2 pp 147ndash159 2002
[30] G Agnihotri and M Mohapatra ldquoPrediction of occurrence ofdaily summer monsoon precipitation over Karnatakardquo Meteo-rological Applications vol 19 no 2 pp 130ndash139 2012
[31] R E Benestad ldquoA comparison between two empirical down-scaling strategiesrdquo International Journal of Climatology vol 21no 13 pp 1645ndash1668 2001
[32] G Burger and Y Chen ldquoRegression-based downscaling of spa-tial variability for hydrologic applicationsrdquo Journal ofHydrologyvol 311 no 1ndash4 pp 299ndash317 2005
[33] E Hertig and J Jacobeit ldquoA novel approach to statisticaldownscaling considering nonstationarities application to dailyprecipitation in the Mediterranean areardquo Journal of GeophysicalResearch-Atmospheres vol 118 2013
[34] J T Schoof and S C Pryor ldquoDownscaling temperature andprecipitation a comparison of regression-based methods andartificial neural networksrdquo International Journal of Climatologyvol 21 no 7 pp 773ndash790 2001
[35] H Tatli H N Dalfes and S S Mentes ldquoA statistical down-scaling method for monthly total precipitation over TurkeyrdquoInternational Journal of Climatology vol 24 no 2 pp 161ndash1802004
[36] A Bardossy I Bogardi and I Matyasovszky ldquoFuzzy rule-based downscaling of precipitationrdquo Theoretical and AppliedClimatology vol 82 no 1-2 pp 119ndash129 2005
[37] A J Cannon ldquoNonlinear analog predictor analysis A coupledneural networkanalog model for climate downscalingrdquo NeuralNetworks vol 20 no 4 pp 444ndash453 2007
[38] S T Chen P S Yu and Y H Tang ldquoStatistical downscaling ofdaily precipitation using support vector machines and multi-variate analysisrdquo Journal of Hydrology vol 385 no 1ndash4 pp 13ndash22 2010
[39] C Harpham and R L Wilby ldquoMulti-site downscaling ofheavy daily precipitation occurrence and amountsrdquo Journal ofHydrology vol 312 no 1ndash4 pp 235ndash255 2005
[40] D N Kumar A Anandhi V V Srinivas and R S NanjundiahldquoDownscaling precipitation to river basin in India for IPCCSRES scenarios using support vector machinerdquo InternationalJournal of Climatology vol 28 no 3 pp 401ndash420 2008
[41] S Ghosh ldquoSVM-PGSL coupled approach for statistical down-scaling to predict rainfall from GCM outputrdquo Journal of Geo-physical Research D Atmospheres vol 115 no 22 Article IDD22102 2010
[42] M Hessami P Gachon T B M J Ouarda and A St-Hilaire ldquoAutomated regression-based statistical downscalingtoolrdquo Environmental Modelling and Software vol 23 no 6 pp813ndash834 2008
[43] J Schmidli C Frei and C Schar ldquoReconstruction of mesoscaleprecipitation fields from sparse observations in complex ter-rainrdquo Journal of Climate vol 14 no 15 pp 3289ndash3306 2001
[44] R L Wilby and T M L Wigley ldquoPrecipitation predictors fordownscaling observed and general circulation model relation-shipsrdquo International Journal of Climatology vol 20 no 6 pp641ndash661 2000
[45] P Berrisford D Dee K Fielding et alTheERA-InterimArchive(Version 10) ERA Report Series European Centre for MediumRange Weather Forecasts Berkshire UK 2009
[46] D P Dee S M Uppala A J Simmons et al ldquoThe ERA-Interimreanalysis Configuration and performance of the data assim-ilation systemrdquo Quarterly Journal of the Royal MeteorologicalSociety vol 137 no 656 pp 553ndash597 2011
[47] D P Dee and S Uppala ldquoVariational bias correction of satelliteradiance data in the ERA-Interim reanalysisrdquoQuarterly Journalof the Royal Meteorological Society vol 135 no 644 pp 1830ndash1841 2009
[48] A Simmons S Uppala D Dee et al ldquoERA-Interim newECMWF reanalysis products from 1989 onwardsrdquo ECMWFNewsletter vol 110 pp 25ndash35 2006
[49] D Dee and S Uppala ldquoVariational bias correction in ERA-Interimrdquo ECMWF Technical Memorandum 575 2008
[50] S Uppala D Dee and S Kobayashi ldquoTowards a climate dataassimilation system status updata of ERA-Interimrdquo ECMWFNewsletter vol 115 pp 12ndash18 2008
[51] A J Simmons K M Willett P D Jones P W Thorneand D P Dee ldquoLow-frequency variations in surface atmo-spheric humidity temperature and precipitation inferencesfrom reanalyses and monthly gridded observational data setsrdquoJournal of Geophysical Research D Atmospheres vol 115 no 1Article ID D01110 2010
[52] M Widmann and C S Bretherton ldquoValidation of mesoscaleprecipitation in the NCEP reanalysis using a new gridcelldataset for the Northwestern United Statesrdquo Journal of Climatevol 13 no 11 pp 1936ndash1950 2000
16 Advances in Meteorology
[53] M Widmann C S Bretherton and E P Salathe Jr ldquoStatisticalprecipitation downscaling over the northwestern united statesusing numerically simulated precipitation as a predictorrdquo Jour-nal of Climate vol 16 no 5 pp 799ndash816 2003
[54] T Engen-Skaugen ldquoRefinement of dynamically downscaledprecipitation and temperature scenariosrdquo Climatic Change vol84 no 3-4 pp 365ndash382 2007
[55] L P Graham J Andreaasson and B Carlsson ldquoAssessingclimate change impacts on hydrology from an ensemble ofregional climate models model scales and linking methods acase study on the Lule River basinrdquo Climatic Change vol 81 no1 pp 293ndash307 2007
[56] R Leander T A Buishand B J JM van denHurk andM JMdeWit ldquoEstimated changes in flood quantiles of the riverMeusefrom resampling of regional climate model outputrdquo Journal ofHydrology vol 351 no 3-4 pp 331ndash343 2008
[57] J Schmidli C Frei and P L Vidale ldquoDownscaling fromGCM precipitation a benchmark for dynamical and statisticaldownscaling methodsrdquo International Journal of Climatologyvol 26 no 5 pp 679ndash689 2006
[58] H W Panofsky and G W Brier Some Applications of Statisticsto Meteorology The Pennsylvania State University Press Uni-versity Park Pa USA 1968
[59] J Boe L Terray F Habets and E Martin ldquoStatistical anddynamical downscaling of the Seine basin climate for hydro-meteorological studiesrdquo International Journal of Climatologyvol 27 no 12 pp 1643ndash1655 2007
[60] CDobler SHagemann R LWilby and J Stotter ldquoQuantifyingdifferent sources of uncertainty in hydrological projections inan Alpine watershedrdquoHydrology and Earth System Sciences vol16 no 11 pp 4343ndash4360 2012
[61] T Hashino A A Bradley and S S Schwartz ldquoEvaluationof bias-correction methods for ensemble streamflow volumeforecastsrdquo Hydrology and Earth System Sciences vol 11 no 2pp 939ndash950 2007
[62] C Piani G PWeedon M Best et al ldquoStatistical bias correctionof global simulated daily precipitation and temperature for theapplication of hydrological modelsrdquo Journal of Hydrology vol395 no 3-4 pp 199ndash215 2010
[63] M J Themeszligl A Gobiet and G Heinrich ldquoEmpirical-statistical downscaling and error correction of regional climatemodels and its impact on the climate change signalrdquo ClimaticChange vol 112 no 2 pp 449ndash468 2012
[64] M Jakob Themeszligl A Gobiet and A Leuprecht ldquoEmpirical-statistical downscaling and error correction of daily precipi-tation from regional climate modelsrdquo International Journal ofClimatology vol 31 no 10 pp 1530ndash1544 2011
[65] A W Wood L R Leung V Sridhar et al ldquoHydrologic impli-cations of dynamical and statistical approaches to downscalingclimate model outputsrdquo Climatic Change vol 62 no 1ndash3 pp189ndash216 2004
[66] R Huth ldquoStatistical downscaling of daily temperature in centralEuroperdquo Journal of Climate vol 15 no 13 pp 1731ndash1742 2002
[67] J Friedman T Hastie H Hofling and R Tibshirani ldquoPathwisecoordinate optimizationrdquoTheAnnals of Applied Statistics vol 1no 2 pp 302ndash332 2007
[68] R Tibshirani ldquoRegression shrinkage and selection via the lassordquoJournal of the Royal Statistical Society B Methodological vol 58no 1 pp 267ndash288 1996
[69] W J Fu ldquoPenalized regressions the bridge versus the lassordquoJournal of Computational and Graphical Statistics vol 7 no 3pp 397ndash416 1998
[70] A M Ebtehaj E Foufoula-Georgiou and G Lerman ldquoSparseregularization for precipitation downscalingrdquo Journal of Geo-physical Research D Atmospheres vol 117 no D8 Article IDD08107 2012
Submit your manuscripts athttpwwwhindawicom
Hindawi Publishing Corporationhttpwwwhindawicom Volume 2014
ClimatologyJournal of
EcologyInternational Journal of
Hindawi Publishing Corporationhttpwwwhindawicom Volume 2014
EarthquakesJournal of
Hindawi Publishing Corporationhttpwwwhindawicom Volume 2014
Hindawi Publishing Corporationhttpwwwhindawicom
Applied ampEnvironmentalSoil Science
Volume 2014
Mining
Hindawi Publishing Corporationhttpwwwhindawicom Volume 2014
Journal of
Hindawi Publishing Corporation httpwwwhindawicom Volume 2014
International Journal of
Geophysics
OceanographyInternational Journal of
Hindawi Publishing Corporationhttpwwwhindawicom Volume 2014
Journal of Computational Environmental SciencesHindawi Publishing Corporationhttpwwwhindawicom Volume 2014
Journal ofPetroleum Engineering
Hindawi Publishing Corporationhttpwwwhindawicom Volume 2014
GeochemistryHindawi Publishing Corporationhttpwwwhindawicom Volume 2014
Journal of
Atmospheric SciencesInternational Journal of
Hindawi Publishing Corporationhttpwwwhindawicom Volume 2014
OceanographyHindawi Publishing Corporationhttpwwwhindawicom Volume 2014
Advances in
Hindawi Publishing Corporationhttpwwwhindawicom Volume 2014
MineralogyInternational Journal of
Hindawi Publishing Corporationhttpwwwhindawicom Volume 2014
MeteorologyAdvances in
The Scientific World JournalHindawi Publishing Corporation httpwwwhindawicom Volume 2014
Paleontology JournalHindawi Publishing Corporationhttpwwwhindawicom Volume 2014
ScientificaHindawi Publishing Corporationhttpwwwhindawicom Volume 2014
Hindawi Publishing Corporationhttpwwwhindawicom Volume 2014
Geological ResearchJournal of
Hindawi Publishing Corporationhttpwwwhindawicom Volume 2014
Geology Advances in
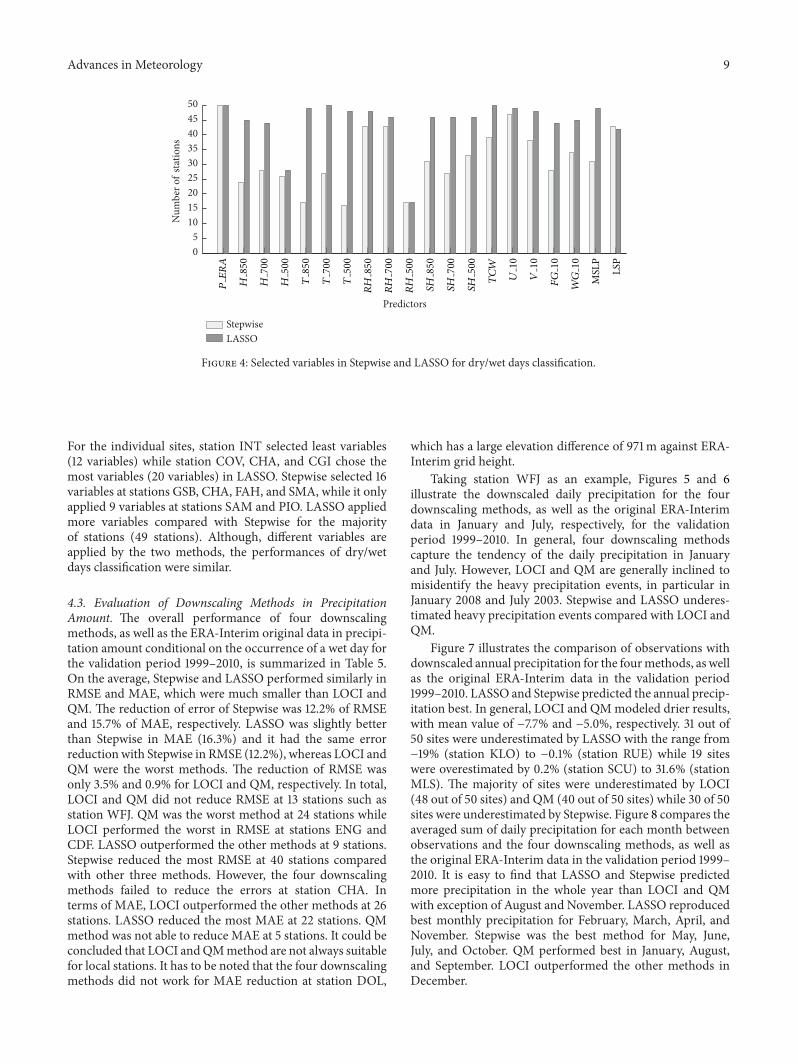