research article simultaneous determination of salicylic acid, jasmonic acid, methyl...
TRANSCRIPT

Research ArticleSimultaneous Determination of Salicylic Acid,Jasmonic Acid, Methyl Salicylate, and Methyl Jasmonatefrom Ulmus pumila Leaves by GC-MS
Zhi-hong Huang,1,2 Zhi-li Wang,2 Bao-lin Shi,2 Dong Wei,2 Jian-xin Chen,2
Su-li Wang,2 and Bao-jia Gao1
1Agricultural University of Hebei, Baoding 071001, China2Hebei North University, Zhangjiakou 075000, China
Correspondence should be addressed to Bao-jia Gao; [email protected]
Received 29 March 2015; Revised 3 June 2015; Accepted 17 June 2015
Academic Editor: Dimitrios Tsikas
Copyright © 2015 Zhi-hong Huang et al. This is an open access article distributed under the Creative Commons AttributionLicense, which permits unrestricted use, distribution, and reproduction in any medium, provided the original work is properlycited.
Salicylic acid, jasmonic acid, methyl salicylate, and methyl jasmonate are important phytohormones and defensive signalingcompounds, so it is of great importance to determine their levels rapidly and accurately. The study uses Ulmus pumila leavesinfected by Tetraneura akinire Sasaki at different stages as materials; after extraction with 80% methanol and ethyl acetate andpurification with primary secondary amine (PSA) and graphitized carbon blacks (GCB), the contents of signal compounds salicylicacid, jasmonic acid, methyl salicylate, and methyl jasmonate were determined by GC-MS. The results showed that the level ofsalicylic acid, jasmonic acid, methyl salicylate, and methyl jasmonate increased remarkably inU. pumila once infected by T. akinireSasaki, but the maximums of these four compounds occurred at different times. Salicylic acid level reached the highest at the earlystage, and jasmonic acid level went to the maximum in the middle stage; by contrast, change of content of methyl salicylate andmethyl jasmonate was the quite opposite.
1. Introduction
When suffering herbivores attack in nature, in addition torelying on their stems and leaf hairs, spines, and otherfirst physical barriers, plants also depend on the changes intheir hormone levels or release of certain signal substancesinvolved in chemically induced defense against attack [1].Up to date, researches have shown that the plant hormonesincluding salicylic acid, jasmonic acid, and their methylatedproducts had a very important role in transmission of defensesignal in plants [2]. Salicylic acid plays many physiologicaleffects in plants, and many experiments have proved it is oneof the key signal molecules produced by systemic acquiredresistance. Jasmonic acid, widely found in higher plants, is anew type of plant hormone to make plants cause a variety ofmorphological or physiological effects. Its role is to induce theopen of glumous flower and the formation of the tuber [3],
to inhibit the pollen germination, root growth, and so on [4].In addition, jasmonic acid can induce the plant to start thedefense system by changes in endogenous levels when theplant is attacked by pathogens or herbivorous animals [5].As endogenous signal molecules, their physiological effectsare extremely complex in plants, and thus it is of greatsignificance to establish a stable and sensitive method fordetermination of endogenous signal compounds.
The contents of salicylic acid and jasmonic acid are verylow in plants, so the measurement is very difficult. Withthe development of separation and identification technology,our predecessors have applied a variety of methods for thedetermination of signal compounds in plants. Currently, themainmethods of determination of salicylic acid and jasmonicacid are ELISA, HPLC, and UPLC [6]. With the method ofELISA, salicylic acid and jasmonic acid in samples get a betterenrichment and then are analyzed by chromatography. In this
Hindawi Publishing CorporationInternational Journal of Analytical ChemistryVolume 2015, Article ID 698630, 7 pageshttp://dx.doi.org/10.1155/2015/698630
2 International Journal of Analytical Chemistry
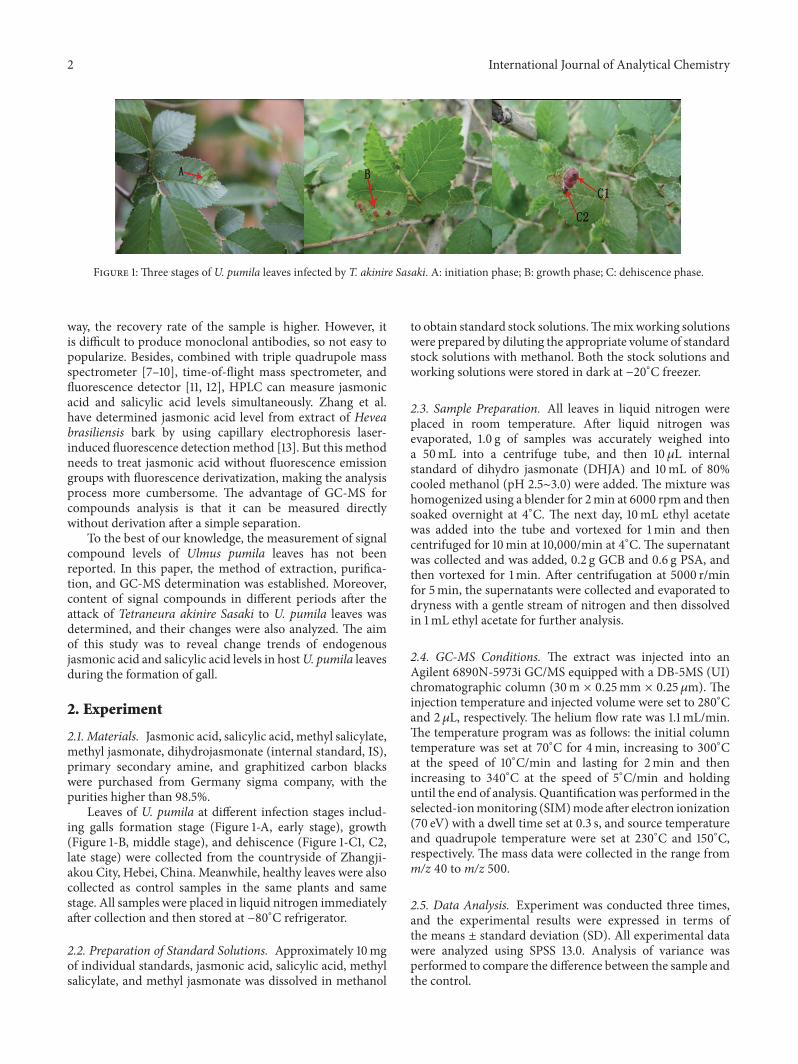
Figure 1: Three stages of U. pumila leaves infected by T. akinire Sasaki. A: initiation phase; B: growth phase; C: dehiscence phase.
way, the recovery rate of the sample is higher. However, itis difficult to produce monoclonal antibodies, so not easy topopularize. Besides, combined with triple quadrupole massspectrometer [7–10], time-of-flight mass spectrometer, andfluorescence detector [11, 12], HPLC can measure jasmonicacid and salicylic acid levels simultaneously. Zhang et al.have determined jasmonic acid level from extract of Heveabrasiliensis bark by using capillary electrophoresis laser-induced fluorescence detectionmethod [13]. But this methodneeds to treat jasmonic acid without fluorescence emissiongroups with fluorescence derivatization, making the analysisprocess more cumbersome. The advantage of GC-MS forcompounds analysis is that it can be measured directlywithout derivation after a simple separation.
To the best of our knowledge, the measurement of signalcompound levels of Ulmus pumila leaves has not beenreported. In this paper, the method of extraction, purifica-tion, and GC-MS determination was established. Moreover,content of signal compounds in different periods after theattack of Tetraneura akinire Sasaki to U. pumila leaves wasdetermined, and their changes were also analyzed. The aimof this study was to reveal change trends of endogenousjasmonic acid and salicylic acid levels in hostU. pumila leavesduring the formation of gall.
2. Experiment
2.1. Materials. Jasmonic acid, salicylic acid, methyl salicylate,methyl jasmonate, dihydrojasmonate (internal standard, IS),primary secondary amine, and graphitized carbon blackswere purchased from Germany sigma company, with thepurities higher than 98.5%.
Leaves of U. pumila at different infection stages includ-ing galls formation stage (Figure 1-A, early stage), growth(Figure 1-B, middle stage), and dehiscence (Figure 1-C1, C2,late stage) were collected from the countryside of Zhangji-akou City, Hebei, China. Meanwhile, healthy leaves were alsocollected as control samples in the same plants and samestage. All samples were placed in liquid nitrogen immediatelyafter collection and then stored at −80∘C refrigerator.
2.2. Preparation of Standard Solutions. Approximately 10mgof individual standards, jasmonic acid, salicylic acid, methylsalicylate, and methyl jasmonate was dissolved in methanol
to obtain standard stock solutions.Themixworking solutionswere prepared by diluting the appropriate volume of standardstock solutions with methanol. Both the stock solutions andworking solutions were stored in dark at −20∘C freezer.
2.3. Sample Preparation. All leaves in liquid nitrogen wereplaced in room temperature. After liquid nitrogen wasevaporated, 1.0 g of samples was accurately weighed intoa 50mL into a centrifuge tube, and then 10 𝜇L internalstandard of dihydro jasmonate (DHJA) and 10mL of 80%cooled methanol (pH 2.5∼3.0) were added. The mixture washomogenized using a blender for 2min at 6000 rpm and thensoaked overnight at 4∘C. The next day, 10mL ethyl acetatewas added into the tube and vortexed for 1min and thencentrifuged for 10min at 10,000/min at 4∘C.The supernatantwas collected and was added, 0.2 g GCB and 0.6 g PSA, andthen vortexed for 1min. After centrifugation at 5000 r/minfor 5min, the supernatants were collected and evaporated todryness with a gentle stream of nitrogen and then dissolvedin 1mL ethyl acetate for further analysis.
2.4. GC-MS Conditions. The extract was injected into anAgilent 6890N-5973i GC/MS equipped with a DB-5MS (UI)chromatographic column (30m × 0.25mm × 0.25 𝜇m). Theinjection temperature and injected volume were set to 280∘Cand 2 𝜇L, respectively. The helium flow rate was 1.1mL/min.The temperature program was as follows: the initial columntemperature was set at 70∘C for 4min, increasing to 300∘Cat the speed of 10∘C/min and lasting for 2min and thenincreasing to 340∘C at the speed of 5∘C/min and holdinguntil the end of analysis. Quantification was performed in theselected-ionmonitoring (SIM)mode after electron ionization(70 eV) with a dwell time set at 0.3 s, and source temperatureand quadrupole temperature were set at 230∘C and 150∘C,respectively. The mass data were collected in the range fromm/z 40 tom/z 500.
2.5. Data Analysis. Experiment was conducted three times,and the experimental results were expressed in terms ofthe means ± standard deviation (SD). All experimental datawere analyzed using SPSS 13.0. Analysis of variance wasperformed to compare the difference between the sample andthe control.
International Journal of Analytical Chemistry 3
Table 1: Effect of extract solvent on extraction efficiency (yield %).
Compound MeOH/H2
O EtOH/H2
O MeOH/H2
O (80 : 20)+ ethyl acetate
MeOH/H2
O (80 : 20)+ n-hexane90 : 10 80 : 20 70 : 30 90 : 10 80 : 20 70 : 30
Salicylic acid 69.5 84.4 75.4 58.3 83.5 72.6 80.4 68.5Jasmonic acid 67.8 88.5 72.6 56.6 79.8 82.4 85.3 70.8Methyl salicylate 79.9 99.8 83.6 82.5 95.6 90.5 94.6 85.6Methyl jasmonate 84.5 94.5 85.6 93.4 99.7 93.5 95.3 83.5
Table 2: Recoveries using different amounts of PSA and GCB (%).
Compound 0.4 g PSA + 0.1 gGCB
0.6 g PSA + 0.1 gGCB
0.6 g PSA + 0.2 gGCB
0.8 g PSA + 0.2 gGCB
0.6 g PSA + 0.3 gGCB
0.8 g PSA + 0.3 gGCB
Salicylic acid 82.2 84.6 86.1 83.9 69.7 73.2Jasmonic acid 85.7 83.8 88.4 81.7 72.5 68.5Methyl salicylate 97.8 94.5 98.8 94.2 88.4 85.5Methyl jasmonate 99.2 98.6 99.7 98.6 85.8 87.9
3. Results and Discussion
3.1. Optimization of Sample Preparation. In order to opti-mize the sample preparation conditions, different extractionsolvents (different ratios of MeOH or EtOH :H
2O) and
sorbents were investigated. Table 1 showed the recoveriesof all the compounds, which indicated that 80% methanolcan get better extraction effect and their recoveries werehigher than 70%. Therefore, 80% methanol was selected asthe extraction solvent. In order to remove the interferenceof impurities from the extracts, the same volume of ethylacetate and n-hexane were used as the extract solvent toevaluate the extraction efficiency of these signal compounds.The results showed that the ethyl acetate got better results(Table 1), which was chosen in further experiments.
Traditionally, PSA is commonly applied as an effectiveclean-up sorbent for polar organic acid removal, and GCBis used for pigment and sterols removal. To examine theimpact of PSA and GCB on the purification effect of samplesand the recovery of analytes, different amounts of PSA (0.4–0.8 g) mixed with GCB (0.1–0.3mg) were used to purify thesamples. As can be seen form Table 2, when 0.6 g of PSA and0.2 g of GCB were used, the recovery rate was the highest.However, recovery values of salicylic acid and jasmonic aciddecreased when GCBwas above 0.2 g. It is probable that GCBadsorptionmechanismwith compounds whose structure hasa high affinity toward GCB.
3.2. Optimization of Chromatography and Mass SpectrometryConditions. DB-5 (30.0m × 320 𝜇m × 0.25 𝜇m) and HP-5(30.0m × 320𝜇m × 1 𝜇m) capillary columns were tested toseparate the target compounds. It was found that there werelarge differences on the separation efficiency in two capillarycolumns. Using HP-5 column, the peak of salicylic acid andmethyl salicylate overlapped partly, and the separation degreeof jasmonic acid and methyl jasmonate was not very goodtoo, whereas, in DB-5 column, jasmonic acid and methyljasmonate can be separated better and salicylic acid and
Table 3: MS parameters for analysis of four compounds.
Compounds Retention time(min)
Quantification(𝑚/𝑧)
Identification(𝑚/𝑧)
Salicylic acid 11.84 120 94,138Jasmonic acid 17.12 83 151,210Dihydro jasmonate 13.01 151 194,164Methyl salicylate 10.23 152 120,92Methyl jasmonate 16.35 83 110,67
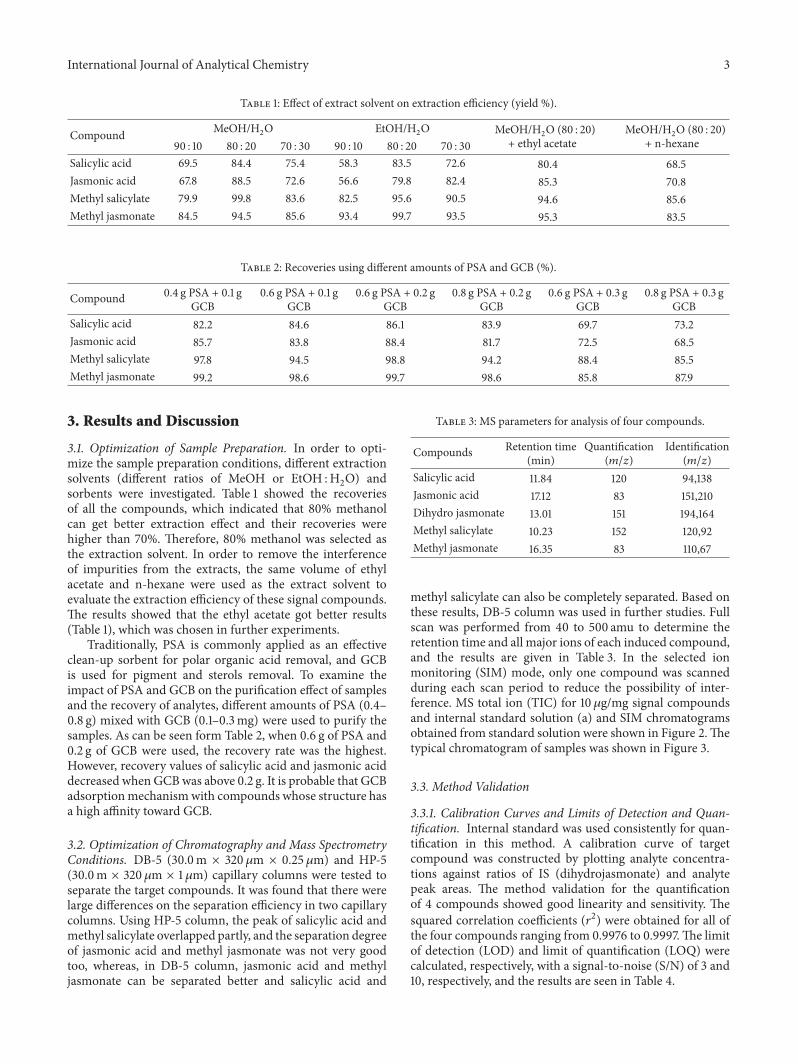
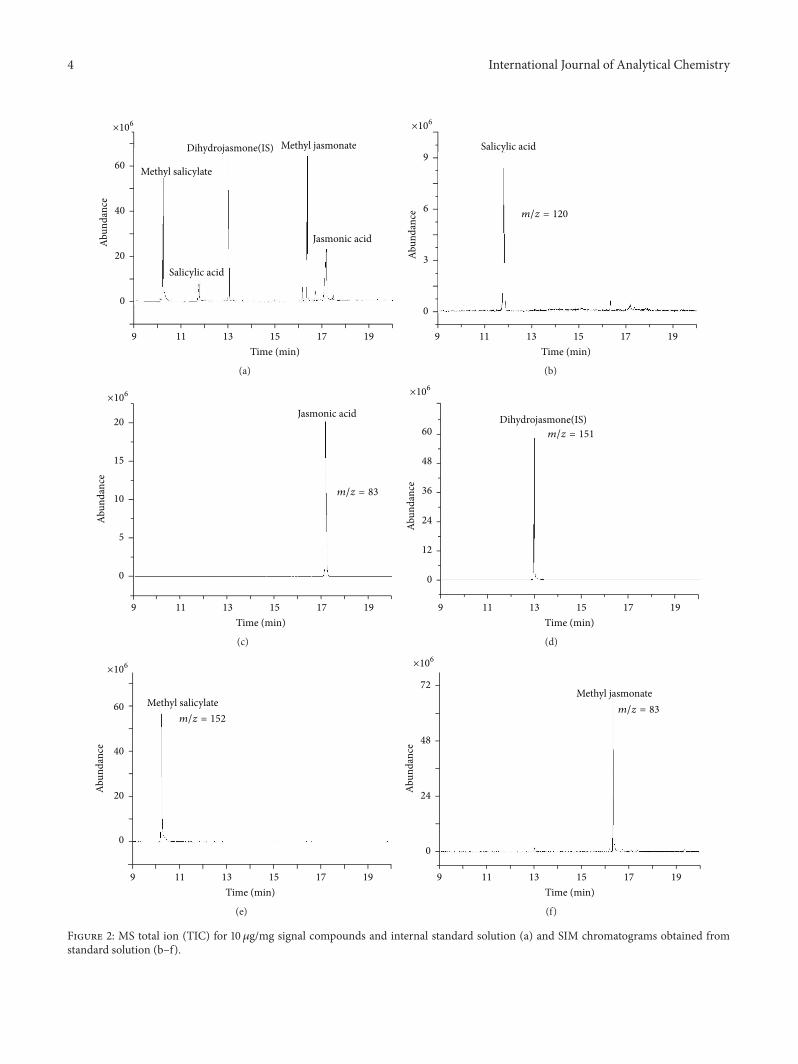
methyl salicylate can also be completely separated. Based onthese results, DB-5 column was used in further studies. Fullscan was performed from 40 to 500 amu to determine theretention time and all major ions of each induced compound,and the results are given in Table 3. In the selected ionmonitoring (SIM) mode, only one compound was scannedduring each scan period to reduce the possibility of inter-ference. MS total ion (TIC) for 10 𝜇g/mg signal compoundsand internal standard solution (a) and SIM chromatogramsobtained from standard solution were shown in Figure 2.Thetypical chromatogram of samples was shown in Figure 3.
3.3. Method Validation
3.3.1. Calibration Curves and Limits of Detection and Quan-tification. Internal standard was used consistently for quan-tification in this method. A calibration curve of targetcompound was constructed by plotting analyte concentra-tions against ratios of IS (dihydrojasmonate) and analytepeak areas. The method validation for the quantificationof 4 compounds showed good linearity and sensitivity. Thesquared correlation coefficients (𝑟2) were obtained for all ofthe four compounds ranging from 0.9976 to 0.9997.The limitof detection (LOD) and limit of quantification (LOQ) werecalculated, respectively, with a signal-to-noise (S/N) of 3 and10, respectively, and the results are seen in Table 4.
4 International Journal of Analytical Chemistry
Methyl jasmonate
Methyl salicylate
Dihydrojasmone(IS) Methylyy jasmonate
Methyly salicylate
Dihydrojasmone(IS)
Abun
danc
e
Jasmonic acid
Salicylic acid
×106
0
20
40
60
11 13 15 17 199
Time (min)
(a)
Abun
danc
e
×106
m/z = 120
0
3
6
9
9 13 15 17 1911
Time (min)
Salicylic acid
(b)
Abun
danc
e
×106
m/z = 83
9 11 15 17 1913
Time (min)
0
5
10
15
20Jasmonic acid
(c)
Abun
danc
e
×106
m/z = 151
Dihydrojasmone(IS)
9 13 15 17 1911
Time (min)
0
12
24
36
48
60
(d)
Abun
danc
e
×106
m/z = 15260
40
20
0
Methyl salicylate
9 13 15 17 1911
Time (min)
(e)
Abun
danc
e
×106
m/z = 83
Methyl jasmonate
9 13 15 17 1911
Time (min)
0
24
48
72
(f)
Figure 2: MS total ion (TIC) for 10 𝜇g/mg signal compounds and internal standard solution (a) and SIM chromatograms obtained fromstandard solution (b–f).
International Journal of Analytical Chemistry 5
Table 4: Linear regression data and validation for four compounds.
Compounds Linear ranges (𝜇g⋅mL−1) Calibration equation 𝑟
2 LOD (𝜇g⋅mL−1) LOQ (𝜇g⋅mL−1)Salicylic acid 0.12–12.0 𝑦 = 1.0309𝑥 − 0.0251 0.9997 0.24 0.78Jasmonic acid 0.11–11.0 𝑦 = 17.060𝑥 − 0.3347 0.9986 0.12 0.38Methyl salicylate 0.14–14.0 𝑦 = 1.0291𝑥 + 0.0206 0.9976 0.05 0.20Methyl jasmonate 0.12–12.0 𝑦 = 1.0135𝑥 + 0.0004 0.9996 0.03 0.12
Abun
danc
e×106
Salic
ylic
acid
Jasm
onic
acid
Met
hyl s
alic
ylat
e
Dih
ydro
jasm
one
Met
hyl j
asm
onat
e10
20
30
40
50
6 14 18 22 2610 3230
Time
Figure 3: Typical chromatogram of defense chemical of U. pumila L. leaves after being infected by Tetraneura akinire Sasaki.
3.3.2. Precision, Accuracy, and Repeatability. The precision ofthe method was validated by the determination of intra- andinterday variance. The intraday precision was determined byreplicate analysis (𝑛 = 6) of standard solutions of the foursignal compounds at low, medium, and high concentrationsin a single day, while the interday values were obtained overthree consecutive days. The concentration of each solutionwas determined using a calibration curve prepared on thesame day. The intraday precision and interday precisioncalculated as RSD were within the range of 1.14% to 4.42%and 0.37% to 4.02%. The results were presented in Table 5.
Recovery was used to further evaluate the accuracy ofthe method. Known amounts of each standard solution atthree different concentration levels were mixed with knownamounts of U. pumila samples; the samples were thenextracted and analyzed with the above established method.The experiments were repeated three times at each level. Theresults showed that recovery ranged from 73.8% to 103.0%,and RSD ranged from 2.14% to 11.05%. Details have beenlisted in Table 6.
Six U. pumila samples from the same source wereextracted and analyzed using the above established method.The RSD values were calculated as a measurement of methodrepeatability. RSD values of salicylic acid, jasmonic acid,methyl salicylate, and methyl jasmonate were 1.22%, 1.98%,1.67%, and 2.70%, respectively, which showed high repeata-bility.
3.4. Sample Analysis. Insect gall is that when aphids (Tetra-neura akinire Sasaki) feed on juice in the phloem ofU. pumilaleaves, and leaves suffer the stimulation of its secretions, and
Table 5: Intra- and interday precision for the four compounds (𝑛 =6).
Compounds Concentration Intradayprecision
Interdayprecision
(𝜇g/mL) (RSD, %) (RSD, %)
Salicylic acid0.24 4.42 4.021.20 3.83 2.476.00 2.25 2.15
Jasmonic acid0.22 2.47 1.751.10 2.71 1.445.50 1.96 1.33
Methyl salicylate0.14 1.63 2.260.70 1.88 1.643.50 1.14 0.37
Methyl jasmonate0.12 1.28 2.350.60 1.79 1.173.00 1.94 1.68
then the cells divide rapidly and differentiate abnormally,leading to cell proliferation around vascular and formationof abnormal nodules or protrusions [14]. Studies have shownthat the development of galls can be divided into threeperiods, which are the initiation phase (early stage), growthphase (middle stage), and dehiscence phase (late stage). Aseries of physiological and biochemical reactions in the plantis produced in the process of galls formation, leading tochanges in the levels of nutrient and signal compounds andvariations in the activity of defensive enzymes.
6 International Journal of Analytical Chemistry
Table 6: Recovery of four signal compounds from spiked samples at three concentrations.
Compounds Added (𝜇g⋅mg−1) Measured (𝜇g⋅mg−1) Recovery (%) Precision (RSD, %)
Salicylic acid1.0 0.87 0.77 0.84 0.78 0.65 78.2 10.395.0 4.85 4.32 4.08 4.10 4.89 89.0 9.1510.0 9.87 8.94 8.80 9.52 8.97 92.2 4.91
Jasmonic acid1.0 0.88 0.74 0.68 0.69 0.70 73.8 11.055.0 4.02 4.28 4.52 4.87 4.68 89.5 7.5410.0 9.89 8.97 9.21 9.35 8.62 92.1 5.04
Methyl salicylate1.0 0.94 0.91 0.88 0.91 0.85 89.8 3.765.0 4.91 4.57 4.87 4.98 4.08 93.6 7.6810.0 10.25 10.67 9.75 11.21 9.63 103.0 6.26
Methyl jasmonate1.0 0.95 0.91 0.89 0.98 0.98 94.21 4.385.0 4.85 4.96 4.89 4.91 5.12 98.92 2.1410.0 10.69 9.97 9.85 9.05 9.27 97.66 6.52
I II IIIGall-developmental stages
Herbivore woundControl
∗∗
∗∗
∗
0.0
0.2
0.4
0.6
0.8
1.0
1.2
1.4
1.6
Salic
ylic
acid
conc
entr
atio
n (𝜇
g/m
g)
(a)
I II IIIGall-developmental stages
Herbivore woundControl
∗∗
∗
∗
0
4
8
12
16
Jasm
onic
acid
conc
entr
atio
n (𝜇
g/m
g)
(b)
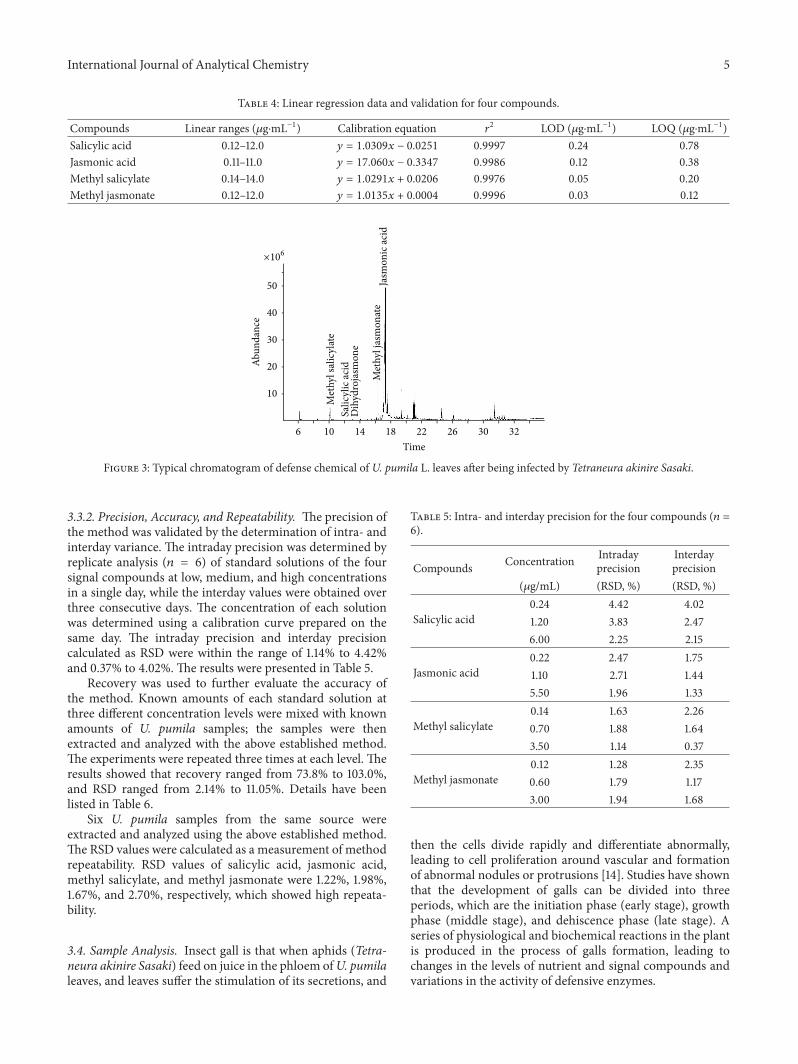
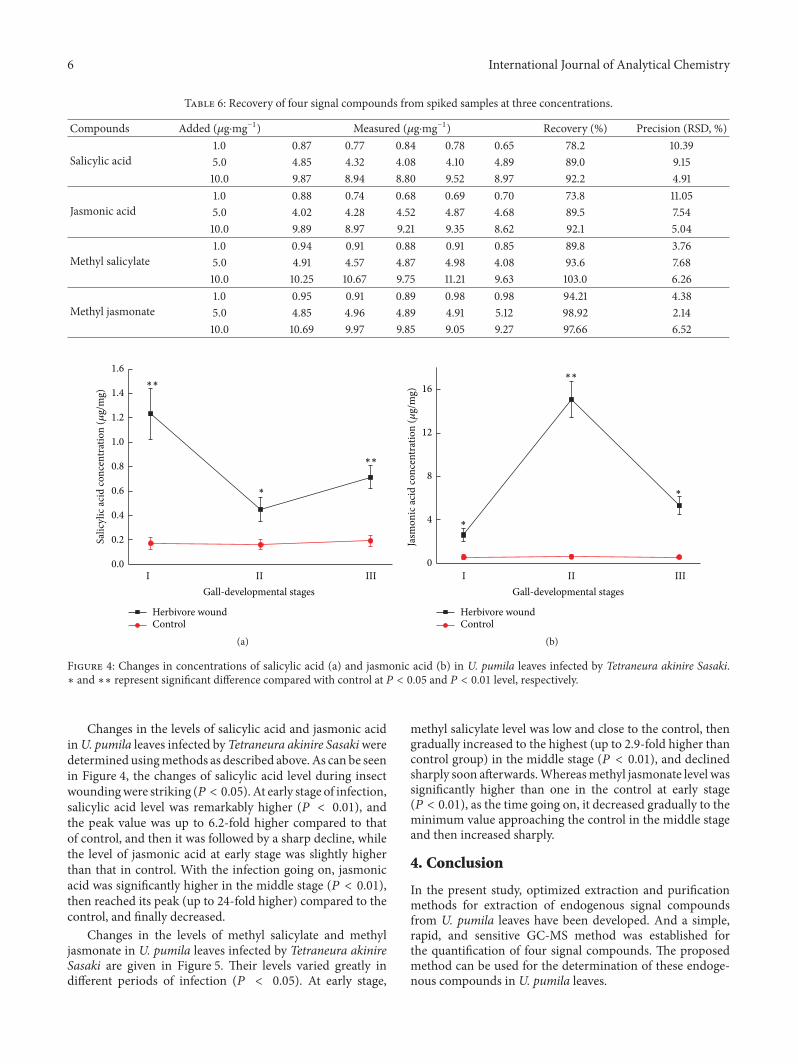
Figure 4: Changes in concentrations of salicylic acid (a) and jasmonic acid (b) in U. pumila leaves infected by Tetraneura akinire Sasaki.∗ and ∗∗ represent significant difference compared with control at 𝑃 < 0.05 and 𝑃 < 0.01 level, respectively.
Changes in the levels of salicylic acid and jasmonic acidinU. pumila leaves infected by Tetraneura akinire Sasakiweredetermined usingmethods as described above. As can be seenin Figure 4, the changes of salicylic acid level during insectwoundingwere striking (𝑃 < 0.05). At early stage of infection,salicylic acid level was remarkably higher (𝑃 < 0.01), andthe peak value was up to 6.2-fold higher compared to thatof control, and then it was followed by a sharp decline, whilethe level of jasmonic acid at early stage was slightly higherthan that in control. With the infection going on, jasmonicacid was significantly higher in the middle stage (𝑃 < 0.01),then reached its peak (up to 24-fold higher) compared to thecontrol, and finally decreased.
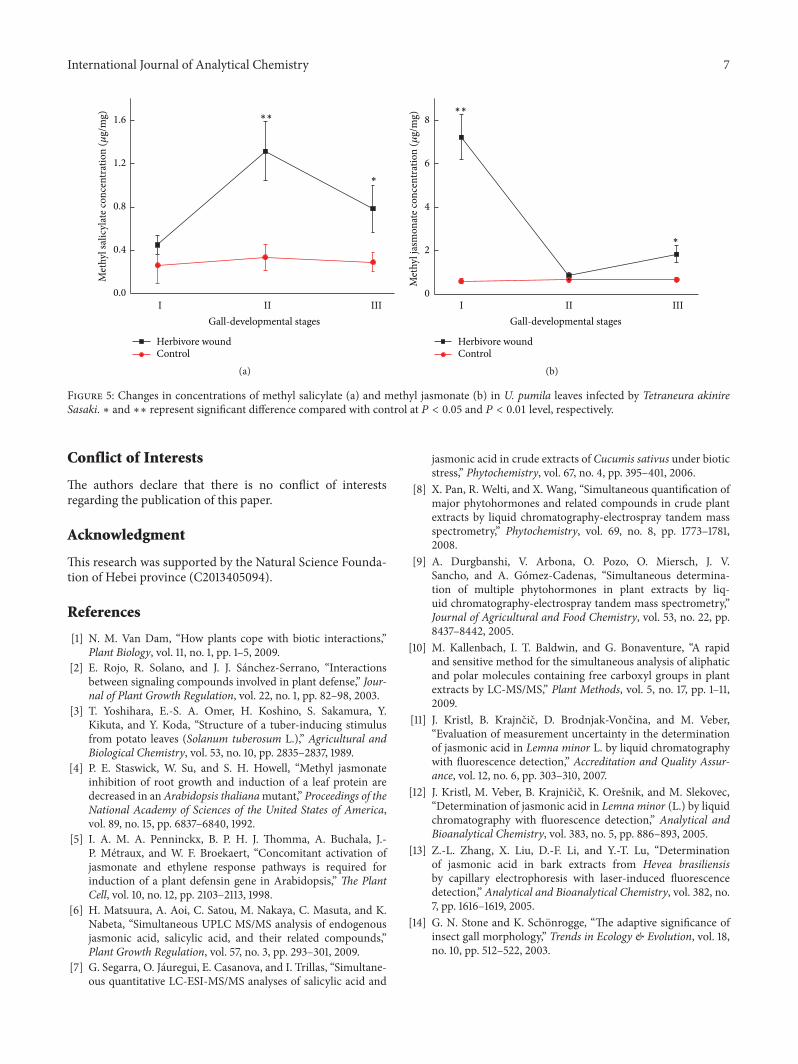
Changes in the levels of methyl salicylate and methyljasmonate in U. pumila leaves infected by Tetraneura akinireSasaki are given in Figure 5. Their levels varied greatly indifferent periods of infection (𝑃 < 0.05). At early stage,
methyl salicylate level was low and close to the control, thengradually increased to the highest (up to 2.9-fold higher thancontrol group) in the middle stage (𝑃 < 0.01), and declinedsharply soon afterwards.Whereasmethyl jasmonate level wassignificantly higher than one in the control at early stage(𝑃 < 0.01), as the time going on, it decreased gradually to theminimum value approaching the control in the middle stageand then increased sharply.
4. Conclusion
In the present study, optimized extraction and purificationmethods for extraction of endogenous signal compoundsfrom U. pumila leaves have been developed. And a simple,rapid, and sensitive GC-MS method was established forthe quantification of four signal compounds. The proposedmethod can be used for the determination of these endoge-nous compounds in U. pumila leaves.
International Journal of Analytical Chemistry 7
∗∗
I II IIIGall-developmental stages
Herbivore woundControl
0.0
0.4
0.8
1.2
1.6
Met
hyl s
alic
ylat
e con
cent
ratio
n (𝜇
g/m
g)
∗
(a)
∗∗
I II IIIGall-developmental stages
Herbivore woundControl
6
0
2
4
8
Met
hyl j
asm
onat
e con
cent
ratio
n ( 𝜇
g/m
g)
∗
(b)
Figure 5: Changes in concentrations of methyl salicylate (a) and methyl jasmonate (b) in U. pumila leaves infected by Tetraneura akinireSasaki. ∗ and ∗∗ represent significant difference compared with control at 𝑃 < 0.05 and 𝑃 < 0.01 level, respectively.
Conflict of Interests
The authors declare that there is no conflict of interestsregarding the publication of this paper.
Acknowledgment
This research was supported by the Natural Science Founda-tion of Hebei province (C2013405094).
References
[1] N. M. Van Dam, “How plants cope with biotic interactions,”Plant Biology, vol. 11, no. 1, pp. 1–5, 2009.
[2] E. Rojo, R. Solano, and J. J. Sanchez-Serrano, “Interactionsbetween signaling compounds involved in plant defense,” Jour-nal of Plant Growth Regulation, vol. 22, no. 1, pp. 82–98, 2003.
[3] T. Yoshihara, E.-S. A. Omer, H. Koshino, S. Sakamura, Y.Kikuta, and Y. Koda, “Structure of a tuber-inducing stimulusfrom potato leaves (Solanum tuberosum L.),” Agricultural andBiological Chemistry, vol. 53, no. 10, pp. 2835–2837, 1989.
[4] P. E. Staswick, W. Su, and S. H. Howell, “Methyl jasmonateinhibition of root growth and induction of a leaf protein aredecreased in anArabidopsis thalianamutant,” Proceedings of theNational Academy of Sciences of the United States of America,vol. 89, no. 15, pp. 6837–6840, 1992.
[5] I. A. M. A. Penninckx, B. P. H. J. Thomma, A. Buchala, J.-P. Metraux, and W. F. Broekaert, “Concomitant activation ofjasmonate and ethylene response pathways is required forinduction of a plant defensin gene in Arabidopsis,” The PlantCell, vol. 10, no. 12, pp. 2103–2113, 1998.
[6] H. Matsuura, A. Aoi, C. Satou, M. Nakaya, C. Masuta, and K.Nabeta, “Simultaneous UPLC MS/MS analysis of endogenousjasmonic acid, salicylic acid, and their related compounds,”Plant Growth Regulation, vol. 57, no. 3, pp. 293–301, 2009.
[7] G. Segarra, O. Jauregui, E. Casanova, and I. Trillas, “Simultane-ous quantitative LC-ESI-MS/MS analyses of salicylic acid and
jasmonic acid in crude extracts of Cucumis sativus under bioticstress,” Phytochemistry, vol. 67, no. 4, pp. 395–401, 2006.
[8] X. Pan, R. Welti, and X. Wang, “Simultaneous quantification ofmajor phytohormones and related compounds in crude plantextracts by liquid chromatography-electrospray tandem massspectrometry,” Phytochemistry, vol. 69, no. 8, pp. 1773–1781,2008.
[9] A. Durgbanshi, V. Arbona, O. Pozo, O. Miersch, J. V.Sancho, and A. Gomez-Cadenas, “Simultaneous determina-tion of multiple phytohormones in plant extracts by liq-uid chromatography-electrospray tandem mass spectrometry,”Journal of Agricultural and Food Chemistry, vol. 53, no. 22, pp.8437–8442, 2005.
[10] M. Kallenbach, I. T. Baldwin, and G. Bonaventure, “A rapidand sensitive method for the simultaneous analysis of aliphaticand polar molecules containing free carboxyl groups in plantextracts by LC-MS/MS,” Plant Methods, vol. 5, no. 17, pp. 1–11,2009.
[11] J. Kristl, B. Krajncic, D. Brodnjak-Voncina, and M. Veber,“Evaluation of measurement uncertainty in the determinationof jasmonic acid in Lemna minor L. by liquid chromatographywith fluorescence detection,” Accreditation and Quality Assur-ance, vol. 12, no. 6, pp. 303–310, 2007.
[12] J. Kristl, M. Veber, B. Krajnicic, K. Oresnik, and M. Slekovec,“Determination of jasmonic acid in Lemna minor (L.) by liquidchromatography with fluorescence detection,” Analytical andBioanalytical Chemistry, vol. 383, no. 5, pp. 886–893, 2005.
[13] Z.-L. Zhang, X. Liu, D.-F. Li, and Y.-T. Lu, “Determinationof jasmonic acid in bark extracts from Hevea brasiliensisby capillary electrophoresis with laser-induced fluorescencedetection,” Analytical and Bioanalytical Chemistry, vol. 382, no.7, pp. 1616–1619, 2005.
[14] G. N. Stone and K. Schonrogge, “The adaptive significance ofinsect gall morphology,” Trends in Ecology & Evolution, vol. 18,no. 10, pp. 512–522, 2003.

Submit your manuscripts athttp://www.hindawi.com
Hindawi Publishing Corporationhttp://www.hindawi.com Volume 2014
Inorganic ChemistryInternational Journal of
Hindawi Publishing Corporation http://www.hindawi.com Volume 2014
International Journal ofPhotoenergy
Hindawi Publishing Corporationhttp://www.hindawi.com Volume 2014
Carbohydrate Chemistry
International Journal of
Hindawi Publishing Corporationhttp://www.hindawi.com Volume 2014
Journal of
Chemistry
Hindawi Publishing Corporationhttp://www.hindawi.com Volume 2014
Advances in
Physical Chemistry
Hindawi Publishing Corporationhttp://www.hindawi.com
Analytical Methods in Chemistry
Journal of
Volume 2014
Bioinorganic Chemistry and ApplicationsHindawi Publishing Corporationhttp://www.hindawi.com Volume 2014
SpectroscopyInternational Journal of
Hindawi Publishing Corporationhttp://www.hindawi.com Volume 2014
The Scientific World JournalHindawi Publishing Corporation http://www.hindawi.com Volume 2014
Medicinal ChemistryInternational Journal of
Hindawi Publishing Corporationhttp://www.hindawi.com Volume 2014
Chromatography Research International
Hindawi Publishing Corporationhttp://www.hindawi.com Volume 2014
Applied ChemistryJournal of
Hindawi Publishing Corporationhttp://www.hindawi.com Volume 2014
Hindawi Publishing Corporationhttp://www.hindawi.com Volume 2014
Theoretical ChemistryJournal of
Hindawi Publishing Corporationhttp://www.hindawi.com Volume 2014
Journal of
Spectroscopy
Analytical ChemistryInternational Journal of
Hindawi Publishing Corporationhttp://www.hindawi.com Volume 2014
Journal of
Hindawi Publishing Corporationhttp://www.hindawi.com Volume 2014
Quantum Chemistry
Hindawi Publishing Corporationhttp://www.hindawi.com Volume 2014
Organic Chemistry International
ElectrochemistryInternational Journal of
Hindawi Publishing Corporation http://www.hindawi.com Volume 2014
Hindawi Publishing Corporationhttp://www.hindawi.com Volume 2014
CatalystsJournal of