research article serum indicators reflecting gastric...
TRANSCRIPT

Research ArticleSerum Indicators Reflecting Gastric Function May AlsoCorrelate with Other Extragastric Diseases
Yuehua Gong,1 Wei Wang,2 Yi Li,1 and Yuan Yuan1
1Department of Tumor Etiology and Screening, Cancer Institute and General Surgery, The First Affiliated Hospital ofChina Medical University and Key Laboratory of Cancer Etiology and Prevention, Liaoning Provincial Education Department,Shenyang 110001, China2Health Examination Center, The First Affiliated Hospital of China Medical University, 155 North Nanjing Street, Heping District,Shenyang 110001, China
Correspondence should be addressed to Yuan Yuan; [email protected]
Received 19 May 2015; Revised 13 July 2015; Accepted 16 July 2015
Academic Editor: Haruhiko Sugimura
Copyright © 2015 Yuehua Gong et al. This is an open access article distributed under the Creative Commons Attribution License,which permits unrestricted use, distribution, and reproduction in any medium, provided the original work is properly cited.
Aim. Serological indicators of organ function can reveal intrinsic links between different organs. The present study aimed todetermine the correlations of serum indicators for gastric and extragastric function. Methods. A total of 823 individuals wereenrolled. Data on indicators reflecting blood lipids, blood glucose, indexes of stomach, kidney, liver, and thyroid function, andH. pylori IgG antibody level were collected. Results. As creatine (Cr) levels increased, PGI (pepsinogen I), PGII concentrations,and PGI/II ratio increased monotonically from 79.7 to 105.15 𝜇g/L, 6.5 to 8.4 𝜇g/L, and 11.97 to 12.27, respectively (𝑃 < 0.05). Asthyroid peroxidase antibody (TPOAb) levels increased, PGI level decreased from 100.85 to 84 𝜇g/L (𝑃 < 0.05) and as thyroidstimulating hormone (TSH) increased, PGI/II ratio increased monotonically from 11.54 to 12.68 (𝑃 < 0.05). As triglyceride (TG)levels increased, gastrin 17 (G17) concentrations increased monotonically from 1.73 to 2.7 pmol/L (𝑃 < 0.05). As serum glucoseand glycated hemoglobin (HbA1C) increased, PGI/II concentrations increased monotonically from 11.98 to 12.67 and 9.7 to 13.54(𝑃 < 0.05), respectively. Conclusions. Serum PG and G17 levels were associated with blood glucose and lipids, kidney function,and thyroid function but not with liver function. Serum indicators reflecting gastric function may correlate not only with primarydiseases, but also with other extragastric diseases.
1. Introduction
Serum indicators are measurable factors that reflect thenormal physiological state of an organism. For example,alanine aminotransferase (ALT) and alkaline phosphatase(ALP) are biomarkers of liver function; creatinine (Cr) andurea nitrogen are biomarkers of renal function; triiodothy-ronine (FT3) and free thyroxine (FT4) are biomarkers ofthyroid function; and high-density lipoprotein (HDL), low-density protein (LDL), glucose, and glycosylated hemoglobin(HbA1C) are related to metabolic function. Some biomarkersof gastric function, such as pepsinogen (PG), have also beenrecognized. PGI is produced in the stomach by the bodyand fundus, and PGII is produced primarily in the oxynticgland mucosa of the stomach, the gastric antrum, and theduodenum. Several studies have found that PGI and PGIIare secreted into the gastric lumen and 1% of them are also
leaked into circulating blood [1, 2]. Serum PG levels seemto be related to the morphologic and functional changes inthe stomach, and their use as “serological biopsy” has beenreported for over 20 years [3–5]. Low serum PGI and a lowPGI/PGII ratio have been recognized as useful diagnosisbiomarkers for the corpus atrophic gastritis (AG) and forpatients screening at high risk of gastric cancer [6–8]. Gastrinnormally regulates gastric acid secretion by stimulating theproliferation of enterochromaffin-like cells and the releaseof histamine [9]. Serum gastrin has become an importantbiomarker for gastric antrum inflammation [10].
Interactions between organs are vital for allowing thebody to adjust the function of each organ according tothe needs of the body as a whole. Associations betweenserological indicators reflecting different organ functions arethus also important for revealing intrinsic links betweendifferent organs. Changes in gastric function may affect
Hindawi Publishing CorporationGastroenterology Research and PracticeVolume 2015, Article ID 867495, 9 pageshttp://dx.doi.org/10.1155/2015/867495
2 Gastroenterology Research and Practice
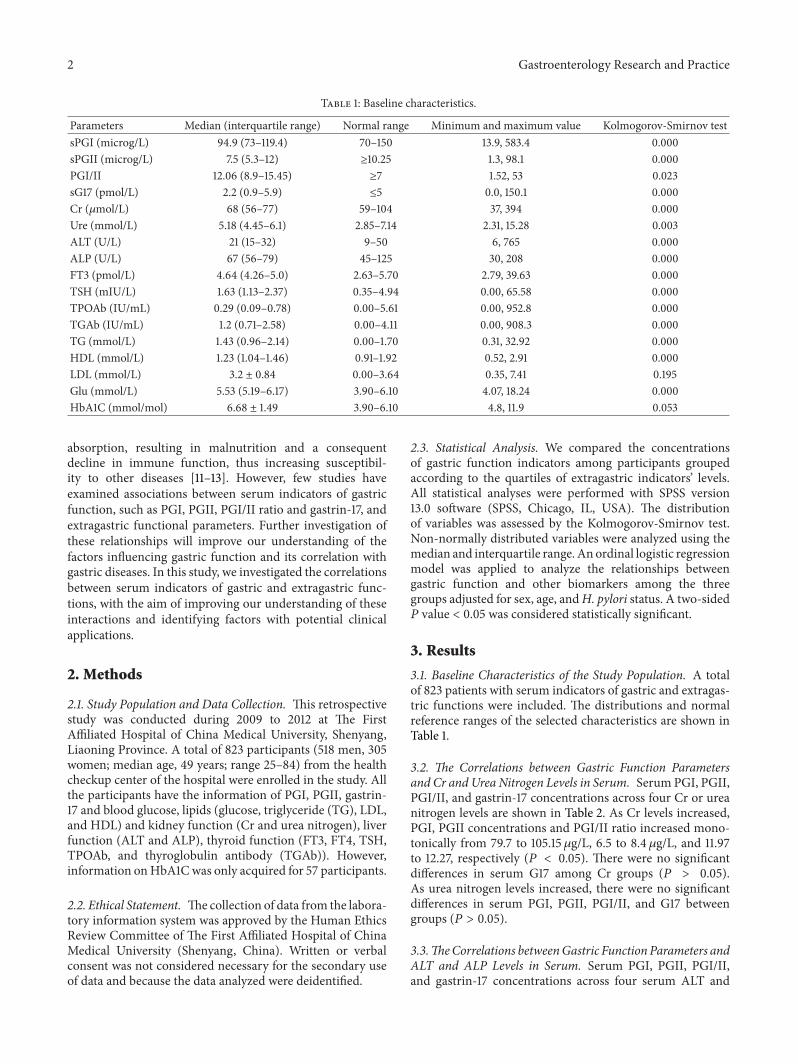
Table 1: Baseline characteristics.
Parameters Median (interquartile range) Normal range Minimum and maximum value Kolmogorov-Smirnov testsPGI (microg/L) 94.9 (73–119.4) 70–150 13.9, 583.4 0.000sPGII (microg/L) 7.5 (5.3–12) ≥10.25 1.3, 98.1 0.000PGI/II 12.06 (8.9–15.45) ≥7 1.52, 53 0.023sG17 (pmol/L) 2.2 (0.9–5.9) ≤5 0.0, 150.1 0.000Cr (𝜇mol/L) 68 (56–77) 59–104 37, 394 0.000Ure (mmol/L) 5.18 (4.45–6.1) 2.85–7.14 2.31, 15.28 0.003ALT (U/L) 21 (15–32) 9–50 6, 765 0.000ALP (U/L) 67 (56–79) 45–125 30, 208 0.000FT3 (pmol/L) 4.64 (4.26–5.0) 2.63–5.70 2.79, 39.63 0.000TSH (mIU/L) 1.63 (1.13–2.37) 0.35–4.94 0.00, 65.58 0.000TPOAb (IU/mL) 0.29 (0.09–0.78) 0.00–5.61 0.00, 952.8 0.000TGAb (IU/mL) 1.2 (0.71–2.58) 0.00–4.11 0.00, 908.3 0.000TG (mmol/L) 1.43 (0.96–2.14) 0.00–1.70 0.31, 32.92 0.000HDL (mmol/L) 1.23 (1.04–1.46) 0.91–1.92 0.52, 2.91 0.000LDL (mmol/L) 3.2 ± 0.84 0.00–3.64 0.35, 7.41 0.195Glu (mmol/L) 5.53 (5.19–6.17) 3.90–6.10 4.07, 18.24 0.000HbA1C (mmol/mol) 6.68 ± 1.49 3.90–6.10 4.8, 11.9 0.053
absorption, resulting in malnutrition and a consequentdecline in immune function, thus increasing susceptibil-ity to other diseases [11–13]. However, few studies haveexamined associations between serum indicators of gastricfunction, such as PGI, PGII, PGI/II ratio and gastrin-17, andextragastric functional parameters. Further investigation ofthese relationships will improve our understanding of thefactors influencing gastric function and its correlation withgastric diseases. In this study, we investigated the correlationsbetween serum indicators of gastric and extragastric func-tions, with the aim of improving our understanding of theseinteractions and identifying factors with potential clinicalapplications.
2. Methods
2.1. Study Population and Data Collection. This retrospectivestudy was conducted during 2009 to 2012 at The FirstAffiliated Hospital of China Medical University, Shenyang,Liaoning Province. A total of 823 participants (518 men, 305women; median age, 49 years; range 25–84) from the healthcheckup center of the hospital were enrolled in the study. Allthe participants have the information of PGI, PGII, gastrin-17 and blood glucose, lipids (glucose, triglyceride (TG), LDL,and HDL) and kidney function (Cr and urea nitrogen), liverfunction (ALT and ALP), thyroid function (FT3, FT4, TSH,TPOAb, and thyroglobulin antibody (TGAb)). However,information onHbA1Cwas only acquired for 57 participants.
2.2. Ethical Statement. Thecollection of data from the labora-tory information system was approved by the Human EthicsReview Committee of The First Affiliated Hospital of ChinaMedical University (Shenyang, China). Written or verbalconsent was not considered necessary for the secondary useof data and because the data analyzed were deidentified.
2.3. Statistical Analysis. We compared the concentrationsof gastric function indicators among participants groupedaccording to the quartiles of extragastric indicators’ levels.All statistical analyses were performed with SPSS version13.0 software (SPSS, Chicago, IL, USA). The distributionof variables was assessed by the Kolmogorov-Smirnov test.Non-normally distributed variables were analyzed using themedian and interquartile range.Anordinal logistic regressionmodel was applied to analyze the relationships betweengastric function and other biomarkers among the threegroups adjusted for sex, age, andH. pylori status. A two-sided𝑃 value < 0.05 was considered statistically significant.
3. Results
3.1. Baseline Characteristics of the Study Population. A totalof 823 patients with serum indicators of gastric and extragas-tric functions were included. The distributions and normalreference ranges of the selected characteristics are shown inTable 1.
3.2. The Correlations between Gastric Function Parametersand Cr and Urea Nitrogen Levels in Serum. Serum PGI, PGII,PGI/II, and gastrin-17 concentrations across four Cr or ureanitrogen levels are shown in Table 2. As Cr levels increased,PGI, PGII concentrations and PGI/II ratio increased mono-tonically from 79.7 to 105.15 𝜇g/L, 6.5 to 8.4 𝜇g/L, and 11.97to 12.27, respectively (𝑃 < 0.05). There were no significantdifferences in serum G17 among Cr groups (𝑃 > 0.05).As urea nitrogen levels increased, there were no significantdifferences in serum PGI, PGII, PGI/II, and G17 betweengroups (𝑃 > 0.05).
3.3.TheCorrelations betweenGastric Function Parameters andALT and ALP Levels in Serum. Serum PGI, PGII, PGI/II,and gastrin-17 concentrations across four serum ALT and

Gastroenterology Research and Practice 3
Table2:Th
ecorrelations
betweengastric
functio
nindicatorsandCr
andurea
nitro
genlevelsin
serum.
Gastricfunctio
nCr
levelquartilesa
𝑃Urealevelqu
artiles
b𝑃
Q1(𝑁=209)
Q2(𝑁=218)
Q3(𝑁=194)
Q4(𝑁=202)
Q1(𝑁=208)
Q2(𝑁=208)
Q3(𝑁=203)
Q4(𝑁=204)
PGI
79.7(66.6–
109.7
5)92.75(72.3–119
.73)
96.65(75.15–117.55)105.15
(80.9–
129.8
)0.04
486.15
(67.4
3–110.45)96.2(73.4–
121.8
8)94.4(72.2–115.7)
99.8(80.4–
129.5
)0.305
PGII
6.5(4.86–
10.75)
7.81(5.1–12.45)
7.75(5.5–12.3)
8.4(5.8–13.23)
0.024
7.2(5.0–11.7
)7.2
5(5.4–11)
7.4(5.0–13.1)
8.25
(5.73–12.2)
0.160
PGI/I
I11.97(8.52
–15.62)
12.03(8.79–
15.14
)12.03(9.05–15.46)
12.27(9.27–15.67)
0.047
11.89(8.47–14.93)
12.67(9.35–15.86)
11.68(8.35–15.15
)12.3(9.1–
15.7)
0.993
G17
2.4(0.98–6.6)
2.45
(0.94–
5.73)
1.78(0.69–
5.34)
2.18
(0.8–6
.63)
0.101
1.65(0.85–5.64
)2.05
(0.78–5.2)
2.9(0.8–7.6)
2.55
(1.0–5.9)
0.416
Cr:creatinine.
a Quartile
1(37–56𝜇
mol/L);qu
artile2
(57–68𝜇mol/L);qu
artile3
(69–
77𝜇mol/L);qu
artile4
(78–394𝜇
mol/L).
b Quartile
1(2.31–4
.45m
mol/L);qu
artile2
(4.46–
5.18mmol/L);qu
artile3
(5.19
–6.10
mmol/L);qu
artile4
(6.11–15.28
mmol/L).
Thev
alueslisted
inthetablearem
edianandinterquartile
range.

4 Gastroenterology Research and Practice
Table3:Th
ecorrelationbetweengastric
functio
nindicatorsandALT
andALP
levelsin
serum.
Gastricfunctio
nALT
levelquartilesa
𝑃ALP
levelquartilesb
𝑃Q1(𝑁=206)
Q2(𝑁=232)
Q3(𝑁=182)
Q4(𝑁=203)
Q1(𝑁=215)
Q2(𝑁=208)
Q3(𝑁=198)
Q4(𝑁=202)
PGI
89.7(69.9
–115.85)
97.95(76.08–121.7)96.2(72.28–121.7)95.3(72.3–119
.4)
0.923
89(70.3–118.5)
95.95(77.0
5–116.48)
96.7(73–123.85)
95.5(73.65–122.88)
0.397
PGII
7.25(5.18
–13.03)
7.6(5.53
–11.5
3)7.2
1(5.18–12.13)
7.8(5.1–
12)
0.64
07.3
(5.0–12.5)
7.2(5.3–11)
8.05
(5.58–12.6)
7.6(5.3–12.03)
0.331
PGI/I
I11.69(8.01–15.29)
12.41(9.5
6–15.7)
12.17
(8.59–
15.05)
12.1(8.9–15.64
)0.639
12.04(8.57–15.69)
12.92(9.13
–15.67)
11.64(8.76
–15.37)
11.98
(8.9–15.3)
0.947
G17
2.28
(0.9–6
.63)
2.35
(0.86–
5.55)
2.35
(0.83–6.14)
1.9(0.9–5.4)
0.267
2.1(0.6–
5.7)
1.65(0.8–5.38)
2.6(1.14
–6.36)
2.53
(0.99–
6.31)
0.146
ALT
:aminotransferase;A
LP:alkalinep
hosphatase.
a Quartile
1(6–
15U/L);qu
artile2
(16–
22U/L);qu
artile3
(23–32
U/L);qu
artile4
(33–765U
/L).
b Quartile
1(30–56U
/L);qu
artile2
(57–67
U/L);qu
artile3
(68–79
U/L);qu
artile4
(80–
208U
/L).
Thev
alueslisted
inthetablearem
edianandinterquartile
range.

Gastroenterology Research and Practice 5
Table 4: (a)The correlation between gastric function indicators and T3 and T4 levels in serum. (b)The correlation between gastric functionparameters and TSH, TPOAb, and TGAb levels in serum.
(a)
Gastric function T3 level quartilesa𝑃
Q1 (𝑁 = 207) Q2 (𝑁 = 210) Q3 (𝑁 = 204) Q4 (𝑁 = 202)PGI 94.2 (72.2–121.9) 92.5 (71.23–112) 94.9 (75.55–122.45) 96.15 (72.4–119.95) 0.399PGII 7.2 (5.3–13.1) 7 (5–10.77) 8.15 (5.63–12.9) 8.15 (5.2–12.23) 0.629PGI/II 12.15 (8.73–16.08) 12.7 (9.39–15.89) 11.47 (8.83–14.59) 12.01 (8.74–15.52) 0.094G17 2.6 (0.9–5.7) 2.08 (0.9–5.26) 2.3 (0.81–7.7) 1.95 (0.9–6.05) 0.151
Gastric function T4 level quartilesb𝑃
Q1 (𝑁 = 207) Q2 (𝑁 = 205) Q3 (𝑁 = 207) Q4 (𝑁 = 204)PGI 96.1 (73–119.8) 91.8 (73–113.3) 92.7 (72.9–117.7) 98.85 (72.78–127) 0.506PGII 7.6 (5.2–12.3) 6.7 (5.25–11.1) 7.7 (5.3–12.2) 7.96 (5.5–12.55) 0.542PGI/II 12.2 (8.9–15.31) 12.38 (9.44–15.59) 12.31 (8.36–15.61) 11.82 (8.64–15.55) 0.820G17 2.55 (0.8–5.9) 2.1 (0.9–5.08) 2.1 (0.8–5.8) 2.28 (0.95–7.6) 0.059T3: triiodothyronine; T4: tetraiodothyroxide.aQuartile 1 (2.79–4.26 pmol/L); quartile 2 (4.27–4.64 pmol/L); quartile 3 (4.65–5.00 pmol/L); quartile 4 (5.01–39.63 pmol/L).bQuartile 1 (7.31–13.22U/L); quartile 2 (13.23–14.28U/L); quartile 3 (14.29–15.44U/L); quartile 4 (15.45–40.89U/L).The values listed in the table are median and interquartile range.
(b)
Gastric function TSH level quartilesc𝑃
Q1 (𝑁 = 206) Q2 (𝑁 = 210) Q3 (𝑁 = 204) Q4 (𝑁 = 203)PGI 98.35 (75.65–122) 95.05 (72.8–117.9) 91.7 (71.68–122.45) 90.8 (71.8–119.4) 0.516PGII 8.15 (5.68–13.53) 7.8 (5.5–11.4) 7 (5–11.7) 6.9 (5.1–12) 0.093PGI/II 11.54 (8.38–15.34) 12.05 (9.5–15.1) 12.09 (9.07–15.6) 12.68 (8.93–15.53) 0.047G17 2.88 (1.09–7.35) 2.7 (1.04–5.3) 1.78 (0.76–6.18) 2 (0.7–5.3) 0.334
Gastric function TPOAb level quartilesd𝑃
Q1 (𝑁 = 210) Q2 (𝑁 = 205) Q3 (𝑁 = 208) Q4 (𝑁 = 200)PGI 100.85 (75.1–125.78) 93.1 (74.05–118) 96.9 (73.33–124.75) 84 (68.98–111.4) 0.008PGII 7.8 (5.5–11.9) 7.3 (5.1–12) 8.65 (5.7–14.08) 6.95 (5–10.78) 0.420PGI/II 12.86 (9.63–15.8) 12.13 (8.97–15.54) 11.08 (8.07–14.49) 12.17 (9.33–15.57) 0.58G17 2.63 (1.04–6.3) 2.05 (0.73–5.43) 2.58 (1.1–6.75) 1.83 (0.6–5.39) 0.990
Gastric function TGAb level quartilese𝑃
Q1 (𝑁 = 208) Q2 (𝑁 = 206) Q3 (𝑁 = 205) Q4 (𝑁 = 204)PGI 92.9 (72.2–121.45) 98.65 (77.08–121.83) 92.4 (74.55–120.85) 91.7 (69.2–118.25) 0.23PGII 8.4 (5.1–12.38) 7.8 (5.68–12.53) 7.3 (5.15–11.05) 6.8 (5.2–11.68) 0.37PGI/II 11.88 (8.78–15.02) 12.51 (9.17–15.57) 12.04 (8.92–15.96) 12.09 (8.56–15.29) 0.21G17 2.98 (1.11–7.28) 2.1 (0.99–5.31) 2.05 (0.8–5.55) 1.83 (0.7–5.35) 0.07TSH: thyroid stimulating hormone; TPOAb: thyroid peroxidase antibody; TGAb: thyroglobulin antibody.cQuartile 1 (0–1.13mIU/L); quartile 2 (1.14–1.63mIU/L); quartile 3 (1.64–2.37mIU/L); quartile 4 (2.38–65.58mIU/L).dQuartile 1 (0–0.10 IU/mL); quartile 2 (0.11–0.29U/mL); quartile 3 (0.30–0.78U/mL); quartile 4 (0.79–952.8 IU/mL).eQuartile 1 (0–0.7 IU/mL); quartile 2 (0.72–1.20 IU/mL); quartile 3 (1.21–2.58 IU/mL); quartile 4 (2.59–908.3 IU/mL).
ALP levels are shown in Table 3. There were no significantdifferences in serum PGI, PGII, PGI/II, and G17 concentra-tions between participants grouped according to ALT or ALPlevel (𝑃 > 0.05).
3.4. The Correlations between Gastric Function Parametersand T3, T4, TSH, TPOAb, and TGAb Levels in Serum. SerumPGI, PGII, PGI/II, and gastrin-17 concentrations across fourserum levels of T3, T4, TSH, TPOAb, and TGAb levels areshown in Table 4. PGI level decreased from 100.85 to 84𝜇g/L
as TPOAb increased (𝑃 < 0.05). There were no significantdifferences in serum PGII, PGI/II, and G17 concentrationsbetween participants grouped according to TPOAb level (𝑃 >0.05). As TSH increased, PGI/II ratio increased monotoni-cally from 11.54 to 12.68 (𝑃 < 0.05). There were no significantdifferences in serum PGI, PGII, and G17 concentrationsbetween participants grouped according to TSH level (𝑃 >0.05). Also therewere no significant differences in serumPGI,PGII, PGI/II, and G17 concentrations between participantsgrouped according to T3, T4, or TGAb level.

6 Gastroenterology Research and Practice
Table 5: The correlation between gastric function parameters and TG, LDL, and HDL levels in serum.
Gastric function TG level quartilesa𝑃
Q1 (𝑁 = 206) Q2 (𝑁 = 207) Q3 (𝑁 = 205) Q4 (𝑁 = 205)PGI 89.15 (69.18–113.78) 98 (74–126) 95.3 (73.9–121.85) 96.1 (73.35–123.15) 0.8PGII 6.7 (4.98–11.63) 7.7 (5.6–13.7) 7.6 (5.35–11.4) 8.3 (5.3–12) 0.75PGI/II 12.31 (8.86–15.65) 11.81 (8.39–15.3) 12.21 (8.97–15.55) 12.13 (9.37–15.42) 0.48G17 1.73 (0.78–4.85) 2.1 (0.85–6.7) 2.35 (0.8–6.1) 2.7 (1.1–6.85) 0.04
Gastric function LDL level quartilesb𝑃
Q1 (𝑁 = 208) Q2 (𝑁 = 205) Q3 (𝑁 = 206) Q4 (𝑁 = 204)PGI 98.25 (75.78–125.53) 89.3 (70.9–119.25) 91.85 (72.18–112.35) 96.55 (72.48–123.4) 0.045PGII 8.25 (5.73–12.4) 7.22 (5.1–12.25) 7.25 (5.2–11.73) 7.34 (5.13–11.95) 0.165PGI/II 12.00 (8.91–14.95) 12.3 (8.92–15.82) 11.94 (8.84–15.32) 12.12 (8.92–15.67) 0.29G17 2.38 (1–5.49) 2.2 (0.83–6.8) 2.05 (0.89–5.71) 2.38 (0.8–6) 0.412
Gastric function HDL level quartilesc𝑃
Q1 (𝑁 = 206) Q2 (𝑁 = 211) Q3 (𝑁 = 205) Q4 (𝑁 = 201)PGI 95.7 (73.58–123.4) 97.7 (73.7–120.4) 95 (74.05–122.1) 89.7 (69.9–114) 0.57PGII 7.8 (5.3–11.3) 8.3 (5.2–13.1) 7.1 (5.3–13) 7 (5.1–11.25) 0.92PGI/II 12.66 (9.9–15.83) 11.63 (8.34–15.33) 12.18 (8.96–15.49) 11.86 (8.54–15.31) 0.170G17 2.1 (0.94–6.23) 2.55 (0.95–6.6) 2.1 (0.73–6.45) 2.3 (0.85–4.88) 0.13TG: triglyceride; LDL: low-density lipoprotein, HDL: high-density lipoprotein.aQuartile 1 (0.31–0.96mmol/L); quartile 2 (0.97–1.42mmol/L); quartile 3 (1.43–2.12mmol/L); quartile 4 (2.13–32.92mmol/L).bQuartile 1 (0.35–2.66mmol/L); quartile 2 (2.67–3.15mmol/L); quartile 3 (3.16–3.69mmol/L); quartile 4 (3.70–7.41mmol/L).cQuartile 1 (0.52–1.04mmol/L); quartile 2 (1.05–1.23mmol/L); quartile 3 (1.24–1.46mmol/L); quartile 4 (1.47–2.91mmol/L).
3.5. The Correlations between Gastric Function Parametersand TG, HDL, and LDL Levels in Serum. Serum PGI, PGII,PGI/II, and gastrin-17 concentrations across four serumlevels of TG, HDL, and LDL are shown in Table 5. As TGlevels increased, G17 concentrations increasedmonotonicallyfrom 1.73 to 2.7 pmol/L (𝑃 < 0.05). There were no significantdifferences in serum PGI, PGII, and PGI/II concentrationsbetween participants grouped according to TG level (𝑃 >0.05). Also therewere no significant differences in serumPGI,PGII, PGI/II, and G17 concentrations between participantsgrouped according to serumHDL and LDL levels (𝑃 > 0.05).
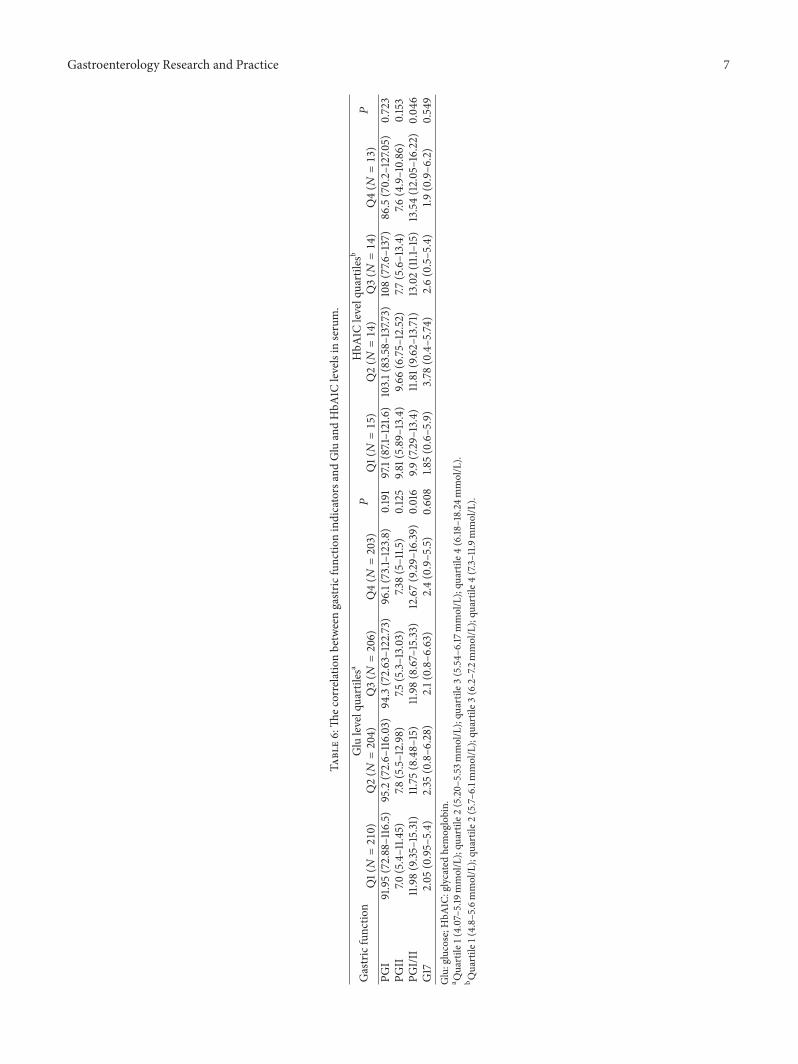
3.6. The Correlations between Gastric Function Parametersand Glucose and HbA1C Levels in Serum. Serum PGI, PGII,PGI/II, and G17 concentrations across four serum levels ofglucose and HbA1C are shown in Table 6. As serum glucoseincreased, PGI/II concentrations increased monotonicallyfrom 11.98 to 12.67 (𝑃 < 0.05). There were no significantdifferences in PGI, PGII, or G17 concentrations according toglucose levels. Similarly, as HbA1C levels increased, PGI/IIconcentrations increased monotonically from 9.7 to 13.54(𝑃 < 0.05). There were no significant differences in serumPGI, PGII, and G17 according to HbA1C levels.
4. Discussion
The present study explored the correlations between serumindicators of gastric function, including PGI, PGII, PGI/II,and gastrin-17, andmultiple serum biomarkers of extragastricfunctions in a Chinese health checkup population. Ourresults suggest that serum PG and G17 levels were associatedwith kidney function, thyroid function, blood glucose, and
lipids but not with liver function. To date, just one similararticle had been published in a Japanese population, whichinvestigated the relationship just only between PGI/II ratioand limited extragastric indicators including glucose, triacyl-glycerol, uric acid, cholinesterase, and hemoglobin [14].
Serum indicators including PGI, PGII, and G-17 mayreflect the morphologic and functional changes in thestomach, and their use as “serological biopsy” for gastricdiseases has been reported for over 20 years [3–5, 10]. Inour preliminary study, we also found that, along with thesequence of Normal→ Superficial Gastritis→Gastric Ero-sion and Ulcer→Atrophic Gastritis→Gastric Cancer, theserum PGI and PGII levels increased while the PGI/II ratiodecreased [15]; sPGII significantly increases in diseased andH. pylori-infected stomach and is a useful biomarker to differ-entiate betweendiseased andnormal stomachs [16].However,it is still unclear whether serum indicators of gastric functionalso can reflect extragastric functional changes. Exploring thecorrelations of serum indicators for gastric and extragastricfunctions will contribute to a better understanding of theclinical value of these indicators.
Cr and urea nitrogen are useful and inexpensive methodof evaluating renal dysfunction. A high serum Cr concentra-tion may indicate a failure of diseased kidneys to filter Crfrom the blood effectively. A previous study also found thatserumPG I concentrationswere elevated as the renal functiondeclined [17]. Paimela et al. found that uremic patientsdisplayed a gastric acid-secretion capacity within the normalrange but had significantly elevated serum gastrin and PGIconcentrations [18]. Nakahama et al. also reported that, inthe group of chronic glomerulonephritis patients, a positivecorrelation between the serum Cr and the pepsinogen levels
Gastroenterology Research and Practice 7
Table6:Th
ecorrelationbetweengastric
functio
nindicatorsandGluandHbA
1Clevelsin
serum.
Gastricfunctio
nGlulevelquartilesa
𝑃HbA
1Clevelquartilesb
𝑃Q1(𝑁=210)
Q2(𝑁=204)
Q3(𝑁=206)
Q4(𝑁=203)
Q1(𝑁=15)
Q2(𝑁=14)
Q3(𝑁=14)
Q4(𝑁=13)
PGI
91.95(72.88–116.5)
95.2(72.6–
116.03)
94.3(72.63–122.73)
96.1(73.1–123.8)
0.191
97.1(87.1–121.6)
103.1(83.58–137.7
3)108(77.6
–137)
86.5(70.2–127.0
5)0.723
PGII
7.0(5.4–11.4
5)7.8
(5.5–12.98)
7.5(5.3–13.03)
7.38(5–11.5
)0.125
9.81(5.89–13.4)
9.66(6.75–12.52
)7.7
(5.6–13.4)
7.6(4.9–10.86)
0.153
PGI/I
I11.98(9.35
–15.31)
11.75(8.48–15)
11.98(8.67–15.33
)12.67(9.29–
16.39
)0.016
9.9(7.29–13.4)
11.81(9.6
2–13.71)
13.02(11.1–15)
13.54(12.05–16.22)
0.04
6G17
2.05
(0.95–5.4)
2.35
(0.8–6
.28)
2.1(0.8–6.63)
2.4(0.9–5.5)
0.608
1.85(0.6–5.9)
3.78
(0.4–5.74
)2.6(0.5–5.4)
1.9(0.9–6
.2)
0.549
Glu:glucose;H
bA1C
:glycatedhemoglobin.
a Quartile
1(4.07–5.19
mmol/L);qu
artile2
(5.20–
5.53
mmol/L);qu
artile3
(5.54–
6.17mmol/L);qu
artile4
(6.18
–18.24
mmol/L).
b Quartile
1(4.8–5.6m
mol/L);qu
artile2
(5.7–
6.1m
mol/L);qu
artile3
(6.2–7.2mmol/L);qu
artile4
(7.3–11.9mmol/L).

8 Gastroenterology Research and Practice
was found [19]. In the present study, we found that as Cr levelsincreased, PGI and PGII concentrations and PGI/II ratioincreasedmonotonically.Most PG is usually secreted into thestomach cavity, but a small proportion enters the blood and isexcreted by the kidneys [1]. We speculated that an increase inCr concentration may result in reduced excretion of PGI andPGII from the diseased kidneys, with a consequent increasein serum PGI and PGII levels. These results suggested thatelevated serum PG concentrations should consider not onlythe gastric dysfunction but also abnormal renal function.
An immunological association between autoimmune thy-roid diseases (AITD) and autoimmune gastritis (AIG) wasfirst suggested in the early 1960s [20]. In patients with AITD,AIG is characterized by atrophy of the corpus and fundusof the stomach and by the presence of serum autoantibod-ies to parietal cells and autoantibodies to intrinsic factor.Autoimmune attack of the parietal cells may cause reducedacid secretion and PG level through a reduction in thenumber of functional cells [20, 21]. The results of our studyalso demonstrated that PGI levels decreased as TPOAblevels increased. In the present study, we also observed theslight increase in the PGI/II ratio across TSH level, and wespeculated that it mainly was caused by a reduction in PGII,rather than an increase in PGI. Thus, particular attentionshould be paid to patients with the change of gastric functionfor the possibility of associated autoimmune thyroid diseases.
Gastrointestinal hormones have function to optimize theprocess of intestinal digestion and absorption of nutrients[22]. Gastrin normally regulates gastric acid secretion bystimulating the proliferation of enterochromaffin-like cellsand the release of histamine [9, 23]. Recently, gastrointestinalhormones play an increasingly important role in the regu-lation of lipid metabolism. In the research of Saqui-Salceset al. results showed that components of food are sensed byantral cilia on endocrine cells, which can modulate gastrinsecretion and gastric acidity [24]. Our present study alsofound that as serum TG level increased, serum G17 levelincreased. The above results suggested that, in addition toreflecting abnormal inflammation in the antrum, elevatedG17 level also was related to abnormal lipid metabolism inthe body.
In accordance with some previous studies, our resultsshowed that the serum PGI/II ratio was positively associatedwith glucose and HbA1C levels. Tanaka et al. demonstratedthat a lack of gastric acid in AG influences the absorptionof a variety of nutrients. Sipponen and Harkonen showedthat AG may be a risk factor for malabsorption of dietaryand supplementary calcium and may therefore increase therisk of osteoporosis on the long term [25]. Tanaka et al.also found that the PG I/II ratio, which was associated withAG, was an independent determinant of glucose levels. Oneproposed mechanism suggests that lower glucose levels maybe caused by poor absorption during the decline of PGI/IIratio. Our results confirmed a positive correlation betweenglucose levels and the PGI/II ratio.
Therewere several limitations to our study. First, althoughthe correlations between serum indicators of gastric andextragastric functions were adjusted by sex, age, andH. pyloriinfection, information about other potential confounding
factors such as unhealthy living habits (e.g., smoking anddrinking) was lacking from this retrospective study. Second,the present study was designed to investigate the correlationsbetween gastric and various extragastric function parametersbut was not able to detect causal links between these indica-tors. For example, althoughwe found the association betweenCr level and PGI and PGII concentrations, no reasonableexplanation was given for the possible molecular mechanismbecause we do not do the mechanism research, which needsto be warranted in the further.
5. Conclusions
In conclusion, our results suggest that serum PG and G17levels were associated with blood glucose and lipids andkidney function thyroid function but not with liver function.Serum indicators reflecting gastric functionmay correlate notonly with primary diseases, but also with other extragastricdiseases.
Disclosure
The funders had no role in study design, data collection andanalysis, decision to publish, or preparation of the paper.
Conflict of Interests
The authors declare that there is no conflict of interestsregarding the publication of this paper.
Authors’ Contribution
YuehuaGong andWeiWang contributed equally to this work.
Acknowledgments
This research is supported by grants fromThe National BasicResearch Development Program of China (973 Program no.2010CB529304) and Science Technology Project in LiaoningProvince (nos. 2007225001-1 and 2011225002).
References
[1] I. Gritti, G. Banfi, and G. S. Roi, “Pepsinogens: physiology,pharmacology pathophysiology and exercise,” PharmacologicalResearch, vol. 41, no. 3, pp. 265–281, 2000.
[2] T. Kageyama, “Pepsinogens, progastricsins, and prochymosins:structure, function, evolution, and development,” Cellular andMolecular Life Sciences, vol. 59, no. 2, pp. 288–306, 2002.
[3] I. M. Samloff, “Pepsinogens I and II: purification from gastricmucosa and radioimmunoassay in serum,” Gastroenterology,vol. 82, no. 1, pp. 26–33, 1982.
[4] I. M. Samloff and R. T. Taggart, “Pepsinogens, pepsins, andpeptic ulcer,” Clinical and Investigative Medicine, vol. 10, no. 3,pp. 215–221, 1987.
[5] I. M. Samloff, K. Varis, T. Ihamaki, M. Siurala, and J. I. Rotter,“Relationships among serum pepsinogen I, serum pepsinogenII, and gastric mucosal histology. A study in relatives of patients

Gastroenterology Research and Practice 9
with pernicious anemia,” Gastroenterology, vol. 83, no. 1, pp.204–209, 1982.
[6] P. Sipponen andD. Y. Graham, “Importance of atrophic gastritisin diagnostics and prevention of gastric cancer: application ofplasma biomarkers,” Scandinavian Journal of Gastroenterology,vol. 42, no. 1, pp. 2–10, 2007.
[7] P. Sipponen, “Biomarkers in clinical practice: a tool to findsubjects at high risk for stomach cancer. A personal view,”Advances in Medical Sciences, vol. 51, pp. 51–53, 2006.
[8] G. Guariso, D. Basso, C.-F. Bortoluzzi et al., “GastroPanel:evaluation of the usefulness in the diagnosis of gastro-duodenalmucosal alterations in children,” Clinica Chimica Acta, vol. 402,no. 1-2, pp. 54–60, 2009.
[9] D. Fourmy, V. Gigoux, and J. C. Reubi, “Gastrin in gastrointesti-nal diseases,” Gastroenterology, vol. 141, no. 3, pp. 814.e3–818.e3,2011.
[10] F. di Mario and L. G. Cavallaro, “Non-invasive tests in gastricdiseases,”Digestive and Liver Disease, vol. 40, no. 7, pp. 523–530,2008.
[11] B. O. Asvold, L. J. Vatten, T. I. L. Nilsen, and T. Bjøro, “Theassociation between TSHwithin the reference range and serumlipid concentrations in a population-based study. The HUNTstudy,” European Journal of Endocrinology, vol. 156, no. 2, pp.181–186, 2007.
[12] K. Miki, M. Morita, M. Sasajima, R. Hoshina, E. Kanda,and Y. Urita, “Usefulness of gastric cancer screening usingthe serum pepsinogen test method,” The American Journal ofGastroenterology, vol. 98, no. 4, pp. 735–739, 2003.
[13] R. W. Ten Kate, G. Pals, J. C. Pronk et al., “Renal handling ofpepsinogens A and C in man,” Clinical Science, vol. 75, no. 6,pp. 649–654, 1988.
[14] M. Tanaka, M. Fukui, M. Kuroda et al., “Pepsinogen I/IIratio is related to glucose, triacylglycerol, and uric acid levels,”Nutrition, vol. 28, no. 4, pp. 418–421, 2012.
[15] L.-P. Sun, Y.-H. Gong, L. Wang, and Y. Yuan, “Serum pepsino-gen levels and their influencing factors: a population-basedstudy in 6990 Chinese from North China,” World Journal ofGastroenterology, vol. 13, no. 48, pp. 6562–6567, 2007.
[16] C.-Y. He, L.-P. Sun, Y.-H. Gong, Q. Xu, N.-N. Dong, and Y.Yuan, “Serum pepsinogen II: a neglected but useful biomarkerto differentiate between diseased and normal stomachs,” Journalof Gastroenterology and Hepatology, vol. 26, no. 6, pp. 1039–1046, 2011.
[17] M. Murakawa, “Influence of impaired renal function and Heli-cobacter pylori infection on serum pepsinogen concentrations,”Nihon Jinzo Gakkai Shi, vol. 41, no. 4, pp. 399–405, 1999.
[18] H. Paimela, M. Harkonen, S.-L. Karonen, L. G. Tallgren, S.Stenman, and J. Ahonen, “Relation between serum group IIpepsinogen concentration and the degree of Brunner’s glandhyperplasia in patients with chronic renal failure,” Gut, vol. 26,no. 2, pp. 198–202, 1985.
[19] H. Nakahama, Y. Tanaka, D. Shirai et al., “Elevated serumpepsinogens in chronic renal failure patients,” Nephron, vol. 70,no. 2, pp. 211–216, 1995.
[20] M. J. Williams, G. B. Scott, J. S. Beck, and D. W. Blair,“Antigastric antibodies in hyperthyroidism: their relationship toimpaired acid secretion,” British Medical Journal, vol. 5484, pp.388–391, 1966.
[21] A. Kokkola, S.-M. Sjoblom, R. Haapiainen, P. Sipponen, P.Puolakkainen, and H. Jarvinen, “The risk of gastric carcinomaand carcinoid tumours in patients with pernicious anaemia.
A prospective follow-up study,” Scandinavian Journal of Gas-troenterology, vol. 33, no. 1, pp. 88–92, 1998.
[22] J. E. Blundell, P. Caudwell, C. Gibbons et al., “Role of restingmetabolic rate and energy expenditure in hunger and appetitecontrol: a new formulation,” Disease Models and Mechanisms,vol. 5, no. 5, pp. 608–613, 2012.
[23] M. Mazaki-Tovi, G. Segev, E. Yas-Natan, and E. Lavy, “Serumgastrin concentrations in dogs with liver disorders,” VeterinaryRecord, vol. 171, no. 1, article 19, 2012.
[24] M. Saqui-Salces, W. E. Dowdle, J. F. Reiter, and J. L. Merchant,“A high-fat diet regulates gastrin and acid secretion throughprimary cilia,”The FASEB Journal, vol. 26, no. 8, pp. 3127–3139,2012.
[25] P. Sipponen and M. Harkonen, “Hypochlorhydric stomach: arisk condition for calcium malabsorption and osteoporosis?”Scandinavian Journal of Gastroenterology, vol. 45, no. 2, pp. 133–138, 2010.

Submit your manuscripts athttp://www.hindawi.com
Stem CellsInternational
Hindawi Publishing Corporationhttp://www.hindawi.com Volume 2014
Hindawi Publishing Corporationhttp://www.hindawi.com Volume 2014
MEDIATORSINFLAMMATION
of
Hindawi Publishing Corporationhttp://www.hindawi.com Volume 2014
Behavioural Neurology
EndocrinologyInternational Journal of
Hindawi Publishing Corporationhttp://www.hindawi.com Volume 2014
Hindawi Publishing Corporationhttp://www.hindawi.com Volume 2014
Disease Markers
Hindawi Publishing Corporationhttp://www.hindawi.com Volume 2014
BioMed Research International
OncologyJournal of
Hindawi Publishing Corporationhttp://www.hindawi.com Volume 2014
Hindawi Publishing Corporationhttp://www.hindawi.com Volume 2014
Oxidative Medicine and Cellular Longevity
Hindawi Publishing Corporationhttp://www.hindawi.com Volume 2014
PPAR Research
The Scientific World JournalHindawi Publishing Corporation http://www.hindawi.com Volume 2014
Immunology ResearchHindawi Publishing Corporationhttp://www.hindawi.com Volume 2014
Journal of
ObesityJournal of
Hindawi Publishing Corporationhttp://www.hindawi.com Volume 2014
Hindawi Publishing Corporationhttp://www.hindawi.com Volume 2014
Computational and Mathematical Methods in Medicine
OphthalmologyJournal of
Hindawi Publishing Corporationhttp://www.hindawi.com Volume 2014
Diabetes ResearchJournal of
Hindawi Publishing Corporationhttp://www.hindawi.com Volume 2014
Hindawi Publishing Corporationhttp://www.hindawi.com Volume 2014
Research and TreatmentAIDS
Hindawi Publishing Corporationhttp://www.hindawi.com Volume 2014
Gastroenterology Research and Practice
Hindawi Publishing Corporationhttp://www.hindawi.com Volume 2014
Parkinson’s Disease
Evidence-Based Complementary and Alternative Medicine
Volume 2014Hindawi Publishing Corporationhttp://www.hindawi.com