research article rice photosynthetic productivity and psii...
TRANSCRIPT

Research ArticleRice Photosynthetic Productivity and PSIIPhotochemistry under Nonflooded Irrigation
Haibing He1 Ru Yang1 Biao Jia1 Lin Chen2 Hua Fan1
Jing Cui1 Dong Yang1 Menglong Li1 and Fu-Yu Ma1
1 Agricultural College Shihezi UniversityKey Laboratory of Oasis Ecology Agriculture of Xinjiang BingtuanShihezi Xinjiang 832003 China
2 Agricultural Drought Research Institute of Tianye Group Company XinJiang 832003 China
Correspondence should be addressed to Fu-Yu Ma mfy agr163com
Received 24 November 2013 Accepted 18 January 2014 Published 5 March 2014
Academic Editors P Parolin and R Sarkar
Copyright copy 2014 Haibing He et al This is an open access article distributed under the Creative Commons Attribution Licensewhich permits unrestricted use distribution and reproduction in any medium provided the original work is properly cited
Nonflooded irrigation is an importantwater-saving rice cultivation technology but little is knownon its photosyntheticmechanismThe aims of this work were to investigate photosynthetic characteristics of rice during grain filling stage under three nonfloodedirrigation treatments furrow irrigationwith plasticmulching (FIM) furrow irrigationwith nonmulching (FIN) and drip irrigationwith plastic mulching (DI) Compared with the conventional flooding (CF) treatment those grown in the nonflooded irrigationtreatments showed lower net photosynthetic rate (119875
119873) lower maximum quantum yield (119865V119865119898) and lower effective quantum yield
of PSII photochemistry (ΦPSII) And the poor photosynthetic characteristics in the nonflooded irrigation treatments were mainlyattributed to the low total nitrogen content (TNC) Under non-flooded irrigation the 119875
119873 119865V119865119898 andΦPSII significantly decreased
with a reduction in the soil water potential but these parameters were rapidly recovered in the DI and FIM treatments whensupplementary irrigation was applied Moreover The DI treatment always had higher photosynthetic productivity than the FIMand FIN treatments Grain yield matter translocation and dry matter post-anthesis (DMPA) were the highest in the CF treatmentfollowed by the DI FIM and FIN treatments in turn In conclusion increasing nitrogen content in leaf of rice plants could be a keyfactor to improve photosynthetic capacity in nonflooded irrigation
1 Introduction
To meet the increasing demand for rice from the wordrsquosgrowing population rice production must increase by 60by 2025 according to current projections [1] However ashortage of water resources is already a problem for agricul-ture [2] Therefore water shortages are expected to limit riceproduction which requires a large amount of water In recentyears various water-saving cultivations for rice productionhave been tested Rice is grown under nonflooded irrigationwith adequate inputs and supplementary irrigation at timesduring the growth period when rainfall is insufficient Ricegrown in this way shows high water use efficiency and grainyield [3ndash7]These technologies provide important theoreticalreference values for coping with potential water deficit andthe demands for a staple food
Grain yield formationmainly depends on photosyntheticproduction during the grain-filling stage [8 9] Thereforephotosynthesis during the grain-filling stage is an importantphysiological factor affecting biomass and grain yield [10]The flag leaves the second and third leaves from the topof the plant are considered to be functional leaves duringgrain filling [11] Therefore studies on the photosyntheticcharacteristics of flag leaves during the grain-filling stagehelp us understand their physiological status and the grainproduction potential of the plant [11] Water stress is themost important limiting factor affecting plant growth andcrop production worldwide Previous studies reported thatthe photosynthetic rate of the flag leaves declined quicklywhen grain-filling stage was subjected to nonflooded con-ditions [12 13] and that grain yield was affected by waterdeficit stress [14 15] However studies on photosynthetic
Hindawi Publishing Corporatione Scientific World JournalVolume 2014 Article ID 839658 14 pageshttpdxdoiorg1011552014839658
2 The Scientific World Journal
mechanisms of rice in nonflooded condition have generallyapplied only short-term water regulation of water supply forexample growing rice under nonflooded cultivation duringthe grain-filling stage while applying flooding conditionsduring other stages of growth [12 13 16] There have beenrelatively few studies on the photosynthesis of rice flag leavesduring the grain-filling stage that have used plants grownunder nonflooded cultivation for the whole growth periodIt is very interesting to know photosynthetic characteristicsand photosynthetic production capacity during the grain-filling stage under long-term nonflooded cultivation Suchresearch will also contribute to an understanding of the ricegrain yield production potential under long-termnonfloodedcultivation
Light energy is a driving factor of photosynthesis Lightenergy absorbed by chlorophyll molecules in a leaf can be lostfromphotosynthesis (photochemistry) heat loss and chloro-phyll fluorescence [17] The processes of photochemistrychlorophyll fluorescence and heat loss directly compete forexcitation energy [18] Therefore chlorophyll fluorescenceespecially for the PSII system can be a very powerful toolto study photosynthetic performance the degree of waterstress or photoinhibition and photoprotective mechanisms[17ndash19] Under abiotic stress the photosynthetic rate is signif-icantly reduced [12] and the requirement for photosyntheticelectrons also decreases so that surplus radiant energy mustbe degraded in alternative ways [20] To alleviate or avoiddamaging the plantrsquos photosynthetic apparatus excessiveenergy can be dissipated by heat emission (nonphotochem-ical quenching) this mechanism protects the photosyntheticapparatus and helps to resist photoinhibition [21] Photoin-hibition occurs when there is a large surplus of radiantenergy andor nonphotochemical quenching is insufficientto dissipate excess energy [22] To date there has been littlesystematic research on the photosynthetic attributes (lightenergy absorption proportion of energy distributed to thephotosynthetic apparatus photoprotection and adaptationmechanisms) of rice grown under long-term nonfloodedirrigation
In rice photosynthesis is affected by nonflooded cultiva-tion conditions The photosynthetic capacity is significantlyimproved in the mulching cultivation than in the bare landcultivation [7] It is likely that different nonflooded cultiva-tion methods will affect photosynthetic performance photo-protection and adaptation mechanisms ultimately affectingyield Therefore in this study we cultivated rice usingthree different nonflooded cultivation methods and analyzedvarious photosynthetic parameters The objectives of thisstudy are (1) to characterize photosynthesis photoprotectionand adaptation mechanism of flag leaves during grain-fillingunder long-term nonflooded irrigation management and (2)to evaluate the photosynthetic production potential underdifferent cultivation conditions
2 Materials and Methods
21 PlantMaterial and ExperimentDesign Field experimentsusing the rice (Oryza sativaL) cultivarNinggeng28were con-ducted in 2011 and 2012 at the Agricultural Drought Research
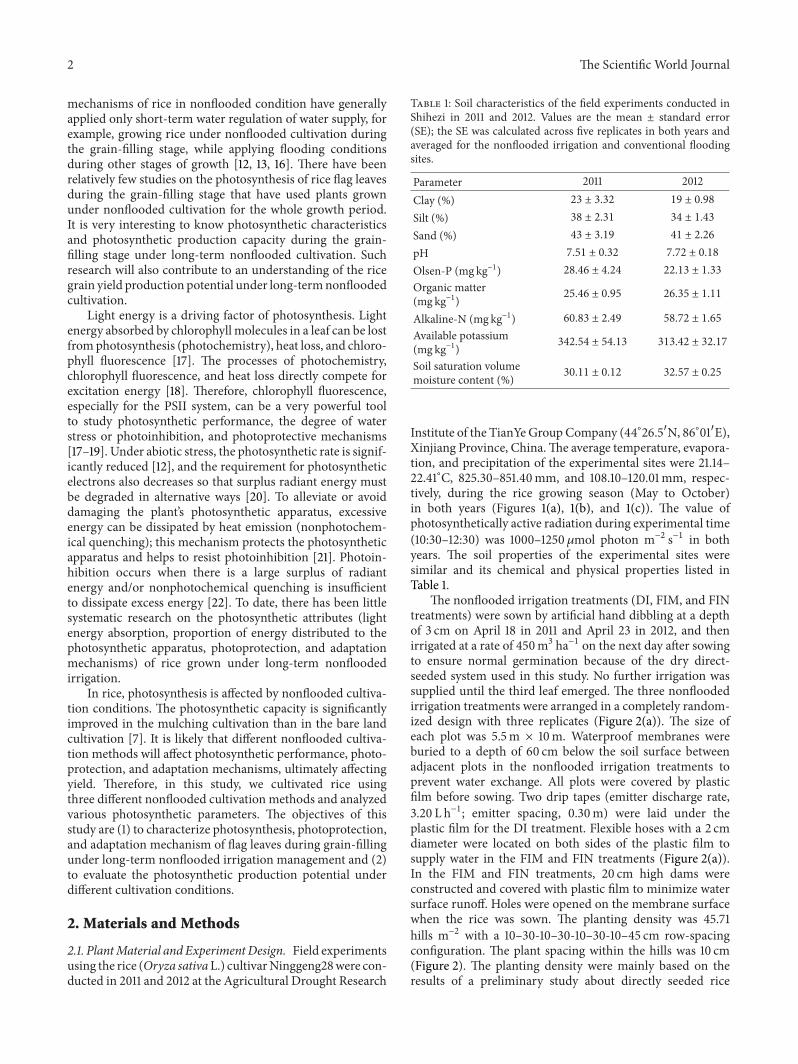
Table 1 Soil characteristics of the field experiments conducted inShihezi in 2011 and 2012 Values are the mean plusmn standard error(SE) the SE was calculated across five replicates in both years andaveraged for the nonflooded irrigation and conventional floodingsites
Parameter 2011 2012Clay () 23 plusmn 332 19 plusmn 098
Silt () 38 plusmn 231 34 plusmn 143
Sand () 43 plusmn 319 41 plusmn 226
pH 751 plusmn 032 772 plusmn 018
Olsen-P (mg kgminus1) 2846 plusmn 424 2213 plusmn 133
Organic matter(mg kgminus1) 2546 plusmn 095 2635 plusmn 111
Alkaline-N (mg kgminus1) 6083 plusmn 249 5872 plusmn 165
Available potassium(mg kgminus1) 34254 plusmn 5413 31342 plusmn 3217
Soil saturation volumemoisture content () 3011 plusmn 012 3257 plusmn 025
Institute of the TianYeGroup Company (44∘2651015840N 86∘011015840E)Xinjiang Province ChinaThe average temperature evapora-tion and precipitation of the experimental sites were 2114ndash2241∘C 82530ndash85140mm and 10810ndash12001mm respec-tively during the rice growing season (May to October)in both years (Figures 1(a) 1(b) and 1(c)) The value ofphotosynthetically active radiation during experimental time(1030ndash1230) was 1000ndash1250 120583mol photon mminus2 sminus1 in bothyears The soil properties of the experimental sites weresimilar and its chemical and physical properties listed inTable 1
The nonflooded irrigation treatments (DI FIM and FINtreatments) were sown by artificial hand dibbling at a depthof 3 cm on April 18 in 2011 and April 23 in 2012 and thenirrigated at a rate of 450m3 haminus1 on the next day after sowingto ensure normal germination because of the dry direct-seeded system used in this study No further irrigation wassupplied until the third leaf emerged The three nonfloodedirrigation treatments were arranged in a completely random-ized design with three replicates (Figure 2(a)) The size ofeach plot was 55m times 10m Waterproof membranes wereburied to a depth of 60 cm below the soil surface betweenadjacent plots in the nonflooded irrigation treatments toprevent water exchange All plots were covered by plasticfilm before sowing Two drip tapes (emitter discharge rate320 L hminus1 emitter spacing 030m) were laid under theplastic film for the DI treatment Flexible hoses with a 2 cmdiameter were located on both sides of the plastic film tosupply water in the FIM and FIN treatments (Figure 2(a))In the FIM and FIN treatments 20 cm high dams wereconstructed and covered with plastic film to minimize watersurface runoff Holes were opened on the membrane surfacewhen the rice was sown The planting density was 4571hills mminus2 with a 10ndash30-10ndash30-10ndash30-10ndash45 cm row-spacingconfiguration The plant spacing within the hills was 10 cm(Figure 2) The planting density were mainly based on theresults of a preliminary study about directly seeded rice
The Scientific World Journal 3
Tem
pera
ture
(∘C)
30
25
20
15
10
5
May June July Aug Sept OctMonth
2011
2012
(a)
Evap
orat
ion
(mm
)
250
200
150
100
50
May June July Aug Sept OctMonth
2011
2012
(b)
Prec
ipita
tion
(mm
)
35
30
25
20
15
10
5
0May June July Aug Sept Oct
Month
2011
2012
(c)
Figure 1 Average temperature (a) evaporation (b) and precipitation (c) during the rice growing period in Shihezi in 2011 and 2012 Eachdatum point represents the mean of a month
under drip irrigation with full mechanization in recent yearsBasic seedling numbers per hill were six plants in bothyears The water regimes were applied from the 3-leaf stageto maturity Forty to sixty millimeter of water was appliedwhen the soil water potential in the 0ndash20 cm soil layer of thenarrow rows (Figure 2(b)) dropped to minus30KPa as monitoredby tensiometer (Watermark Irrometer Company RiversideCA)This soil water potential thresholdwas established basedon the results of a preliminary field investigation in 2010Thesoil water potential at the 20 cm depth occasionally droppedto minus40KPa during the rice growing period To create thebare-soil treatment (ie the FIN treatment) the plastic filmswere removed at the 3-leaf stageThe hydrological conditionsduring the data acquisition period are shown in Figure 3
When the threshold values for supplementary irrigationwere reached supplementary irrigation was immediatelyapplied In particular plants grown in nonflooded irrigationtreatments were irrigated after acquiring gas exchange andchlorophyll fluorescence parameters during the data acqui-sition period The CF cultivation treatment was set as CKthe planting density of the CF treatment was 40 hillsmminus2(10 cm times 25 cm) with five plants per hill The seeds weresown on the nursery trays on the same day when thenonflooded irrigations were sown and then twenty-one-day-old seedlings from the nursery trays were transplanted Awater depth of 5ndash10 cm was continuously maintained in theCF treatment from transplanting to maturity The sites of theCF treatment were about 150m away from the nonflooded
4 The Scientific World Journal
Rice row
Apply fertilizer apparatusPlots of different irrigation modelswith a cultivar
Main irrigation lineDrip tapes
Flexible hose Branch irrigation line Combination of valve and flow meter
DI DI
DI
FIM FIMFIN
FIMFINFIN
Plot with 54m2
(a)
Rice hill
Drip tapes
Watermark (instrument of monitoring soil water potential)
Plastic film
Narrow row spacing (10 cm)Wide row spacing (30 cm)
Film width (160 cm)
Distance between the two films (45 cm)
(b)
Figure 2 Experiment layout (a) and sketch map of planting mode (b) under nonflooded irrigation treatments in Shihezi in both years
irrigation plots and the soil physicochemical property wasconsistent with nonflooding irrigation treatments in bothyears (the flooding treatmentwas set in three small pools builtin 2010 and the flooding plots were not previously traditionalpaddy the area of the each small pool was also the same withthe plot of nonflooding irrigation treatments)
Fertilizers applied were 270 kgN per hectare as urea100 kgK
2Oper hectare as potassium chloride 90 kg P
2O5per
hectare as calcium superphosphate and 30 kg zinc sulfate perhectare of which 10N all K
2O all P
2O5 and all Zn were
applied as basal fertilizer the rest of N was applied in foursplit applications 20 at the three leaf blades stage 35 attillering 35 at panicle initiation and 10 at flowering
22 Measurement of Dry Matter Preanthesis (DMPrA) DryMatter Postanthesis (DMPA) Leaf Area Index at Flowering(LAI119898119886119909
) Matter Translocation and Grain Yield TomeasureDMPrA DMPA and (LAImax) (green leaf area at flowering)050m2 plant samples were taken from each plot at theflowering period (August 2 in 2011 and August 4 in 2012)and the mature stage (September 13 in 2011 and September12 in 2012) in the two years The samples were separatedinto stem leaf and panicle when present The leaf areawas measured with a LI-3100 leaf area meter (LI-COR IncLincoln NEUSA) Then samples were dried in an oven at75∘C for 72 h and the weights of stem leaf and panicle weremeasuredThe drymatter at the flowering period was defined
The Scientific World Journal 5
Soil
wat
er p
oten
tial (
kPa)
DIFIMFIN
Days after anthesis (d)
2011
191817160
minus5
minus10
minus15
minus20
minus25
minus30
minus35
minus40
(a)
Days after anthesis (d)19181716
2012
Soil
wat
er p
oten
tial (
kPa)
0
minus5
minus10
minus15
minus20
minus25
minus30
minus35
minus40
DIFIMFIN
(b)
Figure 3 Soil water potential at 0ndash20 cm soil layer under nonflooded irrigation treatments from the 16th day after anthesis to the 19th dayafter anthesis in Shihezi in 2011 (a) and 2012 (b) Vertical bars represent SE of the mean the SE was calculated across three replicates for eachyear
as DMPrA DMPA was calculated as follows dry matterat maturitymdashdry matter at anthesis Matter translocation =dry weight of stems and sheaths at anthesismdashdry weightof stems and sheaths at maturity The parameter of mattertranslocation was measured because the stems and sheathsare considered as important energy storage organs and thematter translocation rate will affect grain yield formation[8 9] At maturity (September 15 2011 and September 142012) 8m2 plants in each plot were harvested to calculategrain yield Grain weight is expressed at 14 moisturecontent
23 Measurement of Chlorophyll Content Fresh flag leaftissue (01 g) was extracted in 10mL of 80 (vv) acetoneunder dark and sealed conditions for 48 h The absorbance(OD values) of the solution was measured with a 722Svisible spectrophotometer (Shanghai Third instrument Fac-tory Shanghai China) at 647 nm and 664 nm In case ofhighly elevated titers (optical density [OD] values gt 08) theextracted solution was further diluted in 80 (vv) acetoneto give OD values of between 01 and 08 The chlorophyllcontent was calculated as described by Porra [23] as followsChl 119886 (mg Lminus1) = [1225 times OD
664minus 255 times OD
647] times dilution
ratio Chl 119887 (mg Lminus1) = [2031 times OD647minus 491 times OD
664] times
dilution ratio Chl (119886 + 119887) (mg Lminus1) = [1776 times OD647
+ 734timesOD
664] times dilution ratio Chl ab = Chl aChl b Finally Chl
(mg gminus1 FW) = Chl (mg Lminus1) times 001 L01 g FW (fresh weight)
24 Measurement of Total Nitrogen Content (TNC) and Nitro-gen Content per Leaf Area (NLA) of Flag Leaves To measuretotal nitrogen content flag leaves were harvested on the 16thday after anthesis in 2012 The TNC of the dried tissueswas determined using the micro-Kjeldahl method [24] Theamount of nitrogen per leaf area (NLA) was calculated bydividing TNC by the specific leaf weight The specific leafweight of the flag leaf was defined as flag leaf weight per unitarea
25 Measurement of Root Activity The root activity wasdetermined on the 20th day after anthesis in 2012 using thetriphenyltetrazolium chloride (TTC) method [25] Fresh andyoung roots from the 0ndash20 cm soil layer (which containedapprox 85 of the root system data not presented) werewashed and cut at 2 cm from the root tips Then approx-imately 030 g fresh root tissue was placed into test tubewith 5mL of 040 (wv) TTC and 5mL phosphate buffer(006mol Lminus1 pH = 7) Tubes were incubated at 37∘C ina water bath for 3 h and then 2mL of 1mol Lminus1 sulfuricacid was added to each tube to stop the reaction The rootswere then picked out and ground in a pestle with 3-4mLof ethyl acetate and a little quartz sand The liquid phasewas removed into a test tube and the pestle was washed 2-3 times with a small volume of ethyl acetate The absorbance(OD values) of the extractants was recorded at 485 nm with a722S visible spectrophotometer (Shanghai Third instrumentFactory Shanghai China)
6 The Scientific World Journal
Table 2 Analysis-of-variance (119865-values) for chlorophyll (Chl) net photosynthetic rate (119875119873) stomatal conductance (119892
119904) intercellular CO2
concentration (119862119894) maximal quantum yield of PSII photochemistry (119865V119865119898) PSII maximum efficiency (119865V
1015840119865119898
1015840) effective quantum yield ofPSII photochemistry (ΦPSII) and nonphotochemical quenching (NPQ) betweenamong years and treatments
Source of variation df DMPA Yield Chl 119875119873
119892119904
119862119894119865V119865119898 119865V
1015840119865119898
1015840 ΦPSII NPQCultivation mode 3 42155lowastlowastlowast 35121lowastlowastlowast 16310lowastlowastlowast 14122lowastlowastlowast 1373lowastlowastlowast 2091lowastlowastlowast 45 72lowastlowastlowast 14324lowastlowastlowast 17831lowastlowastlowast 1643lowastlowastlowastYear 1 415ns 378ns 227ns 425ns 003ns 026ns 228ns 265ns 089ns 007nsC times Y 3 311ns 241ns 105ns 032ns 057ns 047ns 294ns 356lowast 117ns 008nslowastSignificance difference at 119875 lt 005lowastlowastlowastSignificance difference at 119875 lt 0001nsNonsignificant differences
26 Measurement of Net Photosynthetic Rate (119875119873) Stomatal
Conductance (119892119904) Intercellular CO
2Concentration (119862
119894) and
Transpiration Rate (119864) Five individual flag leaves in vivowere sampled and labeled for each plot to acquire gasexchange parameters and chl119886fluorescence across treatmentsand years Gas exchange parameters were measured with aphotosynthesis system (Li-6400 LI-COR Biosciences Lin-coln NE USA) at 1030ndash1230 h from the 16th day after anthe-sis to the 19th day after anthesis under 1200120583mol photonmminus2 sminus1 light intensity The light was provided by a redblueLED light source system in both years The gas exchangeparameters including 119875
119873(120583molmminus2 sminus1) 119892
119904(molmminus2 sminus1)
119862119894(120583molmolminus1) and 119864 (mmolmminus2 sminus1) were acquired The
atmospheric CO2concentration air temperature and relative
air humidity were 380ndash390 120583molmolminus1 26ndash28∘C and 6021ndash6510 respectively during the data acquisition period ofboth study years
27 Measurement of Chlorophyll Fluorescence Analysis Chl 119886fluorescence was synchronously measured with gas exchangeat 1030ndash1230 h by a portable saturation pulse fluorometer(PAM-2100 Walz GmbH Effeltrich Germany) equippedwith a 2030-B leaf clip holder which can monitor PARand leaf temperature simultaneously The leaves were con-tinuously illuminated at 1200120583molmminus2 sminus1 actinic light with5 minutes to measure the steady-state fluorescence yield(119865119904) then the maximal fluorescence level (119865
119898
1015840) in the light-adapted leaves were recorded after a 080-s saturating pulse(8000120583molmminus2 sminus1) Meanwhile maximal fluorescence yieldof dark-adapted state (119865
119898) and minimum fluorescence yield
of dark-adapted state (119865119900) were measured at predawn being
also with the labeled flag leaves (Note that leaf temperaturesmonitored by a 2030-B leaf clip holder were 196ndash218∘Cat this time across both years) 119865
119900was determined under
illumination with far-red light (lt1 120583molmminus2 sminus1) and thena 080-s saturating pulse (8000 120583molmminus2 sminus1) was suppliedto determine 119865
119898 The minimum fluorescence yield in light-
adapted state (1198651199001015840) was calculated as 119865
119900
1015840 = 119865119900[(119865V119865119898) +
(119865119900119865119898
1015840)] [26]The potential maximum efficiency of PSII wasestimated as 119865V119865119898 = (119865119898 minus 119865119900)119865119898 The PSII maximumefficiency was estimated as 119865V
1015840119865119898
1015840 = (119865119898
1015840 minus 119865119900
1015840)119865119898
1015840 [27]The actual PSII efficiency of PSII was estimated as ΦPSII =(119865119898
1015840 minus 119865119904)119865119898
1015840 [27] Nonphotochemical quenching wasestimated as NPQ = (119865
119898minus119865119898
1015840)119865119898
1015840 [28]The photochemicalquenching coefficient which also represents the fraction ofopen PSII reaction centers was estimated as 119902
119901= (119865119898
1015840 minus
119865119904)(119865119898
1015840 minus 119865119900
1015840) [29]
28 Statistical Analysis Data were analyzed using the gener-alized linear model (GLM) procedure (SPSS160 SPSS IncChicago USA) The effects of the various factors includedcultivation mode year and interactions of cultivation modetimes year were assessed by analysis of variance Means werecompared by Fisherrsquos least-significant-difference test at the5 probability level Also two-tailed 119905-test was used tocompare with the difference of gas exchange and chlorophyllfluorescence parameters gas exchange and between 16th dayafter anthesis and 19th day after anthesis
3 Results
31 Analysis-of-Variance of Treatments As shown in Table 2the DMPA grain yield Chl 119875
119873 119892119904 119862119894 119865V119865119898 119865V
1015840119865119898
1015840ΦPSIIand NPQ were affected significantly by the different cultiva-tion modes (119875 lt 0001) However there were no significantdifferences between the two years for all parameters (119864 119902
119875
and DMPrA not present) There was a significant interactioneffect between the cultivationmode and year for119865V
1015840119865119898
1015840 (119875 lt005) but not for any of the other parametersTherefore datafrom two study years were averaged for further analyses
32 DMPrA DMPA LAI119898119886119909
Matter Translocation andGrainYield In plants grown under nonflooded irrigation theDMPrA was slightly higher and the DMPA was significantlylower than that of plants in the CF treatment (119875 lt 005Table 3) The DI treatment had the highest leaf area indexat flowering stage followed by the FIM treatment the FINtreatment and then the CF treatment (Table 3) The mattertranslocation was in the order of CF gt DI gt FIM gt FINtreatments (Table 3) As Table 3 showed the grain yield wasabout 8500 kg haminus1 in the CF treatment and ranged from2100 kg haminus1 to 5800 kg haminus1 in the nonflooded irrigationtreatments The grain yield was significantly higher in the DItreatment than in the FIM and FIN treatments (119875 lt 005Table 3)
33 Changes in Chlorophyll Content Root Activity TNC andNLA The Chl (119886 + 119887) and Chl 119886119887 values determined onthe 4 days of measurement (from the 16th day after anthesisto the 19th day after anthesis) were averaged for the sametreatment because no significant differences were observedamong the different days of the data acquisition period (dataof analysis-of-variance not present) The results showed thatthe Chl (119886 + 119887) concentration in the CF treatment (control)
The Scientific World Journal 7
Table3Th
edrymatterp
reanthesis(D
MPrA)drymatterp
ostanthesis
(DMPA
)mattertranslocatio
ngrainyield
leafarea
indexatflo
weringsta
ge(LAI m
ax)root
activ
itytotalnitro
gen
content(TN
C)and
nitro
gencontentp
erleafarea
(NLA
)ofcultiv
arNinggeng28(O
ryza
sativaL)u
nder
different
treatmentsin
Shihezi
DMPrA
kghaminus1
DMPA
kghaminus1
Mattertranslocatio
nkg
haminus1
Yield
kghaminus1
LAI m
axRo
otactiv
ity120583ggminus1FW
hminus1
TNC120583ggminus1
NLA120583gd
mminus2
CF1053722plusmn26536b
1526293plusmn47301a
138465plusmn7324a
857985plusmn11043a549plusmn049c
52443plusmn4033a
837plusmn051a371plusmn022a
DI1339854plusmn51123a
941722plusmn30375b
136231plusmn8918a
579368plusmn23841b716plusmn028a
40943plusmn1040b
621plusmn013b219plusmn013b
FIM1184543plusmn36824ab
588114plusmn56950c
45037plusmn5541b
363692plusmn15464c677plusmn028ab
32309plusmn1991c
409plusmn043c113plusmn015c
FIN1186240plusmn82114ab
466602plusmn11845d
minus32455plusmn6359c
208601plusmn22141d664plusmn014b
25886plusmn3250d
364plusmn012c092plusmn008d
Values
arethe
meanplusmnSE
the
SEwas
calculated
acrossthreer
eplicates
fore
achyear
andaveraged
forthe
2yearsVa
lues
with
incolumns
follo
wed
bydifferent
lowercase
lette
rsares
ignificantly
different
at119875lt005
accordingto
least-s
ignificant-d
ifference
test
8 The Scientific World Journal
c
Chl (A + B)
a
b
c
CF DI FIM FINTreatment
1
2
3
4
5
Chl (
a+
b) (m
g gminus1
FW)
(a)
CF DI FIM FIN
aa
aa
Treatment
Chl ABCh
l ab
05
10
15
20
25
(b)
Figure 4 Chl content of cultivar Ninggeng28 (Oryza sativa L) under CF DI FIM and FIN treatments at the grain-filling stage respectivelyin Shihezi The CF indicates conventional flooding and the DI FIM and FIN are plastic film mulching with drip irrigation plastic filmmulching with furrow irrigation and no mulching with furrow irrigation respectively Vertical bars represent SE of the mean the SE wascalculated across five replicates for each year and averaged for the 2 years Values of different treatments followed by the same letter indicateno significant differences (119875 lt 005) according to least-significant-difference test
was 501mg gminus1 FW which was 5310 higher than in theDI treatment 6912 higher than in the FIM treatment and7331 higher than in the FIN treatment (Figure 4(a)) Nosignificant differences were observed in Chl ab among thefour treatments (119875 gt 005 Figure 4(b))
At the grain-filling stage the root activity in the CFtreatment was the highest which was significantly increasedby 2193 compared with the DI treatment by 3839compared with the FIM treatment and by 5064 comparedwith the FIN treatment (119875 lt 005 Table 3) The highest TNCand NLA values for the flag leaves were in the CF treatmentfollowed by the DI treatment then the FIM treatment andthen the FIN treatment Significant differences in the TNCand NLA parameters existed among the four treatments (119875 lt005 Table 3)
34 Analysis of Leaf Gas Exchange Plants in theDI treatmenthad a higher 119875
119873than did plants in the FIM and FIN
treatments from the 16th day after anthesis to the 19th dayafter anthesis However the 119875
119873of plants in the DI FIM
and FIN treatments was always significantly lower than thatof plants in the CF treatment during the data acquisitionperiod (Figure 5(a)) The 119875
119873in the CF treatment remained
relatively stable from the 16th day after anthesis to the 19thday after anthesis (Figure 5(a)) In contrast plants grownin the nonflooded irrigation treatments showed decreasing119875119873as the soil water potential decreased with minimum 119875
119873
values on the 18th day after anthesis (Figure 5(a)) whichthe soil water potential on the day reached its lowest values
across treatments and years (from minus28KPa to minus3650KPa)(Figures 3(a) and 3(b)) After that the 119875
119873rose on the 19th
day after anthesis when the soil water potential had reachedminus3 and minus540KPa as a result of supplementary irrigationin the DI and FIM treatments respectively No significantdifference were observed for the parameter between the 16thday after anthesis and the 19th day after anthesis in the DIand FIM treatments but significant difference existed in theFIN treatment (two-tailed 119905-test For the DI treatment df= 5 119905 = 108 119875 = 031 for the FIM treatment df = 5119905 = 138 119875 = 020 for the FIN treatment df = 5 119905 = 431119875 = 001) indicating that the 119875
119873could completely recover
after supplementary irrigation in the DI and FIM treatmentsThe trends in 119892
119904and 119864 values were similar to those observed
for 119875119873
across soil water potential and cultivation modesTheir values were significantly lower under the nonfloodedirrigation treatments than under theCF treatment (119875 lt 005)Meanwhile both 119892
119904and 119864 parameters gradually decreased
as the soil water potential decreased until the 18th day afteranthesis in the nonflooded irrigation treatments and thenrecovered on the 19th day after anthesis after supplementaryirrigation in the DI and FIM treatments compared with the16th day after anthesis (two-tailed 119905-test 119875 gt 005 for theFIM and DI treatments 119875 lt 005 for the FIN treatment Dataof analysis-of-variance not present) The variation in 119862
119894was
small among the different treatments but higher 119862119894values
were observed in the nonflooded irrigation treatments thanin the CF treatment during the entire measurement period(Figure 5(d))
The Scientific World Journal 9
2
0
4
6
8
10
12
14
16
b
c
c
aa
b
c
c
a
b
c
d
a
b
c
c
CFDI
FIMFIN
Days after anthesis (d)16 17 18 19
PN
(120583m
ol (C
O2)m
minus2
sminus1)
(a)
0
a
bb
b
a
bc
c
a
bc c
a
bb b
2
4
6
8
10
CFDI
FIMFIN
Days after anthesis (d)16 17 18 19
E(m
mol
(H2O
)mminus2
sminus1)
(b)
000
005
010
015
020
025
030
035
040
a
b
cc
a
b
cc
a
bc
c
a
b
c c
CFDI
FIMFIN
Days after anthesis (d)16 17 18 19
gs
(mol
(H2O
)mminus2
sminus1)
(c)
CFDI
FIMFIN
Days afer anthesis (d)16 17 18 19
0
50
100
150
200
250
300
350
400
450
ab aab
b
aabb
c
aab
b
c
aab
b
c
Ci
(120583m
ol (C
O2)m
olminus1)
(d)
Figure 5 The 119875119873(a) 119864 (b) 119892
119904(c) and 119862
119894(d) of cultivar Ninggeng28 (Oryza sativa L)under different treatments from the 16th day after
anthesis to the 19th day after anthesis in Shihezi The CF indicates conventional flooding and the DI FIM and FIN are plastic filmmulchingwith drip irrigation plastic filmmulching with furrow irrigation and nomulching with furrow irrigation respectively Vertical bars representSE of themean the SEwas calculated across five replicates for each year and averaged for the 2 years Values of eachmeasurement date followedby the same letter indicate no significant differences (119875 lt 005) according to least-significant-difference test
10 The Scientific World Journal
35 Analysis of Chlorophyll Fluorescence Thevalues of119865V119865119898119865V1015840119865119898
1015840 119902119901 andΦPSII in the nonflooded irrigation treatments
were significantly lower than their respective values in the CFtreatment from the 16th day after anthesis to the 19th day afteranthesis (119875 lt 005 Figures 6(a) 6(c) 6(e) and 6(f)) Duringthe four days both NPQ and Fo values in the nonfloodedirrigation treatments were significantly higher than in the CFtreatment (119875 lt 005 Figures 6(b) and 6(d)) For the CFtreatment all fluorescence parameters were relatively stableHowever for the nonflooded irrigation treatments values ofthe 119865V119865119898 119865V
1015840119865119898
1015840 119902119901 and ΦPSII decreased with decreasing
soil water potential until the 18th day after anthesis and thencompletely recovered after supplementary irrigation on the19th day after anthesis in the DI and FIM treatments Theseresults were supported by two-tailed 119905-test which showedno significant differences between the 16th day after anthesisand the 19th day after anthesis in the DI and FIM treatments(119875 gt 005 in the FIM and DI treatments 119875 lt 005 in the FINtreatment Data of analysis-of-variance not present) Undernonflooded irrigation 119865V119865119898 119865V
1015840119865119898
1015840 119902119901 and ΦPSII were
always significantly higher in the DI treatment than in theFIM and FIN treatments during data observation period (119875 lt005 Figure 6) The 119865
119900and NPQ values were significantly
higher under the nonflooded irrigation treatments thanunder the CF treatment and gradually increased as thewater potential decreased until the 18th day after anthesisThen both 119865
119900and NPQ values substantially decreased on the
19th day after anthesis because of supplementary irrigation(Figures 6(b) and 6(d))
4 Discussion
Dry matter accumulation is a critical factor in grain yieldformation The aboveground biomass before anthesis maycontribute 20ndash40 to the final crop yield [30] and the restof the matter that contributed to grain yield is derived fromphotosynthesis during the grain-filling stage [8 9] In ourstudy there were no significant differences in the DMPrAamong treatments However the matter translocation in theFIM and FIN treatments was significantly lower than thatin the CF and DI treatments (119875 lt 005 Table 3) The lowtranslocation efficiency may have been insufficient to achievea high grain yield in the FIM and FIN treatments [9] Forthe DI treatment the matter translocation was only slightlyreduced compared with the CF treatmentTherefore we inferthat the decreased grain yield could mainly depend on thephotosynthetic capacity during the grain-filling stage in theDI treatment (Figure 5(a)) and also be related to the drymatter translocation efficiency at the preanthesis stage in theFIM and FIN treatments (Figure 5(a) Table 3)
Moreover a significantly higher population structure(LAImax) was observed in nonflooded irrigation treatmentsthan in the CF treatment (119875 lt 005 Table 3) We canspeculate that the high LAImax negatively affected biomassaccumulation and yield formation under nonflooded irri-gation There are two main reasons for this speculationfirst a considerable proportion of the crop was invalidtillers (nonproductive tillers) especially in the FIM and FINtreatments (data not shown) The accumulated assimilates
are rarely transferred from invalid tillers to effective paniclesand this large proportion of redundant matter and energyis greatly wasted in poorly performing tillers Thus grainyield formation could be limited by inadequate materialsupply [31] Second the consumption of photosynthatewouldincrease because the respiration rate of C
3plants increases
almost proportionally to the increase in LAI [32] Finallycrop failure could also be relevant to the poor populationstructure
The 119875119873
in the FIN treatment was significantly lowerthan that in the CF treatment This result was supported byprevious studies [7] Plants in the treatments with plasticmulch (DI and FIM treatments) showed lower 119875
119873than those
in the CF treatment which differs from the result found byZhang et al [7] In the nonflooded irrigation treatments Chl(119886 + 119887) showed significant declines compared with the CFtreatment (119875 lt 005 Figure 4)Thus low119875
119873in graminaceous
crops such as maize (Zea mays L) and rice (Oryza sativaL) is apparently associated with lower levels of quantity ofpigments [33 34]
Nitrogen plays an important role during photosynthesissince the proteins of the Calvin cycle and thylakoids representthe majority of leaf nitrogen Photosynthesis of rice leavessignificantly increases with increasing nitrogen content ofleaves [35 36] Mae [36] showed that the maximum rate ofCO2assimilation per unit leaf area (measured under light-
saturated ambient air condition) was almost proportional tothe NLA Therefore the photosynthetic capacity of leaves isclosely related to the nitrogen content [37] In our studiesthe TNC and NLA in the CF treatment were significantlyhigher than that in the nonflooded irrigation treatments (119875 lt005 Table 3) The results suggest that the underlying reasonwhich limited photosynthetic capacity was mainly the lowernitrogen content in the nonflooded irrigation treatmentscompared with that in the CF treatment Although the badperformance of the root activity could be one of the importantreasons that restricted the absorption of nitrogen [38] it isstill very necessary to conduct the future experiment to findout the scientific sound reason for the low nitrogen contentin the nonflooded irrigation
Jones [39] suggested that the values of 119862119894and 119875
119873can
be a useful criterion to determine whether photosynthesisis limited by stomatal closure or metabolic impairmentCompared with normal (control) treatment a decrease in119875119873alongside a decrease in 119862
119894indicates stomatal limitation
of photosynthesis whereas if the 119875119873
decreases while 119862119894
increases then nonstomatal limitation (metabolic impair-ment) of photosynthesis is predominant [40] Under thenonflooded irrigation treatments the 119862
119894was also higher
than in the CF treatment during the data acquisition period(Figure 5(d)) but their 119875
119873values were significantly lower
than those in the CF treatment (119875 lt 005 Figure 5(a)) Inaddition the 119892
119904values ranged from 012 to 023molmminus2 sminus1
under the nonflooded irrigation treatments which wassignificantly lower than in the CF treatment (119875 lt 005Figure 5(c)) The low 119892
119904would probably decrease the levels
of ribulouse bisphosphate impair ATP synthesis and eveninhibit Rubico activity [40] which together would inhibit119875
119873
The Scientific World Journal 11
00
02
04
06
08
10FvFm
ab b b
ab
cd
a
b
c
d
ab b
d
Days after anthesis (d)16 17 18 19
(a)
a a a ab b
aa
a
d
c
b
b b b a
01
00
02
03
04
05
06
07
08
Days after anthesis (d)16 17 18 19
Fo
(b)
00
02
04
06
08 ab
bcc
ab
cd
a
b
c c
ab
c
d
Days after anthesis (d)16 17 18 19
Fv998400 F
m998400
(c)
a
bb
a ab b
aa
dc
b
a
b ba
a
05
00
10
15
20
25
30
35
NPQ
Days after anthesis (d)16 17 18 19
(d)
00
01
02
03
04
05
06
07
08
Days after anthesis (d)
a
b
c
d
a
b
cd
a
b
c
d
a
b
c
d
CFDI
FIMFIN
16 17 18 19
ΦPS
II
(e)
a
bc
d
a
b
c
d
a
b
c
d
a
b
c
c
Days after anthesis (d)
CFDI
FIMFIN
16 17 18 1900
02
04
06
08
10
qp
(f)
Figure 6The 119865V119865119898 (a) Fo (b) 119865V1015840119865119898
1015840 (c) NPQ (d)ΦPSII (e) and 119902119901 (f) of cultivar Ninggeng28 (Oryza sativa L) under different treatmentsfrom the 16th day after anthesis to the 19th day after anthesis in ShiheziThe CF indicates conventional flooding and the DI FIM and FIN areplastic filmmulching with drip irrigation plastic filmmulching with furrow irrigation and no mulching with furrow irrigation respectivelyVertical bars represent SE of the mean the SE was calculated across five replicates for each year and averaged for the 2 years Values of eachmeasurement date followed by the same letter indicate no significant differences (119875 lt 005) according to least-significant-difference test
12 The Scientific World Journal
Under the nonflooded irrigation treatments both 119875119873and
119892119904declined with soil water potential decrease The 119875
119873and 119892
119904
almost completely recovered after supplementary irrigationin the plastic mulching treatments (DI and FIM treatments)but not in the FIN treatment (Figures 5(a) and 5(c)) Thisindicated that photoinhibition might not be permanent inthe DI and FIM treatments that is it could recover duringthe grain-filling stage if the soil water potential remainedbetween 0 and minus30KPa during the entire growth periodMoreover the values of 119875
119873 119892119904 and 119864 were higher under
the DI treatment than under the FIM and FIN treatments(Figures 5(a) 5(c) and 5(d)) The results show that theDI treatment can significantly improve rice photosyntheticperformance under nonflooded irrigation
The use of chlorophyll fluorescence to monitor pho-tosynthetic performance in plants is now widespread Chl119886 fluorescence is a very sensitive tool to study the stress-induced damage to photosystem 2 (PSII) [41] The 119865V119865119898value is frequently used as an indicator of stresses caused toPSII [18 42] Under the nonflooded irrigation treatmentsthe 119865V119865119898 values were significantly lower than that in theCF treatment which its value was 081ndash083 during dataacquisition period and fell sharply as the soil water potentialreduced from the 16th day after anthesis to the 18th dayafter anthesis (Figure 6(a)) This result indicated that therice crop could be subject to water stress during grain-filling stage Also increasing of 119865
119900value is usually considered
as an important parameter to estimate photoinhibition inmany plants [19 43] Our results showed that the 119865
119900sharply
increased when soil water potential dropped to minus15 KPain the FIN treatment minus20KPa in the FIM treatment andminus3650KPa in the DI treatment compared with that in theCF treatment and then recovered when soil water potentialreturned to minus450KPa after supplementary irrigation for theDI and FIM treatments (Figure 6(b))These results imply thatnonflooded irrigation cultivation could cause rice to sufferfrom photoinhibition when the soil water potential rangesfrom minus15 KPa to minus3650KPa The plants in the DI treatmentwere more tolerant to nonflooded irrigation cultivationpractices and showed higher photosynthetic efficiency thanthat in FIM and FIN treatments
The ΦPSII reflects the efficiency of excitation energy cap-tured by open reaction centers of PSII Two factors contributetoΦPSII [27] one being the fraction of PSII centers in the openstate 119876
119860(primary quinone acceptor of PSII) for which the
quantitative value is equivalent to 119902119901[18] and the other being
119865V1015840119865119898
1015840 [27] Our studies suggested that the decreases inΦPSIIunder nonflooded irrigationwere caused by a combination oftwo processes (Figures 6(c) 6(e) and 6(f)) Previous studiesindicated that a decrease in 119902
119901could lead to an increase in
the levels of toxic singlet oxygen form [44 45] Unfortunatelywe did not quantify reactive oxygen species (ROS) in thepresent study Further research is required to determinewhether ROS are produced under nonflooded conditionsand to examine their scavenging mechanisms In additionthe decrease in 119865V
1015840119865119898
1015840 is considered to reflect a proactiveand photoprotective thermal dissipation process in whichexcess excitation energy is depleted before it reaches the
PSII centers [45] Figure 6 shows that the 119865V1015840119865119898
1015840 values sig-nificantly decreased under nonflooded irrigation treatmentsand greatly decreased as the soil water potential decreasedThese results indicated that thermal dissipation processeswere enhanced before excess energy reached the PSII centersunder nonflooded irrigation especially when the soil waterpotential was low and in the FIN treatment In brief undernonflooded irrigation treatments total thermal dissipationincluding depletion of heat by NPQ (Figure 6(d)) and bythe processes reflected by the 119865V
1015840119865119898
1015840 value (Figure 6(c))pathways was significantly higher than that under the CFtreatment during the whole observation period These path-ways could be important photoprotective mechanisms in riceplants cultivated under nonflooded irrigation conditions
5 Conclusions
Under nonflooded treatments photosynthetic capacity andgrain-yield of rice plants were significantly decrease com-pared with the CF treatment Nonphotochemical quenching(NPQ) played an important role in protecting photosyn-thetic apparatus in flag leaf of rice plants against damageby nonflooded environments To improve photosyntheticproductivity in nonflooded irrigation it could be necessaryto promote nitrogen content in flag leaf Also the reasons inregulating nitrogen metabolism in flag leaf are not clear innonflooded irrigation and it need to do follow-up studies tofind out scientific mechanisms
Abbreviations
llCF Conventional floodingChl Chlorophyll119862119894 Intercellular CO
2concentration
DI Drip irrigation with plastic mulchingDMPA Dry matter postanthesisDMPrA Dry matter preanthesis119864 Transpiration rateFIM Furrow irrigation with plastic mulchingFIN Furrow irrigation with no mulching119865119898 Maximal fluorescence yield of
dark-adapted state119865119898
1015840 Maximal fluorescence yield oflight-adapted state
119865119900 Minimum fluorescence yield of
dark-adapted state119865119900
1015840 Minimal fluorescence yield oflight-adapted state
119865119904 Steady-state fluorescence yield119865V119865119898 Maximal quantum yield of PSII
photochemistry119865V1015840119865119898
1015840 PSII maximum efficiencyFW Fresh weight119892119904 Stomatal conductance
LAImax Leaf area index at flowering stageNLA Nitrogen content per leaf areaNPQ Non-photochemical quenching119875119873 Net photosynthetic rate
The Scientific World Journal 13
119902119875 Photochemical quenching coefficientΦPSII Effective quantum yield of PSII
photochemistrySE Standard errorTNC Total nitrogen contentTTC Triphenyltetrazolium chloride
Conflict of Interests
The authors declare that there is no conflict of interestsregarding the publication of this paper
Acknowledgments
The authors thank the Agricultural Drought Research Insti-tute of TianYe Group Company for providing the experimen-tal site They are grateful for Grants fromThe National HighTechnology Research and Development Program of China(2011AA100508)
References
[1] G S Khush ldquoOrigin dispersal cultivation and variation ofricerdquo in Oryza From Molecule to Plant pp 25ndash34 SpringerAmsterdam The Netherlands 1997
[2] Y B Wang P T Wu X N Zhao and J L Li ldquoDevelopmenttendency of agricultural water structure in Chinardquo ChineseJournal of Eco-Agriculture vol 18 no 2 pp 399ndash404 2010
[3] B A M Bouman and T P Tuong ldquoField water managementto save water and increase its productivity in irrigated lowlandricerdquo Agricultural Water Management vol 49 no 1 pp 11ndash302001
[4] P Belder B AM Bouman R Cabangon et al ldquoEffect of water-saving irrigation on rice yield and water use in typical lowlandconditions in AsiardquoAgriculturalWaterManagement vol 65 no3 pp 193ndash210 2004
[5] S Peng B Bouman R M Visperas A Castaneda L Nieand H-K Park ldquoComparison between aerobic and floodedrice in the tropics agronomic performance in an eight-seasonexperimentrdquo Field Crops Research vol 96 no 2-3 pp 252ndash2592006
[6] H Tao H Brueck K Dittert C Kreye S Lin and B Sat-telmacher ldquoGrowth and yield formation of rice (Oryza sativaL) in the water-saving ground cover rice production system(GCRPS)rdquo Field Crops Research vol 95 no 1 pp 1ndash12 2006
[7] Z Zhang S Zhang J Yang and J Zhang ldquoYield grain qualityand water use efficiency of rice under non-flooded mulchingcultivationrdquo Field Crops Research vol 108 no 1 pp 71ndash81 2008
[8] D K Papakosta and A A Gagianas ldquoNitrogen and dry matteraccumulation remobilization and losses for Mediterraneanwheat during grain fillingrdquo Agronomy Journal vol 83 no 5 pp864ndash870 1991
[9] L Zhang S Lin B A M Bouman et al ldquoResponse of aerobicrice growth and grain yield toN fertilizer at two contrasting sitesnear Beijing Chinardquo Field Crops Research vol 114 no 1 pp 45ndash53 2009
[10] M J Baig A Anand P K Mandal and R K Bhatt ldquoIrradianceinfluences contents of photosynthetic pigments and proteins intropical grasses and legumesrdquo Photosynthetica vol 43 no 1 pp47ndash53 2005
[11] Q H Ling Crop Population Quality Shanghai Science andTechnology Press Shanghai China 2000
[12] J Yang J Zhang Z Wang Q Zhu andWWang ldquoRemobiliza-tion of carbon reserves in response to water deficit during grainfilling of ricerdquo Field Crops Research vol 71 no 1 pp 47ndash55 2001
[13] X H Chen G W Xu H S Sun Z Q Wang and J C YangldquoEffects of soil moisture and nitrogen nutrition during grainfilling on the grain yield and quality of ricerdquo Journal of YangzhouUniversity vol 24 no 1 pp 37ndash41 2003
[14] J G Zheng G J Ren X J Lu and X L Jiang ldquoEffects ofwater stress on rice grain yield and quality after heading stagerdquoChinese Journal of Rice Science vol 17 no 3 pp 239ndash243 2003
[15] C YWang B LWang andWX Zhang ldquoEffects of water stressof soil on rice yield and qualityrdquoActa Agronomica Sinica vol 23no 1 pp 131ndash137 2006
[16] K Liu H Zhang S F Zhang Z Q Wang and J C YangldquoEffects of soil moisture and irrigation patterns during grainfilling on grain yield and quality of rice and their physiologicalmechanismrdquo Acta Agronomica Sinica vol 34 no 2 pp 268ndash276 2008
[17] K Maxwell and G N Johnson ldquoChlorophyll fluorescencemdashapractical guiderdquo Journal of Experimental Botany vol 51 no 345pp 659ndash668 2000
[18] N R Baker ldquoChlorophyll fluorescence a probe of photosynthe-sis in vivordquo Annual Review of Plant Biology vol 59 pp 89ndash1132008
[19] F Valladares and R W Pearcy ldquoInteractions between waterstress sun-shade acclimation heat tolerance and photoinhibi-tion in the sclerophyll Heteromeles arbutifoliardquo Plant Cell ampEnvironment vol 20 no 1 pp 25ndash36 1997
[20] N I Elsheery and K F Cao ldquoGas exchange chlorophyllfluorescence and osmotic adjustment in two mango cultivarsunder drought stressrdquo Acta Physiologiae Plantarum vol 30 no6 pp 769ndash777 2008
[21] G L Wang and Z F Guo ldquoEffects of chilling stress onphotosynthetic rate and chlorophyll fluorescence parameter inseedlings of two rice cultivars differing in cold tolerancerdquo RiceScience vol 12 no 3 pp 187ndash191 2005
[22] C C Xu Y A Jeon and C H Lee ldquoRelative contributionsof photochemical and non-photochemical routes to excitationenergy dissipation in rice and barley illuminated at a chillingtemperaturerdquo Physiologia Plantarum vol 107 no 4 pp 447ndash453 1999
[23] R J Porra ldquoThe chequered history of the development and useof simultaneous equations for the accurate determination ofchlorophylls a and brdquo in Discoveries in Photosynthesis pp 633ndash640 Springer Amsterdam The Netherlands 2005
[24] G E Schuman M A Stanley and D Knudsen ldquoAutomatedtotal nitrogen analysis of soil and plant samplesrdquo Soil ScienceSociety of America Journal vol 37 no 3 pp 480ndash481 1973
[25] P L Steponkus and FO Lanphear ldquoRefinement of the triphenyltetrazolium chloride method of determining cold injuryrdquo PlantPhysiology vol 42 no 10 pp 1423ndash1426 1967
[26] K Oxborough and N R Baker ldquoResolving chlorophyll a fluo-rescence images of photosynthetic efficiency into photochemi-cal and non-photochemical componentsmdashcalculation of q
119875and
Fv1015840Fm1015840 without measuring Fo1015840rdquo Photosynthesis Research vol54 no 2 pp 135ndash142 1997
[27] B Genty J M Briantais and N R Baker ldquoThe relationshipbetween the quantumyield of photosynthetic electron transportand quenching of chlorophyll fluorescencerdquo Biochimica EtBiophysica Acta vol 990 no 1 pp 87ndash92 1989
14 The Scientific World Journal
[28] W Bilger and O Bjorkman ldquoRole of the xanthophyll cycle inphotoprotection elucidated by measurements of light-inducedabsorbance changes fluorescence and photosynthesis in leavesof Hedera canariensisrdquo Photosynthesis Research vol 25 no 3pp 173ndash185 1990
[29] U Schreiber U Schliwa and W Bilger ldquoContinuous recordingof photochemical and non-photochemical chlorophyll fluores-cence quenching with a new type of modulation fluorometerrdquoPhotosynthesis Research vol 10 no 1-2 pp 51ndash62 1986
[30] S Yoshida ldquoPhysiological aspects of grain yieldrdquoAnnual Reviewof Plant Physiology vol 23 no 1 pp 437ndash464 1972
[31] P Y Jiang X F Hong Z F Xu and Z R Ni ldquoComparison ofcarbon nutrition between effective tillers and ineffective tillersin ricerdquoChinese Journal of Rice Science vol 13 no 4 pp 211ndash2161999
[32] T Takeda ldquoStudies on the photosynthesis and production ofdry matter in the community of rice plantsrdquo Japanese Journalof Botany vol 17 pp 403ndash437 1961
[33] H Hichem D Mounir and E A Naceur ldquoDifferentialresponses of two maize (Zea mays L) varieties to salt stresschanges on polyphenols composition of foliage and oxidativedamagesrdquo Industrial Crops and Products vol 30 no 1 pp 144ndash151 2009
[34] C Suriyan S W Kanyaratt and K Chalermpol ldquoCompar-ative effects of salt stress and extreme pH stress combinedon glycinebetaine accumulation photosynthetic abilities andgrowth characters of two rice genotypesrdquo Rice Science vol 16no 4 pp 274ndash282 2009
[35] K Z Xu ldquoThe dynamic changes of nitrogen content andphotosynthesis and their correlations in pot rice leaves afteranthesisrdquo Acta Agronomica Sinica vol 21 no 2 pp 171ndash1751995
[36] T Mae ldquoPhysiological nitrogen efficiency in rice nitrogen uti-lization photosynthesis and yield potentialrdquo in Plant NutritionFor Sustainable Food Production and Environment pp 51ndash60Springer Amsterdam The Netherlands 1997
[37] J R Evans ldquoPhotosynthesis and nitrogen relationships in leavesof C3plantsrdquo Oecologia vol 78 no 1 pp 9ndash19 1989
[38] MOsaki andT Shinano ldquoInfluence of carbon-nitrogen balanceon productivity of C
3plants and effect of high expression of
phosphoenolpyruvate carboxylase in transgenic ricerdquo Studies inPlant Science vol 7 no C pp 177ndash192 2000
[39] H G Jones ldquoPartitioning stomatal and non-stomatal limita-tions to photosynthesisrdquo Plant Cell amp Environment vol 8 no2 pp 95ndash104 2005
[40] J Flexas and H Medrano ldquoDrought-inhibition of photosyn-thesis in C
3plants stomatal and non-stomatal limitations
revisitedrdquo Annals of Botany vol 89 no 2 pp 183ndash189 2002[41] M C Drew ldquoOxygen deficiency and root metabolism injury
and acclimation under hypoxia and anoxiardquo Annual Review ofPlant Biology vol 48 pp 223ndash250 1997
[42] A Calatayud and E Barreno ldquoResponse to ozone in twolettuce varieties on chlorophyll a fluorescence photosyntheticpigments and lipid peroxidationrdquo Plant Physiology and Bio-chemistry vol 42 no 6 pp 549ndash555 2004
[43] D Epron E Dreyer and N Breda ldquoPhotosynthesis of oaktrees [Quercus petraea (Matt) Liebl] during drought underfield conditions diurnal course of net CO
2assimilation and
photochemical efficiency of photosystem IIrdquo Plant Cell ampEnvironment vol 15 no 7 pp 809ndash820 1992
[44] K Asada and M Takahashi ldquoProduction and scavenging ofactive oxygen in photosynthesisrdquo Photoinhibition vol 9 pp227ndash287 1987
[45] B Demmig-Adams W W Adams III D H Barker B ALogan D R Bowling and A S Verhoeven ldquoUsing chlorophyllfluorescence to assess the fraction of absorbed light allocated tothermal dissipation of excess excitationrdquoPhysiologia Plantarumvol 98 no 2 pp 253ndash264 1996
Submit your manuscripts athttpwwwhindawicom
Nutrition and Metabolism
Journal of
Hindawi Publishing Corporationhttpwwwhindawicom Volume 2014
Hindawi Publishing Corporationhttpwwwhindawicom Volume 2014
Food ScienceInternational Journal of
Agronomy
Hindawi Publishing Corporationhttpwwwhindawicom Volume 2014
International Journal of
Hindawi Publishing Corporationhttpwwwhindawicom Volume 2014
International Journal of
Microbiology
The Scientific World JournalHindawi Publishing Corporation httpwwwhindawicom Volume 2014
Hindawi Publishing Corporationhttpwwwhindawicom
Applied ampEnvironmentalSoil Science
Volume 2014
AgricultureAdvances in
Hindawi Publishing Corporationhttpwwwhindawicom Volume 2014
PsycheHindawi Publishing Corporationhttpwwwhindawicom Volume 2014
BiodiversityInternational Journal of
Hindawi Publishing Corporationhttpwwwhindawicom Volume 2014
ScientificaHindawi Publishing Corporationhttpwwwhindawicom Volume 2014
GenomicsInternational Journal of
Hindawi Publishing Corporationhttpwwwhindawicom Volume 2014
Plant GenomicsInternational Journal of
Hindawi Publishing Corporationhttpwwwhindawicom Volume 2014
Biotechnology Research International
Hindawi Publishing Corporationhttpwwwhindawicom Volume 2014
Forestry ResearchInternational Journal of
Hindawi Publishing Corporationhttpwwwhindawicom Volume 2014
Journal of BotanyHindawi Publishing Corporationhttpwwwhindawicom Volume 2014
EcologyInternational Journal of
Hindawi Publishing Corporationhttpwwwhindawicom Volume 2014
Veterinary Medicine International
Hindawi Publishing Corporationhttpwwwhindawicom Volume 2014
Cell BiologyInternational Journal of
Hindawi Publishing Corporationhttpwwwhindawicom Volume 2014
Evolutionary BiologyInternational Journal of
Hindawi Publishing Corporationhttpwwwhindawicom Volume 2014
2 The Scientific World Journal
mechanisms of rice in nonflooded condition have generallyapplied only short-term water regulation of water supply forexample growing rice under nonflooded cultivation duringthe grain-filling stage while applying flooding conditionsduring other stages of growth [12 13 16] There have beenrelatively few studies on the photosynthesis of rice flag leavesduring the grain-filling stage that have used plants grownunder nonflooded cultivation for the whole growth periodIt is very interesting to know photosynthetic characteristicsand photosynthetic production capacity during the grain-filling stage under long-term nonflooded cultivation Suchresearch will also contribute to an understanding of the ricegrain yield production potential under long-termnonfloodedcultivation
Light energy is a driving factor of photosynthesis Lightenergy absorbed by chlorophyll molecules in a leaf can be lostfromphotosynthesis (photochemistry) heat loss and chloro-phyll fluorescence [17] The processes of photochemistrychlorophyll fluorescence and heat loss directly compete forexcitation energy [18] Therefore chlorophyll fluorescenceespecially for the PSII system can be a very powerful toolto study photosynthetic performance the degree of waterstress or photoinhibition and photoprotective mechanisms[17ndash19] Under abiotic stress the photosynthetic rate is signif-icantly reduced [12] and the requirement for photosyntheticelectrons also decreases so that surplus radiant energy mustbe degraded in alternative ways [20] To alleviate or avoiddamaging the plantrsquos photosynthetic apparatus excessiveenergy can be dissipated by heat emission (nonphotochem-ical quenching) this mechanism protects the photosyntheticapparatus and helps to resist photoinhibition [21] Photoin-hibition occurs when there is a large surplus of radiantenergy andor nonphotochemical quenching is insufficientto dissipate excess energy [22] To date there has been littlesystematic research on the photosynthetic attributes (lightenergy absorption proportion of energy distributed to thephotosynthetic apparatus photoprotection and adaptationmechanisms) of rice grown under long-term nonfloodedirrigation
In rice photosynthesis is affected by nonflooded cultiva-tion conditions The photosynthetic capacity is significantlyimproved in the mulching cultivation than in the bare landcultivation [7] It is likely that different nonflooded cultiva-tion methods will affect photosynthetic performance photo-protection and adaptation mechanisms ultimately affectingyield Therefore in this study we cultivated rice usingthree different nonflooded cultivation methods and analyzedvarious photosynthetic parameters The objectives of thisstudy are (1) to characterize photosynthesis photoprotectionand adaptation mechanism of flag leaves during grain-fillingunder long-term nonflooded irrigation management and (2)to evaluate the photosynthetic production potential underdifferent cultivation conditions
2 Materials and Methods
21 PlantMaterial and ExperimentDesign Field experimentsusing the rice (Oryza sativaL) cultivarNinggeng28were con-ducted in 2011 and 2012 at the Agricultural Drought Research
Table 1 Soil characteristics of the field experiments conducted inShihezi in 2011 and 2012 Values are the mean plusmn standard error(SE) the SE was calculated across five replicates in both years andaveraged for the nonflooded irrigation and conventional floodingsites
Parameter 2011 2012Clay () 23 plusmn 332 19 plusmn 098
Silt () 38 plusmn 231 34 plusmn 143
Sand () 43 plusmn 319 41 plusmn 226
pH 751 plusmn 032 772 plusmn 018
Olsen-P (mg kgminus1) 2846 plusmn 424 2213 plusmn 133
Organic matter(mg kgminus1) 2546 plusmn 095 2635 plusmn 111
Alkaline-N (mg kgminus1) 6083 plusmn 249 5872 plusmn 165
Available potassium(mg kgminus1) 34254 plusmn 5413 31342 plusmn 3217
Soil saturation volumemoisture content () 3011 plusmn 012 3257 plusmn 025
Institute of the TianYeGroup Company (44∘2651015840N 86∘011015840E)Xinjiang Province ChinaThe average temperature evapora-tion and precipitation of the experimental sites were 2114ndash2241∘C 82530ndash85140mm and 10810ndash12001mm respec-tively during the rice growing season (May to October)in both years (Figures 1(a) 1(b) and 1(c)) The value ofphotosynthetically active radiation during experimental time(1030ndash1230) was 1000ndash1250 120583mol photon mminus2 sminus1 in bothyears The soil properties of the experimental sites weresimilar and its chemical and physical properties listed inTable 1
The nonflooded irrigation treatments (DI FIM and FINtreatments) were sown by artificial hand dibbling at a depthof 3 cm on April 18 in 2011 and April 23 in 2012 and thenirrigated at a rate of 450m3 haminus1 on the next day after sowingto ensure normal germination because of the dry direct-seeded system used in this study No further irrigation wassupplied until the third leaf emerged The three nonfloodedirrigation treatments were arranged in a completely random-ized design with three replicates (Figure 2(a)) The size ofeach plot was 55m times 10m Waterproof membranes wereburied to a depth of 60 cm below the soil surface betweenadjacent plots in the nonflooded irrigation treatments toprevent water exchange All plots were covered by plasticfilm before sowing Two drip tapes (emitter discharge rate320 L hminus1 emitter spacing 030m) were laid under theplastic film for the DI treatment Flexible hoses with a 2 cmdiameter were located on both sides of the plastic film tosupply water in the FIM and FIN treatments (Figure 2(a))In the FIM and FIN treatments 20 cm high dams wereconstructed and covered with plastic film to minimize watersurface runoff Holes were opened on the membrane surfacewhen the rice was sown The planting density was 4571hills mminus2 with a 10ndash30-10ndash30-10ndash30-10ndash45 cm row-spacingconfiguration The plant spacing within the hills was 10 cm(Figure 2) The planting density were mainly based on theresults of a preliminary study about directly seeded rice
The Scientific World Journal 3
Tem
pera
ture
(∘C)
30
25
20
15
10
5
May June July Aug Sept OctMonth
2011
2012
(a)
Evap
orat
ion
(mm
)
250
200
150
100
50
May June July Aug Sept OctMonth
2011
2012
(b)
Prec
ipita
tion
(mm
)
35
30
25
20
15
10
5
0May June July Aug Sept Oct
Month
2011
2012
(c)
Figure 1 Average temperature (a) evaporation (b) and precipitation (c) during the rice growing period in Shihezi in 2011 and 2012 Eachdatum point represents the mean of a month
under drip irrigation with full mechanization in recent yearsBasic seedling numbers per hill were six plants in bothyears The water regimes were applied from the 3-leaf stageto maturity Forty to sixty millimeter of water was appliedwhen the soil water potential in the 0ndash20 cm soil layer of thenarrow rows (Figure 2(b)) dropped to minus30KPa as monitoredby tensiometer (Watermark Irrometer Company RiversideCA)This soil water potential thresholdwas established basedon the results of a preliminary field investigation in 2010Thesoil water potential at the 20 cm depth occasionally droppedto minus40KPa during the rice growing period To create thebare-soil treatment (ie the FIN treatment) the plastic filmswere removed at the 3-leaf stageThe hydrological conditionsduring the data acquisition period are shown in Figure 3
When the threshold values for supplementary irrigationwere reached supplementary irrigation was immediatelyapplied In particular plants grown in nonflooded irrigationtreatments were irrigated after acquiring gas exchange andchlorophyll fluorescence parameters during the data acqui-sition period The CF cultivation treatment was set as CKthe planting density of the CF treatment was 40 hillsmminus2(10 cm times 25 cm) with five plants per hill The seeds weresown on the nursery trays on the same day when thenonflooded irrigations were sown and then twenty-one-day-old seedlings from the nursery trays were transplanted Awater depth of 5ndash10 cm was continuously maintained in theCF treatment from transplanting to maturity The sites of theCF treatment were about 150m away from the nonflooded
4 The Scientific World Journal
Rice row
Apply fertilizer apparatusPlots of different irrigation modelswith a cultivar
Main irrigation lineDrip tapes
Flexible hose Branch irrigation line Combination of valve and flow meter
DI DI
DI
FIM FIMFIN
FIMFINFIN
Plot with 54m2
(a)
Rice hill
Drip tapes
Watermark (instrument of monitoring soil water potential)
Plastic film
Narrow row spacing (10 cm)Wide row spacing (30 cm)
Film width (160 cm)
Distance between the two films (45 cm)
(b)
Figure 2 Experiment layout (a) and sketch map of planting mode (b) under nonflooded irrigation treatments in Shihezi in both years
irrigation plots and the soil physicochemical property wasconsistent with nonflooding irrigation treatments in bothyears (the flooding treatmentwas set in three small pools builtin 2010 and the flooding plots were not previously traditionalpaddy the area of the each small pool was also the same withthe plot of nonflooding irrigation treatments)
Fertilizers applied were 270 kgN per hectare as urea100 kgK
2Oper hectare as potassium chloride 90 kg P
2O5per
hectare as calcium superphosphate and 30 kg zinc sulfate perhectare of which 10N all K
2O all P
2O5 and all Zn were
applied as basal fertilizer the rest of N was applied in foursplit applications 20 at the three leaf blades stage 35 attillering 35 at panicle initiation and 10 at flowering
22 Measurement of Dry Matter Preanthesis (DMPrA) DryMatter Postanthesis (DMPA) Leaf Area Index at Flowering(LAI119898119886119909
) Matter Translocation and Grain Yield TomeasureDMPrA DMPA and (LAImax) (green leaf area at flowering)050m2 plant samples were taken from each plot at theflowering period (August 2 in 2011 and August 4 in 2012)and the mature stage (September 13 in 2011 and September12 in 2012) in the two years The samples were separatedinto stem leaf and panicle when present The leaf areawas measured with a LI-3100 leaf area meter (LI-COR IncLincoln NEUSA) Then samples were dried in an oven at75∘C for 72 h and the weights of stem leaf and panicle weremeasuredThe drymatter at the flowering period was defined
The Scientific World Journal 5
Soil
wat
er p
oten
tial (
kPa)
DIFIMFIN
Days after anthesis (d)
2011
191817160
minus5
minus10
minus15
minus20
minus25
minus30
minus35
minus40
(a)
Days after anthesis (d)19181716
2012
Soil
wat
er p
oten
tial (
kPa)
0
minus5
minus10
minus15
minus20
minus25
minus30
minus35
minus40
DIFIMFIN
(b)
Figure 3 Soil water potential at 0ndash20 cm soil layer under nonflooded irrigation treatments from the 16th day after anthesis to the 19th dayafter anthesis in Shihezi in 2011 (a) and 2012 (b) Vertical bars represent SE of the mean the SE was calculated across three replicates for eachyear
as DMPrA DMPA was calculated as follows dry matterat maturitymdashdry matter at anthesis Matter translocation =dry weight of stems and sheaths at anthesismdashdry weightof stems and sheaths at maturity The parameter of mattertranslocation was measured because the stems and sheathsare considered as important energy storage organs and thematter translocation rate will affect grain yield formation[8 9] At maturity (September 15 2011 and September 142012) 8m2 plants in each plot were harvested to calculategrain yield Grain weight is expressed at 14 moisturecontent
23 Measurement of Chlorophyll Content Fresh flag leaftissue (01 g) was extracted in 10mL of 80 (vv) acetoneunder dark and sealed conditions for 48 h The absorbance(OD values) of the solution was measured with a 722Svisible spectrophotometer (Shanghai Third instrument Fac-tory Shanghai China) at 647 nm and 664 nm In case ofhighly elevated titers (optical density [OD] values gt 08) theextracted solution was further diluted in 80 (vv) acetoneto give OD values of between 01 and 08 The chlorophyllcontent was calculated as described by Porra [23] as followsChl 119886 (mg Lminus1) = [1225 times OD
664minus 255 times OD
647] times dilution
ratio Chl 119887 (mg Lminus1) = [2031 times OD647minus 491 times OD
664] times
dilution ratio Chl (119886 + 119887) (mg Lminus1) = [1776 times OD647
+ 734timesOD
664] times dilution ratio Chl ab = Chl aChl b Finally Chl
(mg gminus1 FW) = Chl (mg Lminus1) times 001 L01 g FW (fresh weight)
24 Measurement of Total Nitrogen Content (TNC) and Nitro-gen Content per Leaf Area (NLA) of Flag Leaves To measuretotal nitrogen content flag leaves were harvested on the 16thday after anthesis in 2012 The TNC of the dried tissueswas determined using the micro-Kjeldahl method [24] Theamount of nitrogen per leaf area (NLA) was calculated bydividing TNC by the specific leaf weight The specific leafweight of the flag leaf was defined as flag leaf weight per unitarea
25 Measurement of Root Activity The root activity wasdetermined on the 20th day after anthesis in 2012 using thetriphenyltetrazolium chloride (TTC) method [25] Fresh andyoung roots from the 0ndash20 cm soil layer (which containedapprox 85 of the root system data not presented) werewashed and cut at 2 cm from the root tips Then approx-imately 030 g fresh root tissue was placed into test tubewith 5mL of 040 (wv) TTC and 5mL phosphate buffer(006mol Lminus1 pH = 7) Tubes were incubated at 37∘C ina water bath for 3 h and then 2mL of 1mol Lminus1 sulfuricacid was added to each tube to stop the reaction The rootswere then picked out and ground in a pestle with 3-4mLof ethyl acetate and a little quartz sand The liquid phasewas removed into a test tube and the pestle was washed 2-3 times with a small volume of ethyl acetate The absorbance(OD values) of the extractants was recorded at 485 nm with a722S visible spectrophotometer (Shanghai Third instrumentFactory Shanghai China)
6 The Scientific World Journal
Table 2 Analysis-of-variance (119865-values) for chlorophyll (Chl) net photosynthetic rate (119875119873) stomatal conductance (119892
119904) intercellular CO2
concentration (119862119894) maximal quantum yield of PSII photochemistry (119865V119865119898) PSII maximum efficiency (119865V
1015840119865119898
1015840) effective quantum yield ofPSII photochemistry (ΦPSII) and nonphotochemical quenching (NPQ) betweenamong years and treatments
Source of variation df DMPA Yield Chl 119875119873
119892119904
119862119894119865V119865119898 119865V
1015840119865119898
1015840 ΦPSII NPQCultivation mode 3 42155lowastlowastlowast 35121lowastlowastlowast 16310lowastlowastlowast 14122lowastlowastlowast 1373lowastlowastlowast 2091lowastlowastlowast 45 72lowastlowastlowast 14324lowastlowastlowast 17831lowastlowastlowast 1643lowastlowastlowastYear 1 415ns 378ns 227ns 425ns 003ns 026ns 228ns 265ns 089ns 007nsC times Y 3 311ns 241ns 105ns 032ns 057ns 047ns 294ns 356lowast 117ns 008nslowastSignificance difference at 119875 lt 005lowastlowastlowastSignificance difference at 119875 lt 0001nsNonsignificant differences
26 Measurement of Net Photosynthetic Rate (119875119873) Stomatal
Conductance (119892119904) Intercellular CO
2Concentration (119862
119894) and
Transpiration Rate (119864) Five individual flag leaves in vivowere sampled and labeled for each plot to acquire gasexchange parameters and chl119886fluorescence across treatmentsand years Gas exchange parameters were measured with aphotosynthesis system (Li-6400 LI-COR Biosciences Lin-coln NE USA) at 1030ndash1230 h from the 16th day after anthe-sis to the 19th day after anthesis under 1200120583mol photonmminus2 sminus1 light intensity The light was provided by a redblueLED light source system in both years The gas exchangeparameters including 119875
119873(120583molmminus2 sminus1) 119892
119904(molmminus2 sminus1)
119862119894(120583molmolminus1) and 119864 (mmolmminus2 sminus1) were acquired The
atmospheric CO2concentration air temperature and relative
air humidity were 380ndash390 120583molmolminus1 26ndash28∘C and 6021ndash6510 respectively during the data acquisition period ofboth study years
27 Measurement of Chlorophyll Fluorescence Analysis Chl 119886fluorescence was synchronously measured with gas exchangeat 1030ndash1230 h by a portable saturation pulse fluorometer(PAM-2100 Walz GmbH Effeltrich Germany) equippedwith a 2030-B leaf clip holder which can monitor PARand leaf temperature simultaneously The leaves were con-tinuously illuminated at 1200120583molmminus2 sminus1 actinic light with5 minutes to measure the steady-state fluorescence yield(119865119904) then the maximal fluorescence level (119865
119898
1015840) in the light-adapted leaves were recorded after a 080-s saturating pulse(8000120583molmminus2 sminus1) Meanwhile maximal fluorescence yieldof dark-adapted state (119865
119898) and minimum fluorescence yield
of dark-adapted state (119865119900) were measured at predawn being
also with the labeled flag leaves (Note that leaf temperaturesmonitored by a 2030-B leaf clip holder were 196ndash218∘Cat this time across both years) 119865
119900was determined under
illumination with far-red light (lt1 120583molmminus2 sminus1) and thena 080-s saturating pulse (8000 120583molmminus2 sminus1) was suppliedto determine 119865
119898 The minimum fluorescence yield in light-
adapted state (1198651199001015840) was calculated as 119865
119900
1015840 = 119865119900[(119865V119865119898) +
(119865119900119865119898
1015840)] [26]The potential maximum efficiency of PSII wasestimated as 119865V119865119898 = (119865119898 minus 119865119900)119865119898 The PSII maximumefficiency was estimated as 119865V
1015840119865119898
1015840 = (119865119898
1015840 minus 119865119900
1015840)119865119898
1015840 [27]The actual PSII efficiency of PSII was estimated as ΦPSII =(119865119898
1015840 minus 119865119904)119865119898
1015840 [27] Nonphotochemical quenching wasestimated as NPQ = (119865
119898minus119865119898
1015840)119865119898
1015840 [28]The photochemicalquenching coefficient which also represents the fraction ofopen PSII reaction centers was estimated as 119902
119901= (119865119898
1015840 minus
119865119904)(119865119898
1015840 minus 119865119900
1015840) [29]
28 Statistical Analysis Data were analyzed using the gener-alized linear model (GLM) procedure (SPSS160 SPSS IncChicago USA) The effects of the various factors includedcultivation mode year and interactions of cultivation modetimes year were assessed by analysis of variance Means werecompared by Fisherrsquos least-significant-difference test at the5 probability level Also two-tailed 119905-test was used tocompare with the difference of gas exchange and chlorophyllfluorescence parameters gas exchange and between 16th dayafter anthesis and 19th day after anthesis
3 Results
31 Analysis-of-Variance of Treatments As shown in Table 2the DMPA grain yield Chl 119875
119873 119892119904 119862119894 119865V119865119898 119865V
1015840119865119898
1015840ΦPSIIand NPQ were affected significantly by the different cultiva-tion modes (119875 lt 0001) However there were no significantdifferences between the two years for all parameters (119864 119902
119875
and DMPrA not present) There was a significant interactioneffect between the cultivationmode and year for119865V
1015840119865119898
1015840 (119875 lt005) but not for any of the other parametersTherefore datafrom two study years were averaged for further analyses
32 DMPrA DMPA LAI119898119886119909
Matter Translocation andGrainYield In plants grown under nonflooded irrigation theDMPrA was slightly higher and the DMPA was significantlylower than that of plants in the CF treatment (119875 lt 005Table 3) The DI treatment had the highest leaf area indexat flowering stage followed by the FIM treatment the FINtreatment and then the CF treatment (Table 3) The mattertranslocation was in the order of CF gt DI gt FIM gt FINtreatments (Table 3) As Table 3 showed the grain yield wasabout 8500 kg haminus1 in the CF treatment and ranged from2100 kg haminus1 to 5800 kg haminus1 in the nonflooded irrigationtreatments The grain yield was significantly higher in the DItreatment than in the FIM and FIN treatments (119875 lt 005Table 3)
33 Changes in Chlorophyll Content Root Activity TNC andNLA The Chl (119886 + 119887) and Chl 119886119887 values determined onthe 4 days of measurement (from the 16th day after anthesisto the 19th day after anthesis) were averaged for the sametreatment because no significant differences were observedamong the different days of the data acquisition period (dataof analysis-of-variance not present) The results showed thatthe Chl (119886 + 119887) concentration in the CF treatment (control)
The Scientific World Journal 7
Table3Th
edrymatterp
reanthesis(D
MPrA)drymatterp
ostanthesis
(DMPA
)mattertranslocatio
ngrainyield
leafarea
indexatflo
weringsta
ge(LAI m
ax)root
activ
itytotalnitro
gen
content(TN
C)and
nitro
gencontentp
erleafarea
(NLA
)ofcultiv
arNinggeng28(O
ryza
sativaL)u
nder
different
treatmentsin
Shihezi
DMPrA
kghaminus1
DMPA
kghaminus1
Mattertranslocatio
nkg
haminus1
Yield
kghaminus1
LAI m
axRo
otactiv
ity120583ggminus1FW
hminus1
TNC120583ggminus1
NLA120583gd
mminus2
CF1053722plusmn26536b
1526293plusmn47301a
138465plusmn7324a
857985plusmn11043a549plusmn049c
52443plusmn4033a
837plusmn051a371plusmn022a
DI1339854plusmn51123a
941722plusmn30375b
136231plusmn8918a
579368plusmn23841b716plusmn028a
40943plusmn1040b
621plusmn013b219plusmn013b
FIM1184543plusmn36824ab
588114plusmn56950c
45037plusmn5541b
363692plusmn15464c677plusmn028ab
32309plusmn1991c
409plusmn043c113plusmn015c
FIN1186240plusmn82114ab
466602plusmn11845d
minus32455plusmn6359c
208601plusmn22141d664plusmn014b
25886plusmn3250d
364plusmn012c092plusmn008d
Values
arethe
meanplusmnSE
the
SEwas
calculated
acrossthreer
eplicates
fore
achyear
andaveraged
forthe
2yearsVa
lues
with
incolumns
follo
wed
bydifferent
lowercase
lette
rsares
ignificantly
different
at119875lt005
accordingto
least-s
ignificant-d
ifference
test
8 The Scientific World Journal
c
Chl (A + B)
a
b
c
CF DI FIM FINTreatment
1
2
3
4
5
Chl (
a+
b) (m
g gminus1
FW)
(a)
CF DI FIM FIN
aa
aa
Treatment
Chl ABCh
l ab
05
10
15
20
25
(b)
Figure 4 Chl content of cultivar Ninggeng28 (Oryza sativa L) under CF DI FIM and FIN treatments at the grain-filling stage respectivelyin Shihezi The CF indicates conventional flooding and the DI FIM and FIN are plastic film mulching with drip irrigation plastic filmmulching with furrow irrigation and no mulching with furrow irrigation respectively Vertical bars represent SE of the mean the SE wascalculated across five replicates for each year and averaged for the 2 years Values of different treatments followed by the same letter indicateno significant differences (119875 lt 005) according to least-significant-difference test
was 501mg gminus1 FW which was 5310 higher than in theDI treatment 6912 higher than in the FIM treatment and7331 higher than in the FIN treatment (Figure 4(a)) Nosignificant differences were observed in Chl ab among thefour treatments (119875 gt 005 Figure 4(b))
At the grain-filling stage the root activity in the CFtreatment was the highest which was significantly increasedby 2193 compared with the DI treatment by 3839compared with the FIM treatment and by 5064 comparedwith the FIN treatment (119875 lt 005 Table 3) The highest TNCand NLA values for the flag leaves were in the CF treatmentfollowed by the DI treatment then the FIM treatment andthen the FIN treatment Significant differences in the TNCand NLA parameters existed among the four treatments (119875 lt005 Table 3)
34 Analysis of Leaf Gas Exchange Plants in theDI treatmenthad a higher 119875
119873than did plants in the FIM and FIN
treatments from the 16th day after anthesis to the 19th dayafter anthesis However the 119875
119873of plants in the DI FIM
and FIN treatments was always significantly lower than thatof plants in the CF treatment during the data acquisitionperiod (Figure 5(a)) The 119875
119873in the CF treatment remained
relatively stable from the 16th day after anthesis to the 19thday after anthesis (Figure 5(a)) In contrast plants grownin the nonflooded irrigation treatments showed decreasing119875119873as the soil water potential decreased with minimum 119875
119873
values on the 18th day after anthesis (Figure 5(a)) whichthe soil water potential on the day reached its lowest values
across treatments and years (from minus28KPa to minus3650KPa)(Figures 3(a) and 3(b)) After that the 119875
119873rose on the 19th
day after anthesis when the soil water potential had reachedminus3 and minus540KPa as a result of supplementary irrigationin the DI and FIM treatments respectively No significantdifference were observed for the parameter between the 16thday after anthesis and the 19th day after anthesis in the DIand FIM treatments but significant difference existed in theFIN treatment (two-tailed 119905-test For the DI treatment df= 5 119905 = 108 119875 = 031 for the FIM treatment df = 5119905 = 138 119875 = 020 for the FIN treatment df = 5 119905 = 431119875 = 001) indicating that the 119875
119873could completely recover
after supplementary irrigation in the DI and FIM treatmentsThe trends in 119892
119904and 119864 values were similar to those observed
for 119875119873
across soil water potential and cultivation modesTheir values were significantly lower under the nonfloodedirrigation treatments than under theCF treatment (119875 lt 005)Meanwhile both 119892
119904and 119864 parameters gradually decreased
as the soil water potential decreased until the 18th day afteranthesis in the nonflooded irrigation treatments and thenrecovered on the 19th day after anthesis after supplementaryirrigation in the DI and FIM treatments compared with the16th day after anthesis (two-tailed 119905-test 119875 gt 005 for theFIM and DI treatments 119875 lt 005 for the FIN treatment Dataof analysis-of-variance not present) The variation in 119862
119894was
small among the different treatments but higher 119862119894values
were observed in the nonflooded irrigation treatments thanin the CF treatment during the entire measurement period(Figure 5(d))
The Scientific World Journal 9
2
0
4
6
8
10
12
14
16
b
c
c
aa
b
c
c
a
b
c
d
a
b
c
c
CFDI
FIMFIN
Days after anthesis (d)16 17 18 19
PN
(120583m
ol (C
O2)m
minus2
sminus1)
(a)
0
a
bb
b
a
bc
c
a
bc c
a
bb b
2
4
6
8
10
CFDI
FIMFIN
Days after anthesis (d)16 17 18 19
E(m
mol
(H2O
)mminus2
sminus1)
(b)
000
005
010
015
020
025
030
035
040
a
b
cc
a
b
cc
a
bc
c
a
b
c c
CFDI
FIMFIN
Days after anthesis (d)16 17 18 19
gs
(mol
(H2O
)mminus2
sminus1)
(c)
CFDI
FIMFIN
Days afer anthesis (d)16 17 18 19
0
50
100
150
200
250
300
350
400
450
ab aab
b
aabb
c
aab
b
c
aab
b
c
Ci
(120583m
ol (C
O2)m
olminus1)
(d)
Figure 5 The 119875119873(a) 119864 (b) 119892
119904(c) and 119862
119894(d) of cultivar Ninggeng28 (Oryza sativa L)under different treatments from the 16th day after
anthesis to the 19th day after anthesis in Shihezi The CF indicates conventional flooding and the DI FIM and FIN are plastic filmmulchingwith drip irrigation plastic filmmulching with furrow irrigation and nomulching with furrow irrigation respectively Vertical bars representSE of themean the SEwas calculated across five replicates for each year and averaged for the 2 years Values of eachmeasurement date followedby the same letter indicate no significant differences (119875 lt 005) according to least-significant-difference test
10 The Scientific World Journal
35 Analysis of Chlorophyll Fluorescence Thevalues of119865V119865119898119865V1015840119865119898
1015840 119902119901 andΦPSII in the nonflooded irrigation treatments
were significantly lower than their respective values in the CFtreatment from the 16th day after anthesis to the 19th day afteranthesis (119875 lt 005 Figures 6(a) 6(c) 6(e) and 6(f)) Duringthe four days both NPQ and Fo values in the nonfloodedirrigation treatments were significantly higher than in the CFtreatment (119875 lt 005 Figures 6(b) and 6(d)) For the CFtreatment all fluorescence parameters were relatively stableHowever for the nonflooded irrigation treatments values ofthe 119865V119865119898 119865V
1015840119865119898
1015840 119902119901 and ΦPSII decreased with decreasing
soil water potential until the 18th day after anthesis and thencompletely recovered after supplementary irrigation on the19th day after anthesis in the DI and FIM treatments Theseresults were supported by two-tailed 119905-test which showedno significant differences between the 16th day after anthesisand the 19th day after anthesis in the DI and FIM treatments(119875 gt 005 in the FIM and DI treatments 119875 lt 005 in the FINtreatment Data of analysis-of-variance not present) Undernonflooded irrigation 119865V119865119898 119865V
1015840119865119898
1015840 119902119901 and ΦPSII were
always significantly higher in the DI treatment than in theFIM and FIN treatments during data observation period (119875 lt005 Figure 6) The 119865
119900and NPQ values were significantly
higher under the nonflooded irrigation treatments thanunder the CF treatment and gradually increased as thewater potential decreased until the 18th day after anthesisThen both 119865
119900and NPQ values substantially decreased on the
19th day after anthesis because of supplementary irrigation(Figures 6(b) and 6(d))
4 Discussion
Dry matter accumulation is a critical factor in grain yieldformation The aboveground biomass before anthesis maycontribute 20ndash40 to the final crop yield [30] and the restof the matter that contributed to grain yield is derived fromphotosynthesis during the grain-filling stage [8 9] In ourstudy there were no significant differences in the DMPrAamong treatments However the matter translocation in theFIM and FIN treatments was significantly lower than thatin the CF and DI treatments (119875 lt 005 Table 3) The lowtranslocation efficiency may have been insufficient to achievea high grain yield in the FIM and FIN treatments [9] Forthe DI treatment the matter translocation was only slightlyreduced compared with the CF treatmentTherefore we inferthat the decreased grain yield could mainly depend on thephotosynthetic capacity during the grain-filling stage in theDI treatment (Figure 5(a)) and also be related to the drymatter translocation efficiency at the preanthesis stage in theFIM and FIN treatments (Figure 5(a) Table 3)
Moreover a significantly higher population structure(LAImax) was observed in nonflooded irrigation treatmentsthan in the CF treatment (119875 lt 005 Table 3) We canspeculate that the high LAImax negatively affected biomassaccumulation and yield formation under nonflooded irri-gation There are two main reasons for this speculationfirst a considerable proportion of the crop was invalidtillers (nonproductive tillers) especially in the FIM and FINtreatments (data not shown) The accumulated assimilates
are rarely transferred from invalid tillers to effective paniclesand this large proportion of redundant matter and energyis greatly wasted in poorly performing tillers Thus grainyield formation could be limited by inadequate materialsupply [31] Second the consumption of photosynthatewouldincrease because the respiration rate of C
3plants increases
almost proportionally to the increase in LAI [32] Finallycrop failure could also be relevant to the poor populationstructure
The 119875119873
in the FIN treatment was significantly lowerthan that in the CF treatment This result was supported byprevious studies [7] Plants in the treatments with plasticmulch (DI and FIM treatments) showed lower 119875
119873than those
in the CF treatment which differs from the result found byZhang et al [7] In the nonflooded irrigation treatments Chl(119886 + 119887) showed significant declines compared with the CFtreatment (119875 lt 005 Figure 4)Thus low119875
119873in graminaceous
crops such as maize (Zea mays L) and rice (Oryza sativaL) is apparently associated with lower levels of quantity ofpigments [33 34]
Nitrogen plays an important role during photosynthesissince the proteins of the Calvin cycle and thylakoids representthe majority of leaf nitrogen Photosynthesis of rice leavessignificantly increases with increasing nitrogen content ofleaves [35 36] Mae [36] showed that the maximum rate ofCO2assimilation per unit leaf area (measured under light-
saturated ambient air condition) was almost proportional tothe NLA Therefore the photosynthetic capacity of leaves isclosely related to the nitrogen content [37] In our studiesthe TNC and NLA in the CF treatment were significantlyhigher than that in the nonflooded irrigation treatments (119875 lt005 Table 3) The results suggest that the underlying reasonwhich limited photosynthetic capacity was mainly the lowernitrogen content in the nonflooded irrigation treatmentscompared with that in the CF treatment Although the badperformance of the root activity could be one of the importantreasons that restricted the absorption of nitrogen [38] it isstill very necessary to conduct the future experiment to findout the scientific sound reason for the low nitrogen contentin the nonflooded irrigation
Jones [39] suggested that the values of 119862119894and 119875
119873can
be a useful criterion to determine whether photosynthesisis limited by stomatal closure or metabolic impairmentCompared with normal (control) treatment a decrease in119875119873alongside a decrease in 119862
119894indicates stomatal limitation
of photosynthesis whereas if the 119875119873
decreases while 119862119894
increases then nonstomatal limitation (metabolic impair-ment) of photosynthesis is predominant [40] Under thenonflooded irrigation treatments the 119862
119894was also higher
than in the CF treatment during the data acquisition period(Figure 5(d)) but their 119875
119873values were significantly lower
than those in the CF treatment (119875 lt 005 Figure 5(a)) Inaddition the 119892
119904values ranged from 012 to 023molmminus2 sminus1
under the nonflooded irrigation treatments which wassignificantly lower than in the CF treatment (119875 lt 005Figure 5(c)) The low 119892
119904would probably decrease the levels
of ribulouse bisphosphate impair ATP synthesis and eveninhibit Rubico activity [40] which together would inhibit119875
119873
The Scientific World Journal 11
00
02
04
06
08
10FvFm
ab b b
ab
cd
a
b
c
d
ab b
d
Days after anthesis (d)16 17 18 19
(a)
a a a ab b
aa
a
d
c
b
b b b a
01
00
02
03
04
05
06
07
08
Days after anthesis (d)16 17 18 19
Fo
(b)
00
02
04
06
08 ab
bcc
ab
cd
a
b
c c
ab
c
d
Days after anthesis (d)16 17 18 19
Fv998400 F
m998400
(c)
a
bb
a ab b
aa
dc
b
a
b ba
a
05
00
10
15
20
25
30
35
NPQ
Days after anthesis (d)16 17 18 19
(d)
00
01
02
03
04
05
06
07
08
Days after anthesis (d)
a
b
c
d
a
b
cd
a
b
c
d
a
b
c
d
CFDI
FIMFIN
16 17 18 19
ΦPS
II
(e)
a
bc
d
a
b
c
d
a
b
c
d
a
b
c
c
Days after anthesis (d)
CFDI
FIMFIN
16 17 18 1900
02
04
06
08
10
qp
(f)
Figure 6The 119865V119865119898 (a) Fo (b) 119865V1015840119865119898
1015840 (c) NPQ (d)ΦPSII (e) and 119902119901 (f) of cultivar Ninggeng28 (Oryza sativa L) under different treatmentsfrom the 16th day after anthesis to the 19th day after anthesis in ShiheziThe CF indicates conventional flooding and the DI FIM and FIN areplastic filmmulching with drip irrigation plastic filmmulching with furrow irrigation and no mulching with furrow irrigation respectivelyVertical bars represent SE of the mean the SE was calculated across five replicates for each year and averaged for the 2 years Values of eachmeasurement date followed by the same letter indicate no significant differences (119875 lt 005) according to least-significant-difference test
12 The Scientific World Journal
Under the nonflooded irrigation treatments both 119875119873and
119892119904declined with soil water potential decrease The 119875
119873and 119892
119904
almost completely recovered after supplementary irrigationin the plastic mulching treatments (DI and FIM treatments)but not in the FIN treatment (Figures 5(a) and 5(c)) Thisindicated that photoinhibition might not be permanent inthe DI and FIM treatments that is it could recover duringthe grain-filling stage if the soil water potential remainedbetween 0 and minus30KPa during the entire growth periodMoreover the values of 119875
119873 119892119904 and 119864 were higher under
the DI treatment than under the FIM and FIN treatments(Figures 5(a) 5(c) and 5(d)) The results show that theDI treatment can significantly improve rice photosyntheticperformance under nonflooded irrigation
The use of chlorophyll fluorescence to monitor pho-tosynthetic performance in plants is now widespread Chl119886 fluorescence is a very sensitive tool to study the stress-induced damage to photosystem 2 (PSII) [41] The 119865V119865119898value is frequently used as an indicator of stresses caused toPSII [18 42] Under the nonflooded irrigation treatmentsthe 119865V119865119898 values were significantly lower than that in theCF treatment which its value was 081ndash083 during dataacquisition period and fell sharply as the soil water potentialreduced from the 16th day after anthesis to the 18th dayafter anthesis (Figure 6(a)) This result indicated that therice crop could be subject to water stress during grain-filling stage Also increasing of 119865
119900value is usually considered
as an important parameter to estimate photoinhibition inmany plants [19 43] Our results showed that the 119865
119900sharply
increased when soil water potential dropped to minus15 KPain the FIN treatment minus20KPa in the FIM treatment andminus3650KPa in the DI treatment compared with that in theCF treatment and then recovered when soil water potentialreturned to minus450KPa after supplementary irrigation for theDI and FIM treatments (Figure 6(b))These results imply thatnonflooded irrigation cultivation could cause rice to sufferfrom photoinhibition when the soil water potential rangesfrom minus15 KPa to minus3650KPa The plants in the DI treatmentwere more tolerant to nonflooded irrigation cultivationpractices and showed higher photosynthetic efficiency thanthat in FIM and FIN treatments
The ΦPSII reflects the efficiency of excitation energy cap-tured by open reaction centers of PSII Two factors contributetoΦPSII [27] one being the fraction of PSII centers in the openstate 119876
119860(primary quinone acceptor of PSII) for which the
quantitative value is equivalent to 119902119901[18] and the other being
119865V1015840119865119898
1015840 [27] Our studies suggested that the decreases inΦPSIIunder nonflooded irrigationwere caused by a combination oftwo processes (Figures 6(c) 6(e) and 6(f)) Previous studiesindicated that a decrease in 119902
119901could lead to an increase in
the levels of toxic singlet oxygen form [44 45] Unfortunatelywe did not quantify reactive oxygen species (ROS) in thepresent study Further research is required to determinewhether ROS are produced under nonflooded conditionsand to examine their scavenging mechanisms In additionthe decrease in 119865V
1015840119865119898
1015840 is considered to reflect a proactiveand photoprotective thermal dissipation process in whichexcess excitation energy is depleted before it reaches the
PSII centers [45] Figure 6 shows that the 119865V1015840119865119898
1015840 values sig-nificantly decreased under nonflooded irrigation treatmentsand greatly decreased as the soil water potential decreasedThese results indicated that thermal dissipation processeswere enhanced before excess energy reached the PSII centersunder nonflooded irrigation especially when the soil waterpotential was low and in the FIN treatment In brief undernonflooded irrigation treatments total thermal dissipationincluding depletion of heat by NPQ (Figure 6(d)) and bythe processes reflected by the 119865V
1015840119865119898
1015840 value (Figure 6(c))pathways was significantly higher than that under the CFtreatment during the whole observation period These path-ways could be important photoprotective mechanisms in riceplants cultivated under nonflooded irrigation conditions
5 Conclusions
Under nonflooded treatments photosynthetic capacity andgrain-yield of rice plants were significantly decrease com-pared with the CF treatment Nonphotochemical quenching(NPQ) played an important role in protecting photosyn-thetic apparatus in flag leaf of rice plants against damageby nonflooded environments To improve photosyntheticproductivity in nonflooded irrigation it could be necessaryto promote nitrogen content in flag leaf Also the reasons inregulating nitrogen metabolism in flag leaf are not clear innonflooded irrigation and it need to do follow-up studies tofind out scientific mechanisms
Abbreviations
llCF Conventional floodingChl Chlorophyll119862119894 Intercellular CO
2concentration
DI Drip irrigation with plastic mulchingDMPA Dry matter postanthesisDMPrA Dry matter preanthesis119864 Transpiration rateFIM Furrow irrigation with plastic mulchingFIN Furrow irrigation with no mulching119865119898 Maximal fluorescence yield of
dark-adapted state119865119898
1015840 Maximal fluorescence yield oflight-adapted state
119865119900 Minimum fluorescence yield of
dark-adapted state119865119900
1015840 Minimal fluorescence yield oflight-adapted state
119865119904 Steady-state fluorescence yield119865V119865119898 Maximal quantum yield of PSII
photochemistry119865V1015840119865119898
1015840 PSII maximum efficiencyFW Fresh weight119892119904 Stomatal conductance
LAImax Leaf area index at flowering stageNLA Nitrogen content per leaf areaNPQ Non-photochemical quenching119875119873 Net photosynthetic rate
The Scientific World Journal 13
119902119875 Photochemical quenching coefficientΦPSII Effective quantum yield of PSII
photochemistrySE Standard errorTNC Total nitrogen contentTTC Triphenyltetrazolium chloride
Conflict of Interests
The authors declare that there is no conflict of interestsregarding the publication of this paper
Acknowledgments
The authors thank the Agricultural Drought Research Insti-tute of TianYe Group Company for providing the experimen-tal site They are grateful for Grants fromThe National HighTechnology Research and Development Program of China(2011AA100508)
References
[1] G S Khush ldquoOrigin dispersal cultivation and variation ofricerdquo in Oryza From Molecule to Plant pp 25ndash34 SpringerAmsterdam The Netherlands 1997
[2] Y B Wang P T Wu X N Zhao and J L Li ldquoDevelopmenttendency of agricultural water structure in Chinardquo ChineseJournal of Eco-Agriculture vol 18 no 2 pp 399ndash404 2010
[3] B A M Bouman and T P Tuong ldquoField water managementto save water and increase its productivity in irrigated lowlandricerdquo Agricultural Water Management vol 49 no 1 pp 11ndash302001
[4] P Belder B AM Bouman R Cabangon et al ldquoEffect of water-saving irrigation on rice yield and water use in typical lowlandconditions in AsiardquoAgriculturalWaterManagement vol 65 no3 pp 193ndash210 2004
[5] S Peng B Bouman R M Visperas A Castaneda L Nieand H-K Park ldquoComparison between aerobic and floodedrice in the tropics agronomic performance in an eight-seasonexperimentrdquo Field Crops Research vol 96 no 2-3 pp 252ndash2592006
[6] H Tao H Brueck K Dittert C Kreye S Lin and B Sat-telmacher ldquoGrowth and yield formation of rice (Oryza sativaL) in the water-saving ground cover rice production system(GCRPS)rdquo Field Crops Research vol 95 no 1 pp 1ndash12 2006
[7] Z Zhang S Zhang J Yang and J Zhang ldquoYield grain qualityand water use efficiency of rice under non-flooded mulchingcultivationrdquo Field Crops Research vol 108 no 1 pp 71ndash81 2008
[8] D K Papakosta and A A Gagianas ldquoNitrogen and dry matteraccumulation remobilization and losses for Mediterraneanwheat during grain fillingrdquo Agronomy Journal vol 83 no 5 pp864ndash870 1991
[9] L Zhang S Lin B A M Bouman et al ldquoResponse of aerobicrice growth and grain yield toN fertilizer at two contrasting sitesnear Beijing Chinardquo Field Crops Research vol 114 no 1 pp 45ndash53 2009
[10] M J Baig A Anand P K Mandal and R K Bhatt ldquoIrradianceinfluences contents of photosynthetic pigments and proteins intropical grasses and legumesrdquo Photosynthetica vol 43 no 1 pp47ndash53 2005
[11] Q H Ling Crop Population Quality Shanghai Science andTechnology Press Shanghai China 2000
[12] J Yang J Zhang Z Wang Q Zhu andWWang ldquoRemobiliza-tion of carbon reserves in response to water deficit during grainfilling of ricerdquo Field Crops Research vol 71 no 1 pp 47ndash55 2001
[13] X H Chen G W Xu H S Sun Z Q Wang and J C YangldquoEffects of soil moisture and nitrogen nutrition during grainfilling on the grain yield and quality of ricerdquo Journal of YangzhouUniversity vol 24 no 1 pp 37ndash41 2003
[14] J G Zheng G J Ren X J Lu and X L Jiang ldquoEffects ofwater stress on rice grain yield and quality after heading stagerdquoChinese Journal of Rice Science vol 17 no 3 pp 239ndash243 2003
[15] C YWang B LWang andWX Zhang ldquoEffects of water stressof soil on rice yield and qualityrdquoActa Agronomica Sinica vol 23no 1 pp 131ndash137 2006
[16] K Liu H Zhang S F Zhang Z Q Wang and J C YangldquoEffects of soil moisture and irrigation patterns during grainfilling on grain yield and quality of rice and their physiologicalmechanismrdquo Acta Agronomica Sinica vol 34 no 2 pp 268ndash276 2008
[17] K Maxwell and G N Johnson ldquoChlorophyll fluorescencemdashapractical guiderdquo Journal of Experimental Botany vol 51 no 345pp 659ndash668 2000
[18] N R Baker ldquoChlorophyll fluorescence a probe of photosynthe-sis in vivordquo Annual Review of Plant Biology vol 59 pp 89ndash1132008
[19] F Valladares and R W Pearcy ldquoInteractions between waterstress sun-shade acclimation heat tolerance and photoinhibi-tion in the sclerophyll Heteromeles arbutifoliardquo Plant Cell ampEnvironment vol 20 no 1 pp 25ndash36 1997
[20] N I Elsheery and K F Cao ldquoGas exchange chlorophyllfluorescence and osmotic adjustment in two mango cultivarsunder drought stressrdquo Acta Physiologiae Plantarum vol 30 no6 pp 769ndash777 2008
[21] G L Wang and Z F Guo ldquoEffects of chilling stress onphotosynthetic rate and chlorophyll fluorescence parameter inseedlings of two rice cultivars differing in cold tolerancerdquo RiceScience vol 12 no 3 pp 187ndash191 2005
[22] C C Xu Y A Jeon and C H Lee ldquoRelative contributionsof photochemical and non-photochemical routes to excitationenergy dissipation in rice and barley illuminated at a chillingtemperaturerdquo Physiologia Plantarum vol 107 no 4 pp 447ndash453 1999
[23] R J Porra ldquoThe chequered history of the development and useof simultaneous equations for the accurate determination ofchlorophylls a and brdquo in Discoveries in Photosynthesis pp 633ndash640 Springer Amsterdam The Netherlands 2005
[24] G E Schuman M A Stanley and D Knudsen ldquoAutomatedtotal nitrogen analysis of soil and plant samplesrdquo Soil ScienceSociety of America Journal vol 37 no 3 pp 480ndash481 1973
[25] P L Steponkus and FO Lanphear ldquoRefinement of the triphenyltetrazolium chloride method of determining cold injuryrdquo PlantPhysiology vol 42 no 10 pp 1423ndash1426 1967
[26] K Oxborough and N R Baker ldquoResolving chlorophyll a fluo-rescence images of photosynthetic efficiency into photochemi-cal and non-photochemical componentsmdashcalculation of q
119875and
Fv1015840Fm1015840 without measuring Fo1015840rdquo Photosynthesis Research vol54 no 2 pp 135ndash142 1997
[27] B Genty J M Briantais and N R Baker ldquoThe relationshipbetween the quantumyield of photosynthetic electron transportand quenching of chlorophyll fluorescencerdquo Biochimica EtBiophysica Acta vol 990 no 1 pp 87ndash92 1989
14 The Scientific World Journal
[28] W Bilger and O Bjorkman ldquoRole of the xanthophyll cycle inphotoprotection elucidated by measurements of light-inducedabsorbance changes fluorescence and photosynthesis in leavesof Hedera canariensisrdquo Photosynthesis Research vol 25 no 3pp 173ndash185 1990
[29] U Schreiber U Schliwa and W Bilger ldquoContinuous recordingof photochemical and non-photochemical chlorophyll fluores-cence quenching with a new type of modulation fluorometerrdquoPhotosynthesis Research vol 10 no 1-2 pp 51ndash62 1986
[30] S Yoshida ldquoPhysiological aspects of grain yieldrdquoAnnual Reviewof Plant Physiology vol 23 no 1 pp 437ndash464 1972
[31] P Y Jiang X F Hong Z F Xu and Z R Ni ldquoComparison ofcarbon nutrition between effective tillers and ineffective tillersin ricerdquoChinese Journal of Rice Science vol 13 no 4 pp 211ndash2161999
[32] T Takeda ldquoStudies on the photosynthesis and production ofdry matter in the community of rice plantsrdquo Japanese Journalof Botany vol 17 pp 403ndash437 1961
[33] H Hichem D Mounir and E A Naceur ldquoDifferentialresponses of two maize (Zea mays L) varieties to salt stresschanges on polyphenols composition of foliage and oxidativedamagesrdquo Industrial Crops and Products vol 30 no 1 pp 144ndash151 2009
[34] C Suriyan S W Kanyaratt and K Chalermpol ldquoCompar-ative effects of salt stress and extreme pH stress combinedon glycinebetaine accumulation photosynthetic abilities andgrowth characters of two rice genotypesrdquo Rice Science vol 16no 4 pp 274ndash282 2009
[35] K Z Xu ldquoThe dynamic changes of nitrogen content andphotosynthesis and their correlations in pot rice leaves afteranthesisrdquo Acta Agronomica Sinica vol 21 no 2 pp 171ndash1751995
[36] T Mae ldquoPhysiological nitrogen efficiency in rice nitrogen uti-lization photosynthesis and yield potentialrdquo in Plant NutritionFor Sustainable Food Production and Environment pp 51ndash60Springer Amsterdam The Netherlands 1997
[37] J R Evans ldquoPhotosynthesis and nitrogen relationships in leavesof C3plantsrdquo Oecologia vol 78 no 1 pp 9ndash19 1989
[38] MOsaki andT Shinano ldquoInfluence of carbon-nitrogen balanceon productivity of C
3plants and effect of high expression of
phosphoenolpyruvate carboxylase in transgenic ricerdquo Studies inPlant Science vol 7 no C pp 177ndash192 2000
[39] H G Jones ldquoPartitioning stomatal and non-stomatal limita-tions to photosynthesisrdquo Plant Cell amp Environment vol 8 no2 pp 95ndash104 2005
[40] J Flexas and H Medrano ldquoDrought-inhibition of photosyn-thesis in C
3plants stomatal and non-stomatal limitations
revisitedrdquo Annals of Botany vol 89 no 2 pp 183ndash189 2002[41] M C Drew ldquoOxygen deficiency and root metabolism injury
and acclimation under hypoxia and anoxiardquo Annual Review ofPlant Biology vol 48 pp 223ndash250 1997
[42] A Calatayud and E Barreno ldquoResponse to ozone in twolettuce varieties on chlorophyll a fluorescence photosyntheticpigments and lipid peroxidationrdquo Plant Physiology and Bio-chemistry vol 42 no 6 pp 549ndash555 2004
[43] D Epron E Dreyer and N Breda ldquoPhotosynthesis of oaktrees [Quercus petraea (Matt) Liebl] during drought underfield conditions diurnal course of net CO
2assimilation and
photochemical efficiency of photosystem IIrdquo Plant Cell ampEnvironment vol 15 no 7 pp 809ndash820 1992
[44] K Asada and M Takahashi ldquoProduction and scavenging ofactive oxygen in photosynthesisrdquo Photoinhibition vol 9 pp227ndash287 1987
[45] B Demmig-Adams W W Adams III D H Barker B ALogan D R Bowling and A S Verhoeven ldquoUsing chlorophyllfluorescence to assess the fraction of absorbed light allocated tothermal dissipation of excess excitationrdquoPhysiologia Plantarumvol 98 no 2 pp 253ndash264 1996
Submit your manuscripts athttpwwwhindawicom
Nutrition and Metabolism
Journal of
Hindawi Publishing Corporationhttpwwwhindawicom Volume 2014
Hindawi Publishing Corporationhttpwwwhindawicom Volume 2014
Food ScienceInternational Journal of
Agronomy
Hindawi Publishing Corporationhttpwwwhindawicom Volume 2014
International Journal of
Hindawi Publishing Corporationhttpwwwhindawicom Volume 2014
International Journal of
Microbiology
The Scientific World JournalHindawi Publishing Corporation httpwwwhindawicom Volume 2014
Hindawi Publishing Corporationhttpwwwhindawicom
Applied ampEnvironmentalSoil Science
Volume 2014
AgricultureAdvances in
Hindawi Publishing Corporationhttpwwwhindawicom Volume 2014
PsycheHindawi Publishing Corporationhttpwwwhindawicom Volume 2014
BiodiversityInternational Journal of
Hindawi Publishing Corporationhttpwwwhindawicom Volume 2014
ScientificaHindawi Publishing Corporationhttpwwwhindawicom Volume 2014
GenomicsInternational Journal of
Hindawi Publishing Corporationhttpwwwhindawicom Volume 2014
Plant GenomicsInternational Journal of
Hindawi Publishing Corporationhttpwwwhindawicom Volume 2014
Biotechnology Research International
Hindawi Publishing Corporationhttpwwwhindawicom Volume 2014
Forestry ResearchInternational Journal of
Hindawi Publishing Corporationhttpwwwhindawicom Volume 2014
Journal of BotanyHindawi Publishing Corporationhttpwwwhindawicom Volume 2014
EcologyInternational Journal of
Hindawi Publishing Corporationhttpwwwhindawicom Volume 2014
Veterinary Medicine International
Hindawi Publishing Corporationhttpwwwhindawicom Volume 2014
Cell BiologyInternational Journal of
Hindawi Publishing Corporationhttpwwwhindawicom Volume 2014
Evolutionary BiologyInternational Journal of
Hindawi Publishing Corporationhttpwwwhindawicom Volume 2014
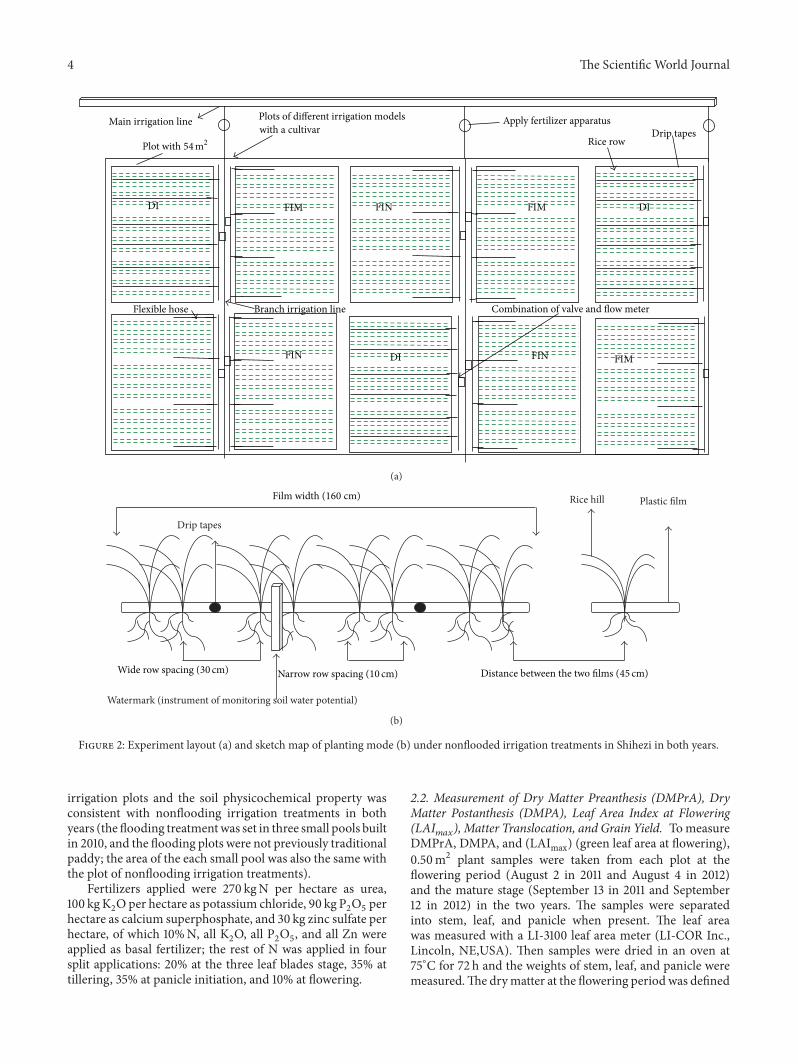
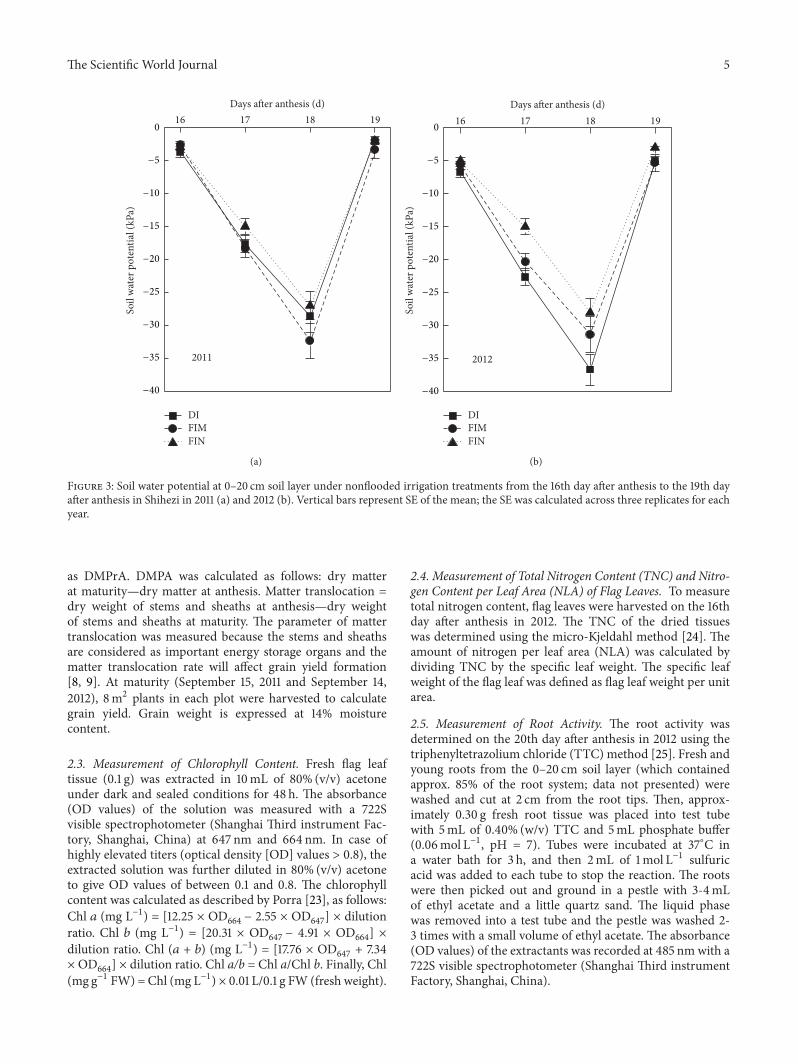
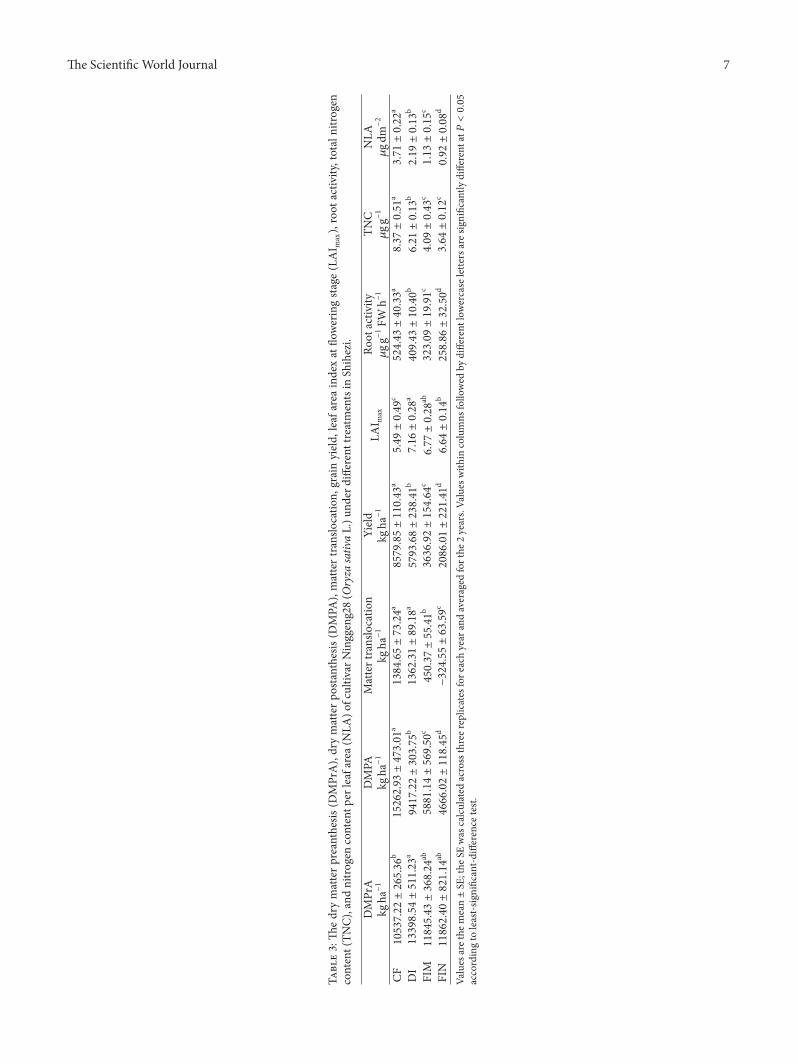
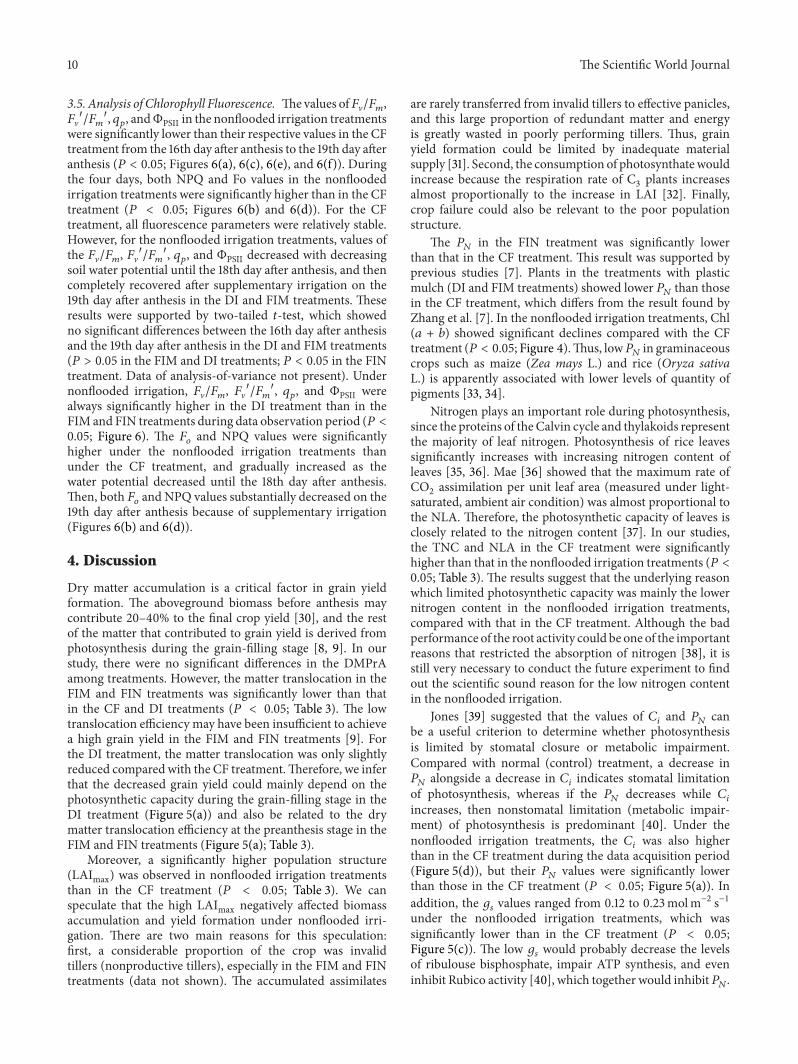
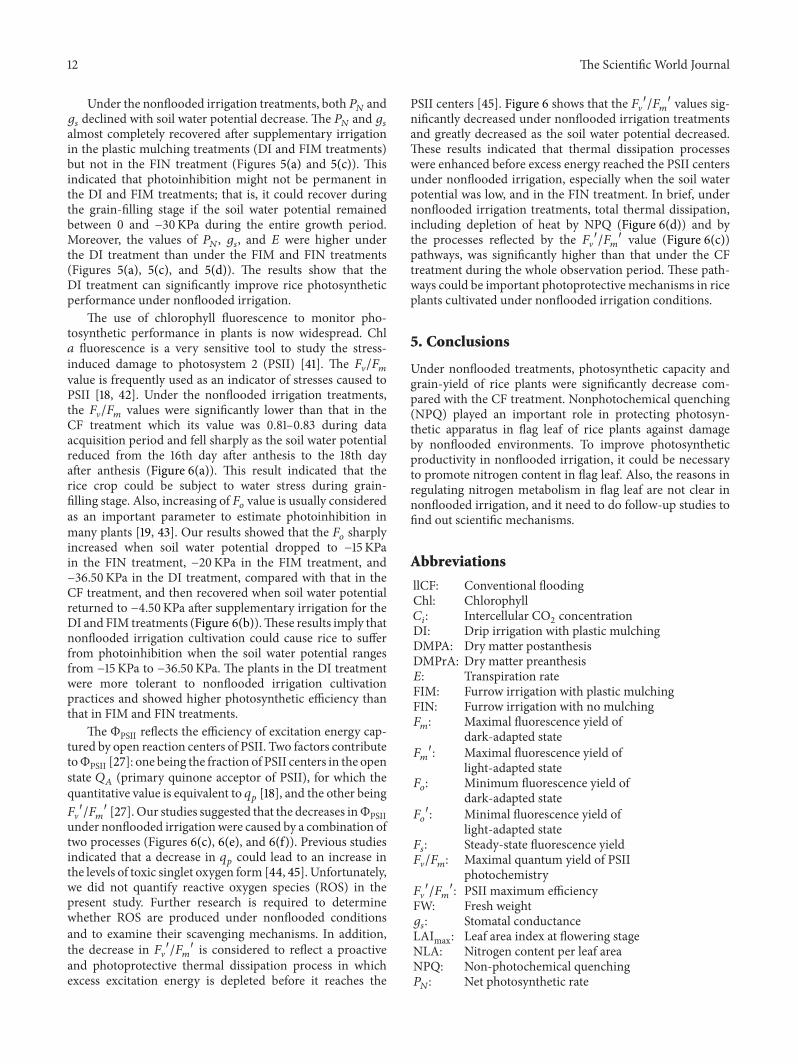